Embed Size (px)
Citation preview
Is Precision Farming the Way to go? Can Smaller Farmers Consider this
with their own Equipment?
Don Tyler, Ph.D. John Wilkerson Ph.D.
Michael Buschermohle Ph.D. University of Tennessee
NO-TILL Conservation Agriculture Conference 2012
“Make the Move Towards Sustainable Agriculture in 2012”
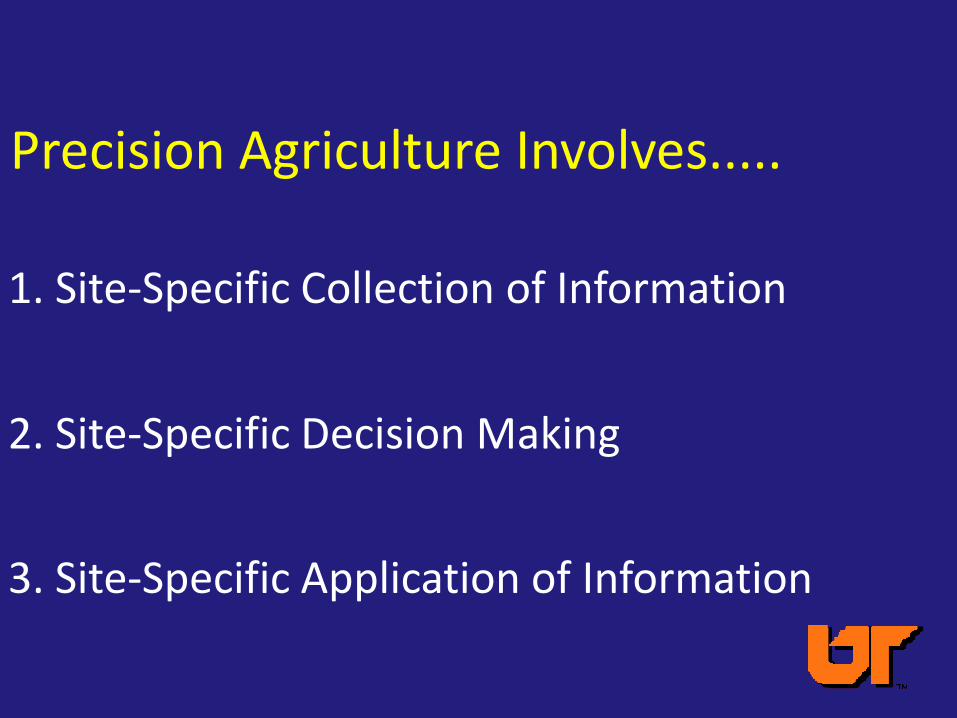
1. Site-Specific Collection of Information
2. Site-Specific Decision Making
3. Site-Specific Application of Information
Precision Agriculture Involves.....
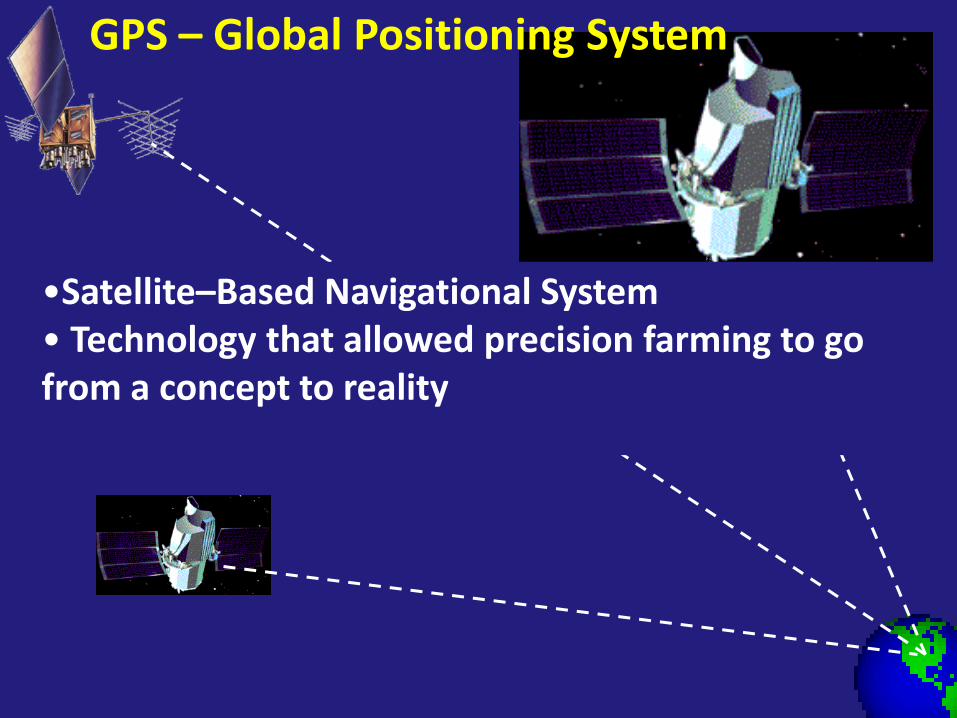
GPS – Global Positioning System
•Satellite–Based Navigational System • Technology that allowed precision farming to go from a concept to reality
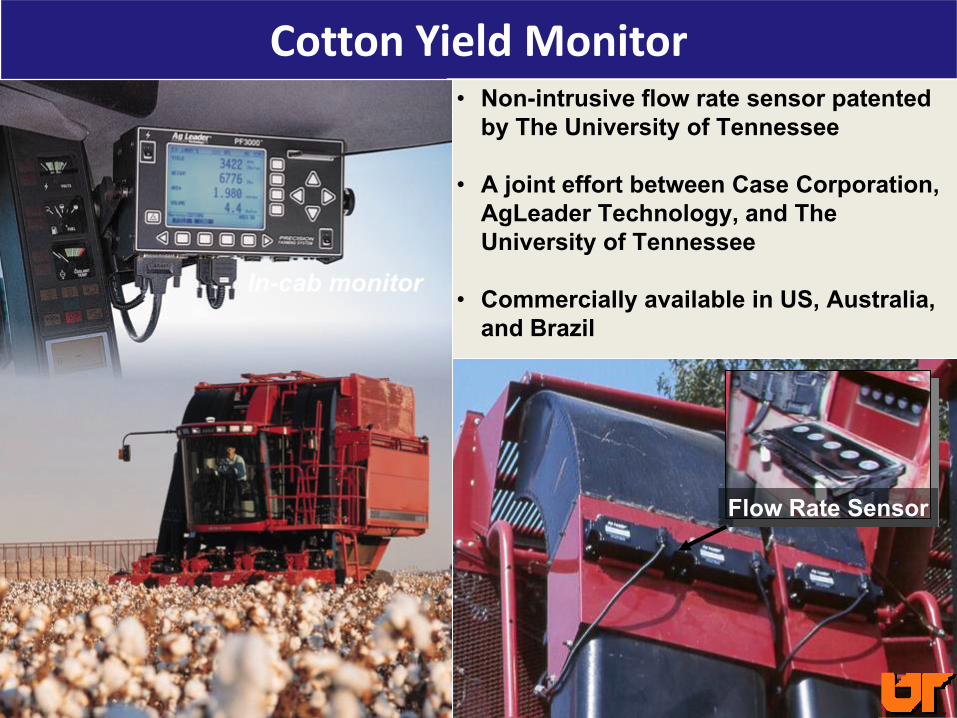
• Non-intrusive flow rate sensor patented by The University of Tennessee
• A joint effort between Case Corporation,
AgLeader Technology, and The University of Tennessee
• Commercially available in US, Australia,
and Brazil
Cotton Yield Monitor
In-cab monitor
Flow Rate Sensor
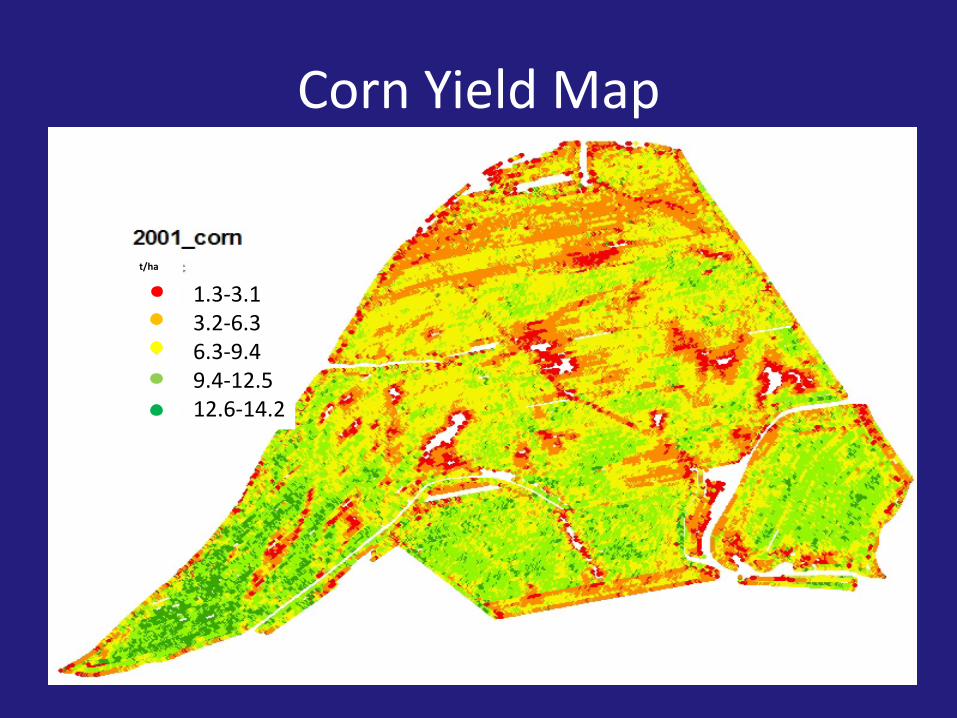
Corn Yield Map
1.3-3.1 3.2-6.3 6.3-9.4 9.4-12.5 12.6-14.2
t/ha
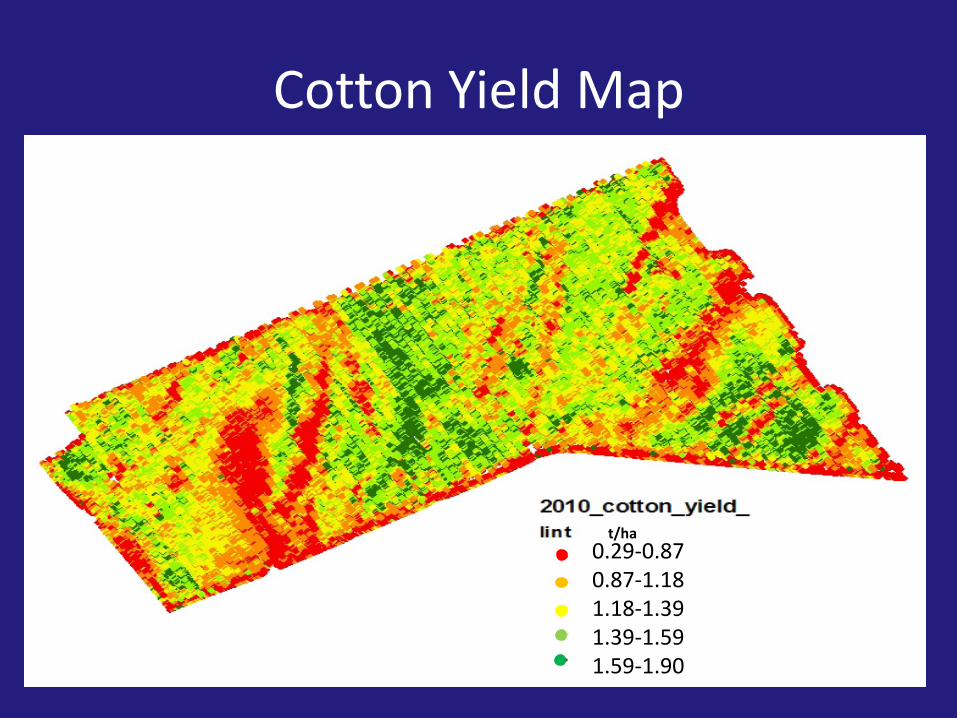
Cotton Yield Map
0.29-0.87 0.87-1.18 1.18-1.39 1.39-1.59 1.59-1.90
t/ha

SYSTEMS FOR SITE-SPECIFIC MANAGEMENT
• Real Time Sensors • Predetermined Management
Zones
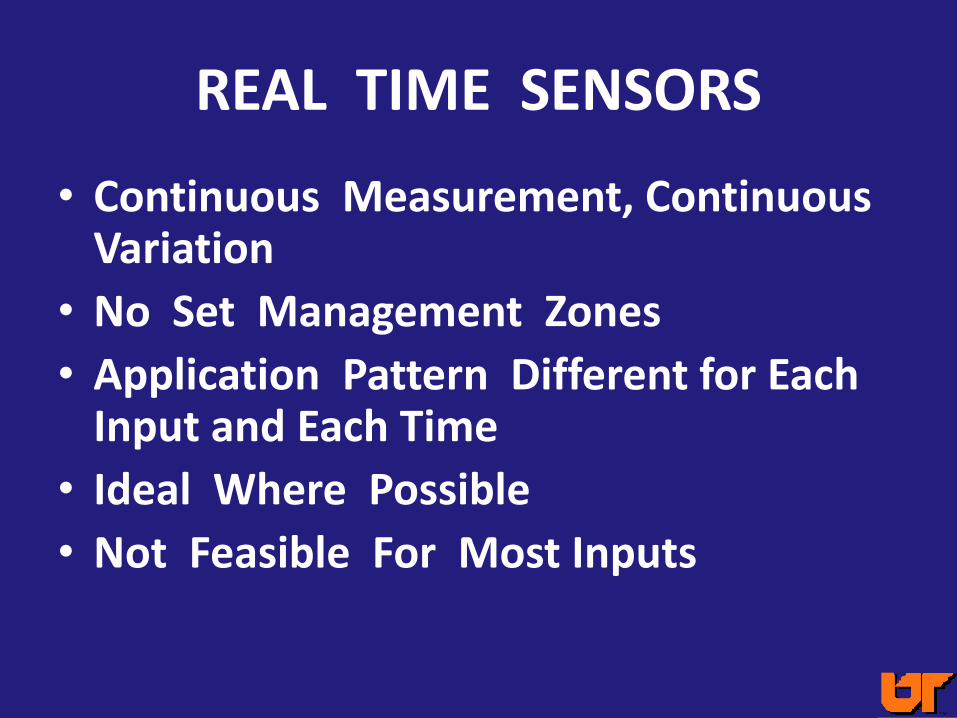
REAL TIME SENSORS
• Continuous Measurement, Continuous Variation
• No Set Management Zones • Application Pattern Different for Each
Input and Each Time • Ideal Where Possible • Not Feasible For Most Inputs
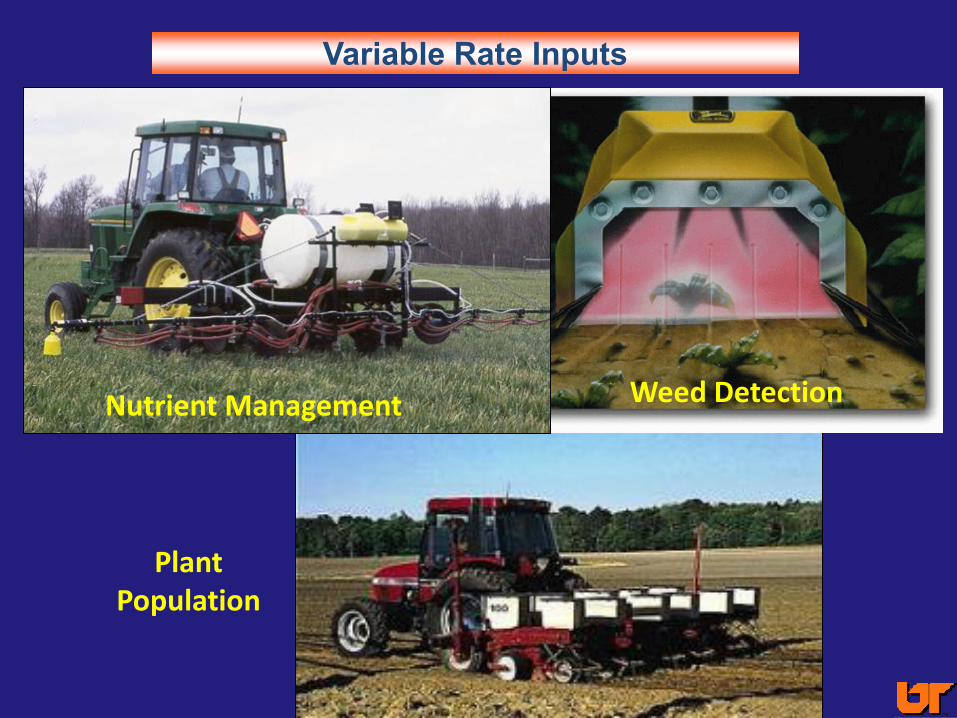
Variable Rate Inputs
Plant Population
Nutrient Management Weed Detection
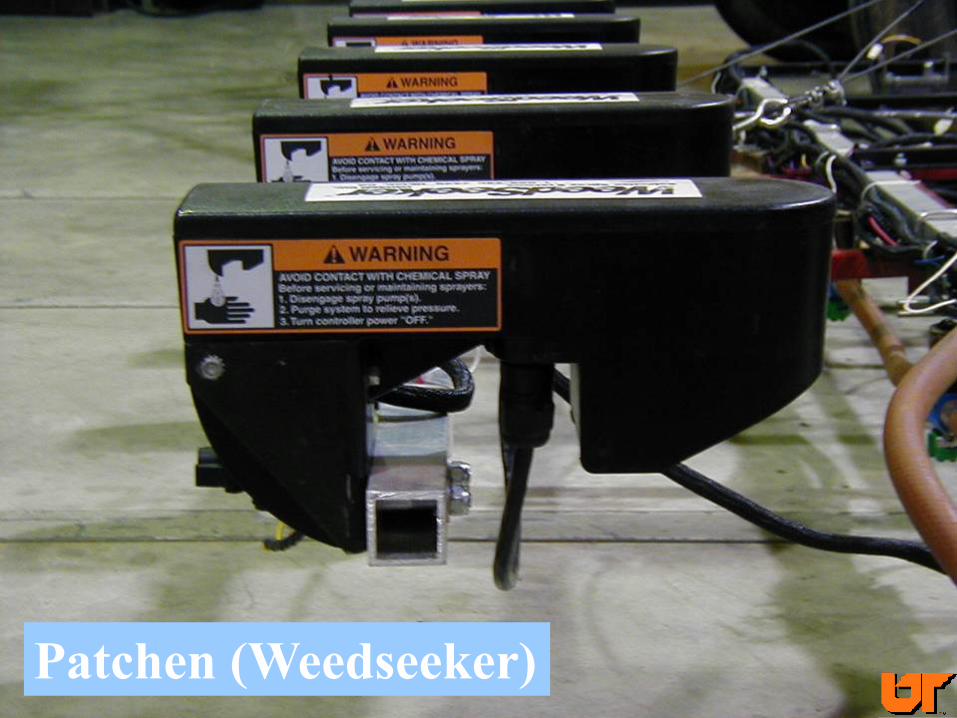
Patchen (Weedseeker)
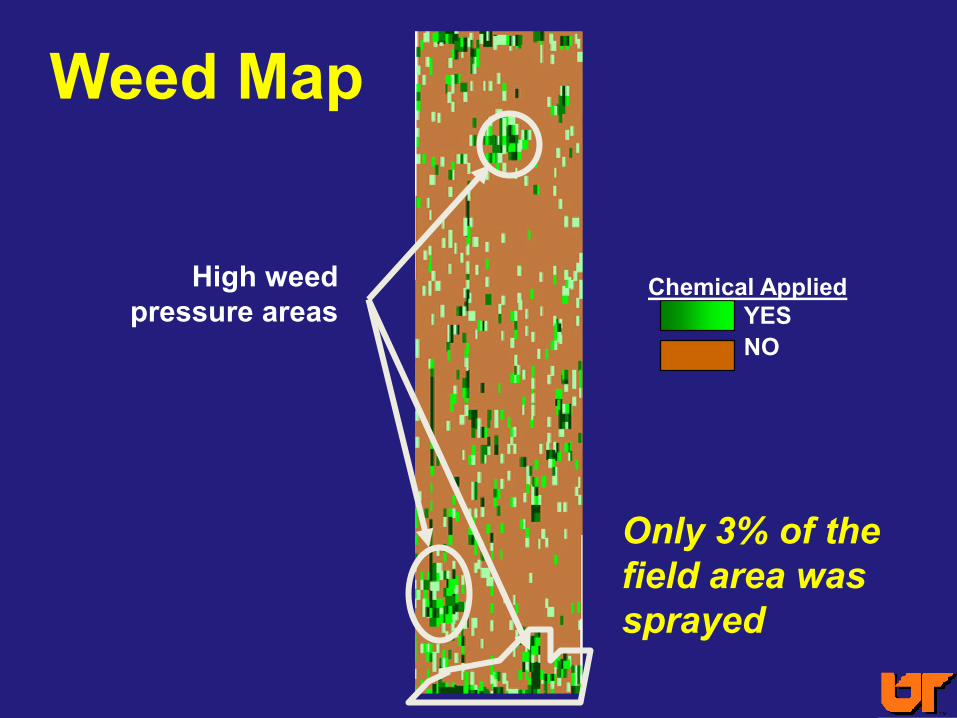
Weed Map
Only 3% of the field area was sprayed
High weed pressure areas
Chemical Applied YES NO


Potential Benefits of Real-Time Plant Health Sensing
Detection of plant diseases or chemical damage, insects, fertility deficiencies, etc.
SYSTEMS FOR SITE-SPECIFIC MANAGEMENT
• Real Time Sensors • Predetermined Management
Zones
WHY MANAGEMENT ZONES ?
• Response Varies Within Fields • Precision Agriculture Varies Management
to Match Response • Management Zones Are “Fields Within
Fields” • Divide Fields into Areas of Similar Response • Used as Basis For Site-Specific Management
For Each Zone
INFORMATION FOR SETTING MANAGEMENT ZONES
• Soil Survey • Topographic Maps • EC, EMI, or GPR • Intensive Soil or Topo Maps • Aerial or Satellite Imagery • Producer Knowledge • Yield Maps
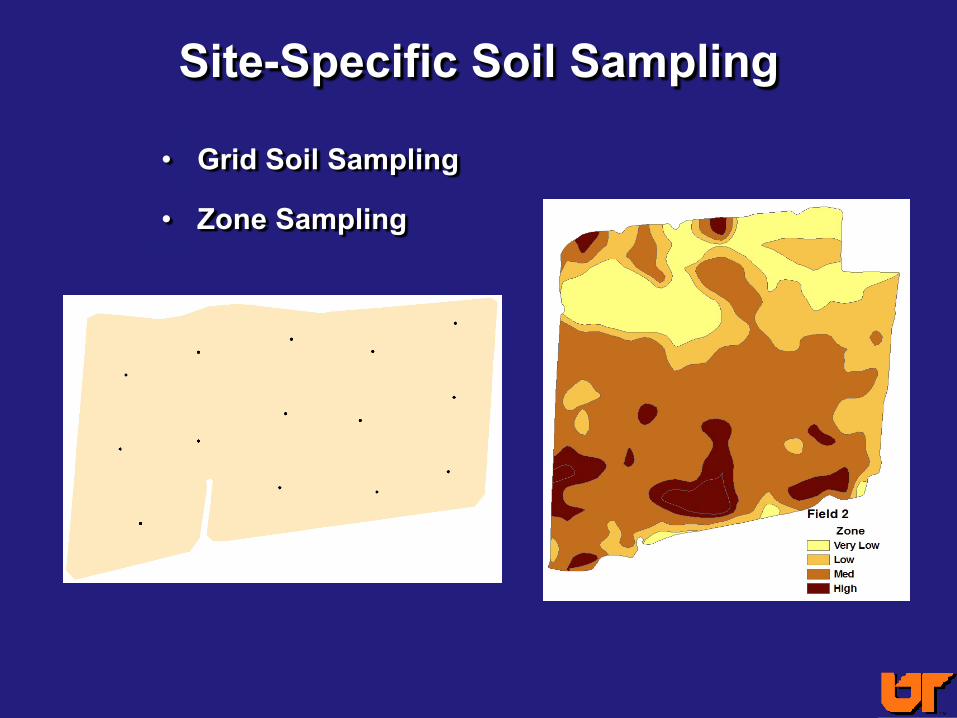
• Grid Soil Sampling
• Zone Sampling
Site-Specific Soil Sampling
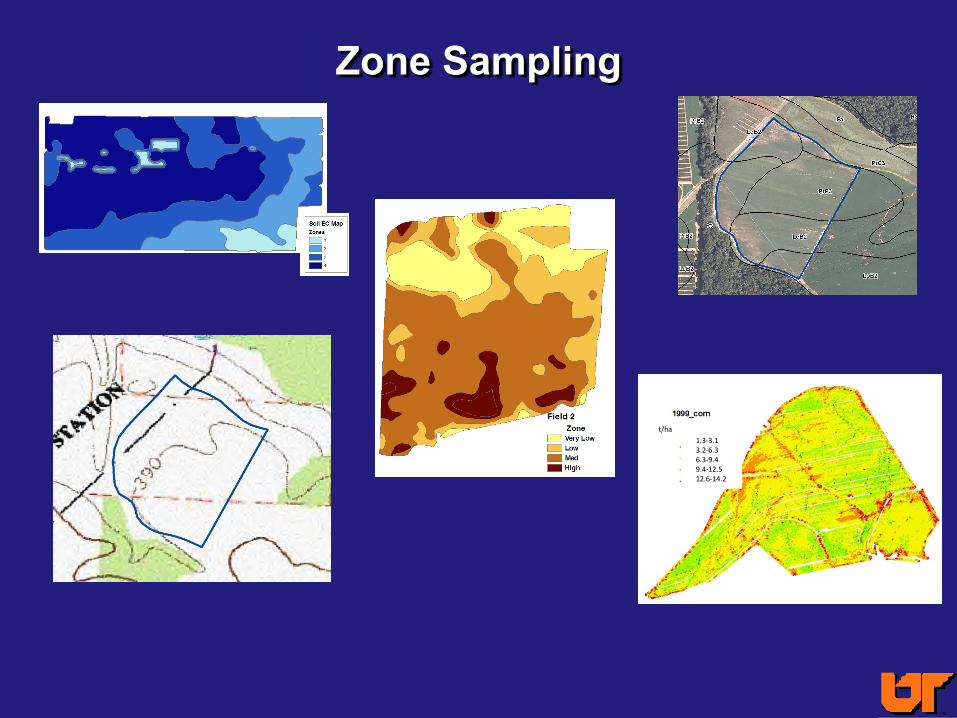
Zone Sampling
1.3-3.1 3.2-6.3 6.3-9.4 9.4-12.5 12.6-14.2
t/ha
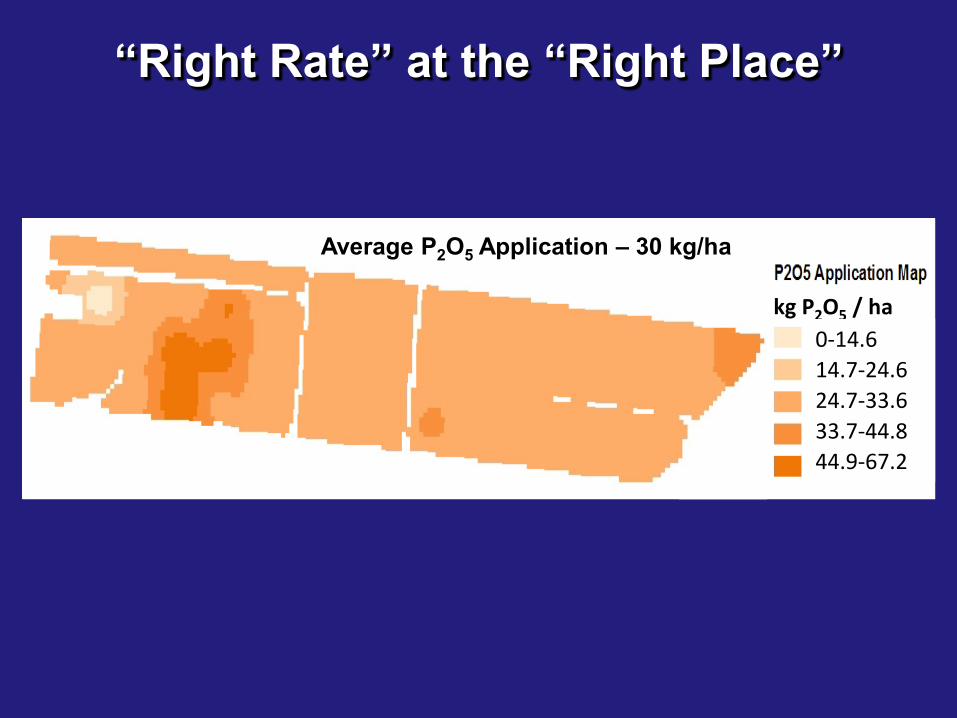
“Right Rate” at the “Right Place”
130 acres
Average P2O5 Application – 30 kg/ha
kg P2O5 / ha 0-14.6 14.7-24.6 24.7-33.6 33.7-44.8 44.9-67.2
-80
-60
-40
-20
0
20
40
60
80
100
30 lb/ac 60 lb/ac 75 lb/ac 90 lb/ac
30
60
75 90
27 27 27 27
-3
-33 -48
-63
P 2O
5 kg/
ha
Blanket VRA lbs reduced
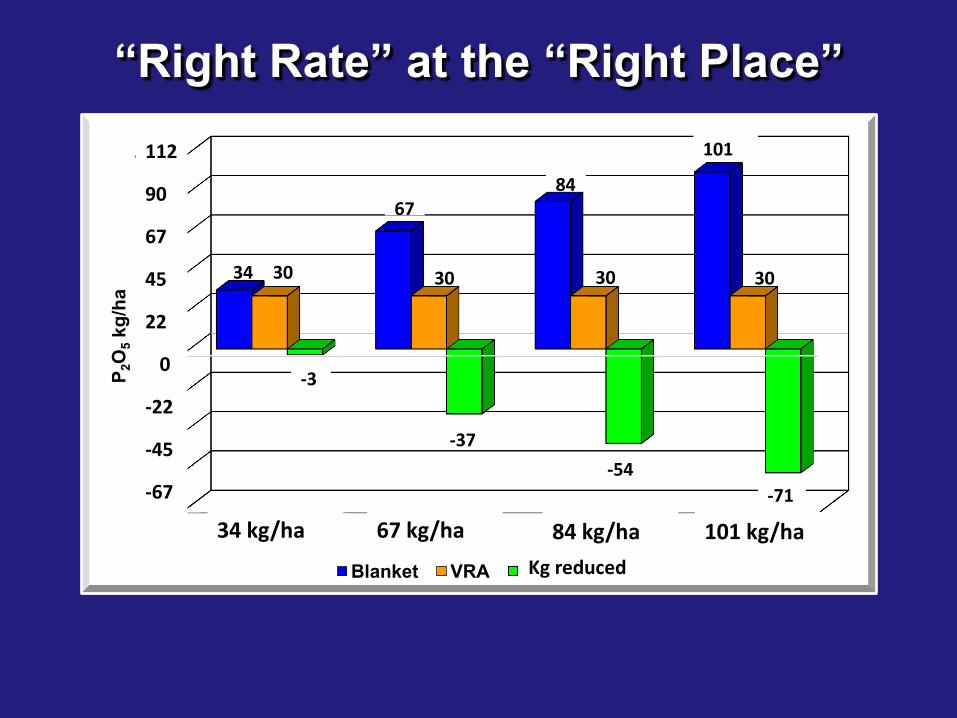
34 30
112
90
67
45
22
0
-22
-45
-67
“Right Rate” at the “Right Place”
34 kg/ha 67 kg/ha 84 kg/ha 101 kg/ha
-3
67
30
-37
84
30
-54
101
30
-71
Kg reduced
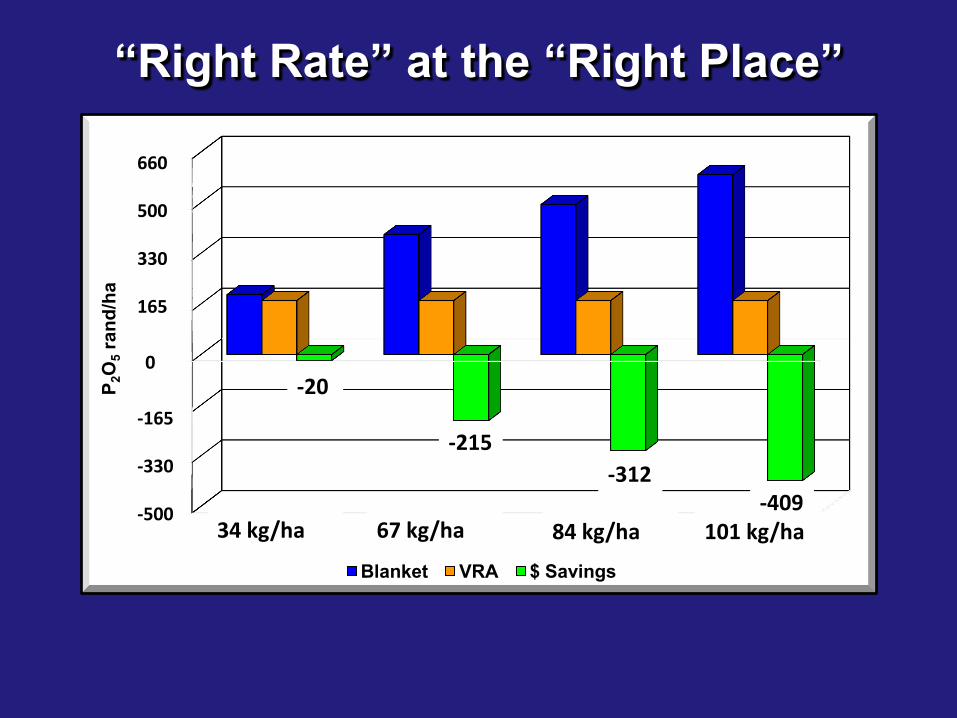
“Right Rate” at the “Right Place”
-60.0
-40.0
-20.0
0.0
20.0
40.0
60.0
80.0
30 lb/ac 60 lb/ac 75 lb/ac 90 lb/ac
-2.4
-26.1 -37.9
-49.8
P 2O
5 ran
d/ha
Blanket VRA $ Savings
-312 -215
-409
-330
-165
0
165
330
500
-500
660
-20
34 kg/ha 67 kg/ha 84 kg/ha 101 kg/ha
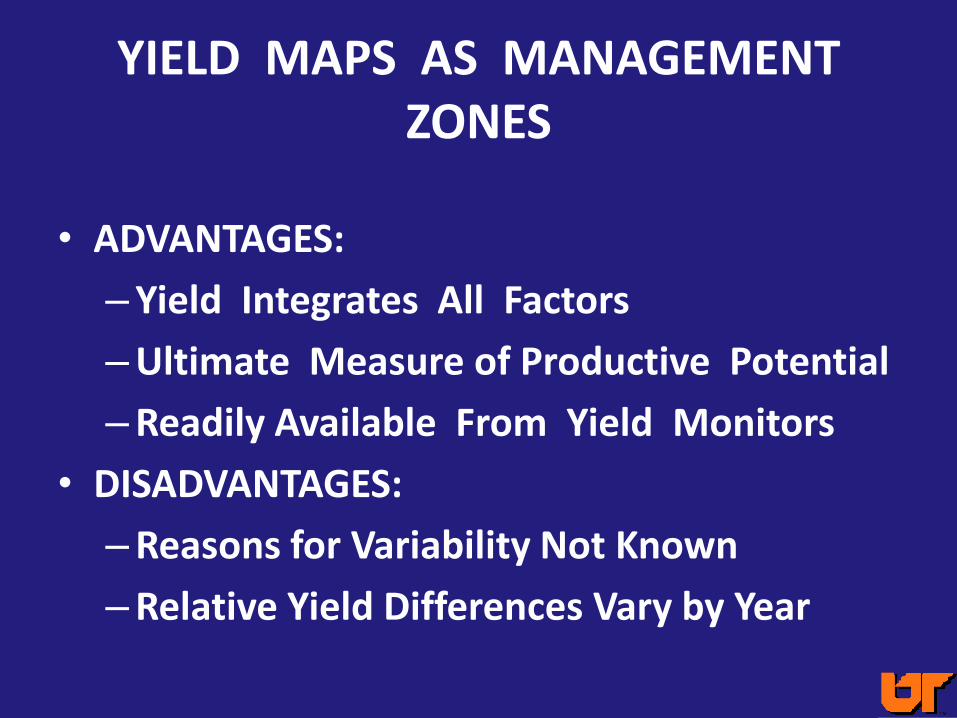
YIELD MAPS AS MANAGEMENT ZONES
• ADVANTAGES:
– Yield Integrates All Factors
– Ultimate Measure of Productive Potential
– Readily Available From Yield Monitors
• DISADVANTAGES:
– Reasons for Variability Not Known
– Relative Yield Differences Vary by Year
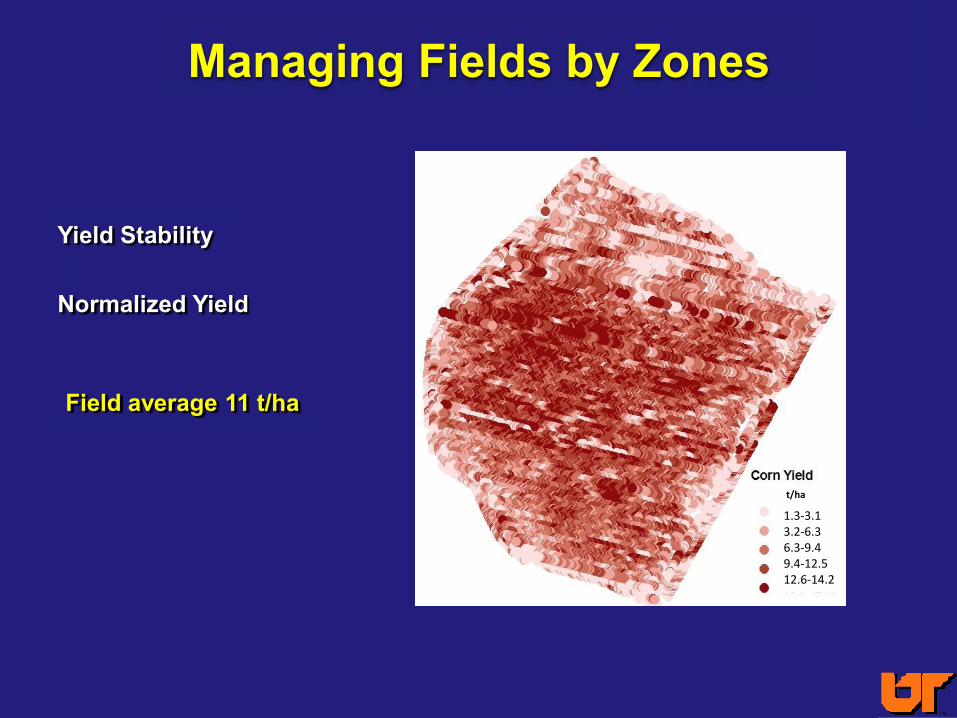
Yield Stability
Normalized Yield
Managing Fields by Zones
Field average 11 t/ha
1.3-3.1 3.2-6.3 6.3-9.4 9.4-12.5 12.6-14.2
t/ha

Field Average 11 t/ha
12.2 t/ha 11 t/ha
= 1.12
8.84 t/ha 11 t/ha
= 0.81
Normalized Yields
Managing Field Variability
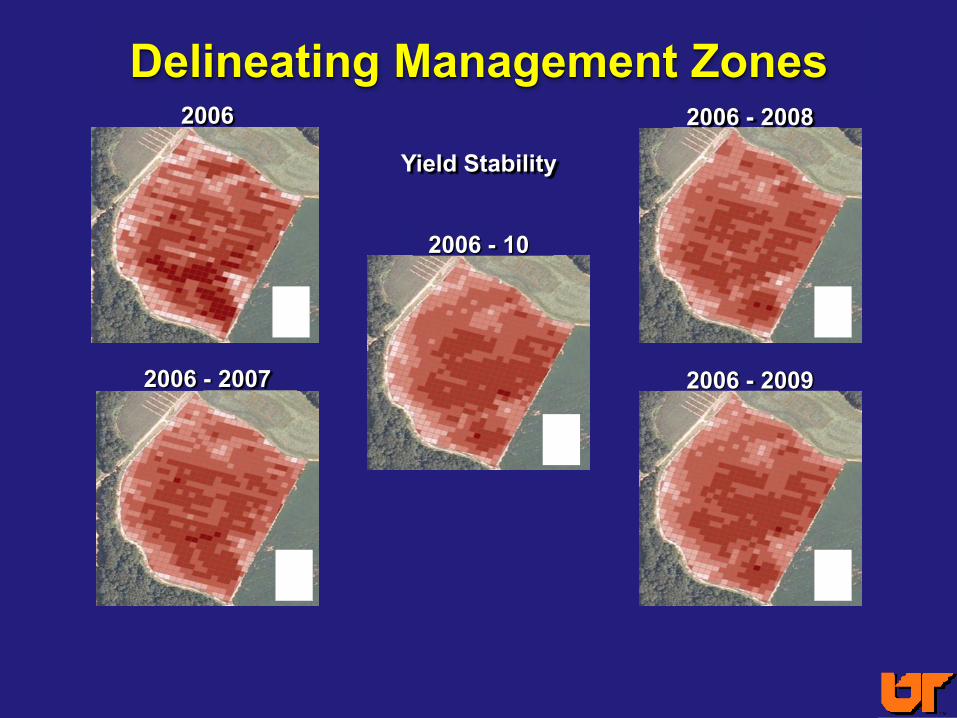
Delineating Management Zones 2006
2006 - 2007
2006 - 10
2006 - 2008
2006 - 2009
Yield Stability
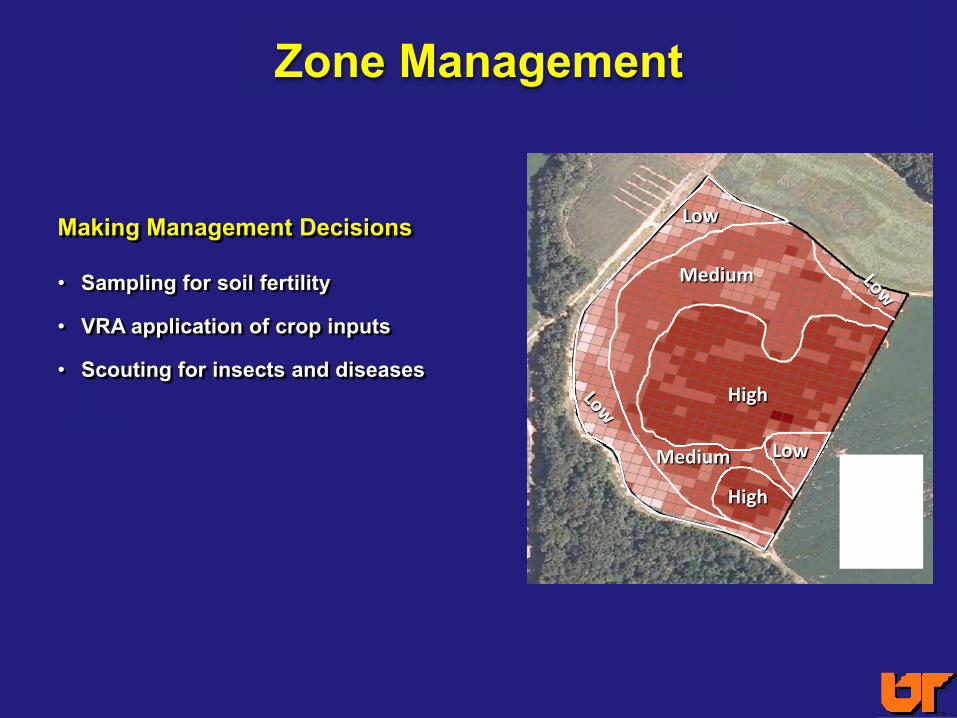
Zone Management
Making Management Decisions
• Sampling for soil fertility
• VRA application of crop inputs
• Scouting for insects and diseases
High
Medium
Low
Low
High
Medium
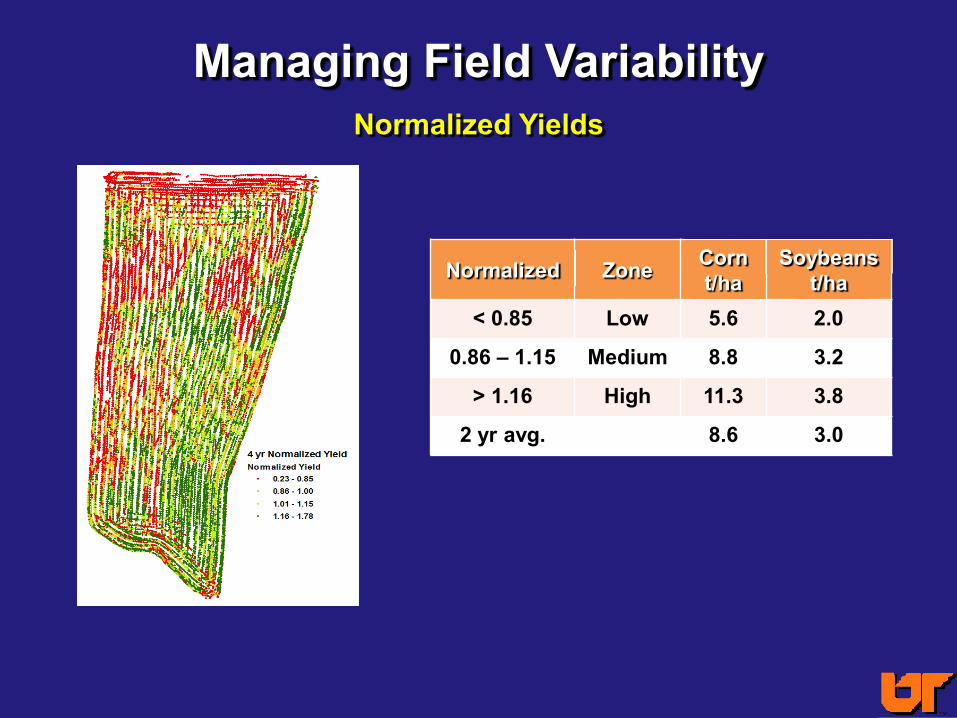
Managing Field Variability Normalized Yields
Normalized Zone Corn t/ha
Soybeans t/ha
< 0.85 Low 5.6 2.0
0.86 – 1.15 Medium 8.8 3.2
> 1.16 High 11.3 3.8
2 yr avg. 8.6 3.0
Liming with Variable Rates
Value of liming acid soils is well known Acid Soils:
– Rhizobium bacteria less robust – Nutrients less available – Aluminum and Manganese available at toxic levels
mainly at pH <5.5 Variable Rate Liming
– May reduce total lime needs for field – Even with cost of technology may reduce costs – More efficient way to use liming materials
General Assumptions Long term investment (5 to 7 years)
Land ownership
Lack of knowledge of field variation (target pH 6.5)
Lack of effective technologies for changing lime recommendations and application methods
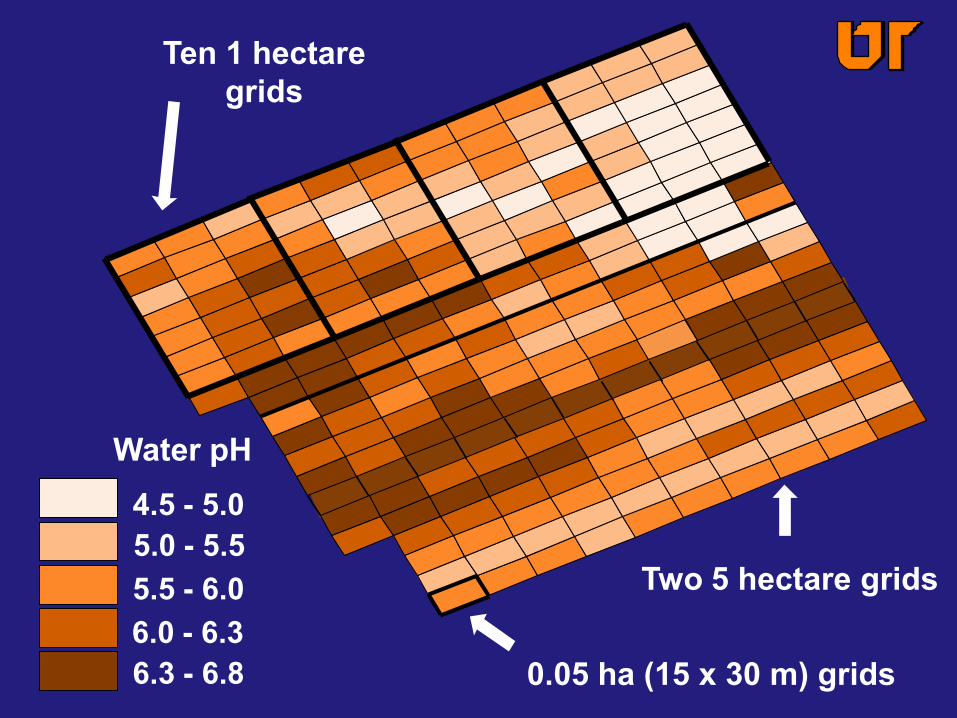
Water pH
Ten 1 hectare grids
4.5 - 5.0 5.0 - 5.5 5.5 - 6.0 6.0 - 6.3 6.3 - 6.8 0.05 ha (15 x 30 m) grids
Two 5 hectare grids
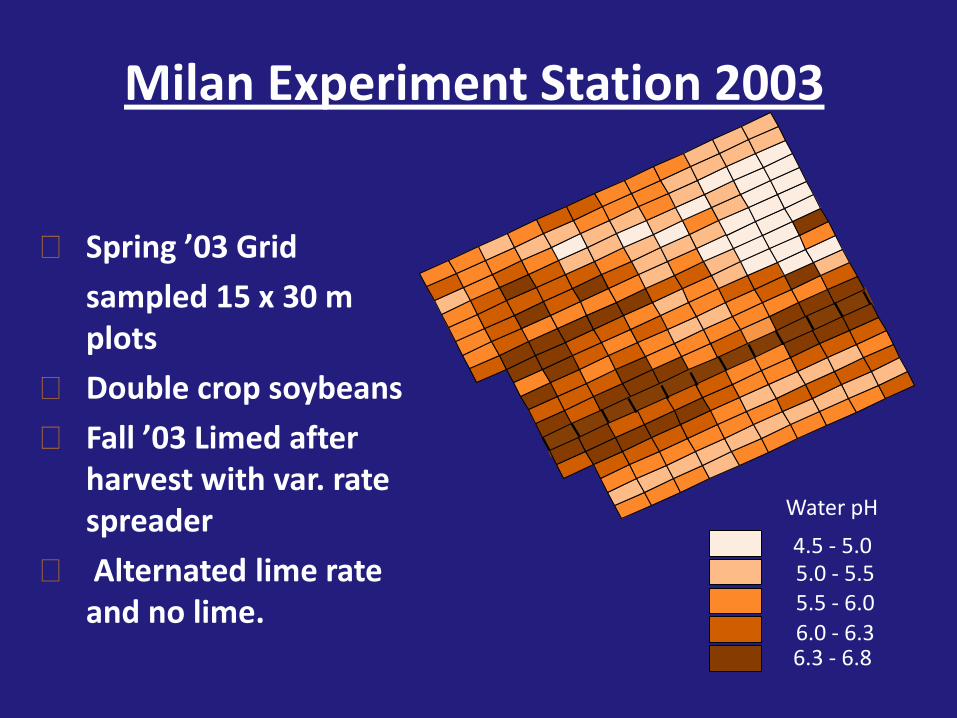
Milan Experiment Station 2003
Spring ’03 Grid
sampled 15 x 30 m plots
Double crop soybeans
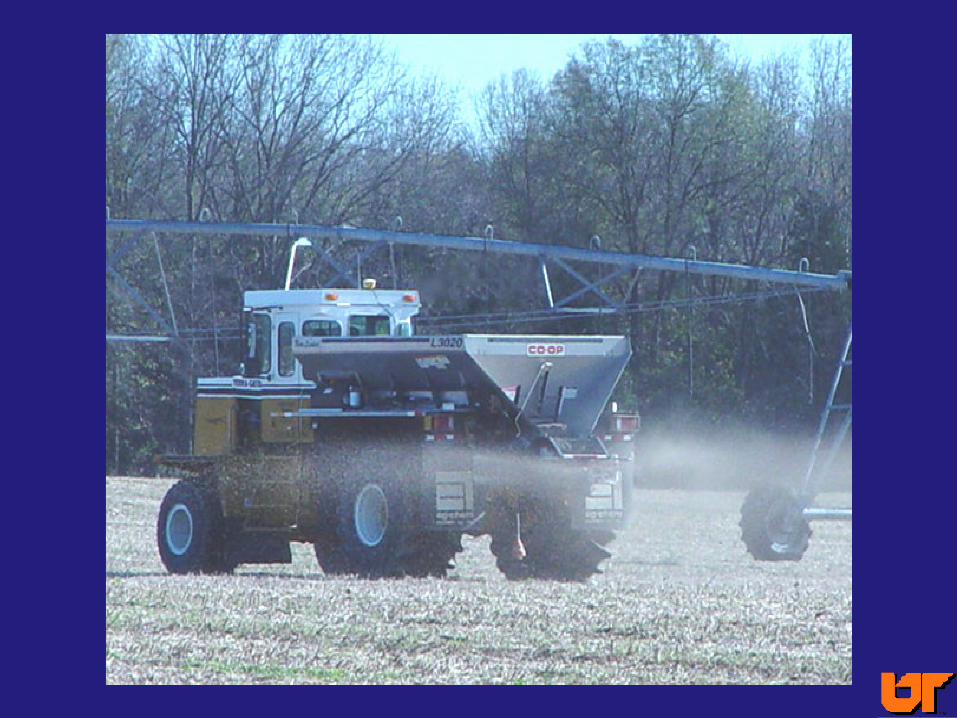
Fall ’03 Limed after harvest with var. rate spreader
Alternated lime rate and no lime.
4.5 - 5.0 5.0 - 5.5 5.5 - 6.0 6.0 - 6.3 6.3 - 6.8
Water pH
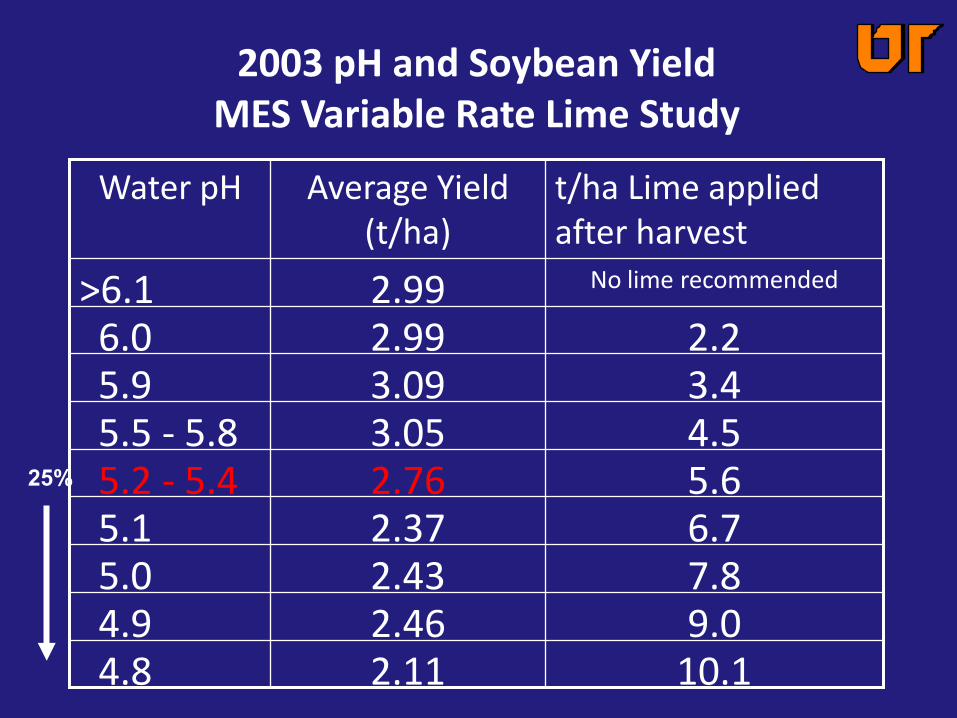
2003 pH and Soybean Yield MES Variable Rate Lime Study
9.0 2.46 4.9 7.8 2.43 5.0 6.7 2.37 5.1
10.1 2.11 4.8
5.6 2.76 5.2 - 5.4 4.5 3.05 5.5 - 5.8 3.4 3.09 5.9 2.2 2.99 6.0
No lime recommended 2.99 >6.1
t/ha Lime applied after harvest
Average Yield (t/ha)
Water pH
25%
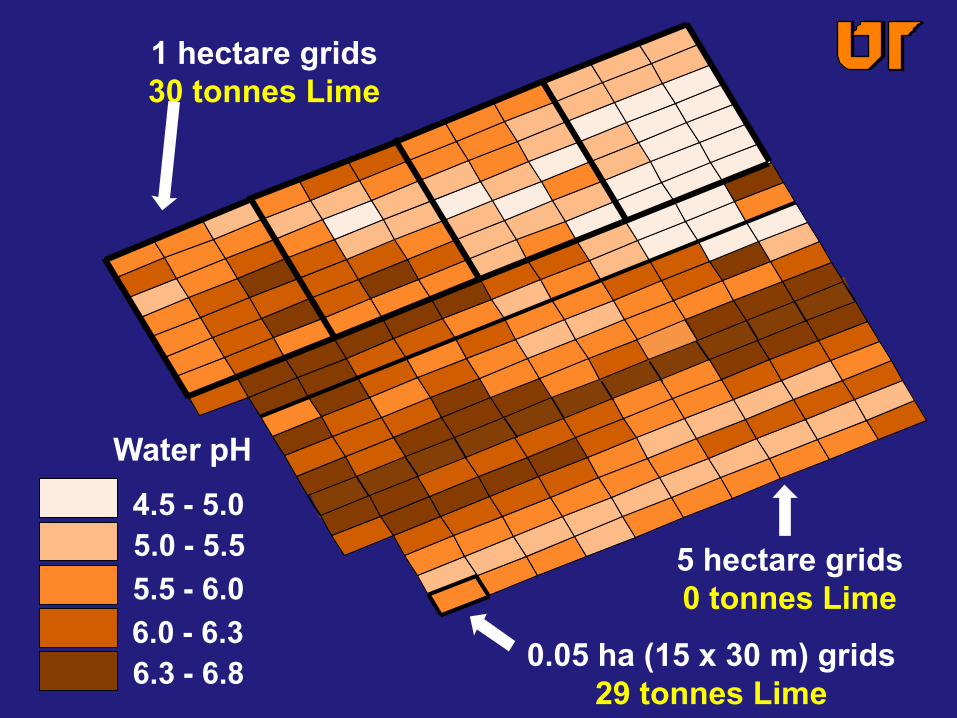
Water pH
1 hectare grids 30 tonnes Lime
4.5 - 5.0 5.0 - 5.5 5.5 - 6.0 6.0 - 6.3 6.3 - 6.8 0.05 ha (15 x 30 m) grids
29 tonnes Lime
5 hectare grids 0 tonnes Lime
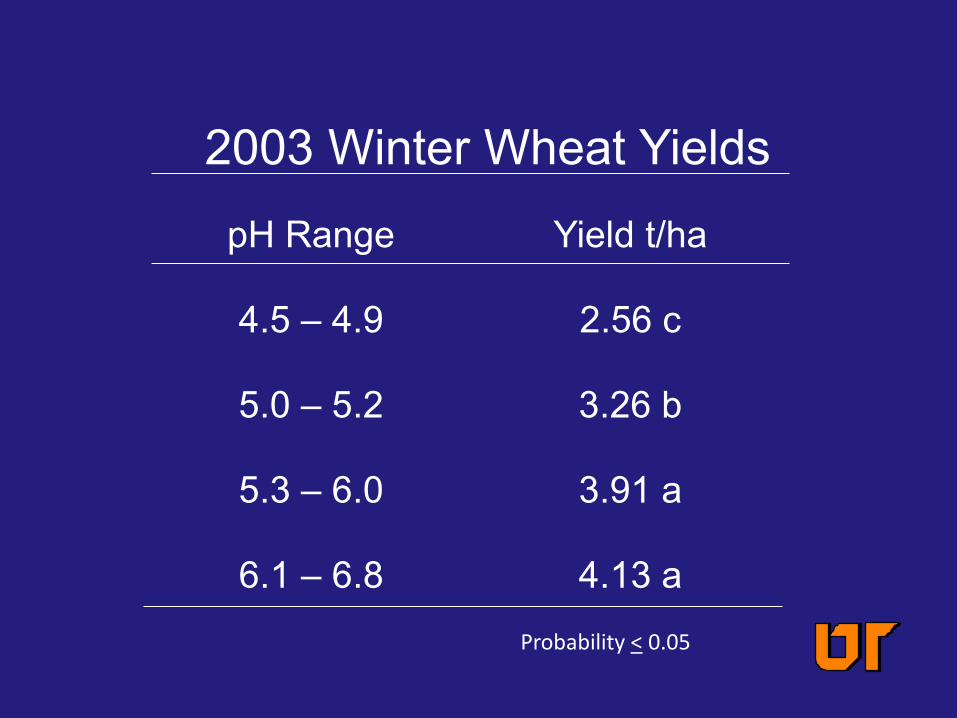
pH Range Yield t/ha
4.5 – 4.9 2.56 c
5.0 – 5.2 3.26 b
5.3 – 6.0 3.91 a
6.1 – 6.8 4.13 a
2003 Winter Wheat Yields
Probability < 0.05
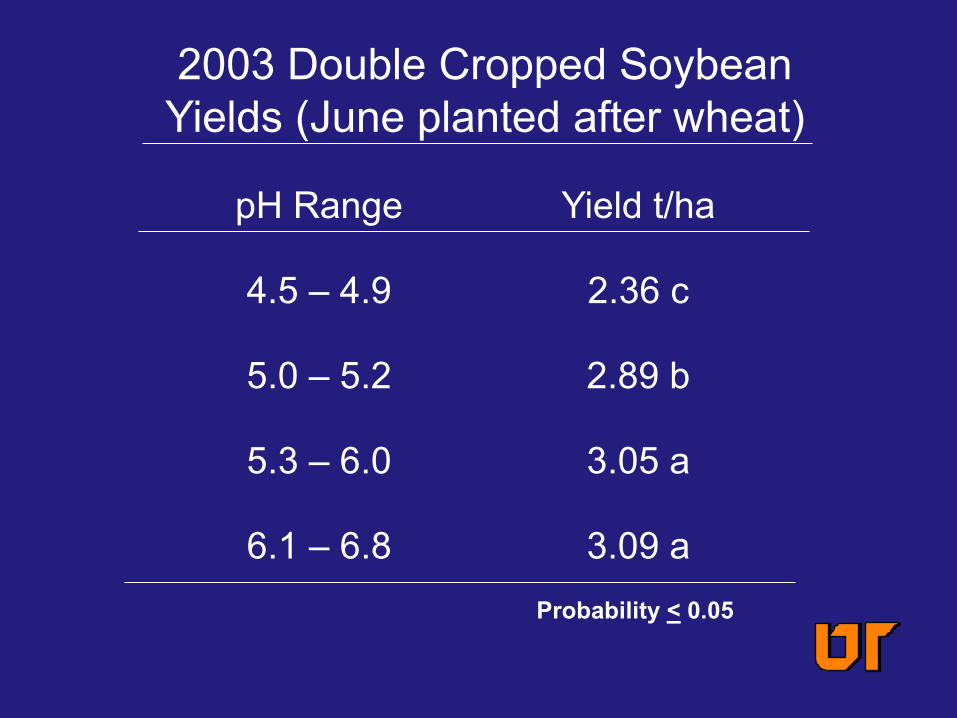
pH Range Yield t/ha
4.5 – 4.9 2.36 c
5.0 – 5.2 2.89 b
5.3 – 6.0 3.05 a
6.1 – 6.8 3.09 a
2003 Double Cropped Soybean Yields (June planted after wheat)
Probability < 0.05

t/ha Lime Recommended
pH change 2003-2005
2005 Soybean Yield Lime Not Applied Lime Applied
3.4
5.6
7.8
10.1
5.9 – 6.2
5.1 – 5.5
4.6 – 5.2
4.6 – 5.0
3.5 3.4
2.9 3.2
2.0 2.8
1.8 2.7
4.5 5.6 – 5.9 3.4 3.4
t/ha
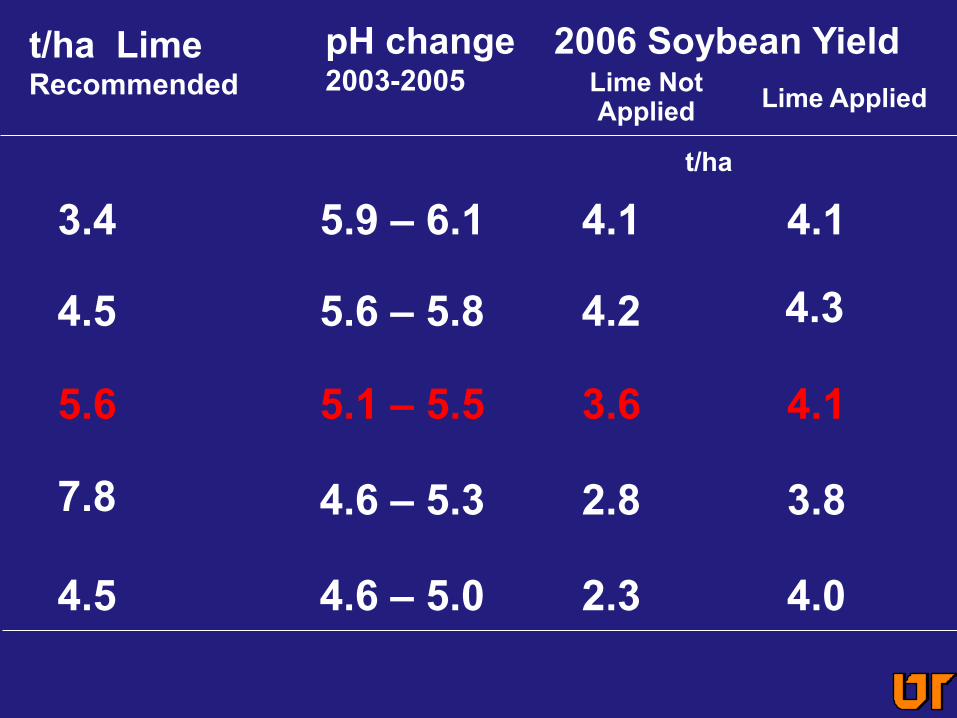
3.4 5.9 – 6.1 4.1 4.1
5.6 5.1 – 5.5 3.6 4.1
7.8 4.6 – 5.3 2.8 3.8
4.5 4.6 – 5.0 2.3 4.0
4.5 5.6 – 5.8 4.2 4.3
t/ha Lime Recommended
pH change 2003-2005
2006 Soybean Yield Lime Applied Lime Not
Applied
t/ha

Summary of Lime Study
Wheat and soybean yields did not decline until pH was below 5.5.
Grid sampling at 1 hectare grid size located most acid areas.
Lime should be targeted to the most acid areas of field.
Data will be used to develop better management strategies for variable rate liming.
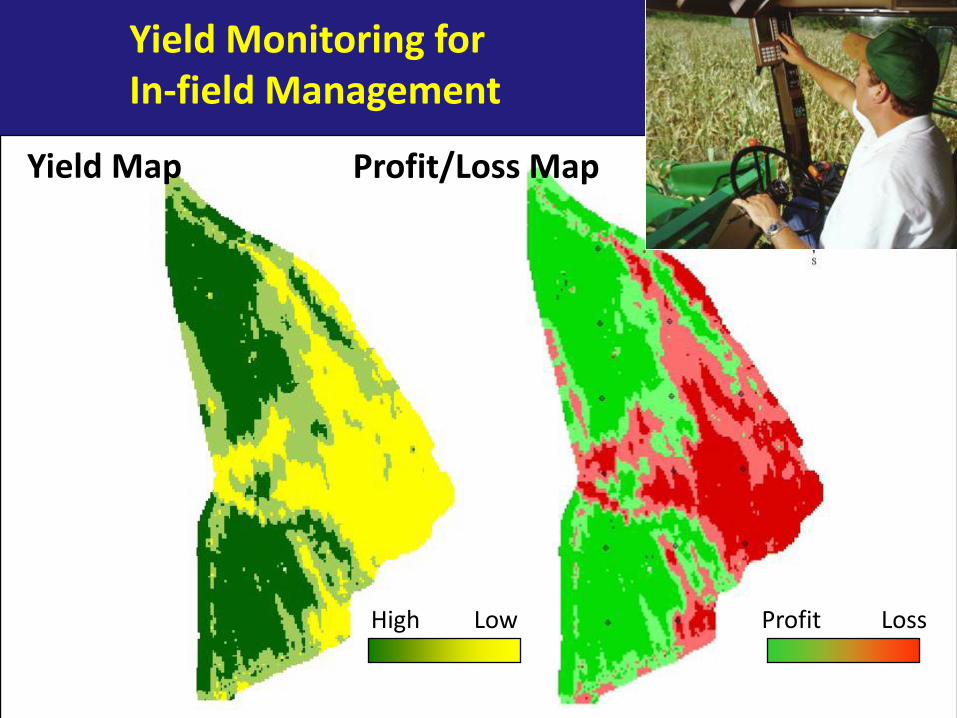
Yield Monitoring for In-field Management
Yield Map Profit/Loss Map
High Low Profit Loss
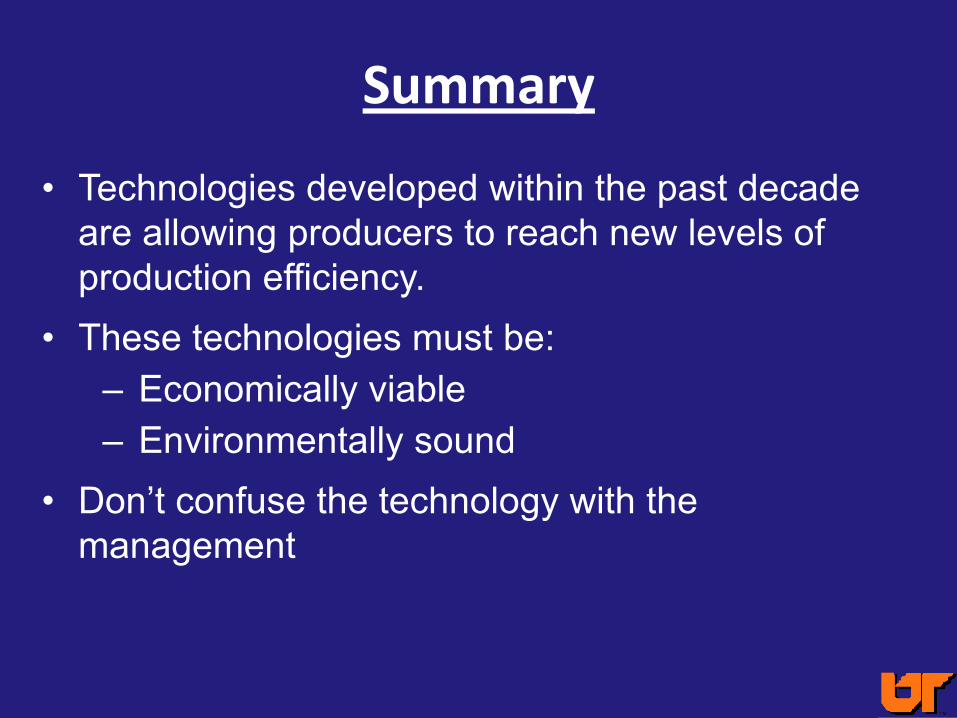
Summary
• Technologies developed within the past decade are allowing producers to reach new levels of production efficiency.
• These technologies must be: – Economically viable – Environmentally sound
• Don’t confuse the technology with the management
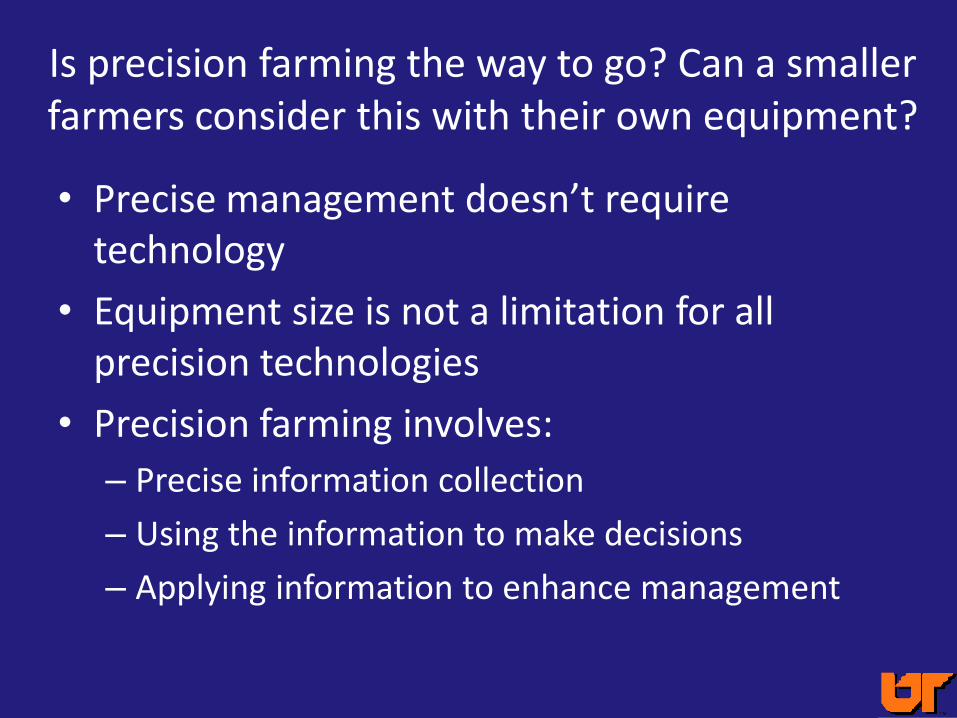
Is precision farming the way to go? Can a smaller farmers consider this with their own equipment?
• Precise management doesn’t require technology
• Equipment size is not a limitation for all precision technologies
• Precision farming involves: – Precise information collection
– Using the information to make decisions
– Applying information to enhance management

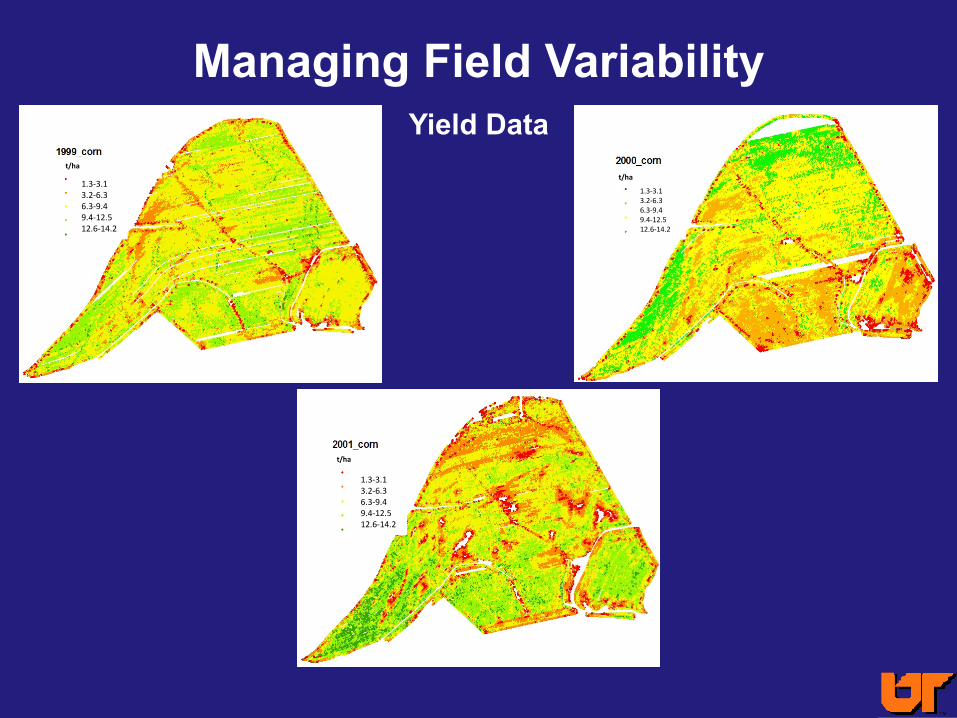
Managing Field Variability Yield Data
1.3-3.1 3.2-6.3 6.3-9.4 9.4-12.5 12.6-14.2
1.3-3.1 3.2-6.3 6.3-9.4 9.4-12.5 12.6-14.2
1.3-3.1 3.2-6.3 6.3-9.4 9.4-12.5 12.6-14.2
t/ha
t/ha
t/ha
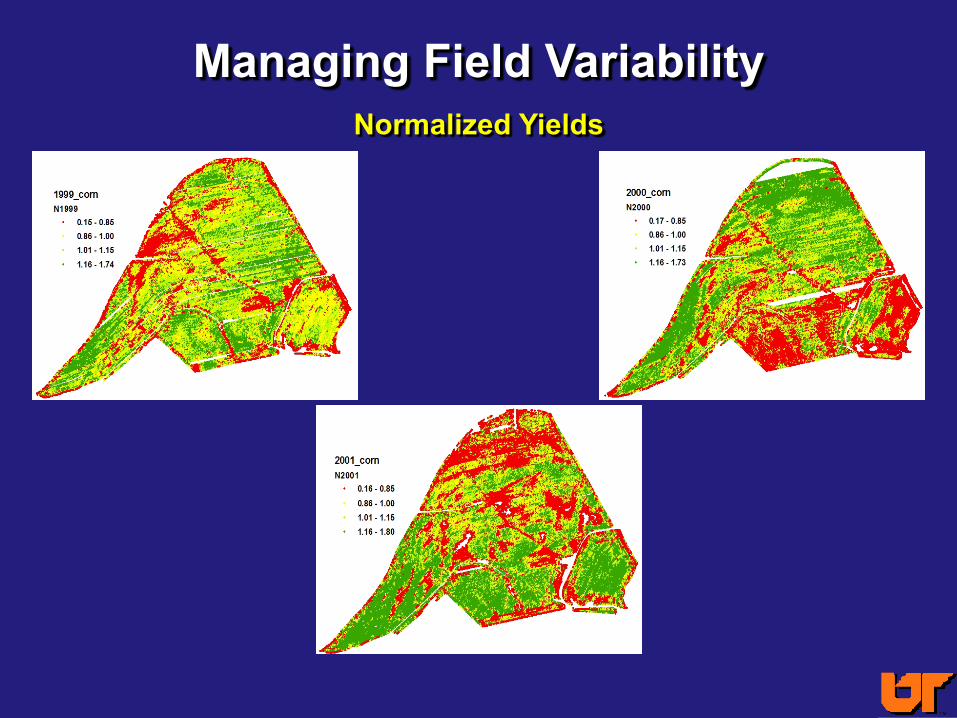
Normalized Yields
Managing Field Variability
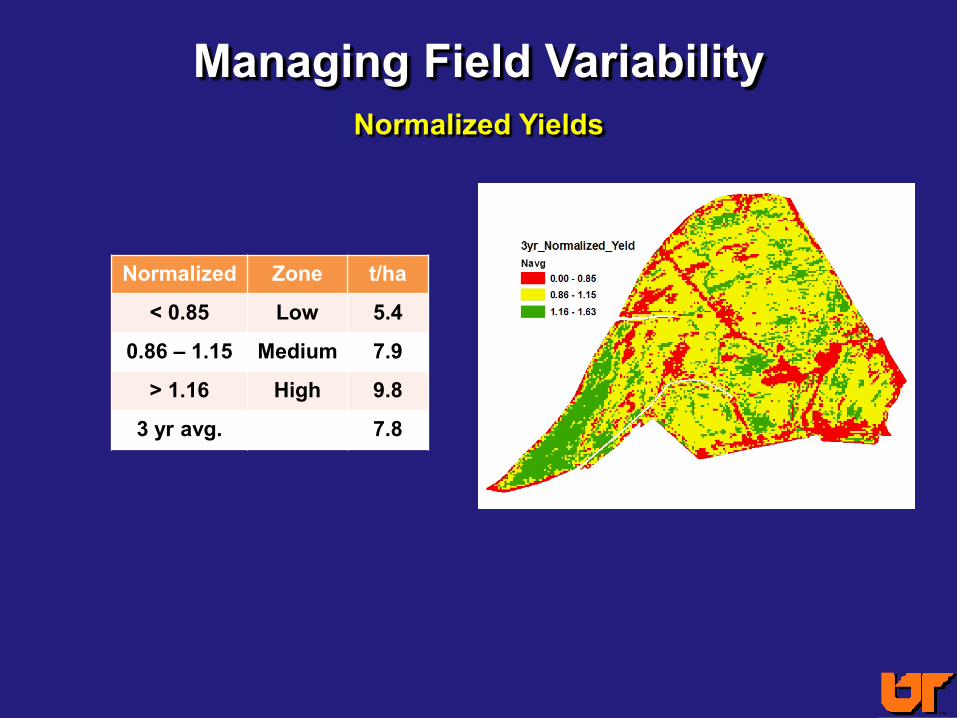
Managing Field Variability Normalized Yields
Normalized Zone t/ha
< 0.85 Low 5.4
0.86 – 1.15 Medium 7.9
> 1.16 High 9.8
3 yr avg. 7.8


![Tyler Beadle[1]](https://img.pdfslide.tips/doc/110x75/58d120fa1a28ab2a738b5903/tyler-beadle1.jpg)