Embed Size (px)
Citation preview
POSITIONING FORSUSTAINABLEGROWTH
Second Quarter 2017 Financial ResultsAugust 3, 2017
2RIC: TSX NYSE
2
RICHMONT MINESFORWARD-LOOKING STATEMENTSThis presentation contains forward-looking statements that include risks and uncertainties. When used in this presentation, thewords “estimate”, “projects”, “anticipate”, “expects”, “intend”, “believe”, “hope”, “may”, and similar expressions, as well as “will”, “shall”, andother indications of future tense, are intended to identify forward-looking statements. The forward-looking statements are based on currentexpectations and apply only as of the date on which they were made. Except as required by law or regulation, Richmont Mines Inc.(“Richmont” or the “Corporation”) undertakes no obligation and disclaims any responsibility to publicly update or revise any forward-looking statements of information, whether as a result of new information, future events or otherwise. The factors that could cause actualresults to differ materially from those indicated in such forward-looking statements include changes in the prevailing price of gold, theCanadian-U.S. exchange rate, grade of ore mined and unforeseen difficulties in mining operations that could affect revenue andproduction costs. Other factors such as uncertainties regarding government regulations could also affect the results. Other risks maybe detailed from time to time in Richmont’s Annual Information Form and other public disclosure.
Safe Harbor Statement & Cautionary Note to U.S. Investors Concerning Resources EstimatesThe resource estimates in this presentation were prepared in accordance with National Instrument 43-101 Standards of Disclosure ofMineral Projects (“NI 43-101”) adopted by the Canadian Securities Administrators. The requirements of NI 43-101 differ significantly fromthe requirements of the United States Securities and Exchange Commission (the “SEC”). In this presentation, we use the terms“Measured”, “Indicated” and “Inferred” Resources. Although these terms are recognized and required to be used in Canada, theSEC does not recognize them. The SEC permits U.S. mining corporations, in their filings with the SEC, to disclose only those mineraldeposits that constitute “Reserves”. Under United States standards, mineralization may not be classified as a Reserve unless thedetermination has been made that the mineralization could be economically and legally extracted at the time the determination is made.United States investors should not assume that all or any portion of a Measured or Indicated Resource will ever be converted into“Reserves”. Furthermore, “Inferred Resources” have a great amount of uncertainty as to their existence and whether they can be minedeconomically or legally, and United States investors should not assume that “Inferred Resources” exist or can be legally or economicallymined, or that they will ever be upgraded to a more certain category.
For additional information regarding the Mineral Reserves and Resources referred to in this presentation, please refer to the press releasedated Jan. 31, 2017 reporting Richmont’s Mineral Reserve and Resource estimates as of Dec. 31, 2016.
An NI 43-101 Technical Report for the Island Gold Mine Expansion Case Preliminary Economic Assessment (“PEA”) is available onwww.sedar.com.
U.S. Investors are urged to consider the disclosure in our annual report on Form 40-F, File No. 001-14598, which may be obtained fromus or from the SEC’s web site: http://sec.gov/edgar.shtml.
(All amounts are in Canadian Dollars, unless otherwise indicated.)
3RIC: TSX NYSE
3
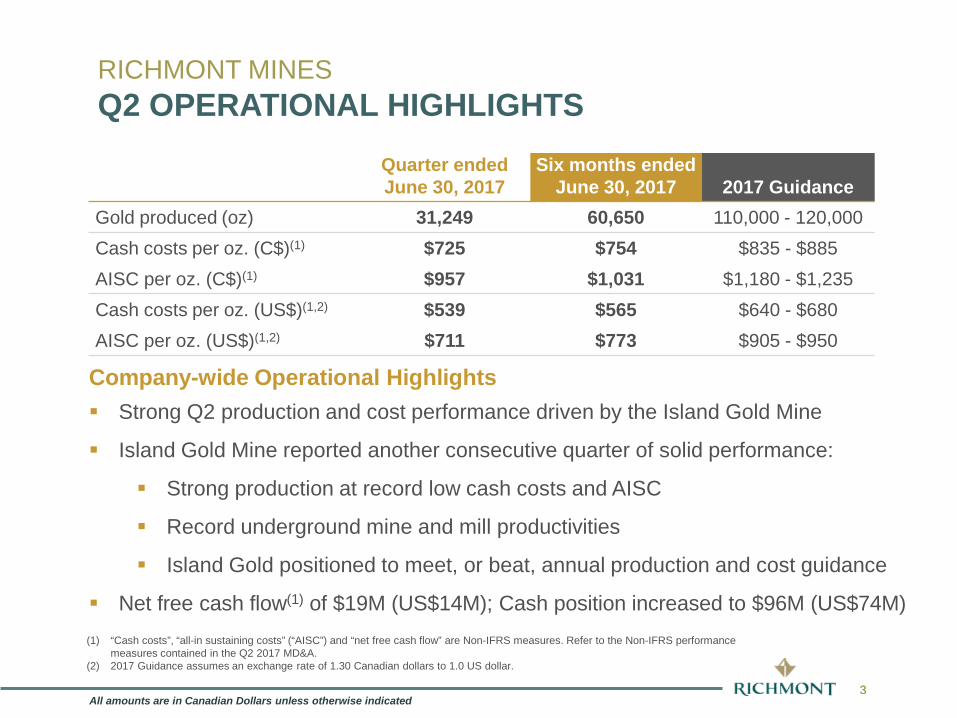
Quarter ended June 30, 2017
Six months ended June 30, 2017 2017 Guidance
Gold produced (oz) 31,249 60,650 110,000 - 120,000Cash costs per oz. (C$)(1) $725 $754 $835 - $885AISC per oz. (C$)(1) $957 $1,031 $1,180 - $1,235Cash costs per oz. (US$)(1,2) $539 $565 $640 - $680AISC per oz. (US$)(1,2) $711 $773 $905 - $950
Company-wide Operational Highlights Strong Q2 production and cost performance driven by the Island Gold Mine
Island Gold Mine reported another consecutive quarter of solid performance:
Strong production at record low cash costs and AISC
Record underground mine and mill productivities
Island Gold positioned to meet, or beat, annual production and cost guidance
Net free cash flow(1) of $19M (US$14M); Cash position increased to $96M (US$74M)
RICHMONT MINESQ2 OPERATIONAL HIGHLIGHTS
All amounts are in Canadian Dollars unless otherwise indicated
(1) “Cash costs”, “all-in sustaining costs” (“AISC”) and “net free cash flow” are Non-IFRS measures. Refer to the Non-IFRS performance measures contained in the Q2 2017 MD&A.
(2) 2017 Guidance assumes an exchange rate of 1.30 Canadian dollars to 1.0 US dollar.
4RIC: TSX NYSE
4
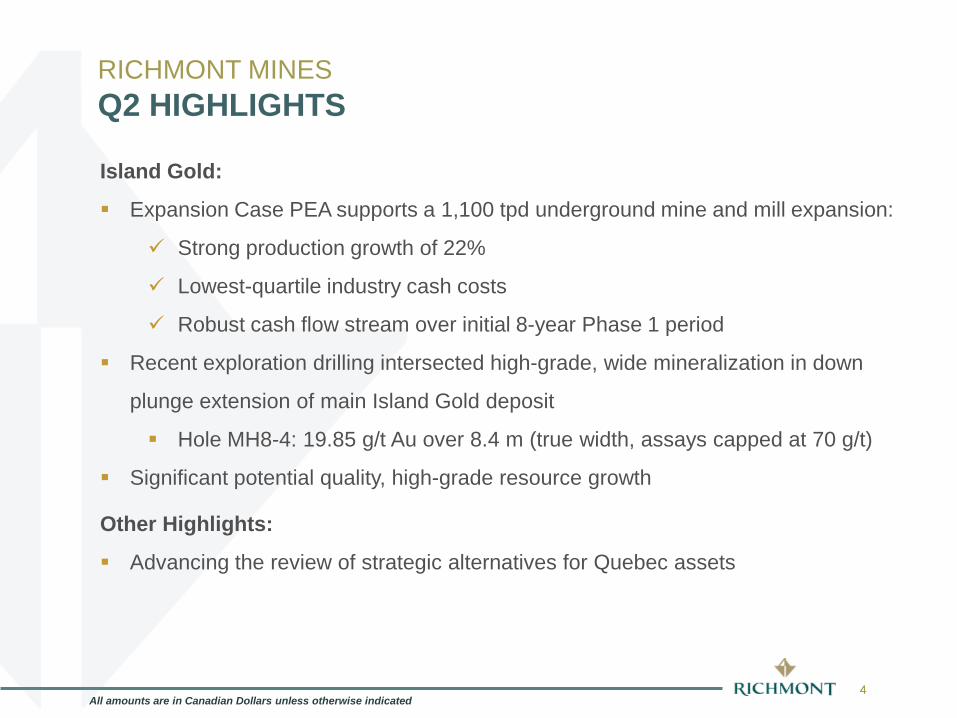
Island Gold:
Expansion Case PEA supports a 1,100 tpd underground mine and mill expansion:
Strong production growth of 22%
Lowest-quartile industry cash costs
Robust cash flow stream over initial 8-year Phase 1 period
Recent exploration drilling intersected high-grade, wide mineralization in down
plunge extension of main Island Gold deposit
Hole MH8-4: 19.85 g/t Au over 8.4 m (true width, assays capped at 70 g/t)
Significant potential quality, high-grade resource growth
Other Highlights:
Advancing the review of strategic alternatives for Quebec assets
RICHMONT MINESQ2 HIGHLIGHTS
All amounts are in Canadian Dollars unless otherwise indicated

5
FINANCIAL HIGHLIGHTS
6
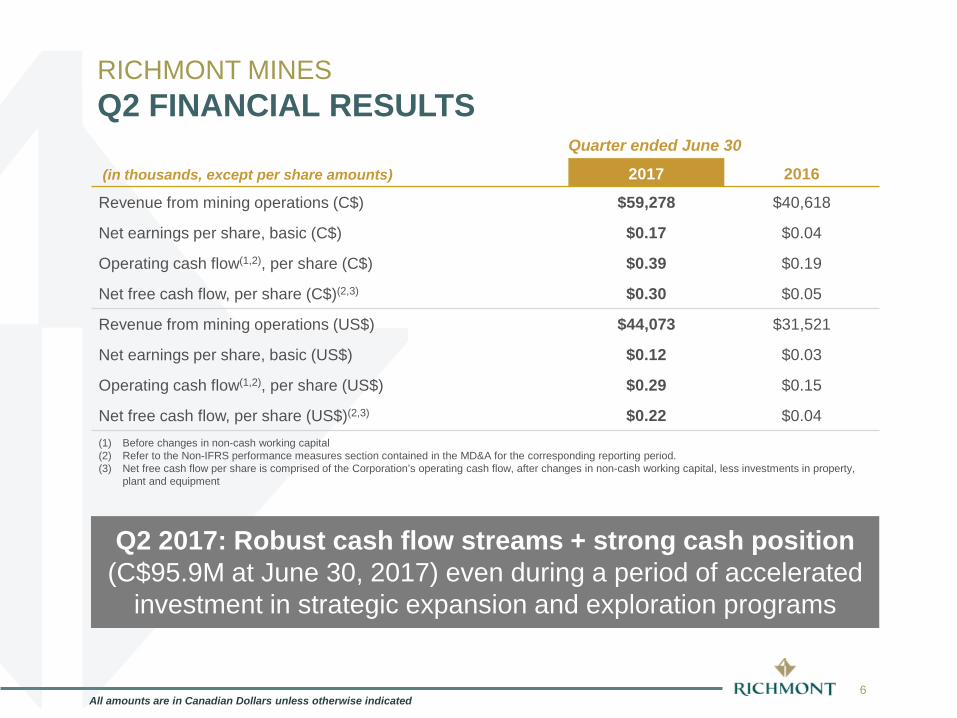
Quarter ended June 30
(in thousands, except per share amounts) 2017 2016
Revenue from mining operations (C$) $59,278 $40,618
Net earnings per share, basic (C$) $0.17 $0.04
Operating cash flow(1,2), per share (C$) $0.39 $0.19
Net free cash flow, per share (C$)(2,3) $0.30 $0.05
Revenue from mining operations (US$) $44,073 $31,521
Net earnings per share, basic (US$) $0.12 $0.03
Operating cash flow(1,2), per share (US$) $0.29 $0.15
Net free cash flow, per share (US$)(2,3) $0.22 $0.04(1) Before changes in non-cash working capital(2) Refer to the Non-IFRS performance measures section contained in the MD&A for the corresponding reporting period.(3) Net free cash flow per share is comprised of the Corporation’s operating cash flow, after changes in non-cash working capital, less investments in property,
plant and equipment
RICHMONT MINESQ2 FINANCIAL RESULTS
All amounts are in Canadian Dollars unless otherwise indicated
Q2 2017: Robust cash flow streams + strong cash position (C$95.9M at June 30, 2017) even during a period of accelerated
investment in strategic expansion and exploration programs
7
RICHMONT MINESQ2 CAPITAL EXPENDITURES & EXPLORATION
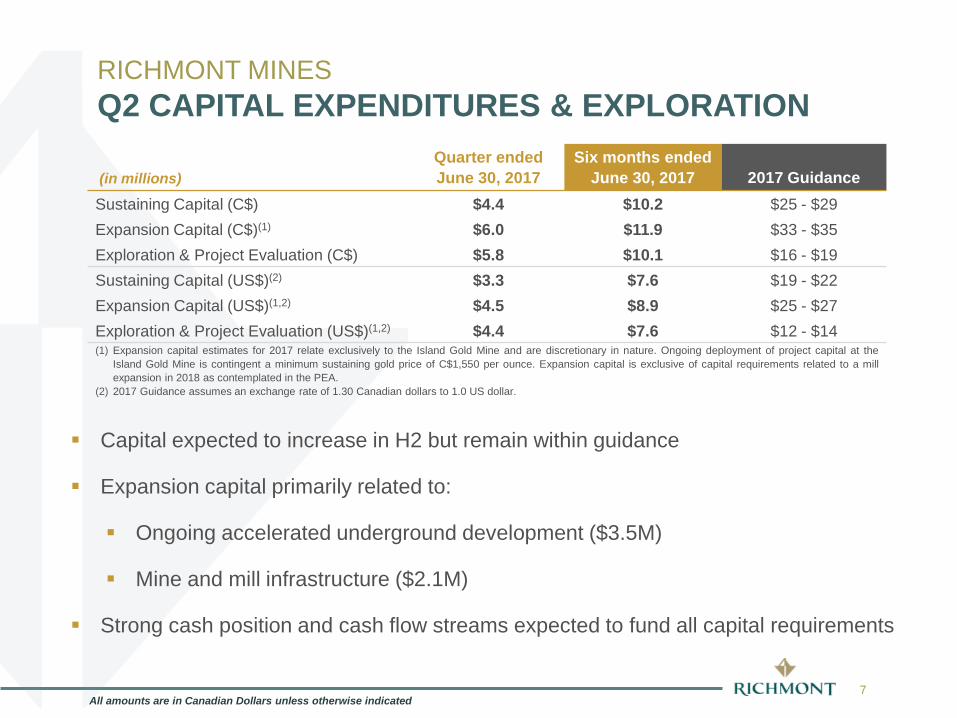
(in millions)Quarter ended June 30, 2017
Six months ended June 30, 2017 2017 Guidance
Sustaining Capital (C$) $4.4 $10.2 $25 - $29Expansion Capital (C$)(1) $6.0 $11.9 $33 - $35Exploration & Project Evaluation (C$) $5.8 $10.1 $16 - $19Sustaining Capital (US$)(2) $3.3 $7.6 $19 - $22Expansion Capital (US$)(1,2) $4.5 $8.9 $25 - $27Exploration & Project Evaluation (US$)(1,2) $4.4 $7.6 $12 - $14(1) Expansion capital estimates for 2017 relate exclusively to the Island Gold Mine and are discretionary in nature. Ongoing deployment of project capital at the
Island Gold Mine is contingent a minimum sustaining gold price of C$1,550 per ounce. Expansion capital is exclusive of capital requirements related to a millexpansion in 2018 as contemplated in the PEA.
(2) 2017 Guidance assumes an exchange rate of 1.30 Canadian dollars to 1.0 US dollar.
Capital expected to increase in H2 but remain within guidance
Expansion capital primarily related to:
Ongoing accelerated underground development ($3.5M)
Mine and mill infrastructure ($2.1M)
Strong cash position and cash flow streams expected to fund all capital requirements
All amounts are in Canadian Dollars unless otherwise indicated

8
OPERATIONS & OVERVIEW
9
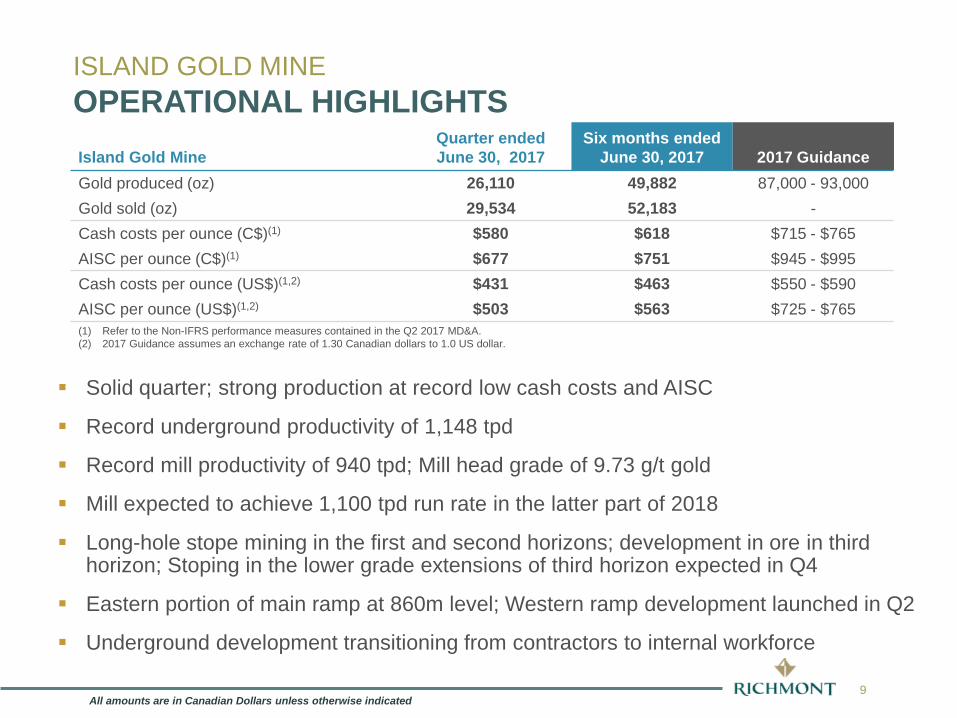
Island Gold MineQuarter ended June 30, 2017
Six months ended June 30, 2017 2017 Guidance
Gold produced (oz) 26,110 49,882 87,000 - 93,000Gold sold (oz) 29,534 52,183 -Cash costs per ounce (C$)(1) $580 $618 $715 - $765AISC per ounce (C$)(1) $677 $751 $945 - $995Cash costs per ounce (US$)(1,2) $431 $463 $550 - $590AISC per ounce (US$)(1,2) $503 $563 $725 - $765(1) Refer to the Non-IFRS performance measures contained in the Q2 2017 MD&A.(2) 2017 Guidance assumes an exchange rate of 1.30 Canadian dollars to 1.0 US dollar.
ISLAND GOLD MINEOPERATIONAL HIGHLIGHTS
Solid quarter; strong production at record low cash costs and AISC
Record underground productivity of 1,148 tpd
Record mill productivity of 940 tpd; Mill head grade of 9.73 g/t gold
Mill expected to achieve 1,100 tpd run rate in the latter part of 2018
Long-hole stope mining in the first and second horizons; development in ore in third horizon; Stoping in the lower grade extensions of third horizon expected in Q4
Eastern portion of main ramp at 860m level; Western ramp development launched in Q2
Underground development transitioning from contractors to internal workforce
All amounts are in Canadian Dollars unless otherwise indicated
10
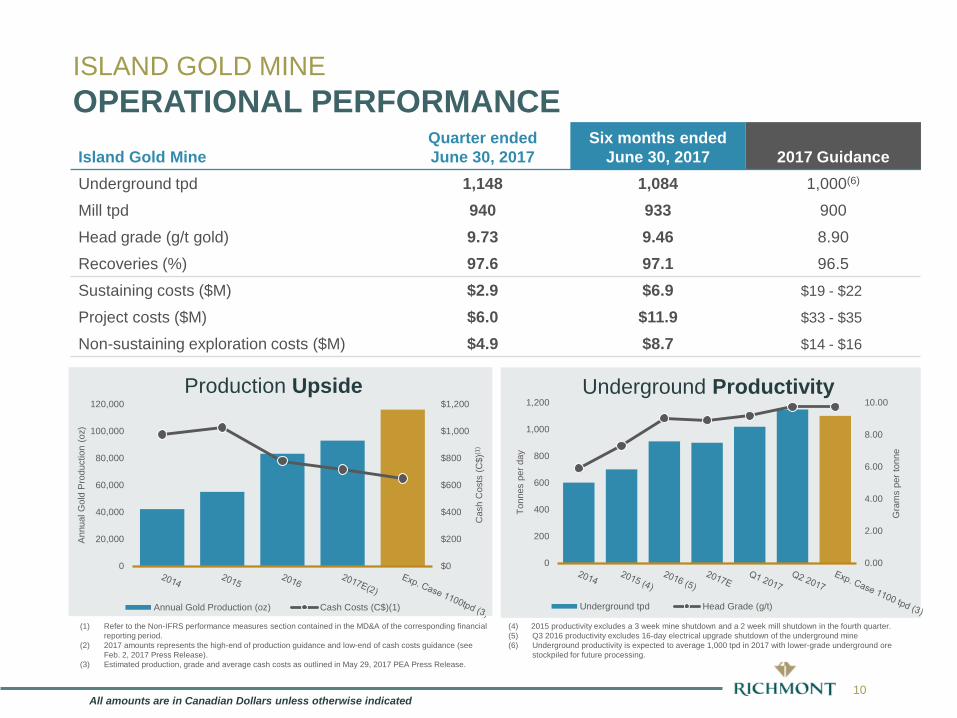
Production Upside
(1) Refer to the Non-IFRS performance measures section contained in the MD&A of the corresponding financial reporting period.
(2) 2017 amounts represents the high-end of production guidance and low-end of cash costs guidance (see Feb. 2, 2017 Press Release).
(3) Estimated production, grade and average cash costs as outlined in May 29, 2017 PEA Press Release.
Underground Productivity
$0
$200
$400
$600
$800
$1,000
$1,200
0
20,000
40,000
60,000
80,000
100,000
120,000
Cas
h C
osts
(C$)
(1)
Ann
ual G
old
Pro
duct
ion
(oz)
Annual Gold Production (oz) Cash Costs (C$)(1)
0.00
2.00
4.00
6.00
8.00
10.00
0
200
400
600
800
1,000
1,200
Gra
ms
per t
onne
Tonn
es p
er d
ay
Underground tpd Head Grade (g/t)
(4) 2015 productivity excludes a 3 week mine shutdown and a 2 week mill shutdown in the fourth quarter.(5) Q3 2016 productivity excludes 16-day electrical upgrade shutdown of the underground mine(6) Underground productivity is expected to average 1,000 tpd in 2017 with lower-grade underground ore
stockpiled for future processing.
ISLAND GOLD MINEOPERATIONAL PERFORMANCEIsland Gold Mine
Quarter ended June 30, 2017
Six months ended June 30, 2017 2017 Guidance
Underground tpd 1,148 1,084 1,000(6)
Mill tpd 940 933 900
Head grade (g/t gold) 9.73 9.46 8.90
Recoveries (%) 97.6 97.1 96.5
Sustaining costs ($M) $2.9 $6.9 $19 - $22
Project costs ($M) $6.0 $11.9 $33 - $35
Non-sustaining exploration costs ($M) $4.9 $8.7 $14 - $16
All amounts are in Canadian Dollars unless otherwise indicated
11
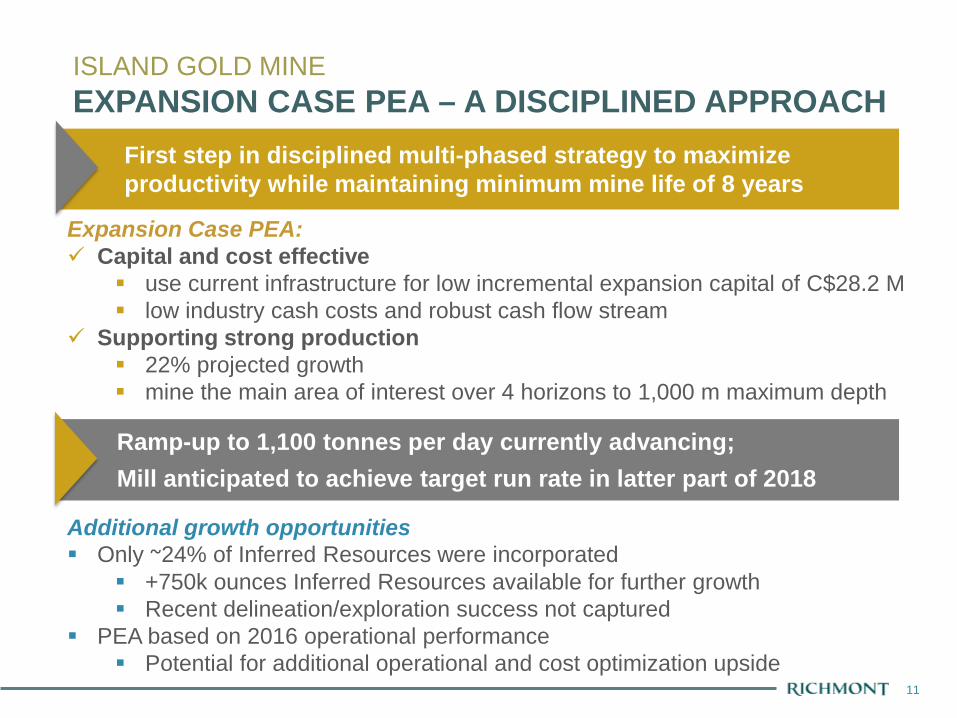
First step in disciplined multi-phased strategy to maximize productivity while maintaining minimum mine life of 8 years
Expansion Case PEA: Capital and cost effective
use current infrastructure for low incremental expansion capital of C$28.2 M low industry cash costs and robust cash flow stream
Supporting strong production 22% projected growth mine the main area of interest over 4 horizons to 1,000 m maximum depth
Additional growth opportunities Only ~24% of Inferred Resources were incorporated
+750k ounces Inferred Resources available for further growth Recent delineation/exploration success not captured
PEA based on 2016 operational performance Potential for additional operational and cost optimization upside
Ramp-up to 1,100 tonnes per day currently advancing; Mill anticipated to achieve target run rate in latter part of 2018
ISLAND GOLD MINEEXPANSION CASE PEA – A DISCIPLINED APPROACH
12RIC: TSX NYSE
12
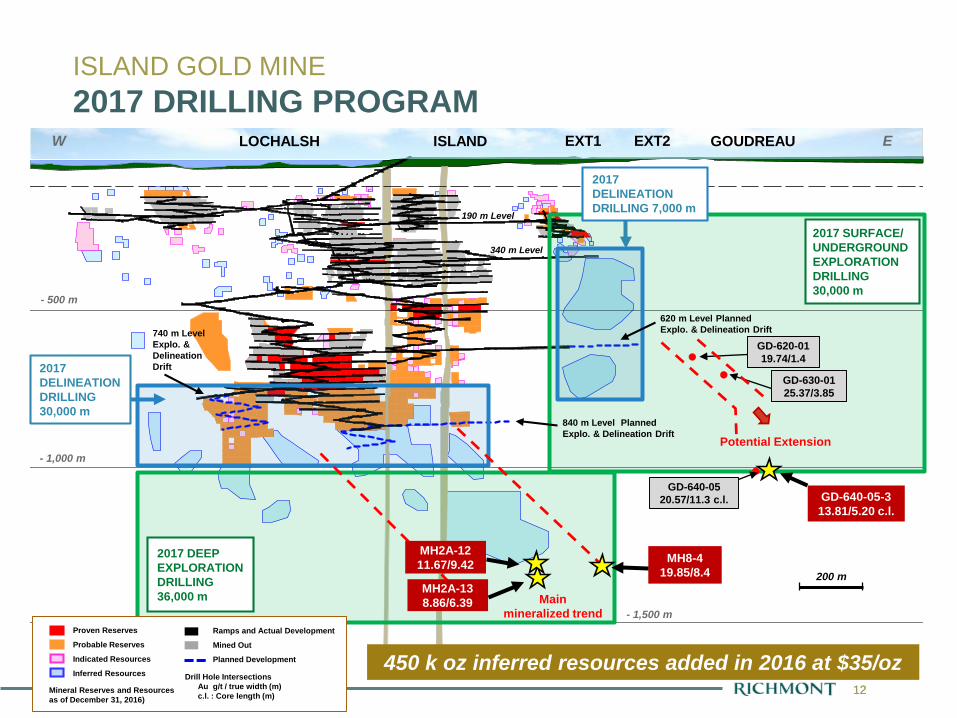
ISLAND GOLD MINE2017 DRILLING PROGRAM
620 m Level PlannedExplo. & Delineation Drift
840 m Level PlannedExplo. & Delineation Drift
GOUDREAULOCHALSH ISLAND EXT1 EXT2
- 500 m
- 1,500 m
W E
340 m Level
190 m Level
740 m LevelExplo. & DelineationDrift
- 1,000 m
200 m
Main mineralized trend
2017 DEEP EXPLORATION DRILLING 36,000 m
Proven Reserves
Probable Reserves
Indicated Resources
Inferred Resources
Mineral Reserves and Resources as of December 31, 2016)
2017 DELINEATION DRILLING 7,000 m
2017 SURFACE/ UNDERGROUNDEXPLORATION DRILLING 30,000 m
450 k oz inferred resources added in 2016 at $35/oz
GD-630-0125.37/3.85
GD-620-0119.74/1.4
Potential Extension
MH8-419.85/8.4
2017 DELINEATION DRILLING 30,000 m
Ramps and Actual Development
Mined Out
Planned Development
GD-640-0520.57/11.3 c.l.
MH2A-138.86/6.39
MH2A-1211.67/9.42
GD-640-05-313.81/5.20 c.l.
Drill Hole IntersectionsAu g/t / true width (m)c.l. : Core length (m)
13RIC: TSX NYSE
13
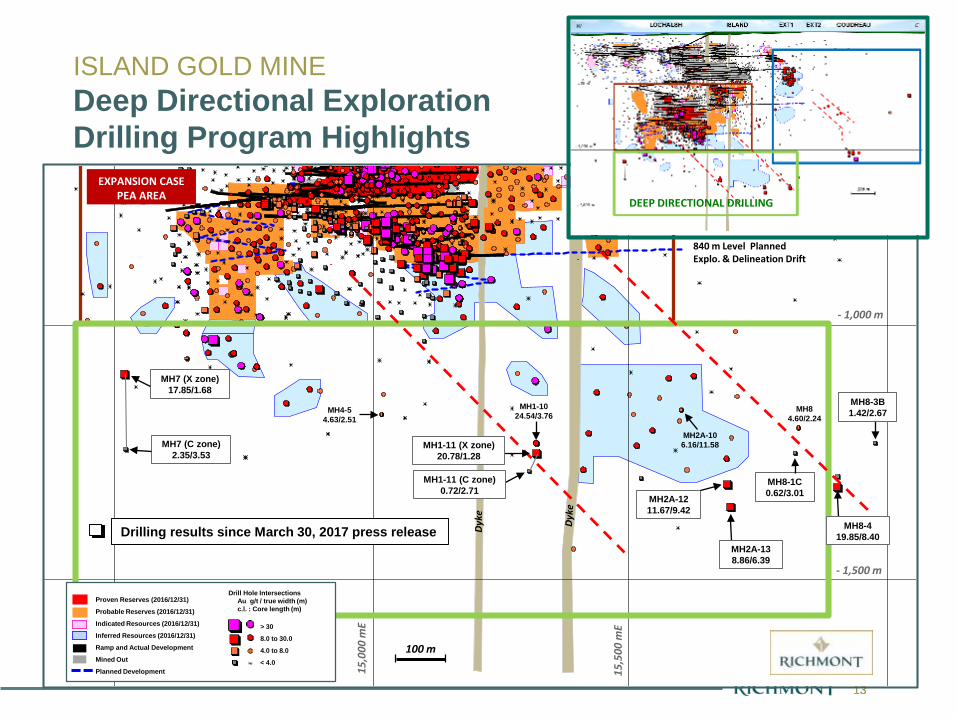
EXPANSION CASE PEA AREA
ISLAND GOLD MINEDeep Directional Exploration Drilling Program Highlights
15,5
00 m
E
15,0
00 m
E
Dyke
- 1,500 m
- 1,000 m
100 m
840 m Level PlannedExplo. & Delineation Drift
MH8-3B1.42/2.67
MH7 (C zone)2.35/3.53
MH8-419.85/8.40
MH8-1C0.62/3.01
Proven Reserves (2016/12/31)
Probable Reserves (2016/12/31)
Indicated Resources (2016/12/31)
Inferred Resources (2016/12/31)
Ramp and Actual Development
Mined Out
Planned Development
> 30
8.0 to 30.0
4.0 to 8.0
< 4.0
MH1-11 (C zone)0.72/2.71
MH2A-138.86/6.39
MH2A-1211.67/9.42
MH4-54.63/2.51
MH84.60/2.24
MH1-1024.54/3.76
MH2A-106.16/11.58
MH7 (X zone)17.85/1.68
MH1-11 (X zone)20.78/1.28
Drilling results since March 30, 2017 press release
Drill Hole IntersectionsAu g/t / true width (m)c.l. : Core length (m)
DEEP DIRECTIONAL DRILLING
14RIC: TSX NYSE
14
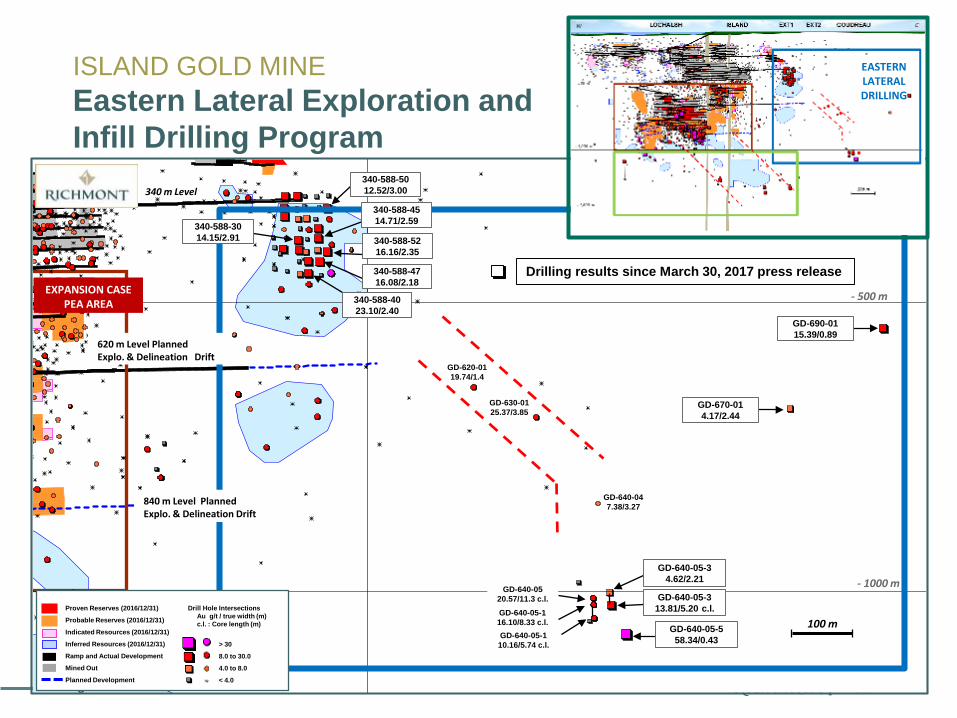
340 m Level
- 500 m
GD-640-047.38/3.27
EXPANSION CASE PEA AREA
620 m Level PlannedExplo. & Delineation Drift
840 m Level PlannedExplo. & Delineation Drift
- 1000 mGD-640-0520.57/11.3 c.l.
GD-640-05-110.16/5.74 c.l.
GD-620-0119.74/1.4
GD-630-0125.37/3.85
GD-640-05-116.10/8.33 c.l.
Proven Reserves (2016/12/31)
Probable Reserves (2016/12/31)
Indicated Resources (2016/12/31)
Inferred Resources (2016/12/31)
Ramp and Actual Development
Mined Out
Planned Development
100 m
> 30
8.0 to 30.0
4.0 to 8.0
< 4.0
ISLAND GOLD MINEEastern Lateral Exploration andInfill Drilling Program
Drilling results since March 30, 2017 press release
340-588-3014.15/2.91
340-588-40 23.10/2.40
GD-670-014.17/2.44
GD-690-0115.39/0.89
GD-640-05-34.62/2.21
GD-640-05-558.34/0.43
GD-640-05-313.81/5.20 c.l.
340-588-52 16.16/2.35
340-588-47 16.08/2.18
340-588-45 14.71/2.59
340-588-50 12.52/3.00
Drill Hole IntersectionsAu g/t / true width (m)c.l. : Core length (m)
EASTERN LATERALDRILLING
15RIC: TSX NYSE
1514,5
00 m
E
15,0
00 m
E
Dyke
- 1,000 m
100 m
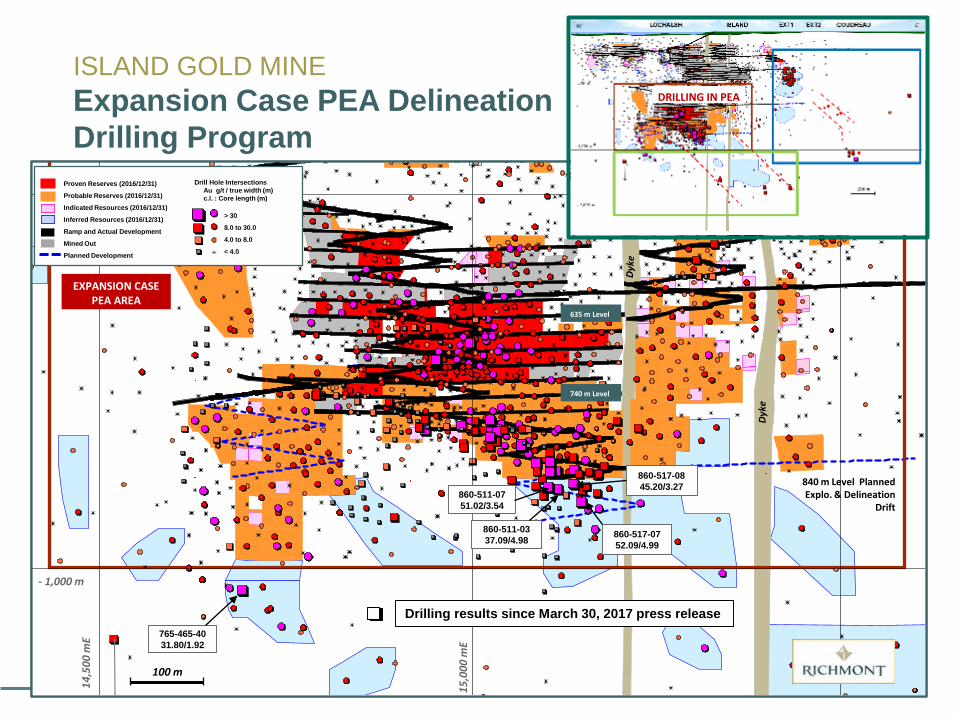
EXPANSION CASE PEA AREA
840 m Level PlannedExplo. & Delineation
Drift
860-517-0845.20/3.27
635 m Level
740 m Level
ISLAND GOLD MINEExpansion Case PEA DelineationDrilling Program
Proven Reserves (2016/12/31)
Probable Reserves (2016/12/31)
Indicated Resources (2016/12/31)
Inferred Resources (2016/12/31)
Ramp and Actual Development
Mined Out
Planned Development
> 30
8.0 to 30.0
4.0 to 8.0
< 4.0
860-511-0751.02/3.54
860-511-0337.09/4.98 860-517-07
52.09/4.99
765-465-4031.80/1.92
Drilling results since March 30, 2017 press release
Drill Hole IntersectionsAu g/t / true width (m)c.l. : Core length (m)
DRILLING IN PEA
16
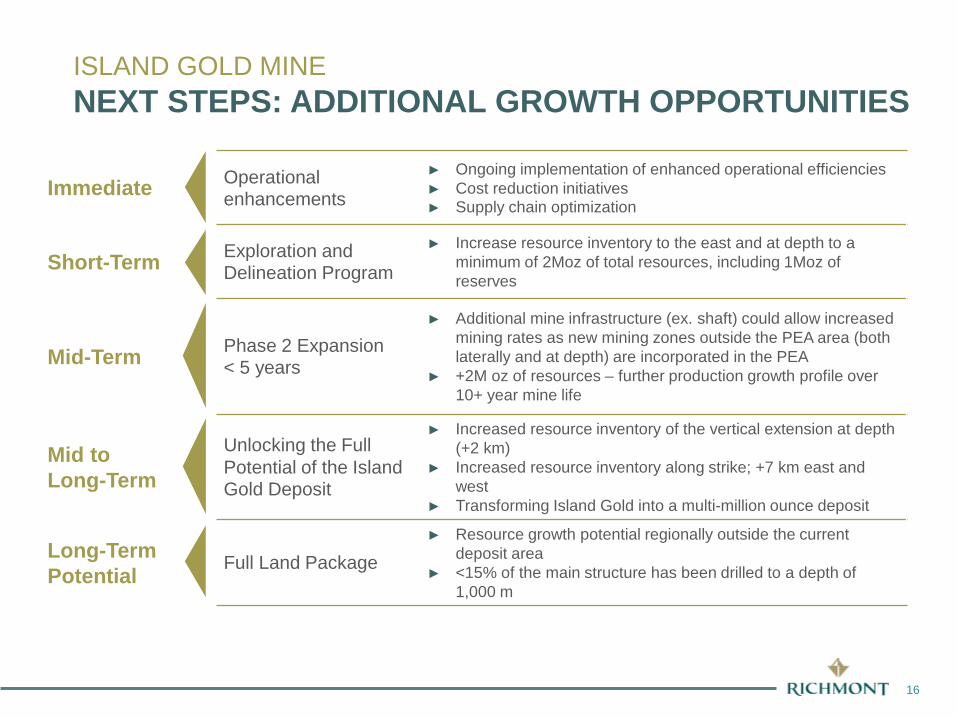
ISLAND GOLD MINENEXT STEPS: ADDITIONAL GROWTH OPPORTUNITIES
Immediate Operational enhancements
► Ongoing implementation of enhanced operational efficiencies► Cost reduction initiatives► Supply chain optimization
Short-Term Exploration andDelineation Program
► Increase resource inventory to the east and at depth to a minimum of 2Moz of total resources, including 1Moz of reserves
Mid-Term Phase 2 Expansion< 5 years
► Additional mine infrastructure (ex. shaft) could allow increased mining rates as new mining zones outside the PEA area (both laterally and at depth) are incorporated in the PEA
► +2M oz of resources – further production growth profile over 10+ year mine life
Mid to Long-Term
Unlocking the Full Potential of the Island Gold Deposit
► Increased resource inventory of the vertical extension at depth (+2 km)
► Increased resource inventory along strike; +7 km east and west
► Transforming Island Gold into a multi-million ounce deposit
Long-Term Potential Full Land Package
► Resource growth potential regionally outside the current deposit area
► <15% of the main structure has been drilled to a depth of 1,000 m
17
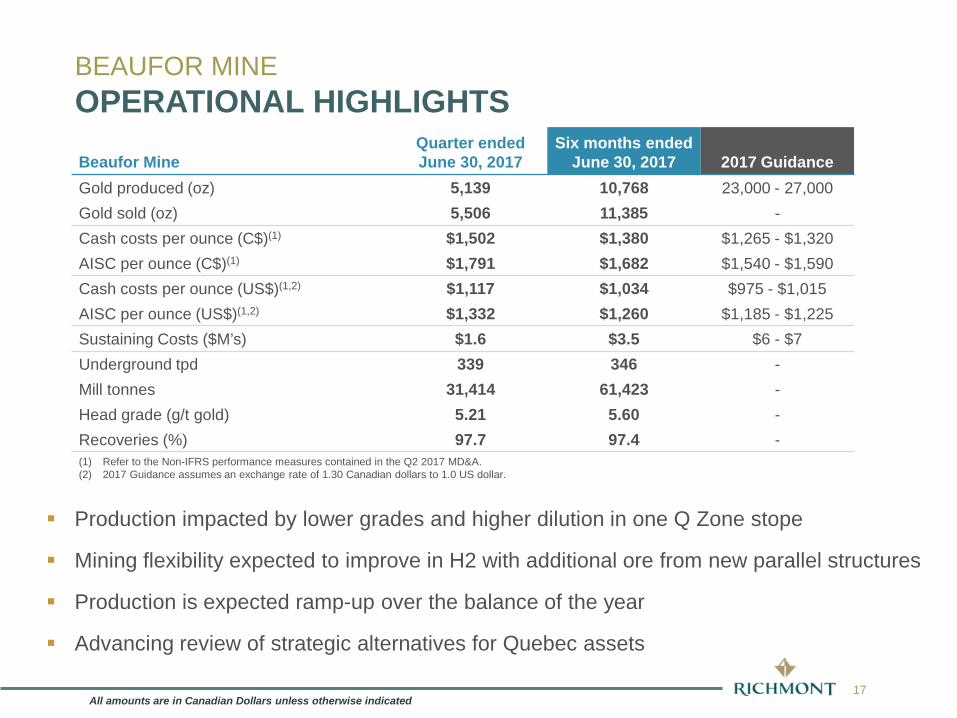
Beaufor MineQuarter ended June 30, 2017
Six months ended June 30, 2017 2017 Guidance
Gold produced (oz) 5,139 10,768 23,000 - 27,000Gold sold (oz) 5,506 11,385 -Cash costs per ounce (C$)(1) $1,502 $1,380 $1,265 - $1,320AISC per ounce (C$)(1) $1,791 $1,682 $1,540 - $1,590Cash costs per ounce (US$)(1,2) $1,117 $1,034 $975 - $1,015AISC per ounce (US$)(1,2) $1,332 $1,260 $1,185 - $1,225Sustaining Costs ($M’s) $1.6 $3.5 $6 - $7Underground tpd 339 346 -Mill tonnes 31,414 61,423 -Head grade (g/t gold) 5.21 5.60 -Recoveries (%) 97.7 97.4 -(1) Refer to the Non-IFRS performance measures contained in the Q2 2017 MD&A.(2) 2017 Guidance assumes an exchange rate of 1.30 Canadian dollars to 1.0 US dollar.
Production impacted by lower grades and higher dilution in one Q Zone stope
Mining flexibility expected to improve in H2 with additional ore from new parallel structures
Production is expected ramp-up over the balance of the year
Advancing review of strategic alternatives for Quebec assets
BEAUFOR MINEOPERATIONAL HIGHLIGHTS
All amounts are in Canadian Dollars unless otherwise indicated
18
Q&A
19
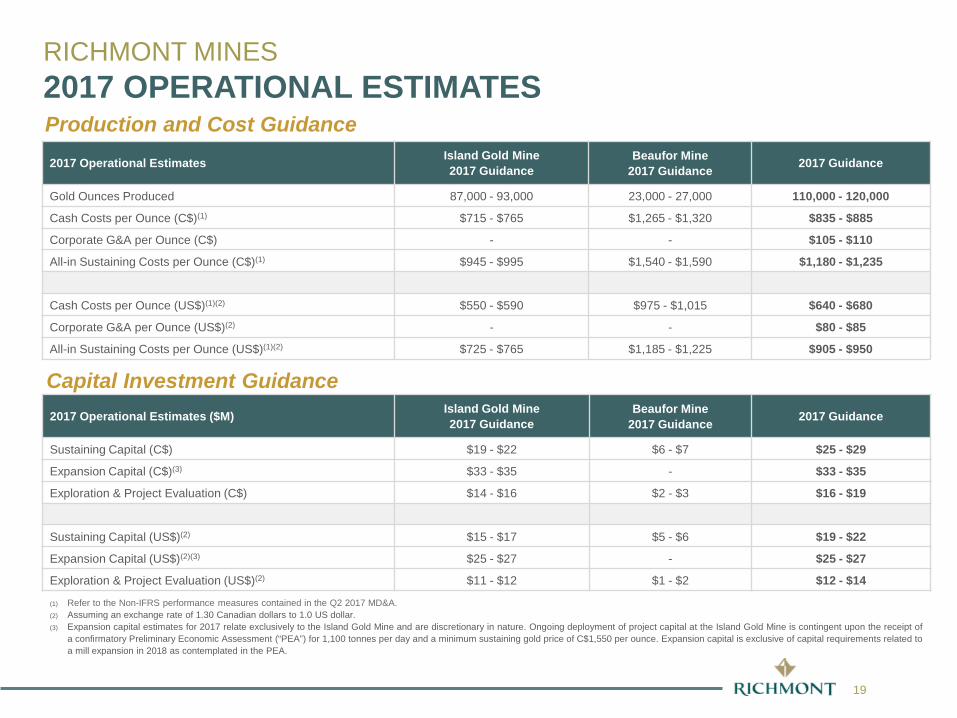
Production and Cost Guidance
Capital Investment Guidance
2017 Operational Estimates Island Gold Mine2017 Guidance
Beaufor Mine2017 Guidance 2017 Guidance
Gold Ounces Produced 87,000 - 93,000 23,000 - 27,000 110,000 - 120,000
Cash Costs per Ounce (C$)(1) $715 - $765 $1,265 - $1,320 $835 - $885
Corporate G&A per Ounce (C$) - - $105 - $110
All-in Sustaining Costs per Ounce (C$)(1) $945 - $995 $1,540 - $1,590 $1,180 - $1,235
Cash Costs per Ounce (US$)(1)(2) $550 - $590 $975 - $1,015 $640 - $680
Corporate G&A per Ounce (US$)(2) - - $80 - $85
All-in Sustaining Costs per Ounce (US$)(1)(2) $725 - $765 $1,185 - $1,225 $905 - $950
2017 Operational Estimates ($M) Island Gold Mine2017 Guidance
Beaufor Mine2017 Guidance 2017 Guidance
Sustaining Capital (C$) $19 - $22 $6 - $7 $25 - $29
Expansion Capital (C$)(3) $33 - $35 - $33 - $35
Exploration & Project Evaluation (C$) $14 - $16 $2 - $3 $16 - $19
Sustaining Capital (US$)(2) $15 - $17 $5 - $6 $19 - $22
Expansion Capital (US$)(2)(3) $25 - $27 - $25 - $27
Exploration & Project Evaluation (US$)(2) $11 - $12 $1 - $2 $12 - $14
(1) Refer to the Non-IFRS performance measures contained in the Q2 2017 MD&A.(2) Assuming an exchange rate of 1.30 Canadian dollars to 1.0 US dollar.(3) Expansion capital estimates for 2017 relate exclusively to the Island Gold Mine and are discretionary in nature. Ongoing deployment of project capital at the Island Gold Mine is contingent upon the receipt of
a confirmatory Preliminary Economic Assessment (“PEA”) for 1,100 tonnes per day and a minimum sustaining gold price of C$1,550 per ounce. Expansion capital is exclusive of capital requirements related toa mill expansion in 2018 as contemplated in the PEA.
RICHMONT MINES2017 OPERATIONAL ESTIMATES
20
0
100
200
300
400
500
600
700
800
2012 2013 2014 2015 2016
Min
eral
Res
erve
s (0
00’s
oun
ces)
Monique Beaufor Island Gold
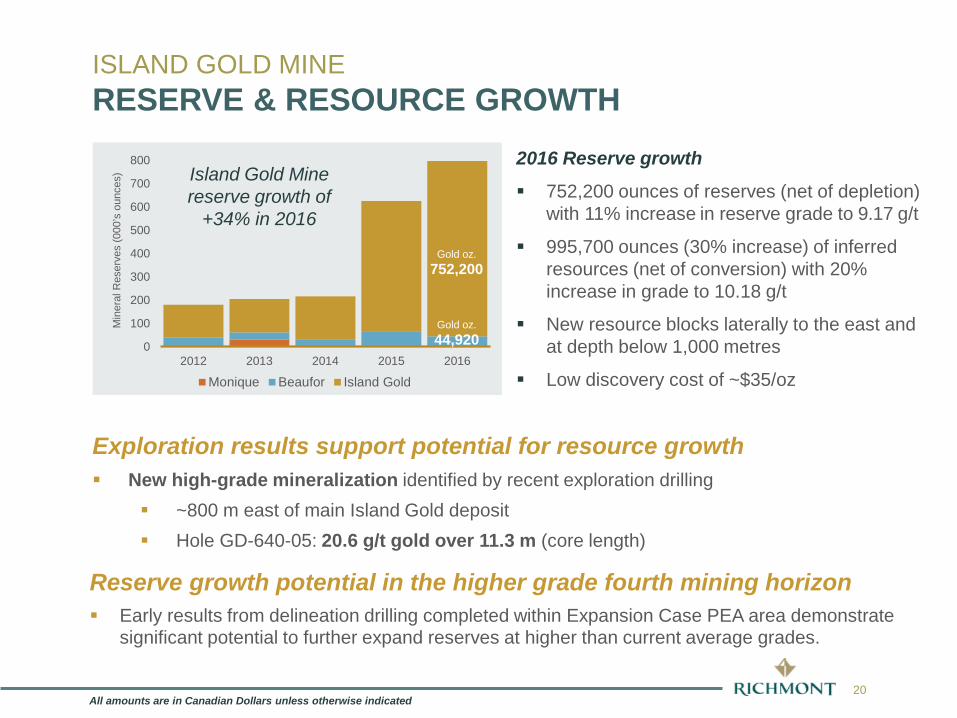
Gold oz.752,200
Island Gold Mine reserve growth of
+34% in 2016
Gold oz.44,920
2016 Reserve growth
752,200 ounces of reserves (net of depletion) with 11% increase in reserve grade to 9.17 g/t
995,700 ounces (30% increase) of inferred resources (net of conversion) with 20% increase in grade to 10.18 g/t
New resource blocks laterally to the east and at depth below 1,000 metres
Low discovery cost of ~$35/oz
ISLAND GOLD MINERESERVE & RESOURCE GROWTH
Exploration results support potential for resource growth New high-grade mineralization identified by recent exploration drilling
~800 m east of main Island Gold deposit Hole GD-640-05: 20.6 g/t gold over 11.3 m (core length)
Reserve growth potential in the higher grade fourth mining horizon Early results from delineation drilling completed within Expansion Case PEA area demonstrate
significant potential to further expand reserves at higher than current average grades.
All amounts are in Canadian Dollars unless otherwise indicated
21
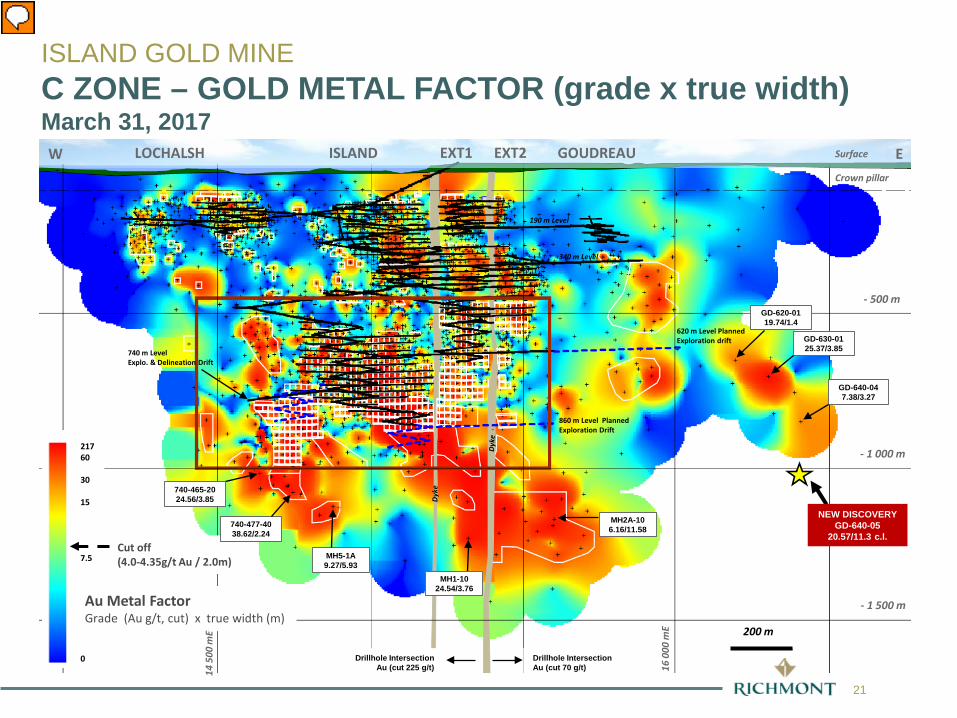
W EGOUDREAULOCHALSH ISLAND EXT1 EXT2
- 1 000 m
- 500 m
Crown pillar
- 1 500 m
16 0
00 m
E
620 m Level PlannedExploration drift
Surface
200 m
Cut off (4.0-4.35g/t Au / 2.0m)
21760
30
15
7.5
0
Au Metal FactorGrade (Au g/t, cut) x true width (m)
190 m Level
340 m Level
MH1-1024.54/3.76
MH2A-106.16/11.58
740-465-2024.56/3.85
GD-640-047.38/3.27
GD-620-0119.74/1.4
GD-630-0125.37/3.85
740-477-4038.62/2.24
MH5-1A9.27/5.93
NEW DISCOVERYGD-640-05
20.57/11.3 c.l.
Drillhole IntersectionAu (cut 225 g/t)
Drillhole IntersectionAu (cut 70 g/t)14
500
mE
860 m Level PlannedExploration Drift
Dyk
e
740 m LevelExplo. & Delineation Drift
ISLAND GOLD MINEC ZONE – GOLD METAL FACTOR (grade x true width)March 31, 2017
22RIC: TSX NYSE
22
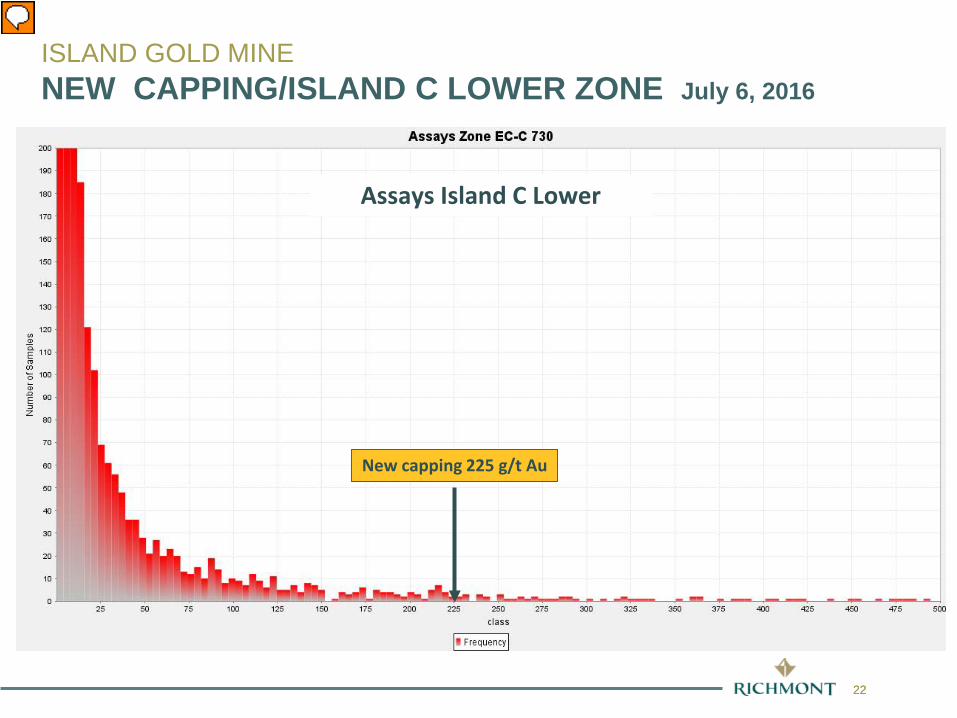
New capping 225 g/t Au
Assays Island C Lower
ISLAND GOLD MINENEW CAPPING/ISLAND C LOWER ZONE July 6, 2016
23RIC: TSX NYSE
23
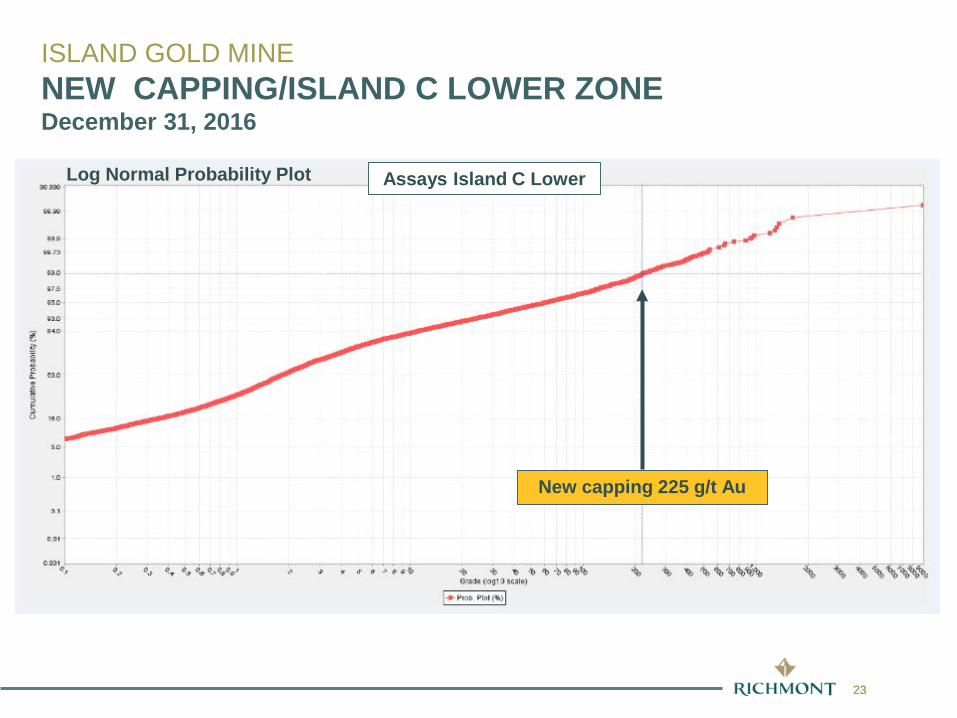
New capping 225 g/t Au
Assays Island C LowerLog Normal Probability Plot
ISLAND GOLD MINENEW CAPPING/ISLAND C LOWER ZONE December 31, 2016