Embed Size (px)
Citation preview
YEAR END 2016 CONFERENCE CALL
February 24, 2017
Cautionary Notes
SSRI:NASDAQ │SSO:TSX │ February 2017 2
Cautionary Note Regarding Forward-Looking Statements
This presentation contains forward-looking information within the meaning of Canadian securities laws and forward-looking statements within the meaning of the U.S. Private Securities Litigation Reform Act of 1995 (collectively, “forward-
looking statements”). All statements, other than statements of historical fact, are forward-looking statements. Generally, forward-looking statements can be identified by the use of words or phrases such as “expects,” “anticipates,” “plans,”
“projects,” “estimates,” “assumes,” “intends,” “strategy,” “goals,” “objectives,” “potential,” “believes,” or variations thereof, or stating that certain actions, events or results “may,” “could,” “would,” “might” or “will” be taken, occur or be
achieved, or the negative of any of these terms or similar expressions. These forward‐looking statements or information relate to, among other things: future production of gold, silver and other metals; future costs of inventory, and cash
costs per payable ounce of precious metals sold; expected exploration and development expenditures; the prices of precious metals; the timing of cessation of stockpile processing at the Pirquitas mine; the effects of laws, regulations
and government policies affecting our operations or potential future operations; future successful development of our projects; the expected timing to make a decision about whether to move forward with the Chinchillas project; the
sufficiency of our current working capital, anticipated operating cash flow or our ability to raise necessary funds; estimated production rates for gold, silver and other metals; timing of production and the cash costs and total costs of
production at the Marigold mine, the Seabee Gold Operation and the Pirquitas mine; the estimated cost of sustaining capital; ongoing or future development plans and capital replacement, improvement or remediation programs; the
estimates of expected or anticipated economic returns from our mining projects, including future sales of metals, concentrate or other products; our ability to expand Mineral Resources and convert Mineral Resources into Mineral
Reserves; and our plans and expectations for our properties and operations.
These forward-looking statements are subject to a variety of known and unknown risks, uncertainties and other factors that could cause actual events or results to differ from those expressed or implied, including, without limitation, the
following: uncertainty of production, development plans and cost estimates for the Marigold mine, the Seabee Gold Operation, the Pirquitas mine and our projects; our ability to replace Mineral Reserves; subject to exercising our election
to proceed, our ability to complete and successfully integrate Golden Arrow Resources Corporation’s (“Golden Arrow”) Chinchillas project, on a joint venture basis, into our current operations; commodity price fluctuations; political or
economic instability and unexpected regulatory changes; currency fluctuations; the possibility of future losses; general economic conditions; fully realizing the value of our shareholdings in Pretium Resources Inc. and our other
marketable securities, due to changes in price, liquidity or disposal cost of such marketable securities; potential export duty and related interest on past production and sales of silver concentrate from the Pirquitas mine; counterparty and
market risks related to the sale of our concentrate and metals; uncertainty in the accuracy of Mineral Reserves and Mineral Resources estimates and in our ability to extract mineralization profitably; differences in U.S. and Canadian
practices for reporting Mineral Reserves and Mineral Resources; lack of suitable infrastructure or damage to existing infrastructure; future development risks, including start-up delays and cost overruns; our ability to obtain adequate
financing for further exploration and development programs and opportunities; uncertainty in acquiring additional commercially mineable mineral rights; delays in obtaining or failure to obtain governmental permits, or non-compliance with
our permits; our ability to attract and retain qualified personnel and management; potential labour unrest, including labour actions by our unionized employees at the Pirquitas mine; the impact of governmental regulations, including
health, safety and environmental regulations, including increased costs and restrictions on operations due to compliance with such regulations; reclamation and closure requirements for our mineral properties; failure to effectively manage
our tailings facilities; social and economic changes following closure of a mine, including the expected closure of the Pirquitas mine in 2017, may lead to adverse impacts and unrest; unpredictable risks and hazards related to the
development and operation of a mine or mineral property that are beyond our control; indigenous peoples’ title claims and rights to consultation and accommodation may affect our existing operations as well as development projects and
future acquisitions; assessments by taxation authorities in multiple jurisdictions; recoverability of value added tax and changes to the collection process in Argentina; claims and legal proceedings, including adverse rulings in litigation
against us and/or our directors or officers; compliance with anti-corruption laws and internal controls, and increased regulatory compliance costs; complying with emerging climate change regulations and the impact of climate change,
including extreme weather conditions; recoverability of deferred consideration to be received in connection with recent divestitures; uncertainties related to title to our mineral properties and the ability to obtain surface rights; the
sufficiency of our insurance coverage; civil disobedience in the countries where our mineral properties are located; operational safety and security risks; actions required to be taken under human rights law; competition in the mining
industry for mineral properties; shortage or poor quality of equipment or supplies; an event of default under our convertible notes may significantly reduce our liquidity and adversely affect our business; failure to meet covenants under our
senior secured revolving credit facility; conflicts of interest that could arise from certain of our directors’ involvement with other natural resource companies; information systems security threats; and those other various risks and
uncertainties identified under the heading “Risk Factors” in our most recent Annual Information Form filed with the Canadian securities regulatory authorities and Annual Report on Form 40-F filed with the U.S. Securities and Exchange
Commission (“SEC”).
The foregoing list is not exhaustive of all factors and assumptions which may have been used. We cannot assure you that actual events, performance or results will be consistent with these forward-looking statements, and management’s
assumptions may prove to be incorrect. Our forward-looking statements reflect current expectations regarding future events and operating performance and speak only as of the date hereof and we do not assume any obligation to update
forward-looking statements if circumstances or management’s beliefs, expectations or opinions should change other than as required by applicable law. For the reasons set forth above, you should not place undue reliance on forward-
looking statements. All references to “$” in this presentation are to U.S. dollars unless otherwise stated.
Qualified Persons: Except as otherwise set out herein, the scientific and technical information contained in this presentation relating to the Marigold mine has been reviewed and approved by Thomas Rice and James N. Carver, each of
whom is a SME Registered Member, a Qualified Person under National Instrument 43-101 — Standards of Disclosure for Mineral Projects (“NI 43-101”) and our employee. The scientific and technical data relating to the Seabee Gold
Operation has been reviewed and approved by F. Carl Edmunds, P. Geo., a Qualified Person under NI 43-101 and our employee. The scientific and technical information relating to the Pirquitas mine has been reviewed and approved by
Bruce Butcher, P.Eng., and F. Carl Edmunds, P. Geo., each of whom is a Qualified Person under NI 43-101 and our employee.
Cautionary Note to U.S. Investors
This presentation includes Mineral Reserves and Mineral Resources classification terms that comply with reporting standards in Canada and the Mineral Reserves and the Mineral Resources estimates are made in accordance with NI
43-101. NI 43-101 is a rule developed by the Canadian Securities Administrators that establishes standards for all public disclosure an issuer makes of scientific and technical information concerning mineral projects. These standards
differ significantly from the requirements of the SEC set out in SEC Industry Guide 7. Consequently, Mineral Reserves and Mineral Resources information included in this presentation is not comparable to similar information that would
generally be disclosed by domestic U.S. reporting companies subject to the reporting and disclosure requirements of the SEC. Under SEC standards, mineralization may not be classified as a “reserve” unless the determination has been
made that the mineralization could be economically produced or extracted at the time the reserve determination is made. In addition, the SEC’s disclosure standards normally do not permit the inclusion of information concerning
“Measured Mineral Resources,” “Indicated Mineral Resources” or “Inferred Mineral Resources” or other descriptions of the amount of mineralization in mineral deposits that do not constitute “reserves” by U.S. standards in documents
filed with the SEC.
Cautionary Note Regarding Non-GAAP Measures
This presentation includes certain terms or performance measures commonly used in the mining industry that are not defined under International Financial Reporting Standards (“IFRS”), including cash costs per payable ounce of
precious metals sold, realized metal prices and adjusted net income (loss) and adjusted basic earnings (loss) per share. Non-GAAP financial measures do not have any standardized meaning prescribed under IFRS and, therefore, may
not be comparable to similar measures reported by other companies. We believe that, in addition to conventional measures prepared in accordance with IFRS, certain investors use this information to evaluate our performance. The data
presented is intended to provide additional information and should not be considered in isolation or as a substitute for measures of performance prepared in accordance with IFRS. These non-GAAP measures should be read in
conjunction with our consolidated financial statements. Readers should refer to our management’s discussion and analysis, available under our corporate profile at www.sedar.com or on our website at www.silverstandard.com, under the
heading “Non-GAAP and Additional GAAP Financial Measures” for a more detailed discussion of how we calculate such measures and for a reconciliation of such measures to IFRS terms.
3
Delivered Scale and Margin
Acquired Seabee Gold Operation May 2016
Record annual production of 393,325 oz AuEq
Lower annual cash costs of $653/oz AuEq
Strong financial performance generated $115 million in cash
Exploration extended Reserve life at Marigold and Seabee
Added value through project portfolio optimization
SSRI:NASDAQ │SSO:TSX
Notes: Cash costs is a non-GAAP financial measure. Please see "Cautionary Note Regarding Non-GAAP Measures” in this presentation.
4SSRI:NASDAQ │SSO:TSX
Marigold Mine: 2016 Results
Notes: Cash costs is a non-GAAP financial measure. Please see "Cautionary Note Regarding Non-GAAP Measures” in this presentation.
Produced 205,116 oz of gold at cash costs of $647/oz gold
Strong Q4 with 59,945 oz gold production at cash costs of $585/oz gold
Moved 75.1M tonnes, an annual record
Marigold 5-year outlook increased gold production at lower costs
5SSRI:NASDAQ │SSO:TSX
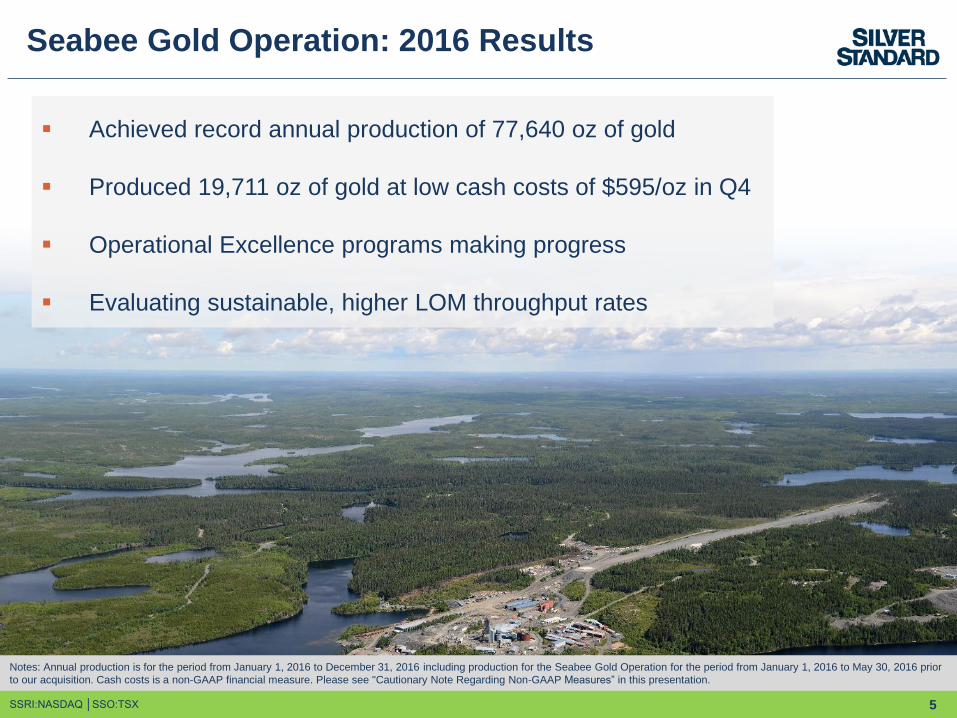
Seabee Gold Operation: 2016 Results
Achieved record annual production of 77,640 oz of gold
Produced 19,711 oz of gold at low cash costs of $595/oz in Q4
Operational Excellence programs making progress
Evaluating sustainable, higher LOM throughput rates
Notes: Annual production is for the period from January 1, 2016 to December 31, 2016 including production for the Seabee Gold Operation for the period from January 1, 2016 to May 30, 2016 prior
to our acquisition. Cash costs is a non-GAAP financial measure. Please see "Cautionary Note Regarding Non-GAAP Measures” in this presentation.
6
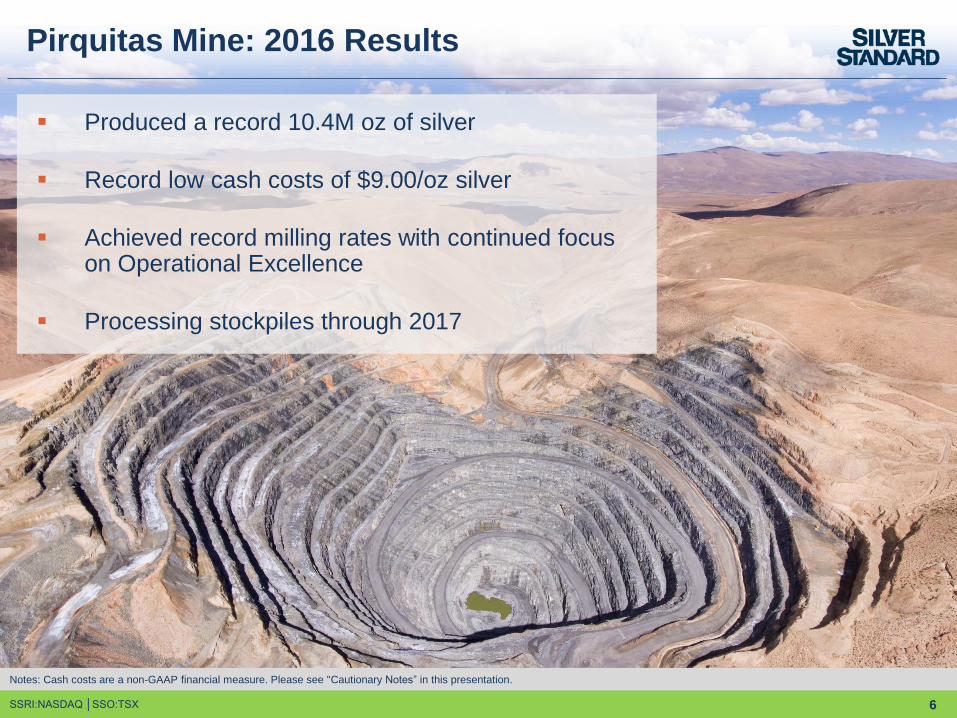
Produced a record 10.4M oz of silver
Record low cash costs of $9.00/oz silver
Achieved record milling rates with continued focus on Operational Excellence
Processing stockpiles through 2017
SSRI:NASDAQ │SSO:TSX
Pirquitas Mine: 2016 Results
Notes: Cash costs are a non-GAAP financial measure. Please see "Cautionary Notes” in this presentation.
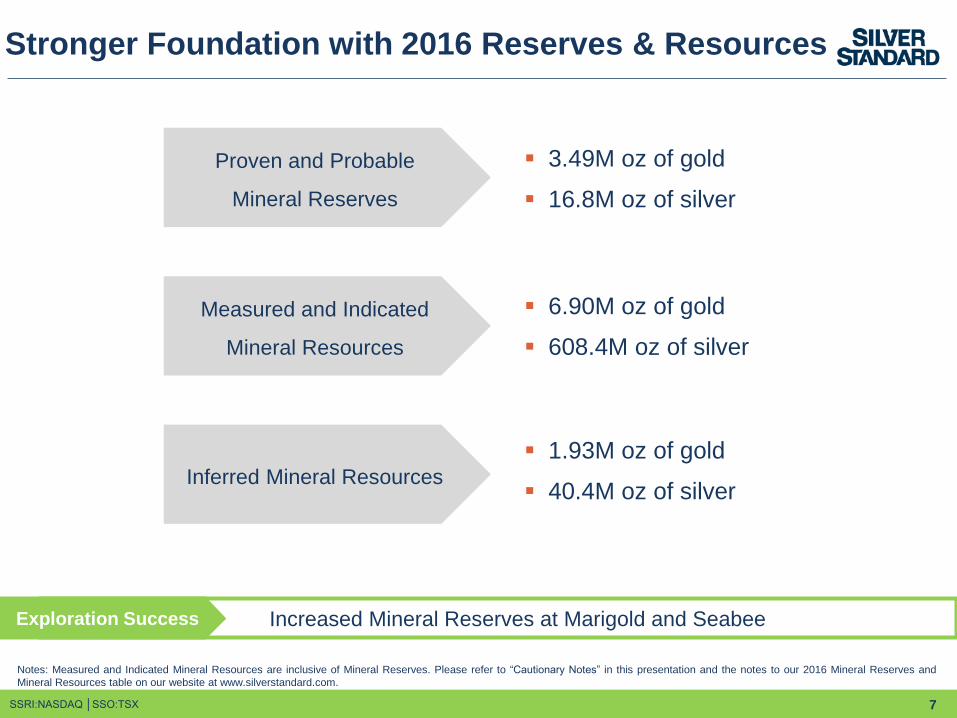
Stronger Foundation with 2016 Reserves & Resources
SSRI:NASDAQ │SSO:TSX 7
Notes: Measured and Indicated Mineral Resources are inclusive of Mineral Reserves. Please refer to “Cautionary Notes” in this presentation and the notes to our 2016 Mineral Reserves and
Mineral Resources table on our website at www.silverstandard.com.
Measured and Indicated
Mineral Resources
Inferred Mineral Resources
Proven and Probable
Mineral Reserves
Increased Mineral Reserves at Marigold and SeabeeExploration Success
3.49M oz of gold
16.8M oz of silver
6.90M oz of gold
608.4M oz of silver
1.93M oz of gold
40.4M oz of silver
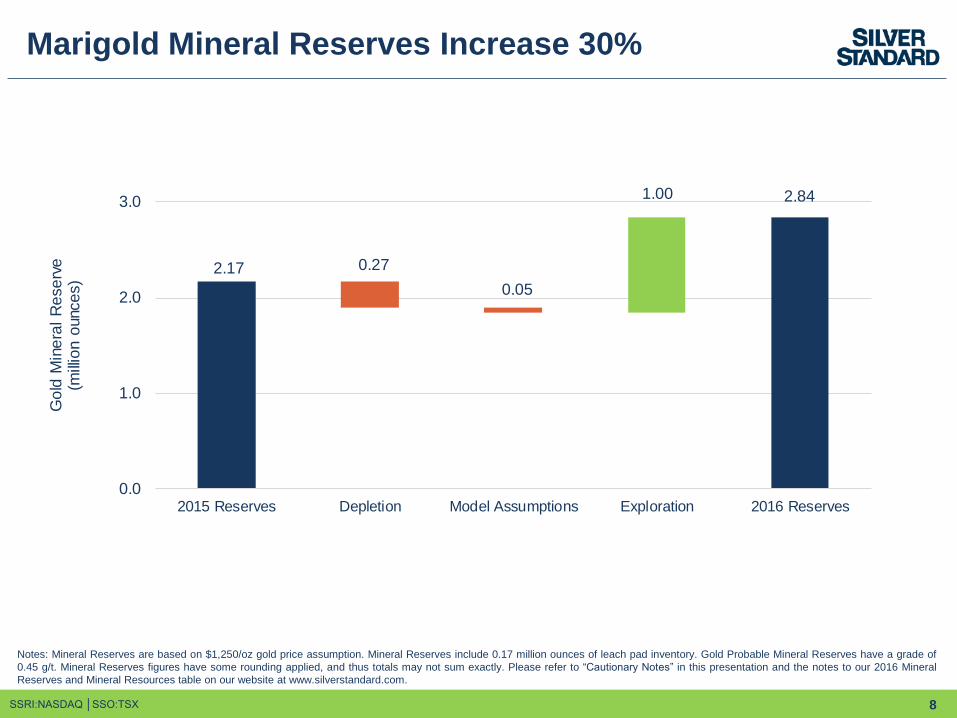
Marigold Mineral Reserves Increase 30%
SSRI:NASDAQ │SSO:TSX 8
Notes: Mineral Reserves are based on $1,250/oz gold price assumption. Mineral Reserves include 0.17 million ounces of leach pad inventory. Gold Probable Mineral Reserves have a grade of
0.45 g/t. Mineral Reserves figures have some rounding applied, and thus totals may not sum exactly. Please refer to “Cautionary Notes” in this presentation and the notes to our 2016 Mineral
Reserves and Mineral Resources table on our website at www.silverstandard.com.
2.17
2.84
0.27
0.05
1.00
0.0
1.0
2.0
3.0
2015 Reserves Depletion Model Assumptions Exploration 2016 Reserves
Go
ld M
ine
ral
Re
se
rve
(m
illio
n o
unce
s)
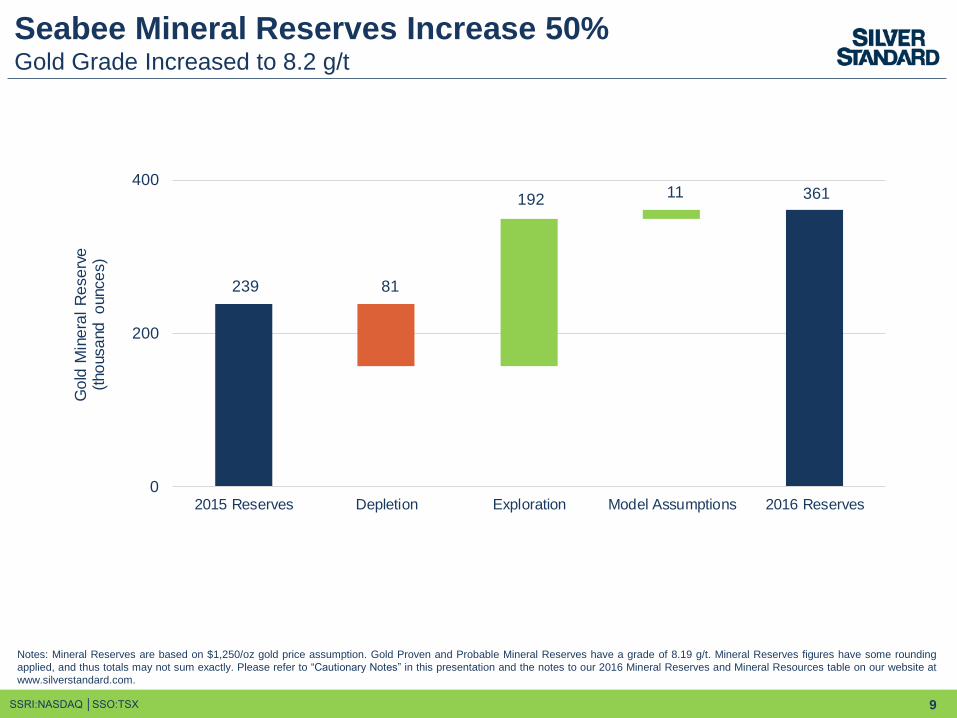
Seabee Mineral Reserves Increase 50%Gold Grade Increased to 8.2 g/t
SSRI:NASDAQ │SSO:TSX 9
Notes: Mineral Reserves are based on $1,250/oz gold price assumption. Gold Proven and Probable Mineral Reserves have a grade of 8.19 g/t. Mineral Reserves figures have some rounding
applied, and thus totals may not sum exactly. Please refer to “Cautionary Notes” in this presentation and the notes to our 2016 Mineral Reserves and Mineral Resources table on our website at
www.silverstandard.com.
239
361
81
192 11
0
200
400
2015 Reserves Depletion Exploration Model Assumptions 2016 Reserves
Go
ld M
ine
ral
Re
se
rve
(tho
usa
nd
o
unce
s)
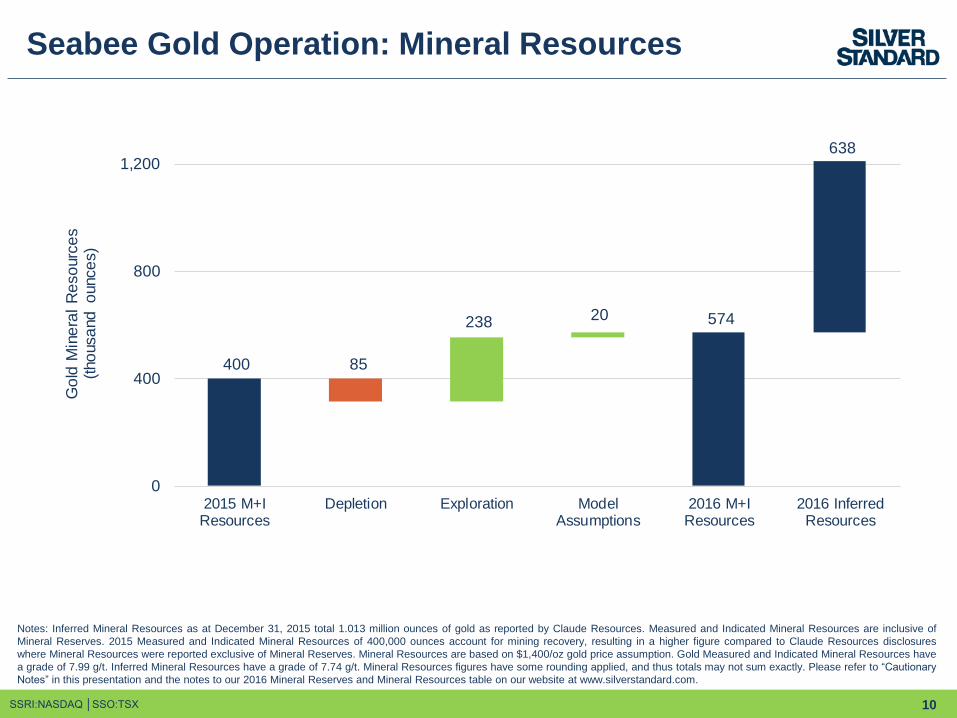
Seabee Gold Operation: Mineral Resources
SSRI:NASDAQ │SSO:TSX 10
Notes: Inferred Mineral Resources as at December 31, 2015 total 1.013 million ounces of gold as reported by Claude Resources. Measured and Indicated Mineral Resources are inclusive of
Mineral Reserves. 2015 Measured and Indicated Mineral Resources of 400,000 ounces account for mining recovery, resulting in a higher figure compared to Claude Resources disclosures
where Mineral Resources were reported exclusive of Mineral Reserves. Mineral Resources are based on $1,400/oz gold price assumption. Gold Measured and Indicated Mineral Resources have
a grade of 7.99 g/t. Inferred Mineral Resources have a grade of 7.74 g/t. Mineral Resources figures have some rounding applied, and thus totals may not sum exactly. Please refer to “Cautionary
Notes” in this presentation and the notes to our 2016 Mineral Reserves and Mineral Resources table on our website at www.silverstandard.com.
400
574
85
238 20
638
0
400
800
1,200
2015 M+IResources
Depletion Exploration ModelAssumptions
2016 M+IResources
2016 InferredResources
Go
ld M
ine
ral
Re
so
urc
es
(t
ho
usa
nd
o
unce
s)

11
Exploration Success in 2016 Extends Reserve Life
SSRI:NASDAQ │SSO:TSX
Increased gold Mineral Reserves at Marigold to 2.84M oz
Added 1M oz of gold primarily from Mackay North and Valmy
Completed Assay Program
Increased gold Mineral Reserves as Seabee to 360,000 oz
Increased reserve grade to 8.2 g/t
Targeting Mineral Resource Growth at Marigold and Seabee in 2017
Notes: Please refer to “Cautionary Notes” in this presentation and the notes to our 2016 Mineral Reserves and Mineral Resources table on our website at www.silverstandard.com.
12
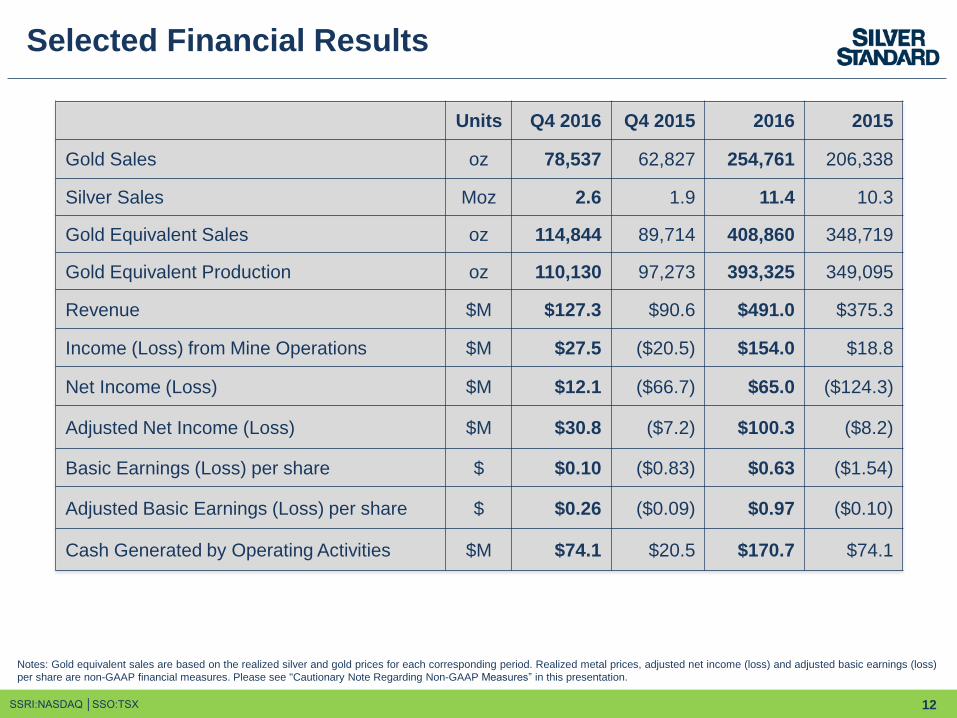
Selected Financial Results
SSRI:NASDAQ │SSO:TSX
Units Q4 2016 Q4 2015 2016 2015
Gold Sales oz 78,537 62,827 254,761 206,338
Silver Sales Moz 2.6 1.9 11.4 10.3
Gold Equivalent Sales oz 114,844 89,714 408,860 348,719
Gold Equivalent Production oz 110,130 97,273 393,325 349,095
Revenue $M $127.3 $90.6 $491.0 $375.3
Income (Loss) from Mine Operations $M $27.5 ($20.5) $154.0 $18.8
Net Income (Loss) $M $12.1 ($66.7) $65.0 ($124.3)
Adjusted Net Income (Loss) $M $30.8 ($7.2) $100.3 ($8.2)
Basic Earnings (Loss) per share $ $0.10 ($0.83) $0.63 ($1.54)
Adjusted Basic Earnings (Loss) per share $ $0.26 ($0.09) $0.97 ($0.10)
Cash Generated by Operating Activities $M $74.1 $20.5 $170.7 $74.1
Notes: Gold equivalent sales are based on the realized silver and gold prices for each corresponding period. Realized metal prices, adjusted net income (loss) and adjusted basic earnings (loss)
per share are non-GAAP financial measures. Please see "Cautionary Note Regarding Non-GAAP Measures” in this presentation.
13
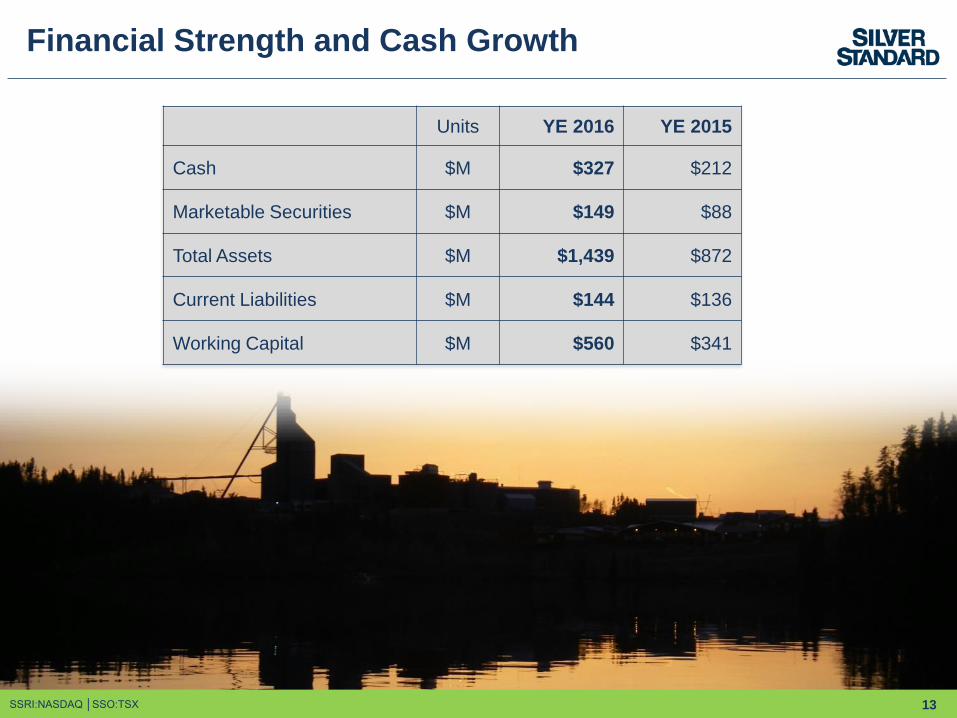
Financial Strength and Cash Growth
SSRI:NASDAQ │SSO:TSX
Units YE 2016 YE 2015
Cash $M $327 $212
Marketable Securities $M $149 $88
Total Assets $M $1,439 $872
Current Liabilities $M $144 $136
Working Capital $M $560 $341
14
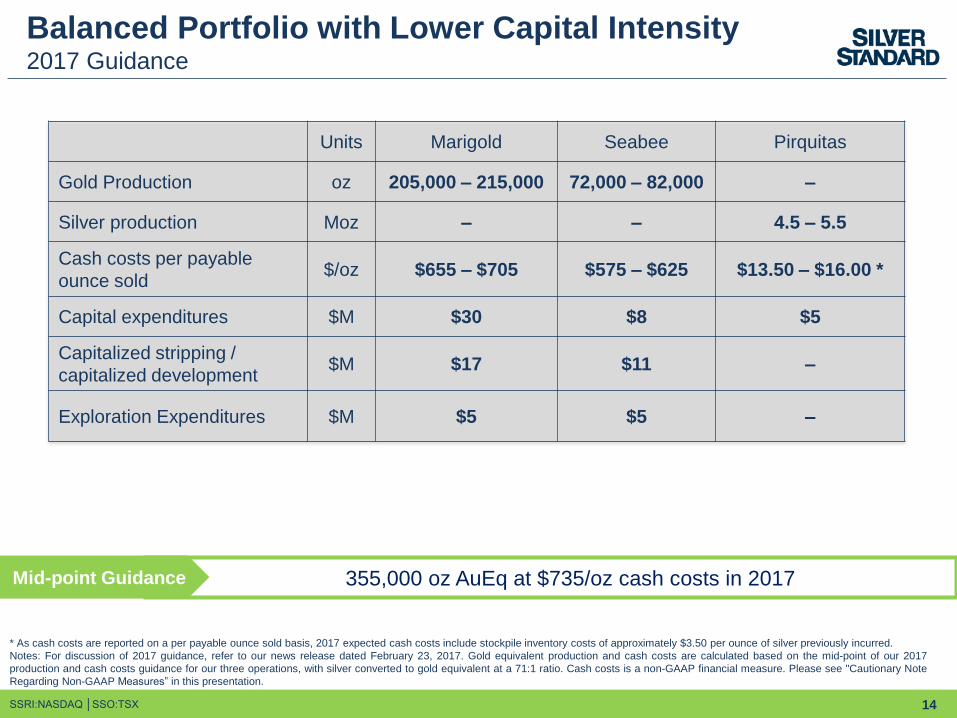
Balanced Portfolio with Lower Capital Intensity2017 Guidance
SSRI:NASDAQ │SSO:TSX
Units Marigold Seabee Pirquitas
Gold Production oz 205,000 – 215,000 72,000 – 82,000 –
Silver production Moz – – 4.5 – 5.5
Cash costs per payable
ounce sold $/oz $655 – $705 $575 – $625 $13.50 – $16.00 *
Capital expenditures $M $30 $8 $5
Capitalized stripping /
capitalized development$M $17 $11 –
Exploration Expenditures $M $5 $5 –
355,000 oz AuEq at $735/oz cash costs in 2017Mid-point Guidance
* As cash costs are reported on a per payable ounce sold basis, 2017 expected cash costs include stockpile inventory costs of approximately $3.50 per ounce of silver previously incurred.
Notes: For discussion of 2017 guidance, refer to our news release dated February 23, 2017. Gold equivalent production and cash costs are calculated based on the mid-point of our 2017
production and cash costs guidance for our three operations, with silver converted to gold equivalent at a 71:1 ratio. Cash costs is a non-GAAP financial measure. Please see "Cautionary Note
Regarding Non-GAAP Measures” in this presentation.
15SSRI:NASDAQ │SSO:TSX
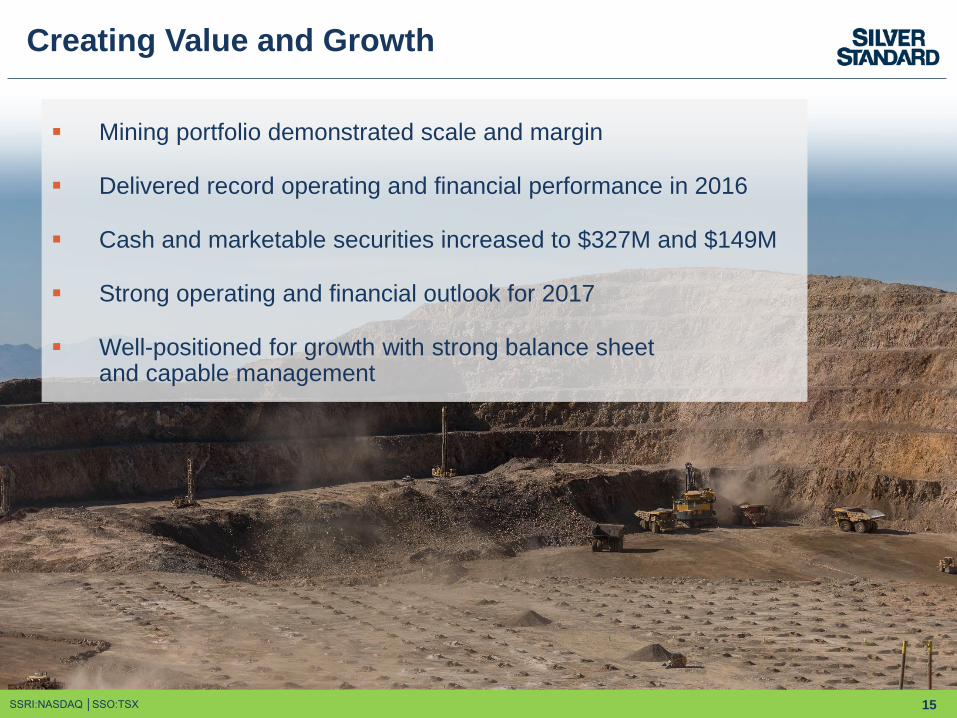
Creating Value and Growth
Mining portfolio demonstrated scale and margin
Delivered record operating and financial performance in 2016
Cash and marketable securities increased to $327M and $149M
Strong operating and financial outlook for 2017
Well-positioned for growth with strong balance sheet and capable management
Silver Standard Resources Inc.
Website: www.silverstandard.com
Email: [email protected]
Toll-free: 1.888.338.0046
Telephone: 1.604.689.3846


![Tammi-maaliskuu-2017-tulosesitys.pptx [Vain luku]...2014 Q4 2014 Q1 2015 Q2 2015 Q3 2015 Q4 2015 Q1 2016 Q2 2016 Q3 2016 Q4 2016 Q1 2017 Taivekartonki Valkoinen ensikuitulaineri 1](https://img.pdfslide.tips/doc/110x75/5f03547b7e708231d408ade8/tammi-maaliskuu-2017-vain-luku-2014-q4-2014-q1-2015-q2-2015-q3-2015-q4-2015.jpg)


![Investor Presentation Q4 FY 2016 [Company Update]](https://img.pdfslide.tips/doc/110x75/577c7fb51a28abe054a5bb0b/investor-presentation-q4-fy-2016-company-update.jpg)