Embed Size (px)
Citation preview

What caused the geophysical anomalies around the Dunedin
Volcanic Centre?
Michael Clark13 April 2014
Location
Dunedin Volcanic Center
[1]

Problem: What causes these anomalies?
Anomalies:1. Uplift
2. Heat flow and volcanics
3. Gravity anomaly

Problem: What causes these anomalies?
1. Uplift of limestone (19 Ma) around Dunedin

Problem: What causes these anomalies?
2. High Heat flow and volcanics
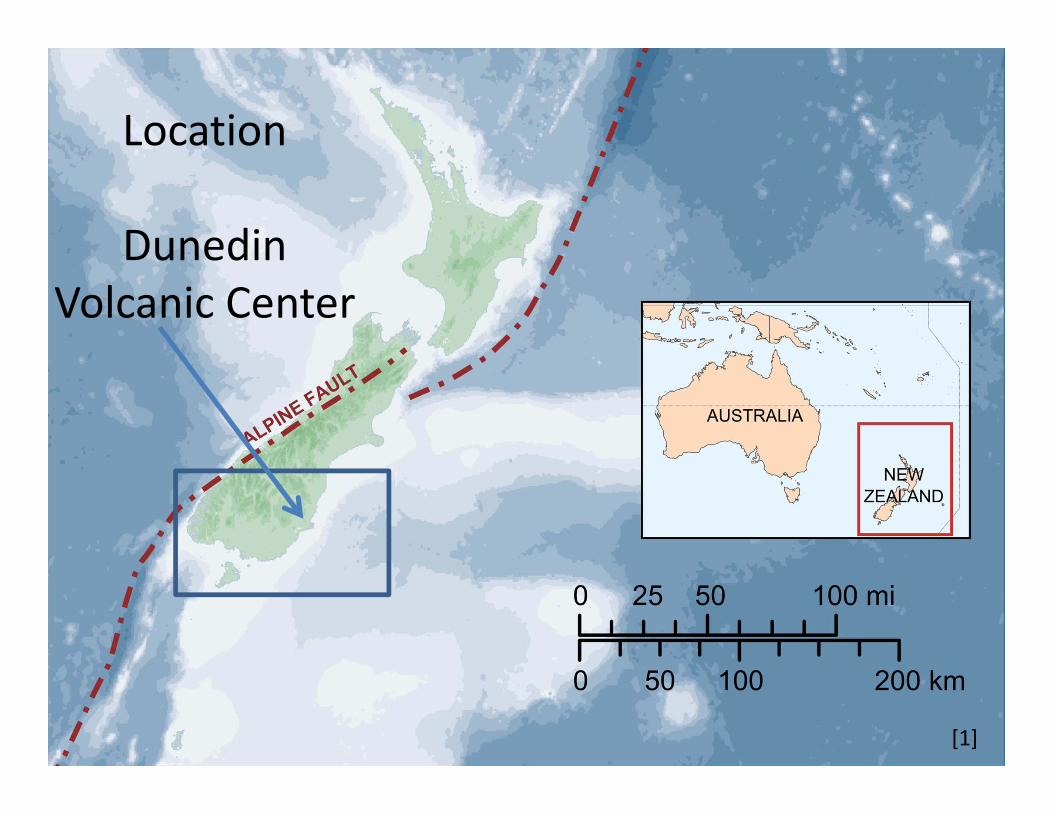
Problem: What causes these anomalies?
3. Positive Gravity anomaly

Problem: What causes these anomalies?
Anomalies:1. Uplift
2. Heat flow and volcanics
3. Gravity anomaly [3]
[2]

Hypothesis: Asthenospheric upwelling?
• Could the caused be an upwelling of the asthenosphere?

Hypothesis: Asthenospheric upwelling?
• Could the caused be an upwelling of the asthenosphere?
• We can test this using a elastic‐plate flexure model
• Does the observed uplift match this flexure?

Test
• Does the uplift we observe match the modeled uplift?

Does the observed uplift match this flexure?
• A weakened plate is bent by
• A load of 75 km of buoyant asthenosphere

Does the observed uplift match this flexure?
• A weakened plate is bent by
• A load of 75 km of buoyant asthenosphere
Result: A good match

Summary• Uplift can be explained
using an Asthenospheric upwelling under a weak lithosphere.
• This also explains the elevated heat flow around Dunedin and possibly other anomalies
• In this scenario there has been a high heat flow for 20 Ma, so we can expect an enhanced source rock maturity.

References1. Karnstedt A 2008. Map of the Zealandia (continent).
Website: http://en.wikipedia.org/wiki/File:Zealandia‐Continent_map_en.svg (accessed: 14 April 2014)
2. Hoke L, Poreda R, Reay A, Weaver S 2000. The subcontinental mantle beneath southern New Zealand, characterised by helium isotopes in intraplate basalts and gas‐rich springs. Geochimica et Cosmochimica Acta 64(14): 2489‐2507.
3. Bourguignon S 2009. Lithospheric deformation at the South Island oblique collision, New Zealand. Unpublished thesis, Victoria University of Wellington.

How heat flow is affected by hot emplacements at different times and depthsFigure 4.11: How heat flow is affected by hot emplacements at different times and depths. Peak heat flow is shown by the blue line. If the heat source was emplaced at 16 Ma – the date of earliest Dunedin volcanism –and the depth is between 13 and 25 km, the model predicts an extra 16‐35 mW/m2 of heatflow. This result is comparable to the elevated surface heat flow around Dunedin of 25 mW/m2 (Funnell et al. 1996).

Figure 4.5: The modelled deflection.
Model nodes are shown as filled squares, labelled lines show transects, and the circles show places or wells. The deflection is measured in metres below sea sea‐level and was shifted to an estimated deposition depth of 1100 m.

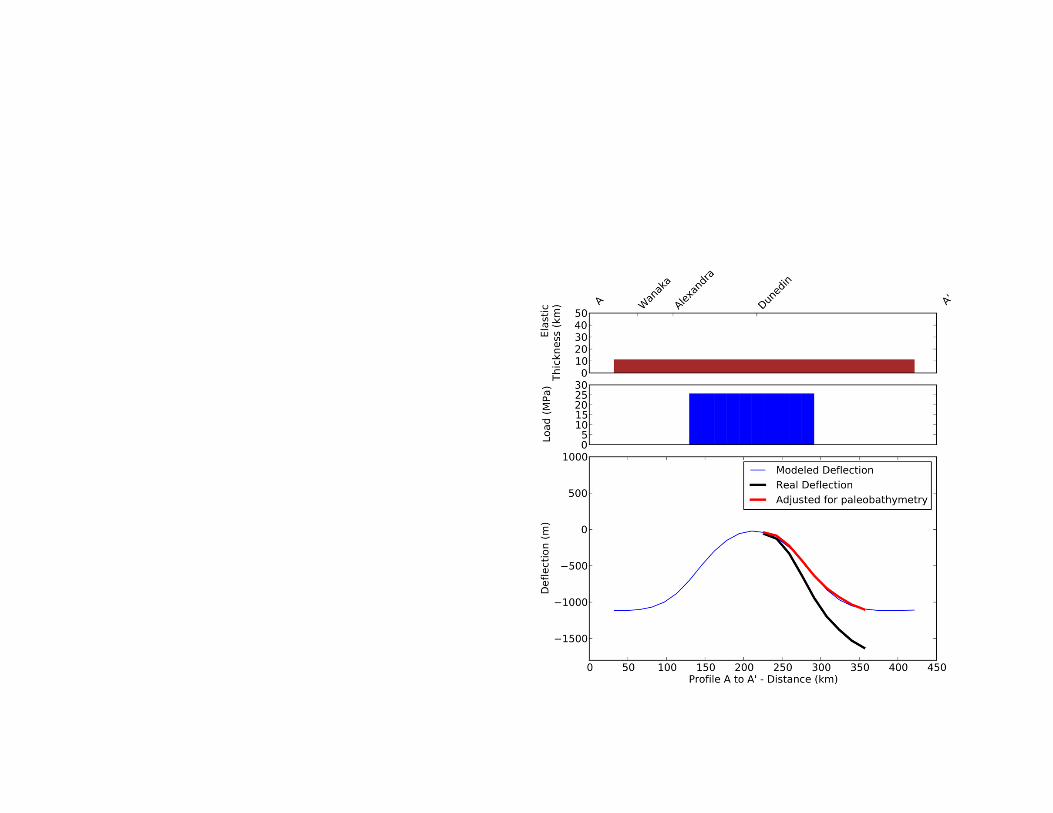
Modelled and observed uplift on a northeast transect B‐B’.
Figure 4.7: Modelled and observed uplift on a northeast transect B‐B’.This is comparable to the SIGHT transect used by Godfrey et al. (2001).Godfrey et al. (2001) The first pane shows the elastic thickness in km, the second shows the buoyant load in MPa, and the third shows the real (black) and modelled (blue) deflection from an estimated deposition depth of 1100 m.
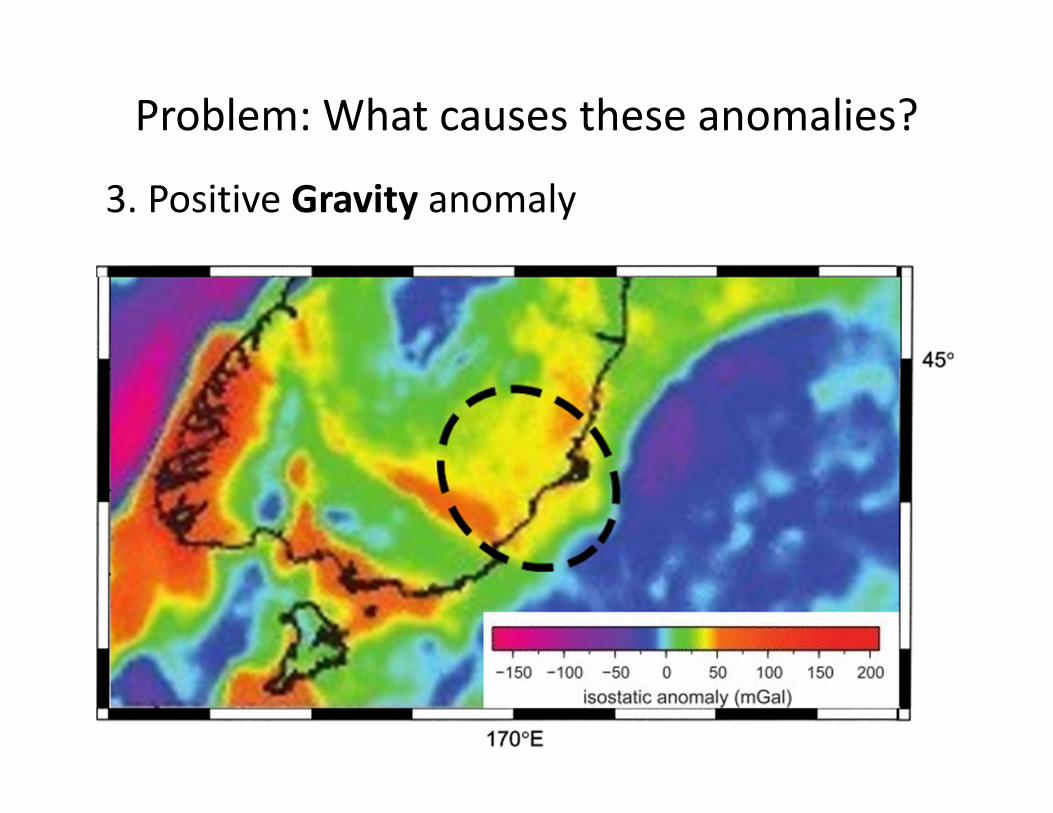
Testing the models sensitivity
Figure 4.9: Testing models sensitivity to elastic thickness on transect B‐B’.The pane shows the real and modelled deflections from an estimated deposition depth of 1100 m.
Figure 4.10: Testing the models sensitivity to load on transect B‐B’. The black line shows real deflection from an estimated deposition depth of 1100 m.

Block diagramFigure 4.4: Block diagram of the inputs, parameters, and output of the flexure model

North‐to‐south transect of upliftFigure 3.4: North‐to‐south transect b‐b’.The coloured lines are Neogene sequence boundaries. As the horizons move to the left they approach Dunedin and onlap onto the uplifted limestone horizon (Top N10).

Neogene horizons onlap onto the Endeavour High
Figure 3.5: Neogene horizons onlap onto the Endeavour High and are used to constrain the timing of motion on the Endeavour fault. Most offset on the Endeavour fault (red trishear zone) occurs below Top N10 (green), which places it before 19 Ma. Later movement occurs between Top TN10 (green) and Top N20 (light green), which places it between 19 Ma and 13.7 Ma.

Late Cenozoic basalts in the Onshore Dunedin areaFigure 2.7: Late Cenozoic basalts in the Onshore Dunedin area(black), modified from Hoke et al. (2000).

Wide‐angle seismic data has revealed crustal anomalies beneath Otago
Figure 2.8: Wide‐angle seismic data has revealed crustal anomalies beneath Otago that may represent a hot fluid‐rich region (Godfrey et al. 2001).

Depth map of the uplifted limestoneDepth map of the uplifted limestone horizon with transects A and B.

• Anomalies together