Embed Size (px)
DESCRIPTION
به نام یکتای جهان آفرین. ECG. H.R Tohidypour. Cardiac Physiology. Electrocardiography. OVERVIEW. VEINS. ARTERIES. brings blood back to heart. distributes blood from heart. Diagnosis. Cardiac Physiology. Electrocardiography. Diagnosis. Cardiac Physiology. Electrocardiography. Atria. - PowerPoint PPT Presentation
Citation preview

به نام یکتای جهان آفرین
ECG
H.R Tohidypour
OVERVIEWOVERVIEW
Cardiac Physiology
Electrocardiography
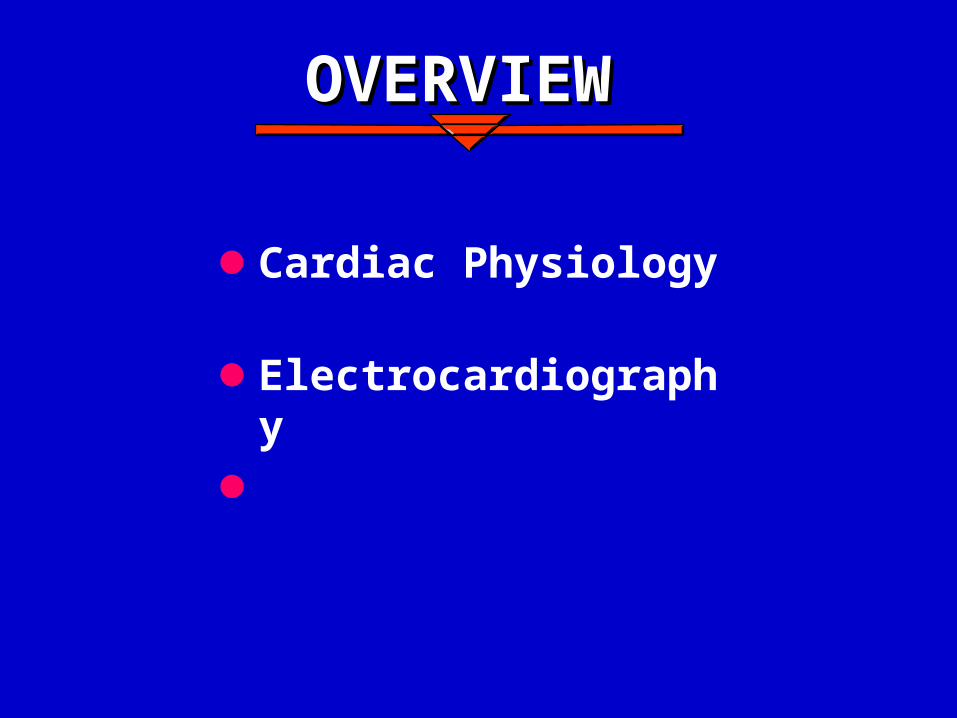
Cardiac Physiology Electrocardiography Diagnosis
ARTERIESdistributes blood from
heart
VEINSbrings blood back to heart
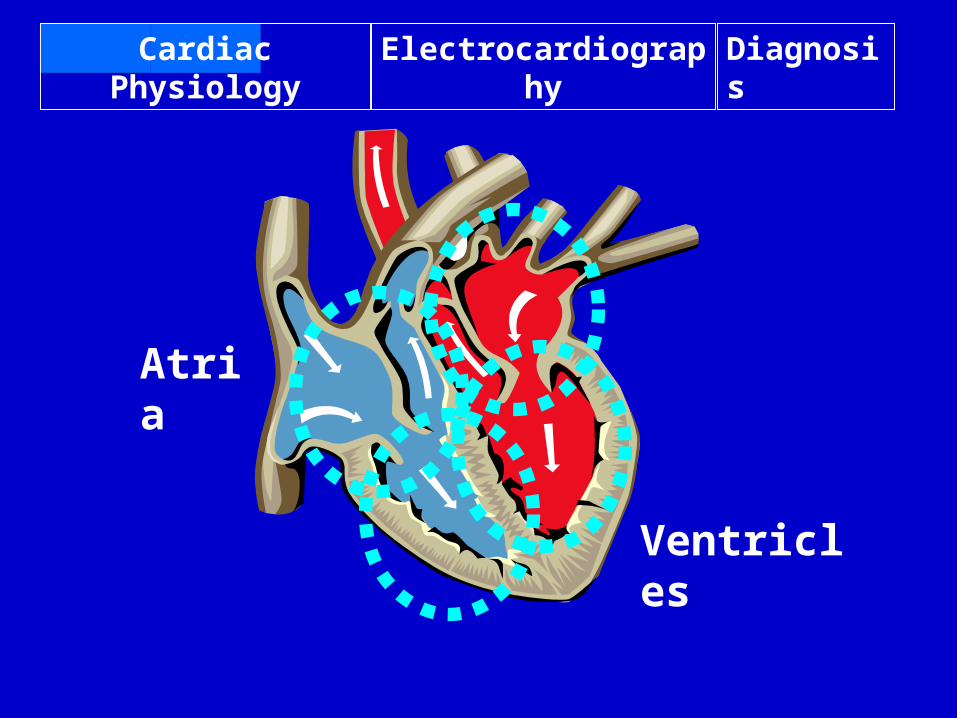
Cardiac Physiology Electrocardiography Diagnosis
Atria
Ventricles
Cardiac Physiology Electrocardiography Diagnosis
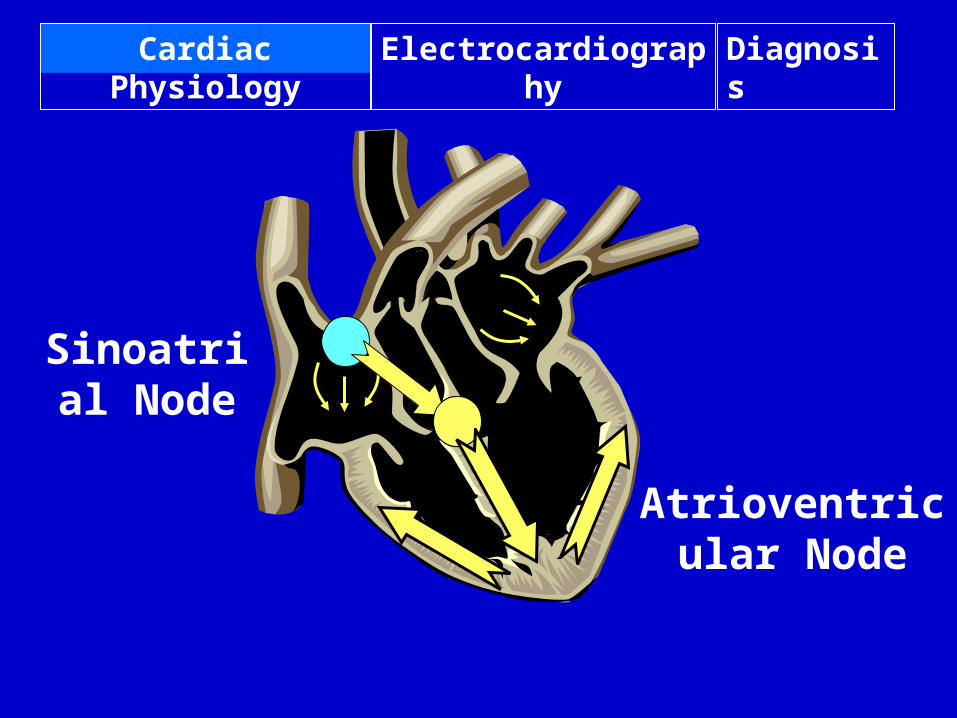
Sinoatrial Node
Atrioventricular Node
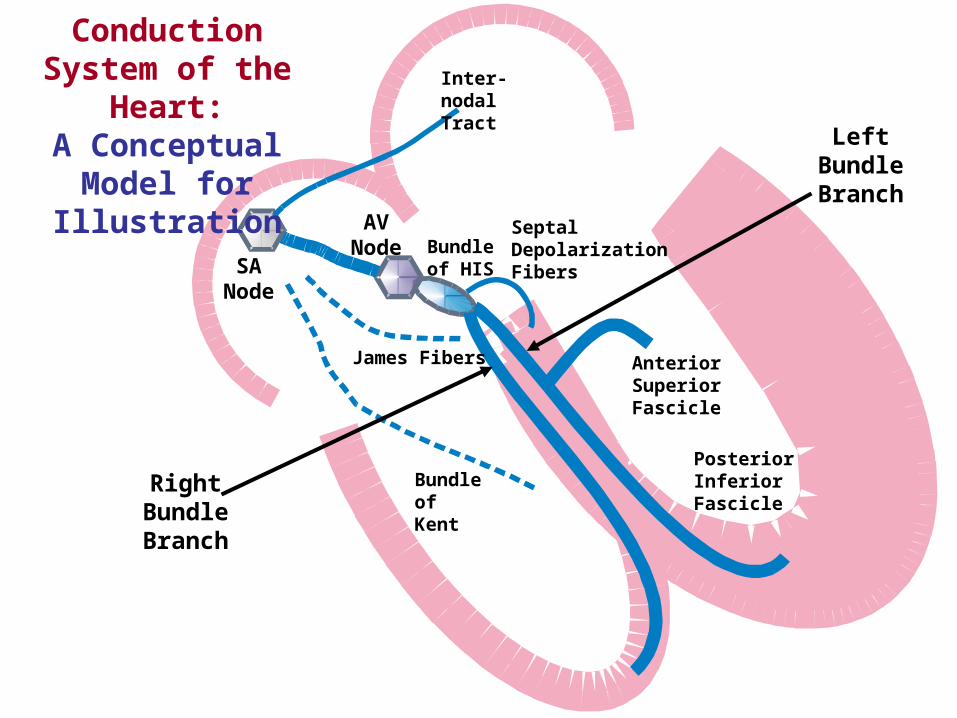
SA Node
AV Node
Inter-nodal Tract
Bundle of Kent
James Fibers
Conduction System of the Heart:
A Conceptual Model for Illustration
Bundle of HIS
Right Bundle Branch
Left Bundle Branch
Septal Depolarization Fibers
Anterior Superior Fascicle
Posterior Inferior Fascicle
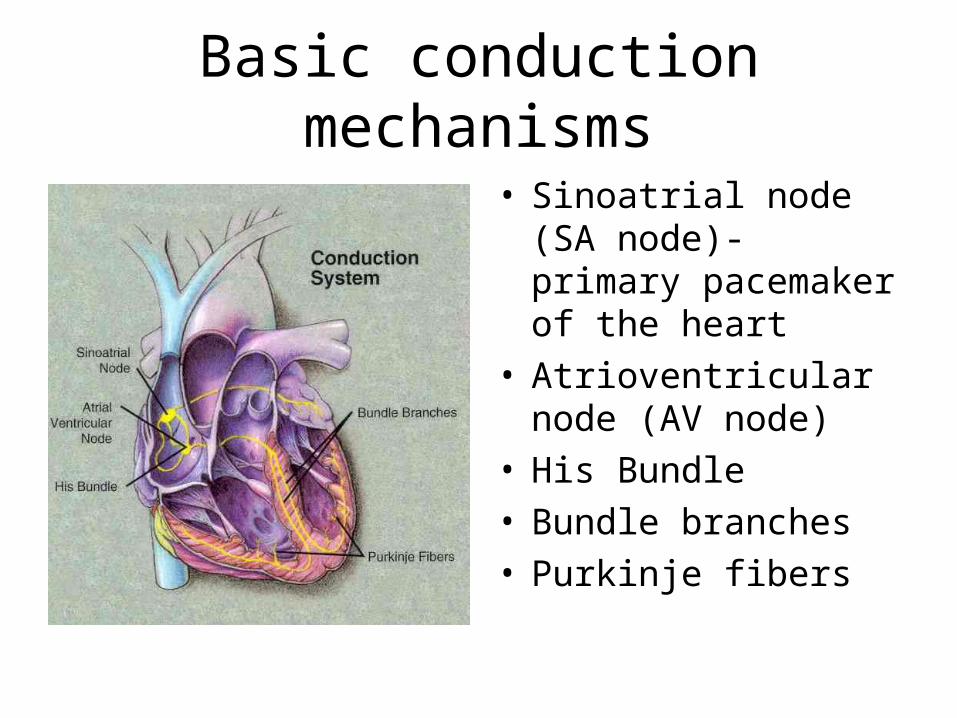
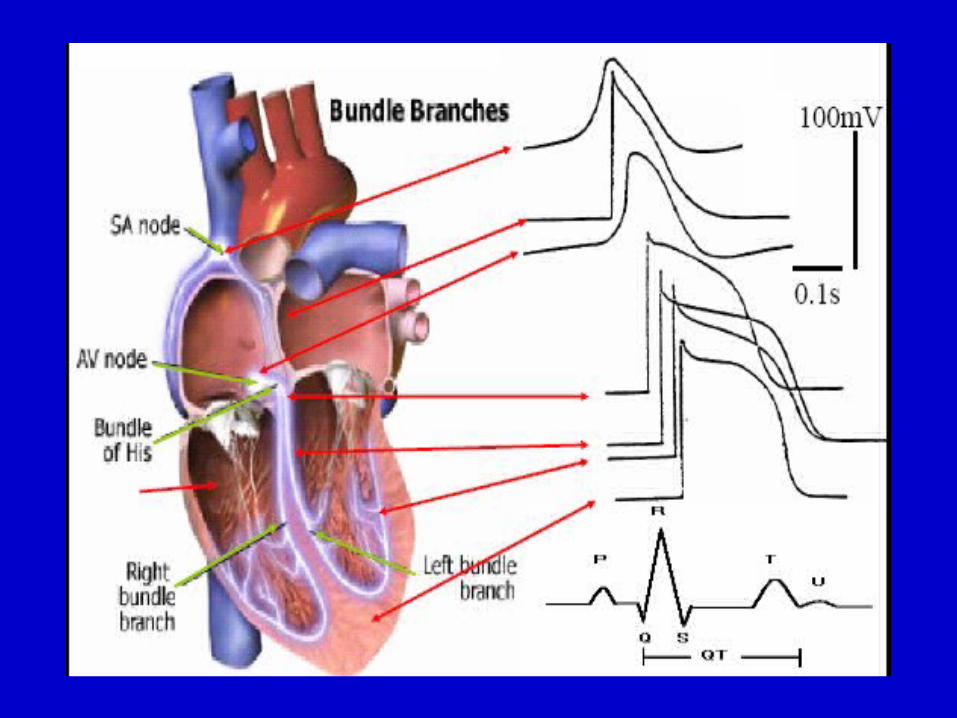
Basic conduction mechanisms
• Sinoatrial node (SA node)- primary pacemaker of the heart
• Atrioventricular node (AV node)
• His Bundle• Bundle branches• Purkinje fibers
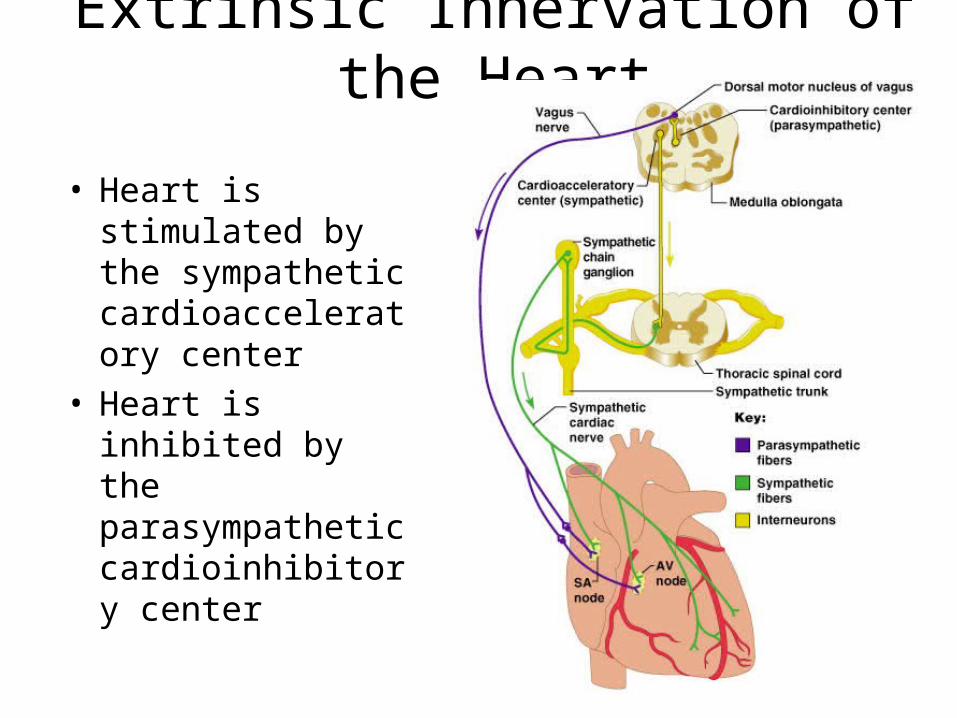
Extrinsic Innervation of the Heart
• Heart is stimulated by the sympathetic cardioacceleratory center
• Heart is inhibited by the parasympathetic cardioinhibitory center
Cardiac Cycle
• Cardiac cycle refers to all events associated with blood flow through the heart– Systole – contraction of heart muscle– Diastole – relaxation of heart muscle
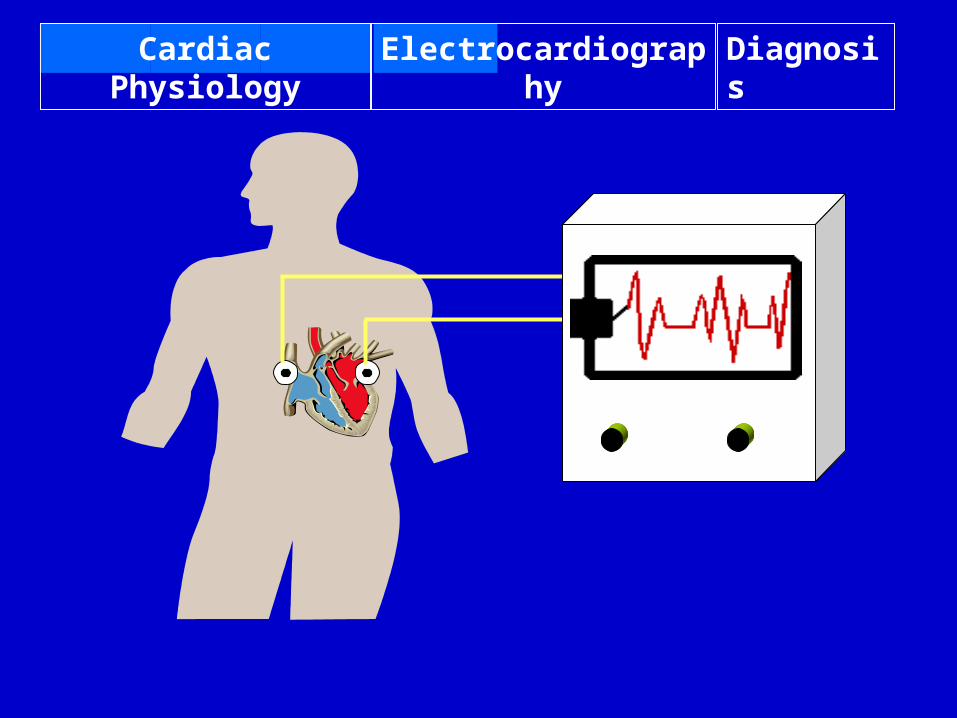
Cardiac Physiology Electrocardiography Diagnosis
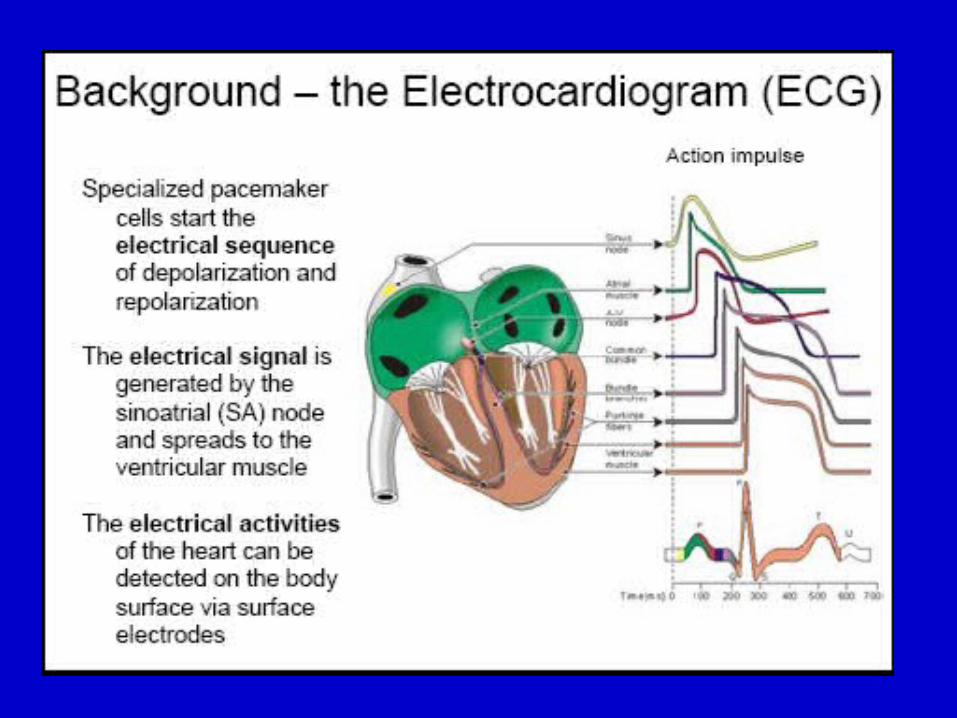
Introduction to Electrocardiography (ECG, EKG)
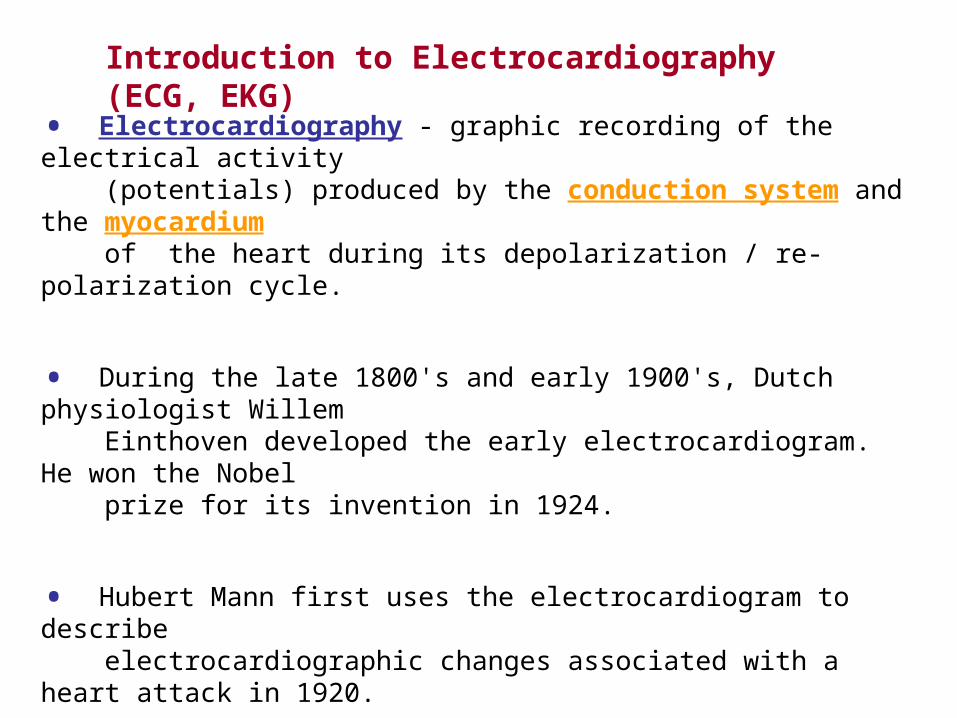
• Electrocardiography - graphic recording of the electrical activity (potentials) produced by the conduction system and the myocardium of the heart during its depolarization / re-polarization cycle.
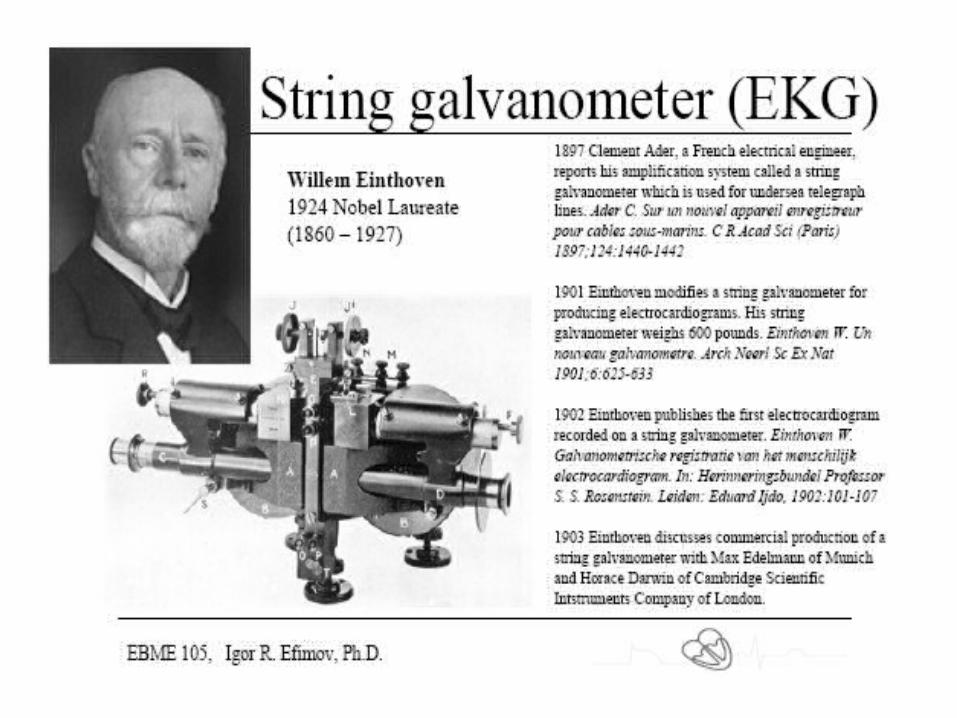
• During the late 1800's and early 1900's, Dutch physiologist Willem Einthoven developed the early electrocardiogram. He won the Nobel prize for its invention in 1924.
• Hubert Mann first uses the electrocardiogram to describe electrocardiographic changes associated with a heart attack in 1920.
• The science of electrocardiography is not exact. The sensitivity and specificity of the tool in relation to various diagnoses are relatively low
• Electrocardiograms must be viewed in the context of demographics, health histories, and other clinical test correlates. They are especially useful when compared across time to see how the electrical activity of the heart has changed (perhaps as the result of some pathology).
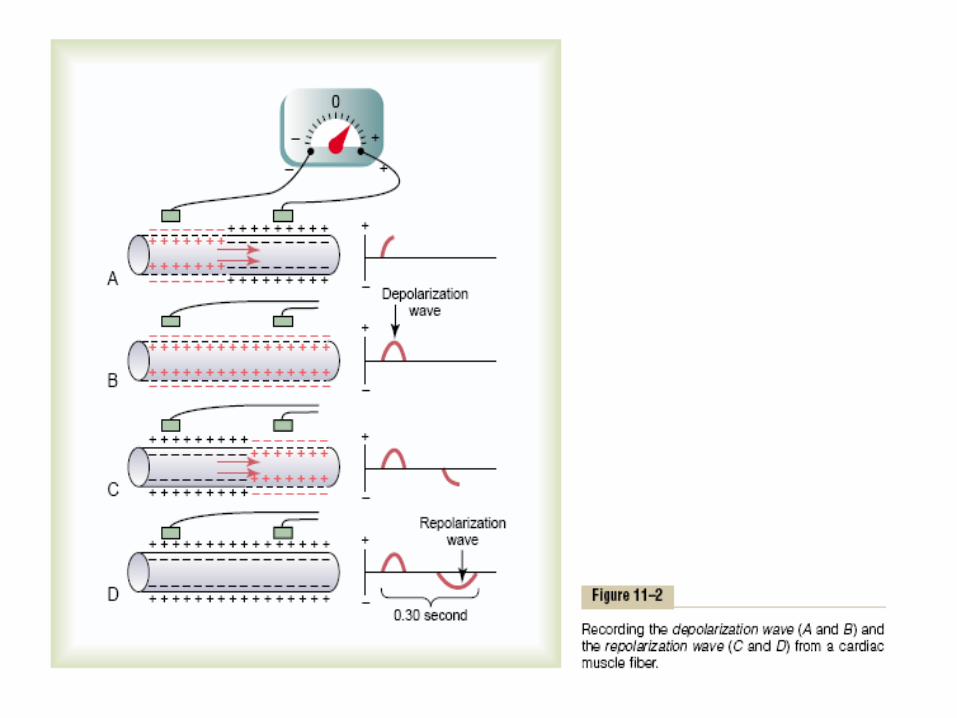
Design considerations: differential recordings
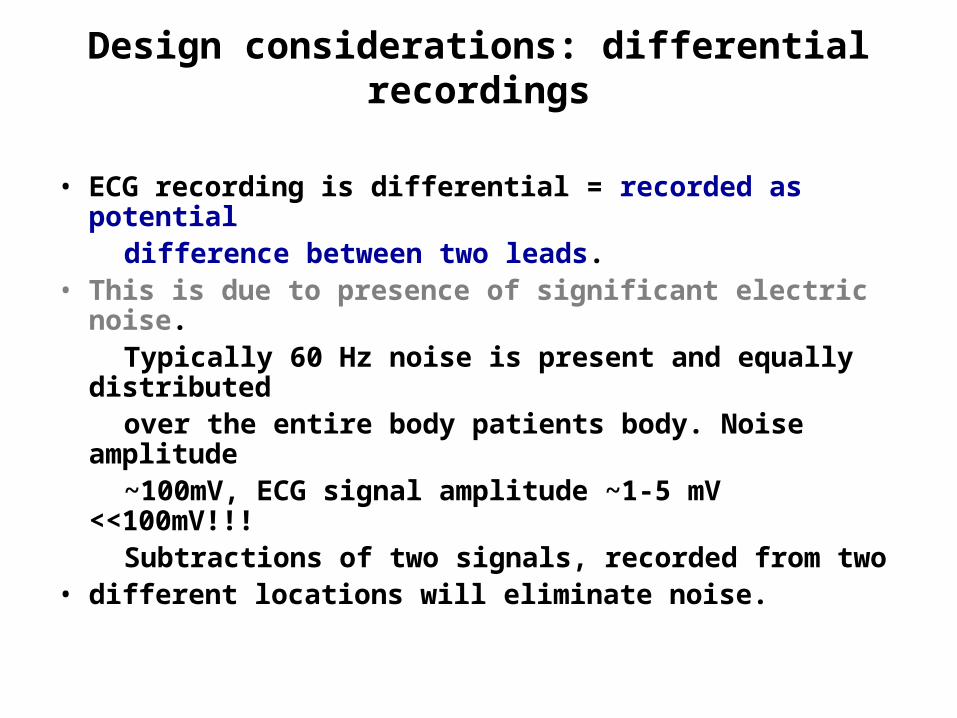
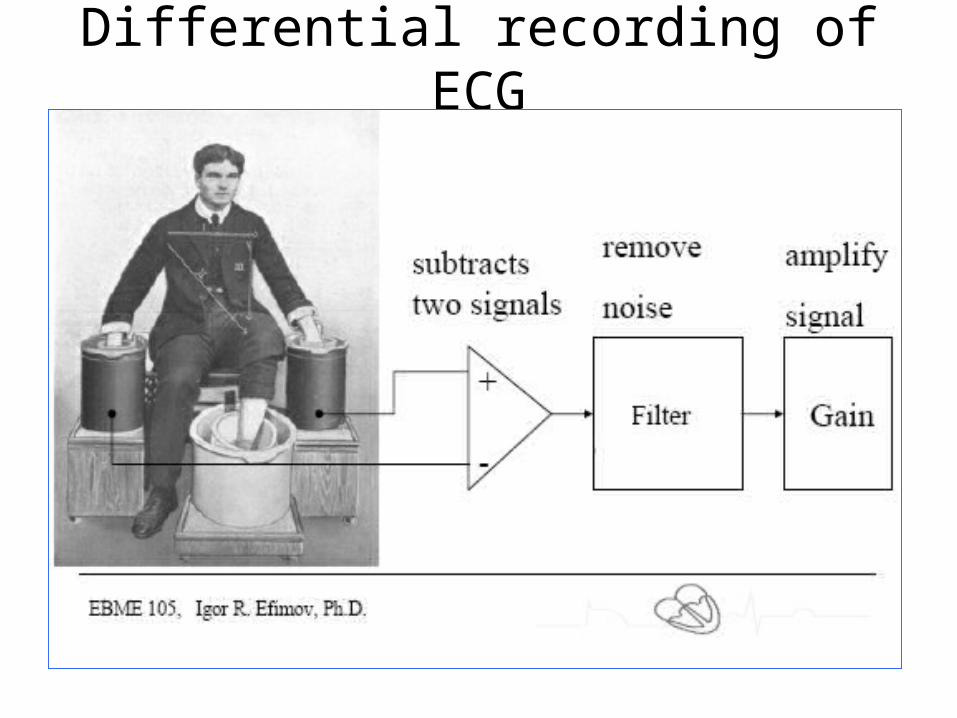
• ECG recording is differential = recorded as potential difference between two leads.• This is due to presence of significant electric noise. Typically 60 Hz noise is present and equally
distributed over the entire body patients body. Noise amplitude ~100mV, ECG signal amplitude ~1-5 mV <<100mV!!! Subtractions of two signals, recorded from two• different locations will eliminate noise.
Differential recording of ECG
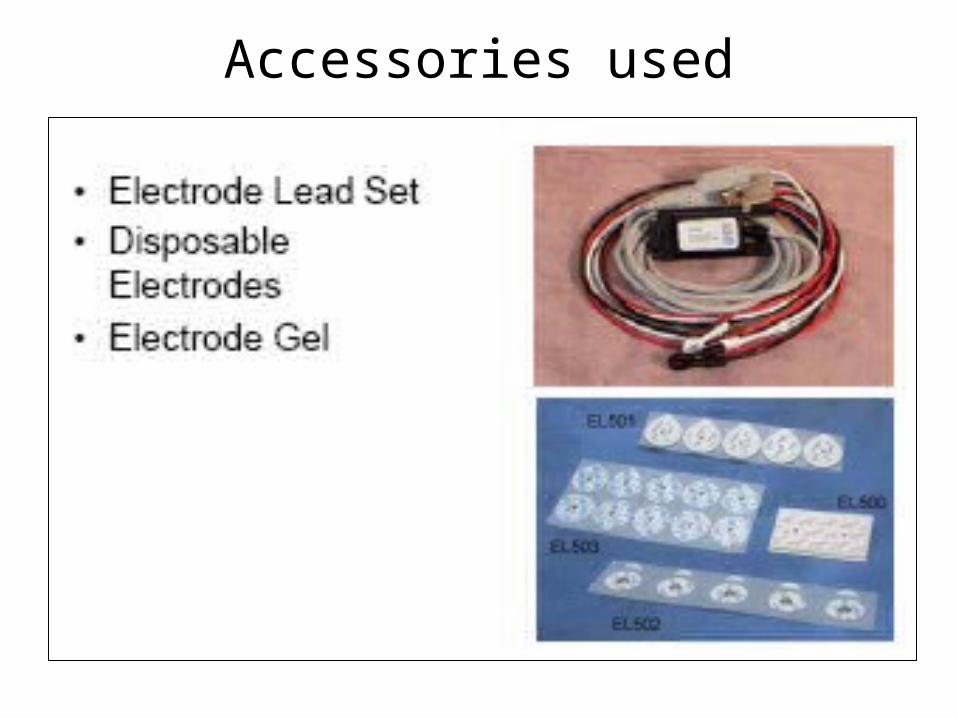
Accessories used
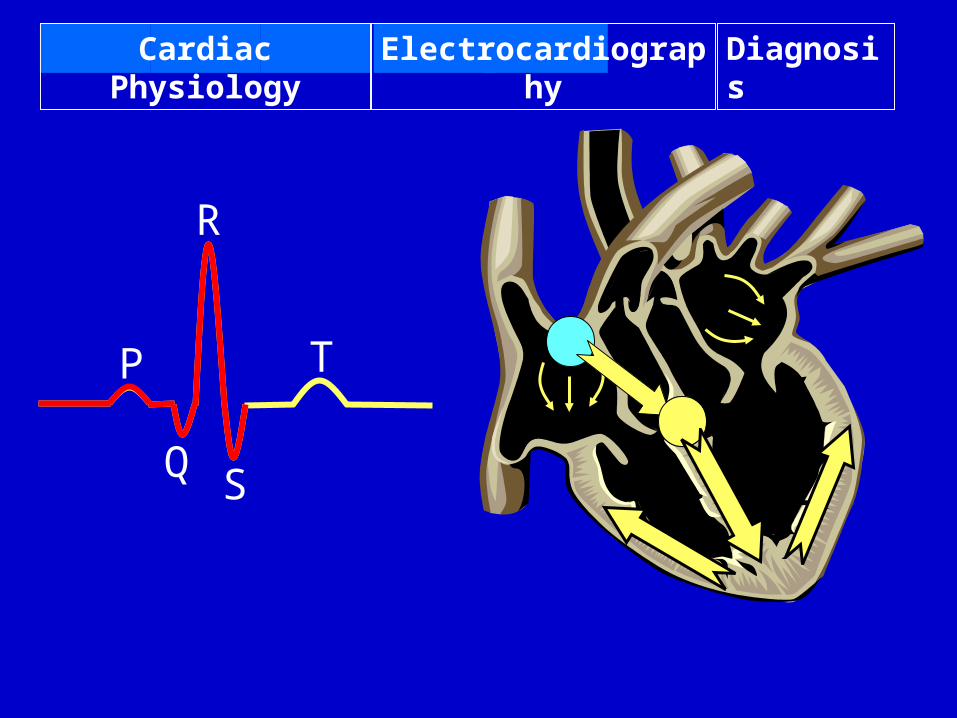
Cardiac Physiology Electrocardiography Diagnosis
P
Q
R
S
T
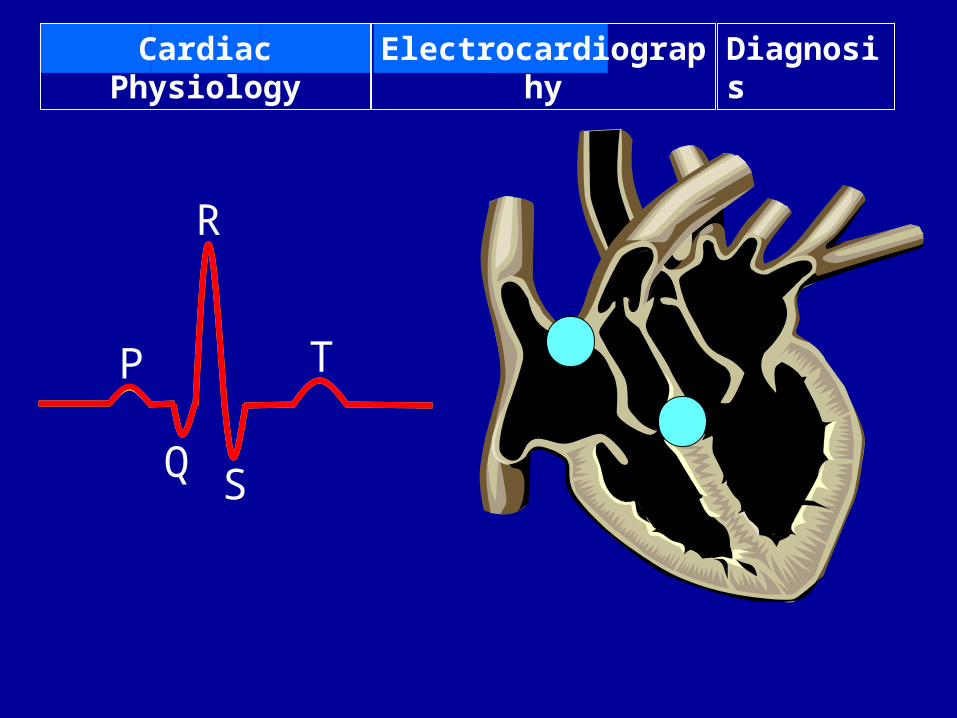
Cardiac Physiology Electrocardiography Diagnosis
P
Q
R
S
T
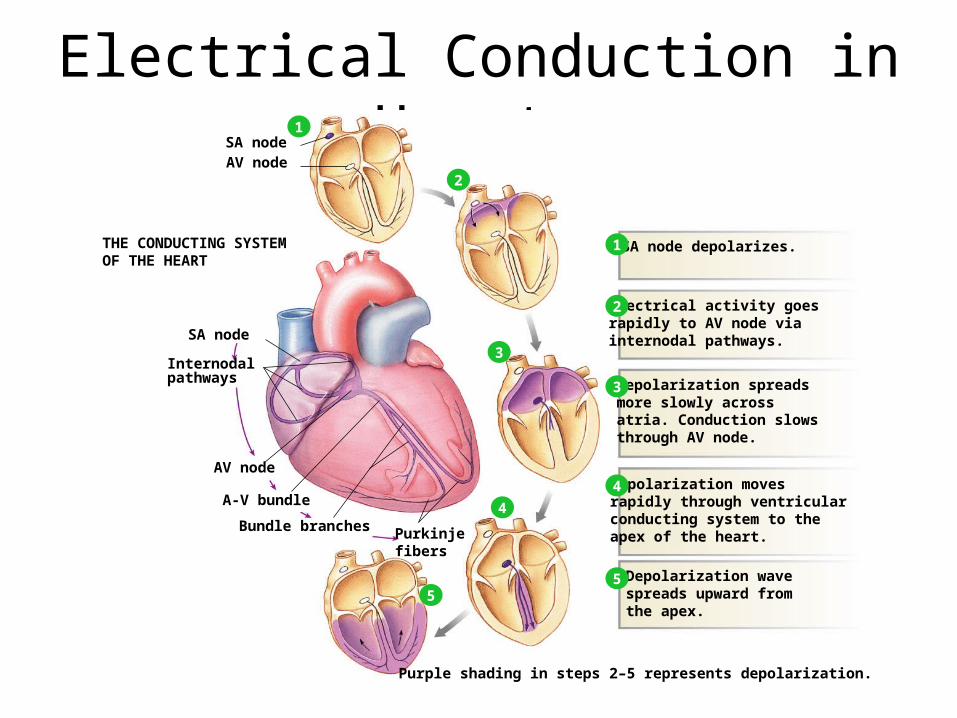
Electrical Conduction in Heart
THE CONDUCTING SYSTEMOF THE HEART
SA nodeAV node
Purkinjefibers
Bundle branches
A-V bundle
AV node
Internodalpathways
SA node
SA node depolarizes.
Electrical activity goesrapidly to AV node viainternodal pathways.
Depolarization spreadsmore slowly acrossatria. Conduction slowsthrough AV node.
Depolarization movesrapidly through ventricularconducting system to theapex of the heart.
Depolarization wavespreads upward fromthe apex.
1
4
5
3
2
1
4
5
3
2
1
Purple shading in steps 2–5 represents depolarization.
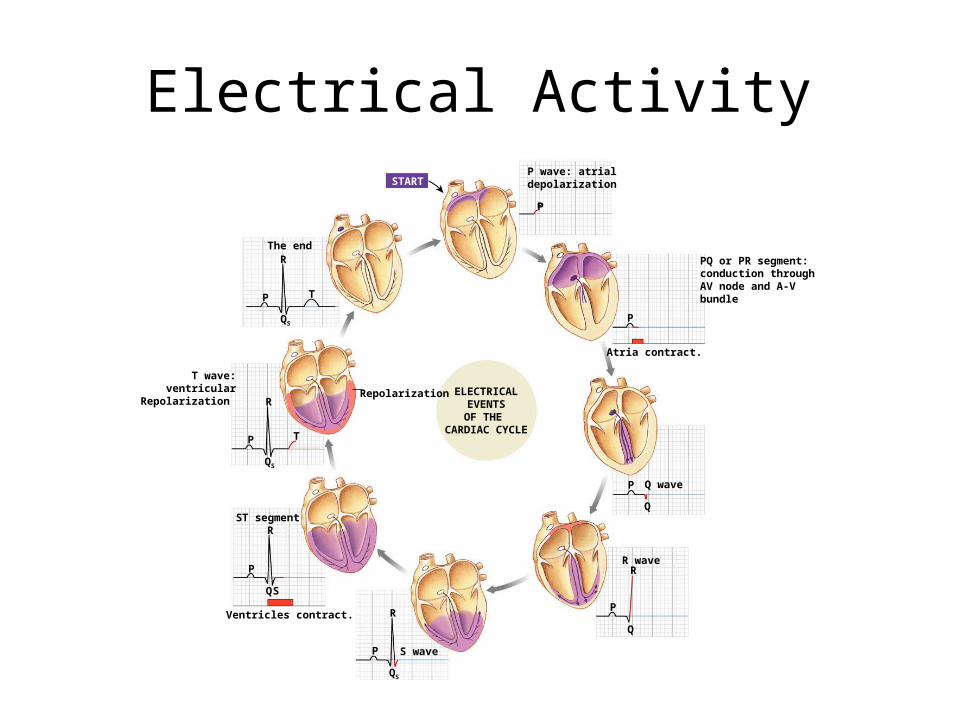
Electrical ActivityP wave: atrialdepolarization
P
START
Atria contract.
PQ or PR segment:conduction throughAV node and A-Vbundle
P
P
Q
Q wave
R wave
P
Q
R
S wave
QS
R
P
ELECTRICALEVENTSOF THE
CARDIAC CYCLE
Repolarization
ST segment
Ventricles contract.
P
Q
R
S
The end
T wave:ventricular
Repolarization
P
QS
R
T
P
QS
R
T
Cardiac Physiology Electrocardiography Diagnosis
P
Q
R
S
T
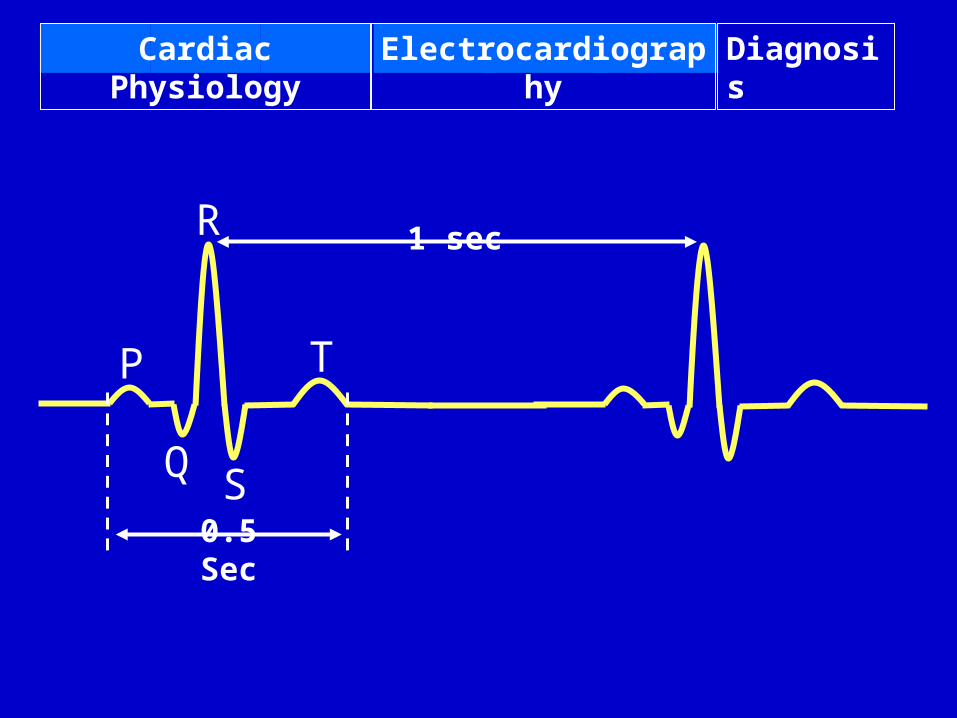
0.5 Sec
1 sec
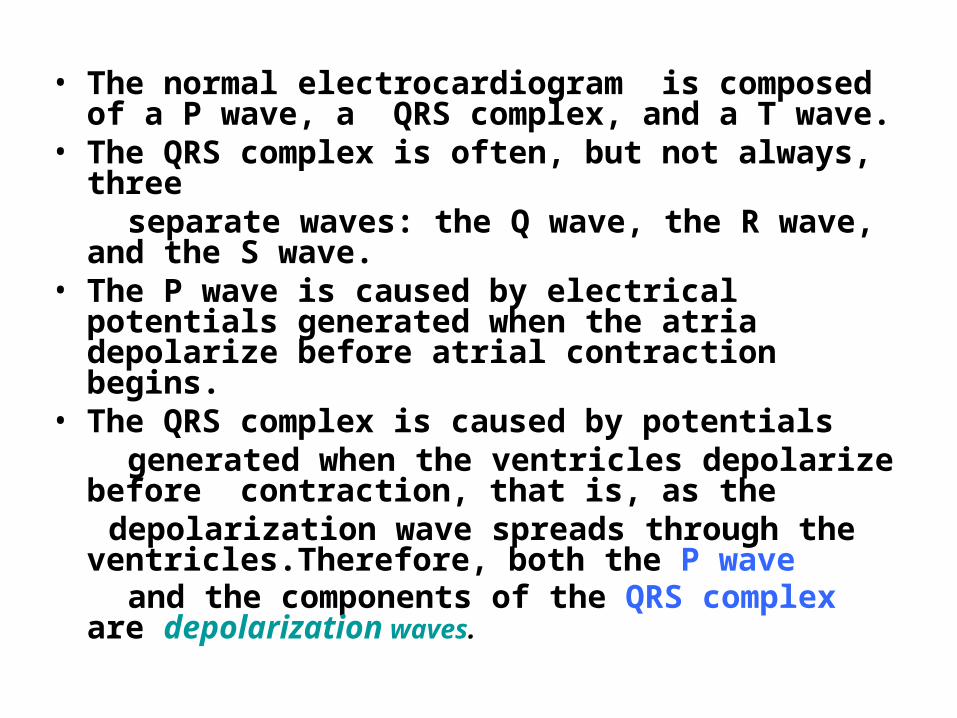
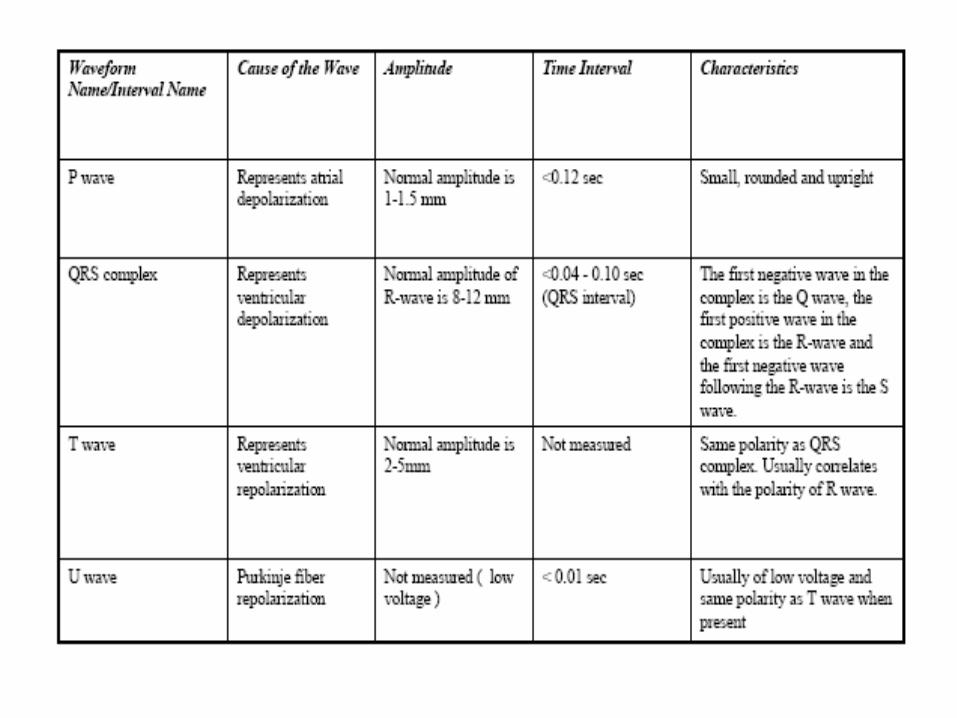
• The normal electrocardiogram is composed of a P wave, a QRS complex, and a T wave.
• The QRS complex is often, but not always, three separate waves: the Q wave, the R wave, and the S
wave.• The P wave is caused by electrical potentials
generated when the atria depolarize before atrial contraction begins.
• The QRS complex is caused by potentials generated when the ventricles depolarize before
contraction, that is, as the depolarization wave spreads through the
ventricles.Therefore, both the P wave and the components of the QRS complex are
depolarization waves.
Normal Voltages in the Electrocardiogram.
• The recorded voltages of the waves in the normal electrocardiogram depend on the manner in which the electrodes are applied to the surface of the body and how close the electrodes are to the heart.
• When one electrode is placed directly over the ventricles and a second electrode is placed elsewhere on the body remote from the heart, the voltage of the QRS complex may be as great as 3 to 4 millivolts.
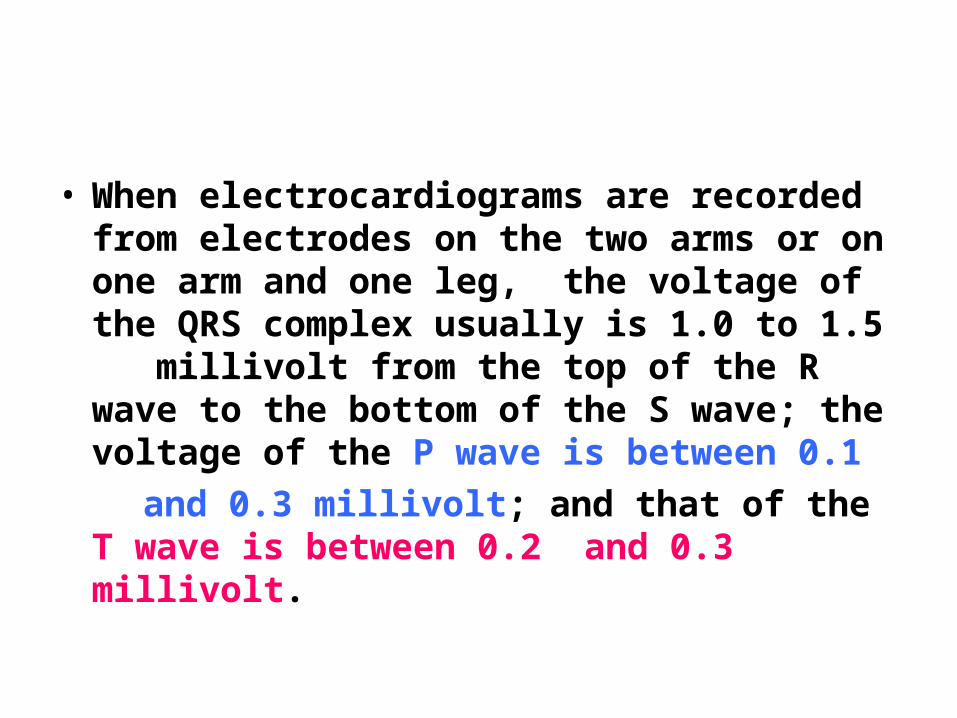
• When electrocardiograms are recorded from electrodes on the two arms or on one arm and one leg, the voltage of the QRS complex usually is 1.0 to 1.5 millivolt from the top of the R wave to the bottom of the S wave; the voltage of the P wave is between 0.1
and 0.3 millivolt; and that of the T wave is between 0.2 and 0.3 millivolt.
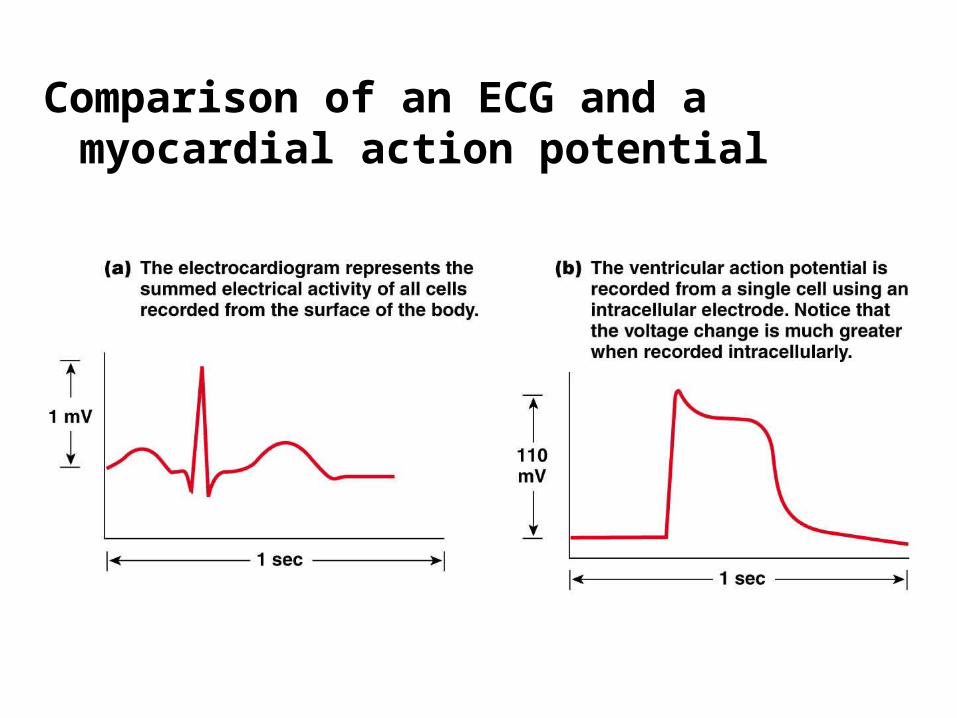
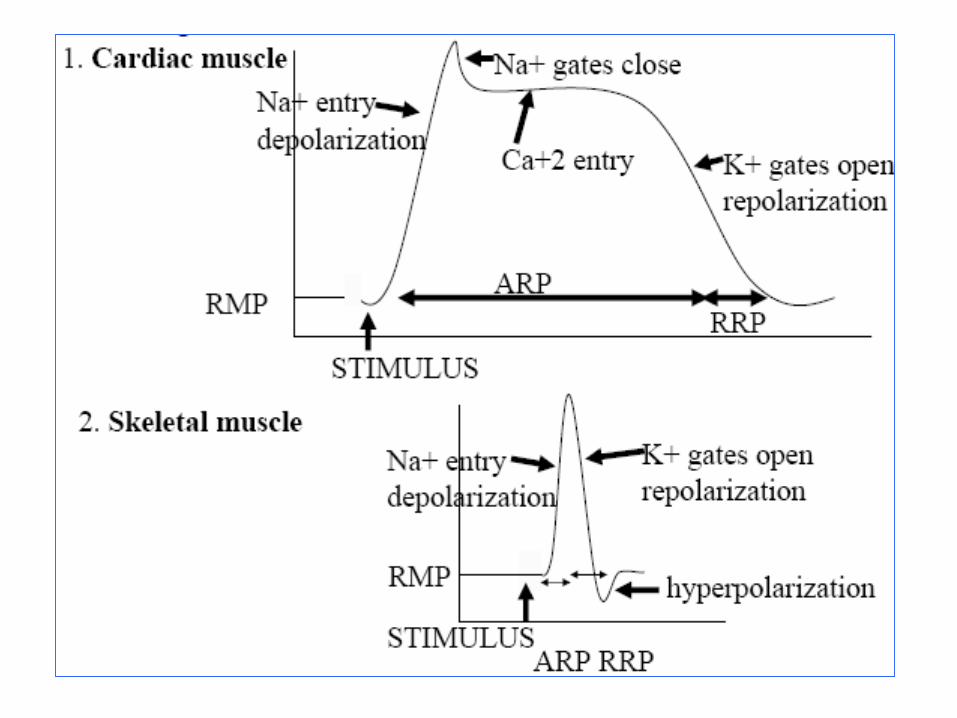
Comparison of an ECG and a myocardial action potential
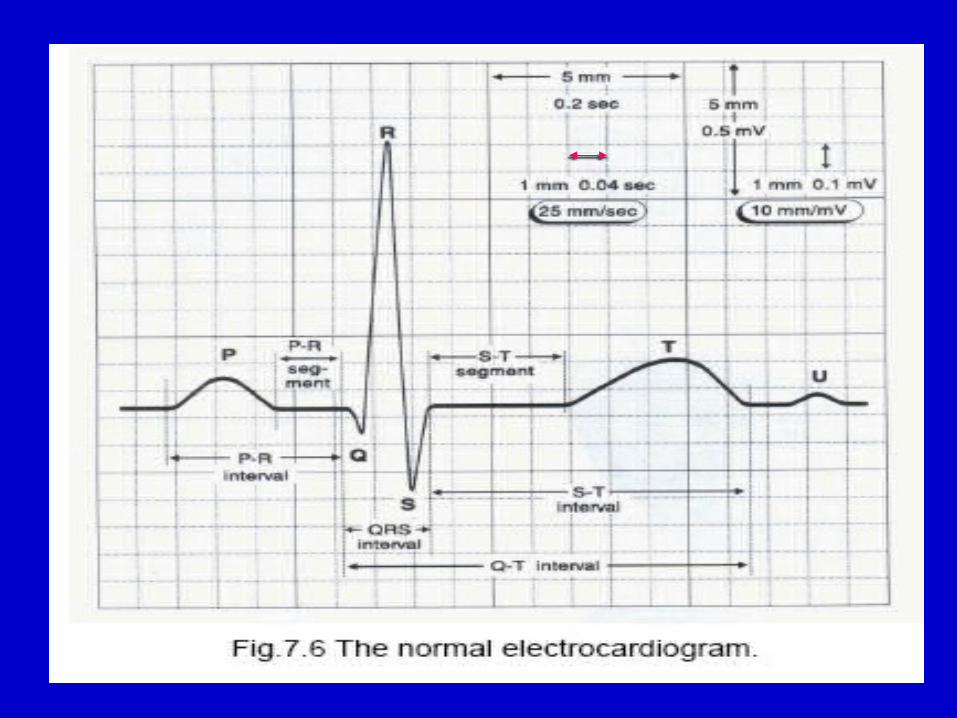
• P-Q or P-R Interval. The time between the beginning of the P wave and the beginning of the QRS complex is the interval between the beginning of electrical excitation of the atria and the beginning of excitation of the ventricles. This period is called the P-Q interval. The normal P-Q interval is about 0.16 second. (Often this interval is called the P-R interval because the Q wave is likely to be absent.)
• Q-T Interval. Contraction of the ventricle lasts almost from the beginning of the Q wave (or R wave, if the Q wave is absent) to the end of the T wave. This
interval is called the Q-T interval and ordinarily is about 0.35 second.
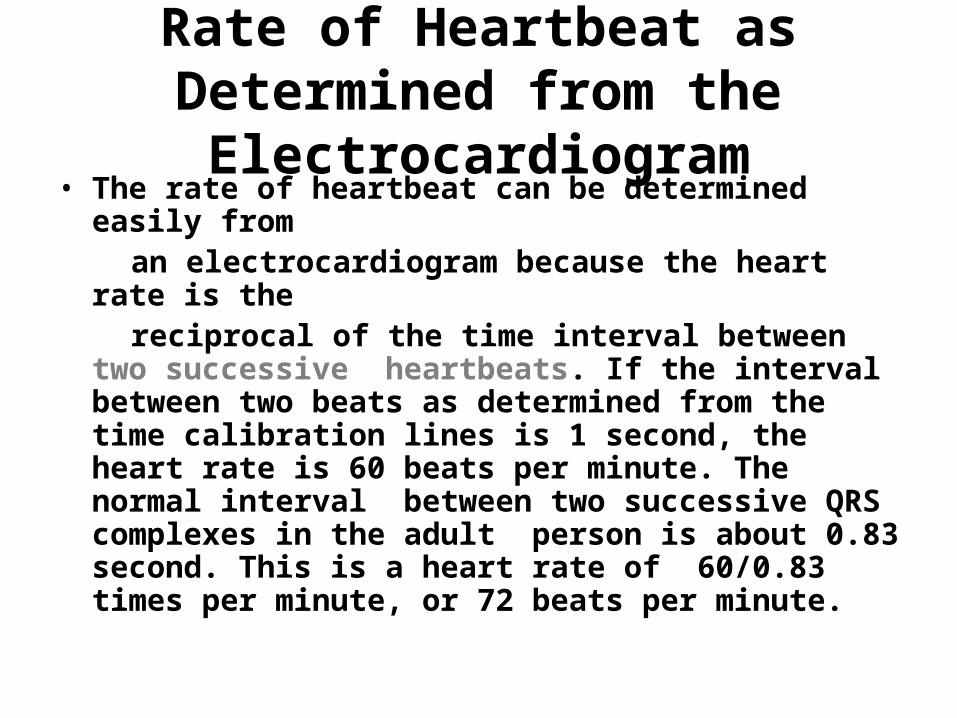
Rate of Heartbeat as Determined from the Electrocardiogram
• The rate of heartbeat can be determined easily from an electrocardiogram because the heart rate is the reciprocal of the time interval between two
successive heartbeats. If the interval between two beats as determined from the time calibration lines is 1 second, the heart rate is 60 beats per minute. The normal interval between two successive QRS complexes in the adult person is about 0.83 second. This is a heart rate of 60/0.83 times per minute, or 72 beats per minute.
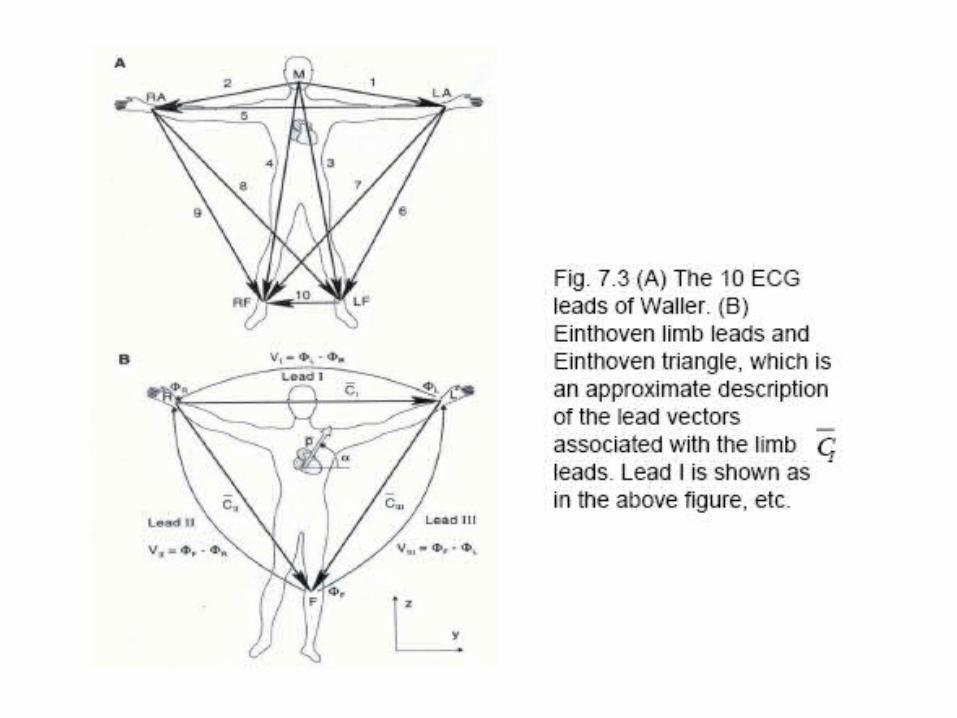
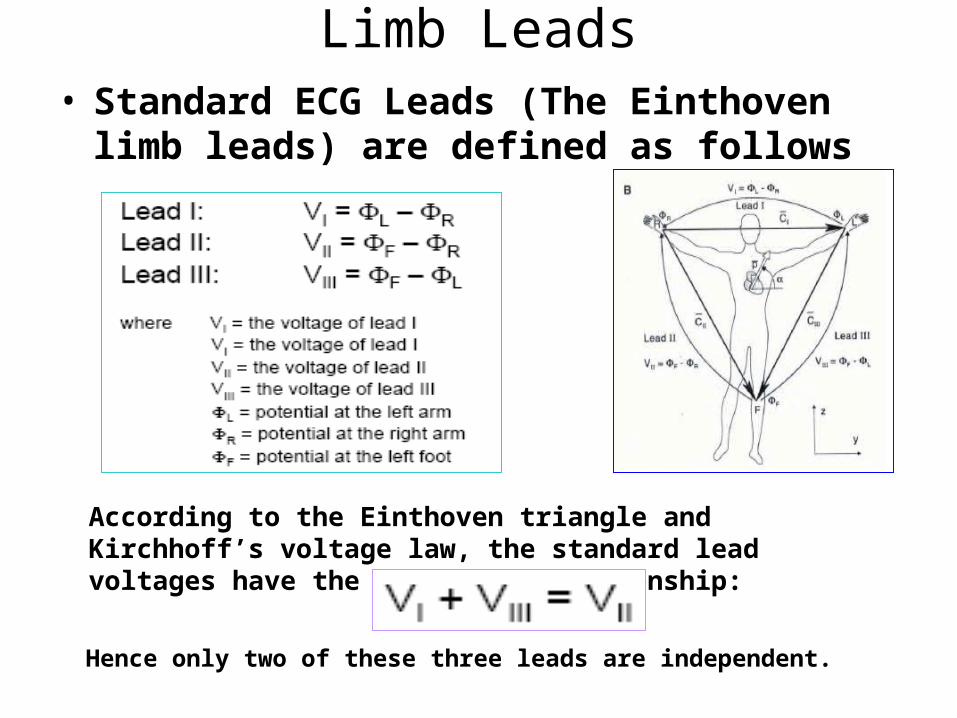
Limb Leads• Standard ECG Leads (The Einthoven limb
leads) are defined as follows
According to the Einthoven triangle and Kirchhoff’s voltage law, the standard lead voltages have the following relationship:
Hence only two of these three leads are independent.
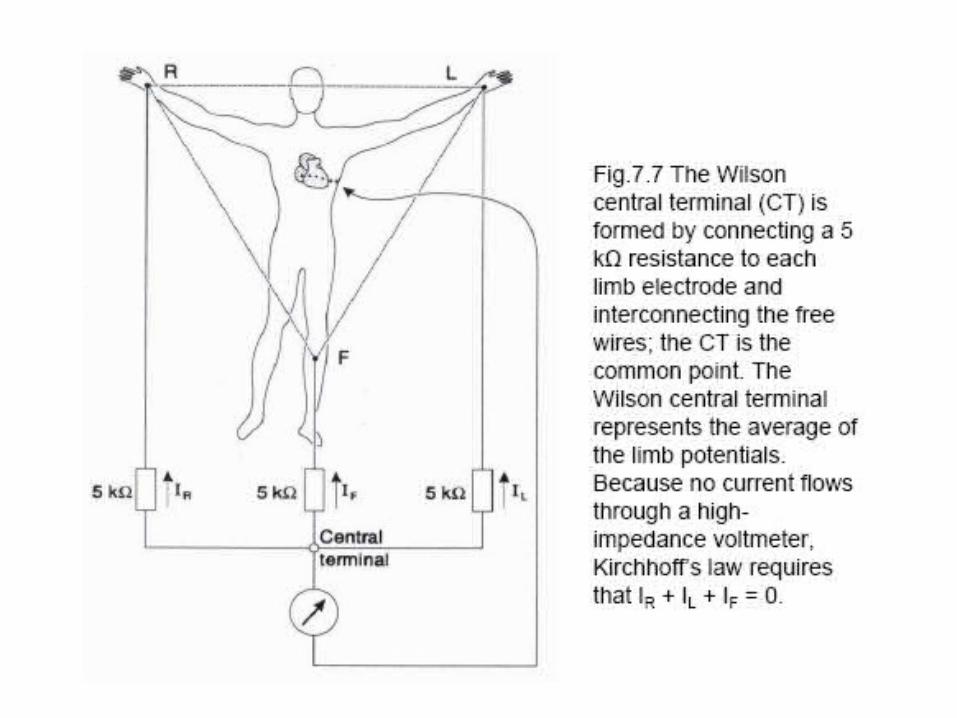
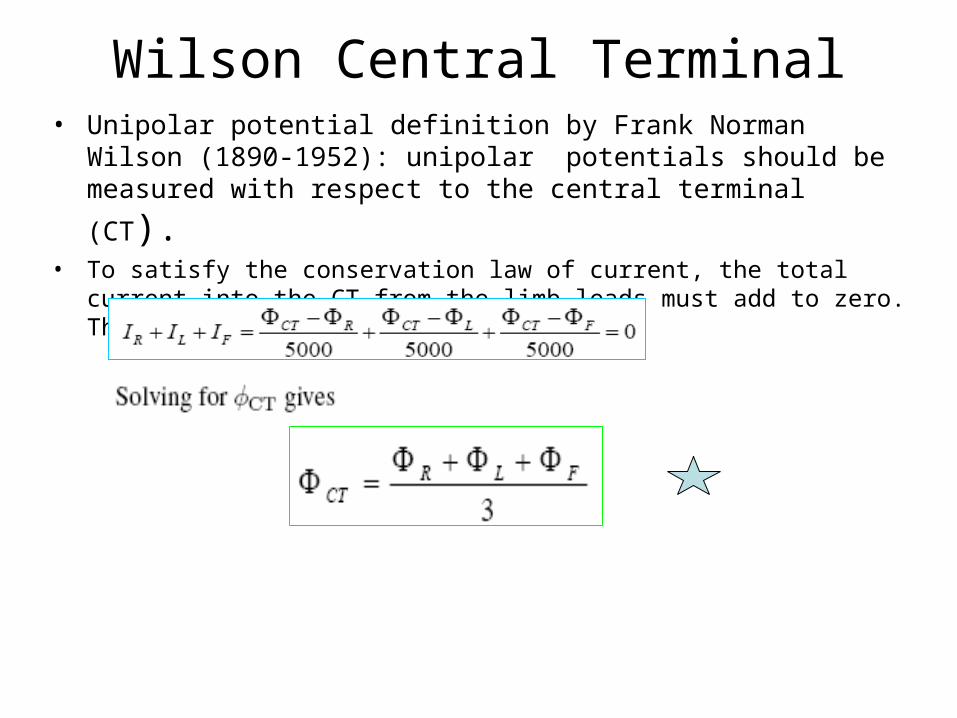
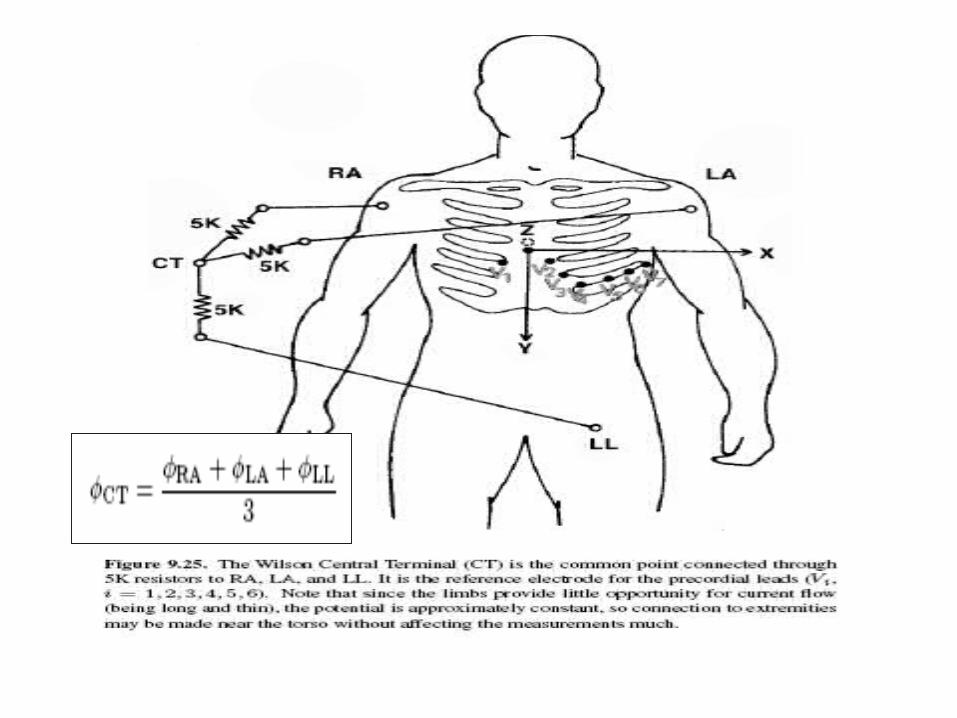
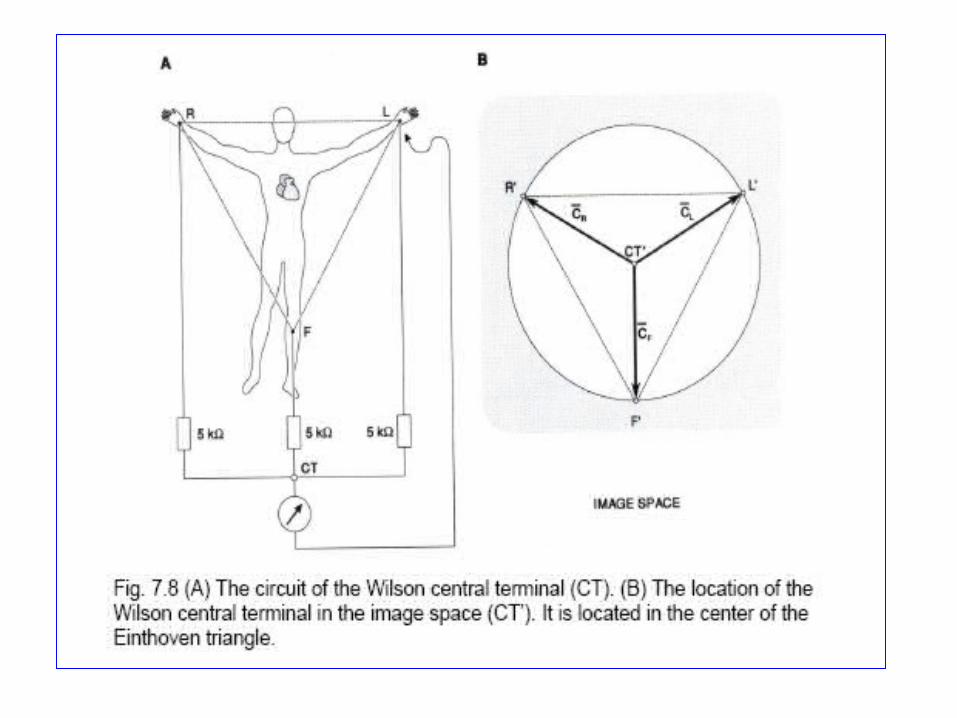
Wilson Central Terminal• Unipolar potential definition by Frank Norman Wilson (1890-1952):
unipolar potentials should be measured with respect to the central
terminal (CT).• To satisfy the conservation law of current, the total current into the CT from
the limb leads must add to zero. Thus, we have:
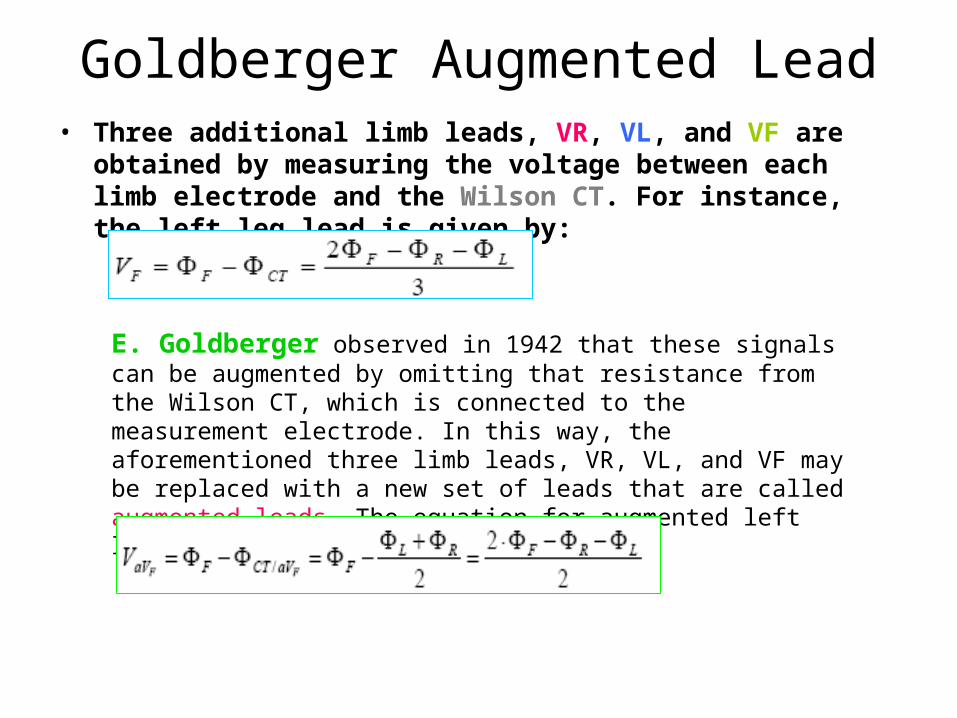
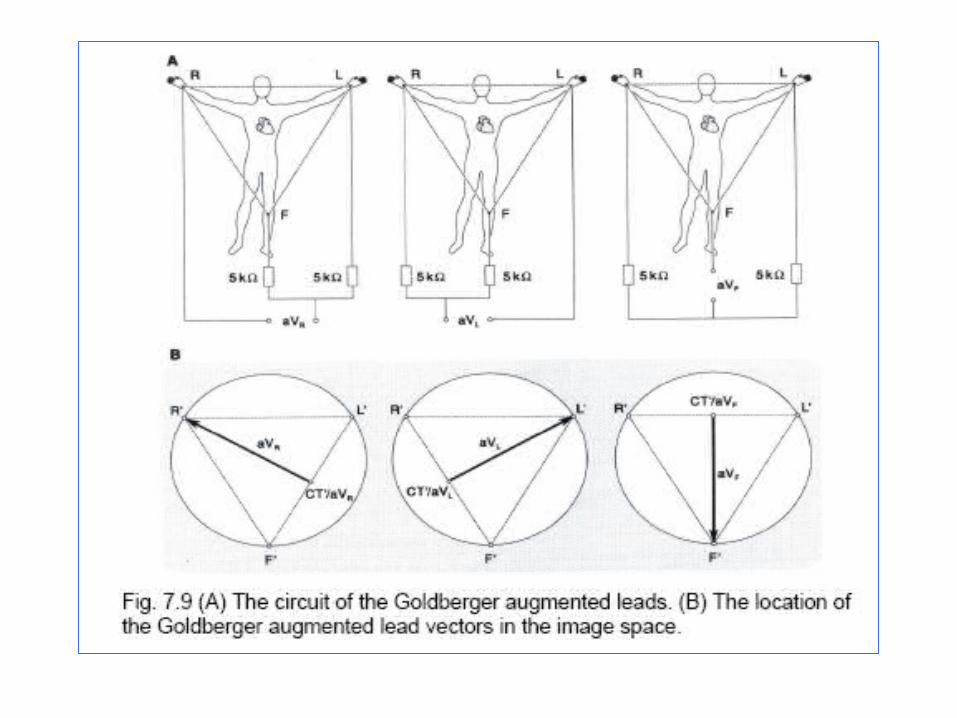
Goldberger Augmented Lead• Three additional limb leads, VR, VL, and VF are obtained by
measuring the voltage between each limb electrode and the Wilson CT. For instance, the left leg lead is given by:
E. Goldberger observed in 1942 that these signals can be augmented by omitting that resistance from the Wilson CT, which is connected to the measurement electrode. In this way, the aforementioned three limb leads, VR, VL, and VF may be replaced with a new set of leads that are called augmented leads. The equation for augmented left leg lead is:
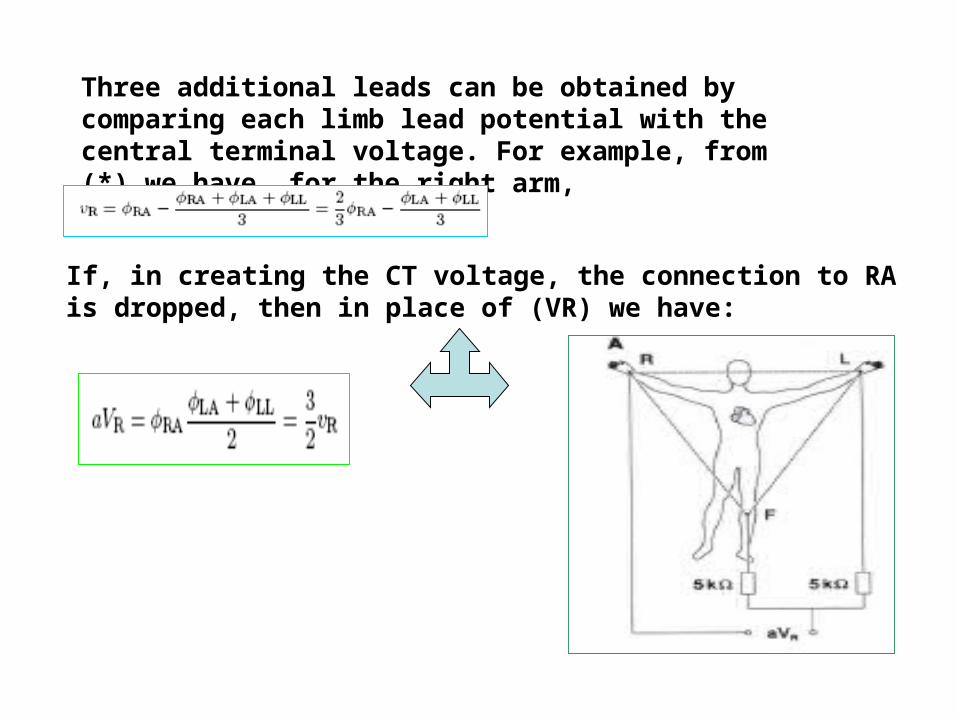
Three additional leads can be obtained by comparing each limb lead potential with the central terminal voltage. For example, from (*) we have, for the right arm,
If, in creating the CT voltage, the connection to RA is dropped, then in place of (VR) we have:
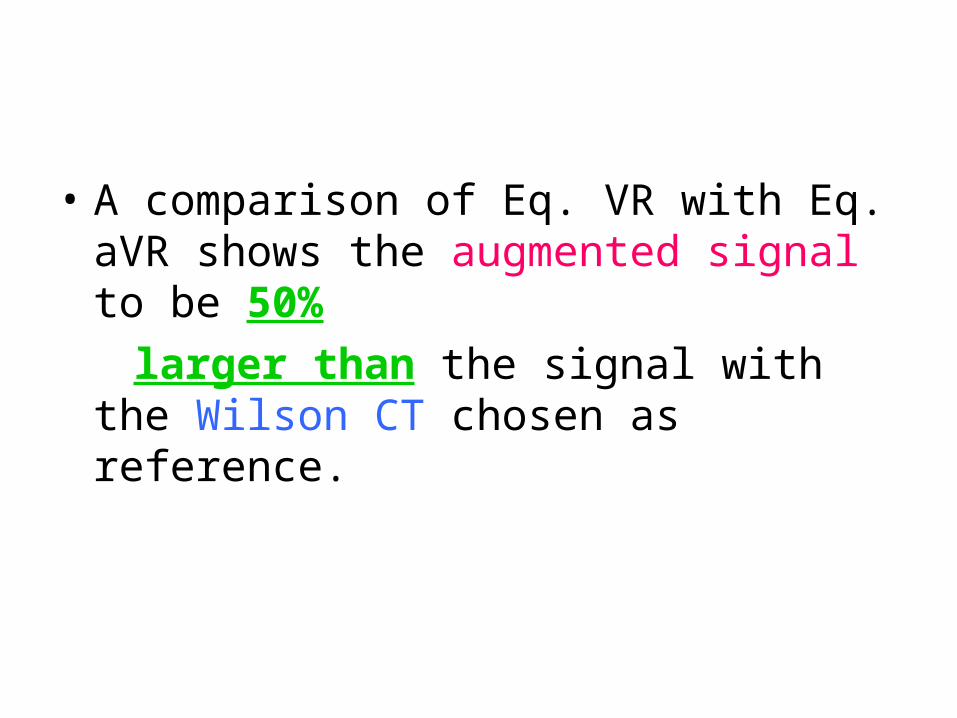
• A comparison of Eq. VR with Eq. aVR shows the augmented signal to be 50%
larger than the signal with the Wilson CT chosen as reference.
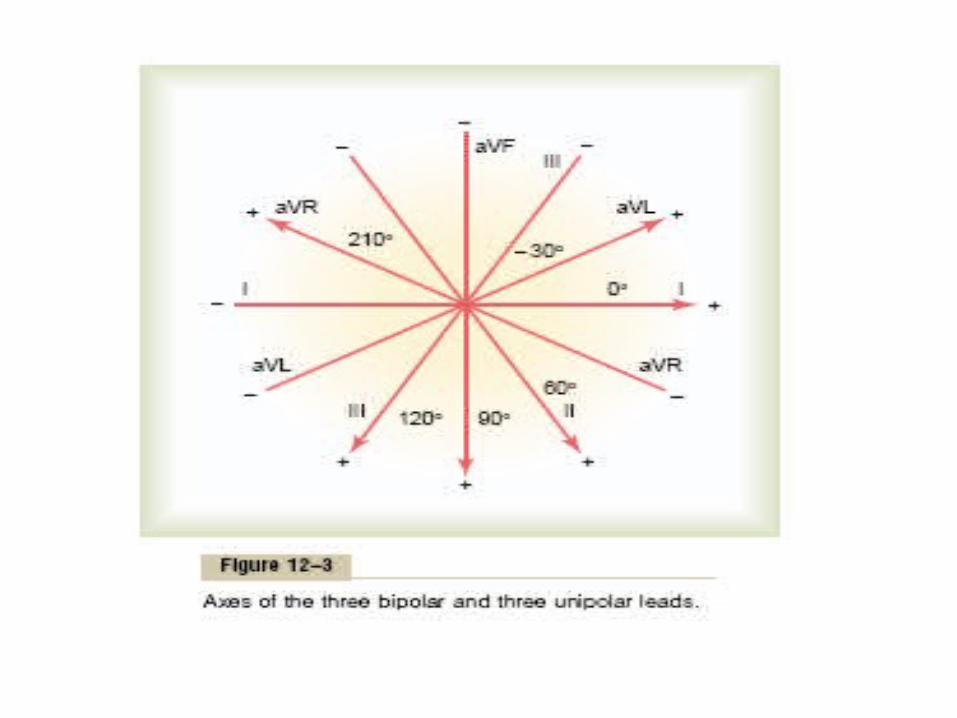
Electrocardiographic Leads
• Three Bipolar Limb Leads
• Chest Leads (Precordial Leads)
• Augmented Unipolar Limb Leads
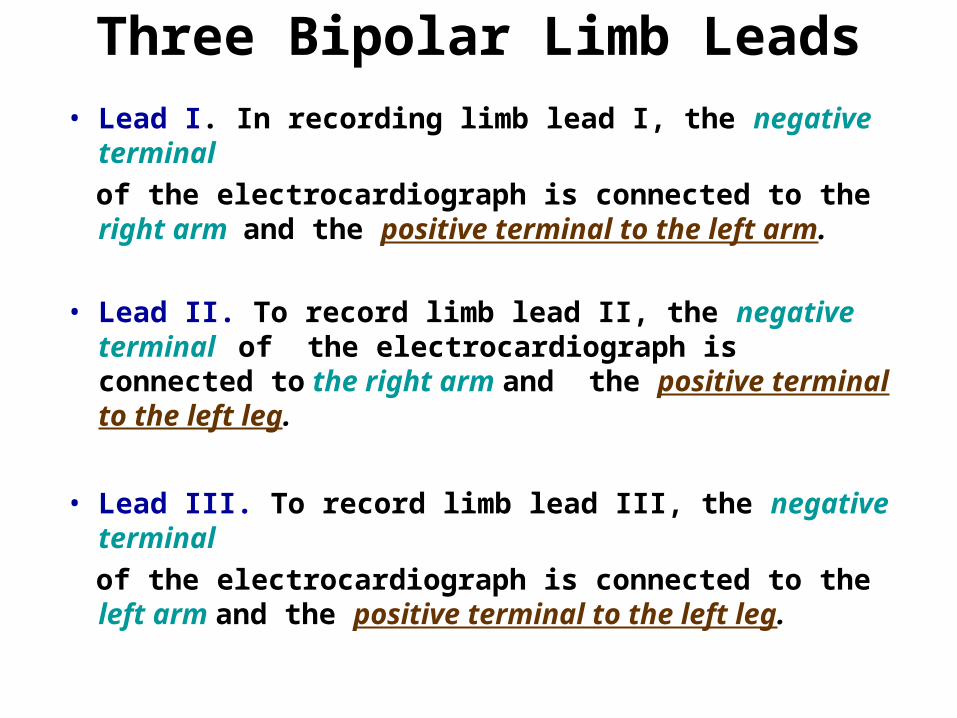
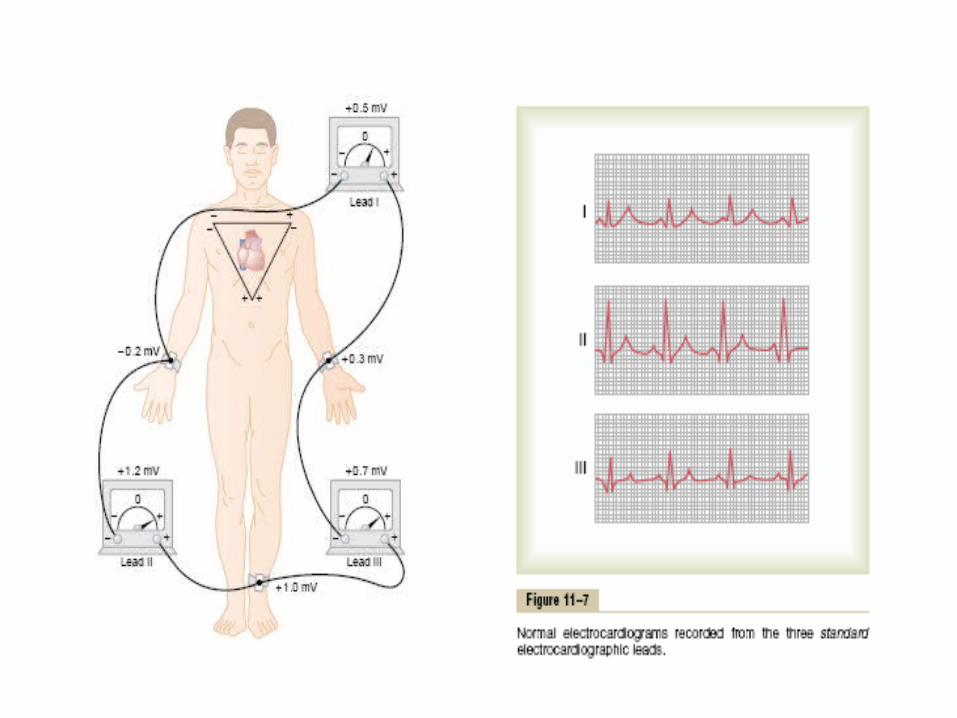
Three Bipolar Limb Leads
• Lead I. In recording limb lead I, the negative terminal
of the electrocardiograph is connected to the right arm and the positive terminal to the left arm.
• Lead II. To record limb lead II, the negative terminal of the electrocardiograph is connected to the right arm and the positive terminal to the left leg.
• Lead III. To record limb lead III, the negative terminal
of the electrocardiograph is connected to the left arm and the positive terminal to the left leg.
Chest Leads (Precordial Leads)• Often electrocardiograms are recorded with one
electrode placed on the anterior surface of the chest directly over the heart at one of the points.This electrode is connected to the positive terminal of the electrocardiograph, and the negative electrode, called the indifferent electrode, is connected through equal electrical resistances to the right arm,
left arm, and left leg all at the same time, as also shown in the figure. Usually six standard chest leads are recorded, one at a time, from the anterior chest wall, the chest electrode being placed sequentially at the six
points shown in the diagram. The different recordings are known as leads V1, V2, V3, V4, V5, and V6.
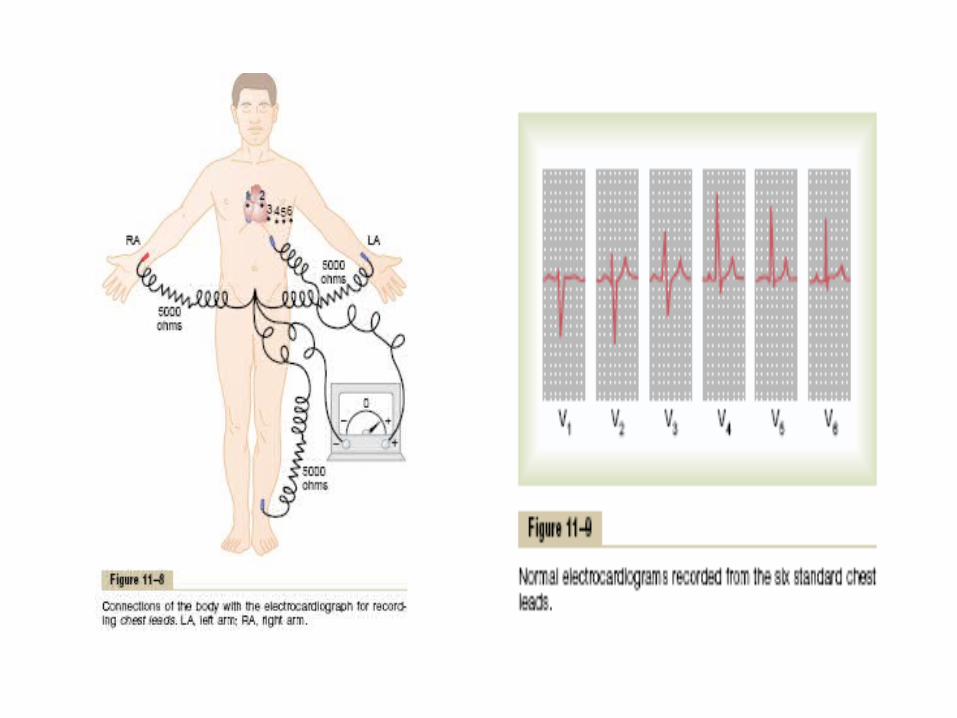
• In leads V1 and V2, the QRS recordings of the
normal heart are mainly negative because
, the chest electrode in these leads is nearer
to the base of the heart than to the apex, and the base of the heart is the direction of electronegativity during most of the ventricular depolarization process.
• the QRS complexes in leads V4,V5, and V6 are mainly positive because the chest electrode in these leads is nearer the heart apex, which is the direction of electropositivity during most of depolarization.
Augmented Unipolar Limb Leads
• Two of the limbs are connected through electrical resistances to the negative terminal of the electrocardiograph, and the third limb is connected to the positive terminal.
• When the positive terminal is on the right arm, the lead is known as the aVR lead; when on the left arm, the aVL lead; and when on the left leg, the aVF
lead.
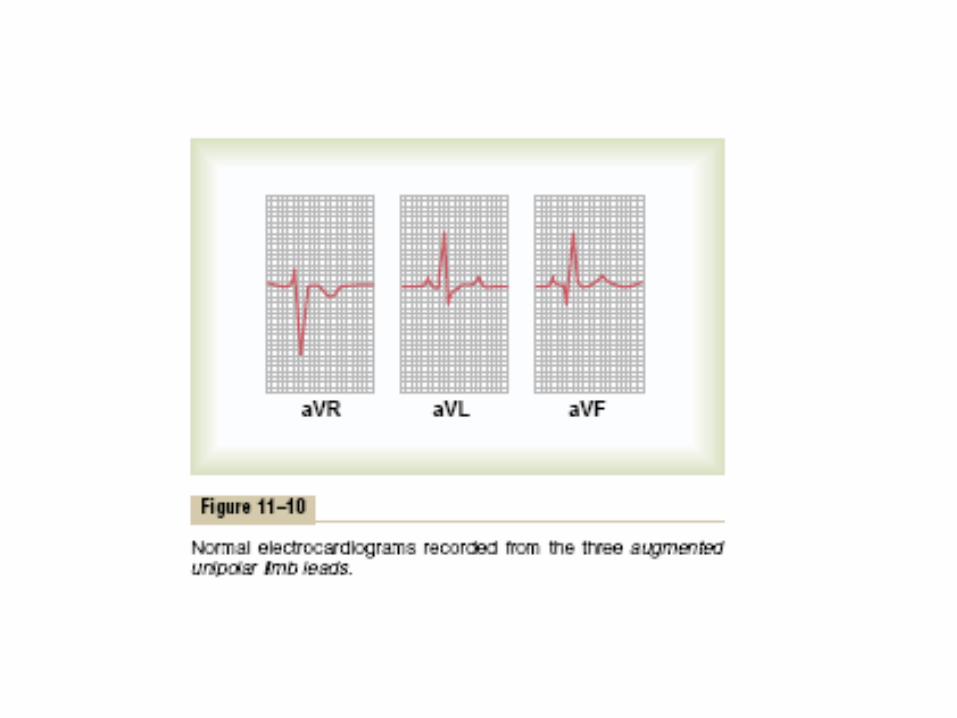
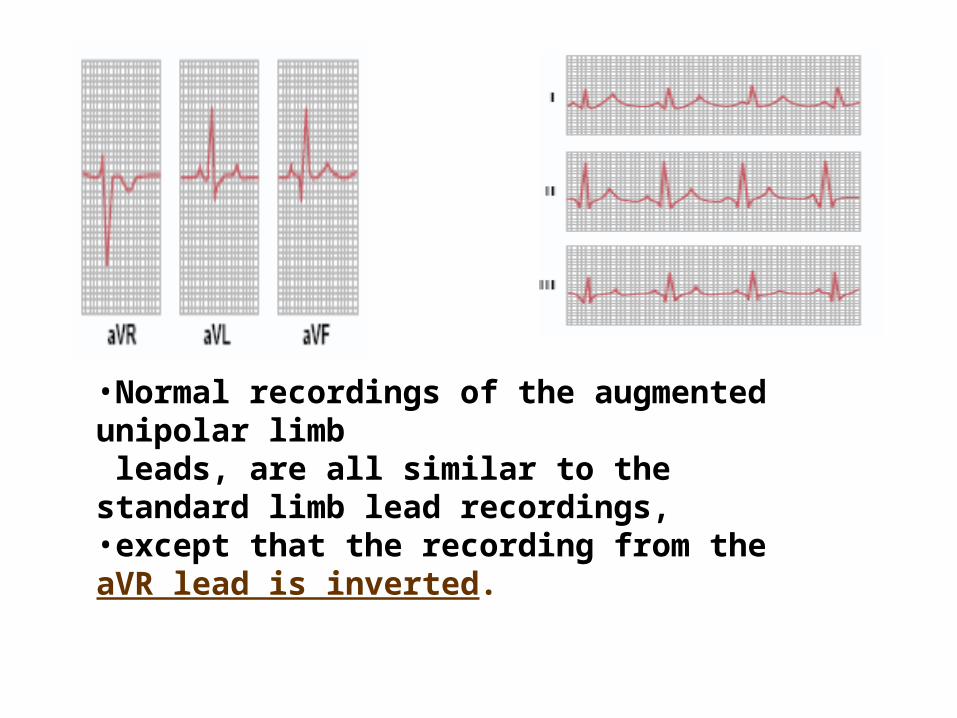
•Normal recordings of the augmented unipolar limb leads, are all similar to the standard limb lead recordings, •except that the recording from the aVR lead is inverted.
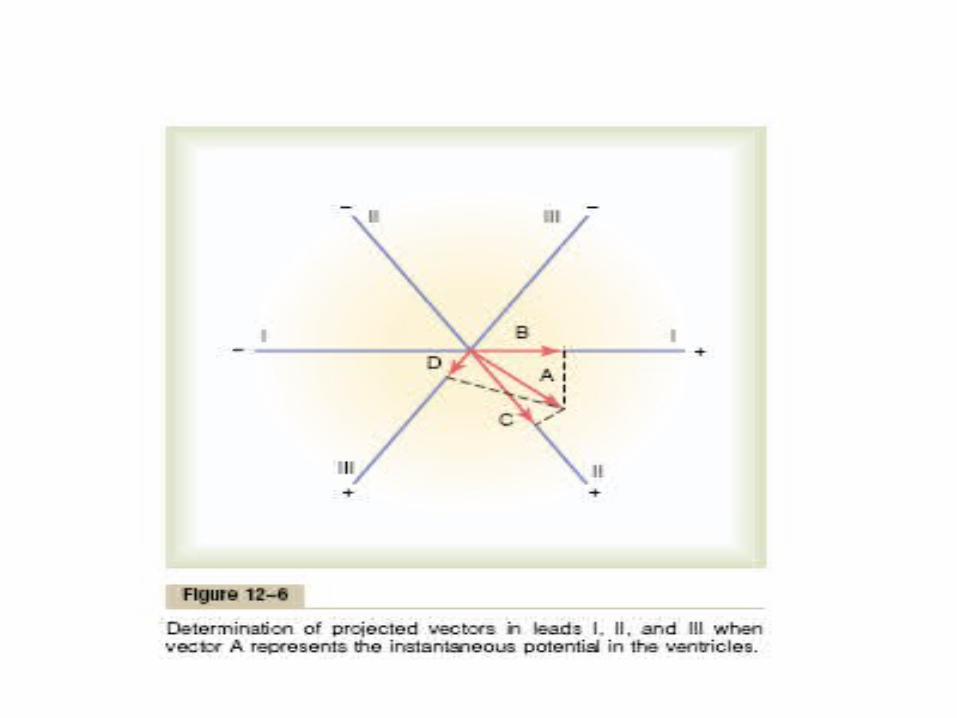
Principles of Vectorial Analysisof Electrocardiograms
• heart current flows in a particular direction in the heart at a given instant during the cardiac cycle.
• A vector is an arrow that points in the direction of the electrical potential generated by the current flow, with the arrowhead in the positive direction.
• Also, by convention, the length of the arrow is drawn proportional to the voltage of the
potential.
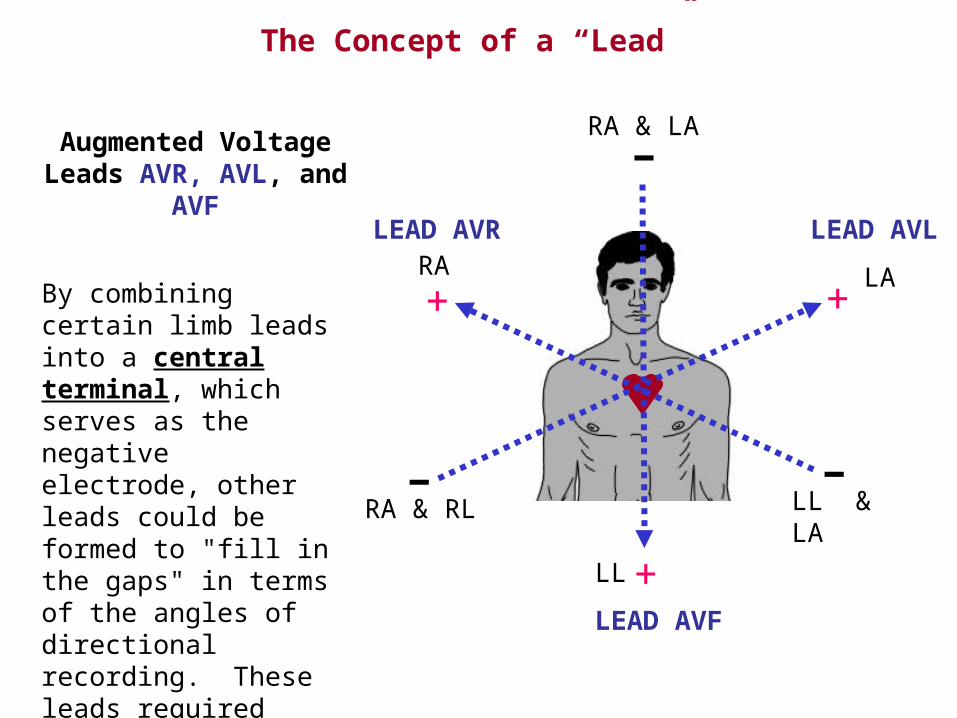
The Concept of a “Lead”
+
-
RA
RA & RL LL & LA
+
+
-LL
RA & LA
LA
LEAD AVR
-
LEAD AVL
LEAD AVF
By combining certain limb leads into a central terminal, which serves as the negative electrode, other leads could be formed to "fill in the gaps" in terms of the angles of directional recording. These leads required augmentation of voltage to be read and are thus labeled.
Augmented Voltage Leads AVR, AVL, and AVF
0o
LEAD AVR LEAD AVL
LEAD AVF
LEAD II
LEAD I
LEAD III
60o
90o120o
-30o-150o
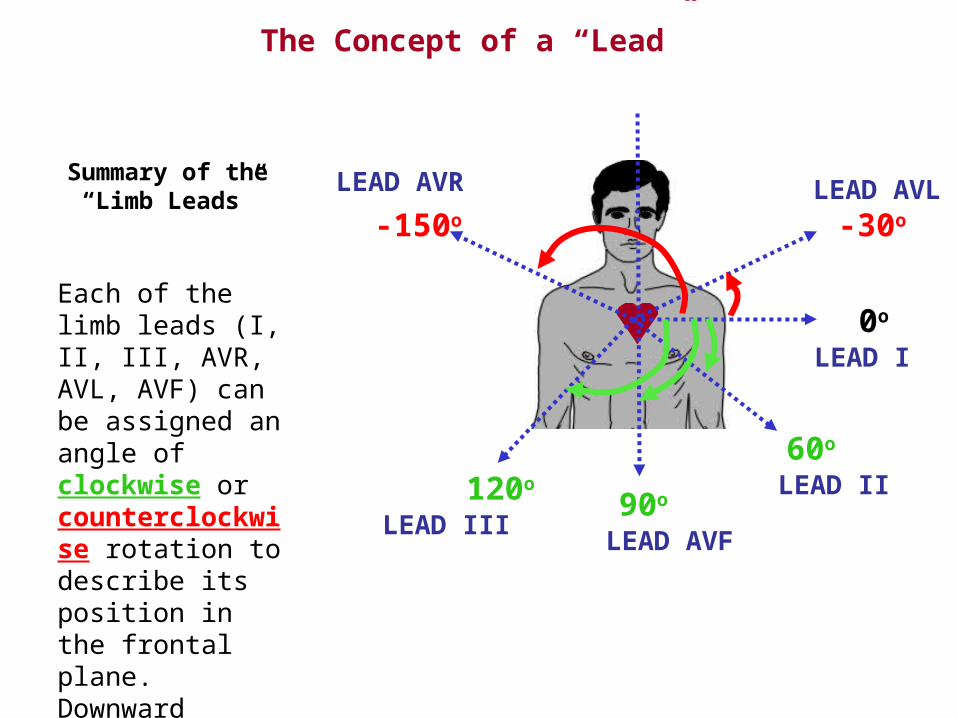
Each of the limb leads (I, II, III, AVR, AVL, AVF) can be assigned an angle of clockwise or counterclockwise rotation to describe its position in the frontal plane. Downward rotation from 0 is positive and upward rotation from 0 is negative.
The Concept of a “Lead”
Summary of the “Limb Leads”
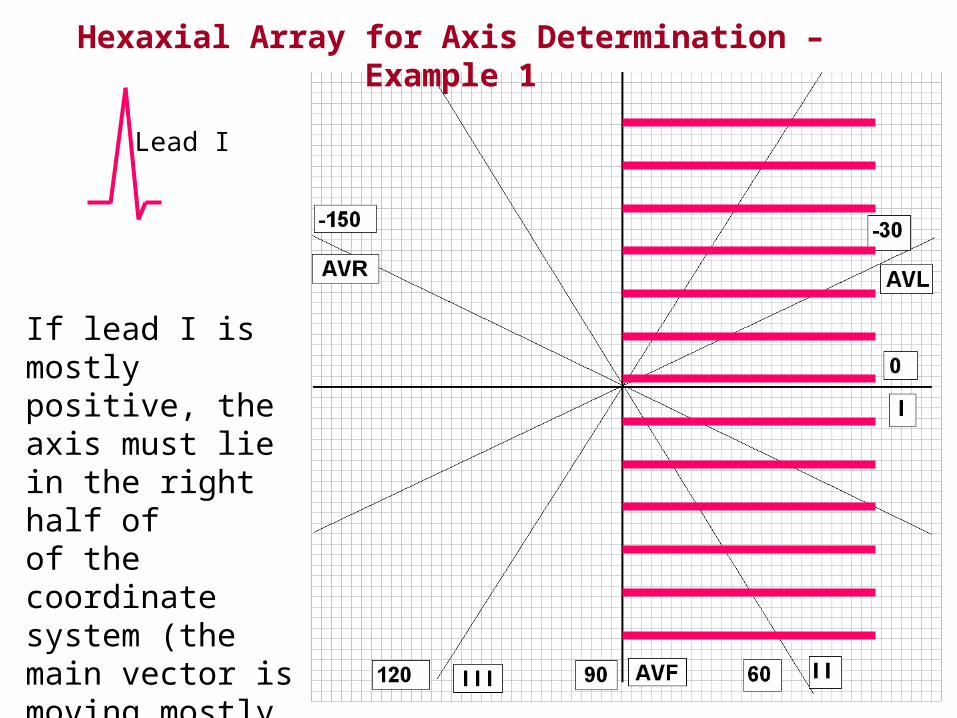
Lead I
If lead I is mostly positive, theaxis must lie in the right half ofof the coordinate system (the main vector is moving mostly toward the lead’s positive electrode)
Hexaxial Array for Axis Determination – Example 1
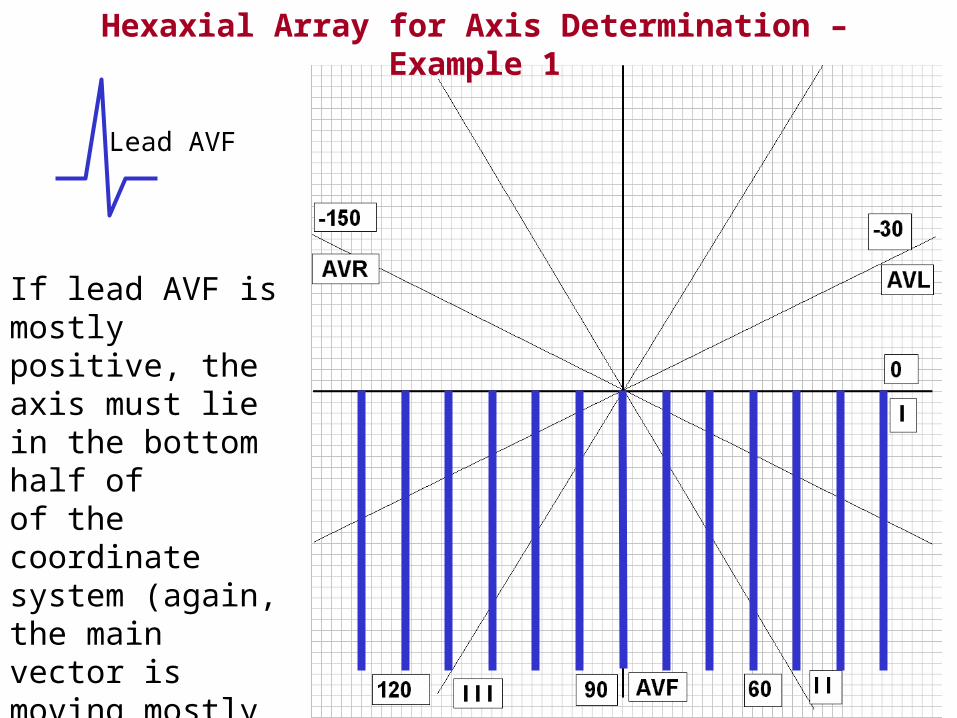
If lead AVF is mostly positive, theaxis must lie in the bottom half ofof the coordinate system (again, the main vector is moving mostly toward the lead’s positive electrode
Lead AVF
Hexaxial Array for Axis Determination – Example 1
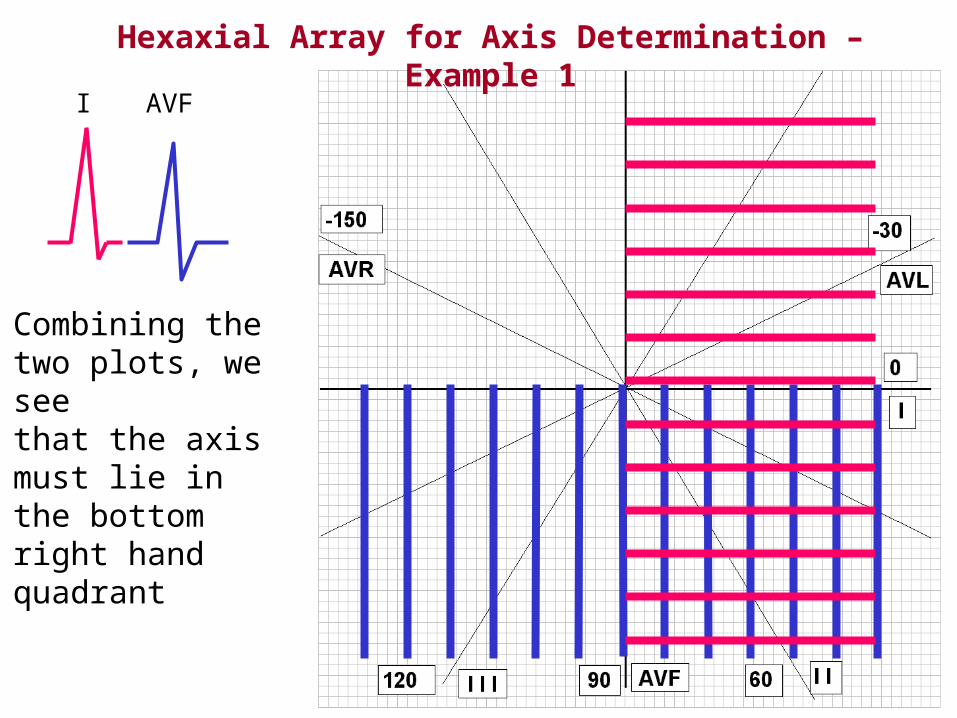
Hexaxial Array for Axis Determination – Example 1
I AVF
Combining the two plots, we seethat the axis must lie in the bottomright hand quadrant
Cardiac Physiology Electrocardiography Diagnosis
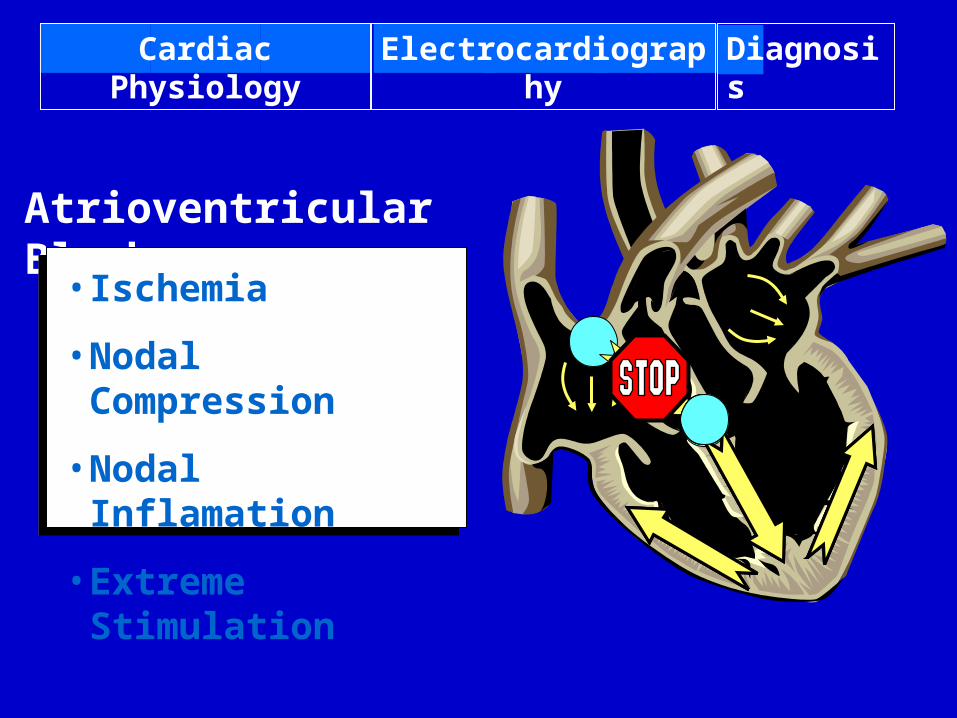
Atrioventricular Block
• Ischemia
• Nodal Compression
• Nodal Inflamation
• Extreme Stimulation
Cardiac Physiology Electrocardiography Diagnosis
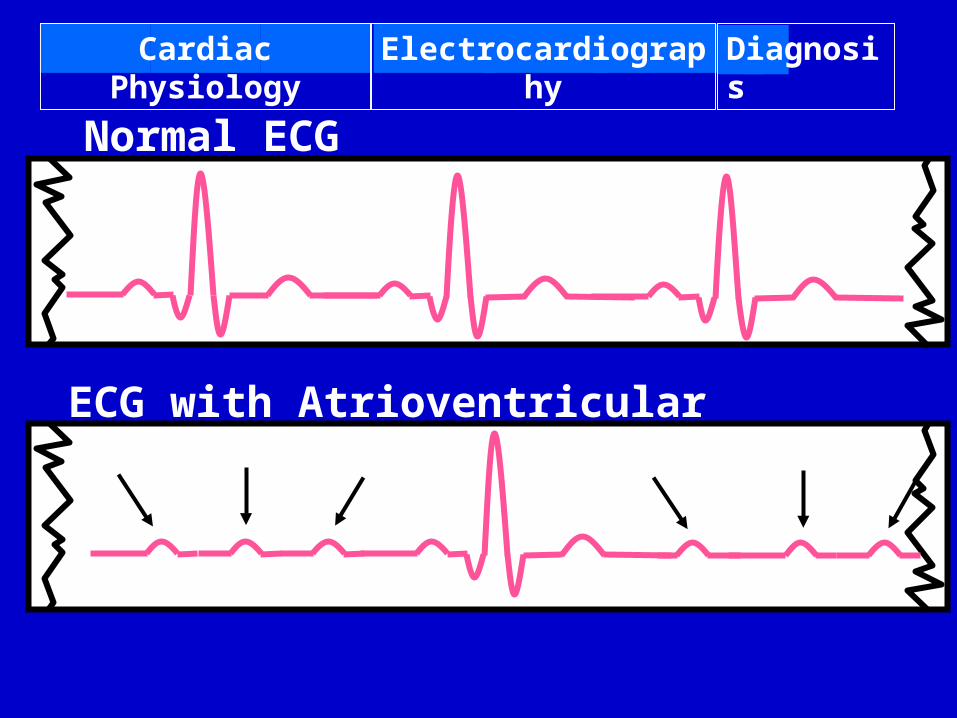
ECG with Atrioventricular Block
Normal ECG
Cardiac Physiology Electrocardiography Diagnosis
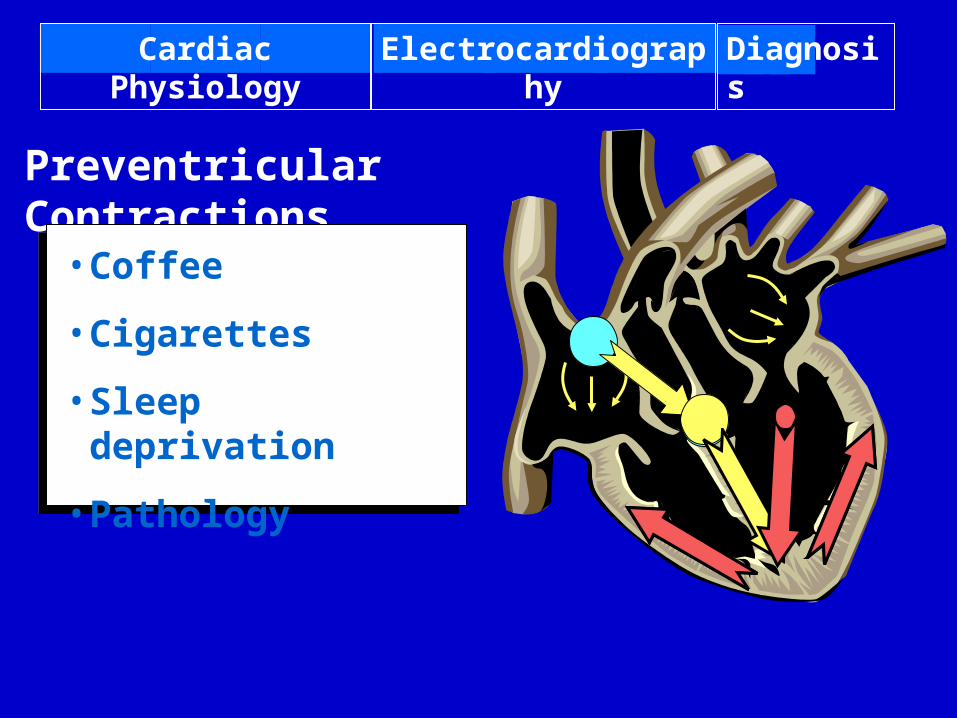
Preventricular Contractions
• Coffee
• Cigarettes
• Sleep deprivation
• Pathology
Cardiac Physiology Electrocardiography Diagnosis
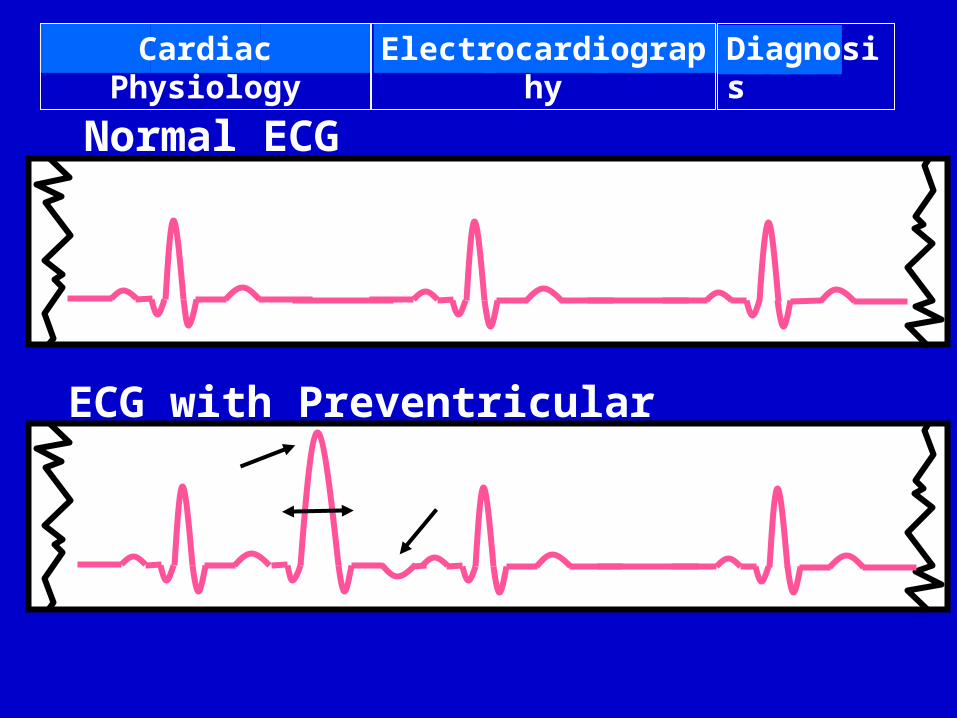
ECG with Preventricular Contractions
Normal ECG
Cardiac Physiology Electrocardiography Diagnosis
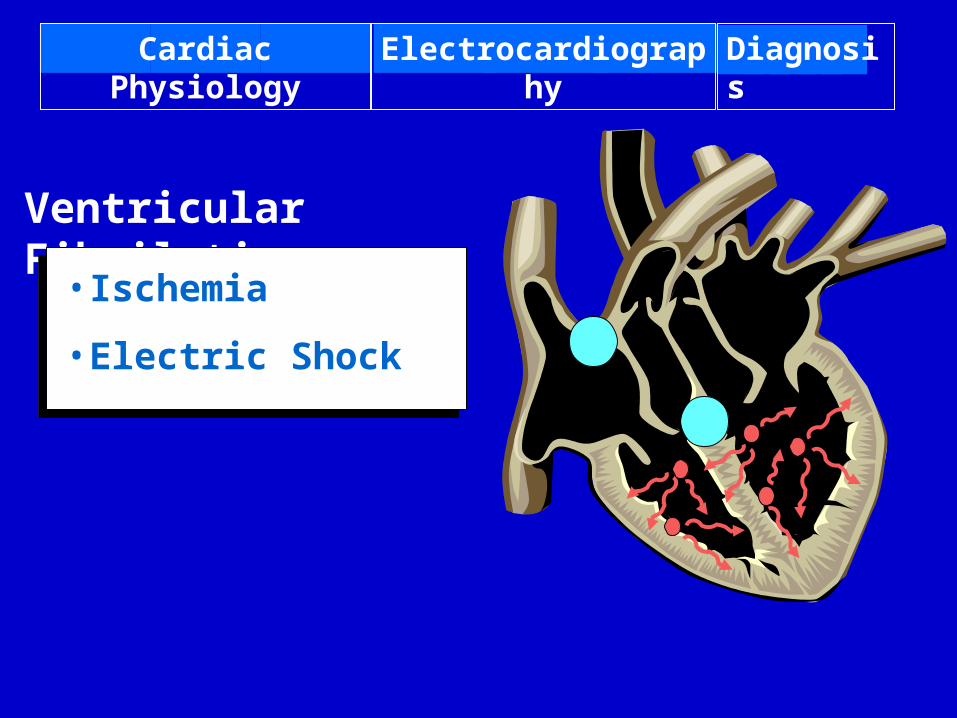
Ventricular Fibrilation
• Ischemia
• Electric Shock
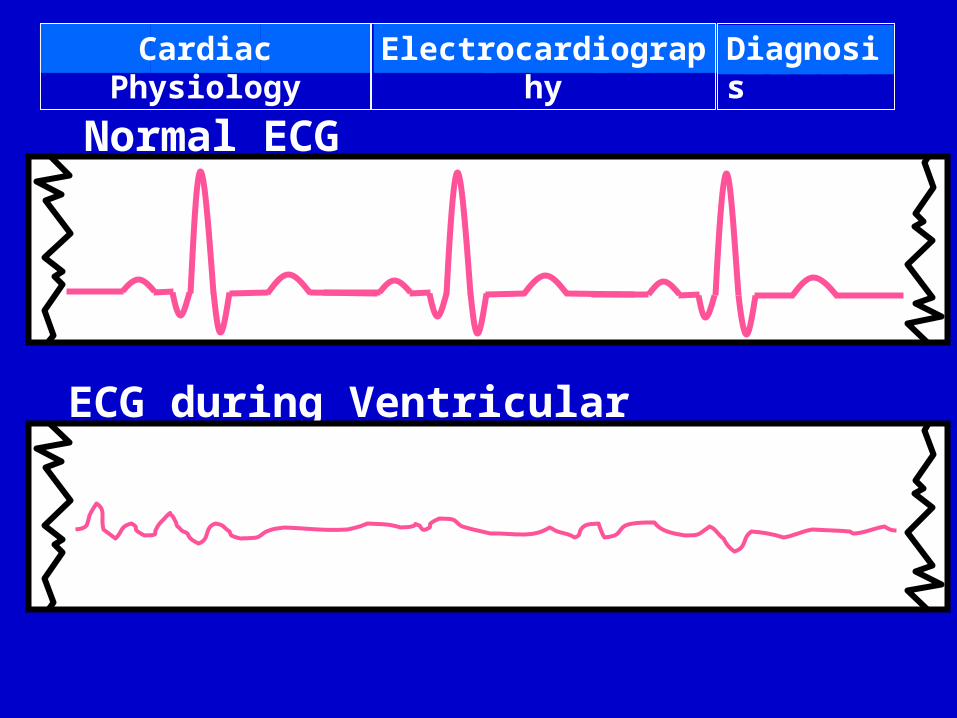
Cardiac Physiology Electrocardiography Diagnosis
ECG during Ventricular Fibrillation
Normal ECG
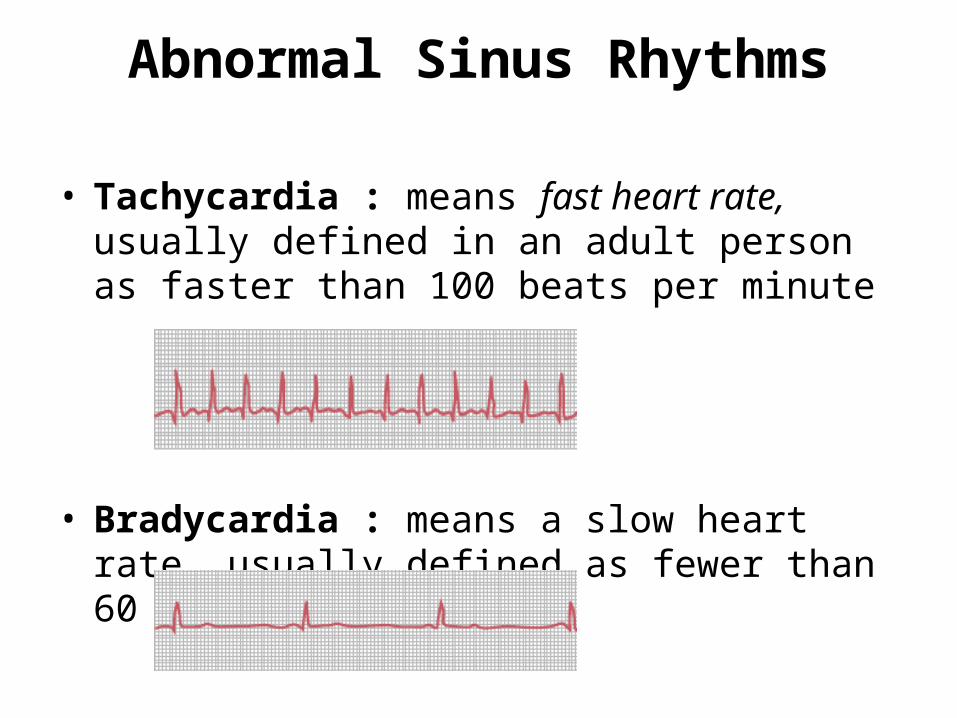
Abnormal Sinus Rhythms
• Tachycardia : means fast heart rate, usually defined in an adult person as faster than 100 beats per minute
• Bradycardia : means a slow heart rate, usually defined as fewer than 60 beats per minute.
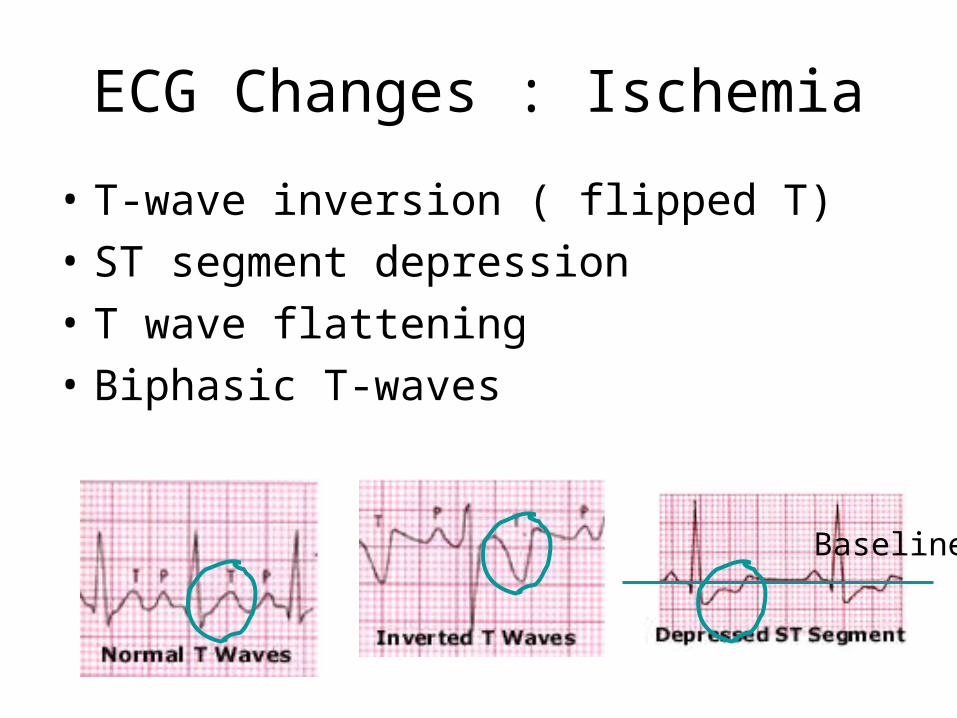
ECG Changes : Ischemia
• T-wave inversion ( flipped T)
• ST segment depression
• T wave flattening
• Biphasic T-waves
Baseline
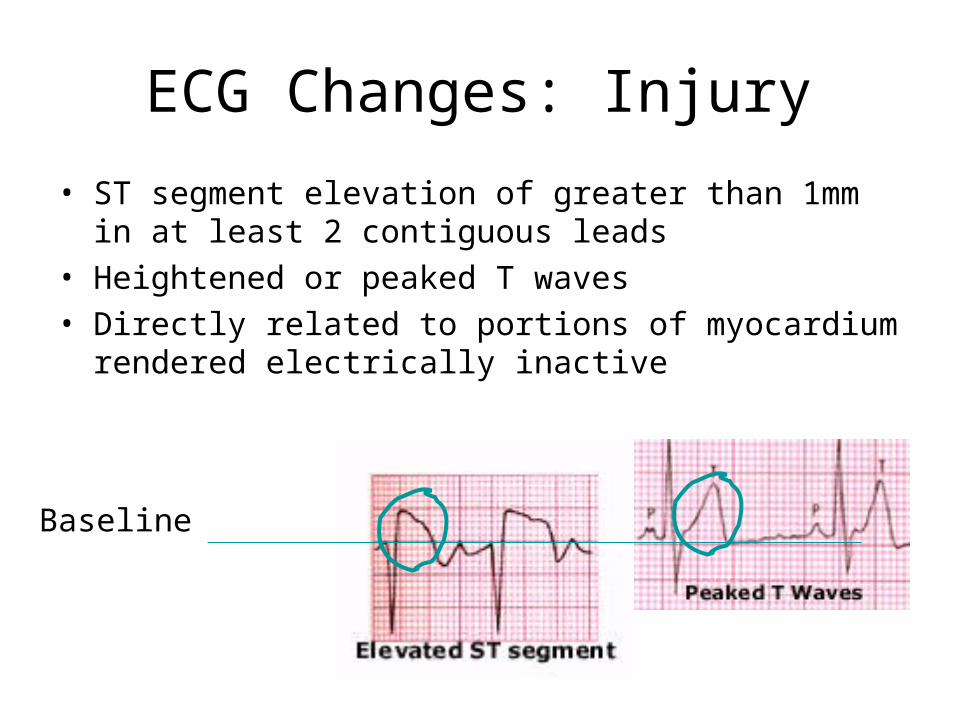
ECG Changes: Injury
• ST segment elevation of greater than 1mm in at least 2 contiguous leads
• Heightened or peaked T waves• Directly related to portions of myocardium rendered
electrically inactive
Baseline
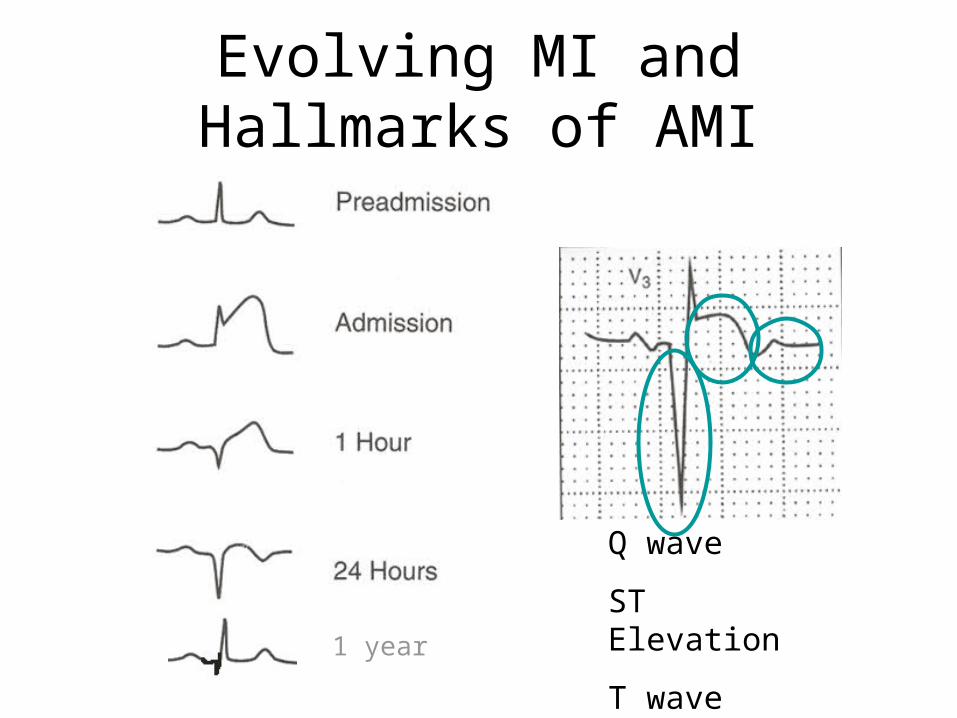
Evolving MI and Hallmarks of AMI
1 year
Q wave
ST Elevation
T wave inversion
Now…The Circuit• PreAmp
• Low Pass Filter
• High Pass Filter
Noise
• Several sources
•60Hz power lines – shielding, filtering
•Other biopotentials – filtering
•Motion artifacts – relaxed subject
•Electrode noise – high quality electrodes, good contacts
•Circuit noise – good design, good components
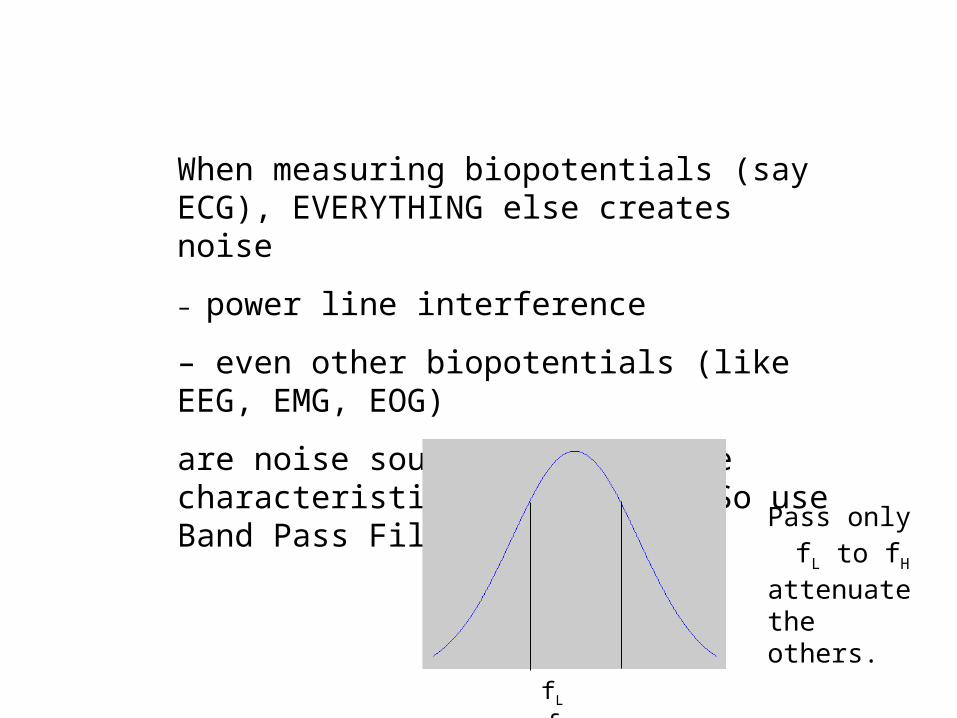
When measuring biopotentials (say ECG), EVERYTHING else creates noise
– power line interference
– even other biopotentials (like EEG, EMG, EOG)
are noise sources. These have characteristic frequencies. So use Band Pass Filters.
fL fH
Pass only
fL to fH attenuate the others.
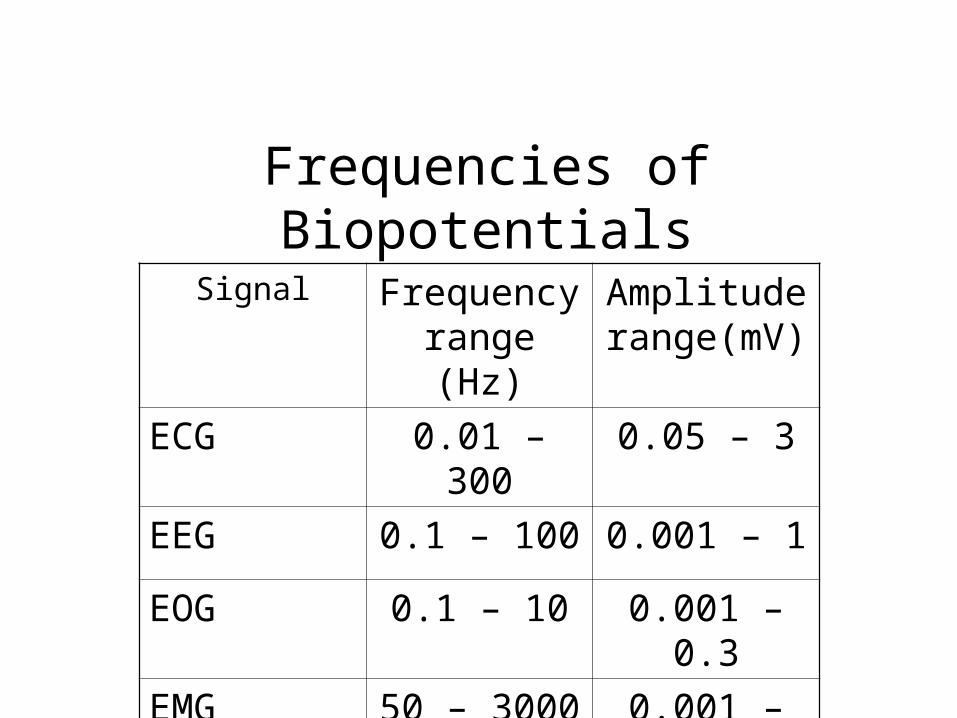
Frequencies of Biopotentials
Signal Frequency range (Hz)
Amplitude range(mV)
ECG 0.01 – 300 0.05 – 3
EEG 0.1 – 100 0.001 – 1
EOG 0.1 – 10 0.001 – 0.3
EMG 50 – 3000 0.001 – 100
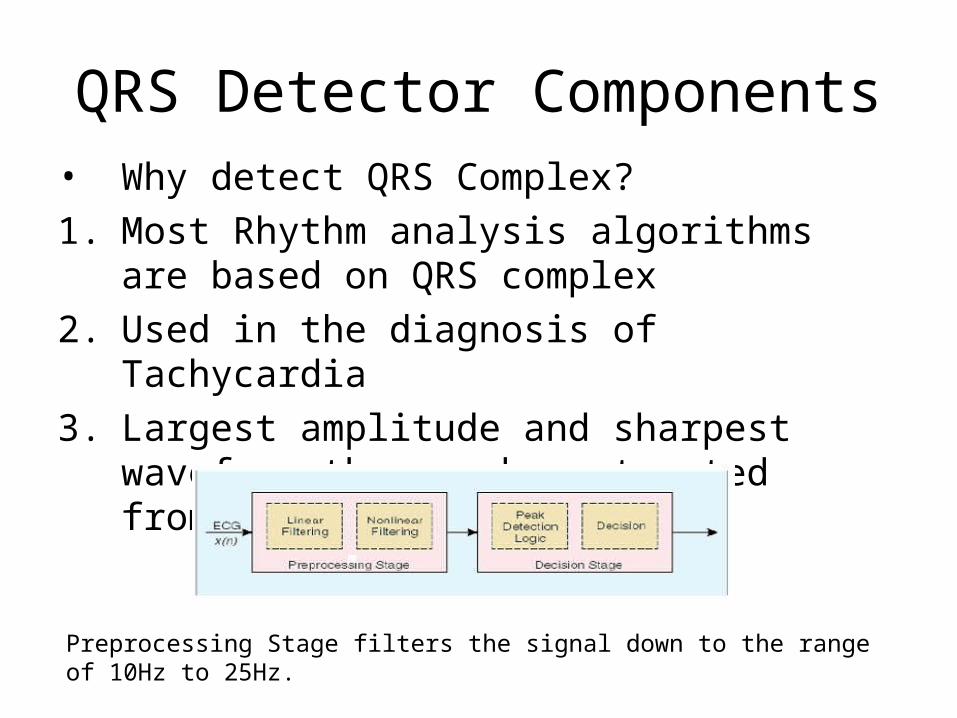
QRS Detector Components• Why detect QRS Complex?
1. Most Rhythm analysis algorithms are based on QRS complex
2. Used in the diagnosis of Tachycardia
3. Largest amplitude and sharpest waveform the can be extracted from the ECG
Preprocessing Stage filters the signal down to the range of 10Hz to 25Hz.
Activation Currents in Cardiac Tissue
• However, the electrocardiogram (ECG) is a recording of the electric potential, generated by the electric activity of the heart, on the surface of the thorax. The ECG thus represents the extracellular electric behavior of the cardiac muscle tissue.
• There are two important properties of cardiac tissue that we shall make use of to analyze the potential and current distribution associated with these propagating waves. First, cells are interconnected by low-resistance pathways (gap junctions), as a result of which currents flowing in the intracellular space of one cell pass freely into the following cell. Second, the space between cells is very restrictive (accounting for less than 25% of the total volume). As a result, both intracellular and extracellular currents are confined to the direction parallel to the propagation of the plane wavefront.
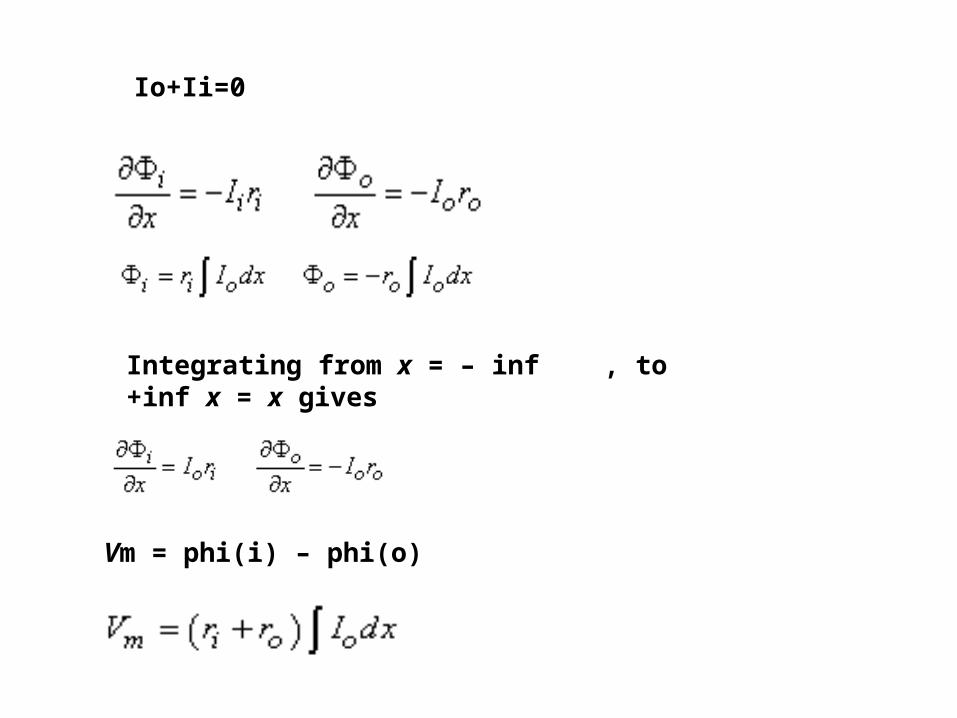
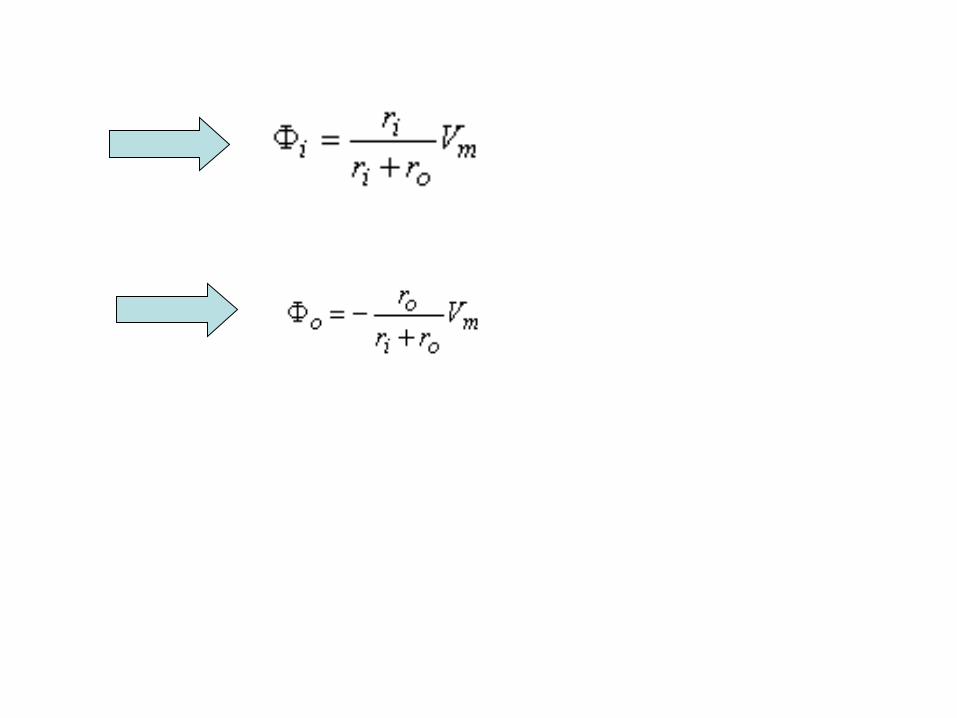
Io+Ii=0
Integrating from x = – inf , to +inf x = x gives
Vm = phi(i) – phi(o)
Thank you