Embed Size (px)
Citation preview

7/27/2019 0010lown
http://slidepdf.com/reader/full/0010lown 1/17
FRBNY Economic Pol icy Review / Oct ober 2000 39
he financial services industry has experienced significantchanges over the past two decades. Hundreds of banks
have been consolidated, restructured, or newly formed. In
addition, deregulation of where banks can operate and what
they can do has encouraged both geographic and product
diversification. The most recent aspect of this transformation
trend is the passage of the Gramm-Leach-Bliley (GLB) Act,
which loosens restrictions on banks’ abilities to engage in the
previously restricted activity of underwriting securities and
permits banks to underwrite insurance policies.
This paper examines some of the potential consequences of
GLB for the structure of the U.S. financial services industry. In
it, we ask how the industry may evolve as this new legislationinteracts with the consolidation trend already under way, what
types of mergers are most li kely to occur, and how profitable
and risky the resulting firms might be.
We begin by reviewing the consolidation trend that has
occurred within the U.S. banking industry over the past ten
years. We explore reasons for the trend, focusing on the factors
responsible for the recent pick-up in i ts pace. Consolidation
accelerated following the 1980s deregulation of restr ictions that
prohibited bank expansion across geographic markets and into
other financial services. If history is any guide, we ought to see
further consolidation following the passage of GLB. Stock price
reaction to its passage suggests that market participants also
anticipate more financial consolidation, especially in the li fe
insurance business.
We then test whether better diversification post-GLB canimprove the risk-return trade-off faced by financial companies.
We do so by constructing hypothetical, pro-forma mergers
between bank holding companies (BHCs) and fi rms in each of
the other three major financial services industr ies: life
insurance, property and casualty insurance, and securi ties. The
results suggest that, ceteris paribus, mergers between BHCs and
life insurance fi rms will produce firms that are less risky (and
no less profitable) than those in either of the two individual
industries. Mergers between BHCs and either securi ties fi rms
or property and casualty firms raise BHCs’ risk measures only
slightly. Similar to the analysis of stock returns, these results
point most strongly to combinations of banks and lifeinsurance companies.
As a final step, we review how the financial services industry
has evolved in Europe. A European bank’s ability to expand
into other financial activities, unlike that of a U.S. bank, is
relatively unrestricted. In recent years, these banks have made
significant inroads in the li fe insurance industry. By examining
these advances, we can better understand the role of scope
economies in the banking industry’s evolution, something we
cannot infer from the pro-forma data analysis.
Overall, our findings point to continued consolidation
among financial firms. The consolidation trend within the
banking industry wil l li kely continue as banks respond further
to the elimination of prior restrictions. Moreover, the recent
elimination of barriers preventing banks from engaging fully in
Cara S. Lown, Carol L. Osler, Philip E. Strahan, and Amir Sufi
The authors thank Ar turo Estrella, João Santos, and Kevin Sti roh for helpful
comments and David Fiore for excellent research assistance. The views
expressed are those of the authors and do not necessarily reflect the positionof the Federal Reserve Bank of New York or the Federal Reserve System.
Th e Ch anging Landscapeof t h e Financial Ser vicesIndust r y: Wh at Lies Ah ead?
Cara S. Lown is a research officer, Carol L. Osler a senior economist, Philip E.
Strahan a vice president, and Amir Sufi an assistant economist at the Federal
Reserve Bank of New York.
T

7/27/2019 0010lown
http://slidepdf.com/reader/full/0010lown 2/17
40 Th e Ch a n gin g La n dsc ape of t h e Fin a nc ia l Ser v ic es In d ust r y
securities underwri ting and insurance wil l allow them to take
advantage of both diversification and economy-of-scope
benefits as they expand into these industries.
Recent Consol idat ion Tr endsin a Decade of Ch ange
Several hundred bank mergers and acquisitions (M&As) have
occurred each year over the past two decades. However, during
the past decade, megamergers—M&As between institutions
with assets of more than $1 bil lion each—have occurred much
more frequently. Most recently, M&As in the United States and
elsewhere have increased dramatically in size; such activity
between institutions with assets in excess of $100 billion has
become almost commonplace. Based on market value, nine of
the ten largest M&As in U.S. history were announced during
1998, and four of these—Citicorp-Travelers, BankAmerica-NationsBank, Banc One-First Chicago, and Norwest-Wells
Fargo—occurred in banking (Moore and Siems 1998). I n 1999,
the pace of these megamergers slowed considerably (not one
was announced in the United States), perhaps because market
parti cipants were wait ing for resolut ion of the debate on
financial services modernization.
As a result of the rapid M&A activity, the number of banks
and banking organizations (stand-alone banks and top-tier
bank holding companies) each fell by about 40 percent between
1989 and 1999 (Table 1). The share of total nationwide assets
held by the eight largest banking organizations nearly doubled
over this period, rising from 21.3 percent to 41.5 percent.1 Atthe same time that large banks’ market share was increasing,
the market shares and profitability of very small and small
banking organizations—defined as having total assets of less
than $50 million and between $50 mil li on and $300 million,
respectively—fell sharply. As Table 1 indicates, over the 1989-
99 period, the share of domestic assets held by small banking
organizations fell from 12.3 percent to 9.0 percent, while the
share of assets held by very small banking organizations
dropped from 3.3 percent to 1.6 percent. The decline in market
share may have occurred because small banks’ profits relative
to those of their larger competitors declined. Before 1992, for
example, the largest 100 banks (ranked by assets) consistentlyearned lower returns per dollar of equity than banks outside
the top 100. After 1992, the largest 100 banks consistently
outperformed smaller banks (Bomfim and Nelson 1999).2
Similarly, after 1992, banks ranked between the 100th and
Tabl e 1
Concentration, Ownership, and Number of Firms in the Commercial Banking Industry
Asset Share (Percent)
Year
Number of U.S. Bank
Charters
Number of Banking
Organizations
Number of Offices
in Banks Plus Thrif ts
Eight Largest Banking
Organizations
Very Small Banking
Organizations
Small Banking
Organizations
1989 12,728 9,620 84,388 21.3 3.3 12.3
1990 12,370 9,391 84,375 21.3 3.3 12.5
1991 11,950 9,167 83,484 23.7 3.2 12.8
1992 11,495 8,871 81,204 23.6 3.1 12.9
1993 11,001 8,445 80,758 24.8 2.8 12.4
1994 10,488 8,017 81,677 26.3 2.6 11.6
1995 9,983 7,680 81,900 30.0 2.3 11.1
1996 9,576 7,415 83,052 31.3 2.1 10.7
1997 9,216 7,225 84,291 35.2 1.8 10.0
1998 8,846 6,943 85,190 35.0 1.6 9.1
1999 8,698 6,852 86,527 41.5 1.6 9.0
Sources: Reports of Condi ti on and Income; National Information Center (1989-99); FDIC H istori cal Stati sti cs on Banking .
Notes: A banking organization is a top-t ier bank holding company or a stand-alone bank. The figures for 1999 are as of the second quarter; all other f igures
are as of year-end. A very small banking organization is one with total banking assets of less than $50 mill ion in 1997 dollars; a small banking organization is
one with assets between $50 mil lion and $300 mill ion in 1997 dollars.

7/27/2019 0010lown
http://slidepdf.com/reader/full/0010lown 3/17
FRBNY Economic Pol icy Review / Oct ober 2000 41
1,000th largest consistently outperformed banks outside the
largest 1,000.
One can point to four key factors that contr ibuted to the fast
pace of M&A activity. First, profitability and high stock prices
in banking during the mid-to-late 1990s may have relaxed
financing constraints on this activity. Second, banks have been
losing market share to competing financial insti tutions on both
sides of the balance sheet since the end of the 1970s.Consolidation provides an efficient way to eliminate the excess
capacity that has arisen in response to the emergence of
nonbank financial institutions. Third, sophisticated financial
technologies such as derivatives contracts, off-balance-sheet
guarantees, and r isk management may be more eff iciently
produced by larger insti tut ions. Finally, the deregulation of
restr ictions on banks’ ability to expand geographically was
relaxed in the 1980s and early 1990s. With a series of removals
of restr ictions on intrastate and interstate banking, concluding
with the Riegle-Neal Interstate Banking and Branching
Efficiency Act of 1994, interstate branching was permitted in
almost all states.3 The removal of these constraints allowed
some previously prohibi ted M&As to occur.4
Expan sion of Ban k Power s Pr iort o Gr amm-Leach -Bl il ey
Regulatory restr ictions in the United States had prohibi ted
bank involvement in underwri ting, insurance, and other
“nonbank” activiti es since the Banking Act of 1933, sections of
which became known collectively as the Glass-Steagall Act.5
Subsequent measures in 1956 and 1970 strengthened the
demarcation between banks, insurance companies, and
securities firms. BHCs were allowed to underwrite certain
eligible securities, including general obligation bonds, U.S.
government bonds, and real estate bonds, which were
exempted from the original Act. But it was not until the mid-
1980s that the Federal Reserve and the Office of the
Comptroller of the Currency (OCC) began loosening
restr ictions on greater bank part icipation in investment
banking and in insurance. (See Table 2 for an historical
summary of recent deregulatory efforts.)
The Federal Reserve began the deregulatory push for BHC
activity in securi ties with a decision in 1987 to allow subsidiaries
of a small group of holding companies to underwri te certain
previously prohibited securities—such as municipal revenue
bonds, commercial paper, and mortgage-related securities—
on a limited basis. The Federal Reserve derived legal authori ty
for the decision from a clause in Section 20 of the 1933 Banking
Act that prohibits banks from affiliating with a company
“engaged principally” in underwriting or dealing securities.
The Federal Reserve contended that the “engaged principally”
clause allowed BHC subsidiaries to underwri te these“ ineligible
securities” as long as the revenue from such underwritings did
not exceed 5 percent of the subsidiary’s gross revenue.
In January 1989, the Federal Reserve also allowed the
“Section 20 subsidiaries” to underwrite corporate debt andequity securities contingent on the 5 percent revenue
limitation. The Federal Reserve continued its incremental
lifting of restrictions by increasing the revenue limit on
Tabl e 2
Summary of Important Dates P rior to the P as sa ge
of G ramm-Leac h-Bliley
Date Description
April 30, 1987 Federal Reserve authorizes limited underwriting
activity for Bankers Trust, J. P. Morgan, and
Citicorp, with a 5 percent revenue limit on
Section 20 ineligible securi ties activit ies.
January 18, 1989 Federal Reserve expands Section 20 underwrit ing
permissibility to corporate debt and equity
securi ties, subject to revenue limi t.
September 13, 1989 Federal Reserve raises limit on revenue from
Section 20 ineligible securi ties activit ies from
5 percent to 10 percent.
Jul y 16, 1993 Cour t r uli ng i n Independent Insurance Agents
of America v. Ludwig allows national banks to sell
insurance from small towns.
January 18, 1995 Court ruling inNat ionsbank v. Valic allows banks
to sell annui ti es.
March 26, 1996 Court rul ing inBarnett Bank v. Nelson overturns
states’ restrictions on banks’ insurance sales.
October 30, 1996 Federal Reserve announces the elimination
of many firewalls between bank and nonbank
subsidiaries within bank holding companies
(BHCs).
December 20, 1996 Federal Reserve raises limi t on revenue from
Section 20 ineligible securi ties activit ies from
10 percent to 25 percent.
August 22, 1997 Federal Reserve eliminates many of the remaining
firewalls between bank and nonbank subsidiar-
ies within BHCs.
April 6, 1998 Citicorp and Travelers Group announce merger
initiating a new round of debate on financial
reform.
Sources: Mester (1996); Bhargava and Fraser (1998); Boyd and Graham
(1986, 1988); Ely and Robinson (1998, 1999).

7/27/2019 0010lown
http://slidepdf.com/reader/full/0010lown 4/17
42 Th e Ch a n gin g La n dsc ape of t h e Fin a nc ia l Ser v ic es In d ust r y
0
0.05
0.10
0.15
0.20
0.25
0.30
98979695941993
Char t 1
S ection 20 Subs idiaries of B a nk HoldingCo mpa nies : S hare of the Se curities Industry
Percent
Sources:Securi ti es Industr y Factbook (1999); Federal ReserveY-20 reports.
Notes: The numerator represents the total revenue and underwritingrevenue reported by Section 20 subsidiaries. The denominatorrepresents the total revenue and underwriting revenue of thesecurities industry. The denominator is calculated from annualrevenue data of New York Stock Exchange (NYSE) member securitiesfirms, and then expanded by dividing by the percentage of totalindustry revenue held by NYSE members. These firms represent onaverage 68 percent of the total industry over the sample period. Weassume that the NYSE member firms’ percentage of underwri tingrevenue approximates the percentage of total revenue.
Revenue
Underwritingrevenue
7
9
11
13
15
17
19
21
23
0.0035
0.0040
0.0045
0.0050
0.0055
0.0060
0.0065
0.0070
0.0075
999897961995
Char t 2
Annuity S a les by B anks
Billions of dollars
Source: Authors’ calculations, based on Reports of Condition
and Income.
Note: Annuity sales were not reported prior to 1995.
Ratio of annuitysales to deposits
Ratio
Scale
Scale
Annuity sales
Section 20 subsidiaries to 10 percent in September 1989 and to
25 percent in December 1996. Also in 1996, the Federal Reserve
began contemplating the elimination of previously instituted
“ firewalls” between bank and nonbank activity within the
subsidiary structure of a BHC. The fi rewalls had been instituted
originally to insulate bank subsidiaries from more risky
nonbank subsidiaries.6 In 1997, the majority of the barriers
were removed.While the Federal Reserve oversaw BHC expansion into
securi ties, OCC rulings backed by the federal courts loosened
restrictions on national banks’ insurance activity. Prior to
1986, state insurance regulators imposed limitations on
national banks’ insurance sales and underwriting. That year,
the OCC argued that a previously overlooked section of the
1917 National Bank Act (Section 92) allowed a national bank to
sell insurance anywhere under the condition that one of i ts
branches be located in a town with less than 5,000 people. In
1993, a U.S. Court of Appeals ruli ng upheld the OCC decision.
State regulators continued fighting the Court decision until a
1996 U.S. Supreme Court ruling upheld i t. The decision forced
state legislatures to level the playing field by passing new laws
allowing both national and state-chartered banks to sell
insurance through subsidiaries or directl y through bank
branches. National banks won another victory in an unrelated
1995 U.S. Supreme Court decision, when the Court ruled that
state law could not prohibit the sale of annuities by national
banks. The Court maintained that both f ixed and variable
annuities were analogous to activities of savings banks and
therefore were not subject to the state’s jurisdiction over
insurance.
As the regulations were modified, banks began a notableexpansion into nonbank financial products. BHCs, through
their Section 20 subsidiaries, began to capture a significant
portion of the securities market. In fact, BHCs increased their
share of the securities industry’s total revenue from 9 percent
to more than 25 percent in just six years (Chart 1). Section 20
subsidiaries also made significant inroads in underwri ting,
especially after the 1996 loosening of the “ ineligible” under-
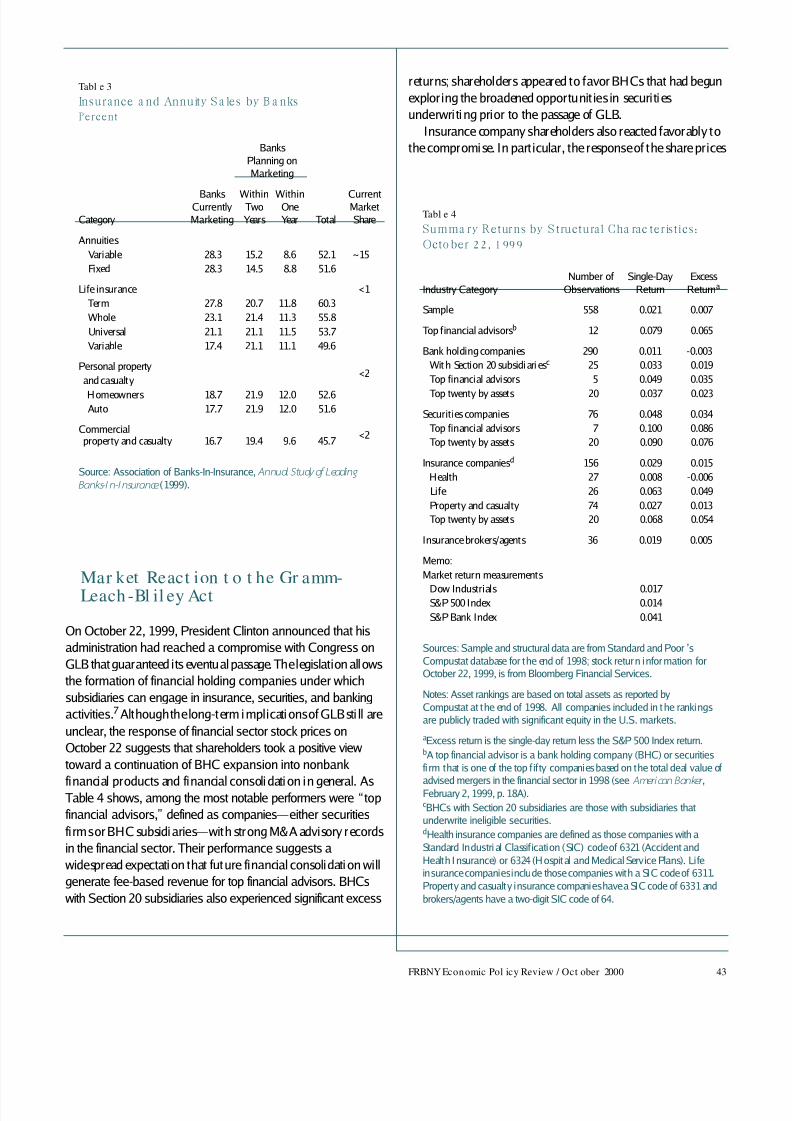
writing revenue restriction. Bank annuity sales also increased
rapidly (Chart 2), and evidence from a study by the Association
of Banks-In-Insurance (ABI) suggests that banks accounted
for approximately 15 percent of the total annuities sales
nationwide (Table 3). This same study indicates that banks stillrepresent a small portion of insurance sales, however, it also
suggests that an increasing number of banks will begin
marketing insurance products over the next two years.
Despite increasing revenue for BHCs in nonbank financial
products, the regulatory environment prior to GLB continued
to impose limitations on expansion across financial sectors.
The passage of the Gramm-Leach-Bliley Act therefore was a
major event in the deregulatory process, removing almost
entirely the remaining barriers separating banks, securities
firms, and insurance companies.
7/27/2019 0010lown
http://slidepdf.com/reader/full/0010lown 5/17
FRBNY Economic Pol icy Review / Oct ober 2000 43
Mar ket React ion t o t he Gr amm-Leach -Bl il ey Act
On October 22, 1999, President Clinton announced that his
administration had reached a compromise with Congress on
GLB that guaranteed its eventual passage. The legislation allows
the formation of financial holding companies under which
subsidiaries can engage in insurance, securities, and banking
activities.7Although the long-term implications of GLB sti ll are
unclear, the response of financial sector stock prices on
October 22 suggests that shareholders took a positive view
toward a continuation of BHC expansion into nonbank
financial products and financial consolidation in general. AsTable 4 shows, among the most notable performers were “ top
financial advisors,” defined as companies—either securities
firms or BHC subsidiaries—with strong M&A advisory records
in the financial sector. Their performance suggests a
widespread expectation that future financial consolidation will
generate fee-based revenue for top financial advisors. BHCs
with Section 20 subsidiaries also experienced significant excess
returns; shareholders appeared to favor BHCs that had begun
exploring the broadened opportunities in securities
underwri ting prior to the passage of GLB.
Insurance company shareholders also reacted favorably to
the compromise. In particular, the response of the share prices
Tabl e 3
Insurance a nd Annuity S a les by B a nks
Percent
Banks
Planning on
Marketing
Category
BanksCurrently
Marketing
WithinTwo
Years
WithinOne
Year Total
CurrentMarket
Share
Annuities
Variable 28.3 15.2 8.6 52.1 ~15
Fixed 28.3 14.5 8.8 51.6
Life insurance <1
Term 27.8 20.7 11.8 60.3
Whole 23.1 21.4 11.3 55.8
Universal 21.1 21.1 11.5 53.7
Variable 17.4 21.1 11.1 49.6
Personal property
and casualty<2
Homeowners 18.7 21.9 12.0 52.6Auto 17.7 21.9 12.0 51.6
Commercialproperty and casualty 16.7 19.4 9.6 45.7
<2
Source: Association of Banks-In-Insurance, Annual Study of Leading
Banks-In-Insurance (1999).
Tabl e 4
Summa ry Returns by S tructural Cha rac teristics:
Octo ber 22, 1999
Industry Category
Number of
Observations
Single-Day
Return
Excess
Returna
Sample 558 0.021 0.007
Top financial advisorsb 12 0.079 0.065
Bank holding companies 290 0.011 -0.003
Wit h Section 20 subsidiari esc 25 0.033 0.019
Top financial advisors 5 0.049 0.035
Top twenty by assets 20 0.037 0.023
Securities companies 76 0.048 0.034
Top financial advisors 7 0.100 0.086
Top twenty by assets 20 0.090 0.076
Insurance companiesd 156 0.029 0.015
Health 27 0.008 -0.006
Life 26 0.063 0.049
Property and casualty 74 0.027 0.013
Top twenty by assets 20 0.068 0.054
Insurance brokers/agents 36 0.019 0.005
Memo:
Market return measurements
Dow Industrials 0.017S&P 500 Index 0.014
S&P Bank Index 0.041
Sources: Sample and structural data are from Standard and Poor ’s
Compustat database for the end of 1998; stock return information forOctober 22, 1999, is from Bloomberg Financial Services.
Notes: Asset rankings are based on total assets as reported by
Compustat at the end of 1998. All companies included in the rankings
are publicly traded with significant equity in the U.S. markets.
aExcess return is the single-day return less the S&P 500 Index return.bA top financial advisor is a bank holding company (BHC) or securities
fi rm that is one of the top f ifty companies based on the total deal value of
advised mergers in the financial sector in 1998 (seeAmerican Banker ,February 2, 1999, p. 18A).cBHCs with Section 20 subsidiaries are those with subsidiaries that
underwrite ineligible securities.dHealth insurance companies are defined as those companies with a
Standard Industri al Classif ication (SIC) code of 6321 (Accident and
Health Insurance) or 6324 (Hospital and Medical Service Plans). Lifeinsurance companies include those companies with a SIC code of 6311.
Property and casualty insurance companies have a SIC code of 6331 and
brokers/agents have a two-digit SIC code of 64.

7/27/2019 0010lown
http://slidepdf.com/reader/full/0010lown 6/17
44 Th e Ch a n gin g La n dsc ape of t h e Fin a nc ia l Ser v ic es In d ust r y
of l ife insurance firms—a single-day average excess return of
4.9 percent—suggests that investors believe that l ife insurance
firms are among those companies that have the most to gain
from the legislation. Shareholders may believe that life
insurance companies can be more profitable if they offer both
bank and insurance products. In addit ion, they may perceive
certain l ife insurance companies to be attractive candidates for
mergers with BHCs that want to expand their availableinsurance operations. The shareholder response to the
announced compromise on GLB might reflect a confirmation
of the past expansion by BHCs into nonbank financial
products; it might also reflect optimism for the new
opportunities owing to consolidation across the banking and
li fe insurance sectors.
Consequences of Financial
Consol idat ion
It is interesting to know that stock market participants reacted
favorably to the passage of GLB, but without further research
we can only hypothesize as to why they reacted this way. For
example, did the positive reaction occur because mergers
between BHCs and other types of financial firms will create
more profitable firms?Are there synergies between firms that
can be taken advantage of?Will these firms have a smaller risk
of bankruptcy?
To varying degrees, prior research has examined these
questions. Only limited research has been conducted on the
efficiency gains of combining commercial banks and other
types of financial service firms, because little data have been
available to examine this issue. However, one study of the cost-
scope efficiency of German universal banks found mostly
diseconomies associated with producing loans and investment-
oriented services within the same institution (Lang and Welzel
1998). More research has evaluated the risk-reduction
potential of combining banking and nontraditional financial
activities.8 Kwast (1989) analyzed the correlation between
banks’ eligible trading and nontrading assets and found that
banks’ engagement in eligible securities activities offers limited
potential for diversification gains. More recently, Kwan (1998)found that combining a Section 20 subsidiary with a bank
subsidiary can improve a BHC’s risk-return t rade-off.9
Taking a somewhat different approach, Boyd and Graham
(1988) explored the risk-reduction potential of merging BHCs
with other financial f irms by simulating cross-industry
mergers. Using U.S. data from the 1970s and 1980s, the authors
considered whether diversification benefi ts from these mergers
were significant enough to lower the riskiness of the result ing
firm. They concluded that mergers between BHCs and life
insurance fi rms would l ikely decrease BHC bankruptcy r isk,
while mergers with all other types of financial firms would
likely increase this risk.10We are not aware of any work that has
considered whether the results reported by Boyd and Graham
are robust across time periods, and in parti cular robust to the
last decade. Hence, the goal of our study is to fi ll this void.11
Using data from the 1984-98 period, we present the risk-
return characteristi cs for all of the major financial servi ces
industr ies: bank holding company, securities, property and
casualty insurance, life insurance, insurance agent/broker,
investment advice, real estate development, and other real
estate fi rms. We then compute these same statistics for
simulated mergers over the 1990s between BHCs and firms
from asubset of the remaining financial services industries:
securities, property and casualty, and life insurance. The idea
behind examining this subset of industr ies is to focus on the
most li kely cross-industry mergers with firms large enough to
affect a BHC’s risk-return profile. We use data from the 1990s
because the number of bank mergers throughout the period
makes it difficult to have consistent data over the enti re period.
In addition, the recent data are more likely to be insightful
about future mergers.
As with the earlier simulation studies, there are, of course,
caveats to this analysis. Economies of scale or scope cannot be
taken into account, for example. Nor can we account for the
fact that we do not have a crystal ball: we cannot focus on
mergers that are actually going to occur. Nevertheless, we think
our results provide an upper bound on what is likely to happen,
since taking into account particular synergies between firmsshould serve to improve on the risk calculations that we do
report.
Dat a and Met hodol ogy
We begin by examining annual year-end balance-sheet data on
all publicly traded financial firms in Standard and Poor’s
Compustat database over the 1984-98 period. The industries
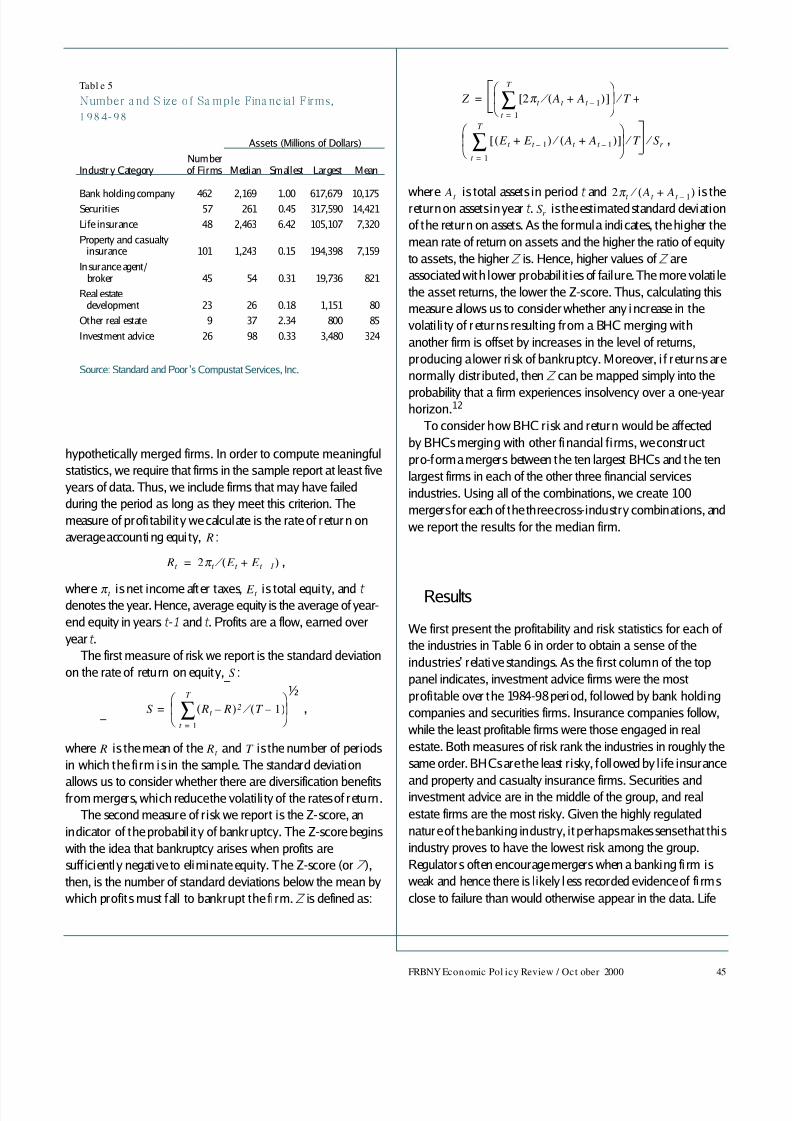
we examine and the number of f irms within each industry arereported in Table 5, along with statistics on firm size in each
industry. As we can see from the table, with the exception of the
“other real estate” category, we have a meaningful number of
firms in each industry to use for our calculations.
We calculate one measure of profi tabili ty and two measures
of risk for each fi rm and report the median value for each
industry. We also compute these same statisti cs for
7/27/2019 0010lown
http://slidepdf.com/reader/full/0010lown 7/17
FRBNY Economic Pol icy Review / Oct ober 2000 45
hypothetically merged fi rms. In order to compute meaningful
statistics, we require that fi rms in the sample report at least five
years of data. Thus, we include firms that may have failed
during the period as long as they meet this criterion. The
measure of profi tability we calculate is the rate of return on
average accounti ng equi ty, :
,
where is net income after taxes, is total equity, and t denotes the year. Hence, average equity is the average of year-
end equity in years t -1 and t . Profits are a flow, earned over
year t .
The first measure of risk we report is the standard deviation
on the rate of return on equity, :
,
where is the mean of the and is the number of periods
in which the fi rm is in the sample. The standard deviation
allows us to consider whether there are diversification benefitsfrom mergers, which reduce the volatili ty of the rates of return.
The second measure of r isk we report is the Z-score, an
indicator of the probabil ity of bankruptcy. The Z-score begins
with the idea that bankruptcy arises when profi ts are
suff iciently negative to eliminate equity. The Z-score (or Z ),
then, is the number of standard deviations below the mean by
which profits must fall to bankrupt the firm. Z is defined as:
R
Rt 2π t E t E t 1–+( ) ⁄ =
π t E t
S
S Rt R–( )t 1=
T
∑ 2 T 1–( ) ⁄
=
½
R Rt T
where is total assets in period t and is thereturn on assets in year t . is the estimated standard deviation
of the return on assets. As the formula indicates, the higher the
mean rate of return on assets and the higher the ratio of equity
to assets, the higher Z is. Hence, higher values of Z are
associated with lower probabil it ies of failure. The more volati le
the asset returns, the lower the Z-score. Thus, calculating this
measure allows us to consider whether any increase in the
volati li ty of returns resulting from a BHC merging with
another firm is offset by increases in the level of returns,
producing a lower risk of bankruptcy. Moreover, i f returns are
normally distr ibuted, then Z can be mapped simply into the
probability that a firm experiences insolvency over a one-yearhorizon.12
To consider how BHC risk and return would be affected
by BHCs merging with other financial firms, we construct
pro-forma mergers between the ten largest BHCs and the ten
largest firms in each of the other three financial services
industries. Using all of the combinations, we create 100
mergers for each of the three cross-industry combinations, and
we report the results for the median firm.
Results
We first present the profi tability and risk statisti cs for each of
the industries in Table 6 in order to obtain a sense of the
industries’ relati ve standings. As the first column of the top
panel indicates, investment advice firms were the most
profitable over the 1984-98 period, fol lowed by bank holding
companies and securities firms. Insurance companies follow,
while the least profi table fi rms were those engaged in real
estate. Both measures of risk rank the industries in roughly the
same order. BHCs are the least risky, followed by life insurance
and property and casualty insurance firms. Securities andinvestment advice are in the middle of the group, and real
estate firms are the most risky. Given the highly regulated
nature of the banking industry, it perhaps makes sense that this
industry proves to have the lowest risk among the group.
Regulators often encourage mergers when a banking fi rm is
weak and hence there is likely less recorded evidence of fi rms
close to failure than would otherwise appear in the data. Life
Z 2π t At At 1–
+( ) ⁄ [ ]t 1=
T
∑
T ⁄
E t E t 1–+( ) At At 1–+( ) ⁄ [ ]t 1=
T
∑
T ⁄
+
S r ⁄
=
,
At 2π t At At 1–+( ) ⁄
S r
Tabl e 5
Number a nd S ize o f Sa mple Fina nc ial Firms,
1984-98
Assets (Millions of Dollars)
Industr y CategoryNumberof Firms Median Smallest Largest Mean
Bank holding company 462 2,169 1.00 617,679 10,175Securities 57 261 0.45 317,590 14,421
Life insurance 48 2,463 6.42 105,107 7,320
Property and casualtyinsurance 101 1,243 0.15 194,398 7,159
Insurance agent/ broker 45 54 0.31 19,736 821
Real estatedevelopment 23 26 0.18 1,151 80
Other real estate 9 37 2.34 800 85
Investment advice 26 98 0.33 3,480 324
Source: Standard and Poor ’s Compustat Services, Inc.

7/27/2019 0010lown
http://slidepdf.com/reader/full/0010lown 8/17
46 Th e Ch a n gin g La n dsc ape of t h e Fin a nc ia l Ser v ic es In d ust r y
insurance and property and casualty insurance are also fairly
highly regulated, and this factor could account for their
relati vely low risk ranking as well .
As a check on the robustness of our results, we also compute
these same statistics over the 1992-98 period. This subsample
exploration allows us to consider whether the results vary when
the 1980s and the early 1990s are excluded, a period in which
many firms were in poor financial health. As the second
column of Table 6 shows, there are a few differences in relative
industry profi tabil ity, with securities firms and insurance
agent/broker firms somewhat more profitable in the 1990s.
However, there are vir tually no di fferences in the relative risk
rankings in the 1990s compared with the entire period. The
overall level of risk i s lower when the 1980s are excluded, a
result consistent with the idea that these firms were in weakerfinancial health over the early part of the sample.
Our findings also accord well wi th those originally reported
by Boyd and Graham (1988). The last column of Table 6
reproduces their statistics, indicating that the relati ve
profitabil ity and risk rankings over the 1970-84 period are very
simi lar to our findings. Two points are worth noting in
comparison. First, as they were in the 1990s, insurance agent/
broker fi rms were quite profitable in the 1970s. Thus, this
industry’s performance in the 1980s appears to be the outlier to
an otherwise profitable performance record. Second, the level
of risk recorded over the 1970-84 period is closer to the levels
experienced in the 1990s, suggesting that the late 1980s were
clearly a difficult period for many financial services firms.
Mergers
The risk measures from combining a BHC with another
financial firm cannot be gleaned merely from the two firms’
standard deviations; the calculation also depends on the
covariance of returns. Hence, to obtain the statistics for
combined f irms, we merge the balance-sheet data and calculate
the risk-return statistics for the pro-forma merged firm. As wenoted, we conduct mergers between BHCs and firms in the life
insurance, property and casualty insurance, and securities
industr ies. To prevent the outcome from being determined by
the larger firm’s size, we examine mergers between the ten
largest BHCs and the ten largest firms in each of the other
industries. The size characteristics of the firms used in the
mergers are reported in Table 7.13
The risk-return measures for the pro-forma mergers with
the ten largest BHCs are presented in Table 8. As we can see,
mergers between BHCs and life insurance firms lower the risk
of both firms. The top ten BHCs have a median standard
deviation of 0.0212, while that of the li fe insurance fi rms is0.0220. The median of the merged firms is 0.0176. Thus, there
are clearly diversification benefi ts to BHC-life insurance
mergers. The Z-score also rises with these mergers, indicating
that the barely lower profitabili ty (16.26 profi tability for the
merged firms, compared with 16.77 for the BHCs) is offset by
the benefits of the lower risk.
Tabl e 6
P rofita bility a nd Risk Mea sures b y Indus try
Profitability
Median (Percent)
Industry Category 1984-98 1992-98 1971-84a
Bank holding
company 12.98 13.28 13.12
Securities 12.98 16.45 16.52
Life insurance 10.58 11.23 12.82
Property and
casualty insurance 11.17 11.73 13.44
Insurance agent/
broker 7.80 14.75 19.98
Real estate
development 2.29 8.94 10.03
Other real estate 2.82 5.12 0.65
Investment
adviceb 20.13 18.59
Risk
Median
1984-98 1992-98 1971-84a
Industry Category S Z S Z S Z
Bank holding
company 0.0271 33.87 0.0173 53.93 0.0245 43.36
Securities 0.1049 10.44 0.0781 14.50 0.0909 13.33
Li fe insur ance 0.0453 19.09 0.0245 31.58 0.0261 36.79
Property and
casualty insurance 0.0691 14.82 0.0449 20.04 0.0467 24.56
Insurance agent/
broker 0.1468 8.49 0.0699 13.56 0.0554 15.97
Real estate
development 0.2892 3.47 0.1408 7.36 0.1382 8.66
Other real estate 0.3642 2.31 0.3899 2.14 0.0925 12.98Investment
adviceb 0.1655 9.48 0.1106 11.37
Sources: Standard and Poor’s Compustat Services, Inc.; authors’
calculations.aThe 1971-84 period reflects the results from Boyd and Graham (1988).bIn Boyd and Graham (1988), the “ investment advice” category is
included in the“securities” category.
R

7/27/2019 0010lown
http://slidepdf.com/reader/full/0010lown 9/17
FRBNY Economic Pol icy Review / Oct ober 2000 47
Mergers with securities firms and property and casualty
firms barely change BHC risk, from 0.0212 to 0.0222 and to0.0221, respectively, although the probability of bankruptcy as
indicated by the Z-score is higher (a lower Z ) for mergers with
property and casualty f irms. The lower relati ve rate of return
recorded by property and casualty fi rms serves to lower Z when
these firms merge with BHCs.14These findings clearly suggest
that mergers between BHCs and life insurance companies are
likely to produce firms with less risk than either of the two
separate entities, while mergers with securities and property
and casualty firms will raise BHC probability of bankruptcy
modestly. The latter findings stand in contrast to those
reported by Boyd and Graham (1988). Their simulated
mergers created firms with lower Z s, and higher standard
deviations, leading the authors to recommend against mergers
between BHCs and either securities firms or property and
casualty fi rms.
Our contrasting findings likely result from the fact that weexamined mergers between the largest fi rms in each industry
while the earlier study examined random mergers. Random
mergers almost surely generated some combinations of a large
securities or property and casualty firm and a small bank
holding company, such that the former, typically riskier, firm
received the bulk of the weight in the calculations. The dif ferent
time period could also play a role because, generally speaking,
financial firms were in better shape in the 1990s than they were
in the 1980s.15
Lessons f r om Eur ope
Recent data on M&A activit y in Europe provide further insight
into how the Gramm-Leach-Bliley Act might influence
consolidation. Europe provides a good model for comparison
because most European countries permit banking, securities,
and insurance activities to occur in the same company or
Tabl e 7
Number and Size of Sample Financial Firms,
1992-98
Assets (Millions of Dollars)
Industry Category Median Smallest Largest Mean
Top ten bank holding
companies 147,522 40,776 617,679 171,706
Top ten securi ti es firms 92,085 2,111 317,590 103,269
Top ten life insurance
companies 21,805 5,067 105,107 29,744
Top ten property and
casualty companies 41,912 13,252 194,398 54,915
Source: Standard and Poor’s Compustat Services, Inc.
Tabl e 8
P rofitab ility a nd Risk Mea sures if a BHC Had Merged with a Nonb a nk Fina ncia l Firm
Profitability (Percent) Risk
Median B&G Mediana Median B&G Mediana
Industry Category S Z S Z
Top ten BHCs 16.77 13.12 0.0212 52.08 0.0245 43.36
BHCs-securities firms 16.90 14.06 0.0222 48.41 0.0480 24.93
BHCs-life insurance companies 16.26 12.95 0.0176 56.83 0.0201 49.30
BHCs-property and casualty companies 15.17 12.97 0.0221 41.18 0.0432 25.28
Top ten securities firms 18.48 16.52 0.0471 17.57 0.0909 13.33
Top ten life insurance companies 13.29 12.82 0.0220 36.66 0.0261 36.79
Top ten property and casualty companies 11.84 13.44 0.0304 24.34 0.0467 24.56
Sources: Standard and Poor ’s Compustat Services, Inc.; authors’ calculations.
Notes: Each hypothetical industry includes 100 fi rms created by merging each top ten bank holding company (BHC) with each top ten nonbank f inancialfirm from our 1992-98 sample of publicly traded firms. A top ten firm is defined as a firm ranking in the top ten of total assets within an industry, defined by
the Standard Industrial Classification code, as of year-end 1996.aThe column refers to Boyd and Graham’s (1988) profitabil ity and ri sk measure results over the 1971-84 period.
R R

7/27/2019 0010lown
http://slidepdf.com/reader/full/0010lown 10/17
48 Th e Ch a n gin g La n dsc ape of t h e Fin a nc ia l Ser v ic es In d ust r y
holding company. Table 9 reports the flows of M&A activity
within the European Community (EC) and within the United
States. The values shown are the sum of the market values of all
target institutions over 1985-99, and the percentages of the
European or U.S. activity these represent.
As the table shows, over the past fifteen years, there was a
litt le more than $775 bill ion in consolidation activity in
Europe, of which 49 percent came from banks consolidatingwith other banks. Consolidation across sectors (the off-
diagonal elements) has also been fairly common in Europe,
accounting for about 24 percent of M&A activity. By
comparison, there was $873 bil lion in consolidation activity in
the United States, of which 56 percent involved only banks.
Consolidation across segments has been relatively uncommon
in the United States, however, as a result of the restrictions on
bank activit ies during most of the period. Only 3.7 percent of
total M&A acti vity occurred between banks and securities fi rms
and about 17 percent of all financial M&As occurred across
segments.16 If the U.S. financial sector begins to evolve
similarly to the European sector, we will l ikely see a substantial
increase in M&A activity across the three main segments.
Since few legal barriers prevent European banks from
entering the insurance business, many of these banks reacted
to the intensified competi tive environment of the 1980s and
1990s by entering aggressively into insurance. In the process,
they created a model of combined banking and insurance now
called “bancassurance.” We review the bancassurance model
here, since the European experience may suggest how the
banking and insurance industr ies are likely to evolve in the
United States post-GLB.17
Or igins of Ban ks’ Int er est
in Insur ance
In recent decades, banks abroad faced many of the same
competitive pressures as banks in the United States. Traditional
banking in most EC countries had not grown robustly, and
profitability had fallen, prompting banks to explore new
business opportunities.18At the same time, the life insurance
business was doing quite well. Between 1986 and 1991, life
insurance premiums grew more than 10 percent per year in
eight of the twelve EC countries, and growth exceeded
12 percent per year on average across all countries (Hoschka
1994). Moreover, growth in life insurance seemed likely to be
sustained, since it could be traced to long-run phenomena such
as rising income and wealth and a rising share of older people.
Life insurance also looked attractive to banks because most EC
countr ies promote it through advantageous tax provisions, in
order to encourage individuals to provide for their reti rement.
As of 1994, tax deductibil ity for li fe insurance premiums was
offered in ni ne of the twelve EC countr ies, while tax-free status
for some or all of the proceeds of life insurance policies was
offered in a different group of nine countries (Hoschka 1994).
Tabl e 9
Va lues o f the Targe ts o f Fina nc ial Ins titutions ’ M&A Activity, 1985-99
Europe: Acquiring Institution United States: Acquiring Institution
Target Institution
Commercial
Bank
Securities
Firm
Insurance
Company Total
Commercial
Bank
Securities
Firm
Insurance
Company Total
Commercial bank 377.4 33.2 49.4 460.0 489.2 6.7 73.5 569.4
(48.6) (4.3) (6.4) (59.2) (56.1) (0.8) (8.4) (65.3)
Securities firm 22.8 50.8 11.5 85.1 23.5 114.3 16.1 153.9
(2.9) (6.5) (1.5) (11.0) (2.7) (13.1) (1.8) (17.6)
Insurance company 40.2 33.0 159.0 232.2 0.6 31.2 117.4 149.2
(5.2) (4.2) (20.5) (29.9) (0.1) (3.6) (13.5) (17.1)
Total 440.4 116.9 219.9 777.3 513.3 152.2 207.0 872.5
(56.7) (15.0) (28.3) (100.0) (58.8) (17.4) (23.7) (100.0)
Source: Securit ies Data Company.
Note: Top figures are the sum of all target institutions’ market value of equity just before being acquired, in bil li ons of dollars; figures in parentheses are the
percentage of the total.

7/27/2019 0010lown
http://slidepdf.com/reader/full/0010lown 11/17
FRBNY Economic Pol icy Review / Oct ober 2000 49
Table 10 shows that combinations of banks and life
insurance companies constituted more than 10 percent of the
total M&A activity in financial services. By contrast, European
banks and property and casualty insurance companies almost
never combined. This may be explained by the fact that the
average growth in property and casualty premiums over the
same period, although an attractive 8 percent per year, was
nevertheless slower than the growth in life insurancepremiums.
In short, at the same time that banks in Europe were pushed
to consider additional sources of revenue by competi tion in
their traditional product l ines, they were pulled toward li fe
insurance by the industry’s sustained rapid growth and tax-
advantaged status. In addition, banks were, and still are, drawn
to life insurance because of substantial cost advantages. We
briefly discuss each advantage, drawing heavily on a joint study
published in 1999 by the Bank Administration Insti tute and the
Boston Consulting Group (BAI/BCG).
The first cost advantage that banks have over traditional
independent li fe insurance sales agents is that their sales
personnel, with fixed salaries, are less expensive than
traditional brokers, who receive commissions (p. 22). This cost
advantage is bolstered by economies of scope based on bank
branch systems, customer information, administration, and
trust. The first two economies of scope provide banks with
advantages in the cost of selling insurance, the third provides
advantages in the cost of underwriting, and customer trust
serves to increase demand. For example, bank branches can
provide space for life insurance activities as well as frequent
opportunities for pursuing sales contacts. As a result, the
productivity of bank personnel in sell ing li fe insurance can be
relatively high. According to the BAI/BCG study, the sales
productivity of a successful bancassurance agent can be three to
fi ve times higher than that of a traditional insurance agent
(p. 23). Furthermore, banks can use their customer
information to tailor their sales approach or to target products
to individuals, which minimizes the chance of a wasted saleseffort. Banks can also enjoy cost advantages in insurance
underwriting by tapping their existing resources in areas such
as administration, investment management, and human
resources. Again, according to the study, it is not necessary for
banks to add employees, systems, or other resources in order to
generate and mail out premium notices. Instead, they can
automatically debit payments from customers’ checking or
savings accounts, which avoids bill generation and mailing as
well as check processing (p. 9). Finally, banks can capitalize on
the trust individuals typically have in their banks by extending
their customer relationships to include insurance.
Successful St r at egies
European banks have put substantial effort into entering the
life insurance business during the past few decades and they
have had substantial success. The BAI/BCG study estimates
that leading European bancassurers typically generate a return
Tabl e 10
European Financial Institutions ’ M&A Activity b y Ind us try Seg ment ,1990-99
Percent
Acquiring Instit ution
Target Institution Commercial Bank Securities FirmLife Insurance
Company
Propert y and
Casualty InsuranceCompany Insurance Brokerage
TotalFinancial
Commercial bank 51.1 6.8 5.0 0.0 0.2 63.2
Securities firm 2.4 6.7 0.8 0.2 0.0 10.2Life insurance company 5.4 3.9 12.9 0.3 0.2 22.6
Property and casualty insurance company 0.1 0.2 0.5 0.5 0.0 1.3
Insurance brokerage 0.3 0.1 2.3 0.0 0.1 2.7
Total financial 59.2 17.7 21.5 1.0 0.5 100.0
Source: Securit ies Data Company.
Note: Figures are based on t he sum of all target insti tut ions’ market value of equity just before being acquired.

7/27/2019 0010lown
http://slidepdf.com/reader/full/0010lown 12/17
50 Th e Ch a n gin g La n dsc ape of t h e Fin a nc ia l Ser v ic es In d ust r y
on sales and on capital of 20 percent to 30 percent and derive
one-quarter to one-third of their retail profi ts from insurance
and investment sales (p. 22). Moreover, European banks have
penetrated the life insurance markets to a substantial degree:
their share of the markets averages more than 20 percent, and
exceeds 50 percent in France. Finally, European banks’ sales of
life and pension insurance continue to grow at more than
20 percent per year, substantially more rapidly than overallsales in their local markets.
Banks have actually transformed parts of the life insurance
business in Europe. Historically, individuals with relatively
high incomes or high net worth have purchased life insurance.
Individuals with low or moderate incomes—who are
tradit ional bank customers—have been “underinsured.” Thus,
banks have access to a customer base, distinct from that of
conventional independent insurance agents, that has
substantial potential for fueling growth.
Banks have found that the ideal life insurance product for
mass-market clients is much simpler than the products
typically available through independent agents. Consequently,
banks have tended to sell a limited range of life insurance
products that are relatively simple to understand. Banks have
also found that their customers prefer streamlined application
and claims processes, and have developed such procedures. For
example, the BAI/BCG study indicates that “ in Europe, banks
pursuing bancassurance strategies sell young customers simple
life insurance policies valued up to $60,000 after only a fifteen-
minute interview at a branch, and no medical exam. By
comparison, most big insurance companies require a medical
exam and often take weeks to process a policy” (p. 2).
The European experience suggests that banks perform bestin the life insurance business when they tightl y integrate their
banking operations with both insurance sales and insurance
underwriting. Initially, when many banks entered marketing
all iances with multiple insurance underwri ters, these efforts
met with mixed success. Even when successful, these ventures
were generally not as profi table as more recent efforts with fully
integrated production, perhaps because banks were not able to
control the products they offered to ensure that they were
appropriate for their client base.19
A fi nal pattern to note from the European experience
concerns the entry of insurance fi rms into banking.
Bancassurance, in which banks enter insurance, has generallyhad a larger presence in Europe than“assurebanking,” in which
insurance fi rms enter banking.20This asymmetry can be traced
in part to the legal barr iers that prevent nonbanks from
entering banking in most EC countries (Hoschka 1994). I t
could also stem from the fact, noted earlier, that insurance has
grown more robustly than banking in recent decades.
Nonetheless, as our tables indicate, insurers now appear to be
expanding into banking.
In sum, if the European experience is any guide, we could
observe banks in the United States entering more aggressively
into the li fe insurance business. This is consistent with both theevent study evidence and the diversification benefi ts discussed
earl ier. Over time, it is possible that banks entering the life
insurance business will integrate both sales and underwriting
operations into their banking business, and that they may very
well develop simpler life insurance policies and procedures
appropriate for a mass market.
Conclusion
By allowing fi nancial holding companies to own banks,
securities underwriters, and insurance companies, Gramm-
Leach-Bliley sets the stage for another round of financial
consolidation. Our evidence points most strongly to
combinations of banks and life insurance companies. When
the compromise on GLB was reached, the stock prices of banks,
securi ties firms, and insurance companies all increased.
Particularly sharp increases occurred at bank holding
companies and securities firms that act as advisors in financial
M&As as well as at life insurance companies. Moreover, our
simulated mergers across the financial services industr ies
indicate that the largest diversifi cation benefi ts would result if
bank holding companies combined with life insurance fi rms.
One explanation for the posit ive reaction of financial fi rms’
stock prices could be the recognition by shareholders that
diversification benefi ts may allow these fi rms to expand into
somewhat riskier activit ies or to operate with less capital. Our
study also suggests, in contrast to earl ier findings, that mergers
between bank holding companies and either securi ties fi rms or
property and casualty firms would likely raise BHC risk only
modestly. Furthermore, the recent expansion of banks into the
life insurance business in Europe, where few legal barriers to
cross-industry activity have been in place, also supports theargument that banks are likely to acquire li fe insurance firms.

7/27/2019 0010lown
http://slidepdf.com/reader/full/0010lown 13/17
Endnot es
FRBNY Economic Pol icy Review / Oct ober 2000 51
1. Concentration in local markets changed very l it tle, however,
suggesting that market power in banking has not increased (see
Berger, Demsetz, and Strahan [1999]).
2. This calculation omits the ten largest banks from the comparison
because these institutions are engaged in a very different set of
activities than medium-size and small banks.
3. See Berger, Kashyap, and Scalise (1995) for year-by-year details on
the changes in state laws.
4. Of course, deregulation is not strictly exogenous. The emergence of
new technologies in both deposit taking and lending also may have
encouraged deregulation (Kroszner and Strahan 1999). Another
impetus may have been the rash of bank and thrift failures in the
1980s, which increased awareness of the advantages of geographically
diversif ied insti tut ions (Kane 1996).
5. The history of reform efforts on nonbank bank acti vity is compiled
from work by Boyd and Graham (1986, 1988), Boyd, Graham, and
Hewitt (1993), Ely and Robinson (1998, 1999), McGuire (1996),
Mester (1996), and Thomas (1997).
6. For a discussion of the history and issues surrounding these
firewalls, see Boyd and Graham (1986).
7. For a further explanation of the legislation and i ts meaning, seeBarth, Brumbaugh, and Wilcox (2000).
8. Morgan (2000) argues that diversif ication across geographic and
product lines within banking can help explain the large number of
mergers over the past decade.
9. For a more comprehensive review of the research on these topics,
see Berger, Demsetz, and Strahan (1999), Kwan and Laderman (1999),
and Santos (1998).
10. In a subsequent study, Boyd, Graham, and Hewit t (1993) explore
these same issues by allowing the portfol io weights for each bank-nonbank pair to vary. Because their main conclusions were virtually
identical to those of the earl ier study, we focus on the earl ier f indings,
which can be compared directly with our results.
11. A recent exception is the work of Laderman (2000). She found that
over the 1987-97 period, risk is likely to be reduced when BHCs invest
in li fe insurance, property and casualty insurance, and securi ties fi rms.
Saunders and Walter (1994) simulated cross-industry mergers using
daily stock return data over the 1984-88 period. They concluded that
risk reduction is most likely to occur from banks’ expansion into
insurance, rather than into securities activit ies.
12. Normality is a strong assumption for the distri bution of rates of
return. Nevertheless, Z is useful in providing a relative risk ranking
across firms and industries.
13. Although it might also be interesting to analyze mergers across
medium-size and small firms, mergers across the largest firms would
have the biggest effect on the financial services industries as a whole.
For this reason, we focus our analysis on the largest firms.
14. Note that with the exception of the 1996 Chase Manhattan-
Chemical merger, we did not construct pro-forma balance-sheet data
for mergers prior to the time that they occurred. The pro-forma
Chase-Chemical data are reported in the database, hence we use them
in our study. When we recalculated our statistics—treating banks that
merged during the period as a single bank throughout the entire
period—we saw that the results were similar and our conclusions
remained the same.
15. We also examined mergers between the second largest BHCs and
the top ten firms in the other industries. The results were similar to
those reported in Table 8, although mergers with securities firms
produced a Z-score of 34.17, somewhat lower than the 48.41 reportedin the table. Securities fi rms in our sample typically are larger than this
second group of BHCs, a factor that gives the risk of these firms greater
weight in the calculation.
16. In the Citigroup merger, the acquirer (Travelers) is categorized as
an insurance company, even though about half of its business is in
securities through its holdings of Salomon-Smith Barney.
17. We do not mean to imply that the regulation and supervision of
these industries are identical across Europe; rather, with some
variation in structure and practice, these activi ti es typically are allowed
to coexist. See Barth, Nolle, and Rice (1997) for a discussion of differences in bank structure and regulation across the European
countries.
18. European banks’ return on equity declined from an average of
roughly 13 percent in 1982 to less than 10 percent in 1991 (authors’
calculations, based on Organization for Economic Cooperation and
Development [ 1993]).

7/27/2019 0010lown
http://slidepdf.com/reader/full/0010lown 14/17
52 Th e Ch a ng in g La n dsc ape of t h e Fi na n cia l Se r vi ces In d ust r y
Endnot es (Cont inued)
19. For example, Credit Agricole of France began with a loose alliance
with two insurance companies that lasted from the 1950s to the early
1970s. Subsequently, it aligned more closely with a single firm,
Soravie, but the firms could not agree on how to share profits. Finally,
Credit Agricole established its own life insurance company in 1986;
since then, business has grown at double-digit rates (Bank
Administration Institute and Boston Consulting Group 1999,
pp. 32-3).
20. This asymmetry is not apparent in Tables 9 and 10 because the
M&A statistics do not reflect de novo entry of banks into insurance.

7/27/2019 0010lown
http://slidepdf.com/reader/full/0010lown 15/17
Refer ences
FRBNY Economic Pol icy Review / Oct ober 2000 53
Bank Admin istrati on Institu te and Boston Consult ing Group . 1999.
“Putting It Together: Convergence Strategies for Banking,
Insurance, and Investments.”
Barth, J. R., D. Brumbaugh, and J. A. Wil cox . 2000. “The Repeal of
Glass-Steagall and the Advent of Broad Banking.” Journal of
Econ omic Per spect ives, May.
Barth, J. R., D. E. Nolle, and T . N. Rice . 1997. “Commercial Banking
Structure, Regulation, and Performance: An I nternational
Comparison.” Office of the Comptroller of the Currency Working
Paper no. 7.
Berger, A. N., R. S. Demsetz, and P. E. Str ahan . 1999. “The
Consolidation of the Financial Services Industry: Causes,
Consequences, and Implications for the Future.” Journal of
Banking a nd Finance 23: 135-94.
Berger, A. N., A. K. Kashyap, and J. M . Scali se . 1995. “The
Transformation of the U.S. Banking Industry: What a Long,
Strange Trip It ’s Been.” Br ookin gs Paper s on Econ omic
Act ivit y, no. 2: 55-218.
Bhargava, R., and D . R. Fraser . 1998. “On the Wealth and Risk Effects
of Commercial Bank Expansion into Securit ies Underwr it ing: An
Analysis of Section 20 Subsidiaries.” Jour nal of Banking and
Finance 22: 447-65.
Bomfim, A. N ., and W. R. Nelson . 1999. “Profits and Balance-Sheet
Developments at U.S. Commercial Banks in 1998.” Federal
Reser ve Bul l et in 85 (June): 369-95.
Boyd, J. H., and M . Gert ler . 1994. “Are Banks Dead?Or, Are the
Reports Greatly Exaggerated?” In The Decl ining Rol e of
Banking, 85-117. Federal Reserve Bank of Chicago, Proceedings
of the 30th Annual Conference on Bank Structure and
Competition.
Boyd, J. H., and S. L. Gr aham . 1986. “Risk, Regulation, and BankHolding Company Expansion into Nonbanking.” Federal Reserve
Bank of MinneapolisQuart erl y Review 10, no. 2 (spring): 2-17.
———. 1988. “The Profitabil it y and Risk Effects of Allowing Bank
Holding Companies to Merge with Other Financial Firms: A
Simulation Study.” Federal Reserve Bank of Minneapolis
Quar t erl y Review 12, no. 2 (spring): 3-20.
Boyd, J. H ., S. L. Graham, and R. S. Hewi tt . 1993. “Bank Holding
Company M ergers with Nonbank Financial Firms: Effects on the
Risk of Failure.” Jour nal of Banking and Finance 17: 43-63.
Ely, D. P., and K . J. Robinson . 1998. “How Might Financial Insti tutions
React to Glass-Steagall Repeal?Evidence from the Stock Market.”
Federal Reserve Bank of DallasFinancial Indust r y St udies,
September: 1-11.
———. 1999. “The Determinants of the Wealth Effects of Banks’
Expanded Securities Powers.” Federal Reserve Bank of Dallas
Financial Industry Studies working paper, April.
Esty, B. C., B. Narasimhan, and P. Tufano . 1999. “ Interest-Rate
Exposure and Bank Mergers.” Jour nal of Banking and
Finance 23: 255-85.
Fazzari , S. M ., R. G. Hubbard, and B. C. Petersen . 1988. “Financing
Constraints and Corporate Investment.” Br ookings Paper s on
Economic Act ivit y, no. 1: 141-95.
Froot, K . A., and J. C. Stein . 1991. “Exchange Rates and Foreign Direct
Investment: An I mperfect Capital M arkets Approach.”
Quar t er l y Jour nal of Economics 106: 1191-1218.
Gande, A., M . Puri, and A. Saunders . 1999. “Bank Entry, Competition,
and the Market for Corporate Securities Underwriting.” Journalof Financial Economics 54, no. 2: 165-95.
Goldberg, L. G., G. A. Hanweck, M . Keenan, and A. Young . 1991.
“Economics of Scale and Scope in the Securit ies Industry.”
Jour nal of Banking and Finance 15: 91-107.
Gora, Jean C . 1997. “Bancassurance: Posit ioning for Aff il iations.
Lessons from Europe, Canada, and the Uni ted States.” Atlanta: Life
Office Management Association.
Hoschka, T . 1994. Ban cassur ance in Eur ope. New York:
St. Martin ’s Press.
Hoshi , T., A. K. Kashyap, and D. Schar fstein . 1991. “Corporate
Structure, Liquidity, and Investment: Evidence from Japanese
Industr ial Groups.” Quart erl y Jour nal of Economics 106:
33-60.

7/27/2019 0010lown
http://slidepdf.com/reader/full/0010lown 16/17
Refer ences (Cont inued)
54 Th e Ch a ng in g La n dsc ape of t h e Fi na n cia l Se r vi ces In d ust r y
Jayaratne, J., and P. E. Str ahan . 1998. “Entry Restrictions, Industry
Evolution, and Dynamic Effi ciency: Evidence from Commercial
Banking.” Jour nal of Law and Economics 49: 239-74.
Jensen, M . C . 1986. “Agency Costs of Free Cash Flow, Corporate
Finance, and Takeovers.” Amer ica n Econ omic Review 76, no. 2:
323-9. Papers and Proceedings of the 98th Annual Meeting of the
American Economic Association.
Kane, E. J . 1996. “De Jure Interstate Banking: Why Only Now?”
Jour na l of Money, Credit , an d Banking 28, no. 2: 141-61.
Kaplan, S., and L. Zingales . 1997. “Do Investment-Cash Flow
Sensitivities Provide Useful Measures of Financing Constraints?”
Quar t erl y Jour nal of Economics 112, no. 1: 169-215.
Kroszner, R. S., and P. E. Str ahan . 1999. “What Drives Deregulation?
Economics and Politics of the Relaxation of Bank Branching
Restrictions.” Quart erl y Journal of Economics 114, no. 4:
1437-67.
Kwan, S . 1998. “Securities Activit ies by Commercial Banking Firms’
Section 20 Subsidiaries: Risk, Return, and Diversification
Benefits.” Federal Reserve Bank of San Francisco Working Paper
no. 98-10.
Kwan, S., and E. Laderman . 1999. “On the Portfolio Effects of Financial Convergence—A Review of the Literature.” Federal
Reserve Bank of San FranciscoEconomic Review 2: 18-31.
Kwast, M . 1989. “The Impact of Underwriting and Dealing on Bank
Returns and Risk.” Jour nal of Banking and Finance 13:
101-25.
Laderman, E . 2000. “The Potential Diversification and Failure-
Reduction Benefi ts of Bank Expansion into Nonbanking
Activities.” Federal Reserve Bank of San Francisco Working Paper
no. 2000-01.
Lamont, O . 1996. “Cash Flow and Investment: Evidence from Internal
Capital M arkets.” Jour nal of Finance 52: 83-109.
Lang, G., and P. Welzel . 1998. “Technology and Cost Efficiency in
Universal Banking: A Thick Frontier Approach.” Journal of
Product ivit y Anal ysis 10: 63-84.
McGui re, Charles R . 1996. “Should Banks Sell Insurance?The
Relationship of Section 92 of the Banking Act, the McFarran-
Ferguson Act, and State Laws Restri cting Bank Activit y.” Journal
of Legisla t ion 22.
Mester, Loretta J . 1996. “Repealing Glass-Steagall: The Past Points the
Way to the Future.” Federal Reserve Bank of Philadelphia
Busin ess Review, July-August: 3-18.
Meyer, L. H . 1998. “Statement before the Committee on Banking and
Financial Services.” U.S. House of Representatives, Apr il 29.
M ishkin , F. S., and P. E. Str ahan . 1999. “What Will Technology Do to
the Financial Structure?” In Robert Litan and Anthony Santomero,
eds., The Effect of Technol ogy on t he Financial Sect or ,
249-87. Brookings-Wharton Papers on Financial Services.
Moore, R. R., and T. F. Siems . 1998. “Bank Mergers: Creating Value or
Destroying Competition?” Federal Reserve Bank of Dallas
Financial Industr y Issues, third quarter.
Morgan, D . 2000. “The Benefits of Geographic Diversification by
Banks.” Unpubl ished paper, Federal Reserve Bank of New York.
Organi zation for Economic Cooperati on and Development . 1993. Bank
Profit abilit y St at istical Suppl ement ; Financial
St at ement s of Banks, 1982-91. Paris: Organization forEconomic Cooperation and Development.
Radecki , L. J., J. Wenni nger, and D. K . Or low . 1997. “ Industry
Structure: Electronic Delivery’s Potential Effects on Retail
Banking.” Jour nal of Ret ail Banking Services 19, no. 4: 57-63.
Sant os, J. A. C . 1998. “Commercial Banks in the Securities Business: A
Review.” Jour nal of Financial Ser vices Resear ch 14, no. 1:
35-59.
Saunders, A., and I. Wal ter . 1994. Universal Banking in th e
Unit ed St at es. New York: Oxford University Press.
Thakor, A. V . 1999. “ Information Technology and Financial Services
Consolidation.” Jour nal of Banking an d Finance 23: 697-700.

7/27/2019 0010lown
http://slidepdf.com/reader/full/0010lown 17/17
Thomas, Jeffrey H . 1997. “ Barnett Bank Brings the Business of
Insurance to the Attention of Congress.” University of Arkansas
at Little Rock Law Jour nal , fall.
The views expressed in thi s arti cle are those of the authors and do not necessarily r eflect the position of the Federal Reserve Bank
of New York or the Federal Reserve System. The Federal Reserve Bank of New York pr ovides no warran ty, express or
impl ied, as to the accuracy, timeli ness, compl eteness, merchantabi li ty, or f i tness for any par ti cular pur pose of any
informat ion contained in documents produced and provided by the Federal Reserve Bank of New York i n any form or
manner whatsoever.


