Embed Size (px)
Citation preview
08 Quantitative Easing 2 — a Bubble in the making?
12 Booking Profits? — Minimise Capital Gain
40 The Rupee as a Policy Instrument
VOL VI-ISSUE 11-NOVEMBER 2010-Rs. 30-Total pgs 44
06India is one of the most attractive destinations for business and investment opportunities due to huge manpower base, diversified natural resources and strong macro-economic fundamentals..………………Read on
EDITORIAL
NOVEMBER 2010 Investime 3
Spread effects and backwash effects are two concepts popularised by the celebrated development economist Gunnar Myrdal. When he
wrote the thesis, mainly, Asian Drama, he had only the aspects of trade in mind, particularly, terms of trade, which was always favourable to more developed countries. Only recently it came to me that even QE2 has some spread effects and backwash effects. In this case what rises and engulfs the terrain is the cheap liquidity. It helps asset markets to rise, and rise like there is no ceiling. It benefits some. But when there is a sell-off, in the asset markets, there are gains that the tide takes away with it. Many controls have been already employed by Thailand, Korea and Brazil, and there is an emerging trend of using the domestic currencies as an active tool of economic management. In our main feature, we discuss some of the salient features of QE2 through two articles on the topic and leave some thoughts at the gates of your mind for you to ruminate and seek the peripheries of reality.
Investime is extraordinarily lucky this time with leading CEOs sharing their perspectives with us on matters of contemporary importance, Mr. Sandesh Kirkire, CEO, Kotak Mahindra AMC, shares a perspective on inflation — where are we headed? You have more by way of our regular features. In his article, Mr. Sudipto Roy, Business Head, Asset Management, Principal AMC, discusses a smarter way of deciding equity allocation, as he says, equity allocation decisions are to be implemented over the long term and through a fund that is structured to consistently implement it through time tested valuation principles. As always, we will continue our efforts to provide you with rich and balanced content. Thank you for your whole-hearted support to Investime.
K. Joseph Thomas
““
Only recently it came to me
that even QE2 has some spread
effects and backwash effects
CONTENTSOUR BRANCHESAHMEDABAD 202, 2nd Aarya Arcade, Next to Crossword, Mithakhali Six Road, Navrangpura, Ahmedabad - 380009. Tel: 079-40276000 / 30
AJMER Shop No.24, 1st Floor, K. C. Complex, Opp. Daulat Bagh, Ajmer - 305001 Tel: 0145-5101013
BANGALORE - I 201, 2nd Floor, H. M. Geneva House, #14, Cunningham Road, Bangalore - 560052. Tel: 080-22269271 / 2
BANGALORE - II No. 15 & 15/1, 1st Floor, Above Nissan Motors, Queens Road, Bangalore - 560052. Tel: 080-43588000
BHOPAL 301, Second Floor, Kay Kay Business Centre, Plot No.133, Zone-I, M. P. Nagar, Bhopal - 462011. Tel: 0755-4247310 / 7311
BHUBANESWAR Plot No-A / 160, Saheed Nagar, Bhubaneswar, Orissa - 751007.Tel: 0674-2540035
CHANDIGARH - I S.C.O. 59-60, 2nd Floor, Sector 9D, Chandigarh - 160009.Tel: 0172-2747971 / 72 / 4635423
CHANDIGARH - II (WEALTH MANAGEMENT) S.C.O. 145-146, Sector 8-C, Madhyamarg, Chandigarh -160017.Tel: 0172-4311559
CHENNAI 42, Kuber Towers, Pantheon Road, Egmore, Chennai - 600008.Tel: 044-42145711 / 46467
COCHIN 2nd Floor, Thekkekara Mansions, M.G. Road, Opp Kavitha Movie, Cochin - 682035. Tel: 0484-2352779 / 2361077
COIMBATORE No. 551-A, 1st Floor, Logammaniya Street, Coimbatore - 641002. Tel: 0422-4214901/02
DELHI - I A-270,1st & 2nd Floor, Defence Colony, New Delhi-110024.Tel: 011-46204400 / 99 / 43363500
DELHI - II Flat No.103, 1st Floor, Arunachal Building, 19, Barakhamba Road, Connaught Place, New Delhi - 110001.Tel: 011-46204300
DWARKA T-10 HL Square, Sector 5, Near ICICI Bank, Dwarka, Delhi - 110077. Tel: 011-32227420
FARIDABAD FF-09, 1st Floor, SCO-12, Sec-16 Market, Faridabad - 121002.Tel: 0129-4168904 / 05 / 07
GHAZIABAD Atlantic Plaza, First Floor, Plot No. 8, Sector-4, Vaishali, Ghaziabad - 201010 Tel: 0120-3142500
INDORE I 312-A,City Centre, 570 M. G. Road, Indore - 452001. Tel: 0731-2534501 / 2432364
INDORE - II 106, Silver Sanchora Castle, 07, RNT Marg, Indore - 452001.Tel: 0731-4289715 / 20
JAIPUR 305, Shyam Anukampa,Near Ahimsa Circle, Ashok Marg, C-Scheme, Jaipur - 302015, Tel: 0141-5112028
KANPUR 2nd Floor, Room No-218, Krishna Tower, 15/63 Civil Lines, Kanpur - 208001. Tel: 0512-3025529 / 3024891
KOLKATA J. K. Millennium Centre, 2nd Floor, 46D, J. L. Nehru Road, Kolkata - 700071. Tel: 033-22883001 / 2, 22882590 / 96 / 97
LUCKNOW 13 & 14, Ground floor, Saran Chamber II, Opposite Civil Hospital, Park Road, Lucknow - 226001. Tel: 0522-4154900
LUDHIANA 2nd Floor, S.C.O.-28, Feroze Gandhi Market, Ludhiana - 141001.Tel: 0161-4649672, 4649674
MUMBAI - APEEJAY HOUSE Apeejay, 2nd Floor, Opp. Lion Gate, S. B. Road, Fort, Mumbai - 400001. Tel: 022-22824350 / 66338641 / 67168118
MUMBAI - ANDHERI 409, Samarth Vaibhav, Opp. Tarapore Tower, Off New Link
Road, Lokhandwala, Andheri, Mumbai - 400053. Tel: 022-65102606
MUMBAI - ANDHERI (SAHAR) Sneha Samadhan Blg, Ground Floor, Near Better Homes, Andheri-Sahar Road, Andheri (East), Mumbai - 400069. Tel: 022-42332222
MUMBAI - BANDRA 10, Mirabelle, 512, Linking Road, Next to National College, Bandra (West), Mumbai - 400050. Tel: 022-65102605
MUMBAI - BORIVALI Abhilasha Bldg. No. 2, Ground Floor, Punjabi Lane, Off. L. T. Road, Borivali (West), Mumbai - 400092. Tel: 022-42441700
MUMBAI - INDIA BULLS One India Bulls Centre, Tower 1, 14th Floor, Jupiter Mill Compound, 841, S. B. Marg, Elphinstone Road, Mumbai - 400013. Tel: 022-43568300
MUMBAI - GHATKOPAR Neel Yog Square, Shop No. 04, R. B. Mehta Road, Ghatkopar (East), Mumbai - 400075. Tel: 022-42441800
MUMBAI - KALINA 2nd Floor, Sheil Estate, Dani Corporate Park, 159, CST Road, Kalina, Santacruz (East) Mumbai - 400098. Tel: 022-42333400
MUMBAI - KHARGHAR Office No. 40-41, Crystal Plaza, Hiranadani Complex, Kharghar, Navi Mumbai - 410210. Tel: 022-31924307
MUMBAI - THANE Ground Floor, Konark Tower, Opp. Saibaba Temple, Ghantali Road, Panchpakhadi, Thane (West), Mumbai - 400602. Tel: 022-67210222 / 23 / 67955457
MUMBAI - THANE II 5th Floor, G. Corp Tech Park, Kasarvadavli Police Station, Near Hypercity Mall, Ghodbunder Road, Thane (West), Mumbai - 400601. Tel: 022-39963500
MUMBAI - VASHI Shop No 29, Plot No 71, Arenja Corner Premises Co-op Society Ltd., Sector 17, Vashi , Navi Mumbai - 400703. Tel: 022-61379100-99
NAGPUR 202, Abhinav Arcade, 2nd Floor, Abhayankar Nagar, Nagpur - 440010. Tel: 0712-6462898 / 99
NOIDA K-10,1st Floor, Sector-18, Noida, Uttar Pradesh - 201301. Tel: 0120-4793200
PATNA 204, Grand Plaza, Frazer Road, Patna - 800001. Tel: 0612-2216045 / 39
PITAMPURA 311, 3rd Floor, A-9, Northex Tower, Pitampura, Delhi -110 034.Tel: 011-47024960/61/62
PUNE 103, ACE Bldg, 1st Floor, 1187/61, Shivaji Nagar, Jangli Maharaj Road, Pune 411004. Tel: 020-41031700 / 71 / 72
RAJKOT 303, Crystal Complex, Above HDFC Bank, 150-Ft Ring Road, Rajkot - 360005. Tel: 0281-3057599
RANCHI Arjan Palace,1st Floor, Near Overbridge Main Road, Ranchi - 834 001. Tel: 0651-6457094, 2332246 / 47
SECUNDERABAD - I 4th Floor, May Fair Complex, S. P. Road, Secunderabad - 500003. Tel: 040-66310955 / 56 / 62
SECUNDERABAD-II 1-8-449, 1st floor, Opp. Police Lane, Above DHL Courier Office, Begumpet, Secunderabad - 500003. Tel: 040-32413658 (ASCIL), 44608000
SURAT 312, 3rd Floor, Jolly Plaza, Athwagate, Surat - 395001. Tel: 0261-3935837
VADODARA (BARODA) 110,1st Floor, Sidharth Complex, R. C. Dutt Road, Alkapuri, Vadodara - 390009. Tel: 0265-6646441/42
VARANASI 4 & 5, 2nd Floor, BC Tower, Shastri Nagar Crossing, Sigra, Varanasi - 221010. Tel: 0542- 2222916 / 917
VIJAYAWADA 39-9-1, Sailok Complex, 1st Floor, Temple Street, Labbipet, Bunder Road, Vijayawada - 520010. Tel: 0866-6455872/3
VISAKHAPATNAM 1st Floor, Praveen Plaza, VIP Road, Near Tycoon Hotel, Siripuram, Visakhapatnam- 530003. Tel: 0891-6458112
REGU
LARS EDITORIAL 03
INVESTIME PRIME NUMBERS 15SELECT PERFORMANCE 17
Printed, published and edited by Mr. K. Joseph Thomas on behalf of Aditya Birla Money Mart Limited. (Formally known as Birla Sun Life Distribution Company Limited) Published from One India Bulls Centre, Tower 1, 14th Floor, Jupiter Mill Compound, 841, Senapati Bapat Marg, Elphinstone Road, Mumbai 400 013.Tel no: 91-22-4356 8300 Fax no. 91-22-4356 8310 and printed at Spenta Multimedia, PeninsulaSpenta, Mathuradas Mill Compound, N. M. Joshi Marg, Lower Parel, Mumbai - 400 013. Tel. : 2481 1010. www.spentamultimedia.comFor advertisement and subscription contact: Dheeraj Prasad, Email: [email protected] Courtesy: www.dreamstime.com, DISCLAIMER CLAUSEThe information published is as per the data provided by various Mutual Funds. While utmost care has been taken to maintain accuracy in the data, the company does not hold any responsibility for errors in the same. The views/opinions expressed in the various articles are that of the author and the company may not subscribe to the same either in part or in full. Any person investing on the basis of the data published in Investime will be doing so at their own risk.
PORTFOLIO COMPOSITION 23EQUITY FUNDS & DEBT FUNDS 31
08
10
14
40
In this article, we look at the effects of the second economic stimulus and that of the US Federal Reserve lining up another US $600 billion stimulus package.
Principal MF unveil an investment strategy, exploring asset allocation based on PE valuation of the index. An interesting option to reduce your portfolio volatility.
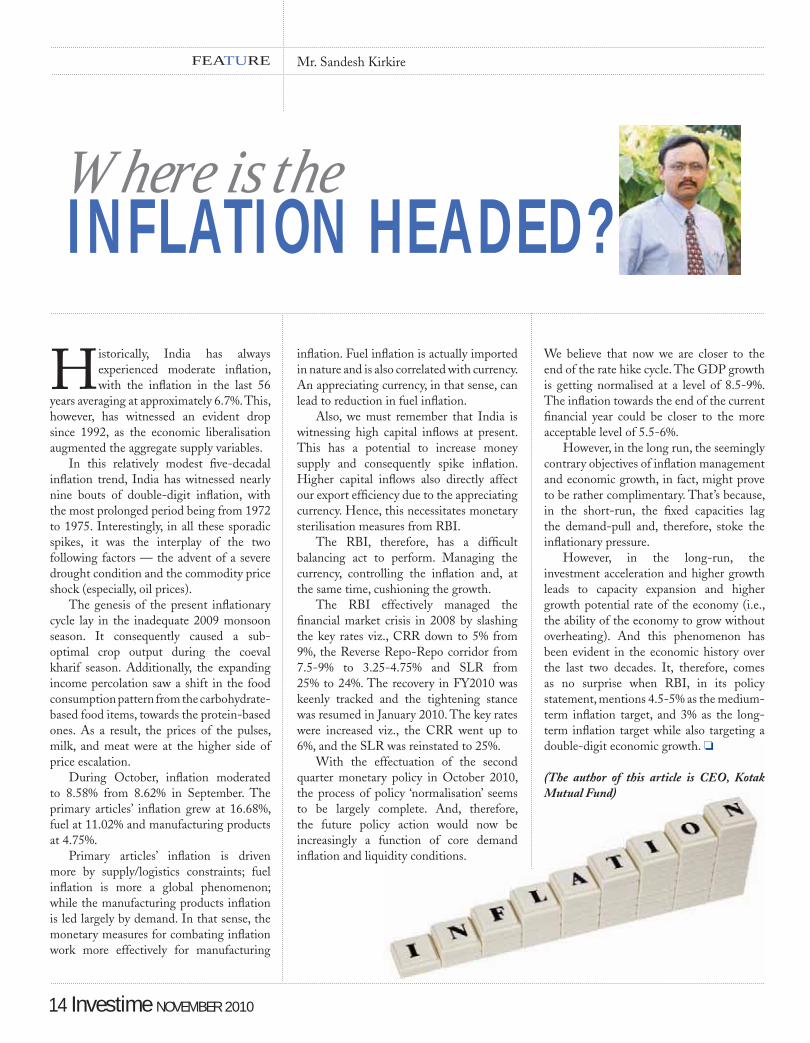
Mr. Sandesh Kirkire helps us in understanding where the current inflation is headed.
Apart from the traditional tools of fiscal and monetary management, the use of the domestic currency unit is becoming increasingly fashionable as an instrument of economic management. The article, authored by K. Joseph Thomas, is sourced from our research archives due to a resurgence of interest in this topic.
Quantitative Easing 2 — a Bubble in the making? Sravan Kumar
A Smarter Way of Deciding Equity Allocation Sudipto Roy
Where is the Inflation Headed? Sandesh Kirkire
The Rupee as a Policy Instrument Commentary
Booking Profits? — Minimise Capital Gain A. N. Shanbagh
12Mr. A. N. Shanbhag uses an educational approach to show how retail investors can take advantage of the soaring indices by selling their stocks and mutual funds not only to book profits but also to try and adjust their profits against any loss-making investments to minimise their capital gains.
Reader’s Paradise Sohini Dey42Written by his friend Kurdo Baksi, this is the biography of Stieg Larsson, author of The Girl with the Dragon Tattoo, The Girl who Played with Fire and The Girl Who Kicked the Hornet’s Nest. Larsson was also well-known as a journalist who fought against racism and extremism. He founded an organisation against racism and violence and was famous as an activist the world over. Steig Larsson, My Friend is a more personal account of his life, as written by his friend.
06The global liquidity tide hits the Indian shores. What would be its spread and backwash effects on India?
INDIA — THE OASIS OF THE WORLD Anand Shah
FEATURE
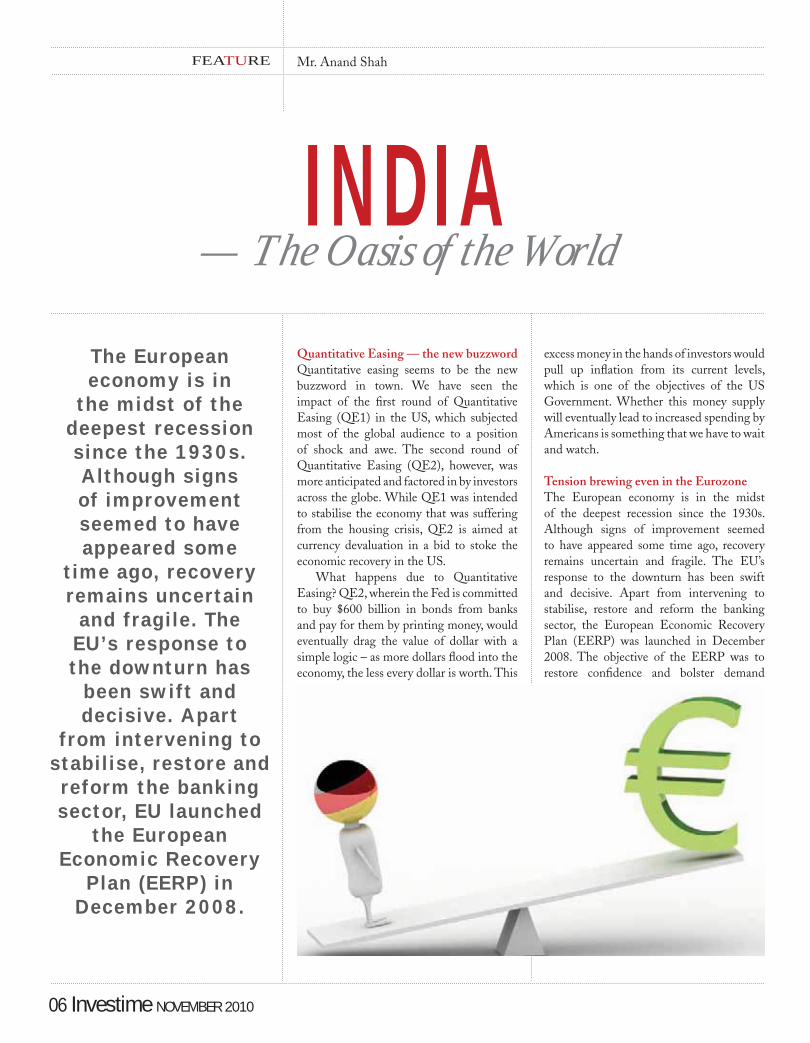
The European economy is in
the midst of the deepest recession since the 1930s. Although signs of improvement seemed to have appeared some
time ago, recovery remains uncertain and fragile. The EU’s response to the downturn has
been swift and decisive. Apart
from intervening to stabilise, restore and reform the banking sector, EU launched
the European Economic Recovery
Plan (EERP) in December 2008.
Mr. Anand Shah
06 Investime NOVEMBER 2010
INDIA — The Oasis of the World
Quantitative Easing — the new buzzword Quantitative easing seems to be the new buzzword in town. We have seen the impact of the first round of Quantitative Easing (QE1) in the US, which subjected most of the global audience to a position of shock and awe. The second round of Quantitative Easing (QE2), however, was more anticipated and factored in by investors across the globe. While QE1 was intended to stabilise the economy that was suffering from the housing crisis, QE2 is aimed at currency devaluation in a bid to stoke the economic recovery in the US.
What happens due to Quantitative Easing? QE2, wherein the Fed is committed to buy $600 billion in bonds from banks and pay for them by printing money, would eventually drag the value of dollar with a simple logic – as more dollars flood into the economy, the less every dollar is worth. This
excess money in the hands of investors would pull up inflation from its current levels, which is one of the objectives of the US Government. Whether this money supply will eventually lead to increased spending by Americans is something that we have to wait and watch.
Tension brewing even in the EurozoneThe European economy is in the midst of the deepest recession since the 1930s. Although signs of improvement seemed to have appeared some time ago, recovery remains uncertain and fragile. The EU’s response to the downturn has been swift and decisive. Apart from intervening to stabilise, restore and reform the banking sector, the European Economic Recovery Plan (EERP) was launched in December 2008. The objective of the EERP was to restore confidence and bolster demand
through a coordinated injection of purchasing power into the economy complemented by strategic investments and measures to shore up business and labour markets. To put it simply, the strategy is to put up rescue funds, demand reforms in the weak economies and hope those steps rebuild confidence in the financial markets so that the Eurozone’s struggling nations can pay back their giant debts. The process started with a $150 billion bailout of Greece in May; when that didn’t squash the contagion, the EU announced a fund of almost $1 trillion to rescue troubled Eurozone economies. However, the bailout program seems to have failed as Ireland recently joined Greece to be the second European nation to seek rescue from the EU. This has, in fact, solidified fears that recession is still around the corner. It is being widely anticipated that Portugal is likely to be the next European nation to resort to bail out. With its high debt, meager growth and political disarray, Portugal has been in the investor spotlight for most of the year, and matters seem to be deteriorating. Please refer to the CDS of Euro countries in 2010 (Fig 1). Fig 1 - EuroZone CDS (2010)
Fig 2 – 10 Yr Bond yields
Thus, with excess availability of money across the world, FIIs are chasing extra returns. The yields on the US Treasuries and other developed nations also continue to be at record lows as compared to emerging economies such as India. Please refer to the benchmark rates in the US, UK,
Japan and India (Fig 2). On the economic front, the global recovery in developed economies such as the US, UK, Japan, etc., is yet to gather pace. As a result of this, the countries are expected to continue to resort to easy monetary policy in order to stimulate demand. As a corollary, the interest rates are expected to remain low for some time and money printing would continue unabated.
So, where will this excess liquidity flow?Emerging economies have been
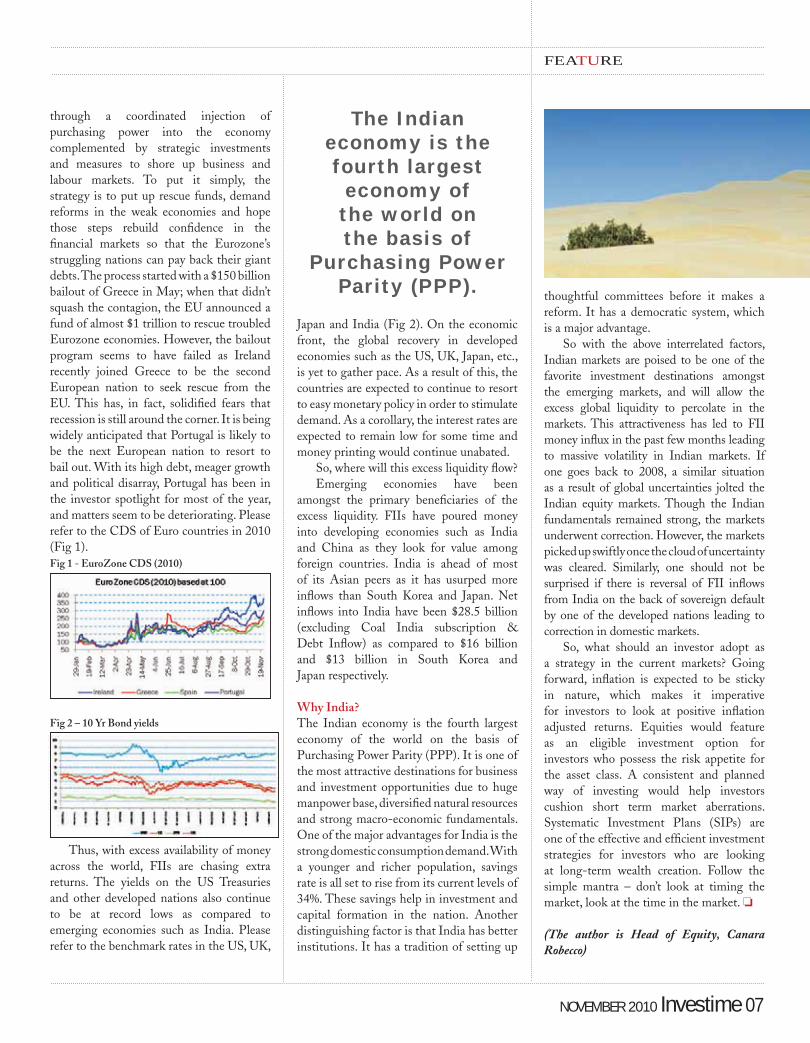
amongst the primary beneficiaries of the excess liquidity. FIIs have poured money into developing economies such as India and China as they look for value among foreign countries. India is ahead of most of its Asian peers as it has usurped more inflows than South Korea and Japan. Net inflows into India have been $28.5 billion (excluding Coal India subscription & Debt Inflow) as compared to $16 billion and $13 billion in South Korea and Japan respectively. Why India?The Indian economy is the fourth largest economy of the world on the basis of Purchasing Power Parity (PPP). It is one of the most attractive destinations for business and investment opportunities due to huge manpower base, diversified natural resources and strong macro-economic fundamentals. One of the major advantages for India is the strong domestic consumption demand. With a younger and richer population, savings rate is all set to rise from its current levels of 34%. These savings help in investment and capital formation in the nation. Another distinguishing factor is that India has better institutions. It has a tradition of setting up
The Indian economy is the fourth largest economy of the world on the basis of
Purchasing Power Parity (PPP). thoughtful committees before it makes a
reform. It has a democratic system, which is a major advantage.
So with the above interrelated factors, Indian markets are poised to be one of the favorite investment destinations amongst the emerging markets, and will allow the excess global liquidity to percolate in the markets. This attractiveness has led to FII money influx in the past few months leading to massive volatility in Indian markets. If one goes back to 2008, a similar situation as a result of global uncertainties jolted the Indian equity markets. Though the Indian fundamentals remained strong, the markets underwent correction. However, the markets picked up swiftly once the cloud of uncertainty was cleared. Similarly, one should not be surprised if there is reversal of FII inflows from India on the back of sovereign default by one of the developed nations leading to correction in domestic markets.
So, what should an investor adopt as a strategy in the current markets? Going forward, inflation is expected to be sticky in nature, which makes it imperative for investors to look at positive inflation adjusted returns. Equities would feature as an eligible investment option for investors who possess the risk appetite for the asset class. A consistent and planned way of investing would help investors cushion short term market aberrations. Systematic Investment Plans (SIPs) are one of the effective and efficient investment strategies for investors who are looking at long-term wealth creation. Follow the simple mantra – don’t look at timing the market, look at the time in the market.
(The author is Head of Equity, Canara Robecco)
FEATURE
NOVEMBER 2010 Investime 07
FEATURE
The tone of the statement from
FOMC shows that the US is ready to print more dollars
to boost their economy and bring inflation back. The move is expected to weaken the US
dollar further, which is advantageous to their fledging
exports. The move is expected to
move funds into risky assets such as gold, emerging
markets equities and commodities, etc.
Mr. Sravan Kumar
08 Investime NOVEMBER 2010
QUANTITATIVE EASING 2 — a Bubble in the making?
In its November meeting, the US Federal Reserve approved additional Quantitative Easing or stimulus
programme to promote a stronger pace of recovery and ensure that inflation over time becomes consistent with its mandate. The Federal Open Market Committee (FOMC) has approved to purchase US $600 billion of treasury securities till the second quarter of 2011, which is about US $75 billion per month. However, FOMC has indicated that the purchase programme is going to be flexible and will regularly review the pace of its purchases and the overall size of the programme.
According to FOMC, this second round of Quantitative Easing is expected to boost its fledging economy and keep the long-term interest low, and for the market have already discounted the programme with a lower bond yield and a weak dollar. The FOMC has not changed the federal funds’ rate from the existing all-time low of 0 to 0.25 per cent. It is expected to remain low for some time now. It has also indicated that it will reinvest principal payments from its securities holdings.
Below is the statement from the FOMC meeting:
“Information received since the Federal Open Market Committee met in September confirms that the pace of recovery in output and employment continues to be slow. Household spending is increasing gradually, but remains constrained by high unemployment, modest income growth, lower housing wealth, and tight credit. Business spending on equipment and software
is rising, though less rapidly than earlier in the year, while investment in non-residential structures continues to be weak. Employers remain reluctant to add to payrolls. Housing starts continue to be depressed. Longer-term inflation expectations have remained stable, but measures of underlying inflation have trended lower in recent quarters.
Consistent with its statutory mandate, the Committee seeks to foster maximum employment and price stability. Currently, the unemployment rate is elevated, and measures of underlying inflation are somewhat low, relative to levels that the Committee judges to be consistent, over the longer run, with its dual mandate. Although the Committee anticipates a gradual return to higher levels of resource utilisation in a context of price stability, progress towards its objectives has been disappointingly slow.
To promote a stronger pace of economic recovery and to help ensure that inflation,
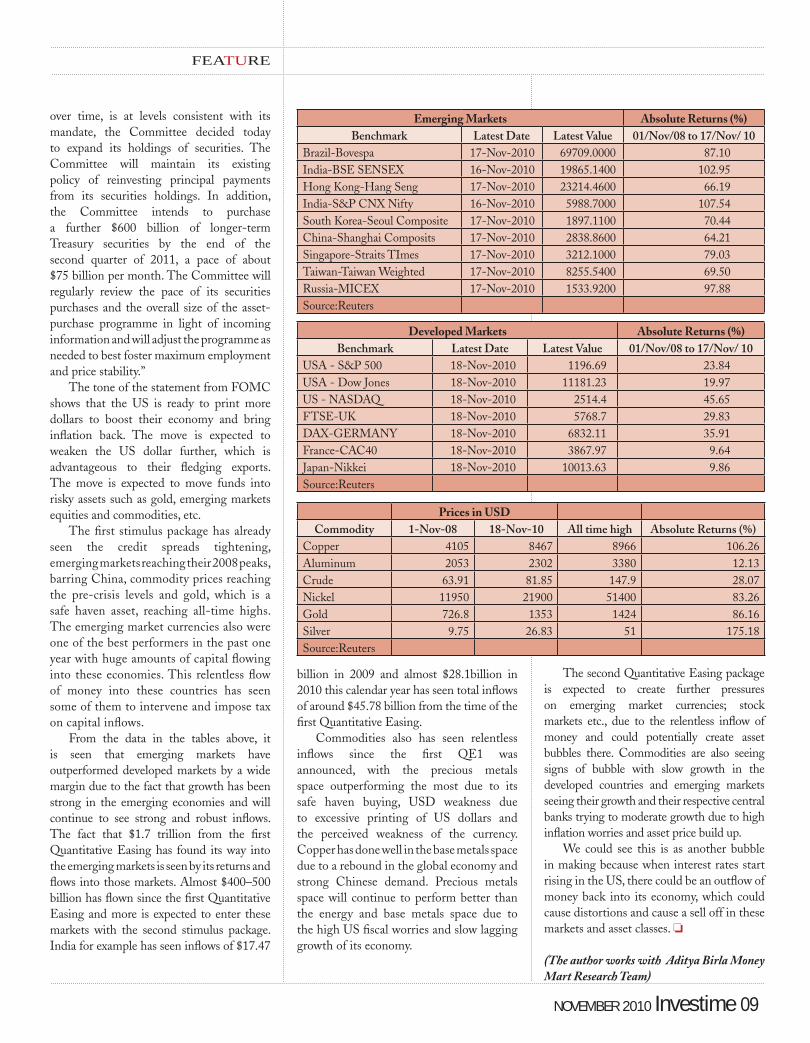
Emerging Markets Absolute Returns (%)Benchmark Latest Date Latest Value 01/Nov/08 to 17/Nov/ 10
Brazil-Bovespa 17-Nov-2010 69709.0000 87.10India-BSE SENSEX 16-Nov-2010 19865.1400 102.95Hong Kong-Hang Seng 17-Nov-2010 23214.4600 66.19India-S&P CNX Nifty 16-Nov-2010 5988.7000 107.54South Korea-Seoul Composite 17-Nov-2010 1897.1100 70.44China-Shanghai Composits 17-Nov-2010 2838.8600 64.21Singapore-Straits TImes 17-Nov-2010 3212.1000 79.03Taiwan-Taiwan Weighted 17-Nov-2010 8255.5400 69.50Russia-MICEX 17-Nov-2010 1533.9200 97.88Source:Reuters
Developed Markets Absolute Returns (%)Benchmark Latest Date Latest Value 01/Nov/08 to 17/Nov/ 10
USA - S&P 500 18-Nov-2010 1196.69 23.84USA - Dow Jones 18-Nov-2010 11181.23 19.97US - NASDAQ 18-Nov-2010 2514.4 45.65FTSE-UK 18-Nov-2010 5768.7 29.83DAX-GERMANY 18-Nov-2010 6832.11 35.91France-CAC40 18-Nov-2010 3867.97 9.64Japan-Nikkei 18-Nov-2010 10013.63 9.86Source:Reuters
over time, is at levels consistent with its mandate, the Committee decided today to expand its holdings of securities. The Committee will maintain its existing policy of reinvesting principal payments from its securities holdings. In addition, the Committee intends to purchase a further $600 billion of longer-term Treasury securities by the end of the second quarter of 2011, a pace of about $75 billion per month. The Committee will regularly review the pace of its securities purchases and the overall size of the asset-purchase programme in light of incoming information and will adjust the programme as needed to best foster maximum employment and price stability.”
The tone of the statement from FOMC shows that the US is ready to print more dollars to boost their economy and bring inflation back. The move is expected to weaken the US dollar further, which is advantageous to their fledging exports. The move is expected to move funds into risky assets such as gold, emerging markets equities and commodities, etc.
The first stimulus package has already seen the credit spreads tightening, emerging markets reaching their 2008 peaks, barring China, commodity prices reaching the pre-crisis levels and gold, which is a safe haven asset, reaching all-time highs. The emerging market currencies also were one of the best performers in the past one year with huge amounts of capital flowing into these economies. This relentless flow of money into these countries has seen some of them to intervene and impose tax on capital inflows.
From the data in the tables above, it is seen that emerging markets have outperformed developed markets by a wide margin due to the fact that growth has been strong in the emerging economies and will continue to see strong and robust inflows. The fact that $1.7 trillion from the first Quantitative Easing has found its way into the emerging markets is seen by its returns and flows into those markets. Almost $400–500 billion has flown since the first Quantitative Easing and more is expected to enter these markets with the second stimulus package. India for example has seen inflows of $17.47
billion in 2009 and almost $28.1billion in 2010 this calendar year has seen total inflows of around $45.78 billion from the time of the first Quantitative Easing.
Commodities also has seen relentless inflows since the first QE1 was announced, with the precious metals space outperforming the most due to its safe haven buying, USD weakness due to excessive printing of US dollars and the perceived weakness of the currency. Copper has done well in the base metals space due to a rebound in the global economy and strong Chinese demand. Precious metals space will continue to perform better than the energy and base metals space due to the high US fiscal worries and slow lagging growth of its economy.
NOVEMBER 2010 Investime 09
The second Quantitative Easing package is expected to create further pressures on emerging market currencies; stock markets etc., due to the relentless inflow of money and could potentially create asset bubbles there. Commodities are also seeing signs of bubble with slow growth in the developed countries and emerging markets seeing their growth and their respective central banks trying to moderate growth due to high inflation worries and asset price build up.
We could see this is as another bubble in making because when interest rates start rising in the US, there could be an outflow of money back into its economy, which could cause distortions and cause a sell off in these markets and asset classes.
(The author works with Aditya Birla Money Mart Research Team)
Prices in USDCommodity 1-Nov-08 18-Nov-10 All time high Absolute Returns (%)
Copper 4105 8467 8966 106.26Aluminum 2053 2302 3380 12.13Crude 63.91 81.85 147.9 28.07Nickel 11950 21900 51400 83.26Gold 726.8 1353 1424 86.16Silver 9.75 26.83 51 175.18Source:Reuters
FEATURE
FEATURE Mr. Sudipto Roy
10 Investime NOVEMBER 2010
EQUITY ALLOCATIONA Smarter Way of Deciding
These days, one of the frequently asked questions comes from investors who have lost out on the recent market
rally, enquiring about the market levels to re-enter the markets. In fact, this is the most frequently asked questions before and after major market movements. More often than not, retail investors miss out on major market rallies and redeem their investments during the worst possible times.
To understand the reasons for such behaviour, we need to understand the investors’ psyche behind these decisions. It is said that fear and greed are two of the greatest impediments to rationale investing. During times when equity markets are in distress, there is an opportunity to invest for long term at attractive levels. Yet, many of us would concur that the fear of further market correction takes over and the investors are not able to fully capture the available opportunity. During such times, to be cautious seems to be the most rational action. The information flow at such times makes us justify our cautious approach. Similarly, during bullish times, the information flow is overtly positive, leading most investors to believe that the markets will continue to rally, finding newer reasons for the same. Greed takes over!
The most important rule for making money from any investment is to buy at a low price and sell it at a high price. This rule applies to equities, bonds, real estate or any other investment. This rule is a common sense thing and almost every investor agrees and vouches that they work towards it. Yet, in practice, many investors invariably are
not able to implement it to the extent they would like to.
Disciplined investing is the solutionA disciplined approach to investing without the influence of human emotions and biases is the solution to this problem. Since these asset allocation decisions are required to be diligently and consistently done over an extended period of time, it is best implemented through a fund that is structured to consistently implement it, strictly adhering to an asset allocation model that is based on time-tested valuation principles.
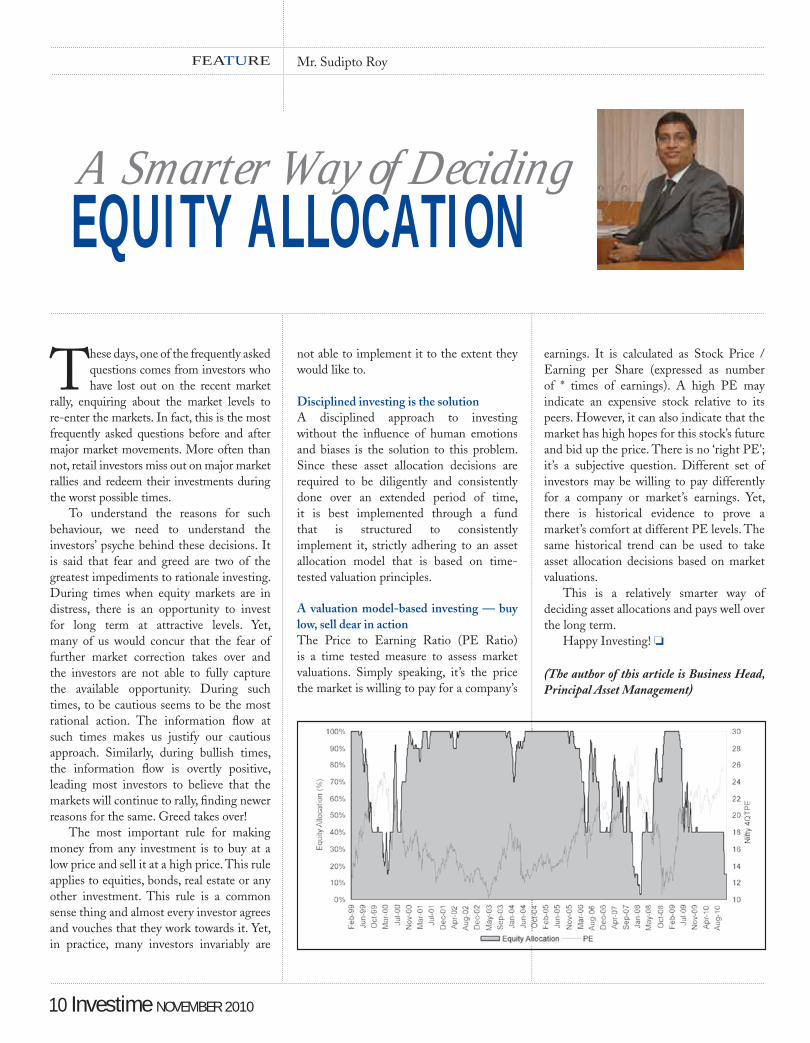
A valuation model-based investing — buy low, sell dear in actionThe Price to Earning Ratio (PE Ratio) is a time tested measure to assess market valuations. Simply speaking, it’s the price the market is willing to pay for a company’s
earnings. It is calculated as Stock Price / Earning per Share (expressed as number of * times of earnings). A high PE may indicate an expensive stock relative to its peers. However, it can also indicate that the market has high hopes for this stock’s future and bid up the price. There is no ‘right PE’; it’s a subjective question. Different set of investors may be willing to pay differently for a company or market’s earnings. Yet, there is historical evidence to prove a market’s comfort at different PE levels. The same historical trend can be used to take asset allocation decisions based on market valuations.
This is a relatively smarter way of deciding asset allocations and pays well over the long term.
Happy Investing!
(The author of this article is Business Head, Principal Asset Management)
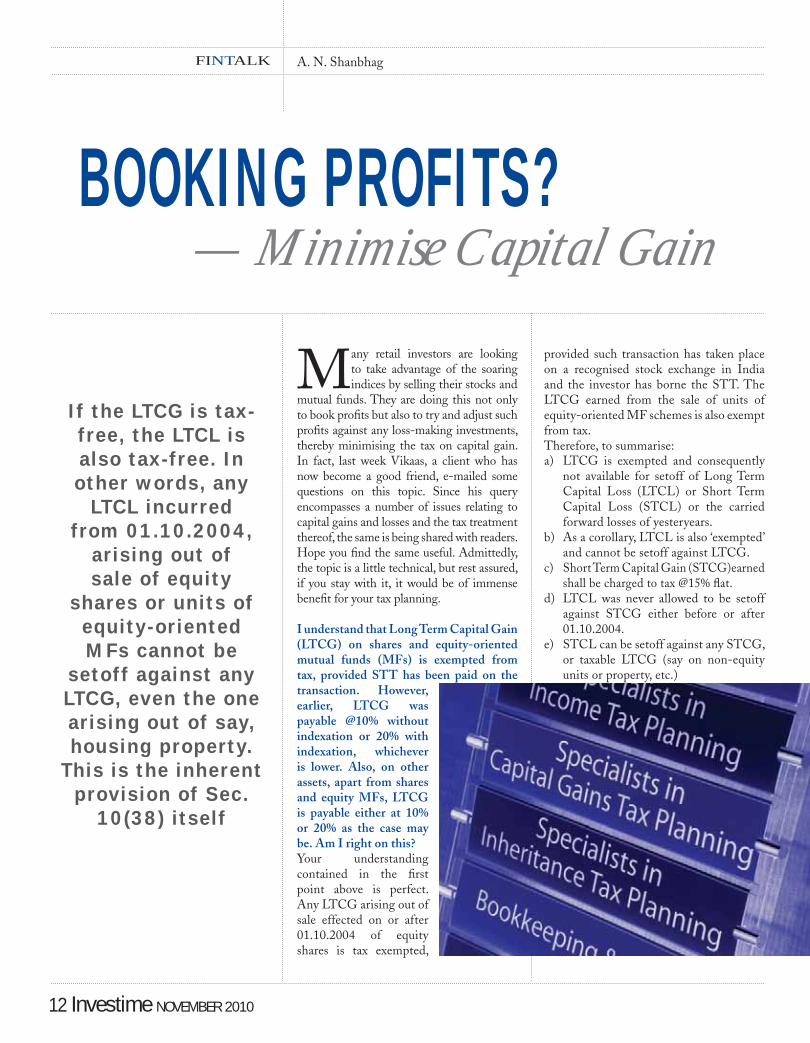
If the LTCG is tax-free, the LTCL is also tax-free. In other words, any
LTCL incurred from 01.10.2004,
arising out of sale of equity
shares or units of equity-oriented MFs cannot be
setoff against any LTCG, even the one arising out of say, housing property.
This is the inherent provision of Sec.
10(38) itself
A. N. Shanbhag FINTALK
12 Investime NOVEMBER 2010
BOOKING PROFITS? — Minimise Capital Gain
Many retail investors are looking to take advantage of the soaring indices by selling their stocks and
mutual funds. They are doing this not only to book profits but also to try and adjust such profits against any loss-making investments, thereby minimising the tax on capital gain. In fact, last week Vikaas, a client who has now become a good friend, e-mailed some questions on this topic. Since his query encompasses a number of issues relating to capital gains and losses and the tax treatment thereof, the same is being shared with readers. Hope you find the same useful. Admittedly, the topic is a little technical, but rest assured, if you stay with it, it would be of immense benefit for your tax planning.
I understand that Long Term Capital Gain (LTCG) on shares and equity-oriented mutual funds (MFs) is exempted from tax, provided STT has been paid on the transaction. However, earlier, LTCG was payable @10% without indexation or 20% with indexation, whichever is lower. Also, on other assets, apart from shares and equity MFs, LTCG is payable either at 10% or 20% as the case may be. Am I right on this?Your understanding contained in the first point above is perfect. Any LTCG arising out of sale effected on or after 01.10.2004 of equity shares is tax exempted,
provided such transaction has taken place on a recognised stock exchange in India and the investor has borne the STT. The LTCG earned from the sale of units of equity-oriented MF schemes is also exempt from tax.Therefore, to summarise:a) LTCG is exempted and consequently
not available for setoff of Long Term Capital Loss (LTCL) or Short Term Capital Loss (STCL) or the carried forward losses of yesteryears.
b) As a corollary, LTCL is also ‘exempted’ and cannot be setoff against LTCG.
c) Short Term Capital Gain (STCG)earned shall be charged to tax @15% flat.
d) LTCL was never allowed to be setoff against STCG either before or after 01.10.2004.
e) STCL can be setoff against any STCG, or taxable LTCG (say on non-equity units or property, etc.)
The point regarding setoff requires further discussion. The Income Tax Act draws a boundary around capital gain incomes and losses. In other words, capital losses can only be setoff against capital gains — other incomes such as salary or business income cannot be used for setoff. Now, LTCL can be setoff only against taxable LTCG. However, STCL can be setoff against both STCG as well as taxable LTCG. This rule existed much before the exemption to LTCG was brought in. The reason is that setting off long-term loss against short-term gains created a sort of tax arbitrage since STCG is taxable at a higher rate (30% in most cases) than LTCG. Therefore, it has been provided by the law that LTCL shall only be setoff against taxable LTCG while STCL may be setoff against both taxable LTCG as well as STCG.STT is not required to be paid on the following types of transactions, even if these take place on or after 01.10.2004:a) Sale or purchase of any asset other
than equities and units of equity-based schemes of MF.
b) Sale or purchase of equity shares that have not taken place on a recognised stock exchange in India.
c) Redemptions or buybacks of its shares, preferential or otherwise by the companies.
On such assets, capital gains and losses shall continue to be taxed as per the old provisions. This means: a) LTCG on non-equity-based schemes
will be charged to tax @10% without indexation or @20% with indexation, whichever is lower.
b) STCG is considered as normal income of the assessee, added to the income and taxed at the slab rate applicable to him. Consequently, the rate depends upon his other income.
If so, the question that now arises is — during the current year, when one incurs some LTCL and LTCG on various sale transactions of equity shares, can the LTCL be setoff against LTCG? If not, then what can be done about such LTCL?If the LTCG is tax-free, the LTCL is also tax-free. In other words, any LTCL
incurred from 01.10.2004, arising out of sale of equity shares or units of equity-oriented MFs cannot be setoff against any LTCG, even the one arising out of say, housing property. This is the inherent provision of Sec. 10(38) itself.
Also, advice if setting-off is permitted against any other income — say, STCG or salary or business income. If, for any reason, the loss cannot be setoff fully, can it be carry forwarded to the next year for possible setoff?In this regard, it is also pertinent to note that setoff, if possible, has to be applied, i.e., the taxpayer does not have the option of paying tax on the gains and carry forward the outstanding losses.
However, it is possible to save tax
on long-term capital gains by using Sec. 54EC, 54F, 54, etc., and carry forward the losses.
Take the case of an individual who has earned taxable LTCG and invested the gains immediately thereafter in NHAI Bonds to come down to nil tax on capital gains. Later, during the same FY, he has incurred a long-term capital loss.
Will the loss have to be setoff against the gains in spite of the taxpayer having invested in the bBonds u/s 54EC?
NOVEMBER 2010 Investime 13
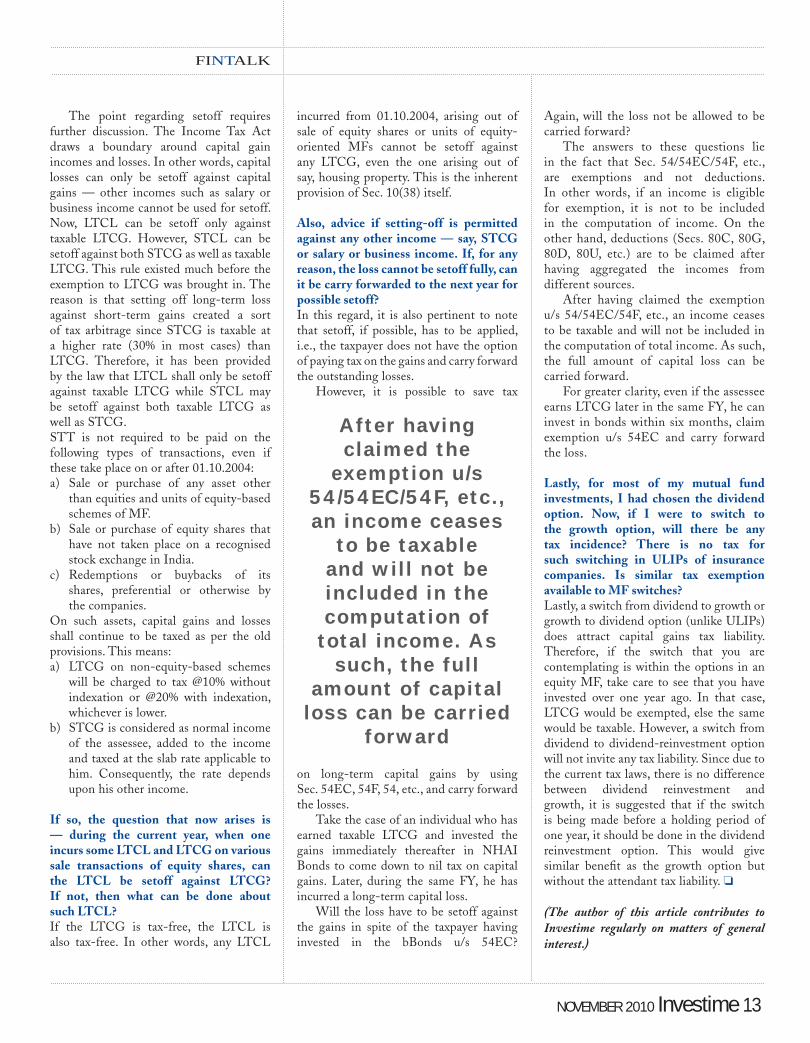
After having claimed the
exemption u/s 54/54EC/54F, etc., an income ceases
to be taxable and will not be included in the computation of total income. As
such, the full amount of capital
loss can be carried forward
FINTALK
Again, will the loss not be allowed to be carried forward?
The answers to these questions lie in the fact that Sec. 54/54EC/54F, etc., are exemptions and not deductions. In other words, if an income is eligible for exemption, it is not to be included in the computation of income. On the other hand, deductions (Secs. 80C, 80G, 80D, 80U, etc.) are to be claimed after having aggregated the incomes from different sources.
After having claimed the exemption u/s 54/54EC/54F, etc., an income ceases to be taxable and will not be included in the computation of total income. As such, the full amount of capital loss can be carried forward.
For greater clarity, even if the assessee earns LTCG later in the same FY, he can invest in bonds within six months, claim exemption u/s 54EC and carry forward the loss.
Lastly, for most of my mutual fund investments, I had chosen the dividend option. Now, if I were to switch to the growth option, will there be any tax incidence? There is no tax for such switching in ULIPs of insurance companies. Is similar tax exemption available to MF switches?Lastly, a switch from dividend to growth or growth to dividend option (unlike ULIPs) does attract capital gains tax liability. Therefore, if the switch that you are contemplating is within the options in an equity MF, take care to see that you have invested over one year ago. In that case, LTCG would be exempted, else the same would be taxable. However, a switch from dividend to dividend-reinvestment option will not invite any tax liability. Since due to the current tax laws, there is no difference between dividend reinvestment and growth, it is suggested that if the switch is being made before a holding period of one year, it should be done in the dividend reinvestment option. This would give similar benefit as the growth option but without the attendant tax liability.
(The author of this article contributes to Investime regularly on matters of general interest.)
We believe that now we are closer to the end of the rate hike cycle. The GDP growth is getting normalised at a level of 8.5-9%. The inflation towards the end of the current financial year could be closer to the more acceptable level of 5.5-6%.
However, in the long run, the seemingly contrary objectives of inflation management and economic growth, in fact, might prove to be rather complimentary. That’s because, in the short-run, the fixed capacities lag the demand-pull and, therefore, stoke the inflationary pressure.
However, in the long-run, the investment acceleration and higher growth leads to capacity expansion and higher growth potential rate of the economy (i.e., the ability of the economy to grow without overheating). And this phenomenon has been evident in the economic history over the last two decades. It, therefore, comes as no surprise when RBI, in its policy statement, mentions 4.5-5% as the medium- term inflation target, and 3% as the long- term inflation target while also targeting a double-digit economic growth.
(The author of this article is CEO, Kotak Mutual Fund)
Mr. Sandesh Kirkire
Historically, India has always experienced moderate inflation, with the inflation in the last 56
years averaging at approximately 6.7%. This, however, has witnessed an evident drop since 1992, as the economic liberalisation augmented the aggregate supply variables.
In this relatively modest five-decadal inflation trend, India has witnessed nearly nine bouts of double-digit inflation, with the most prolonged period being from 1972 to 1975. Interestingly, in all these sporadic spikes, it was the interplay of the two following factors — the advent of a severe drought condition and the commodity price shock (especially, oil prices).
The genesis of the present inflationary cycle lay in the inadequate 2009 monsoon season. It consequently caused a sub-optimal crop output during the coeval kharif season. Additionally, the expanding income percolation saw a shift in the food consumption pattern from the carbohydrate-based food items, towards the protein-based ones. As a result, the prices of the pulses, milk, and meat were at the higher side of price escalation.
During October, inflation moderated to 8.58% from 8.62% in September. The primary articles’ inflation grew at 16.68%, fuel at 11.02% and manufacturing products at 4.75%.
Primary articles’ inflation is driven more by supply/logistics constraints; fuel inflation is more a global phenomenon; while the manufacturing products inflation is led largely by demand. In that sense, the monetary measures for combating inflation work more effectively for manufacturing
14 Investime NOVEMBER 2010
Where is theINFLATION HEADED?
inflation. Fuel inflation is actually imported in nature and is also correlated with currency. An appreciating currency, in that sense, can lead to reduction in fuel inflation.
Also, we must remember that India is witnessing high capital inflows at present. This has a potential to increase money supply and consequently spike inflation. Higher capital inflows also directly affect our export efficiency due to the appreciating currency. Hence, this necessitates monetary sterilisation measures from RBI.
The RBI, therefore, has a difficult balancing act to perform. Managing the currency, controlling the inflation and, at the same time, cushioning the growth.
The RBI effectively managed the financial market crisis in 2008 by slashing the key rates viz., CRR down to 5% from 9%, the Reverse Repo-Repo corridor from 7.5-9% to 3.25-4.75% and SLR from 25% to 24%. The recovery in FY2010 was keenly tracked and the tightening stance was resumed in January 2010. The key rates were increased viz., the CRR went up to 6%, and the SLR was reinstated to 25%.
With the effectuation of the second quarter monetary policy in October 2010, the process of policy ‘normalisation’ seems to be largely complete. And, therefore, the future policy action would now be increasingly a function of core demand inflation and liquidity conditions.
FEATURE
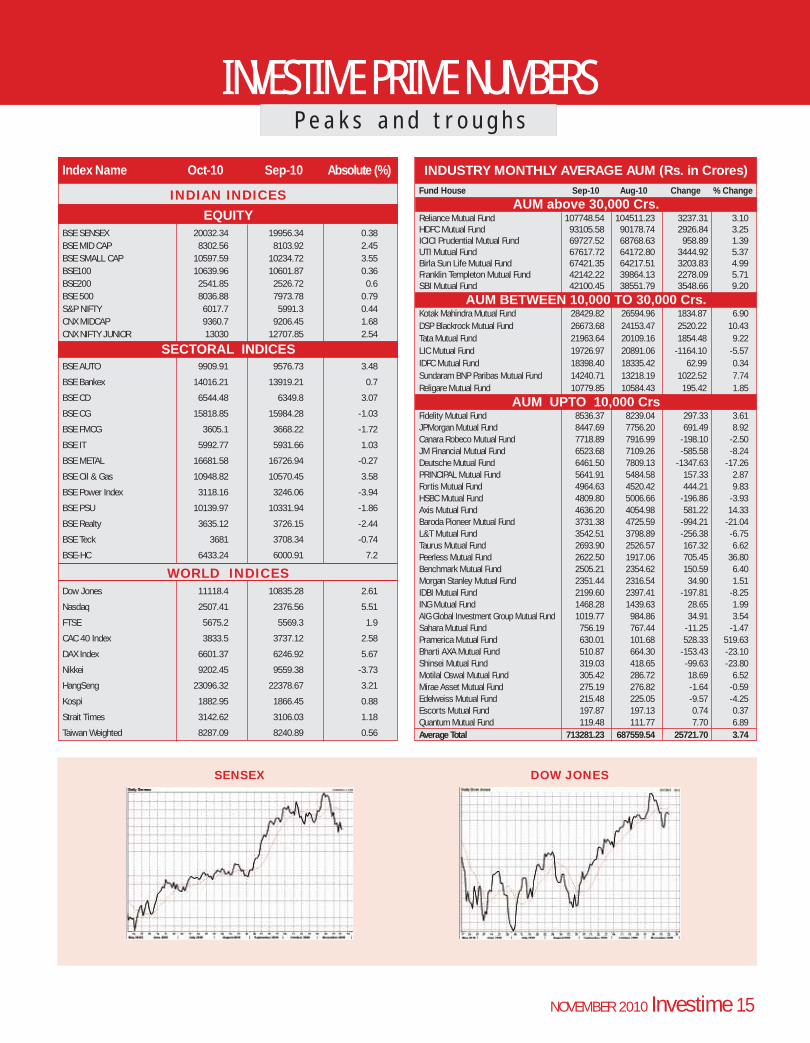
INVESTIME PRIME NUMBERSP e a k s a n d t r o u g h s
NOVEMBER 2010 Investime 15
DOW JONESSENSEX
INDUSTRY MONTHLY AVERAGE AUM (Rs. in Crores)Fund House Sep-10 Aug-10 Change % Change
AUM above 30,000 Crs.Reliance Mutual Fund 107748.54 104511.23 3237.31 3.10HDFC Mutual Fund 93105.58 90178.74 2926.84 3.25ICICI Prudential Mutual Fund 69727.52 68768.63 958.89 1.39UTI Mutual Fund 67617.72 64172.80 3444.92 5.37Birla Sun Life Mutual Fund 67421.35 64217.51 3203.83 4.99Franklin Templeton Mutual Fund 42142.22 39864.13 2278.09 5.71SBI Mutual Fund 42100.45 38551.79 3548.66 9.20
AUM BETWEEN 10,000 TO 30,000 Crs.Kotak Mahindra Mutual Fund 28429.82 26594.96 1834.87 6.90DSP Blackrock Mutual Fund 26673.68 24153.47 2520.22 10.43Tata Mutual Fund 21963.64 20109.16 1854.48 9.22LIC Mutual Fund 19726.97 20891.06 -1164.10 -5.57IDFC Mutual Fund 18398.40 18335.42 62.99 0.34Sundaram BNP Paribas Mutual Fund 14240.71 13218.19 1022.52 7.74Religare Mutual Fund 10779.85 10584.43 195.42 1.85
AUM UPTO 10,000 CrsFidelity Mutual Fund 8536.37 8239.04 297.33 3.61JPMorgan Mutual Fund 8447.69 7756.20 691.49 8.92Canara Robeco Mutual Fund 7718.89 7916.99 -198.10 -2.50JM Financial Mutual Fund 6523.68 7109.26 -585.58 -8.24Deutsche Mutual Fund 6461.50 7809.13 -1347.63 -17.26PRINCIPAL Mutual Fund 5641.91 5484.58 157.33 2.87Fortis Mutual Fund 4964.63 4520.42 444.21 9.83HSBC Mutual Fund 4809.80 5006.66 -196.86 -3.93Axis Mutual Fund 4636.20 4054.98 581.22 14.33Baroda Pioneer Mutual Fund 3731.38 4725.59 -994.21 -21.04L&T Mutual Fund 3542.51 3798.89 -256.38 -6.75Taurus Mutual Fund 2693.90 2526.57 167.32 6.62Peerless Mutual Fund 2622.50 1917.06 705.45 36.80Benchmark Mutual Fund 2505.21 2354.62 150.59 6.40Morgan Stanley Mutual Fund 2351.44 2316.54 34.90 1.51IDBI Mutual Fund 2199.60 2397.41 -197.81 -8.25ING Mutual Fund 1468.28 1439.63 28.65 1.99AIG Global Investment Group Mutual Fund 1019.77 984.86 34.91 3.54Sahara Mutual Fund 756.19 767.44 -11.25 -1.47Pramerica Mutual Fund 630.01 101.68 528.33 519.63Bharti AXA Mutual Fund 510.87 664.30 -153.43 -23.10Shinsei Mutual Fund 319.03 418.65 -99.63 -23.80Motilal Oswal Mutual Fund 305.42 286.72 18.69 6.52Mirae Asset Mutual Fund 275.19 276.82 -1.64 -0.59Edelweiss Mutual Fund 215.48 225.05 -9.57 -4.25Escorts Mutual Fund 197.87 197.13 0.74 0.37Quantum Mutual Fund 119.48 111.77 7.70 6.89Average Total 713281.23 687559.54 25721.70 3.74
Index Name Oct-10 Sep-10 Absolute (%)
INDIAN INDICES
EQUITYBSE SENSEX 20032.34 19956.34 0.38BSE MID CAP 8302.56 8103.92 2.45BSE SMALL CAP 10597.59 10234.72 3.55BSE100 10639.96 10601.87 0.36BSE200 2541.85 2526.72 0.6BSE 500 8036.88 7973.78 0.79S&P NIFTY 6017.7 5991.3 0.44CNX MIDCAP 9360.7 9206.45 1.68CNX NIFTY JUNIOR 13030 12707.85 2.54
SECTORAL INDICESBSE AUTO 9909.91 9576.73 3.48
BSE Bankex 14016.21 13919.21 0.7
BSE CD 6544.48 6349.8 3.07
BSE CG 15818.85 15984.28 -1.03
BSE FMCG 3605.1 3668.22 -1.72
BSE IT 5992.77 5931.66 1.03
BSE METAL 16681.58 16726.94 -0.27
BSE Oil & Gas 10948.82 10570.45 3.58
BSE Power Index 3118.16 3246.06 -3.94
BSE PSU 10139.97 10331.94 -1.86
BSE Realty 3635.12 3726.15 -2.44
BSE Teck 3681 3708.34 -0.74
BSE-HC 6433.24 6000.91 7.2
WORLD INDICESDow Jones 11118.4 10835.28 2.61
Nasdaq 2507.41 2376.56 5.51
FTSE 5675.2 5569.3 1.9
CAC 40 Index 3833.5 3737.12 2.58
DAX Index 6601.37 6246.92 5.67
Nikkei 9202.45 9559.38 -3.73
HangSeng 23096.32 22378.67 3.21
Kospi 1882.95 1866.45 0.88
Strait Times 3142.62 3106.03 1.18
Taiwan Weighted 8287.09 8240.89 0.56
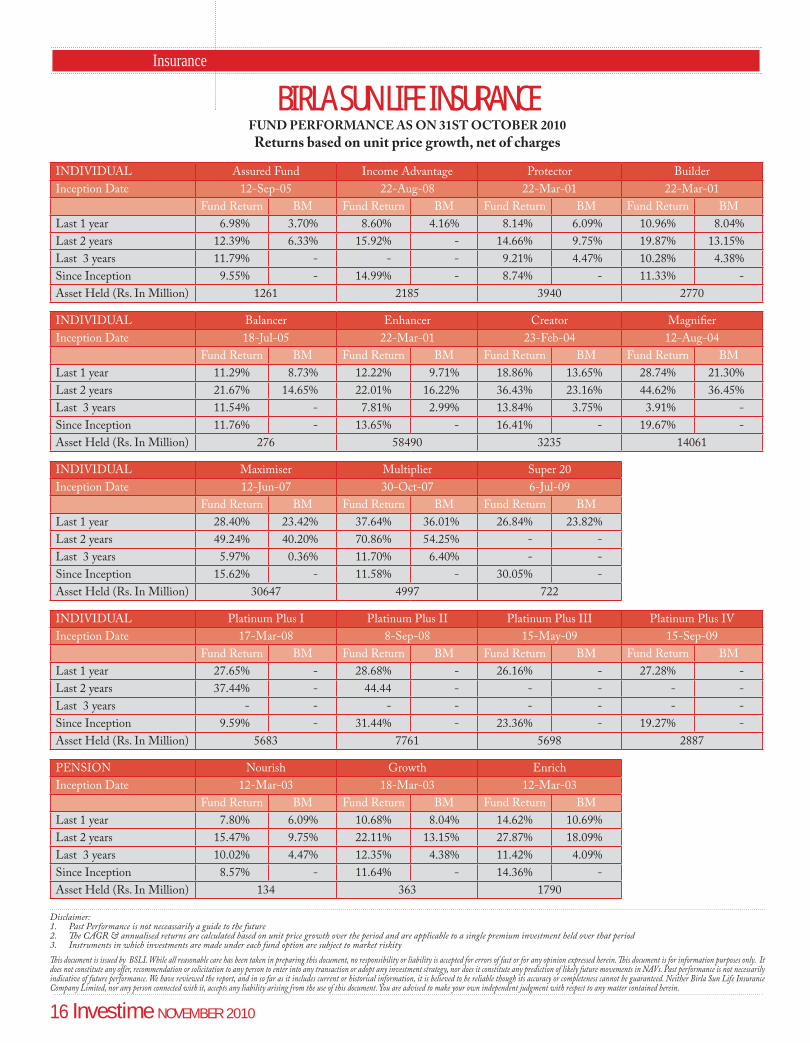
Insurance
BIRLA SUN LIFE INSURANCEFUND PERFORMANCE AS ON 31ST OCTOBER 2010
Returns based on unit price growth, net of charges
16 Investime NOVEMBER 2010
INDIVIDUAL Assured Fund Income Advantage Protector Builder
Inception Date 12-Sep-05 22-Aug-08 22-Mar-01 22-Mar-01
Fund Return BM Fund Return BM Fund Return BM Fund Return BM
Last 1 year 6.98% 3.70% 8.60% 4.16% 8.14% 6.09% 10.96% 8.04%
Last 2 years 12.39% 6.33% 15.92% - 14.66% 9.75% 19.87% 13.15%
Last 3 years 11.79% - - - 9.21% 4.47% 10.28% 4.38%
Since Inception 9.55% - 14.99% - 8.74% - 11.33% -
Asset Held (Rs. In Million) 1261 2185 3940 2770
INDIVIDUAL Balancer Enhancer Creator Magnifier
Inception Date 18-Jul-05 22-Mar-01 23-Feb-04 12-Aug-04
Fund Return BM Fund Return BM Fund Return BM Fund Return BM
Last 1 year 11.29% 8.73% 12.22% 9.71% 18.86% 13.65% 28.74% 21.30%
Last 2 years 21.67% 14.65% 22.01% 16.22% 36.43% 23.16% 44.62% 36.45%
Last 3 years 11.54% - 7.81% 2.99% 13.84% 3.75% 3.91% -
Since Inception 11.76% - 13.65% - 16.41% - 19.67% -
Asset Held (Rs. In Million) 276 58490 3235 14061
INDIVIDUAL Platinum Plus I Platinum Plus II Platinum Plus III Platinum Plus IV
Inception Date 17-Mar-08 8-Sep-08 15-May-09 15-Sep-09
Fund Return BM Fund Return BM Fund Return BM Fund Return BM
Last 1 year 27.65% - 28.68% - 26.16% - 27.28% -
Last 2 years 37.44% - 44.44 - - - - -
Last 3 years - - - - - - - -
Since Inception 9.59% - 31.44% - 23.36% - 19.27% -
Asset Held (Rs. In Million) 5683 7761 5698 2887
INDIVIDUAL Maximiser Multiplier Super 20
Inception Date 12-Jun-07 30-Oct-07 6-Jul-09
Fund Return BM Fund Return BM Fund Return BM
Last 1 year 28.40% 23.42% 37.64% 36.01% 26.84% 23.82%
Last 2 years 49.24% 40.20% 70.86% 54.25% - -
Last 3 years 5.97% 0.36% 11.70% 6.40% - -
Since Inception 15.62% - 11.58% - 30.05% -
Asset Held (Rs. In Million) 30647 4997 722
PENSION Nourish Growth Enrich
Inception Date 12-Mar-03 18-Mar-03 12-Mar-03
Fund Return BM Fund Return BM Fund Return BM
Last 1 year 7.80% 6.09% 10.68% 8.04% 14.62% 10.69%
Last 2 years 15.47% 9.75% 22.11% 13.15% 27.87% 18.09%
Last 3 years 10.02% 4.47% 12.35% 4.38% 11.42% 4.09%
Since Inception 8.57% - 11.64% - 14.36% -
Asset Held (Rs. In Million) 134 363 1790
Disclaimer:Past Performance is not neceassarily a guide to the future 1. The CAGR & annualised returns are calculated based on unit price growth over the period and are applicable to a single premium investment held over that period2. Instruments in which investments are made under each fund option are subject to market riskity 3.
This document is issued by BSLI. While all reasonable care has been taken in preparing this document, no responsibility or liability is accepted for errors of fact or for any opinion expressed herein. This document is for information purposes only. It does not constitute any offer, recommendation or solicitation to any person to enter into any transaction or adopt any investment strategy, nor does it constitute any prediction of likely future movements in NAVs. Past performance is not necessarily indicative of future performance. We have reviewed the report, and in so far as it includes current or historical information, it is believed to be reliable though its accuracy or completeness cannot be guaranteed. Neither Birla Sun Life Insurance Company Limited, nor any person connected with it, accepts any liability arising from the use of this document. You are advised to make your own independent judgment with respect to any matter contained herein.
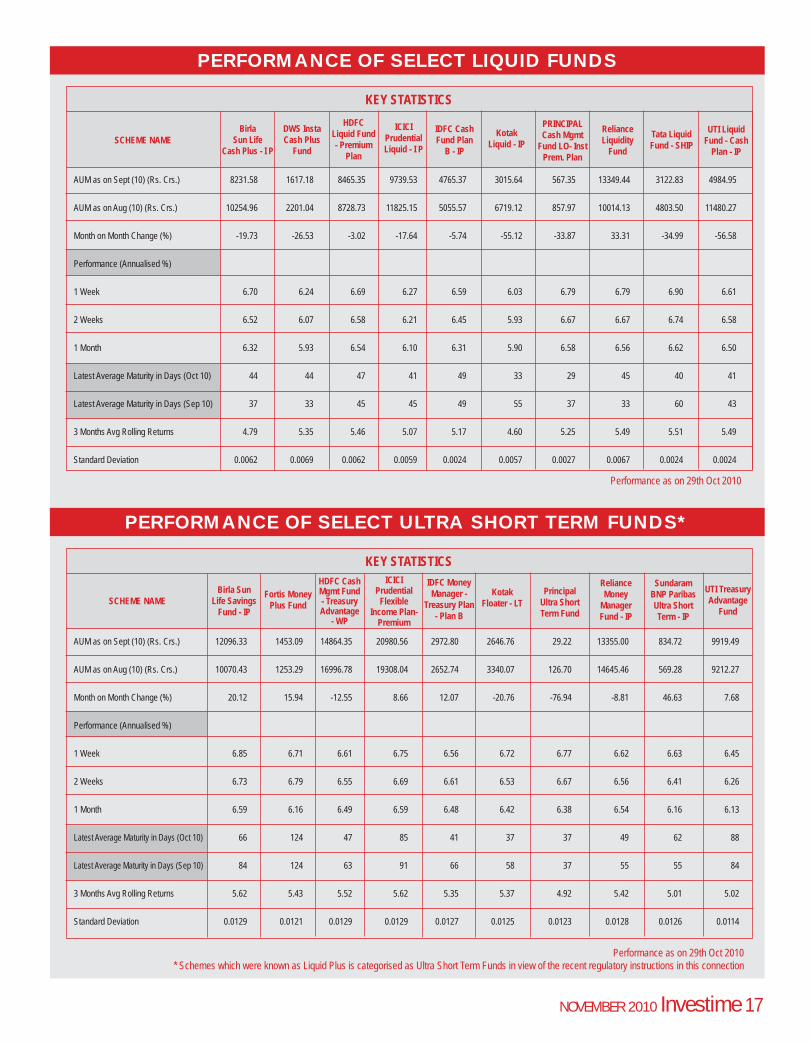
PERFORMANCE OF SELECT LIQUID FUNDS
BirlaSun Life
Cash Plus - I P
KEY STATISTICS
SCHEME NAMEDWS Insta Cash Plus
Fund
HDFCLiquid Fund - Premium
Plan
ICICIPrudentialLiquid - I P
IDFC Cash Fund Plan
B - IP
KotakLiquid - IP
PRINCIPAL Cash Mgmt
Fund LO- Inst Prem. Plan
RelianceLiquidity
Fund
Tata Liquid Fund - SHIP
UTI Liquid Fund - Cash
Plan - IP
NOVEMBER 2010 Investime 17
PERFORMANCE OF SELECT ULTRA SHORT TERM FUNDS*
Birla Sun Life Savings
Fund - IP
KEY STATISTICS
SCHEME NAMEFortis Money
Plus Fund
ICICIPrudential
FlexibleIncome Plan-
Premium
IDFC MoneyManager -
Treasury Plan - Plan B
KotakFloater - LT
PrincipalUltra Short Term Fund
RelianceMoney
ManagerFund - IP
SundaramBNP Paribas Ultra Short Term - IP
UTI Treasury Advantage
Fund
Performance as on 29th Oct 2010
Performance as on 29th Oct 2010* Schemes which were known as Liquid Plus is categorised as Ultra Short Term Funds in view of the recent regulatory instructions in this connection
HDFC Cash Mgmt Fund - Treasury Advantage
- WP
AUM as on Sept (10) (Rs. Crs.) 12096.33 1453.09 14864.35 20980.56 2972.80 2646.76 29.22 13355.00 834.72 9919.49
AUM as on Aug (10) (Rs. Crs.) 10070.43 1253.29 16996.78 19308.04 2652.74 3340.07 126.70 14645.46 569.28 9212.27
Month on Month Change (%) 20.12 15.94 -12.55 8.66 12.07 -20.76 -76.94 -8.81 46.63 7.68
Performance (Annualised %)
1 Week 6.85 6.71 6.61 6.75 6.56 6.72 6.77 6.62 6.63 6.45
2 Weeks 6.73 6.79 6.55 6.69 6.61 6.53 6.67 6.56 6.41 6.26
1 Month 6.59 6.16 6.49 6.59 6.48 6.42 6.38 6.54 6.16 6.13
Latest Average Maturity in Days (Oct 10) 66 124 47 85 41 37 37 49 62 88
Latest Average Maturity in Days (Sep 10) 84 124 63 91 66 58 37 55 55 84
3 Months Avg Rolling Returns 5.62 5.43 5.52 5.62 5.35 5.37 4.92 5.42 5.01 5.02
Standard Deviation 0.0129 0.0121 0.0129 0.0129 0.0127 0.0125 0.0123 0.0128 0.0126 0.0114
AUM as on Sept (10) (Rs. Crs.) 8231.58 1617.18 8465.35 9739.53 4765.37 3015.64 567.35 13349.44 3122.83 4984.95
AUM as on Aug (10) (Rs. Crs.) 10254.96 2201.04 8728.73 11825.15 5055.57 6719.12 857.97 10014.13 4803.50 11480.27
Month on Month Change (%) -19.73 -26.53 -3.02 -17.64 -5.74 -55.12 -33.87 33.31 -34.99 -56.58
Performance (Annualised %)
1 Week 6.70 6.24 6.69 6.27 6.59 6.03 6.79 6.79 6.90 6.61
2 Weeks 6.52 6.07 6.58 6.21 6.45 5.93 6.67 6.67 6.74 6.58
1 Month 6.32 5.93 6.54 6.10 6.31 5.90 6.58 6.56 6.62 6.50
Latest Average Maturity in Days (Oct 10) 44 44 47 41 49 33 29 45 40 41
Latest Average Maturity in Days (Sep 10) 37 33 45 45 49 55 37 33 60 43
3 Months Avg Rolling Returns 4.79 5.35 5.46 5.07 5.17 4.60 5.25 5.49 5.51 5.49
Standard Deviation 0.0062 0.0069 0.0062 0.0059 0.0024 0.0057 0.0027 0.0067 0.0024 0.0024
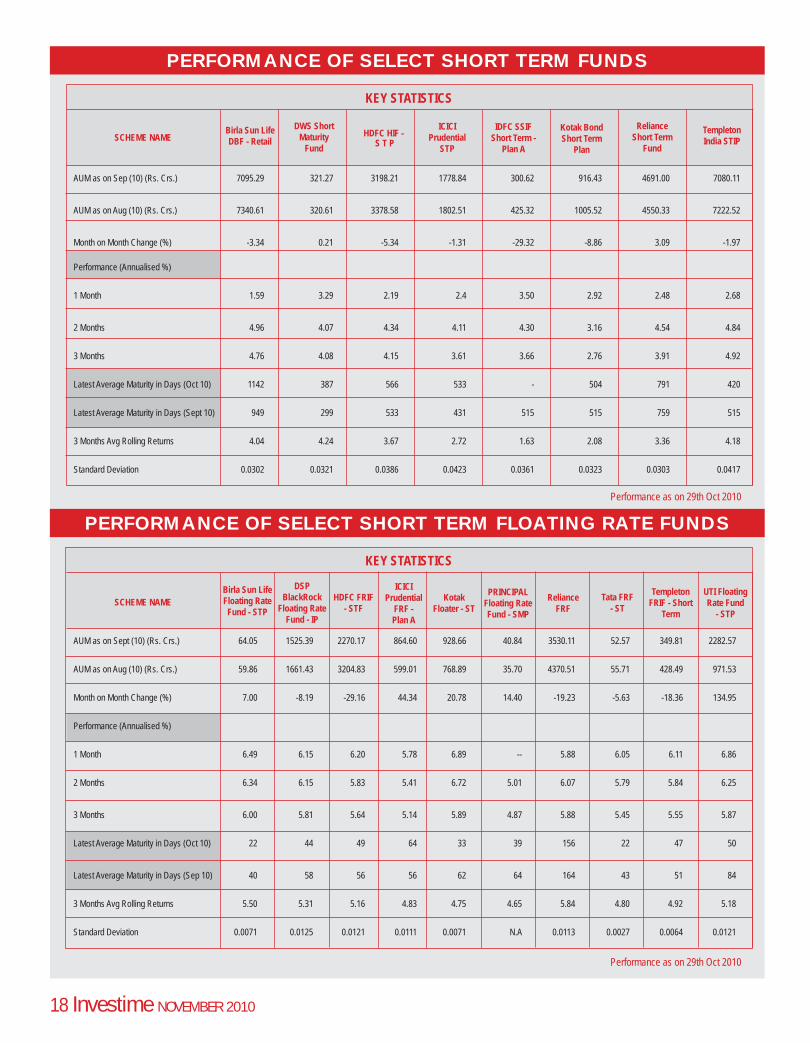
PERFORMANCE OF SELECT SHORT TERM FLOATING RATE FUNDS
Birla Sun Life Floating Rate Fund - STP
AUM as on Sept (10) (Rs. Crs.) 64.05 1525.39 2270.17 864.60 928.66 40.84 3530.11 52.57 349.81 2282.57
AUM as on Aug (10) (Rs. Crs.) 59.86 1661.43 3204.83 599.01 768.89 35.70 4370.51 55.71 428.49 971.53
Month on Month Change (%) 7.00 -8.19 -29.16 44.34 20.78 14.40 -19.23 -5.63 -18.36 134.95
Performance (Annualised %)
1 Month 6.49 6.15 6.20 5.78 6.89 -- 5.88 6.05 6.11 6.86
2 Months 6.34 6.15 5.83 5.41 6.72 5.01 6.07 5.79 5.84 6.25
3 Months 6.00 5.81 5.64 5.14 5.89 4.87 5.88 5.45 5.55 5.87
Latest Average Maturity in Days (Oct 10) 22 44 49 64 33 39 156 22 47 50
Latest Average Maturity in Days (Sep 10) 40 58 56 56 62 64 164 43 51 84
3 Months Avg Rolling Returns 5.50 5.31 5.16 4.83 4.75 4.65 5.84 4.80 4.92 5.18
Standard Deviation 0.0071 0.0125 0.0121 0.0111 0.0071 N.A 0.0113 0.0027 0.0064 0.0121
KEY STATISTICS
SCHEME NAMEDSP
BlackRockFloating Rate
Fund - IP
HDFC FRIF - STF
ICICIPrudential
FRF - Plan A
KotakFloater - ST
RelianceFRF
Templeton FRIF - Short
Term
UTI Floating Rate Fund
- STP
18 Investime NOVEMBER 2010
PERFORMANCE OF SELECT SHORT TERM FUNDS
Birla Sun Life DBF - Retail
AUM as on Sep (10) (Rs. Crs.) 7095.29 321.27 3198.21 1778.84 300.62 916.43 4691.00 7080.11
AUM as on Aug (10) (Rs. Crs.) 7340.61 320.61 3378.58 1802.51 425.32 1005.52 4550.33 7222.52
Month on Month Change (%) -3.34 0.21 -5.34 -1.31 -29.32 -8.86 3.09 -1.97
Performance (Annualised %)
1 Month 1.59 3.29 2.19 2.4 3.50 2.92 2.48 2.68
2 Months 4.96 4.07 4.34 4.11 4.30 3.16 4.54 4.84
3 Months 4.76 4.08 4.15 3.61 3.66 2.76 3.91 4.92
Latest Average Maturity in Days (Oct 10) 1142 387 566 533 - 504 791 420
Latest Average Maturity in Days (Sept 10) 949 299 533 431 515 515 759 515
3 Months Avg Rolling Returns 4.04 4.24 3.67 2.72 1.63 2.08 3.36 4.18
Standard Deviation 0.0302 0.0321 0.0386 0.0423 0.0361 0.0323 0.0303 0.0417
KEY STATISTICS
SCHEME NAMEDWS Short
MaturityFund
IDFC SSIF Short Term -
Plan A
ICICIPrudential
STP
Kotak Bond Short Term
Plan
RelianceShort Term
Fund
Templeton India STIP
Performance as on 29th Oct 2010
Performance as on 29th Oct 2010
HDFC HIF - S T P
PRINCIPAL Floating Rate Fund - SMP
Tata FRF - ST
* Daily Avg. of last Six Months
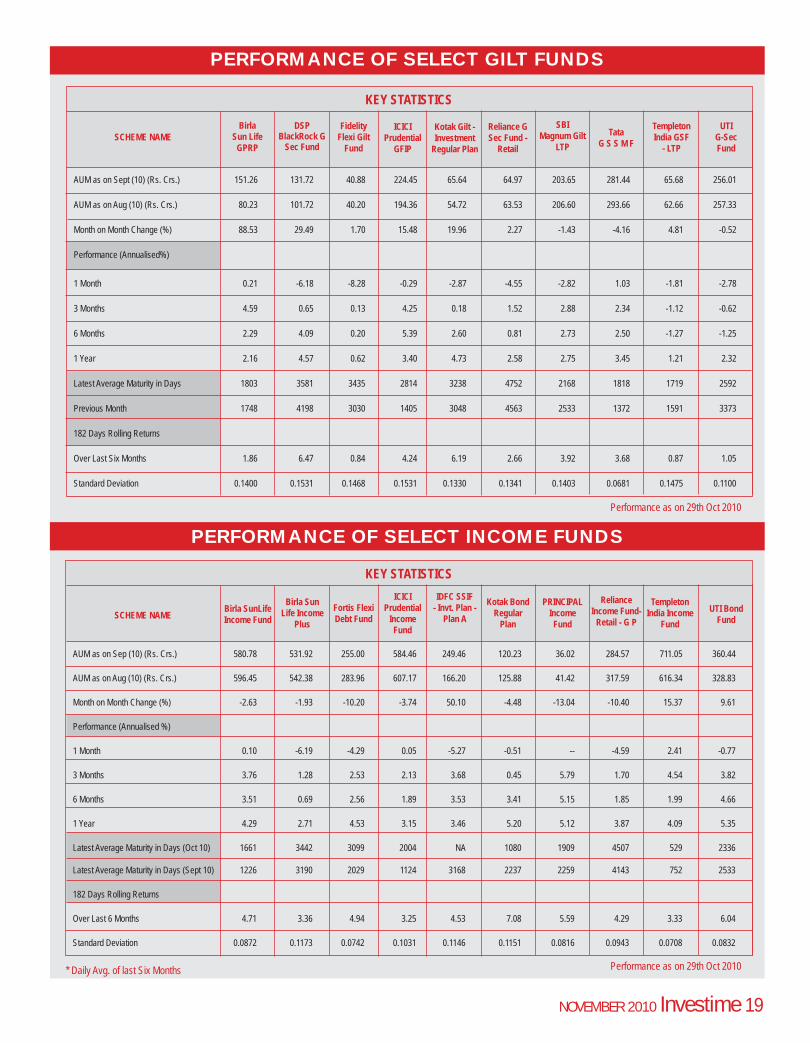
PERFORMANCE OF SELECT GILT FUNDS
PERFORMANCE OF SELECT INCOME FUNDS
BirlaSun Life
GPRP
AUM as on Sept (10) (Rs. Crs.) 151.26 131.72 40.88 224.45 65.64 64.97 203.65 281.44 65.68 256.01
AUM as on Aug (10) (Rs. Crs.) 80.23 101.72 40.20 194.36 54.72 63.53 206.60 293.66 62.66 257.33
Month on Month Change (%) 88.53 29.49 1.70 15.48 19.96 2.27 -1.43 -4.16 4.81 -0.52
Performance (Annualised%)
1 Month 0.21 -6.18 -8.28 -0.29 -2.87 -4.55 -2.82 1.03 -1.81 -2.78
3 Months 4.59 0.65 0.13 4.25 0.18 1.52 2.88 2.34 -1.12 -0.62
6 Months 2.29 4.09 0.20 5.39 2.60 0.81 2.73 2.50 -1.27 -1.25
1 Year 2.16 4.57 0.62 3.40 4.73 2.58 2.75 3.45 1.21 2.32
Latest Average Maturity in Days 1803 3581 3435 2814 3238 4752 2168 1818 1719 2592
Previous Month 1748 4198 3030 1405 3048 4563 2533 1372 1591 3373
182 Days Rolling Returns
Over Last Six Months 1.86 6.47 0.84 4.24 6.19 2.66 3.92 3.68 0.87 1.05
Standard Deviation 0.1400 0.1531 0.1468 0.1531 0.1330 0.1341 0.1403 0.0681 0.1475 0.1100
KEY STATISTICS
SCHEME NAMEDSP
BlackRock G Sec Fund
FidelityFlexi Gilt
Fund
ICICIPrudential
GFIP
Kotak Gilt - Investment
Regular Plan
Reliance G Sec Fund -
Retail
SBIMagnum Gilt
LTPTata
G S S M F
Templeton India GSF
- LTP
UTIG-SecFund
Birla Sun Life Income
Plus
AUM as on Sep (10) (Rs. Crs.) 580.78 531.92 255.00 584.46 249.46 120.23 36.02 284.57 711.05 360.44
AUM as on Aug (10) (Rs. Crs.) 596.45 542.38 283.96 607.17 166.20 125.88 41.42 317.59 616.34 328.83
Month on Month Change (%) -2.63 -1.93 -10.20 -3.74 50.10 -4.48 -13.04 -10.40 15.37 9.61
Performance (Annualised %)
1 Month 0.10 -6.19 -4.29 0.05 -5.27 -0.51 -- -4.59 2.41 -0.77
3 Months 3.76 1.28 2.53 2.13 3.68 0.45 5.79 1.70 4.54 3.82
6 Months 3.51 0.69 2.56 1.89 3.53 3.41 5.15 1.85 1.99 4.66
1 Year 4.29 2.71 4.53 3.15 3.46 5.20 5.12 3.87 4.09 5.35
Latest Average Maturity in Days (Oct 10) 1661 3442 3099 2004 NA 1080 1909 4507 529 2336
Latest Average Maturity in Days (Sept 10) 1226 3190 2029 1124 3168 2237 2259 4143 752 2533
182 Days Rolling Returns
Over Last 6 Months 4.71 3.36 4.94 3.25 4.53 7.08 5.59 4.29 3.33 6.04
Standard Deviation 0.0872 0.1173 0.0742 0.1031 0.1146 0.1151 0.0816 0.0943 0.0708 0.0832
KEY STATISTICS
SCHEME NAMEBirla SunLife Income Fund
Fortis Flexi Debt Fund
ICICIPrudential
IncomeFund
IDFC SSIF - Invt. Plan -
Plan A
Kotak Bond Regular
Plan
PRINCIPAL IncomeFund
RelianceIncome Fund-
Retail - G P
Templeton India Income
FundUTI Bond
Fund
NOVEMBER 2010 Investime 19
Performance as on 29th Oct 2010
Performance as on 29th Oct 2010
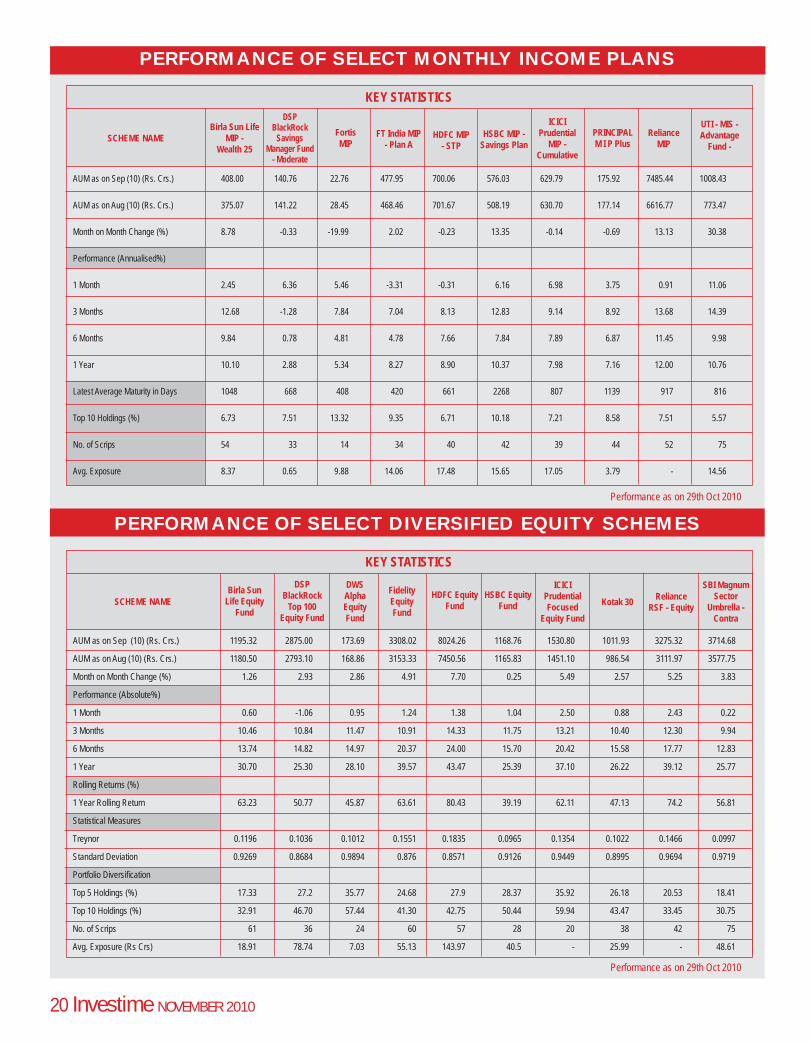
PERFORMANCE OF SELECT MONTHLY INCOME PLANS
Birla Sun Life MIP -
Wealth 25
KEY STATISTICS
SCHEME NAME
DSP BlackRock
SavingsManager Fund
- Moderate
FortisMIP
FT India MIP - Plan A
HSBC MIP - Savings Plan
ICICIPrudential
MIP - Cumulative
PRINCIPAL M I P Plus
UTI - MIS - Advantage
Fund - Reliance
MIP HDFC MIP
- STP
20 Investime NOVEMBER 2010
PERFORMANCE OF SELECT DIVERSIFIED EQUITY SCHEMES
Birla Sun Life Equity
Fund
KEY STATISTICS
SCHEME NAME
DSP BlackRock
Top 100 Equity Fund
DWSAlphaEquityFund
FidelityEquityFund
HSBC Equity Fund
HDFC Equity Fund
ICICIPrudentialFocused
Equity Fund
RelianceRSF - Equity Kotak 30
SBI MagnumSector
Umbrella - Contra
Performance as on 29th Oct 2010
Performance as on 29th Oct 2010
AUM as on Sep (10) (Rs. Crs.) 1195.32 2875.00 173.69 3308.02 8024.26 1168.76 1530.80 1011.93 3275.32 3714.68
AUM as on Aug (10) (Rs. Crs.) 1180.50 2793.10 168.86 3153.33 7450.56 1165.83 1451.10 986.54 3111.97 3577.75
Month on Month Change (%) 1.26 2.93 2.86 4.91 7.70 0.25 5.49 2.57 5.25 3.83
Performance (Absolute%)
1 Month 0.60 -1.06 0.95 1.24 1.38 1.04 2.50 0.88 2.43 0.22
3 Months 10.46 10.84 11.47 10.91 14.33 11.75 13.21 10.40 12.30 9.94
6 Months 13.74 14.82 14.97 20.37 24.00 15.70 20.42 15.58 17.77 12.83
1 Year 30.70 25.30 28.10 39.57 43.47 25.39 37.10 26.22 39.12 25.77
Rolling Returns (%)
1 Year Rolling Return 63.23 50.77 45.87 63.61 80.43 39.19 62.11 47.13 74.2 56.81
Statistical Measures
Treynor 0.1196 0.1036 0.1012 0.1551 0.1835 0.0965 0.1354 0.1022 0.1466 0.0997
Standard Deviation 0.9269 0.8684 0.9894 0.876 0.8571 0.9126 0.9449 0.8995 0.9694 0.9719
Portfolio Diversification
Top 5 Holdings (%) 17.33 27.2 35.77 24.68 27.9 28.37 35.92 26.18 20.53 18.41
Top 10 Holdings (%) 32.91 46.70 57.44 41.30 42.75 50.44 59.94 43.47 33.45 30.75
No. of Scrips 61 36 24 60 57 28 20 38 42 75
Avg. Exposure (Rs Crs) 18.91 78.74 7.03 55.13 143.97 40.5 - 25.99 - 48.61
AUM as on Sep (10) (Rs. Crs.) 408.00 140.76 22.76 477.95 700.06 576.03 629.79 175.92 7485.44 1008.43
AUM as on Aug (10) (Rs. Crs.) 375.07 141.22 28.45 468.46 701.67 508.19 630.70 177.14 6616.77 773.47
Month on Month Change (%) 8.78 -0.33 -19.99 2.02 -0.23 13.35 -0.14 -0.69 13.13 30.38
Performance (Annualised%)
1 Month 2.45 6.36 5.46 -3.31 -0.31 6.16 6.98 3.75 0.91 11.06
3 Months 12.68 -1.28 7.84 7.04 8.13 12.83 9.14 8.92 13.68 14.39
6 Months 9.84 0.78 4.81 4.78 7.66 7.84 7.89 6.87 11.45 9.98
1 Year 10.10 2.88 5.34 8.27 8.90 10.37 7.98 7.16 12.00 10.76
Latest Average Maturity in Days 1048 668 408 420 661 2268 807 1139 917 816
Top 10 Holdings (%) 6.73 7.51 13.32 9.35 6.71 10.18 7.21 8.58 7.51 5.57
No. of Scrips 54 33 14 34 40 42 39 44 52 75
Avg. Exposure 8.37 0.65 9.88 14.06 17.48 15.65 17.05 3.79 - 14.56
DSP BlackRock
OpportunitiesFund
KEY STATISTICS
SCHEME NAMEFortis
Opportunities Fund
DWSInvestmentOpportunity
Fund
FranklinIndia
Opportunity Fund
HSBC India Opportunities
Fund
ICICIPrudentialDynamic
Plan
KotakOpportunities
Fund
RelianceEquity
OpportunitiesFund
Tata Equity Opportunities
Fund
UTIOpportunities
Fund
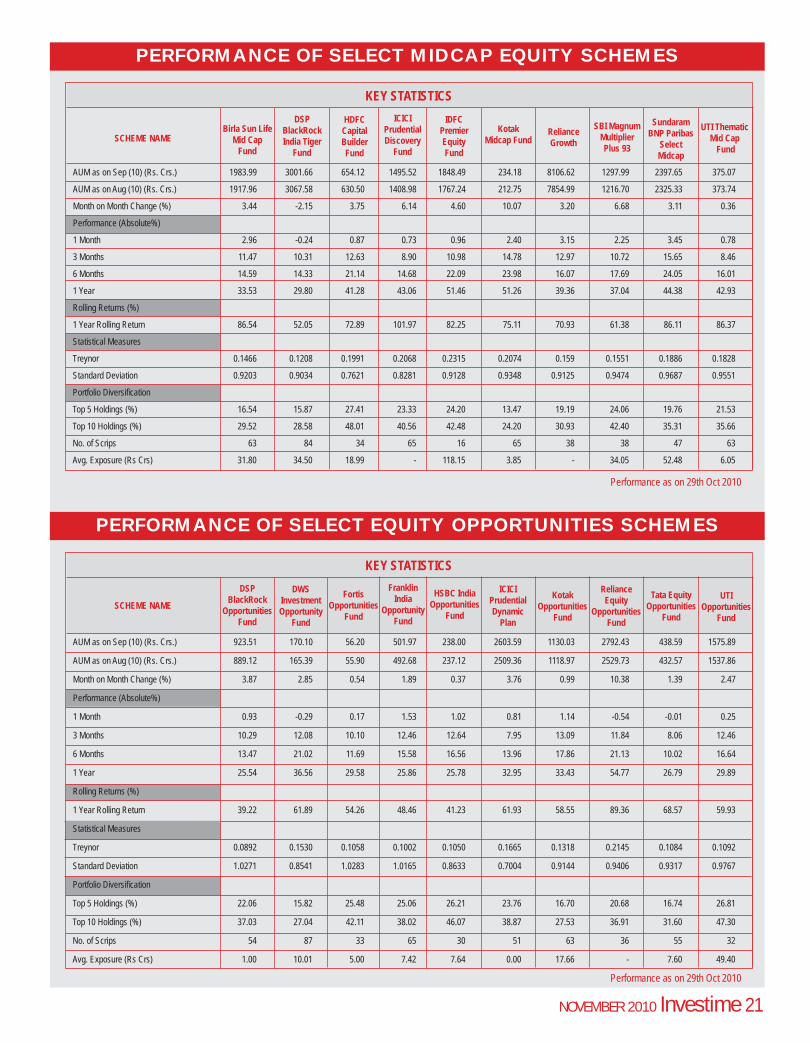
PERFORMANCE OF SELECT EQUITY OPPORTUNITIES SCHEMES
NOVEMBER 2010 Investime 21
Birla Sun Life Mid Cap
Fund
KEY STATISTICS
SCHEME NAME
DSP BlackRockIndia Tiger
Fund
HDFC CapitalBuilderFund
ICICIPrudentialDiscovery
Fund
IDFCPremierEquityFund
UTI Thematic Mid Cap
Fund
KotakMidcap Fund
RelianceGrowth
SBI MagnumMultiplierPlus 93
SundaramBNP Paribas
SelectMidcap
PERFORMANCE OF SELECT MIDCAP EQUITY SCHEMES
AUM as on Sep (10) (Rs. Crs.) 1983.99 3001.66 654.12 1495.52 1848.49 234.18 8106.62 1297.99 2397.65 375.07
AUM as on Aug (10) (Rs. Crs.) 1917.96 3067.58 630.50 1408.98 1767.24 212.75 7854.99 1216.70 2325.33 373.74
Month on Month Change (%) 3.44 -2.15 3.75 6.14 4.60 10.07 3.20 6.68 3.11 0.36
Performance (Absolute%)
1 Month 2.96 -0.24 0.87 0.73 0.96 2.40 3.15 2.25 3.45 0.78
3 Months 11.47 10.31 12.63 8.90 10.98 14.78 12.97 10.72 15.65 8.46
6 Months 14.59 14.33 21.14 14.68 22.09 23.98 16.07 17.69 24.05 16.01
1 Year 33.53 29.80 41.28 43.06 51.46 51.26 39.36 37.04 44.38 42.93
Rolling Returns (%)
1 Year Rolling Return 86.54 52.05 72.89 101.97 82.25 75.11 70.93 61.38 86.11 86.37
Statistical Measures
Treynor 0.1466 0.1208 0.1991 0.2068 0.2315 0.2074 0.159 0.1551 0.1886 0.1828
Standard Deviation 0.9203 0.9034 0.7621 0.8281 0.9128 0.9348 0.9125 0.9474 0.9687 0.9551
Portfolio Diversification
Top 5 Holdings (%) 16.54 15.87 27.41 23.33 24.20 13.47 19.19 24.06 19.76 21.53
Top 10 Holdings (%) 29.52 28.58 48.01 40.56 42.48 24.20 30.93 42.40 35.31 35.66
No. of Scrips 63 84 34 65 16 65 38 38 47 63
Avg. Exposure (Rs Crs) 31.80 34.50 18.99 - 118.15 3.85 - 34.05 52.48 6.05
AUM as on Sep (10) (Rs. Crs.) 923.51 170.10 56.20 501.97 238.00 2603.59 1130.03 2792.43 438.59 1575.89
AUM as on Aug (10) (Rs. Crs.) 889.12 165.39 55.90 492.68 237.12 2509.36 1118.97 2529.73 432.57 1537.86
Month on Month Change (%) 3.87 2.85 0.54 1.89 0.37 3.76 0.99 10.38 1.39 2.47
Performance (Absolute%)
1 Month 0.93 -0.29 0.17 1.53 1.02 0.81 1.14 -0.54 -0.01 0.25
3 Months 10.29 12.08 10.10 12.46 12.64 7.95 13.09 11.84 8.06 12.46
6 Months 13.47 21.02 11.69 15.58 16.56 13.96 17.86 21.13 10.02 16.64
1 Year 25.54 36.56 29.58 25.86 25.78 32.95 33.43 54.77 26.79 29.89
Rolling Returns (%)
1 Year Rolling Return 39.22 61.89 54.26 48.46 41.23 61.93 58.55 89.36 68.57 59.93
Statistical Measures
Treynor 0.0892 0.1530 0.1058 0.1002 0.1050 0.1665 0.1318 0.2145 0.1084 0.1092
Standard Deviation 1.0271 0.8541 1.0283 1.0165 0.8633 0.7004 0.9144 0.9406 0.9317 0.9767
Portfolio Diversification
Top 5 Holdings (%) 22.06 15.82 25.48 25.06 26.21 23.76 16.70 20.68 16.74 26.81
Top 10 Holdings (%) 37.03 27.04 42.11 38.02 46.07 38.87 27.53 36.91 31.60 47.30
No. of Scrips 54 87 33 65 30 51 63 36 55 32
Avg. Exposure (Rs Crs) 1.00 10.01 5.00 7.42 7.64 0.00 17.66 - 7.60 49.40
Performance as on 29th Oct 2010
Performance as on 29th Oct 2010
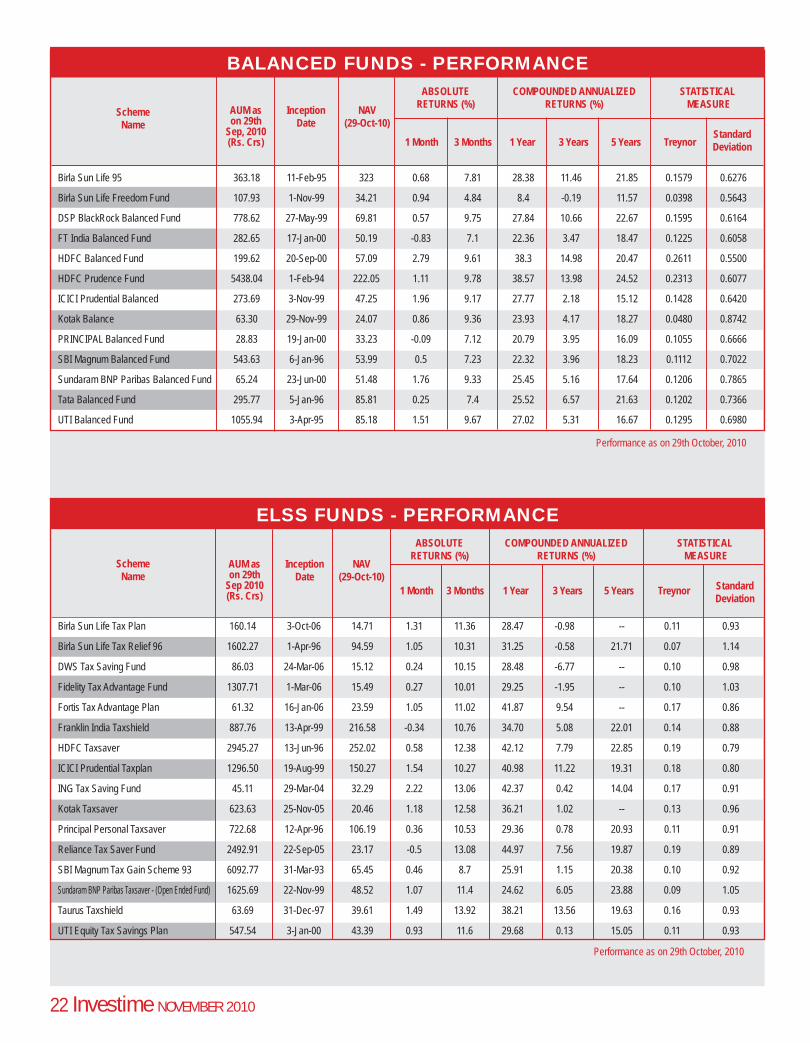
BALANCED FUNDS - PERFORMANCEABSOLUTE
RETURNS (%)
5 Years TreynorStandardDeviation
COMPOUNDED ANNUALIZEDRETURNS (%)
STATISTICALMEASURE
3 Years1 Year3 Months1 Month
Birla Sun Life 95 363.18 11-Feb-95 323 0.68 7.81 28.38 11.46 21.85 0.1579 0.6276
Birla Sun Life Freedom Fund 107.93 1-Nov-99 34.21 0.94 4.84 8.4 -0.19 11.57 0.0398 0.5643
DSP BlackRock Balanced Fund 778.62 27-May-99 69.81 0.57 9.75 27.84 10.66 22.67 0.1595 0.6164
FT India Balanced Fund 282.65 17-Jan-00 50.19 -0.83 7.1 22.36 3.47 18.47 0.1225 0.6058
HDFC Balanced Fund 199.62 20-Sep-00 57.09 2.79 9.61 38.3 14.98 20.47 0.2611 0.5500
HDFC Prudence Fund 5438.04 1-Feb-94 222.05 1.11 9.78 38.57 13.98 24.52 0.2313 0.6077
ICICI Prudential Balanced 273.69 3-Nov-99 47.25 1.96 9.17 27.77 2.18 15.12 0.1428 0.6420
Kotak Balance 63.30 29-Nov-99 24.07 0.86 9.36 23.93 4.17 18.27 0.0480 0.8742
PRINCIPAL Balanced Fund 28.83 19-Jan-00 33.23 -0.09 7.12 20.79 3.95 16.09 0.1055 0.6666
SBI Magnum Balanced Fund 543.63 6-Jan-96 53.99 0.5 7.23 22.32 3.96 18.23 0.1112 0.7022
Sundaram BNP Paribas Balanced Fund 65.24 23-Jun-00 51.48 1.76 9.33 25.45 5.16 17.64 0.1206 0.7865
Tata Balanced Fund 295.77 5-Jan-96 85.81 0.25 7.4 25.52 6.57 21.63 0.1202 0.7366
UTI Balanced Fund 1055.94 3-Apr-95 85.18 1.51 9.67 27.02 5.31 16.67 0.1295 0.6980
SchemeName
NAV (29-Oct-10)
AUM as on 29th
Sep, 2010 (Rs. Crs)
InceptionDate
SchemeName
NAV (29-Oct-10)
AUM as on 29th
Sep 2010 (Rs. Crs)
InceptionDate
ABSOLUTERETURNS (%)
Treynor StandardDeviation
COMPOUNDED ANNUALIZEDRETURNS (%)
STATISTICALMEASURE
3 Years 5 Years1 Year3 Months1 Month
22 Investime NOVEMBER 2010
Performance as on 29th October, 2010
Performance as on 29th October, 2010
Birla Sun Life Tax Plan 160.14 3-Oct-06 14.71 1.31 11.36 28.47 -0.98 -- 0.11 0.93
Birla Sun Life Tax Relief 96 1602.27 1-Apr-96 94.59 1.05 10.31 31.25 -0.58 21.71 0.07 1.14
DWS Tax Saving Fund 86.03 24-Mar-06 15.12 0.24 10.15 28.48 -6.77 -- 0.10 0.98
Fidelity Tax Advantage Fund 1307.71 1-Mar-06 15.49 0.27 10.01 29.25 -1.95 -- 0.10 1.03
Fortis Tax Advantage Plan 61.32 16-Jan-06 23.59 1.05 11.02 41.87 9.54 -- 0.17 0.86
Franklin India Taxshield 887.76 13-Apr-99 216.58 -0.34 10.76 34.70 5.08 22.01 0.14 0.88
HDFC Taxsaver 2945.27 13-Jun-96 252.02 0.58 12.38 42.12 7.79 22.85 0.19 0.79
ICICI Prudential Taxplan 1296.50 19-Aug-99 150.27 1.54 10.27 40.98 11.22 19.31 0.18 0.80
ING Tax Saving Fund 45.11 29-Mar-04 32.29 2.22 13.06 42.37 0.42 14.04 0.17 0.91
Kotak Taxsaver 623.63 25-Nov-05 20.46 1.18 12.58 36.21 1.02 -- 0.13 0.96
Principal Personal Taxsaver 722.68 12-Apr-96 106.19 0.36 10.53 29.36 0.78 20.93 0.11 0.91
Reliance Tax Saver Fund 2492.91 22-Sep-05 23.17 -0.5 13.08 44.97 7.56 19.87 0.19 0.89
SBI Magnum Tax Gain Scheme 93 6092.77 31-Mar-93 65.45 0.46 8.7 25.91 1.15 20.38 0.10 0.92
Sundaram BNP Paribas Taxsaver - (Open Ended Fund) 1625.69 22-Nov-99 48.52 1.07 11.4 24.62 6.05 23.88 0.09 1.05
Taurus Taxshield 63.69 31-Dec-97 39.61 1.49 13.92 38.21 13.56 19.63 0.16 0.93
UTI Equity Tax Savings Plan 547.54 3-Jan-00 43.39 0.93 11.6 29.68 0.13 15.05 0.11 0.93
ELSS FUNDS - PERFORMANCE
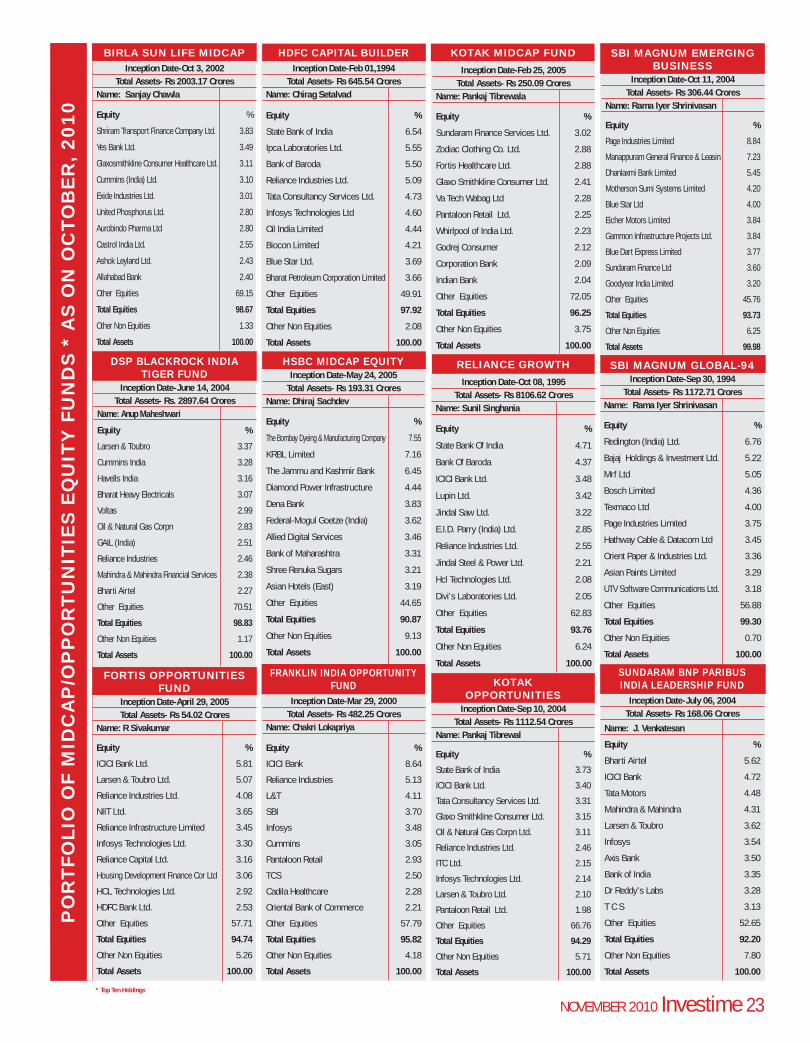
PO
RT
FO
LIO
OF M
IDC
AP
/OP
PO
RT
UN
ITIE
S E
QU
ITY
FU
ND
S *
AS
ON
OC
TO
BE
R,
2010
* Top Ten Holdings
RELIANCE GROWTH
Inception Date-Oct 08, 1995Total Assets- Rs 8106.62 Crores
Name: Sunil Singhania
Equity %
State Bank Of India 4.71
Bank Of Baroda 4.37
ICICI Bank Ltd. 3.48
Lupin Ltd. 3.42
Jindal Saw Ltd. 3.22
E.I.D. Parry (India) Ltd. 2.85
Reliance Industries Ltd. 2.55
Jindal Steel & Power Ltd. 2.21
Hcl Technologies Ltd. 2.08
Divi’s Laboratories Ltd. 2.05
Other Equities 62.83
Total Equities 93.76
Other Non Equities 6.24
Total Assets 100.00FORTIS OPPORTUNITIES
FUNDInception Date-April 29, 2005Total Assets- Rs 54.02 Crores
Name: R Sivakumar
Equity %
ICICI Bank Ltd. 5.81
Larsen & Toubro Ltd. 5.07
Reliance Industries Ltd. 4.08
NIIT Ltd. 3.65
Reliance Infrastructure Limited 3.45
Infosys Technologies Ltd. 3.30
Reliance Capital Ltd. 3.16
Housing Development Finance Cor Ltd 3.06
HCL Technologies Ltd. 2.92
HDFC Bank Ltd. 2.53
Other Equities 57.71
Total Equities 94.74
Other Non Equities 5.26
Total Assets 100.00
KOTAK OPPORTUNITIES
Inception Date-Sep 10, 2004Total Assets- Rs 1112.54 Crores
Name: Pankaj Tibrewal
Equity %
State Bank of India 3.73
ICICI Bank Ltd. 3.40
Tata Consultancy Services Ltd. 3.31
Glaxo Smithkline Consumer Ltd. 3.15
Oil & Natural Gas Corpn Ltd. 3.11
Reliance Industries Ltd. 2.46
ITC Ltd. 2.15
Infosys Technologies Ltd. 2.14
Larsen & Toubro Ltd. 2.10
Pantaloon Retail Ltd. 1.98
Other Equities 66.76
Total Equities 94.29
Other Non Equities 5.71
Total Assets 100.00
FRANKLIN INDIA OPPORTUNITY FUND
Inception Date-Mar 29, 2000 Total Assets- Rs 482.25 Crores
Name: Chakri Lokapriya
Equity %
ICICI Bank 8.64
Reliance Industries 5.13
L&T 4.11
SBI 3.70
Infosys 3.48
Cummins 3.05
Pantaloon Retail 2.93
TCS 2.50
Cadila Healthcare 2.28
Oriental Bank of Commerce 2.21
Other Equities 57.79
Total Equities 95.82
Other Non Equities 4.18
Total Assets 100.00
HSBC MIDCAP EQUITYInception Date-May 24, 2005
Total Assets- Rs 193.31 CroresName: Dhiraj Sachdev
Equity %
The Bombay Dyeing & Manufacturing Company 7.55
KRBL Limited 7.16
The Jammu and Kashmir Bank 6.45
Diamond Power Infrastructure 4.44
Dena Bank 3.83
Federal-Mogul Goetze (India) 3.62
Allied Digital Services 3.46
Bank of Maharashtra 3.31
Shree Renuka Sugars 3.21
Asian Hotels (East) 3.19
Other Equities 44.65
Total Equities 90.87
Other Non Equities 9.13
Total Assets 100.00
SBI MAGNUM GLOBAL-94Inception Date-Sep 30, 1994
Total Assets- Rs 1172.71 CroresName: Rama Iyer Shrinivasan
Equity %
Redington (India) Ltd. 6.76
Bajaj Holdings & Investment Ltd. 5.22
Mrf Ltd 5.05
Bosch Limited 4.36
Texmaco Ltd 4.00
Page Industries Limited 3.75
Hathway Cable & Datacom Ltd 3.45
Orient Paper & Industries Ltd. 3.36
Asian Paints Limited 3.29
UTV Software Communications Ltd. 3.18
Other Equities 56.88
Total Equities 99.30
Other Non Equities 0.70
Total Assets 100.00
SUNDARAM BNP PARIBUS INDIA LEADERSHIP FUND
Inception Date-July 06, 2004Total Assets- Rs 168.06 Crores
Name: J. Venkatesan
Equity %
Bharti Airtel 5.62
ICICI Bank 4.72
Tata Motors 4.48
Mahindra & Mahindra 4.31
Larsen & Toubro 3.62
Infosys 3.54
Axis Bank 3.50
Bank of India 3.35
Dr Reddy’s Labs 3.28
T C S 3.13
Other Equities 52.65
Total Equities 92.20
Other Non Equities 7.80
Total Assets 100.00
BIRLA SUN LIFE MIDCAPInception Date-Oct 3, 2002
Total Assets- Rs 2003.17 CroresName: Sanjay Chawla
Equity %
Shriram Transport Finance Company Ltd. 3.83
Yes Bank Ltd. 3.49
Glaxosmithkline Consumer Healthcare Ltd. 3.11
Cummins (India) Ltd. 3.10
Exide Industries Ltd. 3.01
United Phosphorus Ltd. 2.80
Aurobindo Pharma Ltd 2.80
Castrol India Ltd. 2.55
Ashok Leyland Ltd. 2.43
Allahabad Bank 2.40
Other Equities 69.15
Total Equities 98.67
Other Non Equities 1.33
Total Assets 100.00
HDFC CAPITAL BUILDER Inception Date-Feb 01,1994
Total Assets- Rs 645.54 CroresName: Chirag Setalvad
Equity %
State Bank of India 6.54
Ipca Laboratories Ltd. 5.55
Bank of Baroda 5.50
Reliance Industries Ltd. 5.09
Tata Consultancy Services Ltd. 4.73
Infosys Technologies Ltd 4.60
Oil India Limited 4.44
Biocon Limited 4.21
Blue Star Ltd. 3.69
Bharat Petroleum Corporation Limited 3.66
Other Equities 49.91
Total Equities 97.92
Other Non Equities 2.08
Total Assets 100.00
KOTAK MIDCAP FUND
Inception Date-Feb 25, 2005Total Assets- Rs 250.09 Crores
Name: Pankaj Tibrewala
Equity %
Sundaram Finance Services Ltd. 3.02
Zodiac Clothing Co. Ltd. 2.88
Fortis Healthcare Ltd. 2.88
Glaxo Smithkline Consumer Ltd. 2.41
Va Tech Wabag Ltd 2.28
Pantaloon Retail Ltd. 2.25
Whirlpool of India Ltd. 2.23
Godrej Consumer 2.12
Corporation Bank 2.09
Indian Bank 2.04
Other Equities 72.05
Total Equities 96.25
Other Non Equities 3.75
Total Assets 100.00
DSP BLACKROCK INDIA TIGER FUND
Inception Date-June 14, 2004Total Assets- Rs. 2897.64 Crores
Name: Anup Maheshwari
Equity %
Larsen & Toubro 3.37
Cummins India 3.28
Havells India 3.16
Bharat Heavy Electricals 3.07
Voltas 2.99
Oil & Natural Gas Corpn 2.83
GAIL (India) 2.51
Reliance Industries 2.46
Mahindra & Mahindra Financial Services 2.38
Bharti Airtel 2.27
Other Equities 70.51
Total Equities 98.83
Other Non Equities 1.17
Total Assets 100.00
NOVEMBER 2010 Investime 23
SBI MAGNUM EMERGING BUSINESS
Inception Date-Oct 11, 2004Total Assets- Rs 306.44 Crores
Name: Rama Iyer Shrinivasan
Equity %
Page Industries Limited 8.84
Manappuram General Finance & Leasin 7.23
Dhanlaxmi Bank Limited 5.45
Motherson Sumi Systems Limited 4.20
Blue Star Ltd 4.00
Eicher Motors Limited 3.84
Gammon Infrastructure Projects Ltd. 3.84
Blue Dart Express Limited 3.77
Sundaram Finance Ltd 3.60
Goodyear India Limited 3.20
Other Equities 45.76
Total Equities 93.73
Other Non Equities 6.25
Total Assets 99.98
PO
RT
FO
LIO
OF M
IDC
AP
/OP
PO
RT
UN
ITIE
S E
QU
ITY
FU
ND
S *
AS
ON
OC
TO
BE
R,
2010
SUNDARAM BNP PARIBAS SMILE FUND
Inception Date-Feb 16, 2005Total Assets- Rs 791.60 Crores
Name: S. Krishnakumar
Equity %
TVS Motors 4.57
Ashok Leyland 4.40
Kingfisher Airlines 3.36
Lupin 3.26
Elgi Equipment 3.25
Orchid Chemicals 3.19
Polaris Software 2.70
Ranbaxy 2.45
Indian Bank 2.36
Hindustan Dorr 2.25
Other Equities 67.40
Total Equities 99.20
Other Non Equities 0.80
Total Assets 100.00
UTI MID CAP FUNDInception Date-April 19, 2004
Total Assets- Rs 381.45 CroresName: Anoop Bhaskar
Equity %
Rallis India Ltd. 5.27
Eicher Motors Ltd 5.04
Indus Ind Bank Ltd. 4.00
Lupin Ltd. 3.62
Bank Of Baroda 3.60
Coromandel International Ltd. 3.10
Ashok Leyland Ltd. 2.79
Cadila Healthcare Ltd. 2.77
Bajaj Electricals Ltd. 2.75
Motherson Sumi System Ltd. 2.72
Other Equities 61.55
Total Equities 97.21
Other Non Equities 2.79
Total Assets 100.00
SBI MAGNUM MIDCAP
Inception Date-Apr 15, 2005Total Assets- Rs 325.14 Crores
Name: Sohini Andani
Equity %
Glaxosmithkline Cons.Healthcare Ltd 5.80
Beml Limited 5.64
Swaraj Engines Limited 5.60
United Breweries Limited 5.40
Cadilla Healthcare Limited 4.89
Motherson Sumi Systems Limited 4.80
UTV Software Communications Ltd. 4.43
Elecon Engineering Co. Ltd 4.21
Mindtree Limited 4.19
PTC India Limited 3.55
Other Equities 51.47
Total Equities 100.00
Other Non Equities
Total Assets 100.00
SUNDARAM BNP PARIBAS SELECT MIDCAP
Inception Date- July 31, 2002 Total Assets- Rs 2466.50 Crores
Name: Satish Ramanathan
Equity %
IPCA Labs 4.55
M & M Financial 3.95
Coromandel Fertilizers 3.90
Indraprastha Gas 3.84
SRF 3.53
Mphasis BFL 3.42
Trent 3.09
United Phosphorus 3.07
IndusInd Bank 3.02
Spicejet 2.95
Other Equities 58.29
Total Equities 93.60
Other Non Equities 6.40
Total Assets 100.00
SUNDARAM BNP PARIBAS RURAL INDIA FUNDInception Date-May 18, 2006
Total Assets- Rs 289.36 CroresName: J. Venkatesan
Equity %
Coromandel Fertilizers 3.98
G S F C 3.95
Mahindra & Mahindra 3.92
M & M Financial 3.83
Bharti Airtel 3.65
Escorts 3.63
Karuturi Networks 3.62
United Phosphorus 3.62
Punjab National Bank 3.57
R E C 3.52
Other Equities 57.41
Total Equities 94.70
Other Non Equities 5.30
Total Assets 100.00
FRANKLIN INDIA PRIMA FUND
Inception Date-Dec 15, 1993Total Assets- Rs 978.31 Crores
Name: K. N. Siva Subramanian
Equity %
Federal Bank 5.25
Yes Bank 4.26
Jagran Prakashan 3.80
Pidilite 3.74
Crompton Greaves 3.62
Greaves Cotton 3.55
Gujarat State Petronet 3.42
Voltas 3.27
IPCA Labs 3.16
Indus Ind Bank 2.83
Other Equities 58.46
Total Equities 95.36
Other Non Equities 4.64
Total Assets 100.00
IDFC PREMIER EQUITY FUNDInception Date- October 5, 2005Total Assets- Rs 1890.43 Crores
Name: Kenneth Andrade
Equity %
Reliance Industries Ltd. 7.84
Infosys Technologies Ltd. 6.05
ICICI Bank Ltd. 5.65
Larsen & Toubro Ltd. 4.55
I T C Ltd. 3.79
Housing Development Finance Corporation Ltd. 3.75
State Bank of India 3.43
HDFC Bank Ltd. 3.40
Tata Consultancy Services Ltd. 2.25
Oil & Natural Gas Corporation Ltd. 1.86
Other Equities 7.08
Total Equities 49.65
Other Non Equities 50.35
Total Assets 100.00
TATA EQUITY OPPORTUNITIES
Inception Date-April 16,1999Total Assets- Rs 418 Crores
Name: M Venugopal
Equity %
ICICI Bank Ltd 3.97
Andhra Bank 3.39
Sadbhav Engineering Limited 3.18
Mahindra & Mahindra Ltd. 3.15
Tata Motors Limited 3.05
Larsen & Toubro Ltd. 3.05
Rallis India Limited 3.04
Lupin Ltd 2.96
Oil & Natu. Gas Co. 2.95
Pantaloon Retail (India) Ltd. 2.86
Other Equities 64.90
Total Equities 96.50
Other Non Equities 3.50
Total Assets 100.00
DSP BLACKROCK OPPORTUNITIES
Inception Date-May 16, 2000Total Assets- Rs 870.90 Crores
Name: Anup Maheshwari
Equity %
Infosys Technologies 4.18
Voltas 2.73
Karur Vysya Bank 2.69
Bharti Airtel 2.50
Oracle Financial Services Software 2.47
Tata Consultancy Services 2.25
ITC 2.08
ICICI Bank 2.06
Lupin 2.02
Crompton Greaves 1.96
Other Equities 72.62
Total Equities 97.56
Other Non Equities 2.44
Total Assets 100.00
HSBC INDIA OPPORTUNITIES
Inception Date-Mar 05, 2004Total Assets- Rs 229.16 Crores
Name: Dhimant Shah
Equity %
Bosch 6.15
Reliance Industries 6.03
Bharat Heavy Electricals 4.80
Larsen and Toubro 4.78
State Bank of India 4.45
Infosys Technologies 4.38
ICICI Bank 4.11
Oil and Natural Gas Corporation 4.10
I T C 4.03
HSBC Bank 3.49
Other Equities 43.36
Total Equities 89.68
Other Non Equities 10.32
Total Assets 100.00
RELIANCE EQUITY OPPORTUNITIES
Inception Date-Mar 28, 2005Total Assets- Rs 2830 Crores
Name: Viral Belawala
Equity %
Aventis Pharma Ltd. 4.60
Trent Limited 4.32
Tata Consultancy Services Ltd. 4.09
Maruti Suzuki India Ltd. 3.84
Divi’s Laboratories Ltd. 3.84
State Bank Of India 3.34
Indian Metal And Ferro Alloys Limit 3.32
Info Edge India Limited 3.31
Larsen & Toubro Ltd. 3.22
Dish TV India Limited 3.03
Other Equities 56.06
Total Equities 92.97
Other Non Equities 7.03
Total Assets 100.00
DSP BLACKROCK SMALL AND MIDCAP
Inception Date-Nov 14, 2006Total Assets- Rs 1186.18 Crores
Name: Anup Maheshwari
Equity %
EID Parry India 2.97
Bayer Cropscience 2.84
Thermax 2.75
Tata Chemicals 2.71
Bharat Forge 2.71
Trent 2.59
Eicher Motors 2.40
Info Edge (India) 2.38
Alstom Projects India 2.25
LIC Housing Finance 2.14
Other Equities 70.11
Total Equities 95.85
Other Non Equities 4.15
Total Assets 100.00
* Top Ten Holdings
24 Investime NOVEMBER 2010
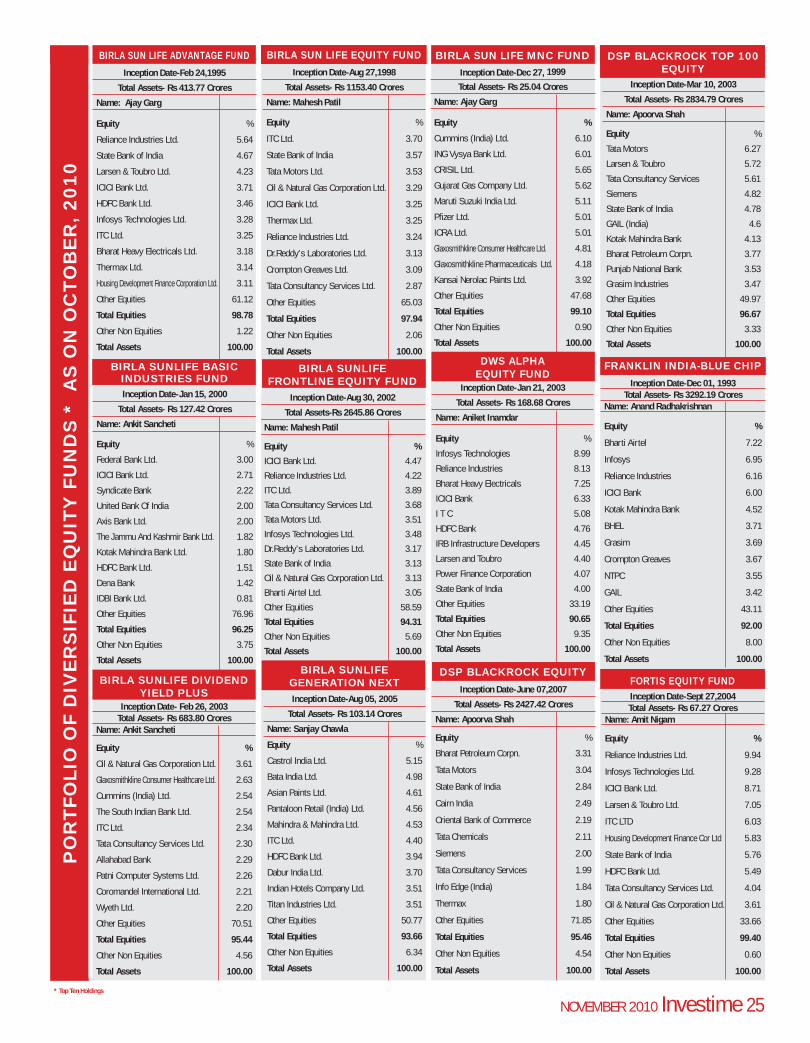
BIRLA SUNLIFE BASIC INDUSTRIES FUND Inception Date-Jan 15, 2000
Total Assets- Rs 127.42 Crores
Name: Ankit Sancheti
Equity %
Federal Bank Ltd. 3.00
ICICI Bank Ltd. 2.71
Syndicate Bank 2.22
United Bank Of India 2.00
Axis Bank Ltd. 2.00
The Jammu And Kashmir Bank Ltd. 1.82
Kotak Mahindra Bank Ltd. 1.80
HDFC Bank Ltd. 1.51
Dena Bank 1.42
IDBI Bank Ltd. 0.81
Other Equities 76.96
Total Equities 96.25
Other Non Equities 3.75
Total Assets 100.00
BIRLA SUNLIFE FRONTLINE EQUITY FUND
Inception Date-Aug 30, 2002
Total Assets-Rs 2645.86 Crores
Name: Mahesh Patil
Equity %
ICICI Bank Ltd. 4.47
Reliance Industries Ltd. 4.22
ITC Ltd. 3.89
Tata Consultancy Services Ltd. 3.68
Tata Motors Ltd. 3.51
Infosys Technologies Ltd. 3.48
Dr.Reddy’s Laboratories Ltd. 3.17
State Bank of India 3.13
Oil & Natural Gas Corporation Ltd. 3.13
Bharti Airtel Ltd. 3.05
Other Equities 58.59
Total Equities 94.31
Other Non Equities 5.69
Total Assets 100.00
PO
RT
FO
LIO
OF D
IVE
RS
IFIE
D E
QU
ITY
FU
ND
S *
A
S O
N O
CT
OB
ER
, 2010
DSP BLACKROCK TOP 100 EQUITY
Inception Date-Mar 10, 2003
Total Assets- Rs 2834.79 Crores
Name: Apoorva Shah
Equity %
Tata Motors 6.27
Larsen & Toubro 5.72
Tata Consultancy Services 5.61
Siemens 4.82
State Bank of India 4.78
GAIL (India) 4.6
Kotak Mahindra Bank 4.13
Bharat Petroleum Corpn. 3.77
Punjab National Bank 3.53
Grasim Industries 3.47
Other Equities 49.97
Total Equities 96.67
Other Non Equities 3.33
Total Assets 100.00
DWS ALPHA EQUITY FUND
Inception Date-Jan 21, 2003
Total Assets- Rs 168.68 Crores
Name: Aniket Inamdar
Equity %
Infosys Technologies 8.99
Reliance Industries 8.13
Bharat Heavy Electricals 7.25
ICICI Bank 6.33
I T C 5.08
HDFC Bank 4.76
IRB Infrastructure Developers 4.45
Larsen and Toubro 4.40
Power Finance Corporation 4.07
State Bank of India 4.00
Other Equities 33.19
Total Equities 90.65
Other Non Equities 9.35
Total Assets 100.00
BIRLA SUNLIFE GENERATION NEXTInception Date-Aug 05, 2005
Total Assets- Rs 103.14 Crores
Name: Sanjay Chawla
Equity %
Castrol India Ltd. 5.15
Bata India Ltd. 4.98
Asian Paints Ltd. 4.61
Pantaloon Retail (India) Ltd. 4.56
Mahindra & Mahindra Ltd. 4.53
ITC Ltd. 4.40
HDFC Bank Ltd. 3.94
Dabur India Ltd. 3.70
Indian Hotels Company Ltd. 3.51
Titan Industries Ltd. 3.51
Other Equities 50.77
Total Equities 93.66
Other Non Equities 6.34
Total Assets 100.00
BIRLA SUN LIFE MNC FUND
Inception Date-Dec 27, 1999
Total Assets- Rs 25.04 Crores
Name: Ajay Garg
Equity %
Cummins (India) Ltd. 6.10
ING Vysya Bank Ltd. 6.01
CRISIL Ltd. 5.65
Gujarat Gas Company Ltd. 5.62
Maruti Suzuki India Ltd. 5.11
Pfizer Ltd. 5.01
ICRA Ltd. 5.01
Glaxosmithkline Consumer Healthcare Ltd. 4.81
Glaxosmithkline Pharmaceuticals Ltd. 4.18
Kansai Nerolac Paints Ltd. 3.92
Other Equities 47.68
Total Equities 99.10
Other Non Equities 0.90
Total Assets 100.00
BIRLA SUN LIFE EQUITY FUND
Inception Date-Aug 27,1998
Total Assets- Rs 1153.40 Crores
Name: Mahesh Patil
Equity %
ITC Ltd. 3.70
State Bank of India 3.57
Tata Motors Ltd. 3.53
Oil & Natural Gas Corporation Ltd. 3.29
ICICI Bank Ltd. 3.25
Thermax Ltd. 3.25
Reliance Industries Ltd. 3.24
Dr.Reddy’s Laboratories Ltd. 3.13
Crompton Greaves Ltd. 3.09
Tata Consultancy Services Ltd. 2.87
Other Equities 65.03
Total Equities 97.94
Other Non Equities 2.06
Total Assets 100.00
DSP BLACKROCK EQUITY
Inception Date-June 07,2007
Total Assets- Rs 2427.42 Crores
Name: Apoorva Shah
Equity %
Bharat Petroleum Corpn. 3.31
Tata Motors 3.04
State Bank of India 2.84
Cairn India 2.49
Oriental Bank of Commerce 2.19
Tata Chemicals 2.11
Siemens 2.00
Tata Consultancy Services 1.99
Info Edge (India) 1.84
Thermax 1.80
Other Equities 71.85
Total Equities 95.46
Other Non Equities 4.54
Total Assets 100.00
BIRLA SUNLIFE DIVIDEND YIELD PLUS
Inception Date- Feb 26, 2003Total Assets- Rs 683.80 Crores
Name: Ankit Sancheti
Equity %
Oil & Natural Gas Corporation Ltd. 3.61
Glaxosmithkline Consumer Healthcare Ltd. 2.63
Cummins (India) Ltd. 2.54
The South Indian Bank Ltd. 2.54
ITC Ltd. 2.34
Tata Consultancy Services Ltd. 2.30
Allahabad Bank 2.29
Patni Computer Systems Ltd. 2.26
Coromandel International Ltd. 2.21
Wyeth Ltd. 2.20
Other Equities 70.51
Total Equities 95.44
Other Non Equities 4.56
Total Assets 100.00
FRANKLIN INDIA-BLUE CHIP
Inception Date-Dec 01, 1993Total Assets- Rs 3292.19 Crores
Name: Anand Radhakrishnan
Equity %
Bharti Airtel 7.22
Infosys 6.95
Reliance Industries 6.16
ICICI Bank 6.00
Kotak Mahindra Bank 4.52
BHEL 3.71
Grasim 3.69
Crompton Greaves 3.67
NTPC 3.55
GAIL 3.42
Other Equities 43.11
Total Equities 92.00
Other Non Equities 8.00
Total Assets 100.00
FORTIS EQUITY FUNDInception Date-Sept 27,2004Total Assets- Rs 67.27 Crores
Name: Amit Nigam
Equity %
Reliance Industries Ltd. 9.94
Infosys Technologies Ltd. 9.28
ICICI Bank Ltd. 8.71
Larsen & Toubro Ltd. 7.05
ITC LTD 6.03
Housing Development Finance Cor Ltd 5.83
State Bank of India 5.76
HDFC Bank Ltd. 5.49
Tata Consultancy Services Ltd. 4.04
Oil & Natural Gas Corporation Ltd. 3.61
Other Equities 33.66
Total Equities 99.40
Other Non Equities 0.60
Total Assets 100.00
BIRLA SUN LIFE ADVANTAGE FUND
Inception Date-Feb 24,1995
Total Assets- Rs 413.77 Crores
Name: Ajay Garg
Equity %
Reliance Industries Ltd. 5.64
State Bank of India 4.67
Larsen & Toubro Ltd. 4.23
ICICI Bank Ltd. 3.71
HDFC Bank Ltd. 3.46
Infosys Technologies Ltd. 3.28
ITC Ltd. 3.25
Bharat Heavy Electricals Ltd. 3.18
Thermax Ltd. 3.14
Housing Development Finance Corporation Ltd. 3.11
Other Equities 61.12
Total Equities 98.78
Other Non Equities 1.22
Total Assets 100.00
* Top Ten Holdings
NOVEMBER 2010 Investime 25
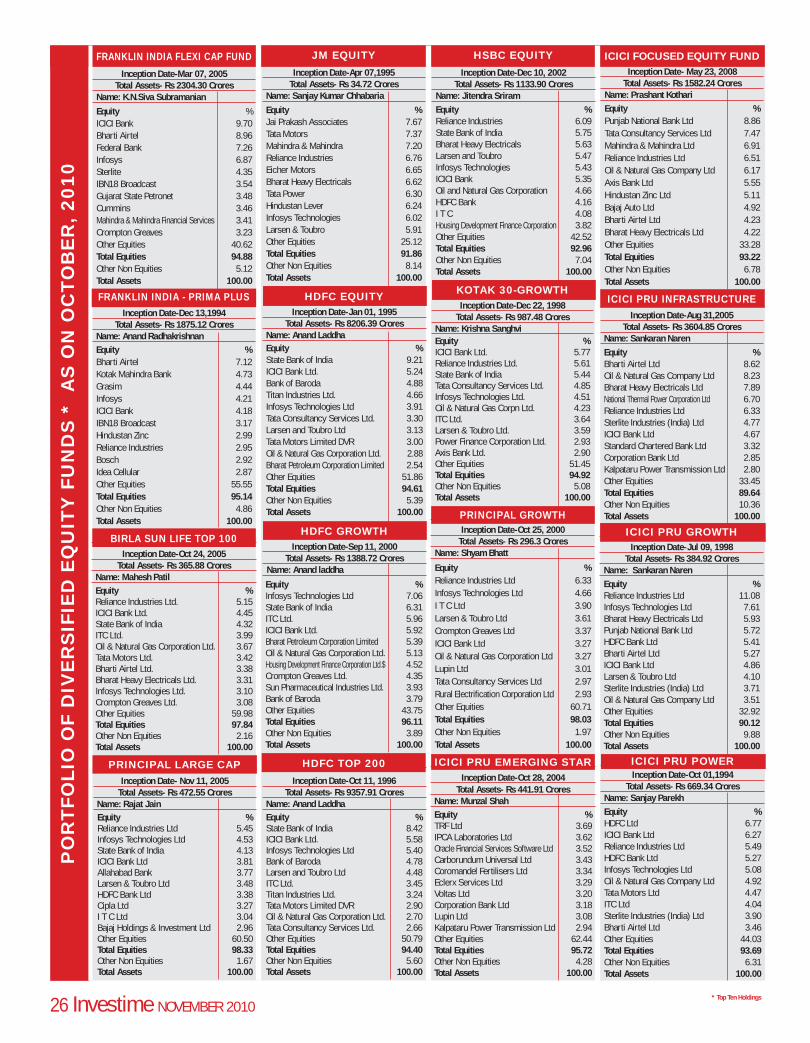
PO
RT
FO
LIO
OF D
IVE
RS
IFIE
D E
QU
ITY
FU
ND
S *
A
S O
N O
CT
OB
ER
, 2010
HDFC GROWTHInception Date-Sep 11, 2000
Total Assets- Rs 1388.72 CroresName: Anand laddha
Equity % Infosys Technologies Ltd 7.06 State Bank of India 6.31 ITC Ltd. 5.96 ICICI Bank Ltd. 5.92 Bharat Petroleum Corporation Limited 5.39 Oil & Natural Gas Corporation Ltd. 5.13 Housing Development Finance Corporation Ltd.$ 4.52 Crompton Greaves Ltd. 4.35 Sun Pharmaceutical Industries Ltd. 3.93 Bank of Baroda 3.79 Other Equities 43.75Total Equities 96.11Other Non Equities 3.89Total Assets 100.00
BIRLA SUN LIFE TOP 100Inception Date-Oct 24, 2005
Total Assets- Rs 365.88 CroresName: Mahesh Patil Equity % Reliance Industries Ltd. 5.15ICICI Bank Ltd. 4.45State Bank of India 4.32ITC Ltd. 3.99Oil & Natural Gas Corporation Ltd. 3.67Tata Motors Ltd. 3.42Bharti Airtel Ltd. 3.38Bharat Heavy Electricals Ltd. 3.31Infosys Technologies Ltd. 3.10Crompton Greaves Ltd. 3.08Other Equities 59.98Total Equities 97.84Other Non Equities 2.16Total Assets 100.00
* Top Ten Holdings
PRINCIPAL LARGE CAPInception Date- Nov 11, 2005
Total Assets- Rs 472.55 CroresName: Rajat Jain Equity % Reliance Industries Ltd 5.45Infosys Technologies Ltd 4.53State Bank of India 4.13ICICI Bank Ltd 3.81Allahabad Bank 3.77Larsen & Toubro Ltd 3.48HDFC Bank Ltd 3.38Cipla Ltd 3.27I T C Ltd 3.04Bajaj Holdings & Investment Ltd 2.96Other Equities 60.50Total Equities 98.33Other Non Equities 1.67Total Assets 100.00
ICICI FOCUSED EQUITY FUNDInception Date- May 23, 2008
Total Assets- Rs 1582.24 CroresName: Prashant Kothari Equity % Punjab National Bank Ltd 8.86Tata Consultancy Services Ltd 7.47Mahindra & Mahindra Ltd 6.91Reliance Industries Ltd 6.51Oil & Natural Gas Company Ltd 6.17Axis Bank Ltd 5.55Hindustan Zinc Ltd 5.11Bajaj Auto Ltd 4.92Bharti Airtel Ltd 4.23Bharat Heavy Electricals Ltd 4.22Other Equities 33.28Total Equities 93.22Other Non Equities 6.78Total Assets 100.00
FRANKLIN INDIA - PRIMA PLUS Inception Date-Dec 13,1994
Total Assets- Rs 1875.12 CroresName: Anand Radhakrishnan Equity % Bharti Airtel 7.12Kotak Mahindra Bank 4.73Grasim 4.44Infosys 4.21ICICI Bank 4.18IBN18 Broadcast 3.17Hindustan Zinc 2.99Reliance Industries 2.95Bosch 2.92Idea Cellular 2.87Other Equities 55.55Total Equities 95.14Other Non Equities 4.86Total Assets 100.00
KOTAK 30-GROWTH Inception Date-Dec 22, 1998
Total Assets- Rs 987.48 CroresName: Krishna Sanghvi Equity % ICICI Bank Ltd. 5.77Reliance Industries Ltd. 5.61State Bank of India 5.44Tata Consultancy Services Ltd. 4.85Infosys Technologies Ltd. 4.51Oil & Natural Gas Corpn Ltd. 4.23ITC Ltd. 3.64Larsen & Toubro Ltd. 3.59Power Finance Corporation Ltd. 2.93Axis Bank Ltd. 2.90Other Equities 51.45Total Equities 94.92Other Non Equities 5.08Total Assets 100.00
HDFC TOP 200
Inception Date-Oct 11, 1996Total Assets- Rs 9357.91 Crores
Name: Anand Laddha Equity % State Bank of India 8.42 ICICI Bank Ltd. 5.58 Infosys Technologies Ltd 5.40 Bank of Baroda 4.78 Larsen and Toubro Ltd 4.48 ITC Ltd. 3.45 Titan Industries Ltd. 3.24 Tata Motors Limited DVR 2.90 Oil & Natural Gas Corporation Ltd. 2.70 Tata Consultancy Services Ltd. 2.66 Other Equities 50.79Total Equities 94.40Other Non Equities 5.60Total Assets 100.00
HSBC EQUITY
Inception Date-Dec 10, 2002Total Assets- Rs 1133.90 Crores
Name: Jitendra Sriram Equity % Reliance Industries 6.09State Bank of India 5.75Bharat Heavy Electricals 5.63Larsen and Toubro 5.47Infosys Technologies 5.43ICICI Bank 5.35Oil and Natural Gas Corporation 4.66HDFC Bank 4.16I T C 4.08Housing Development Finance Corporation 3.82Other Equities 42.52Total Equities 92.96Other Non Equities 7.04Total Assets 100.00
PRINCIPAL GROWTH Inception Date-Oct 25, 2000
Total Assets- Rs 296.3 CroresName: Shyam Bhatt
Equity % Reliance Industries Ltd 6.33Infosys Technologies Ltd 4.66I T C Ltd 3.90Larsen & Toubro Ltd 3.61Crompton Greaves Ltd 3.37ICICI Bank Ltd 3.27Oil & Natural Gas Corporation Ltd 3.27Lupin Ltd 3.01Tata Consultancy Services Ltd 2.97Rural Electrification Corporation Ltd 2.93Other Equities 60.71Total Equities 98.03Other Non Equities 1.97Total Assets 100.00
HDFC EQUITY Inception Date-Jan 01, 1995
Total Assets- Rs 8206.39 CroresName: Anand Laddha Equity % State Bank of India 9.21 ICICI Bank Ltd. 5.24 Bank of Baroda 4.88 Titan Industries Ltd. 4.66 Infosys Technologies Ltd 3.91 Tata Consultancy Services Ltd. 3.30 Larsen and Toubro Ltd 3.13 Tata Motors Limited DVR 3.00 Oil & Natural Gas Corporation Ltd. 2.88 Bharat Petroleum Corporation Limited 2.54 Other Equities 51.86Total Equities 94.61Other Non Equities 5.39Total Assets 100.00
FRANKLIN INDIA FLEXI CAP FUND
Inception Date-Mar 07, 2005Total Assets- Rs 2304.30 Crores
Name: K.N.Siva Subramanian
Equity % ICICI Bank 9.70Bharti Airtel 8.96Federal Bank 7.26Infosys 6.87Sterlite 4.35IBN18 Broadcast 3.54Gujarat State Petronet 3.48Cummins 3.46Mahindra & Mahindra Financial Services 3.41Crompton Greaves 3.23Other Equities 40.62Total Equities 94.88Other Non Equities 5.12Total Assets 100.00
ICICI PRU INFRASTRUCTURE Inception Date-Aug 31,2005
Total Assets- Rs 3604.85 CroresName: Sankaran Naren Equity % Bharti Airtel Ltd 8.62Oil & Natural Gas Company Ltd 8.23Bharat Heavy Electricals Ltd 7.89National Thermal Power Corporation Ltd 6.70Reliance Industries Ltd 6.33Sterlite Industries (India) Ltd 4.77ICICI Bank Ltd 4.67Standard Chartered Bank Ltd 3.32Corporation Bank Ltd 2.85Kalpataru Power Transmission Ltd 2.80Other Equities 33.45Total Equities 89.64Other Non Equities 10.36Total Assets 100.00
ICICI PRU GROWTHInception Date-Jul 09, 1998
Total Assets- Rs 384.92 CroresName: Sankaran Naren Equity % Reliance Industries Ltd 11.08Infosys Technologies Ltd 7.61Bharat Heavy Electricals Ltd 5.93Punjab National Bank Ltd 5.72HDFC Bank Ltd 5.41Bharti Airtel Ltd 5.27ICICI Bank Ltd 4.86Larsen & Toubro Ltd 4.10Sterlite Industries (India) Ltd 3.71Oil & Natural Gas Company Ltd 3.51Other Equities 32.92Total Equities 90.12Other Non Equities 9.88Total Assets 100.00
JM EQUITY
Inception Date-Apr 07,1995Total Assets- Rs 34.72 Crores
Name: Sanjay Kumar Chhabaria
Equity % Jai Prakash Associates 7.67Tata Motors 7.37Mahindra & Mahindra 7.20Reliance Industries 6.76Eicher Motors 6.65Bharat Heavy Electricals 6.62Tata Power 6.30Hindustan Lever 6.24Infosys Technologies 6.02Larsen & Toubro 5.91Other Equities 25.12Total Equities 91.86Other Non Equities 8.14Total Assets 100.00
26 Investime NOVEMBER 2010
ICICI PRU EMERGING STARInception Date-Oct 28, 2004
Total Assets- Rs 441.91 CroresName: Munzal ShahEquity % TRF Ltd 3.69IPCA Laboratories Ltd 3.62Oracle Financial Services Software Ltd 3.52Carborundum Universal Ltd 3.43Coromandel Fertilisers Ltd 3.34Eclerx Services Ltd 3.29Voltas Ltd 3.20Corporation Bank Ltd 3.18Lupin Ltd 3.08Kalpataru Power Transmission Ltd 2.94Other Equities 62.44Total Equities 95.72Other Non Equities 4.28Total Assets 100.00
ICICI PRU POWER Inception Date-Oct 01,1994
Total Assets- Rs 669.34 CroresName: Sanjay Parekh Equity % HDFC Ltd 6.77ICICI Bank Ltd 6.27Reliance Industries Ltd 5.49HDFC Bank Ltd 5.27Infosys Technologies Ltd 5.08Oil & Natural Gas Company Ltd 4.92Tata Motors Ltd 4.47ITC Ltd 4.04Sterlite Industries (India) Ltd 3.90Bharti Airtel Ltd 3.46Other Equities 44.03Total Equities 93.69Other Non Equities 6.31Total Assets 100.00
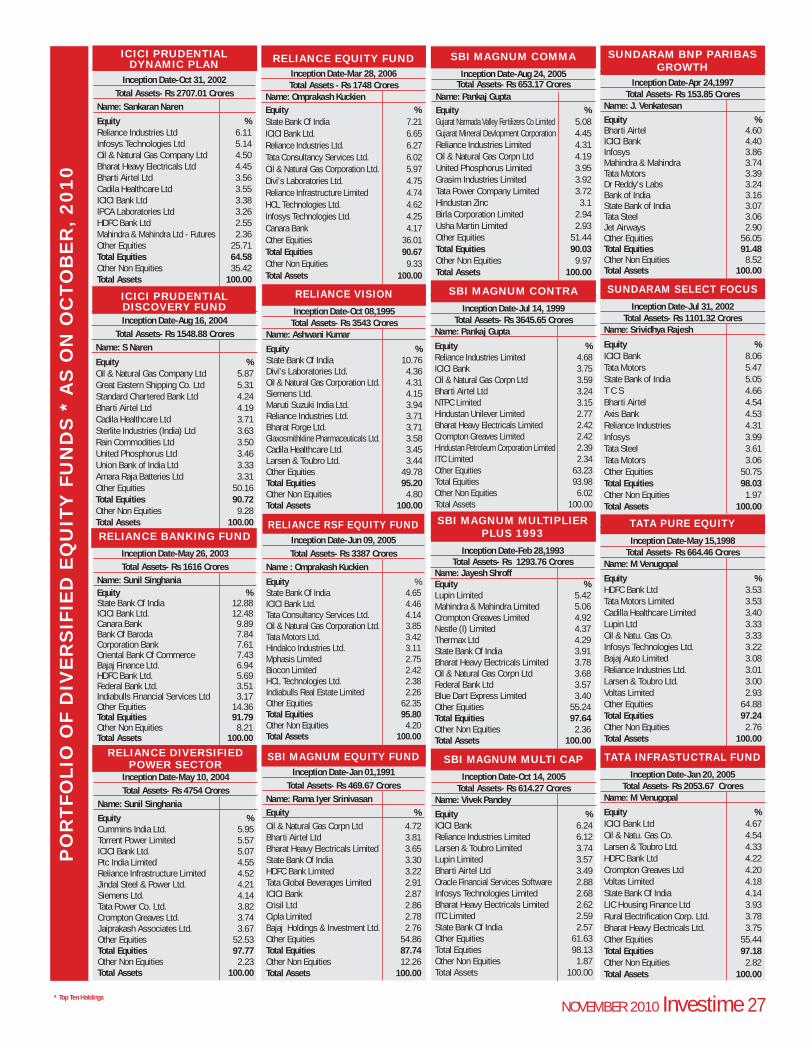
PO
RT
FO
LIO
OF D
IVE
RS
IFIE
D E
QU
ITY
FU
ND
S *
AS
ON
OC
TO
BE
R, 2010
SBI MAGNUM EQUITY FUNDInception Date-Jan 01,1991
Total Assets- Rs 469.67 CroresName: Rama Iyer SrinivasanEquity % Oil & Natural Gas Corpn Ltd 4.72Bharti Airtel Ltd 3.81Bharat Heavy Electricals Limited 3.65State Bank Of India 3.30HDFC Bank Limited 3.22Tata Global Beverages Limited 2.91ICICI Bank 2.87Crisil Ltd 2.86Cipla Limited 2.78Bajaj Holdings & Investment Ltd. 2.76Other Equities 54.86Total Equities 87.74Other Non Equities 12.26Total Assets 100.00
* Top Ten Holdings
ICICI PRUDENTIAL DYNAMIC PLAN
Inception Date-Oct 31, 2002Total Assets- Rs 2707.01 Crores
Name: Sankaran Naren
Equity % Reliance Industries Ltd 6.11Infosys Technologies Ltd 5.14Oil & Natural Gas Company Ltd 4.50Bharat Heavy Electricals Ltd 4.45Bharti Airtel Ltd 3.56Cadila Healthcare Ltd 3.55ICICI Bank Ltd 3.38IPCA Laboratories Ltd 3.26HDFC Bank Ltd 2.55Mahindra & Mahindra Ltd - Futures 2.36Other Equities 25.71Total Equities 64.58Other Non Equities 35.42Total Assets 100.00
SUNDARAM SELECT FOCUS
Inception Date-Jul 31, 2002Total Assets- Rs 1101.32 Crores
Name: Srividhya Rajesh
Equity % ICICI Bank 8.06Tata Motors 5.47State Bank of India 5.05T C S 4.66Bharti Airtel 4.54Axis Bank 4.53Reliance Industries 4.31Infosys 3.99Tata Steel 3.61Tata Motors 3.06Other Equities 50.75Total Equities 98.03Other Non Equities 1.97Total Assets 100.00
RELIANCE RSF EQUITY FUNDInception Date-Jun 09, 2005Total Assets- Rs 3387 Crores
Name : Omprakash Kuckien
Equity % State Bank Of India 4.65ICICI Bank Ltd. 4.46Tata Consultancy Services Ltd. 4.14Oil & Natural Gas Corporation Ltd. 3.85Tata Motors Ltd. 3.42Hindalco Industries Ltd. 3.11Mphasis Limited 2.75Biocon Limited 2.42HCL Technologies Ltd. 2.38Indiabulls Real Estate Limited 2.26Other Equities 62.35Total Equities 95.80Other Non Equities 4.20Total Assets 100.00
SBI MAGNUM CONTRA
Inception Date-Jul 14, 1999Total Assets- Rs 3645.65 Crores
Name: Pankaj Gupta
Equity % Reliance Industries Limited 4.68ICICI Bank 3.75Oil & Natural Gas Corpn Ltd 3.59Bharti Airtel Ltd 3.24NTPC Limited 3.15Hindustan Unilever Limited 2.77Bharat Heavy Electricals Limited 2.42Crompton Greaves Limited 2.42Hindustan Petroleum Corporation Limited 2.39ITC Limited 2.34Other Equities 63.23Total Equities 93.98Other Non Equities 6.02Total Assets 100.00
RELIANCE VISION
Inception Date-Oct 08,1995Total Assets- Rs 3543 Crores
Name: Ashwani Kumar
Equity % State Bank Of India 10.76Divi’s Laboratories Ltd. 4.36Oil & Natural Gas Corporation Ltd. 4.31Siemens Ltd. 4.15Maruti Suzuki India Ltd. 3.94Reliance Industries Ltd. 3.71Bharat Forge Ltd. 3.71Glaxosmithkline Pharmaceuticals Ltd. 3.58Cadila Healthcare Ltd. 3.45Larsen & Toubro Ltd. 3.44Other Equities 49.78Total Equities 95.20Other Non Equities 4.80Total Assets 100.00
SBI MAGNUM COMMA
Inception Date-Aug 24, 2005Total Assets- Rs 653.17 Crores
Name: Pankaj Gupta Equity % Gujarat Narmada Valley Fertilizers Co Limited 5.08Gujarat Mineral Devlopment Corporation 4.45Reliance Industries Limited 4.31Oil & Natural Gas Corpn Ltd 4.19United Phosphorus Limited 3.95Grasim Industries Limited 3.92Tata Power Company Limited 3.72Hindustan Zinc 3.1Birla Corporation Limited 2.94Usha Martin Limited 2.93Other Equities 51.44Total Equities 90.03Other Non Equities 9.97Total Assets 100.00
ICICI PRUDENTIAL DISCOVERY FUNDInception Date-Aug 16, 2004
Total Assets- Rs 1548.88 CroresName: S Naren
Equity % Oil & Natural Gas Company Ltd 5.87Great Eastern Shipping Co. Ltd 5.31Standard Chartered Bank Ltd 4.24Bharti Airtel Ltd 4.19Cadila Healthcare Ltd 3.71Sterlite Industries (India) Ltd 3.63Rain Commodities Ltd 3.50United Phosphorus Ltd 3.46Union Bank of India Ltd 3.33Amara Raja Batteries Ltd 3.31Other Equities 50.16Total Equities 90.72Other Non Equities 9.28Total Assets 100.00
RELIANCE BANKING FUND
Inception Date-May 26, 2003Total Assets- Rs 1616 Crores
Name: Sunil SinghaniaEquity % State Bank Of India 12.88ICICI Bank Ltd. 12.48Canara Bank 9.89Bank Of Baroda 7.84Corporation Bank 7.61Oriental Bank Of Commerce 7.43Bajaj Finance Ltd. 6.94HDFC Bank Ltd. 5.69Federal Bank Ltd. 3.51Indiabulls Financial Services Ltd 3.17Other Equities 14.36Total Equities 91.79Other Non Equities 8.21Total Assets 100.00
SBI MAGNUM MULTIPLIER PLUS 1993
Inception Date-Feb 28,1993Total Assets- Rs 1293.76 Crores
Name: Jayesh Shroff Equity % Lupin Limited 5.42Mahindra & Mahindra Limited 5.06Crompton Greaves Limited 4.92Nestle (I) Limited 4.37Thermax Ltd 4.29State Bank Of India 3.91Bharat Heavy Electricals Limited 3.78Oil & Natural Gas Corpn Ltd 3.68Federal Bank Ltd 3.57Blue Dart Express Limited 3.40Other Equities 55.24Total Equities 97.64Other Non Equities 2.36Total Assets 100.00
SUNDARAM BNP PARIBAS GROWTH
Inception Date-Apr 24,1997Total Assets- Rs 153.85 Crores
Name: J. VenkatesanEquity % Bharti Airtel 4.60ICICI Bank 4.40Infosys 3.86Mahindra & Mahindra 3.74Tata Motors 3.39Dr Reddy’s Labs 3.24Bank of India 3.16State Bank of India 3.07Tata Steel 3.06Jet Airways 2.90Other Equities 56.05Total Equities 91.48Other Non Equities 8.52Total Assets 100.00
SBI MAGNUM MULTI CAP
Inception Date-Oct 14, 2005Total Assets- Rs 614.27 Crores
Name: Vivek Pandey
Equity % ICICI Bank 6.24Reliance Industries Limited 6.12Larsen & Toubro Limited 3.74Lupin Limited 3.57Bharti Airtel Ltd 3.49Oracle Financial Services Software 2.88Infosys Technologies Limited 2.68Bharat Heavy Electricals Limited 2.62ITC Limited 2.59State Bank Of India 2.57Other Equities 61.63Total Equities 98.13Other Non Equities 1.87Total Assets 100.00
TATA PURE EQUITY
Inception Date-May 15,1998Total Assets- Rs 664.46 Crores
Name: M Venugopal
Equity % HDFC Bank Ltd 3.53Tata Motors Limited 3.53Cadilla Healthcare Limited 3.40Lupin Ltd 3.33Oil & Natu. Gas Co. 3.33Infosys Technologies Ltd. 3.22Bajaj Auto Limited 3.08Reliance Industries Ltd. 3.01Larsen & Toubro Ltd. 3.00Voltas Limited 2.93Other Equities 64.88Total Equities 97.24Other Non Equities 2.76Total Assets 100.00
TATA INFRASTUCTRAL FUND
Inception Date-Jan 20, 2005Total Assets- Rs 2053.67 Crores
Name: M Venugopal
Equity % ICICI Bank Ltd 4.67Oil & Natu. Gas Co. 4.54Larsen & Toubro Ltd. 4.33HDFC Bank Ltd 4.22Crompton Greaves Ltd 4.20Voltas Limited 4.18State Bank Of India 4.14LIC Housing Finance Ltd 3.93Rural Electrification Corp. Ltd. 3.78Bharat Heavy Electricals Ltd. 3.75Other Equities 55.44Total Equities 97.18Other Non Equities 2.82Total Assets 100.00
NOVEMBER 2010 Investime 27
RELIANCE EQUITY FUNDInception Date-Mar 28, 2006Total Assets - Rs 1748 Crores
Name: Omprakash Kuckien Equity % State Bank Of India 7.21ICICI Bank Ltd. 6.65Reliance Industries Ltd. 6.27Tata Consultancy Services Ltd. 6.02Oil & Natural Gas Corporation Ltd. 5.97Divi’s Laboratories Ltd. 4.75Reliance Infrastructure Limited 4.74HCL Technologies Ltd. 4.62Infosys Technologies Ltd. 4.25Canara Bank 4.17Other Equities 36.01Total Equities 90.67Other Non Equities 9.33Total Assets 100.00
RELIANCE DIVERSIFIED POWER SECTOR
Inception Date-May 10, 2004Total Assets- Rs 4754 Crores
Name: Sunil Singhania
Equity % Cummins India Ltd. 5.95Torrent Power Limited 5.57ICICI Bank Ltd. 5.07Ptc India Limited 4.55Reliance Infrastructure Limited 4.52Jindal Steel & Power Ltd. 4.21Siemens Ltd. 4.14Tata Power Co. Ltd. 3.82Crompton Greaves Ltd. 3.74Jaiprakash Associates Ltd. 3.67Other Equities 52.53Total Equities 97.77Other Non Equities 2.23Total Assets 100.00
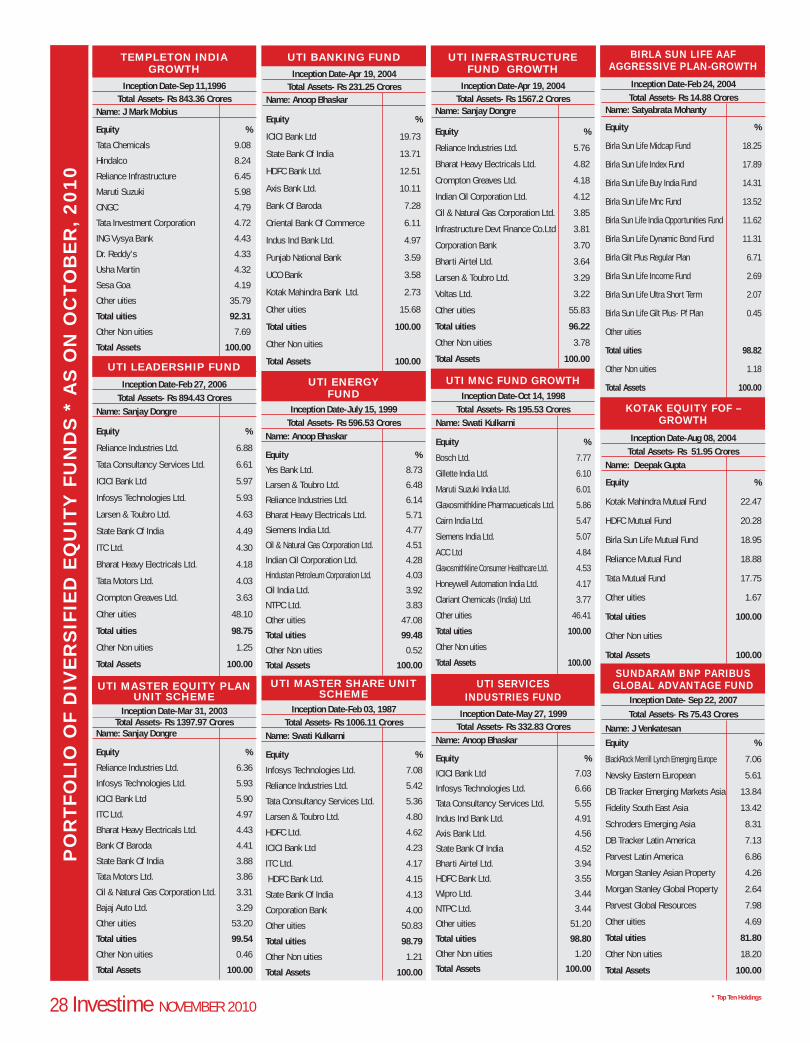
PO
RT
FO
LIO
OF D
IVE
RS
IFIE
D E
QU
ITY
FU
ND
S *
AS
ON
OC
TO
BE
R, 2010
UTI ENERGY FUND
Inception Date-July 15, 1999Total Assets- Rs 596.53 Crores
Name: Anoop Bhaskar
Equity %
Yes Bank Ltd. 8.73
Larsen & Toubro Ltd. 6.48
Reliance Industries Ltd. 6.14
Bharat Heavy Electricals Ltd. 5.71
Siemens India Ltd. 4.77
Oil & Natural Gas Corporation Ltd. 4.51
Indian Oil Corporation Ltd. 4.28
Hindustan Petroleum Corporation Ltd. 4.03
Oil India Ltd. 3.92
NTPC Ltd. 3.83
Other uities 47.08
Total uities 99.48
Other Non uities 0.52
Total Assets 100.00
TEMPLETON INDIA GROWTH
Inception Date-Sep 11,1996Total Assets- Rs 843.36 Crores
Name: J Mark Mobius
Equity %
Tata Chemicals 9.08
Hindalco 8.24
Reliance Infrastructure 6.45
Maruti Suzuki 5.98
ONGC 4.79
Tata Investment Corporation 4.72
ING Vysya Bank 4.43
Dr. Reddy’s 4.33
Usha Martin 4.32
Sesa Goa 4.19
Other uities 35.79
Total uities 92.31
Other Non uities 7.69
Total Assets 100.00
UTI INFRASTRUCTURE FUND GROWTH
Inception Date-Apr 19, 2004Total Assets- Rs 1567.2 Crores
Name: Sanjay Dongre
Equity %
Reliance Industries Ltd. 5.76
Bharat Heavy Electricals Ltd. 4.82
Crompton Greaves Ltd. 4.18
Indian Oil Corporation Ltd. 4.12
Oil & Natural Gas Corporation Ltd. 3.85
Infrastructure Devt Finance Co.Ltd 3.81
Corporation Bank 3.70
Bharti Airtel Ltd. 3.64
Larsen & Toubro Ltd. 3.29
Voltas Ltd. 3.22
Other uities 55.83
Total uities 96.22
Other Non uities 3.78
Total Assets 100.00
UTI BANKING FUND
Inception Date-Apr 19, 2004Total Assets- Rs 231.25 Crores
Name: Anoop Bhaskar
Equity %
ICICI Bank Ltd 19.73
State Bank Of India 13.71
HDFC Bank Ltd. 12.51
Axis Bank Ltd. 10.11
Bank Of Baroda 7.28
Oriental Bank Of Commerce 6.11
Indus Ind Bank Ltd. 4.97
Punjab National Bank 3.59
UCO Bank 3.58
Kotak Mahindra Bank Ltd. 2.73
Other uities 15.68
Total uities 100.00
Other Non uities
Total Assets 100.00UTI LEADERSHIP FUND
Inception Date-Feb 27, 2006Total Assets- Rs 894.43 Crores
Name: Sanjay Dongre
Equity %
Reliance Industries Ltd. 6.88
Tata Consultancy Services Ltd. 6.61
ICICI Bank Ltd 5.97
Infosys Technologies Ltd. 5.93
Larsen & Toubro Ltd. 4.63
State Bank Of India 4.49
ITC Ltd. 4.30
Bharat Heavy Electricals Ltd. 4.18
Tata Motors Ltd. 4.03
Crompton Greaves Ltd. 3.63
Other uities 48.10
Total uities 98.75
Other Non uities 1.25
Total Assets 100.00
UTI MASTER EQUITY PLAN UNIT SCHEME
Inception Date-Mar 31, 2003 Total Assets- Rs 1397.97 Crores
Name: Sanjay Dongre
Equity %
Reliance Industries Ltd. 6.36
Infosys Technologies Ltd. 5.93
ICICI Bank Ltd 5.90
ITC Ltd. 4.97
Bharat Heavy Electricals Ltd. 4.43
Bank Of Baroda 4.41
State Bank Of India 3.88
Tata Motors Ltd. 3.86
Oil & Natural Gas Corporation Ltd. 3.31
Bajaj Auto Ltd. 3.29
Other uities 53.20
Total uities 99.54
Other Non uities 0.46
Total Assets 100.00
UTI MNC FUND GROWTHInception Date-Oct 14, 1998
Total Assets- Rs 195.53 CroresName: Swati Kulkarni
Equity %
Bosch Ltd. 7.77
Gillette India Ltd. 6.10
Maruti Suzuki India Ltd. 6.01
Glaxosmithkline Pharmacueticals Ltd. 5.86
Cairn India Ltd. 5.47
Siemens India Ltd. 5.07
ACC Ltd 4.84
Glaxosmithkline Consumer Healthcare Ltd. 4.53
Honeywell Automation India Ltd. 4.17
Clariant Chemicals (India) Ltd. 3.77
Other uities 46.41
Total uities 100.00
Other Non uities
Total Assets 100.00
UTI SERVICES INDUSTRIES FUND
Inception Date-May 27, 1999Total Assets- Rs 332.83 Crores
Name: Anoop Bhaskar
Equity %
ICICI Bank Ltd 7.03
Infosys Technologies Ltd. 6.66
Tata Consultancy Services Ltd. 5.55
Indus Ind Bank Ltd. 4.91
Axis Bank Ltd. 4.56
State Bank Of India 4.52
Bharti Airtel Ltd. 3.94
HDFC Bank Ltd. 3.55
Wipro Ltd. 3.44
NTPC Ltd. 3.44
Other uities 51.20
Total uities 98.80
Other Non uities 1.20
Total Assets 100.00
UTI MASTER SHARE UNIT SCHEME
Inception Date-Feb 03, 1987Total Assets- Rs 1006.11 Crores
Name: Swati Kulkarni
Equity %
Infosys Technologies Ltd. 7.08
Reliance Industries Ltd. 5.42
Tata Consultancy Services Ltd. 5.36
Larsen & Toubro Ltd. 4.80
HDFC Ltd. 4.62
ICICI Bank Ltd 4.23
ITC Ltd. 4.17
HDFC Bank Ltd. 4.15
State Bank Of India 4.13
Corporation Bank 4.00
Other uities 50.83
Total uities 98.79
Other Non uities 1.21
Total Assets 100.00
BIRLA SUN LIFE AAF AGGRESSIVE PLAN-GROWTH
Inception Date-Feb 24, 2004Total Assets- Rs 14.88 Crores
Name: Satyabrata Mohanty
Equity %
Birla Sun Life Midcap Fund 18.25
Birla Sun Life Index Fund 17.89
Birla Sun Life Buy India Fund 14.31
Birla Sun Life Mnc Fund 13.52
Birla Sun Life India Opportunities Fund 11.62
Birla Sun Life Dynamic Bond Fund 11.31
Birla Gilt Plus Regular Plan 6.71
Birla Sun Life Income Fund 2.69
Birla Sun Life Ultra Short Term 2.07
Birla Sun Life Gilt Plus- Pf Plan 0.45
Other uities
Total uities 98.82
Other Non uities 1.18
Total Assets 100.00
SUNDARAM BNP PARIBUS GLOBAL ADVANTAGE FUND
Inception Date- Sep 22, 2007
Total Assets- Rs 75.43 Crores
Name: J Venkatesan
Equity %
BlackRock Merrill Lynch Emerging Europe 7.06
Nevsky Eastern European 5.61
DB Tracker Emerging Markets Asia 13.84
Fidelity South East Asia 13.42
Schroders Emerging Asia 8.31
DB Tracker Latin America 7.13
Parvest Latin America 6.86
Morgan Stanley Asian Property 4.26
Morgan Stanley Global Property 2.64
Parvest Global Resources 7.98
Other uities 4.69
Total uities 81.80
Other Non uities 18.20
Total Assets 100.00
KOTAK EQUITY FOF – GROWTH
Inception Date-Aug 08, 2004Total Assets- Rs 51.95 Crores
Name: Deepak Gupta
Equity %
Kotak Mahindra Mutual Fund 22.47
HDFC Mutual Fund 20.28
Birla Sun Life Mutual Fund 18.95
Reliance Mutual Fund 18.88
Tata Mutual Fund 17.75
Other uities 1.67
Total uities 100.00
Other Non uities
Total Assets 100.00
* Top Ten Holdings
28 Investime NOVEMBER 2010
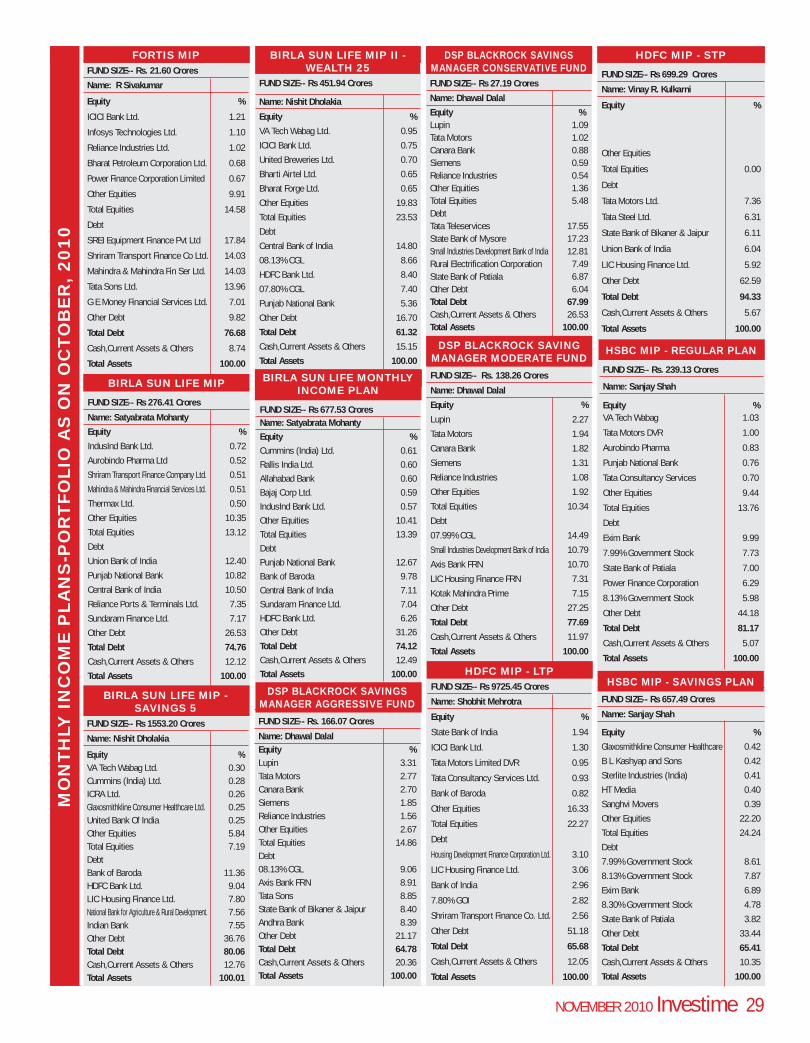
MO
NT
HLY
IN
CO
ME
PLA
NS
-PO
RT
FO
LIO
AS
ON
OC
TO
BE
R,
20
10
FORTIS MIP FUND SIZE-- Rs. 21.60 Crores
Name: R Sivakumar
Equity %
ICICI Bank Ltd. 1.21
Infosys Technologies Ltd. 1.10
Reliance Industries Ltd. 1.02
Bharat Petroleum Corporation Ltd. 0.68
Power Finance Corporation Limited 0.67
Other Equities 9.91
Total Equities 14.58
Debt
SREI Equipment Finance Pvt Ltd 17.84
Shriram Transport Finance Co Ltd. 14.03
Mahindra & Mahindra Fin Ser Ltd. 14.03
Tata Sons Ltd. 13.96
G E Money Financial Services Ltd. 7.01
Other Debt 9.82
Total Debt 76.68
Cash,Current Assets & Others 8.74
Total Assets 100.00
DSP BLACKROCK SAVINGS MANAGER AGGRESSIVE FUND
FUND SIZE-- Rs. 166.07 Crores
Name: Dhawal Dalal Equity %Lupin 3.31Tata Motors 2.77Canara Bank 2.70Siemens 1.85Reliance Industries 1.56Other Equities 2.67Total Equities 14.86Debt 08.13% CGL 9.06Axis Bank FRN 8.91Tata Sons 8.85State Bank of Bikaner & Jaipur 8.40Andhra Bank 8.39Other Debt 21.17Total Debt 64.78Cash,Current Assets & Others 20.36 Total Assets 100.00
BIRLA SUN LIFE MIP
FUND SIZE-- Rs 276.41 Crores
Name: Satyabrata Mohanty
Equity %
IndusInd Bank Ltd. 0.72
Aurobindo Pharma Ltd 0.52
Shriram Transport Finance Company Ltd. 0.51
Mahindra & Mahindra Financial Services Ltd. 0.51
Thermax Ltd. 0.50
Other Equities 10.35
Total Equities 13.12
Debt
Union Bank of India 12.40
Punjab National Bank 10.82
Central Bank of India 10.50
Reliance Ports & Terminals Ltd. 7.35
Sundaram Finance Ltd. 7.17
Other Debt 26.53
Total Debt 74.76
Cash,Current Assets & Others 12.12
Total Assets 100.00
DSP BLACKROCK SAVING MANAGER MODERATE FUND
FUND SIZE-- Rs. 138.26 Crores
Name: Dhawal Dalal
Equity %
Lupin 2.27
Tata Motors 1.94
Canara Bank 1.82
Siemens 1.31
Reliance Industries 1.08
Other Equities 1.92
Total Equities 10.34
Debt
07.99% CGL 14.49
Small Industries Development Bank of India 10.79
Axis Bank FRN 10.70
LIC Housing Finance FRN 7.31
Kotak Mahindra Prime 7.15
Other Debt 27.25
Total Debt 77.69
Cash,Current Assets & Others 11.97
Total Assets 100.00
BIRLA SUN LIFE MONTHLY INCOME PLAN
FUND SIZE-- Rs 677.53 CroresName: Satyabrata Mohanty Equity %Cummins (India) Ltd. 0.61
Rallis India Ltd. 0.60
Allahabad Bank 0.60
Bajaj Corp Ltd. 0.59
IndusInd Bank Ltd. 0.57
Other Equities 10.41
Total Equities 13.39
Debt
Punjab National Bank 12.67
Bank of Baroda 9.78
Central Bank of India 7.11
Sundaram Finance Ltd. 7.04
HDFC Bank Ltd. 6.26
Other Debt 31.26
Total Debt 74.12Cash,Current Assets & Others 12.49
Total Assets 100.00
BIRLA SUN LIFE MIP II - WEALTH 25
FUND SIZE-- Rs 451.94 Crores
Name: Nishit Dholakia
Equity %
VA Tech Wabag Ltd. 0.95
ICICI Bank Ltd. 0.75
United Breweries Ltd. 0.70
Bharti Airtel Ltd. 0.65
Bharat Forge Ltd. 0.65
Other Equities 19.83
Total Equities 23.53
Debt
Central Bank of India 14.80
08.13% CGL 8.66
HDFC Bank Ltd. 8.40
07.80% CGL 7.40
Punjab National Bank 5.36
Other Debt 16.70
Total Debt 61.32
Cash,Current Assets & Others 15.15
Total Assets 100.00HSBC MIP - REGULAR PLAN
FUND SIZE-- Rs. 239.13 Crores
Name: Sanjay Shah
Equity %VA Tech Wabag 1.03
Tata Motors DVR 1.00
Aurobindo Pharma 0.83
Punjab National Bank 0.76
Tata Consultancy Services 0.70
Other Equities 9.44
Total Equities 13.76
Debt
Exim Bank 9.99
7.99% Government Stock 7.73
State Bank of Patiala 7.00
Power Finance Corporation 6.29
8.13% Government Stock 5.98
Other Debt 44.18
Total Debt 81.17
Cash,Current Assets & Others 5.07
Total Assets 100.00
HDFC MIP - STP
FUND SIZE-- Rs 699.29 Crores
Name: Vinay R. Kulkarni
Equity %
Other Equities
Total Equities 0.00
Debt
Tata Motors Ltd. 7.36
Tata Steel Ltd. 6.31
State Bank of Bikaner & Jaipur 6.11
Union Bank of India 6.04
LIC Housing Finance Ltd. 5.92
Other Debt 62.59
Total Debt 94.33
Cash,Current Assets & Others 5.67
Total Assets 100.00
DSP BLACKROCK SAVINGS MANAGER CONSERVATIVE FUND FUND SIZE-- Rs 27.19 Crores
Name: Dhawal Dalal
Equity % Lupin 1.09Tata Motors 1.02Canara Bank 0.88Siemens 0.59Reliance Industries 0.54Other Equities 1.36Total Equities 5.48Debt Tata Teleservices 17.55State Bank of Mysore 17.23Small Industries Development Bank of India 12.81Rural Electrification Corporation 7.49State Bank of Patiala 6.87Other Debt 6.04Total Debt 67.99Cash,Current Assets & Others 26.53 Total Assets 100.00
HSBC MIP - SAVINGS PLAN
FUND SIZE-- Rs 657.49 Crores
Name: Sanjay Shah
Equity %
Glaxosmithkline Consumer Healthcare 0.42
B L Kashyap and Sons 0.42
Sterlite Industries (India) 0.41
HT Media 0.40
Sanghvi Movers 0.39
Other Equities 22.20
Total Equities 24.24
Debt
7.99% Government Stock 8.61
8.13% Government Stock 7.87
Exim Bank 6.89
8.30% Government Stock 4.78
State Bank of Patiala 3.82
Other Debt 33.44
Total Debt 65.41
Cash,Current Assets & Others 10.35
Total Assets 100.00
HDFC MIP - LTP FUND SIZE-- Rs 9725.45 Crores
Name: Shobhit Mehrotra
Equity %
State Bank of India 1.94
ICICI Bank Ltd. 1.30
Tata Motors Limited DVR 0.95
Tata Consultancy Services Ltd. 0.93
Bank of Baroda 0.82
Other Equities 16.33
Total Equities 22.27
Debt
Housing Development Finance Corporation Ltd. 3.10
LIC Housing Finance Ltd. 3.06
Bank of India 2.96
7.80% GOI 2.82
Shriram Transport Finance Co. Ltd. 2.56
Other Debt 51.18
Total Debt 65.68
Cash,Current Assets & Others 12.05
Total Assets 100.00
NOVEMBER 2010 Investime 29
BIRLA SUN LIFE MIP - SAVINGS 5
FUND SIZE-- Rs 1553.20 Crores
Name: Nishit Dholakia
Equity %VA Tech Wabag Ltd. 0.30Cummins (India) Ltd. 0.28ICRA Ltd. 0.26Glaxosmithkline Consumer Healthcare Ltd. 0.25United Bank Of India 0.25Other Equities 5.84Total Equities 7.19Debt Bank of Baroda 11.36 HDFC Bank Ltd. 9.04LIC Housing Finance Ltd. 7.80National Bank for Agriculture & Rural Development. 7.56Indian Bank 7.55Other Debt 36.76Total Debt 80.06Cash,Current Assets & Others 12.76 Total Assets 100.01
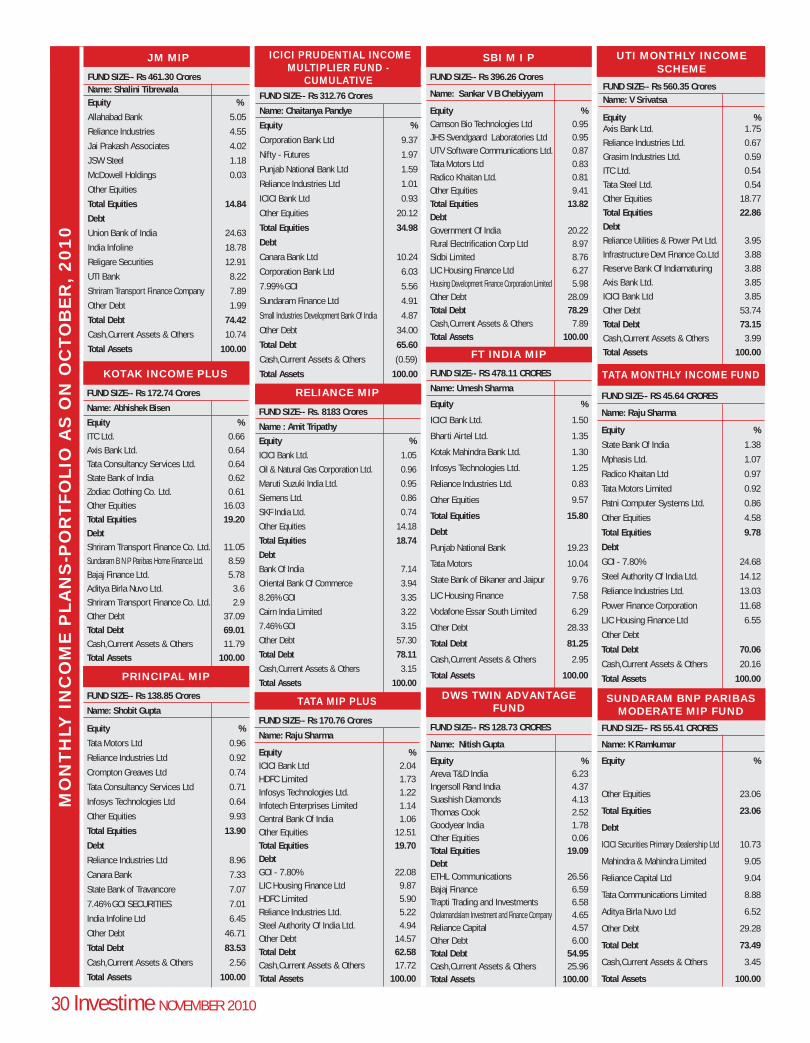
30 Investime NOVEMBER 2010
MO
NT
HLY
IN
CO
ME
PLA
NS
-PO
RT
FO
LIO
AS
ON
OC
TO
BE
R,
20
10
TATA MIP PLUS
FUND SIZE-- Rs 170.76 Crores
Name: Raju Sharma
Equity %ICICI Bank Ltd 2.04HDFC Limited 1.73Infosys Technologies Ltd. 1.22Infotech Enterprises Limited 1.14Central Bank Of India 1.06Other Equities 12.51Total Equities 19.70Debt GOI - 7.80% 22.08LIC Housing Finance Ltd 9.87HDFC Limited 5.90Reliance Industries Ltd. 5.22Steel Authority Of India Ltd. 4.94Other Debt 14.57Total Debt 62.58Cash,Current Assets & Others 17.72 Total Assets 100.00
KOTAK INCOME PLUS
FUND SIZE-- Rs 172.74 Crores
Name: Abhishek Bisen
Equity %ITC Ltd. 0.66Axis Bank Ltd. 0.64Tata Consultancy Services Ltd. 0.64State Bank of India 0.62Zodiac Clothing Co. Ltd. 0.61Other Equities 16.03Total Equities 19.20Debt Shriram Transport Finance Co. Ltd. 11.05Sundaram B N P Paribas Home Finance Ltd. 8.59Bajaj Finance Ltd. 5.78Aditya Birla Nuvo Ltd. 3.6Shriram Transport Finance Co. Ltd. 2.9Other Debt 37.09Total Debt 69.01Cash,Current Assets & Others 11.79 Total Assets 100.00
FT INDIA MIP
FUND SIZE-- RS 478.11 CRORES
Name: Umesh Sharma
Equity %
ICICI Bank Ltd. 1.50
Bharti Airtel Ltd. 1.35
Kotak Mahindra Bank Ltd. 1.30
Infosys Technologies Ltd. 1.25
Reliance Industries Ltd. 0.83
Other Equities 9.57
Total Equities 15.80
Debt
Punjab National Bank 19.23
Tata Motors 10.04
State Bank of Bikaner and Jaipur 9.76
LIC Housing Finance 7.58
Vodafone Essar South Limited 6.29
Other Debt 28.33
Total Debt 81.25
Cash,Current Assets & Others 2.95
Total Assets 100.00
SBI M I P
FUND SIZE-- Rs 396.26 Crores
Name: Sankar V B Chebiyyam
Equity %Camson Bio Technologies Ltd 0.95JHS Svendgaard Laboratories Ltd 0.95UTV Software Communications Ltd. 0.87Tata Motors Ltd 0.83Radico Khaitan Ltd. 0.81Other Equities 9.41Total Equities 13.82Debt Government Of India 20.22Rural Electrification Corp Ltd 8.97Sidbi Limited 8.76LIC Housing Finance Ltd 6.27Housing Development Finance Corporation Limited 5.98Other Debt 28.09Total Debt 78.29Cash,Current Assets & Others 7.89 Total Assets 100.00
TATA MONTHLY INCOME FUND
FUND SIZE-- RS 45.64 CRORES
Name: Raju Sharma
Equity %
State Bank Of India 1.38
Mphasis Ltd. 1.07
Radico Khaitan Ltd 0.97
Tata Motors Limited 0.92
Patni Computer Systems Ltd. 0.86
Other Equities 4.58
Total Equities 9.78
Debt
GOI - 7.80% 24.68
Steel Authority Of India Ltd. 14.12
Reliance Industries Ltd. 13.03
Power Finance Corporation 11.68
LIC Housing Finance Ltd 6.55
Other Debt
Total Debt 70.06
Cash,Current Assets & Others 20.16
Total Assets 100.00
JM MIP
FUND SIZE-- Rs 461.30 CroresName: Shalini Tibrewala
Equity %
Allahabad Bank 5.05
Reliance Industries 4.55
Jai Prakash Associates 4.02
JSW Steel 1.18
McDowell Holdings 0.03
Other Equities
Total Equities 14.84
Debt
Union Bank of India 24.63
India Infoline 18.78
Religare Securities 12.91
UTI Bank 8.22
Shriram Transport Finance Company 7.89
Other Debt 1.99
Total Debt 74.42
Cash,Current Assets & Others 10.74
Total Assets 100.00
PRINCIPAL MIP
FUND SIZE-- Rs 138.85 Crores
Name: Shobit Gupta
Equity %
Tata Motors Ltd 0.96
Reliance Industries Ltd 0.92
Crompton Greaves Ltd 0.74
Tata Consultancy Services Ltd 0.71
Infosys Technologies Ltd 0.64
Other Equities 9.93
Total Equities 13.90
Debt
Reliance Industries Ltd 8.96
Canara Bank 7.33
State Bank of Travancore 7.07
7.46% GOI SECURITIES 7.01
India Infoline Ltd 6.45
Other Debt 46.71
Total Debt 83.53
Cash,Current Assets & Others 2.56
Total Assets 100.00
ICICI PRUDENTIAL INCOME MULTIPLIER FUND -
CUMULATIVE FUND SIZE-- Rs 312.76 Crores
Name: Chaitanya Pandye
Equity %
Corporation Bank Ltd 9.37
Nifty - Futures 1.97
Punjab National Bank Ltd 1.59
Reliance Industries Ltd 1.01
ICICI Bank Ltd 0.93
Other Equities 20.12
Total Equities 34.98
Debt
Canara Bank Ltd 10.24
Corporation Bank Ltd 6.03
7.99% GOI 5.56
Sundaram Finance Ltd 4.91
Small Industries Development Bank Of India 4.87
Other Debt 34.00
Total Debt 65.60
Cash,Current Assets & Others (0.59)
Total Assets 100.00
RELIANCE MIP
FUND SIZE-- Rs. 8183 Crores
Name : Amit Tripathy
Equity %
ICICI Bank Ltd. 1.05
Oil & Natural Gas Corporation Ltd. 0.96
Maruti Suzuki India Ltd. 0.95
Siemens Ltd. 0.86
SKF India Ltd. 0.74
Other Equities 14.18
Total Equities 18.74
Debt
Bank Of India 7.14
Oriental Bank Of Commerce 3.94
8.26% GOI 3.35
Cairn India Limited 3.22
7.46% GOI 3.15
Other Debt 57.30
Total Debt 78.11
Cash,Current Assets & Others 3.15
Total Assets 100.00DWS TWIN ADVANTAGE
FUND
FUND SIZE-- RS 128.73 CRORES
Name: Nitish Gupta
Equity %Areva T&D India 6.23Ingersoll Rand India 4.37Suashish Diamonds 4.13Thomas Cook 2.52Goodyear India 1.78Other Equities 0.06Total Equities 19.09Debt ETHL Communications 26.56 Bajaj Finance 6.59Trapti Trading and Investments 6.58Cholamandalam Investment and Finance Company 4.65Reliance Capital 4.57Other Debt 6.00Total Debt 54.95Cash,Current Assets & Others 25.96 Total Assets 100.00
SUNDARAM BNP PARIBAS MODERATE MIP FUND
FUND SIZE-- RS 55.41 CRORES
Name: K Ramkumar
Equity %
Other Equities 23.06
Total Equities 23.06
Debt
ICICI Securities Primary Dealership Ltd 10.73
Mahindra & Mahindra Limited 9.05
Reliance Capital Ltd 9.04
Tata Communications Limited 8.88
Aditya Birla Nuvo Ltd 6.52
Other Debt 29.28
Total Debt 73.49
Cash,Current Assets & Others 3.45
Total Assets 100.00
UTI MONTHLY INCOME SCHEME
FUND SIZE-- Rs 560.35 Crores Name: V Srivatsa
Equity %Axis Bank Ltd. 1.75
Reliance Industries Ltd. 0.67
Grasim Industries Ltd. 0.59
ITC Ltd. 0.54
Tata Steel Ltd. 0.54
Other Equities 18.77
Total Equities 22.86Debt Reliance Utilities & Power Pvt Ltd. 3.95
Infrastructure Devt Finance Co.Ltd 3.88
Reserve Bank Of Indiamaturing 3.88
Axis Bank Ltd. 3.85
ICICI Bank Ltd 3.85
Other Debt 53.74
Total Debt 73.15Cash,Current Assets & Others 3.99
Total Assets 100.00
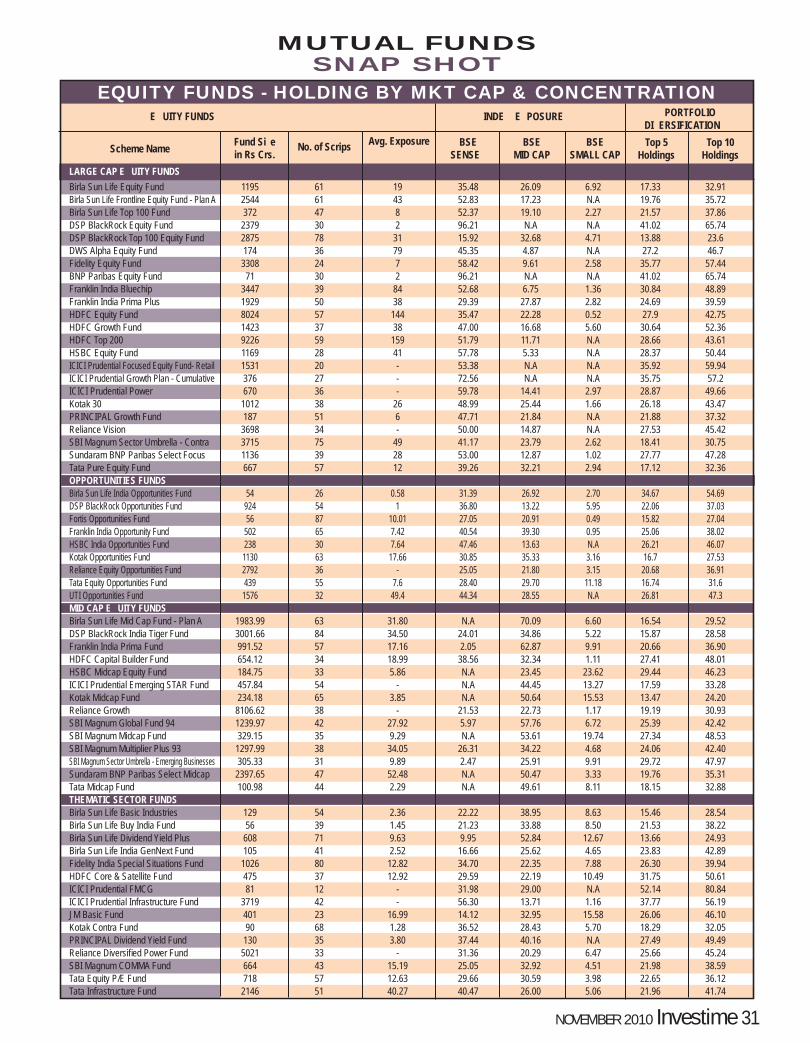
INDE E POSURE E UITY FUNDS
Fund Si ein Rs Crs.
PORTFOLIODI ERSIFICATION
BSEMID CAP
BSESENSE
BSESMALL CAP
Top 5 Holdings
Top 10 HoldingsScheme Name No. of Scrips Avg. Exposure
SNAP SHOTMUTUAL FUNDS
EQUITY FUNDS - HOLDING BY MKT CAP & CONCENTRATION
LARGE CAP E UITY FUNDS Birla Sun Life Equity Fund 1195 61 19 35.48 26.09 6.92 17.33 32.91Birla Sun Life Frontline Equity Fund - Plan A 2544 61 43 52.83 17.23 N.A 19.76 35.72Birla Sun Life Top 100 Fund 372 47 8 52.37 19.10 2.27 21.57 37.86DSP BlackRock Equity Fund 2379 30 2 96.21 N.A N.A 41.02 65.74DSP BlackRock Top 100 Equity Fund 2875 78 31 15.92 32.68 4.71 13.88 23.6DWS Alpha Equity Fund 174 36 79 45.35 4.87 N.A 27.2 46.7Fidelity Equity Fund 3308 24 7 58.42 9.61 2.58 35.77 57.44BNP Paribas Equity Fund 71 30 2 96.21 N.A N.A 41.02 65.74Franklin India Bluechip 3447 39 84 52.68 6.75 1.36 30.84 48.89Franklin India Prima Plus 1929 50 38 29.39 27.87 2.82 24.69 39.59HDFC Equity Fund 8024 57 144 35.47 22.28 0.52 27.9 42.75HDFC Growth Fund 1423 37 38 47.00 16.68 5.60 30.64 52.36HDFC Top 200 9226 59 159 51.79 11.71 N.A 28.66 43.61HSBC Equity Fund 1169 28 41 57.78 5.33 N.A 28.37 50.44ICICI Prudential Focused Equity Fund- Retail 1531 20 - 53.38 N.A N.A 35.92 59.94ICICI Prudential Growth Plan - Cumulative 376 27 - 72.56 N.A N.A 35.75 57.2ICICI Prudential Power 670 36 - 59.78 14.41 2.97 28.87 49.66Kotak 30 1012 38 26 48.99 25.44 1.66 26.18 43.47PRINCIPAL Growth Fund 187 51 6 47.71 21.84 N.A 21.88 37.32Reliance Vision 3698 34 - 50.00 14.87 N.A 27.53 45.42SBI Magnum Sector Umbrella - Contra 3715 75 49 41.17 23.79 2.62 18.41 30.75Sundaram BNP Paribas Select Focus 1136 39 28 53.00 12.87 1.02 27.77 47.28Tata Pure Equity Fund 667 57 12 39.26 32.21 2.94 17.12 32.36OPPORTUNITIES FUNDS Birla Sun Life India Opportunities Fund 54 26 0.58 31.39 26.92 2.70 34.67 54.69DSP BlackRock Opportunities Fund 924 54 1 36.80 13.22 5.95 22.06 37.03Fortis Opportunities Fund 56 87 10.01 27.05 20.91 0.49 15.82 27.04Franklin India Opportunity Fund 502 65 7.42 40.54 39.30 0.95 25.06 38.02HSBC India Opportunities Fund 238 30 7.64 47.46 13.63 N.A 26.21 46.07Kotak Opportunities Fund 1130 63 17.66 30.85 35.33 3.16 16.7 27.53Reliance Equity Opportunities Fund 2792 36 - 25.05 21.80 3.15 20.68 36.91Tata Equity Opportunities Fund 439 55 7.6 28.40 29.70 11.18 16.74 31.6UTI Opportunities Fund 1576 32 49.4 44.34 28.55 N.A 26.81 47.3MID CAP E UITY FUNDS Birla Sun Life Mid Cap Fund - Plan A 1983.99 63 31.80 N.A 70.09 6.60 16.54 29.52DSP BlackRock India Tiger Fund 3001.66 84 34.50 24.01 34.86 5.22 15.87 28.58Franklin India Prima Fund 991.52 57 17.16 2.05 62.87 9.91 20.66 36.90HDFC Capital Builder Fund 654.12 34 18.99 38.56 32.34 1.11 27.41 48.01HSBC Midcap Equity Fund 184.75 33 5.86 N.A 23.45 23.62 29.44 46.23ICICI Prudential Emerging STAR Fund 457.84 54 - N.A 44.45 13.27 17.59 33.28Kotak Midcap Fund 234.18 65 3.85 N.A 50.64 15.53 13.47 24.20Reliance Growth 8106.62 38 - 21.53 22.73 1.17 19.19 30.93SBI Magnum Global Fund 94 1239.97 42 27.92 5.97 57.76 6.72 25.39 42.42SBI Magnum Midcap Fund 329.15 35 9.29 N.A 53.61 19.74 27.34 48.53SBI Magnum Multiplier Plus 93 1297.99 38 34.05 26.31 34.22 4.68 24.06 42.40SBI Magnum Sector Umbrella - Emerging Businesses 305.33 31 9.89 2.47 25.91 9.91 29.72 47.97Sundaram BNP Paribas Select Midcap 2397.65 47 52.48 N.A 50.47 3.33 19.76 35.31Tata Midcap Fund 100.98 44 2.29 N.A 49.61 8.11 18.15 32.88THEMATIC SECTOR FUNDSBirla Sun Life Basic Industries 129 54 2.36 22.22 38.95 8.63 15.46 28.54Birla Sun Life Buy India Fund 56 39 1.45 21.23 33.88 8.50 21.53 38.22Birla Sun Life Dividend Yield Plus 608 71 9.63 9.95 52.84 12.67 13.66 24.93Birla Sun Life India GenNext Fund 105 41 2.52 16.66 25.62 4.65 23.83 42.89Fidelity India Special Situations Fund 1026 80 12.82 34.70 22.35 7.88 26.30 39.94HDFC Core & Satellite Fund 475 37 12.92 29.59 22.19 10.49 31.75 50.61ICICI Prudential FMCG 81 12 - 31.98 29.00 N.A 52.14 80.84ICICI Prudential Infrastructure Fund 3719 42 - 56.30 13.71 1.16 37.77 56.19JM Basic Fund 401 23 16.99 14.12 32.95 15.58 26.06 46.10Kotak Contra Fund 90 68 1.28 36.52 28.43 5.70 18.29 32.05PRINCIPAL Dividend Yield Fund 130 35 3.80 37.44 40.16 N.A 27.49 49.49Reliance Diversified Power Fund 5021 33 - 31.36 20.29 6.47 25.66 45.24SBI Magnum COMMA Fund 664 43 15.19 25.05 32.92 4.51 21.98 38.59Tata Equity P/E Fund 718 57 12.63 29.66 30.59 3.98 22.65 36.12Tata Infrastructure Fund 2146 51 40.27 40.47 26.00 5.06 21.96 41.74
NOVEMBER 2010 Investime 31
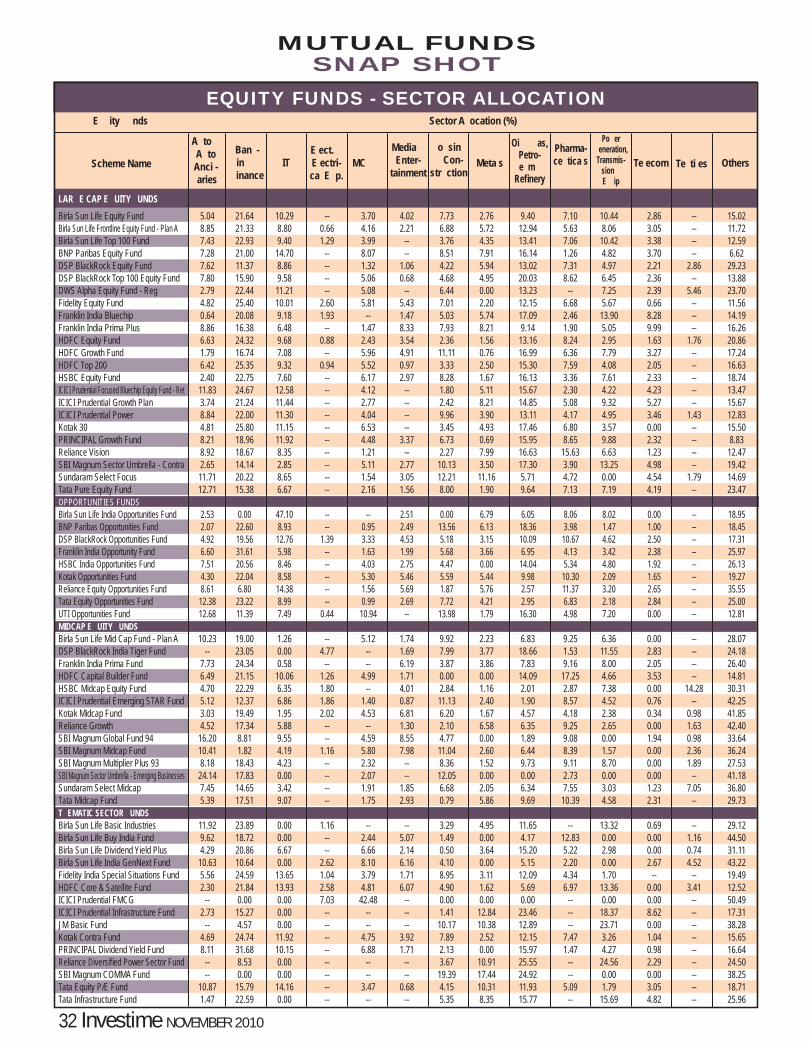
EQUITY FUNDS - SECTOR ALLOCATIONSector A ocation (%)E ity nds
Scheme Name
A to A toAnci -aries
Ban -in inance
MCE ect. E ectri-ca E p.
Meta s Te ti es OthersITMedia Enter-
tainment
o sin Con-
str ction
Oi as, Petro-e m
RefineryTe ecom
Pharma-ce tica s
Po ereneration,
Transmis-sion E ip
LAR E CAP E UITY UNDS Birla Sun Life Equity Fund 5.04 21.64 10.29 -- 3.70 4.02 7.73 2.76 9.40 7.10 10.44 2.86 -- 15.02Birla Sun Life Frontline Equity Fund - Plan A 8.85 21.33 8.80 0.66 4.16 2.21 6.88 5.72 12.94 5.63 8.06 3.05 -- 11.72Birla Sun Life Top 100 Fund 7.43 22.93 9.40 1.29 3.99 -- 3.76 4.35 13.41 7.06 10.42 3.38 -- 12.59BNP Paribas Equity Fund 7.28 21.00 14.70 -- 8.07 -- 8.51 7.91 16.14 1.26 4.82 3.70 -- 6.62DSP BlackRock Equity Fund 7.62 11.37 8.86 -- 1.32 1.06 4.22 5.94 13.02 7.31 4.97 2.21 2.86 29.23DSP BlackRock Top 100 Equity Fund 7.80 15.90 9.58 -- 5.06 0.68 4.68 4.95 20.03 8.62 6.45 2.36 -- 13.88DWS Alpha Equity Fund - Reg 2.79 22.44 11.21 -- 5.08 -- 6.44 0.00 13.23 -- 7.25 2.39 5.46 23.70Fidelity Equity Fund 4.82 25.40 10.01 2.60 5.81 5.43 7.01 2.20 12.15 6.68 5.67 0.66 -- 11.56Franklin India Bluechip 0.64 20.08 9.18 1.93 -- 1.47 5.03 5.74 17.09 2.46 13.90 8.28 -- 14.19Franklin India Prima Plus 8.86 16.38 6.48 -- 1.47 8.33 7.93 8.21 9.14 1.90 5.05 9.99 -- 16.26HDFC Equity Fund 6.63 24.32 9.68 0.88 2.43 3.54 2.36 1.56 13.16 8.24 2.95 1.63 1.76 20.86HDFC Growth Fund 1.79 16.74 7.08 -- 5.96 4.91 11.11 0.76 16.99 6.36 7.79 3.27 -- 17.24HDFC Top 200 6.42 25.35 9.32 0.94 5.52 0.97 3.33 2.50 15.30 7.59 4.08 2.05 -- 16.63HSBC Equity Fund 2.40 22.75 7.60 -- 6.17 2.97 8.28 1.67 16.13 3.36 7.61 2.33 -- 18.74ICICI Prudential Focused Bluechip Equity Fund - Ret 11.83 24.67 12.58 -- 4.12 -- 1.80 5.11 15.67 2.30 4.22 4.23 -- 13.47ICICI Prudential Growth Plan 3.74 21.24 11.44 -- 2.77 -- 2.42 8.21 14.85 5.08 9.32 5.27 -- 15.67ICICI Prudential Power 8.84 22.00 11.30 -- 4.04 -- 9.96 3.90 13.11 4.17 4.95 3.46 1.43 12.83Kotak 30 4.81 25.80 11.15 -- 6.53 -- 3.45 4.93 17.46 6.80 3.57 0.00 -- 15.50PRINCIPAL Growth Fund 8.21 18.96 11.92 -- 4.48 3.37 6.73 0.69 15.95 8.65 9.88 2.32 -- 8.83Reliance Vision 8.92 18.67 8.35 -- 1.21 -- 2.27 7.99 16.63 15.63 6.63 1.23 -- 12.47SBI Magnum Sector Umbrella - Contra 2.65 14.14 2.85 -- 5.11 2.77 10.13 3.50 17.30 3.90 13.25 4.98 -- 19.42Sundaram Select Focus 11.71 20.22 8.65 -- 1.54 3.05 12.21 11.16 5.71 4.72 0.00 4.54 1.79 14.69Tata Pure Equity Fund 12.71 15.38 6.67 -- 2.16 1.56 8.00 1.90 9.64 7.13 7.19 4.19 -- 23.47OPPORTUNITIES FUNDS Birla Sun Life India Opportunities Fund 2.53 0.00 47.10 -- -- 2.51 0.00 6.79 6.05 8.06 8.02 0.00 -- 18.95BNP Paribas Opportunities Fund 2.07 22.60 8.93 -- 0.95 2.49 13.56 6.13 18.36 3.98 1.47 1.00 -- 18.45DSP BlackRock Opportunities Fund 4.92 19.56 12.76 1.39 3.33 4.53 5.18 3.15 10.09 10.67 4.62 2.50 -- 17.31Franklin India Opportunity Fund 6.60 31.61 5.98 -- 1.63 1.99 5.68 3.66 6.95 4.13 3.42 2.38 -- 25.97HSBC India Opportunities Fund 7.51 20.56 8.46 -- 4.03 2.75 4.47 0.00 14.04 5.34 4.80 1.92 -- 26.13Kotak Opportunities Fund 4.30 22.04 8.58 -- 5.30 5.46 5.59 5.44 9.98 10.30 2.09 1.65 -- 19.27Reliance Equity Opportunities Fund 8.61 6.80 14.38 -- 1.56 5.69 1.87 5.76 2.57 11.37 3.20 2.65 -- 35.55Tata Equity Opportunities Fund 12.38 23.22 8.99 -- 0.99 2.69 7.72 4.21 2.95 6.83 2.18 2.84 -- 25.00UTI Opportunities Fund 12.68 11.39 7.49 0.44 10.94 -- 13.98 1.79 16.30 4.98 7.20 0.00 -- 12.81MIDCAP E UITY UNDS Birla Sun Life Mid Cap Fund - Plan A 10.23 19.00 1.26 -- 5.12 1.74 9.92 2.23 6.83 9.25 6.36 0.00 -- 28.07DSP BlackRock India Tiger Fund -- 23.05 0.00 4.77 -- 1.69 7.99 3.77 18.66 1.53 11.55 2.83 -- 24.18Franklin India Prima Fund 7.73 24.34 0.58 -- -- 6.19 3.87 3.86 7.83 9.16 8.00 2.05 -- 26.40HDFC Capital Builder Fund 6.49 21.15 10.06 1.26 4.99 1.71 0.00 0.00 14.09 17.25 4.66 3.53 -- 14.81HSBC Midcap Equity Fund 4.70 22.29 6.35 1.80 -- 4.01 2.84 1.16 2.01 2.87 7.38 0.00 14.28 30.31ICICI Prudential Emerging STAR Fund 5.12 12.37 6.86 1.86 1.40 0.87 11.13 2.40 1.90 8.57 4.52 0.76 -- 42.25Kotak Midcap Fund 3.03 19.49 1.95 2.02 4.53 6.81 6.20 1.67 4.57 4.18 2.38 0.34 0.98 41.85Reliance Growth 4.52 17.34 5.88 -- -- 1.30 2.10 6.58 6.35 9.25 2.65 0.00 1.63 42.40SBI Magnum Global Fund 94 16.20 8.81 9.55 -- 4.59 8.55 4.77 0.00 1.89 9.08 0.00 1.94 0.98 33.64SBI Magnum Midcap Fund 10.41 1.82 4.19 1.16 5.80 7.98 11.04 2.60 6.44 8.39 1.57 0.00 2.36 36.24SBI Magnum Multiplier Plus 93 8.18 18.43 4.23 -- 2.32 -- 8.36 1.52 9.73 9.11 8.70 0.00 1.89 27.53SBI Magnum Sector Umbrella - Emerging Businesses 24.14 17.83 0.00 -- 2.07 -- 12.05 0.00 0.00 2.73 0.00 0.00 -- 41.18Sundaram Select Midcap 7.45 14.65 3.42 -- 1.91 1.85 6.68 2.05 6.34 7.55 3.03 1.23 7.05 36.80Tata Midcap Fund 5.39 17.51 9.07 -- 1.75 2.93 0.79 5.86 9.69 10.39 4.58 2.31 -- 29.73T EMATIC SECTOR UNDS Birla Sun Life Basic Industries 11.92 23.89 0.00 1.16 -- -- 3.29 4.95 11.65 -- 13.32 0.69 -- 29.12Birla Sun Life Buy India Fund 9.62 18.72 0.00 -- 2.44 5.07 1.49 0.00 4.17 12.83 0.00 0.00 1.16 44.50Birla Sun Life Dividend Yield Plus 4.29 20.86 6.67 -- 6.66 2.14 0.50 3.64 15.20 5.22 2.98 0.00 0.74 31.11Birla Sun Life India GenNext Fund 10.63 10.64 0.00 2.62 8.10 6.16 4.10 0.00 5.15 2.20 0.00 2.67 4.52 43.22Fidelity India Special Situations Fund 5.56 24.59 13.65 1.04 3.79 1.71 8.95 3.11 12.09 4.34 1.70 -- -- 19.49HDFC Core & Satellite Fund 2.30 21.84 13.93 2.58 4.81 6.07 4.90 1.62 5.69 6.97 13.36 0.00 3.41 12.52ICICI Prudential FMCG -- 0.00 0.00 7.03 42.48 -- 0.00 0.00 0.00 -- 0.00 0.00 -- 50.49ICICI Prudential Infrastructure Fund 2.73 15.27 0.00 -- -- -- 1.41 12.84 23.46 -- 18.37 8.62 -- 17.31JM Basic Fund -- 4.57 0.00 -- -- -- 10.17 10.38 12.89 -- 23.71 0.00 -- 38.28Kotak Contra Fund 4.69 24.74 11.92 -- 4.75 3.92 7.89 2.52 12.15 7.47 3.26 1.04 -- 15.65PRINCIPAL Dividend Yield Fund 8.11 31.68 10.15 -- 6.88 1.71 2.13 0.00 15.97 1.47 4.27 0.98 -- 16.64Reliance Diversified Power Sector Fund -- 8.53 0.00 -- -- -- 3.67 10.91 25.55 -- 24.56 2.29 -- 24.50SBI Magnum COMMA Fund -- 0.00 0.00 -- -- -- 19.39 17.44 24.92 -- 0.00 0.00 -- 38.25Tata Equity P/E Fund 10.87 15.79 14.16 -- 3.47 0.68 4.15 10.31 11.93 5.09 1.79 3.05 -- 18.71Tata Infrastructure Fund 1.47 22.59 0.00 -- -- -- 5.35 8.35 15.77 -- 15.69 4.82 -- 25.96
32 Investime NOVEMBER 2010
SNAP SHOTMUTUAL FUNDS
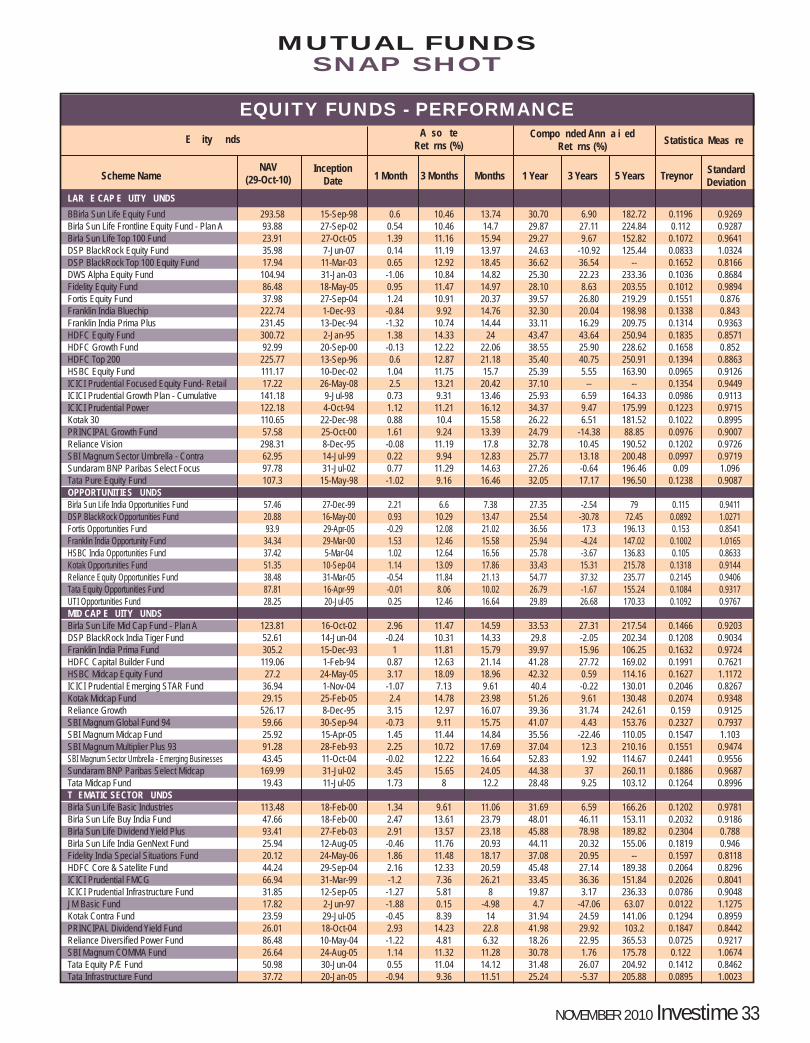
Compo nded Ann a i ed Ret rns (%) Statistica Meas re
InceptionDate 1 Month 1 Year 5 Years Treynor
A so teRet rns (%)
Scheme NameNAV
(29-Oct-10) 3 Months 3 Years StandardDeviation
E ity nds
Months
EQUITY FUNDS - PERFORMANCE
LAR E CAP E UITY UNDS BBirla Sun Life Equity Fund 293.58 15-Sep-98 0.6 10.46 13.74 30.70 6.90 182.72 0.1196 0.9269Birla Sun Life Frontline Equity Fund - Plan A 93.88 27-Sep-02 0.54 10.46 14.7 29.87 27.11 224.84 0.112 0.9287Birla Sun Life Top 100 Fund 23.91 27-Oct-05 1.39 11.16 15.94 29.27 9.67 152.82 0.1072 0.9641DSP BlackRock Equity Fund 35.98 7-Jun-07 0.14 11.19 13.97 24.63 -10.92 125.44 0.0833 1.0324DSP BlackRock Top 100 Equity Fund 17.94 11-Mar-03 0.65 12.92 18.45 36.62 36.54 -- 0.1652 0.8166DWS Alpha Equity Fund 104.94 31-Jan-03 -1.06 10.84 14.82 25.30 22.23 233.36 0.1036 0.8684Fidelity Equity Fund 86.48 18-May-05 0.95 11.47 14.97 28.10 8.63 203.55 0.1012 0.9894Fortis Equity Fund 37.98 27-Sep-04 1.24 10.91 20.37 39.57 26.80 219.29 0.1551 0.876Franklin India Bluechip 222.74 1-Dec-93 -0.84 9.92 14.76 32.30 20.04 198.98 0.1338 0.843Franklin India Prima Plus 231.45 13-Dec-94 -1.32 10.74 14.44 33.11 16.29 209.75 0.1314 0.9363HDFC Equity Fund 300.72 2-Jan-95 1.38 14.33 24 43.47 43.64 250.94 0.1835 0.8571HDFC Growth Fund 92.99 20-Sep-00 -0.13 12.22 22.06 38.55 25.90 228.62 0.1658 0.852HDFC Top 200 225.77 13-Sep-96 0.6 12.87 21.18 35.40 40.75 250.91 0.1394 0.8863HSBC Equity Fund 111.17 10-Dec-02 1.04 11.75 15.7 25.39 5.55 163.90 0.0965 0.9126ICICI Prudential Focused Equity Fund- Retail 17.22 26-May-08 2.5 13.21 20.42 37.10 -- -- 0.1354 0.9449ICICI Prudential Growth Plan - Cumulative 141.18 9-Jul-98 0.73 9.31 13.46 25.93 6.59 164.33 0.0986 0.9113ICICI Prudential Power 122.18 4-Oct-94 1.12 11.21 16.12 34.37 9.47 175.99 0.1223 0.9715Kotak 30 110.65 22-Dec-98 0.88 10.4 15.58 26.22 6.51 181.52 0.1022 0.8995PRINCIPAL Growth Fund 57.58 25-Oct-00 1.61 9.24 13.39 24.79 -14.38 88.85 0.0976 0.9007Reliance Vision 298.31 8-Dec-95 -0.08 11.19 17.8 32.78 10.45 190.52 0.1202 0.9726SBI Magnum Sector Umbrella - Contra 62.95 14-Jul-99 0.22 9.94 12.83 25.77 13.18 200.48 0.0997 0.9719Sundaram BNP Paribas Select Focus 97.78 31-Jul-02 0.77 11.29 14.63 27.26 -0.64 196.46 0.09 1.096Tata Pure Equity Fund 107.3 15-May-98 -1.02 9.16 16.46 32.05 17.17 196.50 0.1238 0.9087OPPORTUNITIES UNDS Birla Sun Life India Opportunities Fund 57.46 27-Dec-99 2.21 6.6 7.38 27.35 -2.54 79 0.115 0.9411DSP BlackRock Opportunities Fund 20.88 16-May-00 0.93 10.29 13.47 25.54 -30.78 72.45 0.0892 1.0271Fortis Opportunities Fund 93.9 29-Apr-05 -0.29 12.08 21.02 36.56 17.3 196.13 0.153 0.8541Franklin India Opportunity Fund 34.34 29-Mar-00 1.53 12.46 15.58 25.94 -4.24 147.02 0.1002 1.0165HSBC India Opportunities Fund 37.42 5-Mar-04 1.02 12.64 16.56 25.78 -3.67 136.83 0.105 0.8633Kotak Opportunities Fund 51.35 10-Sep-04 1.14 13.09 17.86 33.43 15.31 215.78 0.1318 0.9144Reliance Equity Opportunities Fund 38.48 31-Mar-05 -0.54 11.84 21.13 54.77 37.32 235.77 0.2145 0.9406Tata Equity Opportunities Fund 87.81 16-Apr-99 -0.01 8.06 10.02 26.79 -1.67 155.24 0.1084 0.9317UTI Opportunities Fund 28.25 20-Jul-05 0.25 12.46 16.64 29.89 26.68 170.33 0.1092 0.9767MID CAP E UITY UNDS Birla Sun Life Mid Cap Fund - Plan A 123.81 16-Oct-02 2.96 11.47 14.59 33.53 27.31 217.54 0.1466 0.9203DSP BlackRock India Tiger Fund 52.61 14-Jun-04 -0.24 10.31 14.33 29.8 -2.05 202.34 0.1208 0.9034Franklin India Prima Fund 305.2 15-Dec-93 1 11.81 15.79 39.97 15.96 106.25 0.1632 0.9724HDFC Capital Builder Fund 119.06 1-Feb-94 0.87 12.63 21.14 41.28 27.72 169.02 0.1991 0.7621HSBC Midcap Equity Fund 27.2 24-May-05 3.17 18.09 18.96 42.32 0.59 114.16 0.1627 1.1172ICICI Prudential Emerging STAR Fund 36.94 1-Nov-04 -1.07 7.13 9.61 40.4 -0.22 130.01 0.2046 0.8267Kotak Midcap Fund 29.15 25-Feb-05 2.4 14.78 23.98 51.26 9.61 130.48 0.2074 0.9348Reliance Growth 526.17 8-Dec-95 3.15 12.97 16.07 39.36 31.74 242.61 0.159 0.9125SBI Magnum Global Fund 94 59.66 30-Sep-94 -0.73 9.11 15.75 41.07 4.43 153.76 0.2327 0.7937SBI Magnum Midcap Fund 25.92 15-Apr-05 1.45 11.44 14.84 35.56 -22.46 110.05 0.1547 1.103SBI Magnum Multiplier Plus 93 91.28 28-Feb-93 2.25 10.72 17.69 37.04 12.3 210.16 0.1551 0.9474SBI Magnum Sector Umbrella - Emerging Businesses 43.45 11-Oct-04 -0.02 12.22 16.64 52.83 1.92 114.67 0.2441 0.9556Sundaram BNP Paribas Select Midcap 169.99 31-Jul-02 3.45 15.65 24.05 44.38 37 260.11 0.1886 0.9687Tata Midcap Fund 19.43 11-Jul-05 1.73 8 12.2 28.48 9.25 103.12 0.1264 0.8996T EMATIC SECTOR UNDS Birla Sun Life Basic Industries 113.48 18-Feb-00 1.34 9.61 11.06 31.69 6.59 166.26 0.1202 0.9781Birla Sun Life Buy India Fund 47.66 18-Feb-00 2.47 13.61 23.79 48.01 46.11 153.11 0.2032 0.9186Birla Sun Life Dividend Yield Plus 93.41 27-Feb-03 2.91 13.57 23.18 45.88 78.98 189.82 0.2304 0.788Birla Sun Life India GenNext Fund 25.94 12-Aug-05 -0.46 11.76 20.93 44.11 20.32 155.06 0.1819 0.946Fidelity India Special Situations Fund 20.12 24-May-06 1.86 11.48 18.17 37.08 20.95 -- 0.1597 0.8118HDFC Core & Satellite Fund 44.24 29-Sep-04 2.16 12.33 20.59 45.48 27.14 189.38 0.2064 0.8296ICICI Prudential FMCG 66.94 31-Mar-99 -1.2 7.36 26.21 33.45 36.36 151.84 0.2026 0.8041ICICI Prudential Infrastructure Fund 31.85 12-Sep-05 -1.27 5.81 8 19.87 3.17 236.33 0.0786 0.9048JM Basic Fund 17.82 2-Jun-97 -1.88 0.15 -4.98 4.7 -47.06 63.07 0.0122 1.1275Kotak Contra Fund 23.59 29-Jul-05 -0.45 8.39 14 31.94 24.59 141.06 0.1294 0.8959PRINCIPAL Dividend Yield Fund 26.01 18-Oct-04 2.93 14.23 22.8 41.98 29.92 103.2 0.1847 0.8442Reliance Diversified Power Fund 86.48 10-May-04 -1.22 4.81 6.32 18.26 22.95 365.53 0.0725 0.9217SBI Magnum COMMA Fund 26.64 24-Aug-05 1.14 11.32 11.28 30.78 1.76 175.78 0.122 1.0674Tata Equity P/E Fund 50.98 30-Jun-04 0.55 11.04 14.12 31.48 26.07 204.92 0.1412 0.8462Tata Infrastructure Fund 37.72 20-Jan-05 -0.94 9.36 11.51 25.24 -5.37 205.88 0.0895 1.0023
NOVEMBER 2010 Investime 33
SNAP SHOTMUTUAL FUNDS
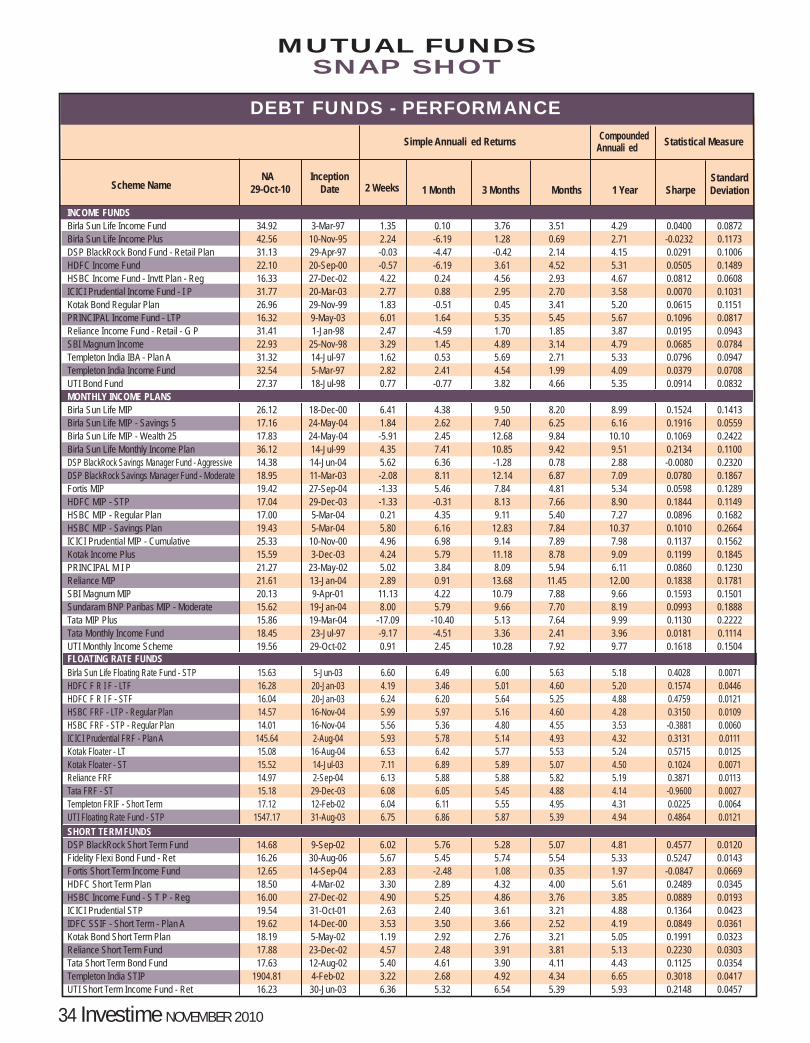
Scheme Name
DEBT FUNDS - PERFORMANCE
NA 29-Oct-10
InceptionDate 2 Weeks 1 Month 3 Months Months 1 Year Sharpe
StandardDeviation
Compounded Annuali ed Statistical MeasureSimple Annuali ed Returns
INCOME FUNDS Birla Sun Life Income Fund 34.92 3-Mar-97 1.35 0.10 3.76 3.51 4.29 0.0400 0.0872Birla Sun Life Income Plus 42.56 10-Nov-95 2.24 -6.19 1.28 0.69 2.71 -0.0232 0.1173DSP BlackRock Bond Fund - Retail Plan 31.13 29-Apr-97 -0.03 -4.47 -0.42 2.14 4.15 0.0291 0.1006HDFC Income Fund 22.10 20-Sep-00 -0.57 -6.19 3.61 4.52 5.31 0.0505 0.1489HSBC Income Fund - Invtt Plan - Reg 16.33 27-Dec-02 4.22 0.24 4.56 2.93 4.67 0.0812 0.0608ICICI Prudential Income Fund - I P 31.77 20-Mar-03 2.77 0.88 2.95 2.70 3.58 0.0070 0.1031Kotak Bond Regular Plan 26.96 29-Nov-99 1.83 -0.51 0.45 3.41 5.20 0.0615 0.1151PRINCIPAL Income Fund - LTP 16.32 9-May-03 6.01 1.64 5.35 5.45 5.67 0.1096 0.0817Reliance Income Fund - Retail - G P 31.41 1-Jan-98 2.47 -4.59 1.70 1.85 3.87 0.0195 0.0943SBI Magnum Income 22.93 25-Nov-98 3.29 1.45 4.89 3.14 4.79 0.0685 0.0784Templeton India IBA - Plan A 31.32 14-Jul-97 1.62 0.53 5.69 2.71 5.33 0.0796 0.0947Templeton India Income Fund 32.54 5-Mar-97 2.82 2.41 4.54 1.99 4.09 0.0379 0.0708UTI Bond Fund 27.37 18-Jul-98 0.77 -0.77 3.82 4.66 5.35 0.0914 0.0832MONTHLY INCOME PLANSBirla Sun Life MIP 26.12 18-Dec-00 6.41 4.38 9.50 8.20 8.99 0.1524 0.1413Birla Sun Life MIP - Savings 5 17.16 24-May-04 1.84 2.62 7.40 6.25 6.16 0.1916 0.0559Birla Sun Life MIP - Wealth 25 17.83 24-May-04 -5.91 2.45 12.68 9.84 10.10 0.1069 0.2422Birla Sun Life Monthly Income Plan 36.12 14-Jul-99 4.35 7.41 10.85 9.42 9.51 0.2134 0.1100DSP BlackRock Savings Manager Fund - Aggressive 14.38 14-Jun-04 5.62 6.36 -1.28 0.78 2.88 -0.0080 0.2320DSP BlackRock Savings Manager Fund - Moderate 18.95 11-Mar-03 -2.08 8.11 12.14 6.87 7.09 0.0780 0.1867Fortis MIP 19.42 27-Sep-04 -1.33 5.46 7.84 4.81 5.34 0.0598 0.1289HDFC MIP - STP 17.04 29-Dec-03 -1.33 -0.31 8.13 7.66 8.90 0.1844 0.1149HSBC MIP - Regular Plan 17.00 5-Mar-04 0.21 4.35 9.11 5.40 7.27 0.0896 0.1682HSBC MIP - Savings Plan 19.43 5-Mar-04 5.80 6.16 12.83 7.84 10.37 0.1010 0.2664ICICI Prudential MIP - Cumulative 25.33 10-Nov-00 4.96 6.98 9.14 7.89 7.98 0.1137 0.1562Kotak Income Plus 15.59 3-Dec-03 4.24 5.79 11.18 8.78 9.09 0.1199 0.1845PRINCIPAL M I P 21.27 23-May-02 5.02 3.84 8.09 5.94 6.11 0.0860 0.1230Reliance MIP 21.61 13-Jan-04 2.89 0.91 13.68 11.45 12.00 0.1838 0.1781SBI Magnum MIP 20.13 9-Apr-01 11.13 4.22 10.79 7.88 9.66 0.1593 0.1501Sundaram BNP Paribas MIP - Moderate 15.62 19-Jan-04 8.00 5.79 9.66 7.70 8.19 0.0993 0.1888Tata MIP Plus 15.86 19-Mar-04 -17.09 -10.40 5.13 7.64 9.99 0.1130 0.2222Tata Monthly Income Fund 18.45 23-Jul-97 -9.17 -4.51 3.36 2.41 3.96 0.0181 0.1114UTI Monthly Income Scheme 19.56 29-Oct-02 0.91 2.45 10.28 7.92 9.77 0.1618 0.1504FLOATING RATE FUNDSBirla Sun Life Floating Rate Fund - STP 15.63 5-Jun-03 6.60 6.49 6.00 5.63 5.18 0.4028 0.0071HDFC F R I F - LTF 16.28 20-Jan-03 4.19 3.46 5.01 4.60 5.20 0.1574 0.0446HDFC F R I F - STF 16.04 20-Jan-03 6.24 6.20 5.64 5.25 4.88 0.4759 0.0121HSBC FRF - LTP - Regular Plan 14.57 16-Nov-04 5.99 5.97 5.16 4.60 4.28 0.3150 0.0109HSBC FRF - STP - Regular Plan 14.01 16-Nov-04 5.56 5.36 4.80 4.55 3.53 -0.3881 0.0060ICICI Prudential FRF - Plan A 145.64 2-Aug-04 5.93 5.78 5.14 4.93 4.32 0.3131 0.0111Kotak Floater - LT 15.08 16-Aug-04 6.53 6.42 5.77 5.53 5.24 0.5715 0.0125Kotak Floater - ST 15.52 14-Jul-03 7.11 6.89 5.89 5.07 4.50 0.1024 0.0071Reliance FRF 14.97 2-Sep-04 6.13 5.88 5.88 5.82 5.19 0.3871 0.0113Tata FRF - ST 15.18 29-Dec-03 6.08 6.05 5.45 4.88 4.14 -0.9600 0.0027Templeton FRIF - Short Term 17.12 12-Feb-02 6.04 6.11 5.55 4.95 4.31 0.0225 0.0064UTI Floating Rate Fund - STP 1547.17 31-Aug-03 6.75 6.86 5.87 5.39 4.94 0.4864 0.0121SHORT TERM FUNDSDSP BlackRock Short Term Fund 14.68 9-Sep-02 6.02 5.76 5.28 5.07 4.81 0.4577 0.0120Fidelity Flexi Bond Fund - Ret 16.26 30-Aug-06 5.67 5.45 5.74 5.54 5.33 0.5247 0.0143Fortis Short Term Income Fund 12.65 14-Sep-04 2.83 -2.48 1.08 0.35 1.97 -0.0847 0.0669HDFC Short Term Plan 18.50 4-Mar-02 3.30 2.89 4.32 4.00 5.61 0.2489 0.0345HSBC Income Fund - S T P - Reg 16.00 27-Dec-02 4.90 5.25 4.86 3.76 3.85 0.0889 0.0193ICICI Prudential STP 19.54 31-Oct-01 2.63 2.40 3.61 3.21 4.88 0.1364 0.0423IDFC SSIF - Short Term - Plan A 19.62 14-Dec-00 3.53 3.50 3.66 2.52 4.19 0.0849 0.0361Kotak Bond Short Term Plan 18.19 5-May-02 1.19 2.92 2.76 3.21 5.05 0.1991 0.0323Reliance Short Term Fund 17.88 23-Dec-02 4.57 2.48 3.91 3.81 5.13 0.2230 0.0303Tata Short Term Bond Fund 17.63 12-Aug-02 5.40 4.61 3.90 4.11 4.43 0.1125 0.0354Templeton India STIP 1904.81 4-Feb-02 3.22 2.68 4.92 4.34 6.65 0.3018 0.0417UTI Short Term Income Fund - Ret 16.23 30-Jun-03 6.36 5.32 6.54 5.39 5.93 0.2148 0.0457
34 Investime NOVEMBER 2010
SNAP SHOTMUTUAL FUNDS
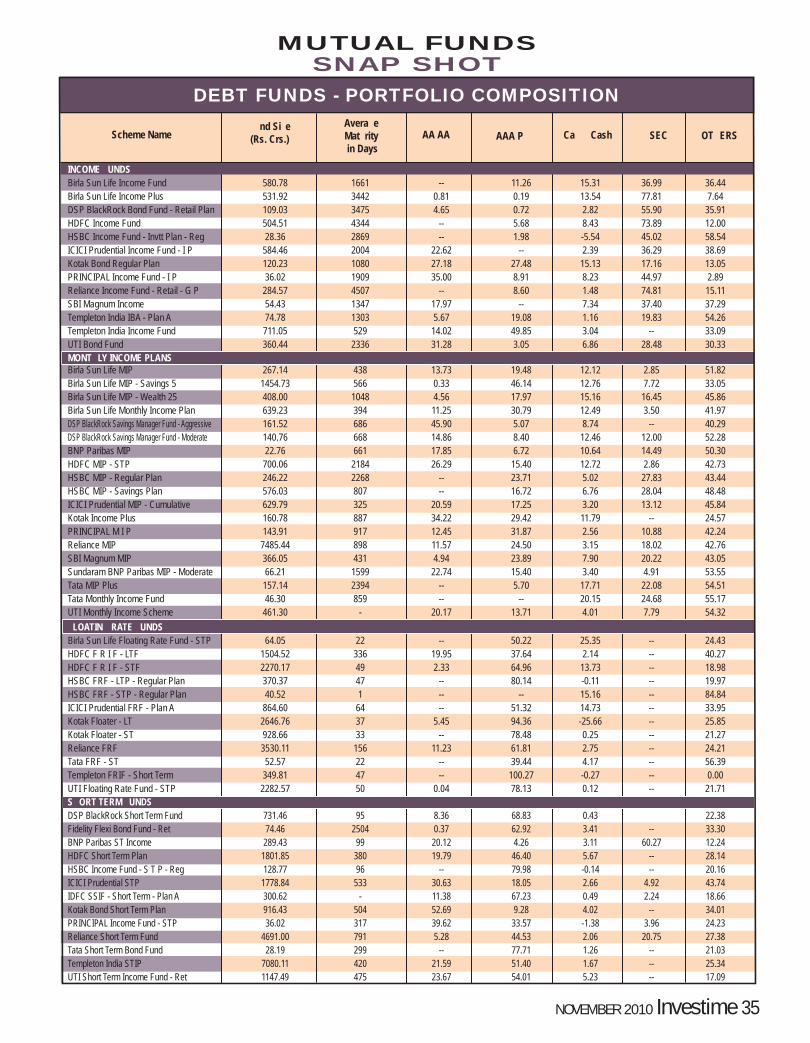
Scheme Namend Si e
(Rs. Crs.)Avera e Mat rity in Days
AA AA AAA P Ca Cash SEC OT ERS
DEBT FUNDS - PORTFOLIO COMPOSITION
NOVEMBER 2010 Investime 35
SNAP SHOTMUTUAL FUNDS
INCOME UNDS Birla Sun Life Income Fund 580.78 1661 -- 11.26 15.31 36.99 36.44Birla Sun Life Income Plus 531.92 3442 0.81 0.19 13.54 77.81 7.64DSP BlackRock Bond Fund - Retail Plan 109.03 3475 4.65 0.72 2.82 55.90 35.91HDFC Income Fund 504.51 4344 -- 5.68 8.43 73.89 12.00HSBC Income Fund - Invtt Plan - Reg 28.36 2869 -- 1.98 -5.54 45.02 58.54ICICI Prudential Income Fund - I P 584.46 2004 22.62 -- 2.39 36.29 38.69Kotak Bond Regular Plan 120.23 1080 27.18 27.48 15.13 17.16 13.05PRINCIPAL Income Fund - I P 36.02 1909 35.00 8.91 8.23 44.97 2.89Reliance Income Fund - Retail - G P 284.57 4507 -- 8.60 1.48 74.81 15.11SBI Magnum Income 54.43 1347 17.97 -- 7.34 37.40 37.29Templeton India IBA - Plan A 74.78 1303 5.67 19.08 1.16 19.83 54.26Templeton India Income Fund 711.05 529 14.02 49.85 3.04 -- 33.09UTI Bond Fund 360.44 2336 31.28 3.05 6.86 28.48 30.33MONT LY INCOME PLANS Birla Sun Life MIP 267.14 438 13.73 19.48 12.12 2.85 51.82Birla Sun Life MIP - Savings 5 1454.73 566 0.33 46.14 12.76 7.72 33.05Birla Sun Life MIP - Wealth 25 408.00 1048 4.56 17.97 15.16 16.45 45.86Birla Sun Life Monthly Income Plan 639.23 394 11.25 30.79 12.49 3.50 41.97DSP BlackRock Savings Manager Fund - Aggressive 161.52 686 45.90 5.07 8.74 -- 40.29DSP BlackRock Savings Manager Fund - Moderate 140.76 668 14.86 8.40 12.46 12.00 52.28BNP Paribas MIP 22.76 661 17.85 6.72 10.64 14.49 50.30HDFC MIP - STP 700.06 2184 26.29 15.40 12.72 2.86 42.73HSBC MIP - Regular Plan 246.22 2268 -- 23.71 5.02 27.83 43.44HSBC MIP - Savings Plan 576.03 807 -- 16.72 6.76 28.04 48.48ICICI Prudential MIP - Cumulative 629.79 325 20.59 17.25 3.20 13.12 45.84Kotak Income Plus 160.78 887 34.22 29.42 11.79 -- 24.57PRINCIPAL M I P 143.91 917 12.45 31.87 2.56 10.88 42.24Reliance MIP 7485.44 898 11.57 24.50 3.15 18.02 42.76SBI Magnum MIP 366.05 431 4.94 23.89 7.90 20.22 43.05Sundaram BNP Paribas MIP - Moderate 66.21 1599 22.74 15.40 3.40 4.91 53.55Tata MIP Plus 157.14 2394 -- 5.70 17.71 22.08 54.51Tata Monthly Income Fund 46.30 859 -- -- 20.15 24.68 55.17UTI Monthly Income Scheme 461.30 - 20.17 13.71 4.01 7.79 54.32
LOATIN RATE UNDS Birla Sun Life Floating Rate Fund - STP 64.05 22 -- 50.22 25.35 -- 24.43HDFC F R I F - LTF 1504.52 336 19.95 37.64 2.14 -- 40.27HDFC F R I F - STF 2270.17 49 2.33 64.96 13.73 -- 18.98HSBC FRF - LTP - Regular Plan 370.37 47 -- 80.14 -0.11 -- 19.97HSBC FRF - STP - Regular Plan 40.52 1 -- -- 15.16 -- 84.84ICICI Prudential FRF - Plan A 864.60 64 -- 51.32 14.73 -- 33.95Kotak Floater - LT 2646.76 37 5.45 94.36 -25.66 -- 25.85Kotak Floater - ST 928.66 33 -- 78.48 0.25 -- 21.27Reliance FRF 3530.11 156 11.23 61.81 2.75 -- 24.21Tata FRF - ST 52.57 22 -- 39.44 4.17 -- 56.39Templeton FRIF - Short Term 349.81 47 -- 100.27 -0.27 -- 0.00UTI Floating Rate Fund - STP 2282.57 50 0.04 78.13 0.12 -- 21.71S ORT TERM UNDS DSP BlackRock Short Term Fund 731.46 95 8.36 68.83 0.43 22.38Fidelity Flexi Bond Fund - Ret 74.46 2504 0.37 62.92 3.41 -- 33.30BNP Paribas ST Income 289.43 99 20.12 4.26 3.11 60.27 12.24HDFC Short Term Plan 1801.85 380 19.79 46.40 5.67 -- 28.14HSBC Income Fund - S T P - Reg 128.77 96 -- 79.98 -0.14 -- 20.16ICICI Prudential STP 1778.84 533 30.63 18.05 2.66 4.92 43.74IDFC SSIF - Short Term - Plan A 300.62 - 11.38 67.23 0.49 2.24 18.66Kotak Bond Short Term Plan 916.43 504 52.69 9.28 4.02 -- 34.01PRINCIPAL Income Fund - STP 36.02 317 39.62 33.57 -1.38 3.96 24.23Reliance Short Term Fund 4691.00 791 5.28 44.53 2.06 20.75 27.38Tata Short Term Bond Fund 28.19 299 -- 77.71 1.26 -- 21.03Templeton India STIP 7080.11 420 21.59 51.40 1.67 -- 25.34UTI Short Term Income Fund - Ret 1147.49 475 23.67 54.01 5.23 -- 17.09
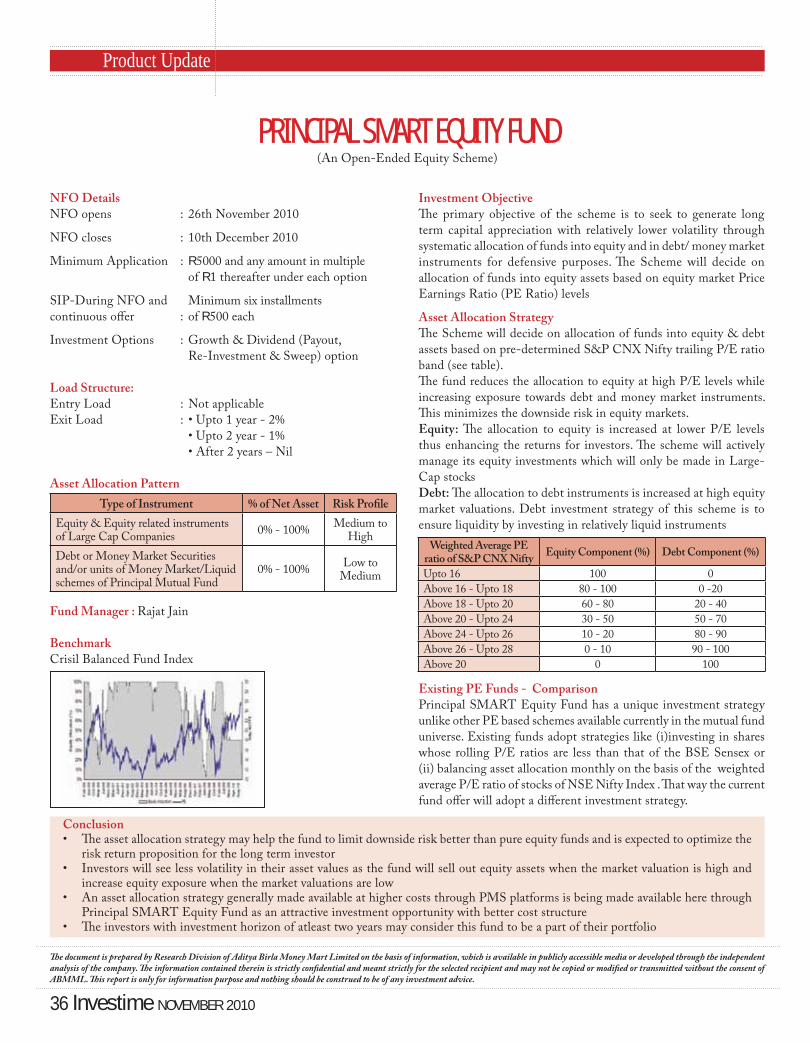
PRINCIPAL SMART EQUITY FUND
Product Update
(An Open-Ended Equity Scheme)
Investment Objective
The primary objective of the scheme is to seek to generate long
term capital appreciation with relatively lower volatility through
systematic allocation of funds into equity and in debt/ money market
instruments for defensive purposes. The Scheme will decide on
allocation of funds into equity assets based on equity market Price
Earnings Ratio (PE Ratio) levels
Asset Allocation Strategy
The Scheme will decide on allocation of funds into equity & debt
assets based on pre-determined S&P CNX Nifty trailing P/E ratio
band (see table).
The fund reduces the allocation to equity at high P/E levels while
increasing exposure towards debt and money market instruments.
This minimizes the downside risk in equity markets.
Equity: The allocation to equity is increased at lower P/E levels
thus enhancing the returns for investors. The scheme will actively
manage its equity investments which will only be made in Large-
Cap stocks
Debt: The allocation to debt instruments is increased at high equity
market valuations. Debt investment strategy of this scheme is to
ensure liquidity by investing in relatively liquid instruments
NFO Details
NFO opens : 26th November 2010
NFO closes : 10th December 2010
Minimum Application : R5000 and any amount in multiple
of R1 thereafter under each option
SIP-During NFO and Minimum six installments
continuous offer : of R500 each
Investment Options : Growth & Dividend (Payout,
Re-Investment & Sweep) option
Load Structure:
Entry Load : Not applicable
Asset Allocation Pattern
Fund Manager : Rajat Jain
Benchmark
Crisil Balanced Fund Index
The document is prepared by Research Division of Aditya Birla Money Mart Limited on the basis of information, which is available in publicly accessible media or developed through the independent analysis of the company. The information contained therein is strictly confidential and meant strictly for the selected recipient and may not be copied or modified or transmitted without the consent of ABMML. This report is only for information purpose and nothing should be construed to be of any investment advice.
Existing PE Funds - Comparison
Principal SMART Equity Fund has a unique investment strategy
unlike other PE based schemes available currently in the mutual fund
universe. Existing funds adopt strategies like (i)investing in shares
whose rolling P/E ratios are less than that of the BSE Sensex or
(ii) balancing asset allocation monthly on the basis of the weighted
average P/E ratio of stocks of NSE Nifty Index . That way the current
fund offer will adopt a different investment strategy.
Conclusion
risk return proposition for the long term investor
increase equity exposure when the market valuations are low
Principal SMART Equity Fund as an attractive investment opportunity with better cost structure
Type of Instrument % of Net Asset Risk Profile
Equity & Equity related instruments of Large Cap Companies
Medium to High
Debt or Money Market Securities and/or units of Money Market/Liquid schemes of Principal Mutual Fund
Low to Medium
Weighted Average PE ratio of S&P CNX Nifty
Equity Component (%) Debt Component (%)
100 0
0 -20
20 - 40
30 - 50 50 - 70
10 - 20
0 - 10
Above 20 0 100
36 Investime NOVEMBER 2010
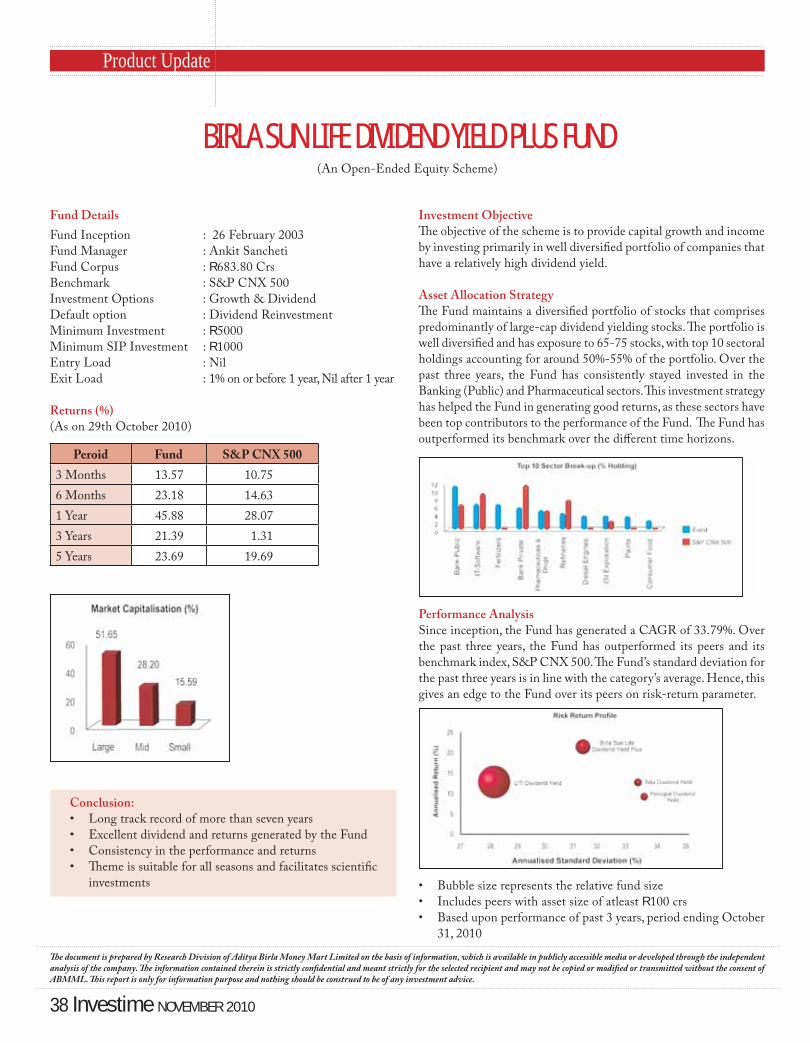
BIRLA SUN LIFE DIVIDEND YIELD PLUS FUND
Product Update
(An Open-Ended Equity Scheme)
Investment Objective
The objective of the scheme is to provide capital growth and income
by investing primarily in well diversified portfolio of companies that
have a relatively high dividend yield.
Asset Allocation Strategy
The Fund maintains a diversified portfolio of stocks that comprises
predominantly of large-cap dividend yielding stocks. The portfolio is
well diversified and has exposure to 65-75 stocks, with top 10 sectoral
holdings accounting for around 50%-55% of the portfolio. Over the
past three years, the Fund has consistently stayed invested in the
Banking (Public) and Pharmaceutical sectors. This investment strategy
has helped the Fund in generating good returns, as these sectors have
been top contributors to the performance of the Fund. The Fund has
outperformed its benchmark over the different time horizons.
Performance Analysis
Since inception, the Fund has generated a CAGR of 33.79%. Over
the past three years, the Fund has outperformed its peers and its
benchmark index, S&P CNX 500. The Fund’s standard deviation for
the past three years is in line with the category’s average. Hence, this
gives an edge to the Fund over its peers on risk-return parameter.
R100 crs
31, 2010
38 Investime NOVEMBER 2010
The document is prepared by Research Division of Aditya Birla Money Mart Limited on the basis of information, which is available in publicly accessible media or developed through the independent analysis of the company. The information contained therein is strictly confidential and meant strictly for the selected recipient and may not be copied or modified or transmitted without the consent of ABMML. This report is only for information purpose and nothing should be construed to be of any investment advice.
Peroid Fund S&P CNX 500
3 Months 13.57 10.75
6 Months 23.18 14.63
1 Year 45.88 28.07
3 Years 21.39 1.31
5 Years 23.69 19.69
Fund Details
R683.80 Crs
R5000
R1000
Returns (%)
(As on 29th October 2010)
Conclusion:
investments
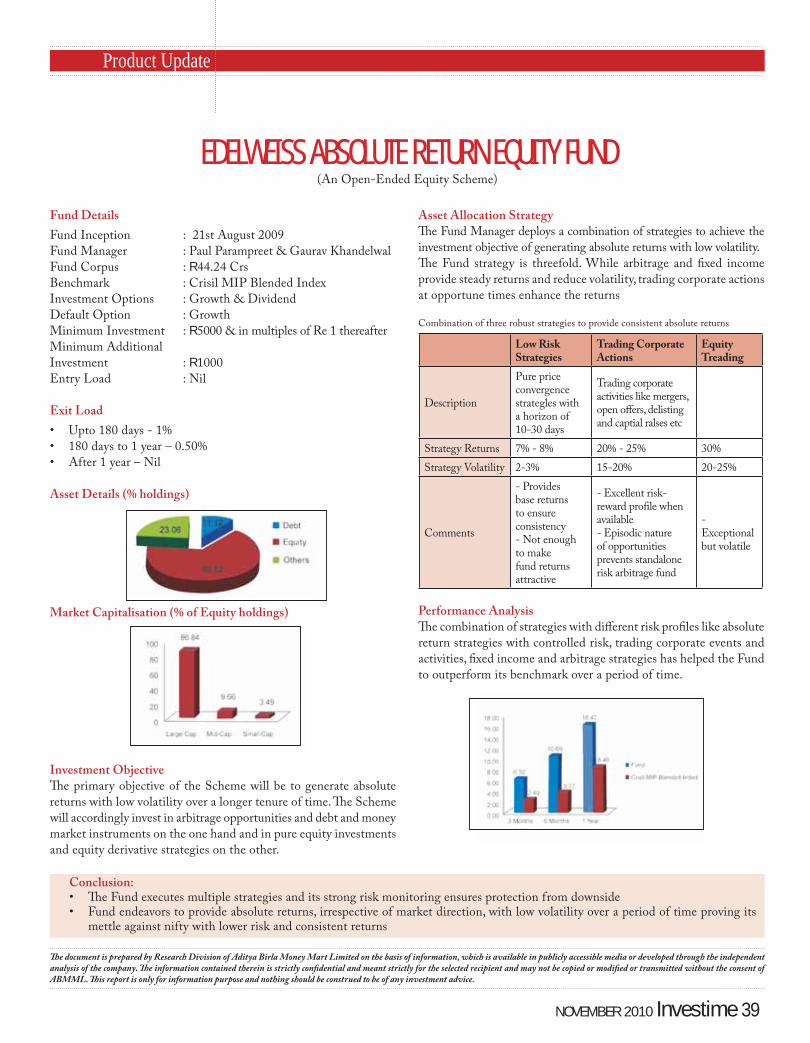
EDELWEISS ABSOLUTE RETURN EQUITY FUND
Product Update
(An Open-Ended Equity Scheme)
The document is prepared by Research Division of Aditya Birla Money Mart Limited on the basis of information, which is available in publicly accessible media or developed through the independent analysis of the company. The information contained therein is strictly confidential and meant strictly for the selected recipient and may not be copied or modified or transmitted without the consent of ABMML. This report is only for information purpose and nothing should be construed to be of any investment advice.
Investment Objective
The primary objective of the Scheme will be to generate absolute
returns with low volatility over a longer tenure of time. The Scheme
will accordingly invest in arbitrage opportunities and debt and money
market instruments on the one hand and in pure equity investments
and equity derivative strategies on the other.
Fund Details
Fund Inception : 21st August 2009
Fund Manager : Paul Parampreet & Gaurav Khandelwal
Fund Corpus : R44.24 Crs
Benchmark : Crisil MIP Blended Index
Investment Options : Growth & Dividend
Default Option : Growth
Minimum Investment : R5000 & in multiples of Re 1 thereafter
Minimum Additional
Investment : R1000
Entry Load : Nil
Exit Load
Asset Details (% holdings)
Market Capitalisation (% of Equity holdings)
Conclusion:
mettle against nifty with lower risk and consistent returns
Asset Allocation Strategy
The Fund Manager deploys a combination of strategies to achieve the
investment objective of generating absolute returns with low volatility.
The Fund strategy is threefold. While arbitrage and fixed income
at opportune times enhance the returns
Combination of three robust strategies to provide consistent absolute returns
Performance Analysis
The combination of strategies with different risk profiles like absolute
to outperform its benchmark over a period of time.
Low Risk Strategies
Trading Corporate Actions
Equity Treading
Description
Pure price convergence strategles with a horizon of 10-30 days
Trading corporate
and captial ralses etc
Strategy Returns
Strategy Volatility
Comments
- Provides base returns to ensure consistency - Not enough to make fund returns attractive
- Excellent risk-reward profile when available - Episodic nature of opportunities prevents standalone risk arbitrage fund
- Exceptional but volatile
NOVEMBER 2010 Investime 39
40 Investime NOVEMBER 2010
POLICY INSTRUMENTThe Rupee as a
The Rupee seems to be well-composed, being in a state of managed floating, the official position of the domestic
currency. This is akin to a state of being insulated from adverse weather and, at the same time, being benefited from the occasional exposures. From a condition of intermittent but definitive depreciation, the currency started swaying both ways under the influence of an economy that was opening up. We called it by different names — liberalisation and globalisation. The metamorphosis was defined by the greater capital account convertibility and a relatively free current account. Despite these winds of change sweeping through the landscape, the Rupee never evolved itself into a policy instrument. Here, the definition of the policy instrument, rather policy tool, is different from what we perceive in the normal course. It means a catalyst or facilitator, and its faculties are more varied and versatile than normal instruments.
Currency intervention is a policy tool; currency restrictions is yet another. The act of intervention is intellectually assimilated and accepted in a sober fashion when it comes from the Federal Reserve Bank of New York, much respected when it is from the Bank of Japan, and much dreaded when it was from the Deutsche Bundesbank. The feelings toward currency intervention are a product of experience. Intervention requires a few billions of dollars every time, and it need not necessarily be successful all the time as borne out by the experience of Bank of England in the 1990s. In a country like India where we pay more for what we buy from international markets than what we receive on what we export, the currency level would be an efficient mechanism to control price transmission from overseas markets and economies. This is, in addition to its role as a promoter of external trade. But, probably, this has not been taken
advantage of by us. With persistently high prices and inflation eating into the standard of living already achieved, a careful policy of currency management needs to be put in place to reach goals of social welfare. Going back to classical or even neoclassical thinking, there is a price equalisation that happens when we open up our borders for free movement of goods and services. But we lose the comparative advantage when the price equalisation is finally reached. This calls for restrictions rather than opening up too much.
There is an enormous amount of cheap money created in the West moving into emerging markets today, and this is the direct result of the liquidity created in the aftermath of the worst depression ever. The situation was complicated by the recent reaffirmation of the continuation of the soft money policy, as recently as just two or three months back. It is not surprising that some nations have already taken drastic steps to arrest the swelling tide of idle cash flowing in because they have realised that there is too much of froth and no beer. Last week, strong and novel currency controls were established by Brazil, Thailand and Korea to contain the impact of inflows and the consequent rise in the value of the domestic currencies. For many years, Japan was accused of manipulating its currency in furtherance of its domestic, economic and social agenda, manipulation for others and modification for those who think alike. China holds on to its currency policy of managed appreciation despite the need for speed was expressed by many, including the US. The currency is an expression of national identity and national aspirations as well.
The RBI is currently in a difficult state of reconciling the demands of growth with those of stability. Let us look at the realities. The inflows today reside very much in the realm of limited financial investments. Do we
really benefit from this? We may not! So long as these are speculative money flows. May be, for some time, from an inflated market capitalisation we tend to derive comfort. But it really means very little to the real economy. China promoted FDIs and never FIIs. We need resources for growth, production and to enhance the efficiency of capital and not plain financial investments in the markets from which gains are made by an undefined set of people as the prices surge up with demand. Currency positioning can provide a direction in such situations. We need to banish currency gain as something that is taken for granted.
Going back to classical economic theorising, a weak currency is a proxy for interest rate reduction and a strong currency is an index of higher rates. This holds good even today, and more so, in the context of dynamic forces acting on the currency rate, both external and internal, and driving it in a direction mostly judged as far appropriate by one factor or the other. What we require is a policy that has its moorings in a more realistic approach to currency management, a policy that will enhance the efficiency of capital. The RBI has fulfilled its responsibilities to a large extent, but we still need to walk that extra mile to realise the full potential.
At a time when the US is steadily losing its command and sheen, and capital controls are gradually becoming more common as a way of dealing with difficult situations, and also as a measure of protecting national interests, we need to look at transforming the currency into a resilient and strong tool of economic and monetary management. This may be the beginning of a new era of currency-based management.
(Sourced from ABMML Archives)
FEATURE Commentary

BOOK REVIEW Sohini Dey
Inof...
memory
42 Investime NOVEMBER 2010
Today, Stieg Larsson is the famous author of the wildly popular Millenium series of feminist crime thrillers. The
trilogy is a worldwide phenomenon and is now being made into highly anticipated movies. But Stieg Larsson never saw all this. The journalist who worked against discrimination and violence (doesn’t seem likely for a crime thriller writer, does it?) died just before he could taste literary success.Over five years after his death, friend and colleague Kurdo Baksi has written Stieg Larsson’s biography, a welcome chronicle about a person of whom we know so little otherwise. Baksi speaks about Larsson’s work and his personal life — what made him so vocal against violence on women, his reason for founding Expo, his life with partner Eva Gabrielsson and unfinished plans for writing about ten books in the Millenium series. Baksi gives us an account full of stories and anecdotes, but at the same time deeply personal, thanks to his long-standing relationship with Larsson. A great biography and a must read for all Millenium series fans. `
Stieg Larsson, my FriendAuthor: Kurdo BaksiPublisher: QuercusPrice: `450
Kurdo Baksi reveals lesser known facts of one of today’s
most popular authors, the late
Stieg Larsson, in a moving,
personal account