Embed Size (px)
Citation preview

PERE CFO MARKET PULSE
A compensation survey conducted by BCGI
Presented by Robert Baron and Neil Golub

SURVEY POPULATION
• REAL ESTATE INVESTMENT MANAGERS
• NORTH AMERICAN
• DIVERSIFIED STRATEGIES
• 55 PARTICIPANTS CONSISTING OF:
o CFOs
o COOs
o MANAGING PARTNERS
o INVESTOR RELATIONS

SURVEY POPULATION - GEOGRAPHY
Major Cities
15% - New York
11% - Boston
7% - San Francisco
7% - Washington DC
6% - Dallas
2%
9%
13%
20%
4%
48%
4%

SURVEY POPULATION - AUM
0%
5%
10%
15%
20%
25%
30%
35%
< $500 million $500 million - $1 billion $1 billion - $5 billion > $5 billion
12
16
19
8
TOTAL ASSETS UNDER MANAGEMENT

SURVEY POPULATION - FUNDRAISING
0%
10%
20%
30%
40%
50%
< $250 million $250 million - $500million
$500-$1billion > $1 billion
27
13
10
5
MOST RECENT FUND SIZE

SURVEY POPULATION – SIZE & TYPE
0%
20%
40%
60%
80%
100%
< 25 25-50 50-100 100-250 > 250
24
11 11
5 4
# OF PROFESSIONAL EMPLOYEES
0%
20%
40%
60%
80%
100%
Verticallyintegrated
Allocator Fund offunds
38
12
5
FUND MODEL
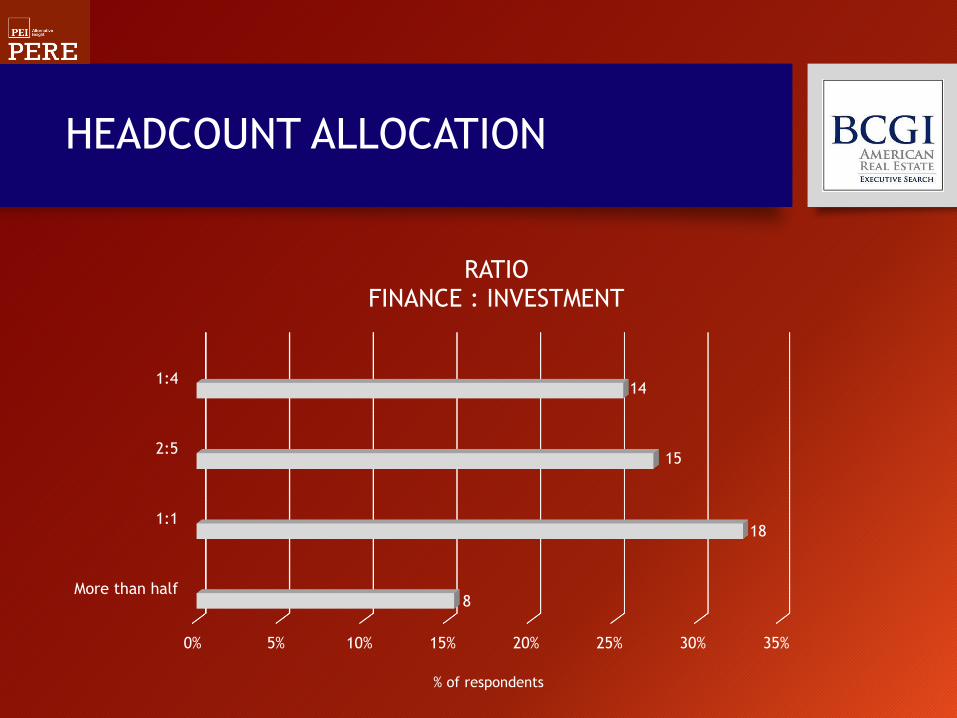
HEADCOUNT ALLOCATION
0% 5% 10% 15% 20% 25% 30% 35%
More than half
1:1
2:5
1:4
8
18
15
14
RATIOFINANCE : INVESTMENT
% of respondents
FEES

MANAGEMENT FEES
0%
10%
20%
30%
40%
50%
60%
< 50 50 - 100 100 - 150 150 -200 > 200
2
7
31
14
1
MANAGEMENT FEE OF MOST RECENT FUND
Basis Points

MANAGEMENT FEES – AUM
0%
10%
20%
30%
40%
50%
60%
70%
80%
< $500MM $500MM - $1B $1B - $5B > $5B
MANAGEMENT FEES ACCORDING TO AUM
< 50 50 - 100 100 - 150 150 -200 > 200
Basis Points
AUM
FEES

ACQUISITION FEES
Yes
No
ACQUISITION FEE IN LATEST FUND
85% of firms charging acquisition fees
are vertically integrated
74%
26%

PARTICIPATION
Yes
No
CFO IS ON THE INVESTMENT COMMITTEE
69%
31%

COMPENSATION

COMPENSATION - CFO
0%
5%
10%
15%
20%
25%
30%
Less than$100K
$100K -$150K
$150K -$200K
$200K -$250K
$250K -$300K
$300K -$350K
More than$400K
45
7
15
8
11
5
CFO’s BASE SALARY IN 2013
55 respondents

CARRIED INTEREST
Yes
No
THE CFO RECEIVES CARRIED INTEREST
24%
76%

COMPENSATION - CFO
0%
5%
10%
15%
20%
25%
30%
$100K -$250K
$250K -$350K
$350K -$450K
$450K -$600K
$600K -$750K
More than$750K
14
10
8
4
7
12
CFO’s TOTAL COMPENSATION (including LTIP) IN 2013
55 respondents

COMPENSATION - CFO
0%
10%
20%
30%
40%
50%
60%
70%
< $500MM $500MM - $1B $1B - $5B > $5B
TOTAL CFO COMPENSATION BY AUM
$100K - $250K $250K - $350K $350K - $450K $450K - $600K $600K - $750K More than $750K
AUM

COMPENSATION - CONTROLLER
0%
10%
20%
30%
40%
50%
60%
Less than$100K
$100K -$150K
$150K -$200K
$200K -$250K
More than$250K
12
26
64
1
CONTROLLER’s BASE SALARY IN 2013
49 respondents

COMPENSATION - CONTROLLER
0%
5%
10%
15%
20%
25%
30%
35%
Less than$100K
$100K -$150K
$150K -$200K
$200K -$250K
$250K -$300K
$300K -$350K
More than$350K
6
17
11
5
3 34
CONTROLLER’s TOTAL COMPENSATION IN 2013
49 respondents

COMPENSATION - COO
0%
5%
10%
15%
20%
25%
30%
35%
$100K -$250K
$250K -$350K
$350K -$450K
$450K -$550K
$550K -$650K
$650K -$750K
More than$750K
I'm alsothe CFO
5
9
6
4
1
8
14
COO’s TOTAL COMPENSATION (including LTIP) IN 2013
46 respondents

COMPENSATION – HEAD OF ASSET MANAGEMENT
0%
5%
10%
15%
20%
25%
Less than $100K $100K - $200K $200K - $300K $300K - $400K $400K - $500K More than$500K
3
10 10
6 6
10
45 respondents
HEAD OF ASSET MANAGEMENT’s TOTAL COMPENSATION (including LTIP) IN 2013

COMPENSATION – HEAD OF TRANSACTIONS
0%
5%
10%
15%
20%
25%
30%
Less than$100K
$100K -$250K
$250K -$350K
$350K -$450K
$450K -$550K
$550K -$650K
$650K -$750K
More than$750K
4
8
4 4 4
3
4
11
42 respondents
HEAD OF TRANSACTIONS’ TOTAL COMPENSATION (including LTIP) IN 2013

COMPENSATION – HEAD OF IR
40 respondents
0%
5%
10%
15%
20%
25%
30%
< $100K $100K - $200K $200K - $300K $300K - $400K $400K - $500K > $500K
7
11
7
4
1
10
HEAD OF INVESTOR RELATIONS’ TOTAL COMPENSATION (including LTIP) IN 2013

COMPLIANCE
Yes
No
FIRM HAS A CHIEF COMPLIANCE OFFICER
67%
33%

COMPLIANCE
0% 10% 20% 30% 40% 50% 60%
Other
Managing Partners
COO
We're all staying late
General Counsel
CFO
5
2
3
6
6
18
COMPLIANCE OTHER THAN CCO
Others include:• Director of Finance
• Parent Company
• Vice President of Accounting
• 3RD Party Service Provider% of respondents

EXPENSES
0% 10% 20% 30% 40% 50% 60%
Other (please specify)
Real Estate (Occupancy)
Marketing
Technology
Payroll
Investor Relations/Reporting
Legal/Compliance
Benefits
1
6
7
9
10
13
27
29
UNANTICIPATED EXPENSE INCREASES
% of respondents

BACK OFFICE
No, it's all in-houseConsidering it
Yes, we keep it lean
BACK-OFFICE OUTSOURCING ?
65%
28%
7%

SENTIMENT
0% 10% 20% 30% 40% 50%
Partners at home?
Partners at work
Partners on deals
Tax reform
Rising costs
Reporting
Deploying capital
Fund performance
Fundraising
Regulation
1
2
6
6
8
17
21
22
25
25
ISSUES KEEPING CFOs UP AT NIGHT
% of respondents

SUCCESSION
No
Yes
SUCCESSION PLANNING
24%
Hmmm, that’s probably
worth discussing
63% 13%

RECRUITING
0% 5% 10% 15% 20% 25% 30% 35% 40% 45% 50%
Legal
Administrative
Investor Relations
Risk
Operations
Asset Management
Compliance
Executive Management
Accounting
Capital Raising
Acquisitions
2
3
3
4
5
5
5
6
14
20
23
THE MOST DIFFICULT AREAS TO RECRUIT
% of respondents

EXPANSION
No
Yes
ADDING HEADCOUNT DURING 2014
80%
20%

EXPANSION
0% 10% 20% 30% 40% 50% 60%
Risk
Legal
Compliance
Investor Relations
Executive Management
Administrative
Operations
Capital Raising
Asset Management
Acquisitions
Accounting
1
2
3
5
6
7
14
15
20
23
24
AREAS OF EXPANSION
% of respondents

SURVEY SAYS...
69% of CFOs sit on the
investment committee
57% of Controllers
earned $100K - $200K
Benefits and Compliance
are the rising cost centers
Recruiting challenge
Acquisitions & Capital Raisers
80% of firms
plan to hire
25% of CFOs earned < $250K 30% act as both CFO & COO
22% of CFOs earned > $750K

CLOSING...
When an actor comes to me and wants to discuss his
character, I say, 'It's in the script.'
If he says, 'But what's my motivation?, ' I say, 'Your salary.’
- Alfred Hitchcock

PERE CFO MARKET PULSE
A compensation survey conducted by BCGI
Presented by Robert Baron and Neil Golub
New York
535 Fifth Ave
4th Floor
New York, NY 10017
212-706-0750
Toronto
141 Adelaide Street West
Suite 1006
Toronto, ON M5H 3L5
416-979-2404