Embed Size (px)
Citation preview
English as an Additional Languagein Victorian government schools
2015
IntroductionThis report provides information about English as an Additional Language (EAL) students and programs in Victorian government schools in 2015.
This report is based on:
• the August School CensusThe Department of Education and Training conducts a schools’ census in August each year. This census provides detailed information about students from language backgrounds other than English who are enrolled in government schools in Victoria. The allocation of EAL Index funding for the following year is based on this census.
• the EAL section of the Supplementary Census The Department of Education and Training conducts an annual mid-year supplementary school data collection in August. The EAL section seeks information from all schools in receipt of EAL Index funding and provides a profile of EAL learners and the types of EAL programs in government schools.
• CASES21 CASES21 is the software component of CASES (Computerised Administrative System Environment in Schools) which is the package provided to Victorian government schools to support school administration, finance and central reporting.
Victorian government school EAL programs are provided to eligible students for up to five years after their first enrolment in an Australian school. Students who are newly arrived are eligible for support through the New Arrivals Program which provides intensive, specialist support for English language learning in the first twelve to eighteen months in Australia. Students transition from the New Arrivals Program to a mainstream school where they are supported by programs funded by EAL Index funding.
Part 1 provides information about EAL provision and programs for newly arrived EAL students.
Part 2 provides information about EAL provision and programs for students in mainstream schools.
This report was published in July 2016.
2

List of tables and figures
Table 1 EAL new arrivals by region, government schools, Victoria 2015 p. 5
Figure 1 Language backgrounds of newly arrived EAL students, government schools, Victoria 2015
p. 6
Figure 2 Countries of birth of newly arrived EAL students, government schools, Victoria 2015 p. 7
Figure 3 Residency status of newly arrived EAL students, government schools, Victoria 2015 p. 8
Table 2 Students in EAL new arrival programs, government schools, Victoria 2015 p. 10
Table 3 Students eligible for EAL funding in mainstream schools, government schools, by year level and region, Victoria 2015
p. 11
Table 4 EAL program types, Victorian government schools, 2015 p. 13
Table 5 Government schools that assessed EAL students against the EAL standards, Victoria 2015
p. 14
Table 6 Students assessed against the EAL Standards, government schools, Victoria 2015 p. 14
Table 7 Students enrolled in VCE EAL Units 3 and 4 sequence as compared to all students enrolled in English by region, government schools, Victoria 2015
p. 15
Table 8 Students enrolled in VCE EAL Units 3 and 4 by region, between 2009-2015 p. 15
AppendicesAppendix 1 Newly arrived EAL students by language and region, government schools,
Victoria 2015p. 16
Appendix 2 Newly arrived EAL students by country of birth and region, government schools, Victoria 2015
p. 20
3
Acronyms and abbreviations
CASES21 Computerised Administrative System Environment in Schools
EAL English as an Additional Language
ELS English Language School
ELC English Language Centre
LBOTE Language Background Other Than English
nec Not elsewhere classified
NEV North-Eastern Victoria Region
nfd Not further defined
NWV North-Western Victoria Region
SAR Special Administrative Region
SEV South-Eastern Victoria Region
SWV South-Western Victoria Region
VCAA Victorian Curriculum and Assessment Authority
VCE Victorian Certificate of Education
VSL Victorian School of Languages
4
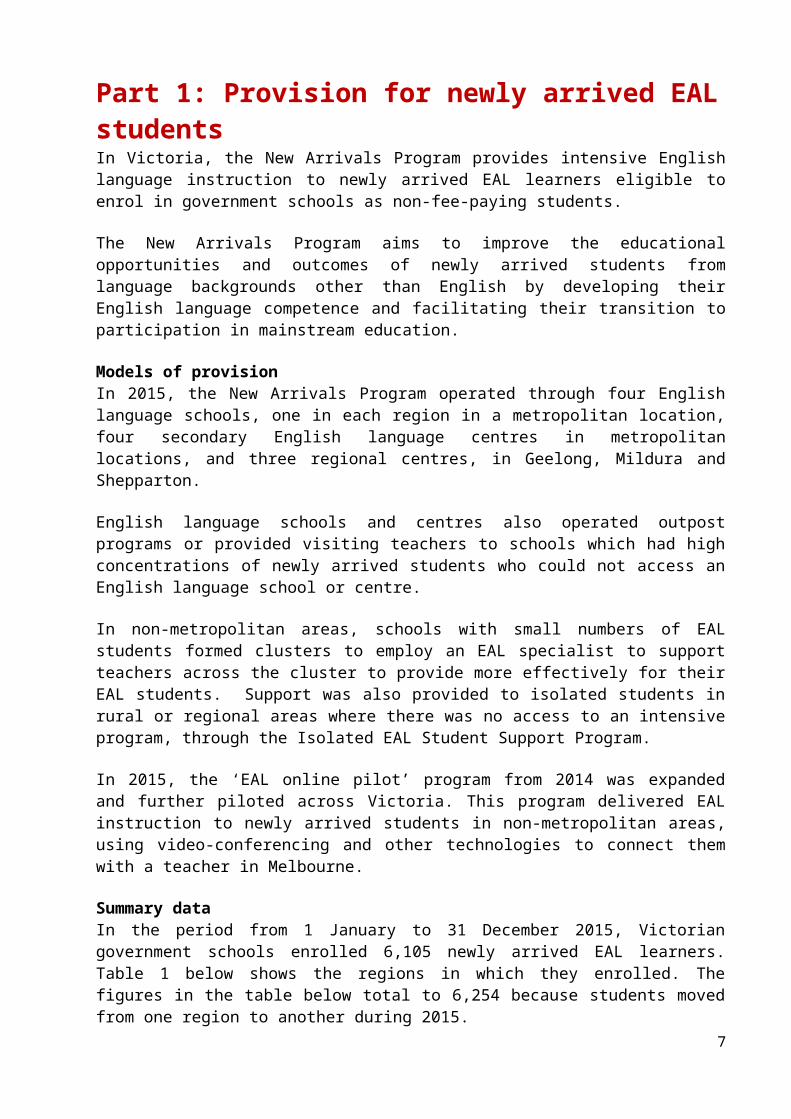
Part 1: Provision for newly arrived EAL studentsIn Victoria, the New Arrivals Program provides intensive English language instruction to newly arrived EAL learners eligible to enrol in government schools as non-fee-paying students.
The New Arrivals Program aims to improve the educational opportunities and outcomes of newly arrived students from language backgrounds other than English by developing their English language competence and facilitating their transition to participation in mainstream education.
Models of provisionIn 2015, the New Arrivals Program operated through four English language schools, one in each region in a metropolitan location, four secondary English language centres in metropolitan locations, and three regional centres, in Geelong, Mildura and Shepparton.
English language schools and centres also operated outpost programs or provided visiting teachers to schools which had high concentrations of newly arrived students who could not access an English language school or centre.
In non-metropolitan areas, schools with small numbers of EAL students formed clusters to employ an EAL specialist to support teachers across the cluster to provide more effectively for their EAL students. Support was also provided to isolated students in rural or regional areas where there was no access to an intensive program, through the Isolated EAL Student Support Program.
In 2015, the ‘EAL online pilot’ program from 2014 was expanded and further piloted across Victoria. This program delivered EAL instruction to newly arrived students in non-metropolitan areas, using video-conferencing and other technologies to connect them with a teacher in Melbourne.
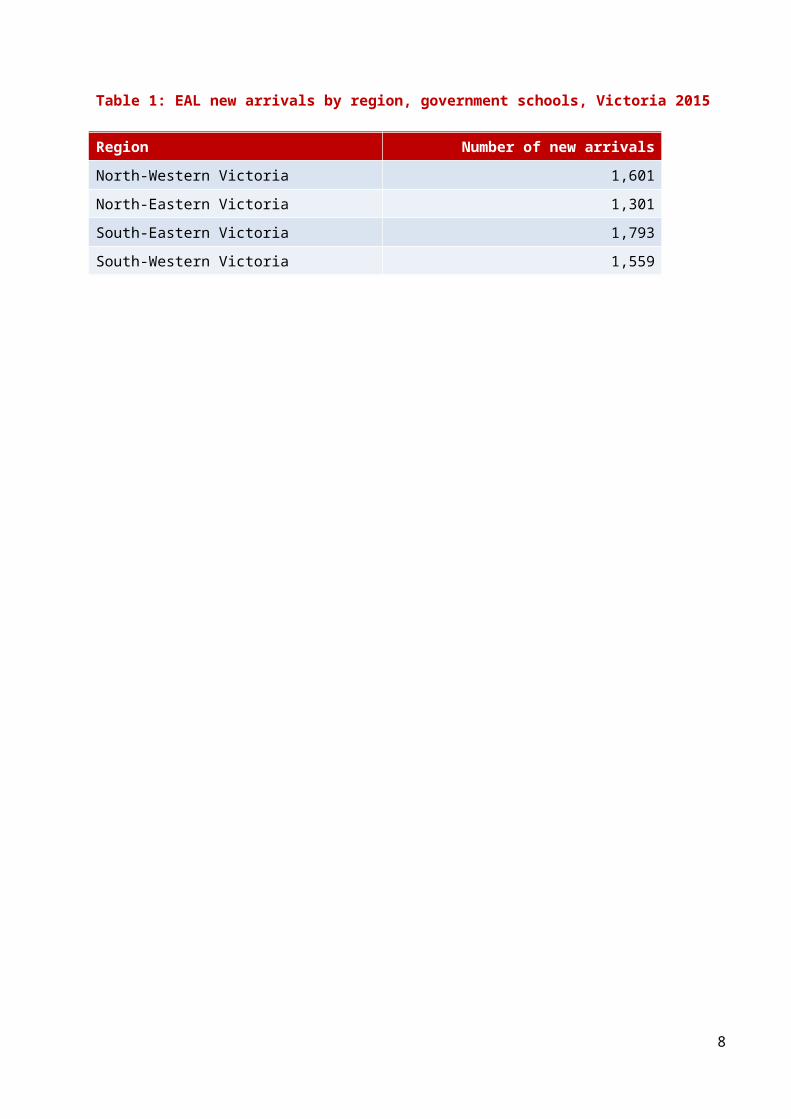
Summary dataIn the period from 1 January to 31 December 2015, Victorian government schools enrolled 6,105 newly arrived EAL learners. Table 1 below shows the regions in which they enrolled. The figures in the table below total to 6,254 because students moved from one region to another during 2015.
Table 1: EAL new arrivals by region, government schools, Victoria 2015
Region Number of new arrivals
North-Western Victoria 1,601
North-Eastern Victoria 1,301
South-Eastern Victoria 1,793
South-Western Victoria 1,559
5

Language backgroundsThe 6,105 newly arrived EAL students who enrolled in Victorian government schools in 2015 came from 128 language backgrounds.
More than half of these students came from one of nine language backgrounds: Mandarin, Chinese (not further defined), Arabic, Dari, Samoan, Hindi, Urdu, Hazaraghi and Vietnamese.
Figure 1 below shows the number of speakers, and the percentage of all new arrivals of the top ten languages spoken by newly arrived students in Victoria in 2015.
See Appendix 1 for details of all 128 languages, including distribution across the four regions.
Figure 1: Language backgrounds of newly arrived EAL students, government schools, Victoria 2015
Mandari
n
Chinese (N
FD)
Arabic
Dari
Samoan
HindiUrdu
Hazarag
hi
Vietnam
ese
Persian
(excl
uding Dari
)100
200
300
400
500
600
700
800
900
781 (12.79%)
445 (7.29%) 391
(6.4%) 328(5.37%) 309
(5.06) 257(4.21%) 230
(3.77%) 201(3.29%)
192 (3.14%) 175
(2.87%)
Top ten language backgrounds - newly arrived EAL students
Source: CASES21 2015
6
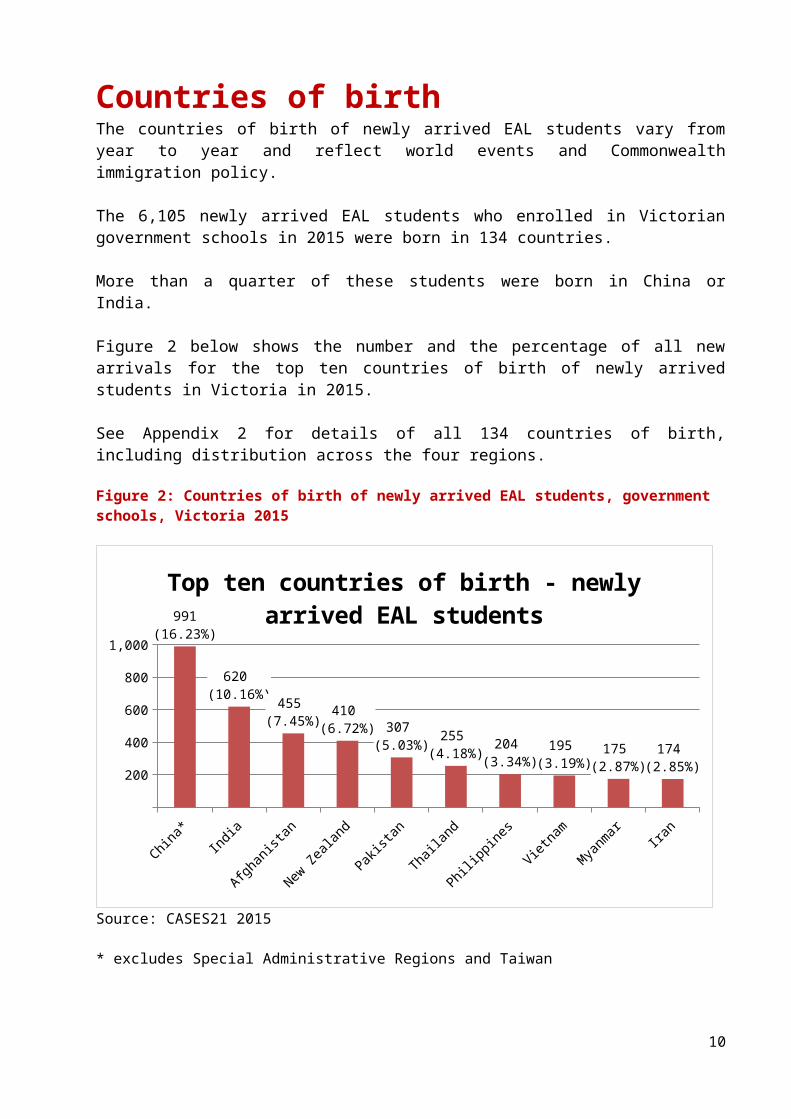
Countries of birthThe countries of birth of newly arrived EAL students vary from year to year and reflect world events and Commonwealth immigration policy.
The 6,105 newly arrived EAL students who enrolled in Victorian government schools in 2015 were born in 134 countries.
More than a quarter of these students were born in China or India.
Figure 2 below shows the number and the percentage of all new arrivals for the top ten countries of birth of newly arrived students in Victoria in 2015.
See Appendix 2 for details of all 134 countries of birth, including distribution across the four regions.
Figure 2: Countries of birth of newly arrived EAL students, government schools, Victoria 2015
China*India
Afghan
istan
New Ze
aland
Pakista
n
Thaila
nd
Philippines
Vietnam
Myanmar Ira
n
200
400
600
800
1,000
991(16.23%)
620 (10.16%)
455 (7.45%) 410
(6.72%) 307 (5.03%) 255
(4.18%) 204 (3.34%)
195 (3.19%)
175 (2.87%)
174 (2.85%)
Top ten countries of birth - newly arrived EAL students
Source: CASES21 2015
* excludes Special Administrative Regions and Taiwan
7
Student residency statusStudents eligible for EAL services in Victorian government schools include both permanent and temporary residents of Australia. Students may have arrived under the Australian Government’s Migration Program or Humanitarian Program, have been born in Australia or be seeking Australia’s protection.
In Victorian government schools, approximately 66 per cent of newly arrived students in 2015 were permanent residents. As residential status changes from temporary to permanent for some students, the percentage fluctuates within a year.
Figure 3 below shows the percentage and distribution of students by residency status across the four regions and includes a statewide average.
Figure 3: Residency status of newly arrived EAL students, government schools, Victoria 2015
North-Eastern Victoria
North-Western Victoria
South-Eastern Victoria
South-Western Victoria
Average Statewide
63% 68% 65% 70% 66%
37% 32% 35% 30% 34%
Permanent Temporary
Source: CASES21 2015
8

Learning EAL online In 2014, the Department entered into a partnership with the Victorian School of Languages (VSL) and the Western English Language School to pilot and evaluate a video-conferencing EAL new arrivals program for geographically isolated EAL learners who were not able to access a program through an English language school or centre, or regional program, or through the Isolated EAL Student Support Program.
Eleven students in the South Western Victoria Region participated in the 2014 ‘EAL online pilot’ program, which was taught by a qualified EAL teacher from Western English Language School and a distance education VSL EAL specialist teacher using technology.
In 2015, the pilot program was expanded to include students from all regions, and to gather further knowledge and data about student outcomes. Five students from 2014 continued and exited the program at the end of Term 1 2015. Thirteen new students participated in the 2015 program.
9
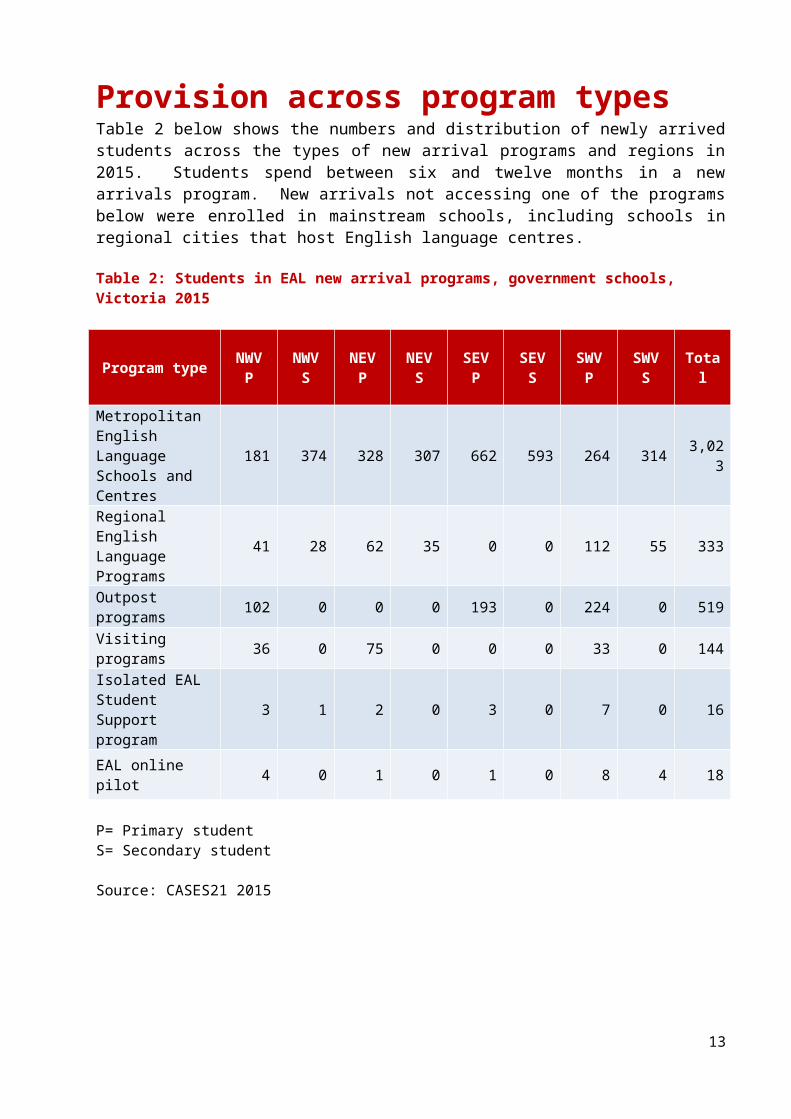
Provision across program typesTable 2 below shows the numbers and distribution of newly arrived students across the types of new arrival programs and regions in 2015. Students spend between six and twelve months in a new arrivals program. New arrivals not accessing one of the programs below were enrolled in mainstream schools, including schools in regional cities that host English language centres.
Table 2: Students in EAL new arrival programs, government schools, Victoria 2015
Program type NWVP
NWVS
NEVP
NEVS
SEVP
SEVS
SWVP
SWVS Total
Metropolitan English Language Schools and Centres
181 374 328 307 662 593 264 314 3,023
Regional English Language Programs 41 28 62 35 0 0 112 55 333
Outpost programs 102 0 0 0 193 0 224 0 519
Visiting programs 36 0 75 0 0 0 33 0 144
Isolated EAL Student Support program
3 1 2 0 3 0 7 0 16
EAL online pilot 4 0 1 0 1 0 8 4 18
P= Primary studentS= Secondary student
Source: CASES21 2015
10

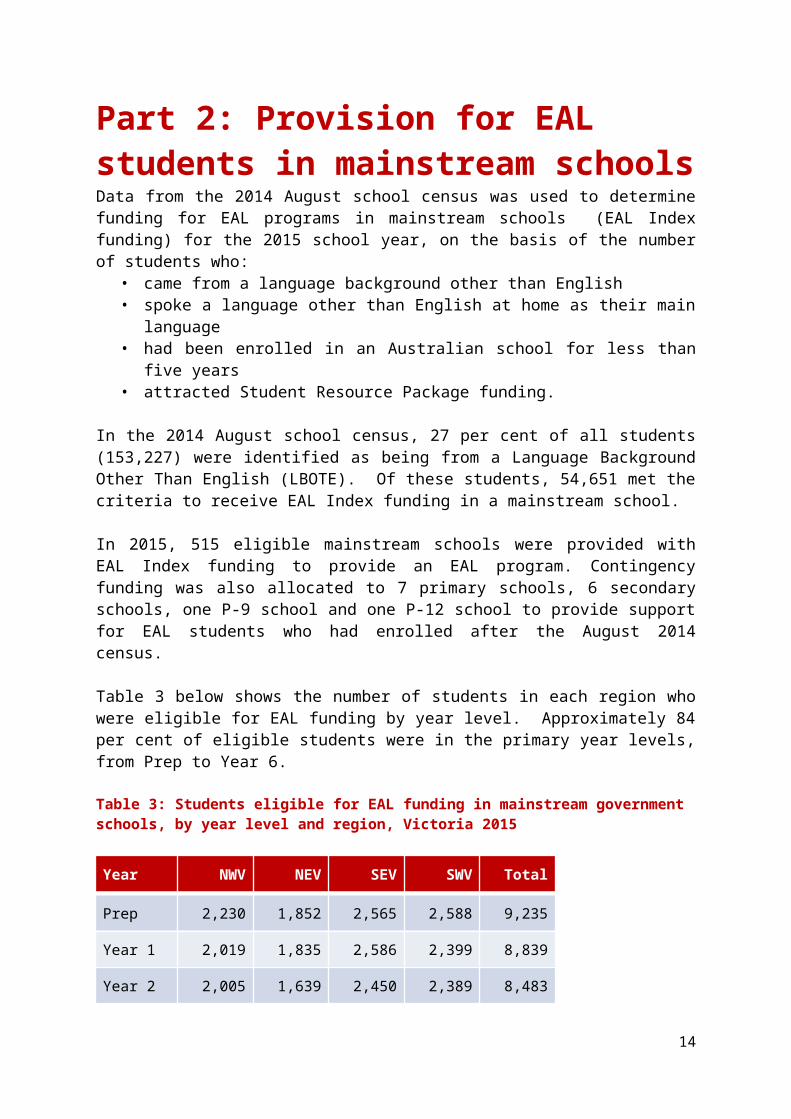
Part 2: Provision for EAL students in mainstream schoolsData from the 2014 August school census was used to determine funding for EAL programs in mainstream schools (EAL Index funding) for the 2015 school year, on the basis of the number of students who:• came from a language background other than English• spoke a language other than English at home as their main language• had been enrolled in an Australian school for less than five years• attracted Student Resource Package funding.
In the 2014 August school census, 27 per cent of all students (153,227) were identified as being from a Language Background Other Than English (LBOTE). Of these students, 54,651 met the criteria to receive EAL Index funding in a mainstream school.
In 2015, 515 eligible mainstream schools were provided with EAL Index funding to provide an EAL program. Contingency funding was also allocated to 7 primary schools, 6 secondary schools, one P-9 school and one P-12 school to provide support for EAL students who had enrolled after the August 2014 census.
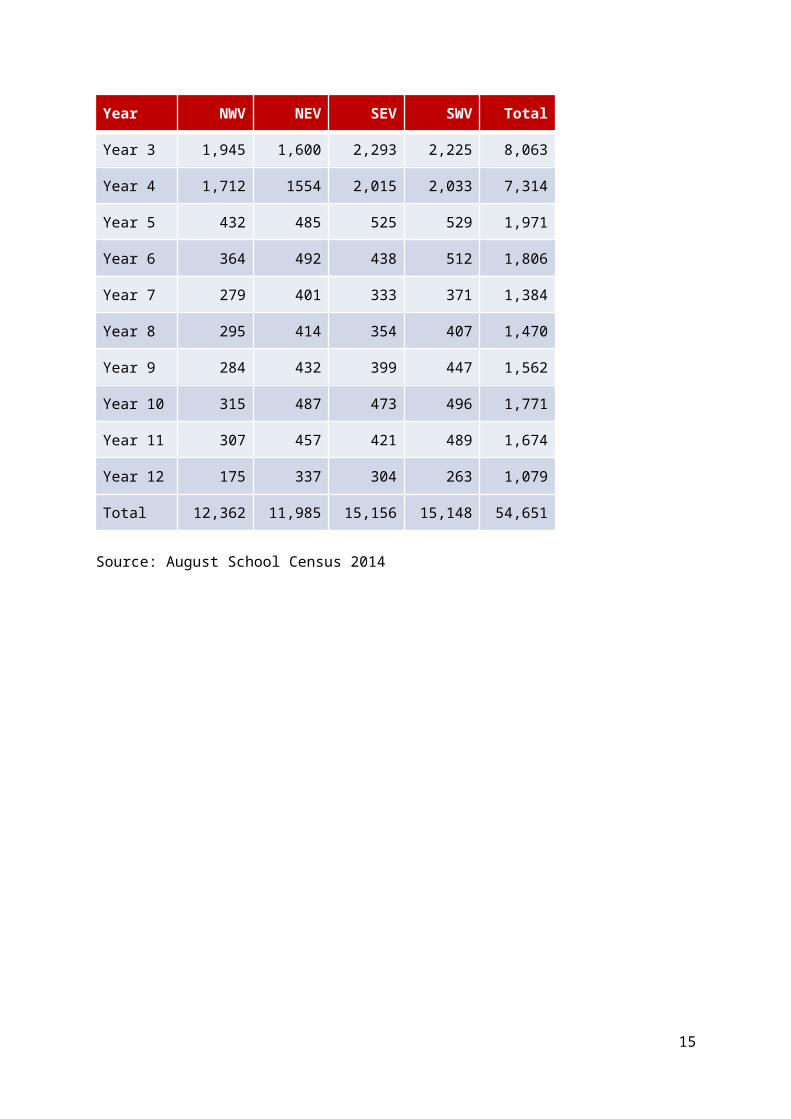
Table 3 below shows the number of students in each region who were eligible for EAL funding by year level. Approximately 84 per cent of eligible students were in the primary year levels, from Prep to Year 6.
Table 3: Students eligible for EAL funding in mainstream government schools, by year level and region, Victoria 2015
Year NWV NEV SEV SWV Total
Prep 2,230 1,852 2,565 2,588 9,235
Year 1 2,019 1,835 2,586 2,399 8,839
Year 2 2,005 1,639 2,450 2,389 8,483
Year 3 1,945 1,600 2,293 2,225 8,063
Year 4 1,712 1554 2,015 2,033 7,314
Year 5 432 485 525 529 1,971
Year 6 364 492 438 512 1,806
Year 7 279 401 333 371 1,384
Year 8 295 414 354 407 1,470
Year 9 284 432 399 447 1,562
11

Year NWV NEV SEV SWV Total
Year 10 315 487 473 496 1,771
Year 11 307 457 421 489 1,674
Year 12 175 337 304 263 1,079
Total 12,362 11,985 15,156 15,148 54,651
Source: August School Census 2014
12
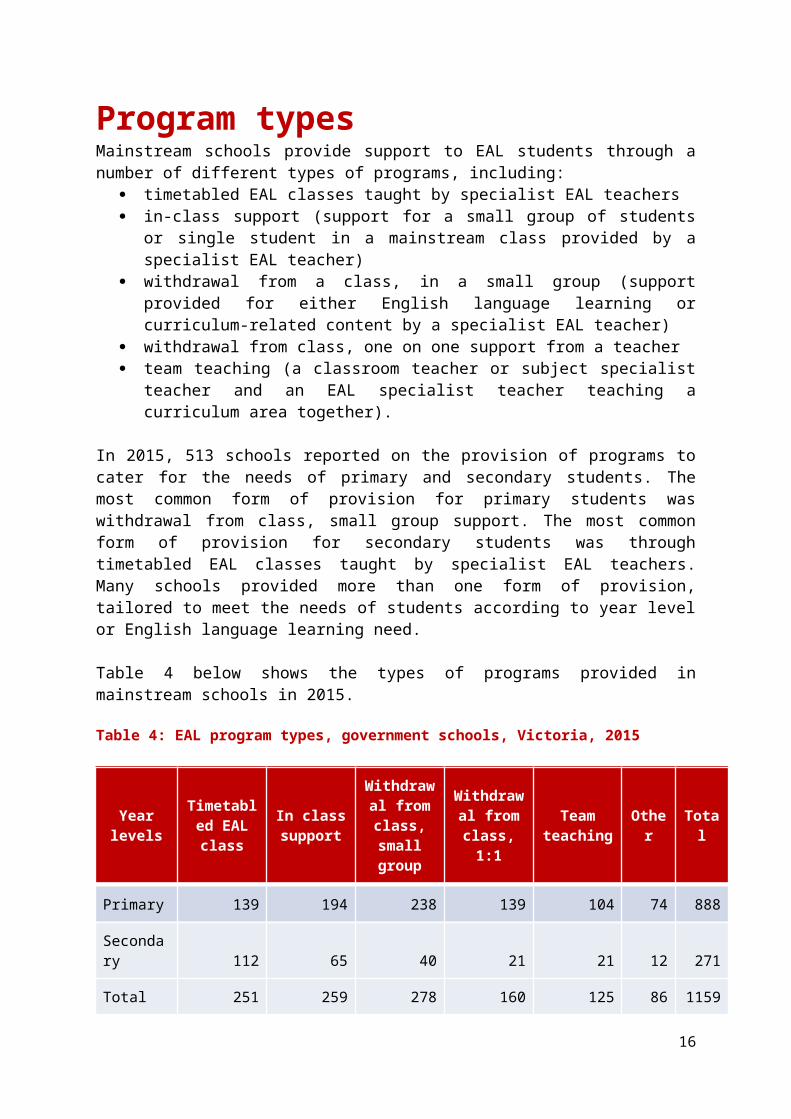
Program typesMainstream schools provide support to EAL students through a number of different types of programs, including:
timetabled EAL classes taught by specialist EAL teachers in-class support (support for a small group of students or single student in a
mainstream class provided by a specialist EAL teacher) withdrawal from a class, in a small group (support provided for either English
language learning or curriculum-related content by a specialist EAL teacher) withdrawal from class, one on one support from a teacher team teaching (a classroom teacher or subject specialist teacher and an EAL
specialist teacher teaching a curriculum area together).
In 2015, 513 schools reported on the provision of programs to cater for the needs of primary and secondary students. The most common form of provision for primary students was withdrawal from class, small group support. The most common form of provision for secondary students was through timetabled EAL classes taught by specialist EAL teachers. Many schools provided more than one form of provision, tailored to meet the needs of students according to year level or English language learning need.
Table 4 below shows the types of programs provided in mainstream schools in 2015.
Table 4: EAL program types, government schools, Victoria, 2015
Year levels Timetabled EAL class
In class support
Withdrawal from class, small group
Withdrawal from class,
1:1
Team teaching Other Total
Primary 139 194 238 139 104 74 888
Secondary 112 65 40 21 21 12 271
Total 251 259 278 160 125 86 1159
Source: Mid-Year School Supplementary Census 2015
13
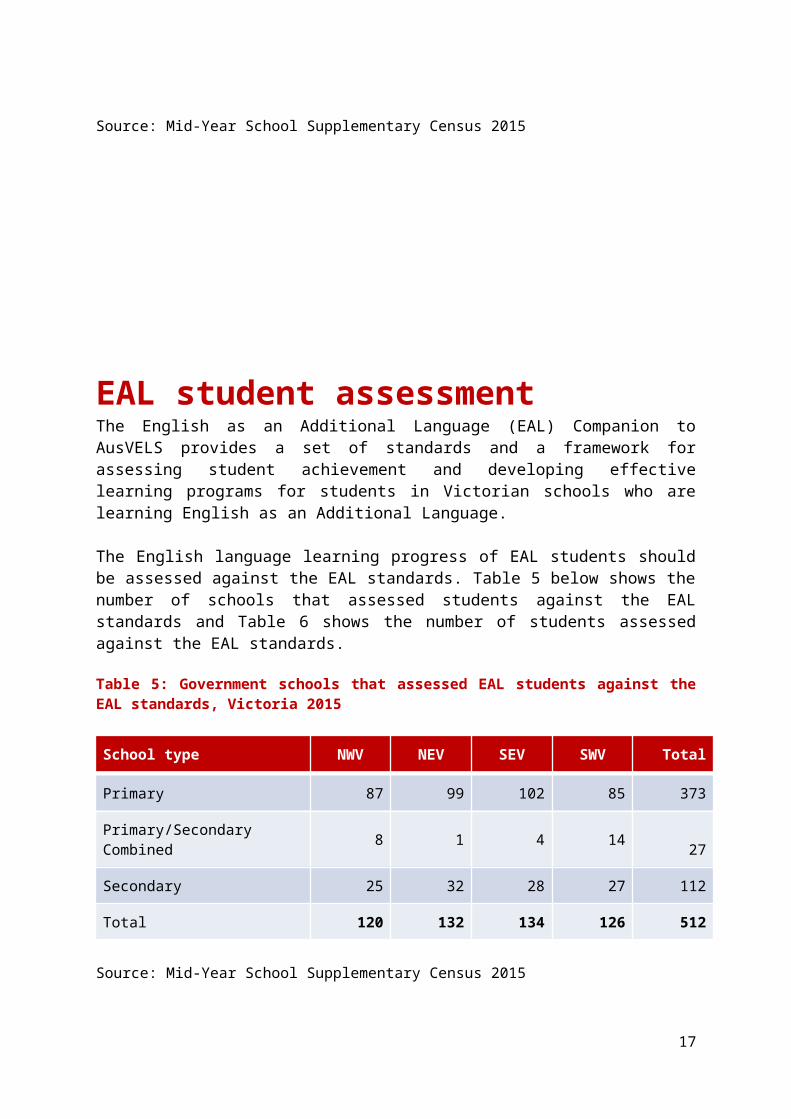
EAL student assessmentThe English as an Additional Language (EAL) Companion to AusVELS provides a set of standards and a framework for assessing student achievement and developing effective learning programs for students in Victorian schools who are learning English as an Additional Language.
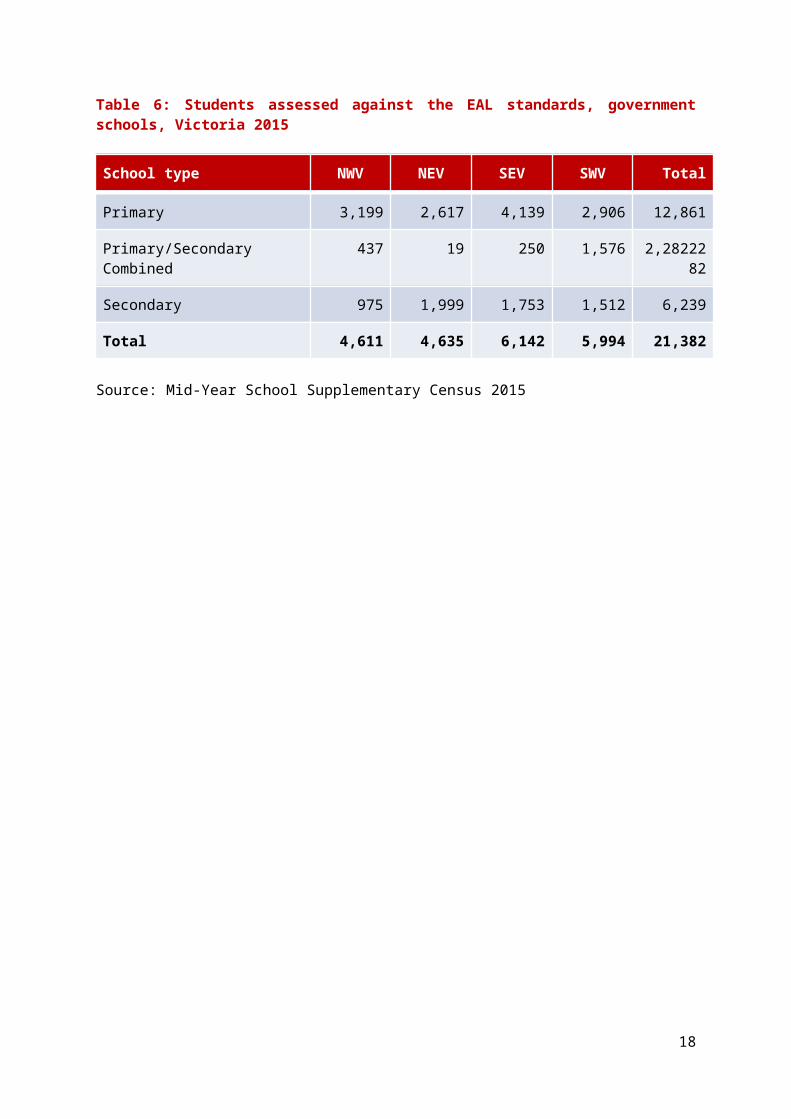
The English language learning progress of EAL students should be assessed against the EAL standards. Table 5 below shows the number of schools that assessed students against the EAL standards and Table 6 shows the number of students assessed against the EAL standards.
Table 5: Government schools that assessed EAL students against the EAL standards, Victoria 2015
School type NWV NEV SEV SWV Total
Primary 87 99 102 85 373
Primary/Secondary Combined 8 1 4 14 27
Secondary 25 32 28 27 112
Total 120 132 134 126 512
Source: Mid-Year School Supplementary Census 2015
Table 6: Students assessed against the EAL standards, government schools, Victoria 2015
School type NWV NEV SEV SWV Total
Primary 3,199 2,617 4,139 2,906 12,861
Primary/Secondary Combined 437 19 250 1,576 2,2822282
Secondary 975 1,999 1,753 1,512 6,239
Total 4,611 4,635 6,142 5,994 21,382
Source: Mid-Year School Supplementary Census 2015
14
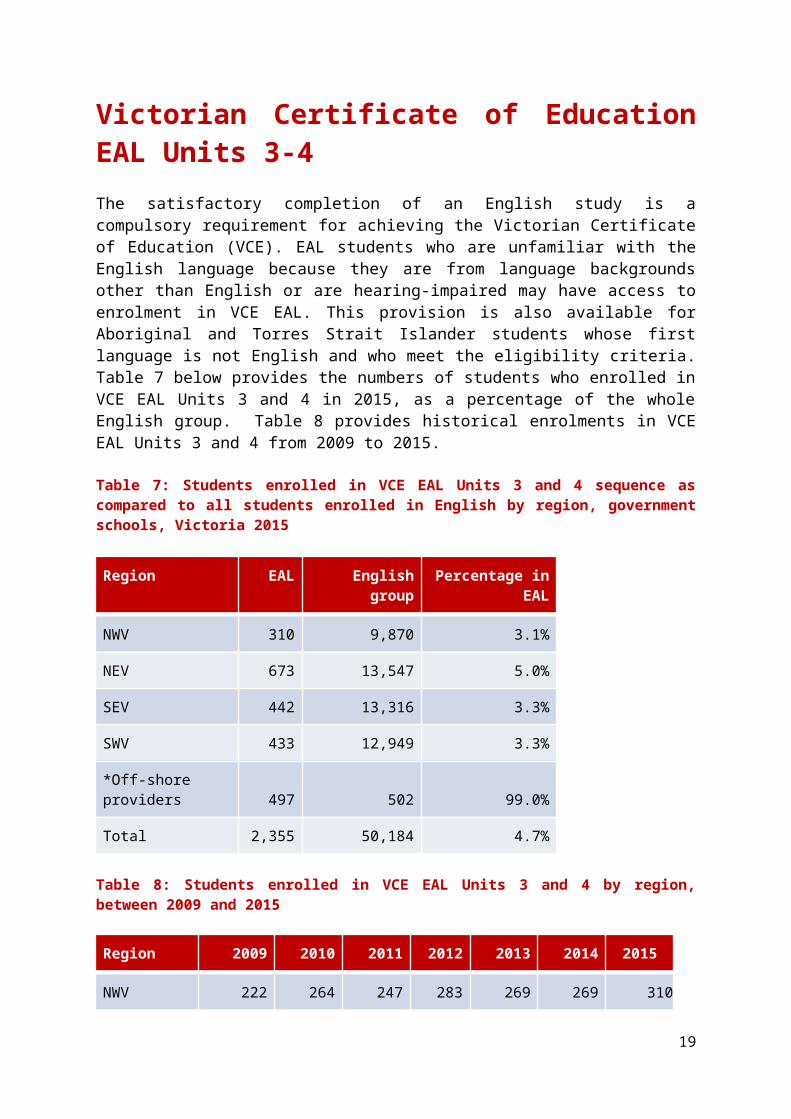
Victorian Certificate of Education EAL Units 3-4 The satisfactory completion of an English study is a compulsory requirement for achieving the Victorian Certificate of Education (VCE). EAL students who are unfamiliar with the English language because they are from language backgrounds other than English or are hearing-impaired may have access to enrolment in VCE EAL. This provision is also available for Aboriginal and Torres Strait Islander students whose first language is not English and who meet the eligibility criteria. Table 7 below provides the numbers of students who enrolled in VCE EAL Units 3 and 4 in 2015, as a percentage of the whole English group. Table 8 provides historical enrolments in VCE EAL Units 3 and 4 from 2009 to 2015.
Table 7: Students enrolled in VCE EAL Units 3 and 4 sequence as compared to all students enrolled in English by region, government schools, Victoria 2015
Region EAL English group Percentage in EAL
NWV 310 9,870 3.1%
NEV 673 13,547 5.0%
SEV 442 13,316 3.3%
SWV 433 12,949 3.3%
*Off-shore providers 497 502 99.0%
Total 2,355 50,184 4.7%
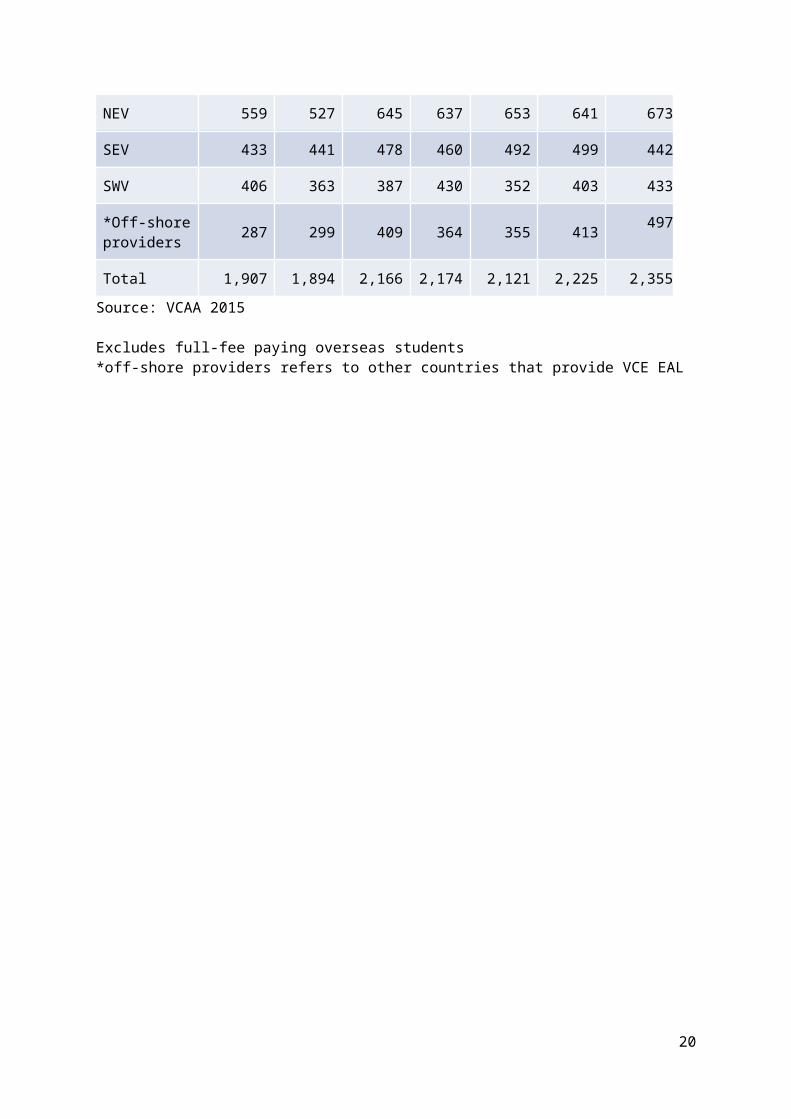
Table 8: Students enrolled in VCE EAL Units 3 and 4 by region, between 2009 and 2015
Region 2009 2010 2011 2012 2013 2014 2015
NWV 222 264 247 283 269 269 310
NEV 559 527 645 637 653 641 673
SEV 433 441 478 460 492 499 442
SWV 406 363 387 430 352 403 433
*Off-shore providers 287 299 409 364 355 413 497
Total 1,907 1,894 2,166 2,174 2,121 2,225 2,355
Source: VCAA 2015
Excludes full-fee paying overseas students*off-shore providers refers to other countries that provide VCE EAL
15
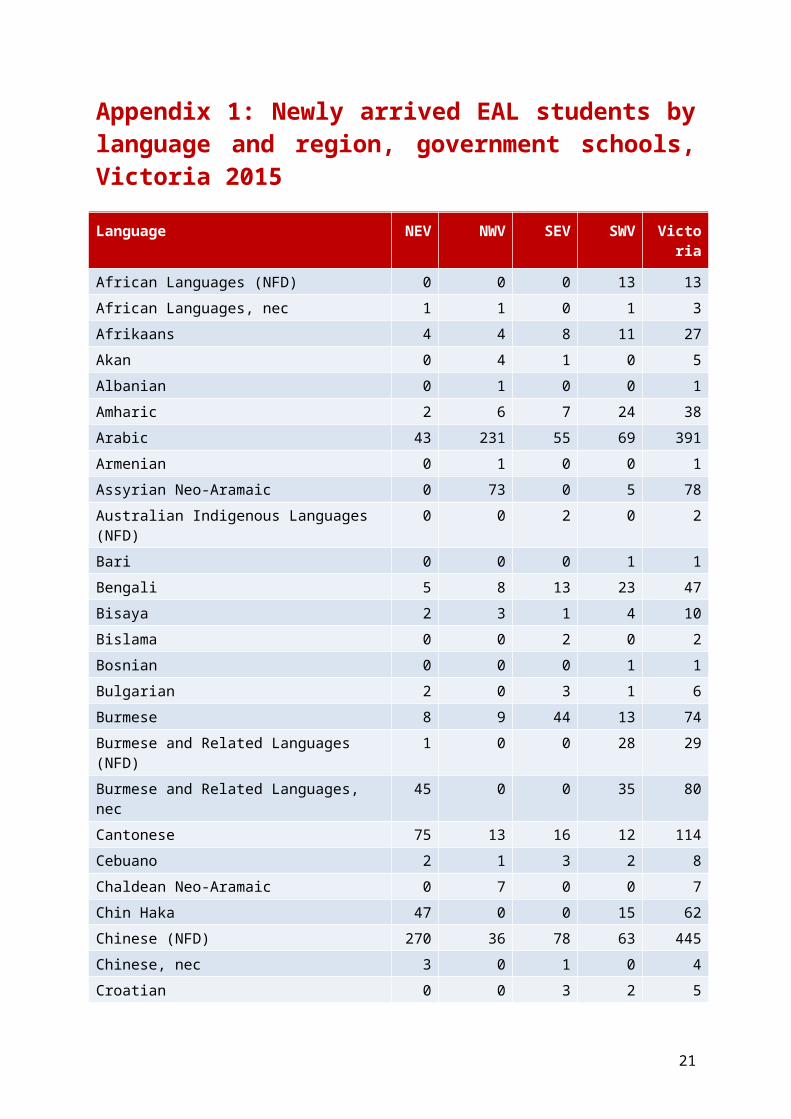
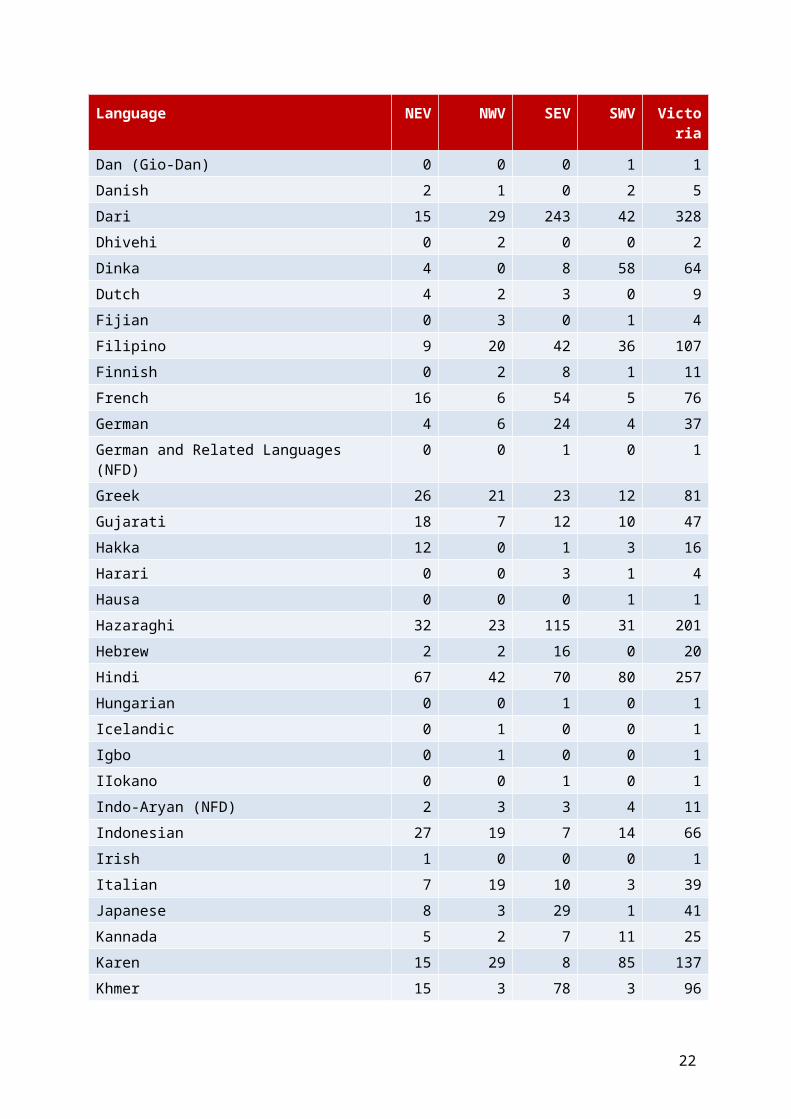
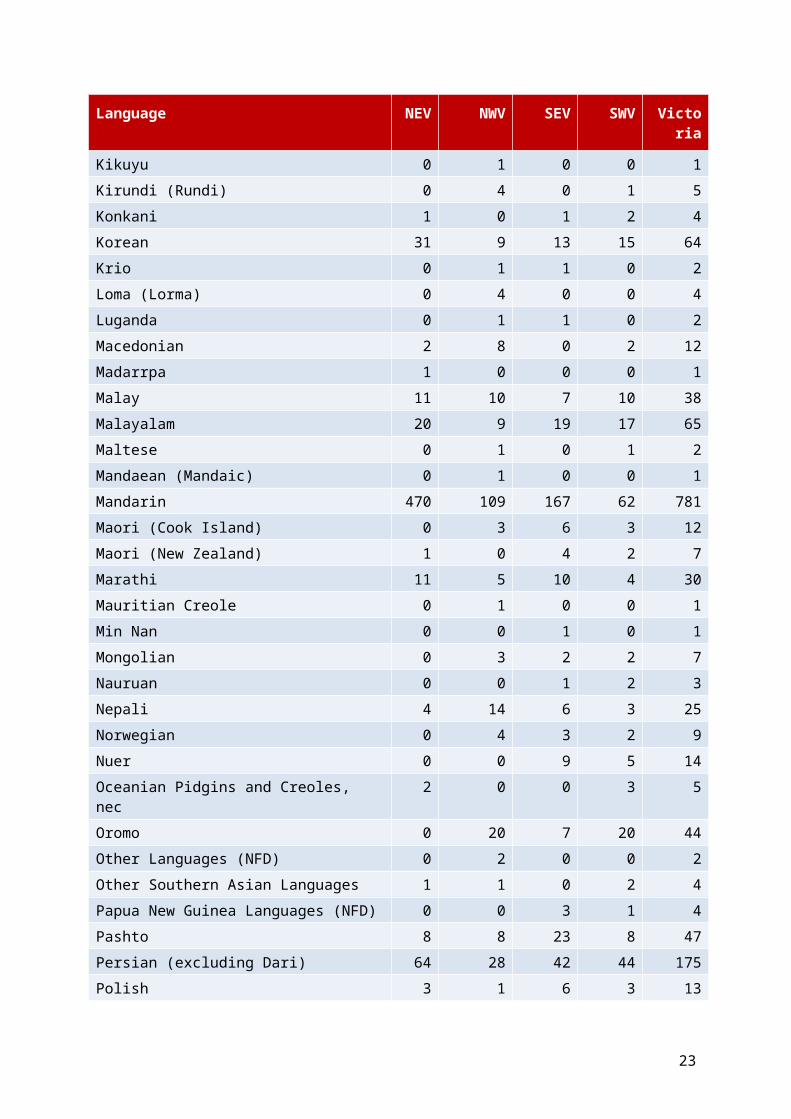
Appendix 1: Newly arrived EAL students by language and region, government schools, Victoria 2015
Language NEV NWV SEV SWV Victoria
African Languages (NFD) 0 0 0 13 13
African Languages, nec 1 1 0 1 3
Afrikaans 4 4 8 11 27
Akan 0 4 1 0 5
Albanian 0 1 0 0 1
Amharic 2 6 7 24 38
Arabic 43 231 55 69 391
Armenian 0 1 0 0 1
Assyrian Neo-Aramaic 0 73 0 5 78
Australian Indigenous Languages (NFD) 0 0 2 0 2
Bari 0 0 0 1 1
Bengali 5 8 13 23 47
Bisaya 2 3 1 4 10
Bislama 0 0 2 0 2
Bosnian 0 0 0 1 1
Bulgarian 2 0 3 1 6
Burmese 8 9 44 13 74
Burmese and Related Languages (NFD) 1 0 0 28 29
Burmese and Related Languages, nec 45 0 0 35 80
Cantonese 75 13 16 12 114
Cebuano 2 1 3 2 8
Chaldean Neo-Aramaic 0 7 0 0 7
Chin Haka 47 0 0 15 62
Chinese (NFD) 270 36 78 63 445
Chinese, nec 3 0 1 0 4
Croatian 0 0 3 2 5
Dan (Gio-Dan) 0 0 0 1 1
Danish 2 1 0 2 5
Dari 15 29 243 42 328
Dhivehi 0 2 0 0 2
Dinka 4 0 8 58 64
Dutch 4 2 3 0 9
Fijian 0 3 0 1 4
Filipino 9 20 42 36 107
16
Language NEV NWV SEV SWV Victoria
Finnish 0 2 8 1 11
French 16 6 54 5 76
German 4 6 24 4 37
German and Related Languages (NFD) 0 0 1 0 1
Greek 26 21 23 12 81
Gujarati 18 7 12 10 47
Hakka 12 0 1 3 16
Harari 0 0 3 1 4
Hausa 0 0 0 1 1
Hazaraghi 32 23 115 31 201
Hebrew 2 2 16 0 20
Hindi 67 42 70 80 257
Hungarian 0 0 1 0 1
Icelandic 0 1 0 0 1
Igbo 0 1 0 0 1
IIokano 0 0 1 0 1
Indo-Aryan (NFD) 2 3 3 4 11
Indonesian 27 19 7 14 66
Irish 1 0 0 0 1
Italian 7 19 10 3 39
Japanese 8 3 29 1 41
Kannada 5 2 7 11 25
Karen 15 29 8 85 137
Khmer 15 3 78 3 96
Kikuyu 0 1 0 0 1
Kirundi (Rundi) 0 4 0 1 5
Konkani 1 0 1 2 4
Korean 31 9 13 15 64
Krio 0 1 1 0 2
Loma (Lorma) 0 4 0 0 4
Luganda 0 1 1 0 2
Macedonian 2 8 0 2 12
Madarrpa 1 0 0 0 1
Malay 11 10 7 10 38
Malayalam 20 9 19 17 65
Maltese 0 1 0 1 2
Mandaean (Mandaic) 0 1 0 0 1
17
Language NEV NWV SEV SWV Victoria
Mandarin 470 109 167 62 781
Maori (Cook Island) 0 3 6 3 12
Maori (New Zealand) 1 0 4 2 7
Marathi 11 5 10 4 30
Mauritian Creole 0 1 0 0 1
Min Nan 0 0 1 0 1
Mongolian 0 3 2 2 7
Nauruan 0 0 1 2 3
Nepali 4 14 6 3 25
Norwegian 0 4 3 2 9
Nuer 0 0 9 5 14
Oceanian Pidgins and Creoles, nec 2 0 0 3 5
Oromo 0 20 7 20 44
Other Languages (NFD) 0 2 0 0 2
Other Southern Asian Languages 1 1 0 2 4
Papua New Guinea Languages (NFD) 0 0 3 1 4
Pashto 8 8 23 8 47
Persian (excluding Dari) 64 28 42 44 175
Polish 3 1 6 3 13
Portuguese 1 5 7 4 17
Punjabi 22 32 25 51 127
Rohingya 0 0 1 1 1
Romanian 1 1 7 2 11
Russian 11 4 31 8 53
Samoan 20 63 90 139 309
Serbian 0 1 6 4 11
Shona 2 6 1 3 12
Sindhi 0 2 0 1 3
Sinhalese 40 18 63 16 135
Slovak 0 0 2 0 2
Slovene 0 3 0 0 3
Solomon Islands Pijin 0 0 0 3 3
Somali 0 26 5 39 70
Southeast Asian Austronesian Languages (NFD) 1 3 1 0 5
Southern Asian Languages (NFD) 1 2 2 0 5
Southwest And Central Asian Languages (NFD) 0 2 0 0 2
Spanish 9 10 14 12 44
18
Language NEV NWV SEV SWV Victoria
Swahili 15 3 2 14 34
Swedish 3 8 8 3 20
Tagalog 16 10 33 40 99
Tamil 23 28 32 27 110
Telugu 6 11 24 36 76
Tetum 0 6 0 1 7
Thai 10 23 24 19 74
Tibetan 0 0 2 0 2
Tigrinya 0 3 3 26 31
Tok Pisin 0 2 2 1 5
Tongan 1 8 9 35 53
Tulu 0 0 2 0 2
Turkish 1 10 6 0 17
Ukrainian 2 1 0 0 3
Unknown Language 4 5 0 3 12
Urdu 41 97 47 52 230
Uygur 0 0 0 1 1
Vietnamese 26 36 47 90 192
Wu 0 3 0 0 3
Yoruba 1 0 1 3 5
Source: CASES21 2015
19
Appendix 2: Newly arrived EAL students by country of birth and region, government schools, Victoria 2015
Country of birth NEV NWV SEV SWV Victoria
Afghanistan 30 48 311 67 455
Albania 0 1 0 1 1
Algeria 0 1 0 0 1
Argentina 3 0 4 6 13
Austria 0 1 1 0 2
Bahrain 3 0 0 2 5
Bangladesh 4 6 8 17 34
Belgium 1 1 4 0 6
Bhutan 1 1 0 2 4
Bosnia and Herzegovina 0 0 0 1 1
Brazil 1 4 2 2 9
Bulgaria 2 0 3 1 6
Burundi 0 2 0 3 5
Cambodia 15 3 70 1 86
Cameroon 0 1 0 0 1
Canada 0 1 5 1 7
Chad 0 0 0 3 3
Chile 2 1 2 0 4
China (excludes SARs and Taiwan) 586 135 219 108 991
Chinese Asia (includes Mongolia) (NFD) 2 0 1 1 4
Colombia 1 0 2 2 5
Congo, Democratic Republic of 13 3 0 1 17
Congo, Republic of 1 0 0 0 1
Cook Islands 0 3 3 2 8
Cote d'Ivoire 0 0 0 1 1
Croatia 0 0 4 2 6
Curacao 1 0 0 0 1
Czech Republic 0 0 1 0 1
Denmark 2 1 0 6 9
Djibouti 0 0 1 0 1
Ecuador 0 1 0 0 1
Egypt 8 12 9 8 37
El Salvador 0 0 1 1 2
20
Country of birth NEV NWV SEV SWV Victoria
England 2 2 2 7 13
Eritrea 0 8 2 8 17
Ethiopia 2 26 14 59 97
Fiji 1 9 3 3 16
Finland 1 2 8 1 12
Former Yugoslav Republic of Macedonia (FYROM) 2 9 0 2 13
France 6 4 43 0 52
Gaza Strip and West Bank 0 0 1 0 1
Georgia 2 0 0 0 2
Germany 5 4 19 1 28
Ghana 0 4 1 0 5
Greece 24 21 23 12 79
Guatemala 0 2 0 0 2
Guinea 0 2 0 0 2
Hong Kong (SAR of China) 74 6 7 7 92
Hungary 0 0 1 0 1
Iceland 0 1 0 0 1
India 145 100 177 206 620
Indonesia 27 22 8 14 68
Iran 64 31 46 36 174
Iraq 14 111 10 28 161
Ireland 4 5 2 5 16
Israel 2 1 23 1 27
Italy 8 19 12 2 41
Japan 11 4 19 2 36
Jordan 0 4 2 2 8
Kenya 5 4 3 34 45
Korea, Democratic People's Republic of (North) 0 2 1 0 3
Korea, Republic of (South) 27 8 11 14 56
Kuwait 1 5 3 2 11
Latvia 0 0 0 1 1
Lebanon 3 22 7 10 42
Liberia 0 2 0 0 2
Libya 0 5 0 0 5
Macau (SAR of China) 1 0 1 0 2
Malaysia 63 22 23 21 127
21
Country of birth NEV NWV SEV SWV Victoria
Maldives 0 2 3 0 5
Malta 0 2 0 1 3
Mauritius 3 4 2 3 11
Mexico 0 3 0 1 4
Middle East (NFD) 0 1 0 0 1
Moldova 0 0 1 0 1
Mongolia 0 3 2 2 7
Montenegro 0 0 1 0 1
Myanmar, The Republic of the Union of 94 9 10 65 175
Nauru 0 0 1 2 3
Nepal 4 14 6 3 25
Netherlands 3 3 1 0 7
New Caledonia 0 0 1 0 1
New Zealand 30 108 104 171 410
Nigeria 1 1 1 6 9
Norway 0 4 3 1 8
Oman 1 5 0 2 8
Pakistan 52 91 114 59 307
Palau 0 1 0 0 1
Papua New Guinea 5 5 5 2 15
Peru 0 0 0 1 1
Philippines 29 33 66 76 204
Poland 3 1 6 2 12
Portugal 0 1 3 1 5
Qatar 3 1 1 1 6
Romania 1 0 5 2 8
Russian Federation 9 4 18 5 35
Samoa 13 20 40 46 118
Saudi Arabia 7 27 9 14 54
Serbia 0 1 3 4 8
Sierra Leone 0 0 1 0 1
Singapore 14 6 5 5 30
Slovakia 0 0 2 0 2
Slovenia 0 2 0 0 2
Solomon Islands 0 0 0 3 3
Somalia 0 20 5 17 42
22
Country of birth NEV NWV SEV SWV Victoria
South Africa 4 8 8 13 33
South Sudan 2 0 10 29 41
Southern Asia (NFD) 2 0 2 1 5
Spain 3 1 6 2 12
Sri Lanka 41 21 72 17 149
Sudan 1 7 13 22 42
Swaziland 0 0 0 1 1
Sweden 5 9 9 3 24
Switzerland 3 1 9 4 14
Syria 3 68 3 8 82
Taiwan 18 0 1 1 20
Tanzania 0 3 0 1 4
Thailand 26 48 57 126 255
Timor-Leste 0 5 0 1 6
Tonga 0 1 3 5 9
Turkey 0 8 6 0 14
Uganda 1 1 0 7 9
Ukraine 2 1 6 0 8
United Arab Emirates 13 10 9 9 41
United Kingdom, Channel Islands and Isle of Man (N 11 3 6 11 31
United States of America 6 7 7 10 30
Unknown Country 0 1 0 0 1
Uruguay 0 1 0 0 1
Vanuatu 0 0 2 2 4
Venezuela, Bolivarian Republic of 1 0 0 0 1
Vietnam 26 37 48 91 195
Yemen 1 1 0 0 2
Zambia 0 0 0 4 4
Zimbabwe 0 2 1 2 5
Source: CASES21 2015
23