Embed Size (px)
Citation preview
2016 ANNUAL RESULTS
March 2nd, 2017
Digital bus shelter on 5th Avenue in New York, United States
BUSINESS OVERVIEW
Jean-Charles Decaux
Chairman of the Executive Board and Co-CEO
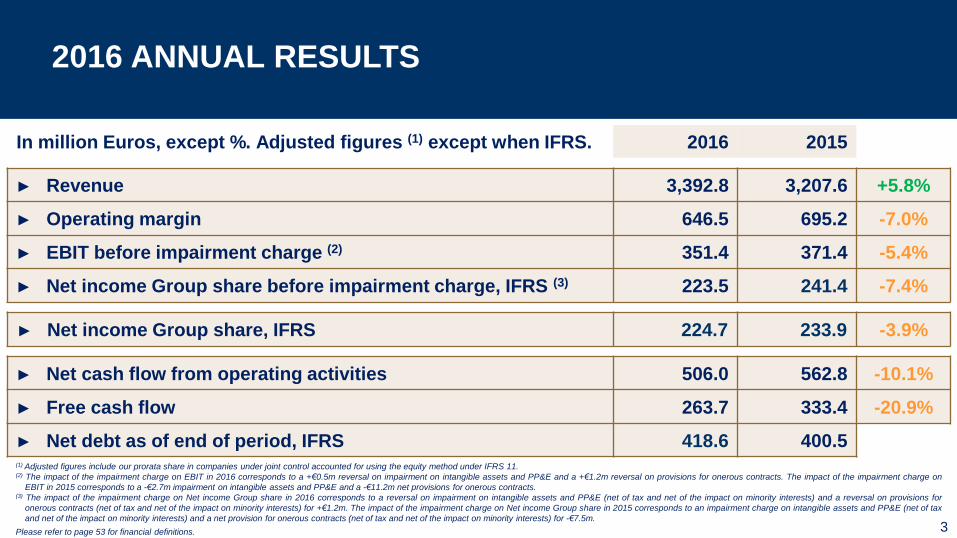
In million Euros, except %. Adjusted figures (1) except when IFRS. 2016 2015
► Revenue 3,392.8 3,207.6 +5.8%
► Operating margin 646.5 695.2 -7.0%
► EBIT before impairment charge (2) 351.4 371.4 -5.4%
► Net income Group share before impairment charge, IFRS (3) 223.5 241.4 -7.4%
► Net income Group share, IFRS 224.7 233.9 -3.9%
► Net cash flow from operating activities 506.0 562.8 -10.1%
► Free cash flow 263.7 333.4 -20.9%
► Net debt as of end of period, IFRS 418.6 400.5
2016 ANNUAL RESULTS
(1) Adjusted figures include our prorata share in companies under joint control accounted for using the equity method under IFRS 11.(2) The impact of the impairment charge on EBIT in 2016 corresponds to a +€0.5m reversal on impairment on intangible assets and PP&E and a +€1.2m reversal on provisions for onerous contracts. The impact of the impairment charge on
EBIT in 2015 corresponds to a -€2.7m impairment on intangible assets and PP&E and a -€11.2m net provisions for onerous contracts.(3) The impact of the impairment charge on Net income Group share in 2016 corresponds to a reversal on impairment on intangible assets and PP&E (net of tax and net of the impact on minority interests) and a reversal on provisions for
onerous contracts (net of tax and net of the impact on minority interests) for +€1.2m. The impact of the impairment charge on Net income Group share in 2015 corresponds to an impairment charge on intangible assets and PP&E (net of tax
and net of the impact on minority interests) and a net provision for onerous contracts (net of tax and net of the impact on minority interests) for -€7.5m.
Please refer to page 53 for financial definitions. 3
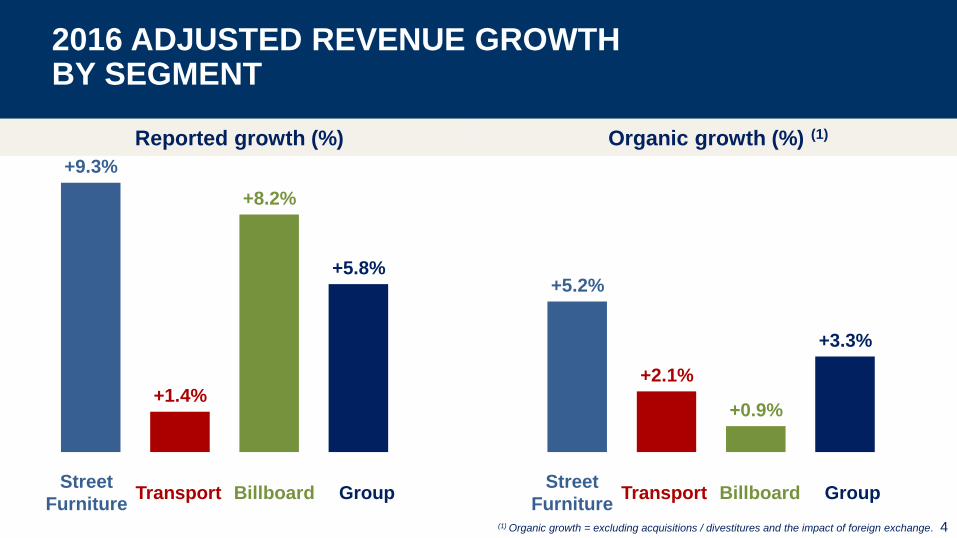
+5.2%
+2.1%
+0.9%
+3.3%
+9.3%
+1.4%
+8.2%
+5.8%
2016 ADJUSTED REVENUE GROWTH BY SEGMENT
(1) Organic growth = excluding acquisitions / divestitures and the impact of foreign exchange.
Street
FurnitureTransport Billboard Group
Street
FurnitureTransport Billboard Group
Organic growth (%) (1)Reported growth (%)
4
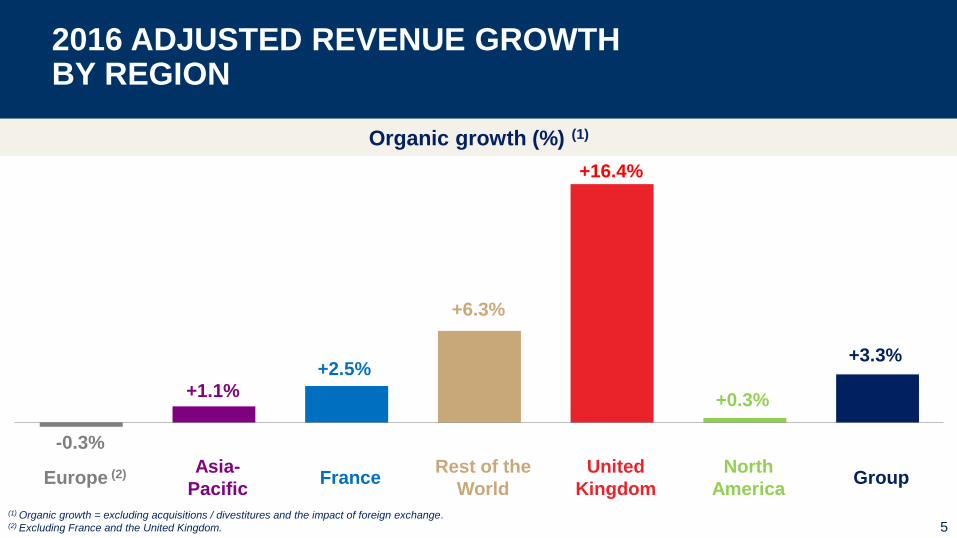
-0.3%
+1.1%
+2.5%
+6.3%
+16.4%
+0.3%
+3.3%
2016 ADJUSTED REVENUE GROWTH BY REGION
(1) Organic growth = excluding acquisitions / divestitures and the impact of foreign exchange.(2) Excluding France and the United Kingdom.
FranceUnited
Kingdom
Rest of the
World
North
AmericaGroup
Organic growth (%) (1)
5
Europe (2) Asia-
Pacific
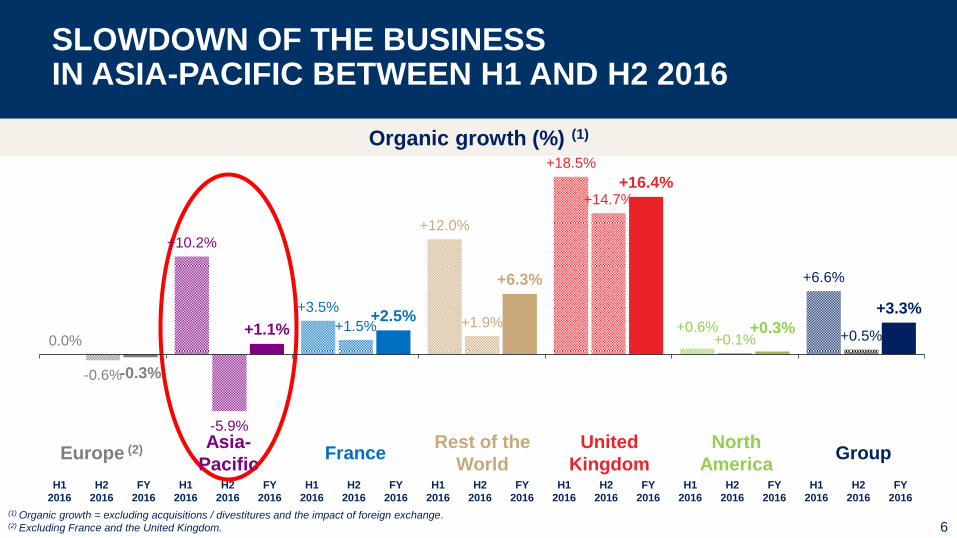
0.0%
+10.2%
+3.5%
+12.0%
+18.5%
+0.6%
+6.6%
-0.6%
-5.9%
+1.5% +1.9%
+14.7%
+0.1% +0.5%
-0.3%
+1.1%+2.5%
+6.3%
+16.4%
+0.3%
+3.3%
SLOWDOWN OF THE BUSINESSIN ASIA-PACIFIC BETWEEN H1 AND H2 2016
6
Organic growth (%) (1)
H1
2016
H2
2016
FY
2016
H1
2016
H2
2016
FY
2016
H1
2016
H2
2016
FY
2016
H1
2016
H2
2016
FY
2016
H1
2016
H2
2016
FY
2016
H1
2016
H2
2016
FY
2016
H1
2016
H2
2016
FY
2016
FranceUnited
Kingdom
Rest of the
World
North
AmericaEurope (2) Asia-
PacificGroup
(1) Organic growth = excluding acquisitions / divestitures and the impact of foreign exchange.(2) Excluding France and the United Kingdom.
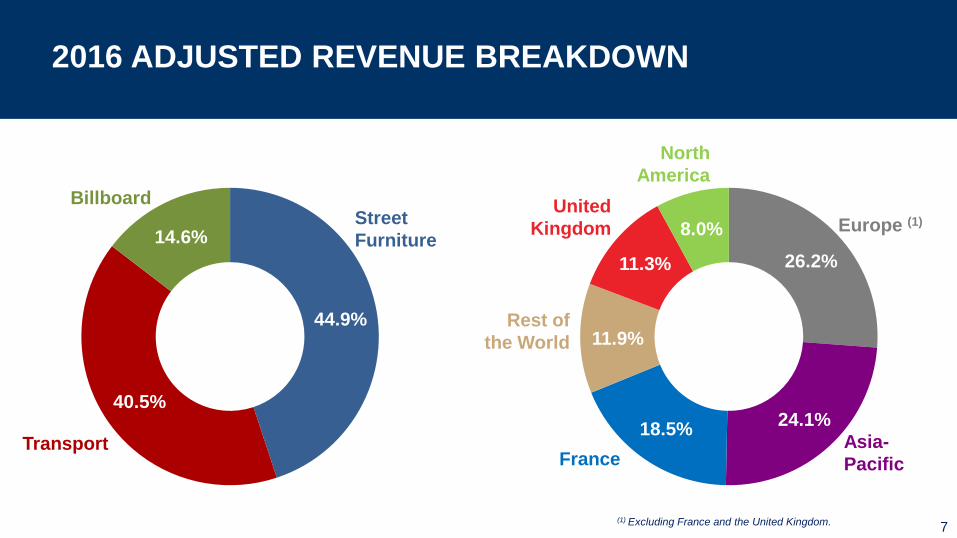
26.2%
24.1%18.5%
11.9%
11.3%
8.0%
44.9%
40.5%
14.6%
2016 ADJUSTED REVENUE BREAKDOWN
Billboard
Transport
United
Kingdom
Rest of
the World
North
America
France
Street
Furniture
(1) Excluding France and the United Kingdom. 7
Europe (1)
Asia-
Pacific
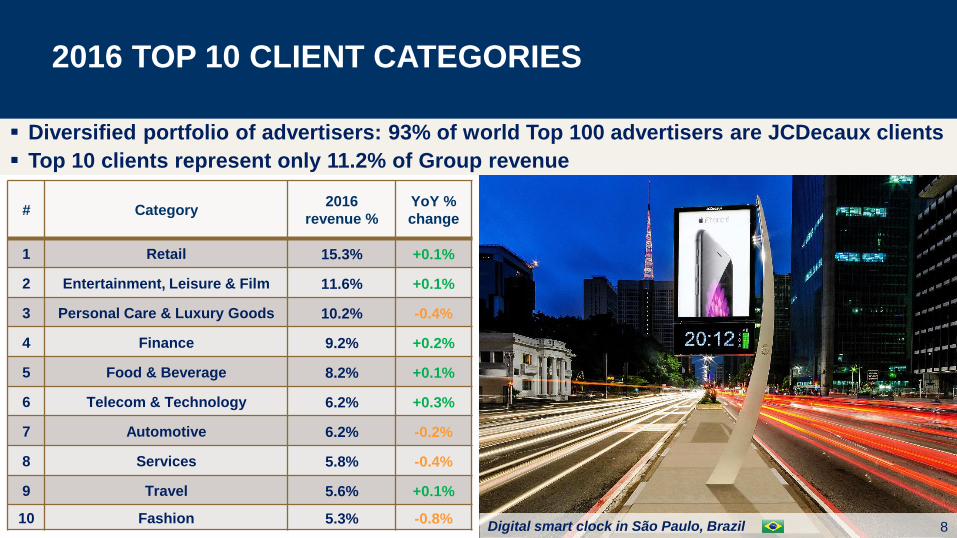
2016 TOP 10 CLIENT CATEGORIES
Diversified portfolio of advertisers: 93% of world Top 100 advertisers are JCDecaux clients
Top 10 clients represent only 11.2% of Group revenue
Digital smart clock in São Paulo, Brazil 8
# Category2016
revenue %
YoY %
change
1 Retail 15.3% +0.1%
2 Entertainment, Leisure & Film 11.6% +0.1%
3 Personal Care & Luxury Goods 10.2% -0.4%
4 Finance 9.2% +0.2%
5 Food & Beverage 8.2% +0.1%
6 Telecom & Technology 6.2% +0.3%
7 Automotive 6.2% -0.2%
8 Services 5.8% -0.4%
9 Travel 5.6% +0.1%
10 Fashion 5.3% -0.8%
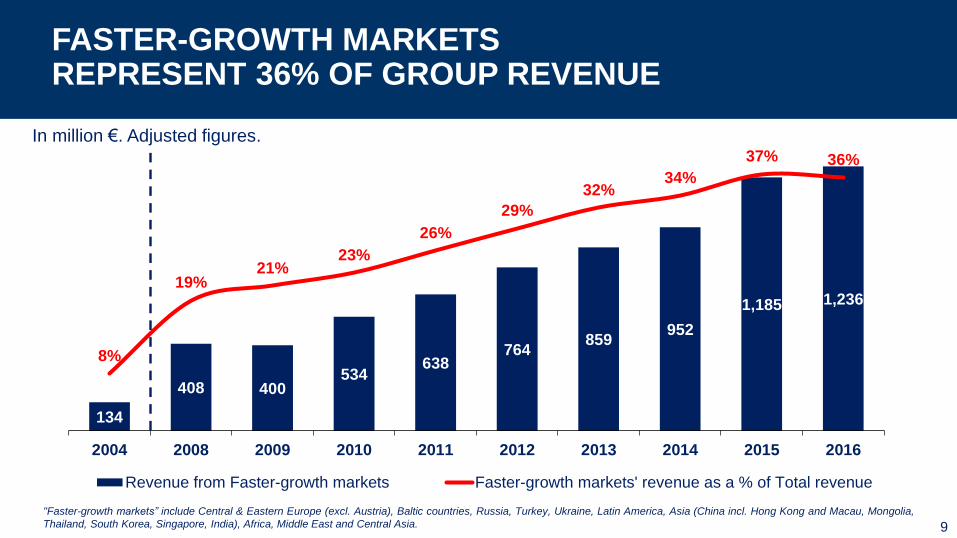
134
408 400534
638764
859952
1,185 1,236
8%
19%21%
23%
26%
29%
32%34%
37% 36%
2004 2008 2009 2010 2011 2012 2013 2014 2015 2016
Revenue from Faster-growth markets Faster-growth markets' revenue as a % of Total revenue
FASTER-GROWTH MARKETSREPRESENT 36% OF GROUP REVENUE
In million €. Adjusted figures.
"Faster-growth markets” include Central & Eastern Europe (excl. Austria), Baltic countries, Russia, Turkey, Ukraine, Latin America, Asia (China incl. Hong Kong and Macau, Mongolia,
Thailand, South Korea, Singapore, India), Africa, Middle East and Central Asia. 9
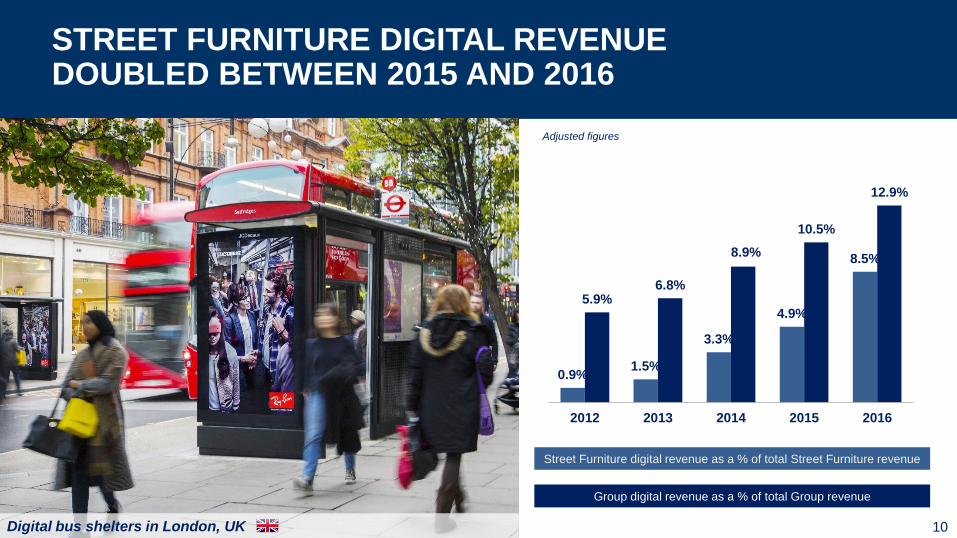
0.9%1.5%
3.3%
4.9%
8.5%
5.9%6.8%
8.9%
10.5%
12.9%
2012 2013 2014 2015 2016
Digital bus shelters in London, UK
STREET FURNITURE DIGITAL REVENUEDOUBLED BETWEEN 2015 AND 2016
10
Adjusted figures
Street Furniture digital revenue as a % of total Street Furniture revenue
Group digital revenue as a % of total Group revenue
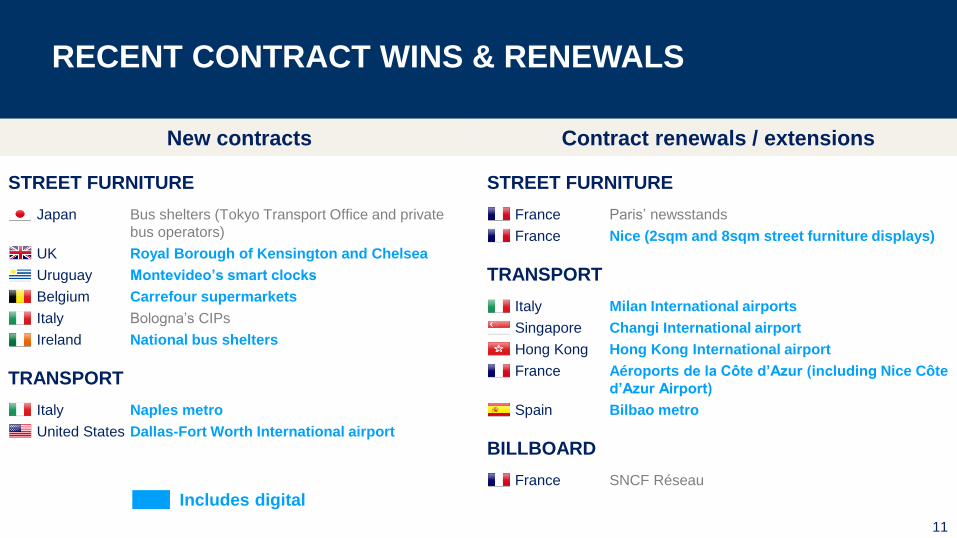
RECENT CONTRACT WINS & RENEWALS
Contract renewals / extensionsNew contracts
11
STREET FURNITURE
France Paris’ newsstands
France Nice (2sqm and 8sqm street furniture displays)
TRANSPORT
Italy Milan International airports
Singapore Changi International airport
Hong Kong Hong Kong International airport
France Aéroports de la Côte d’Azur (including Nice Côte
d’Azur Airport)
Spain Bilbao metro
BILLBOARD
France SNCF Réseau
STREET FURNITURE
Japan Bus shelters (Tokyo Transport Office and private
bus operators)
UK Royal Borough of Kensington and Chelsea
Uruguay Montevideo’s smart clocks
Belgium Carrefour supermarkets
Italy Bologna’s CIPs
Ireland National bus shelters
TRANSPORT
Italy Naples metro
United States Dallas-Fort Worth International airport
Includes digital
Tokyo, Japan
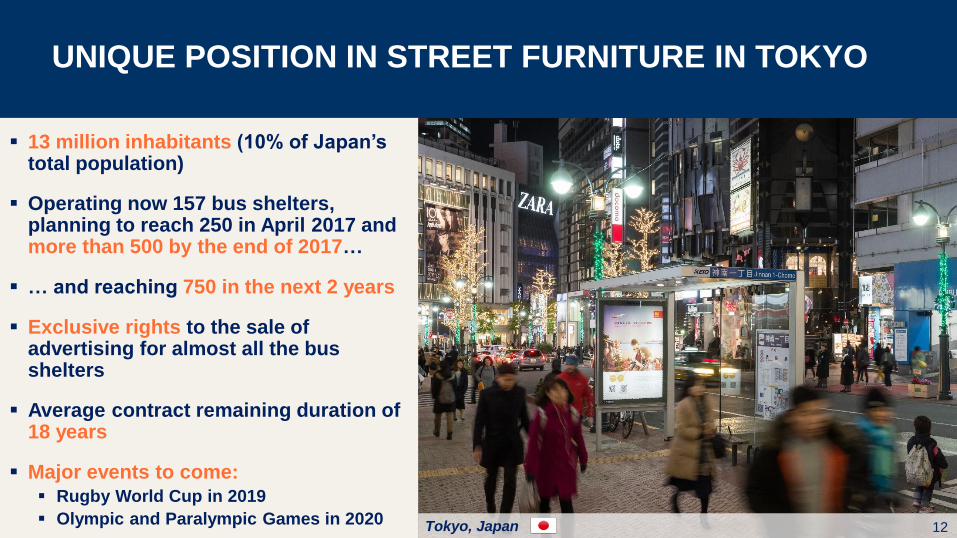
13 million inhabitants (10% of Japan’s total population)
Operating now 157 bus shelters, planning to reach 250 in April 2017 and more than 500 by the end of 2017…
… and reaching 750 in the next 2 years
Exclusive rights to the sale of advertising for almost all the bus shelters
Average contract remaining duration of 18 years
Major events to come: Rugby World Cup in 2019
Olympic and Paralympic Games in 202012
UNIQUE POSITION IN STREET FURNITURE IN TOKYO
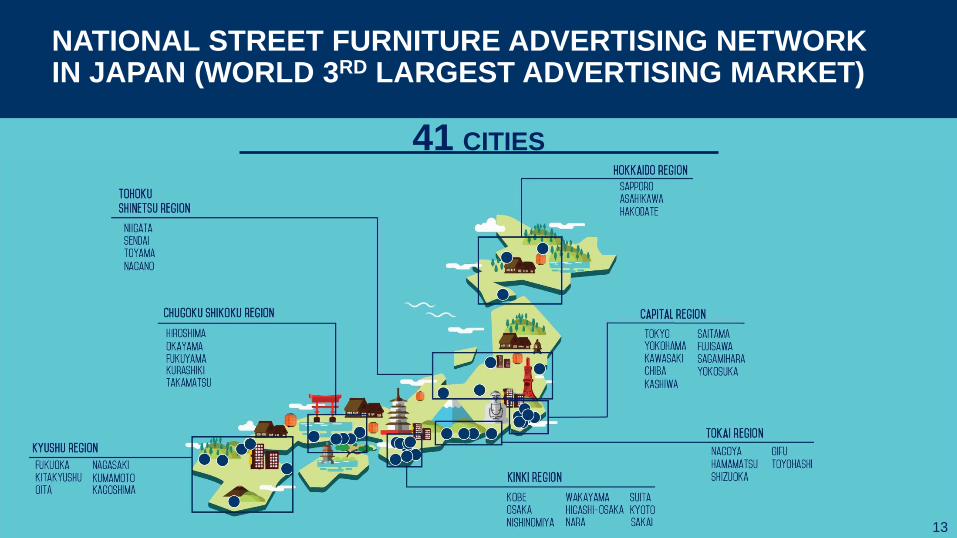
NATIONAL STREET FURNITURE ADVERTISING NETWORKIN JAPAN (WORLD 3RD LARGEST ADVERTISING MARKET)
13
41 CITIES
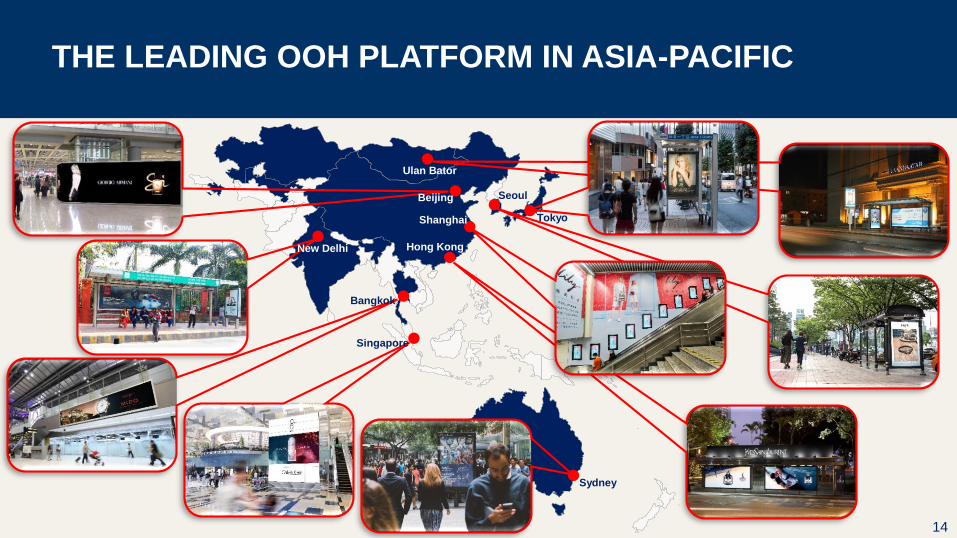
THE LEADING OOH PLATFORM IN ASIA-PACIFIC
14
Shanghai
Hong Kong
Sydney
SeoulBeijing
Bangkok
New Delhi
Singapore
Ulan Bator
Tokyo
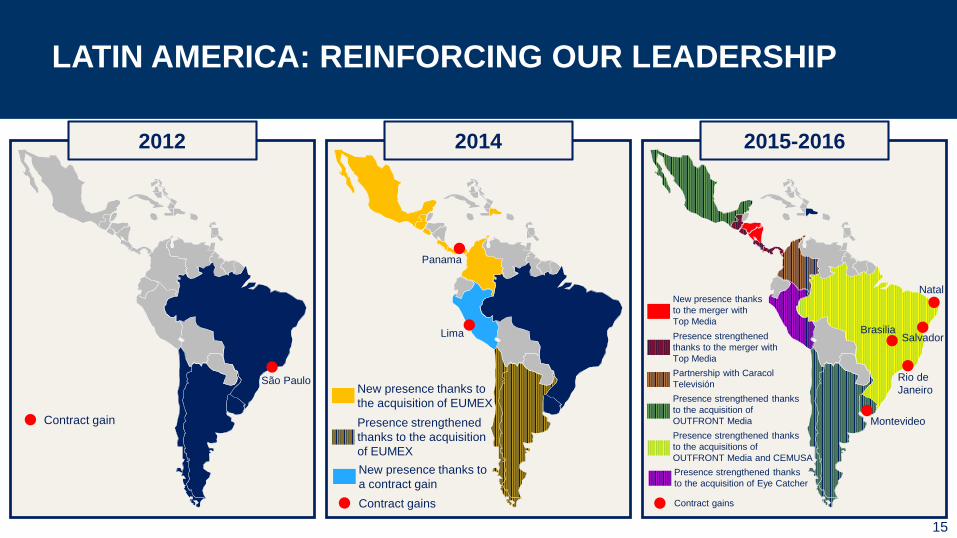
LATIN AMERICA: REINFORCING OUR LEADERSHIP
15
2012 2014 2015-2016
Presence strengthened thanks
to the acquisition of
OUTFRONT Media
Presence strengthened thanks
to the acquisitions of
OUTFRONT Media and CEMUSA
Presence strengthened thanks
to the acquisition of Eye Catcher
Contract gains
São Paulo
Lima
Panama
Montevideo
Rio de
Janeiro
SalvadorBrasilia
Natal
Partnership with Caracol
Televisión
Presence strengthened
thanks to the merger with
Top Media
New presence thanks
to the merger with
Top Media
New presence thanks to
the acquisition of EUMEX
Presence strengthened
thanks to the acquisition
of EUMEX
New presence thanks to
a contract gain
Contract gains
Contract gain
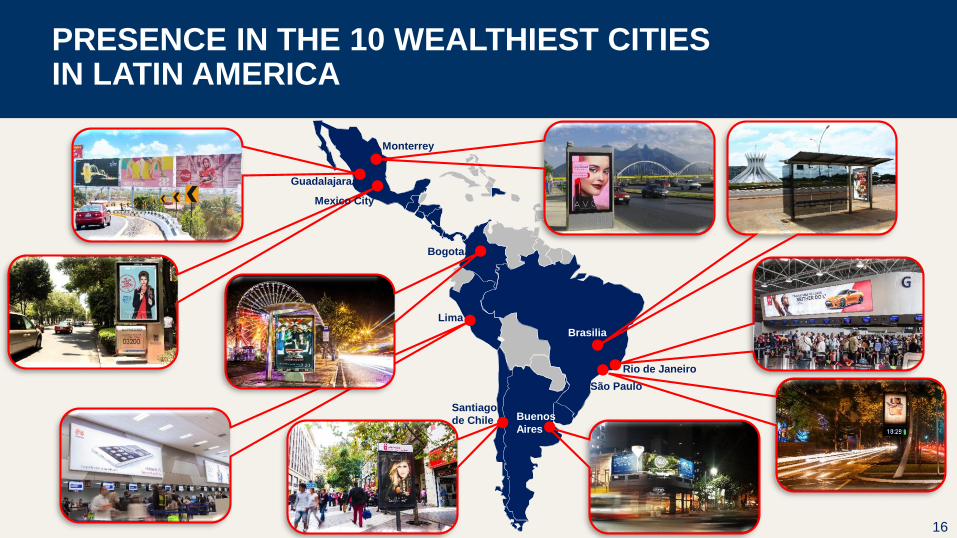
PRESENCE IN THE 10 WEALTHIEST CITIESIN LATIN AMERICA
16
Mexico City
Guadalajara
Monterrey
Brasilia
Rio de Janeiro
São Paulo
Bogota
Lima
Santiago
de Chile Buenos
Aires
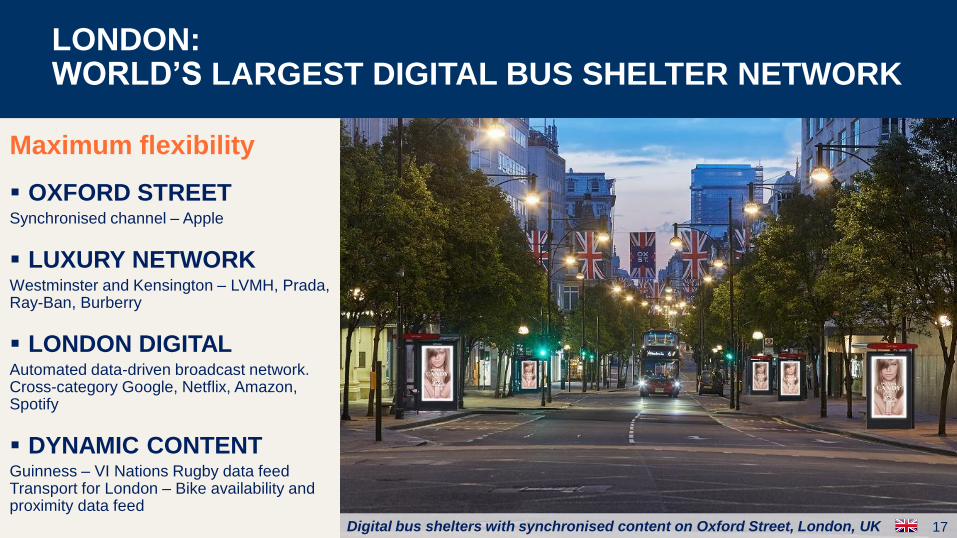
Digital bus shelters with synchronised content on Oxford Street, London, UK
LONDON:WORLD’S LARGEST DIGITAL BUS SHELTER NETWORK
17
Maximum flexibility
OXFORD STREETSynchronised channel – Apple
LUXURY NETWORKWestminster and Kensington – LVMH, Prada, Ray-Ban, Burberry
LONDON DIGITALAutomated data-driven broadcast network. Cross-category Google, Netflix, Amazon, Spotify
DYNAMIC CONTENTGuinness – VI Nations Rugby data feedTransport for London – Bike availability and proximity data feed
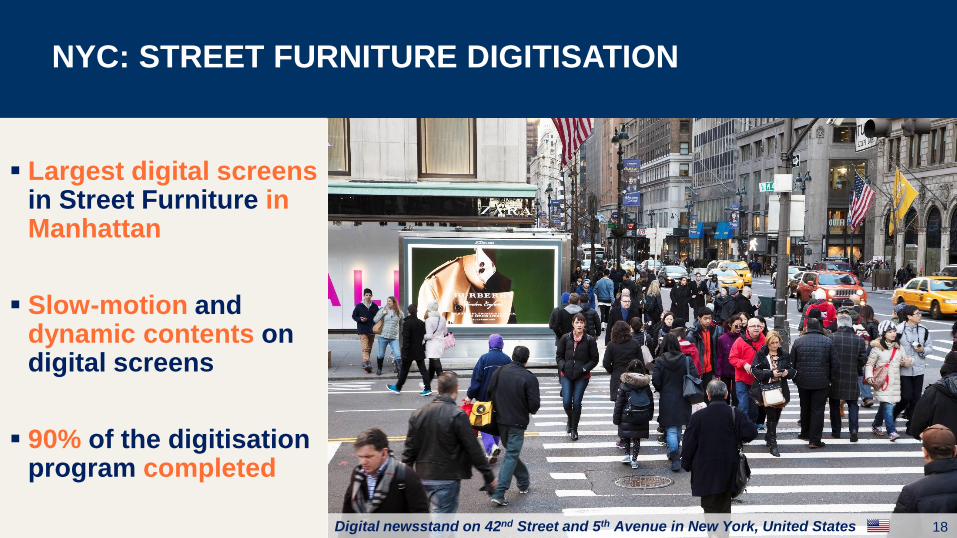
Digital newsstand on 42nd Street and 5th Avenue in New York, United States
NYC: STREET FURNITURE DIGITISATION
18
Largest digital screens in Street Furniture in Manhattan
Slow-motion anddynamic contents on digital screens
90% of the digitisation program completed
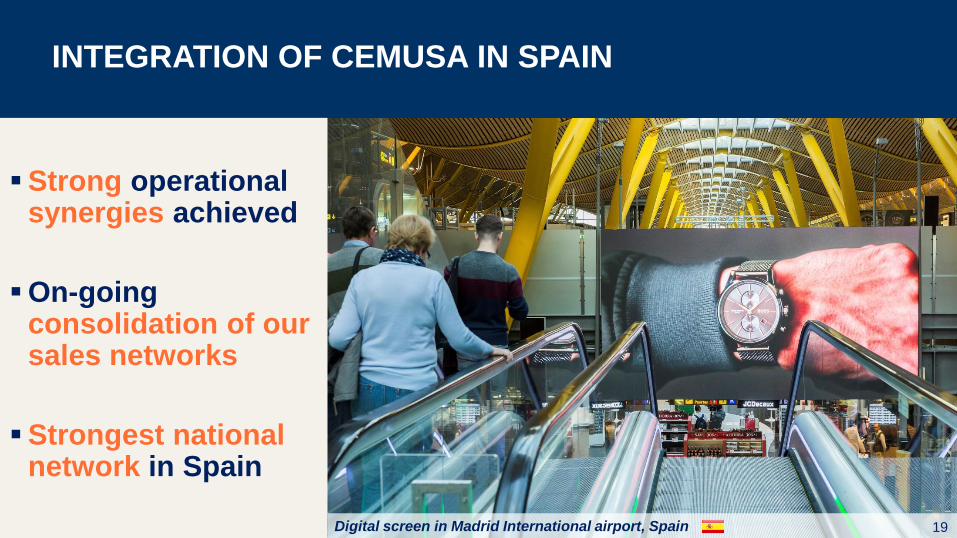
Digital screen in Madrid International airport, Spain
INTEGRATION OF CEMUSA IN SPAIN
Strong operational synergies achieved
On-going consolidation of our sales networks
Strongest national network in Spain
19
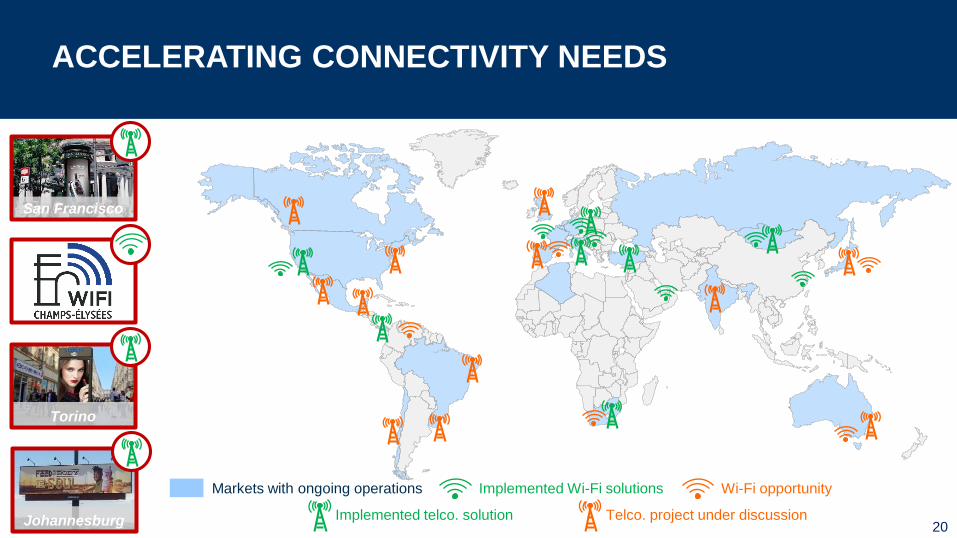
ACCELERATING CONNECTIVITY NEEDS
20
San Francisco
Torino
Johannesburg
Markets with ongoing operations Implemented Wi-Fi solutions Wi-Fi opportunity
Implemented telco. solution Telco. project under discussion
21
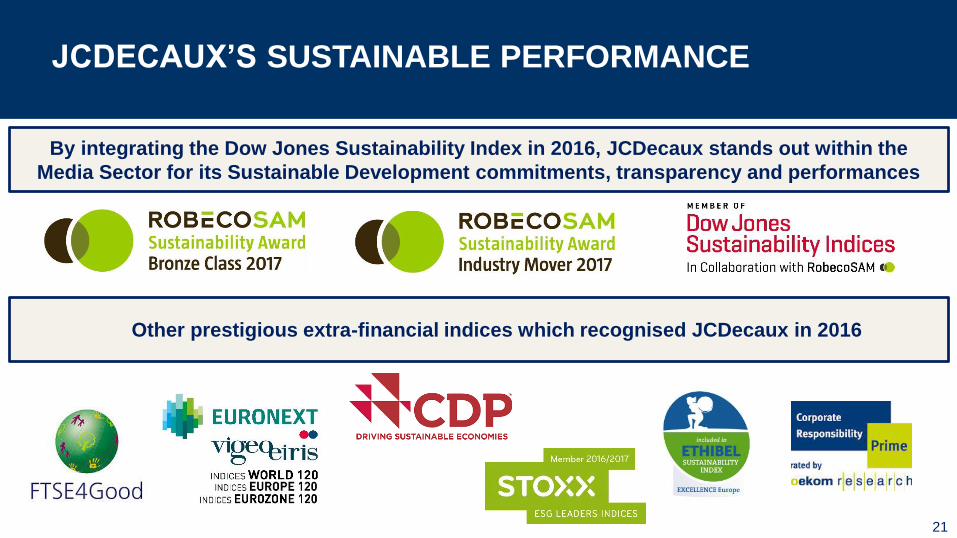
JCDECAUX’S SUSTAINABLE PERFORMANCE
By integrating the Dow Jones Sustainability Index in 2016, JCDecaux stands out within the
Media Sector for its Sustainable Development commitments, transparency and performances
Other prestigious extra-financial indices which recognised JCDecaux in 2016
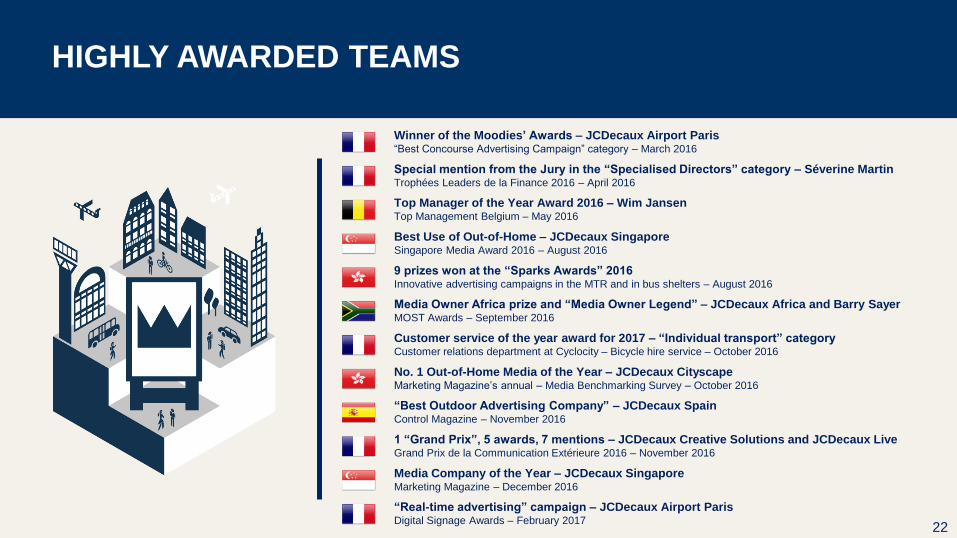
Winner of the Moodies’ Awards – JCDecaux Airport Paris“Best Concourse Advertising Campaign” category – March 2016
Special mention from the Jury in the “Specialised Directors” category – Séverine MartinTrophées Leaders de la Finance 2016 – April 2016
Top Manager of the Year Award 2016 – Wim JansenTop Management Belgium – May 2016
Best Use of Out-of-Home – JCDecaux SingaporeSingapore Media Award 2016 – August 2016
9 prizes won at the “Sparks Awards” 2016Innovative advertising campaigns in the MTR and in bus shelters – August 2016
Media Owner Africa prize and “Media Owner Legend” – JCDecaux Africa and Barry SayerMOST Awards – September 2016
Customer service of the year award for 2017 – “Individual transport” categoryCustomer relations department at Cyclocity – Bicycle hire service – October 2016
No. 1 Out-of-Home Media of the Year – JCDecaux CityscapeMarketing Magazine’s annual – Media Benchmarking Survey – October 2016
“Best Outdoor Advertising Company” – JCDecaux SpainControl Magazine – November 2016
1 “Grand Prix”, 5 awards, 7 mentions – JCDecaux Creative Solutions and JCDecaux LiveGrand Prix de la Communication Extérieure 2016 – November 2016
Media Company of the Year – JCDecaux SingaporeMarketing Magazine – December 2016
“Real-time advertising” campaign – JCDecaux Airport ParisDigital Signage Awards – February 2017
HIGHLY AWARDED TEAMS
22
FINANCIAL HIGHLIGHTS
David Bourg
Chief Financial & Administrative Officer

In million Euros, except %. Adjusted figures (1) except when IFRS. 2016 2015
► Revenue 3,392.8 3,207.6 +5.8%
► Operating margin 646.5 695.2 -7.0%
► EBIT before impairment charge (2) 351.4 371.4 -5.4%
► Net income Group share before impairment charge, IFRS (3) 223.5 241.4 -7.4%
► Net income Group share, IFRS 224.7 233.9 -3.9%
► Net cash flow from operating activities 506.0 562.8 -10.1%
► Free cash flow 263.7 333.4 -20.9%
► Net debt as of end of period, IFRS 418.6 400.5
2016 ANNUAL RESULTS
(1) Adjusted figures include our prorata share in companies under joint control accounted for using the equity method under IFRS 11.(2) The impact of the impairment charge on EBIT in 2016 corresponds to a +€0.5m reversal on impairment on intangible assets and PP&E and a +€1.2m reversal on provisions for onerous contracts. The impact of the impairment charge on
EBIT in 2015 corresponds to a -€2.7m impairment on intangible assets and PP&E and a -€11.2m net provisions for onerous contracts.(3) The impact of the impairment charge on Net income Group share in 2016 corresponds to a reversal on impairment on intangible assets and PP&E (net of tax and net of the impact on minority interests) and a reversal on provisions for
onerous contracts (net of tax and net of the impact on minority interests) for +€1.2m. The impact of the impairment charge on Net income Group share in 2015 corresponds to an impairment charge on intangible assets and PP&E (net of tax
and net of the impact on minority interests) and a net provision for onerous contracts (net of tax and net of the impact on minority interests) for -€7.5m.
Please refer to page 53 for financial definitions. 24

+5.2%
+2.1%
+0.9%
+3.3%
+9.3%
+1.4%
+8.2%
+5.8%
2016 ADJUSTED REVENUE GROWTH BY SEGMENT
(1) Organic growth = excluding acquisitions / divestitures and the impact of foreign exchange.
Street
FurnitureTransport Billboard Group
Street
FurnitureTransport Billboard Group
Organic growth (%) (1)Reported growth (%)
25
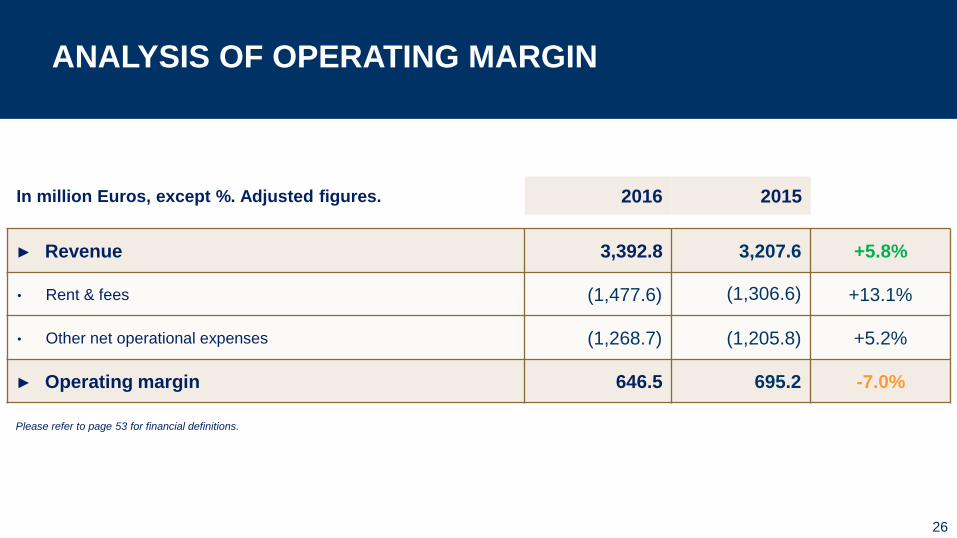
ANALYSIS OF OPERATING MARGIN
26
In million Euros, except %. Adjusted figures. 2016 2015
► Revenue 3,392.8 3,207.6 +5.8%
• Rent & fees (1,477.6) (1,306.6) +13.1%
• Other net operational expenses (1,268.7) (1,205.8) +5.2%
► Operating margin 646.5 695.2 -7.0%
Please refer to page 53 for financial definitions.
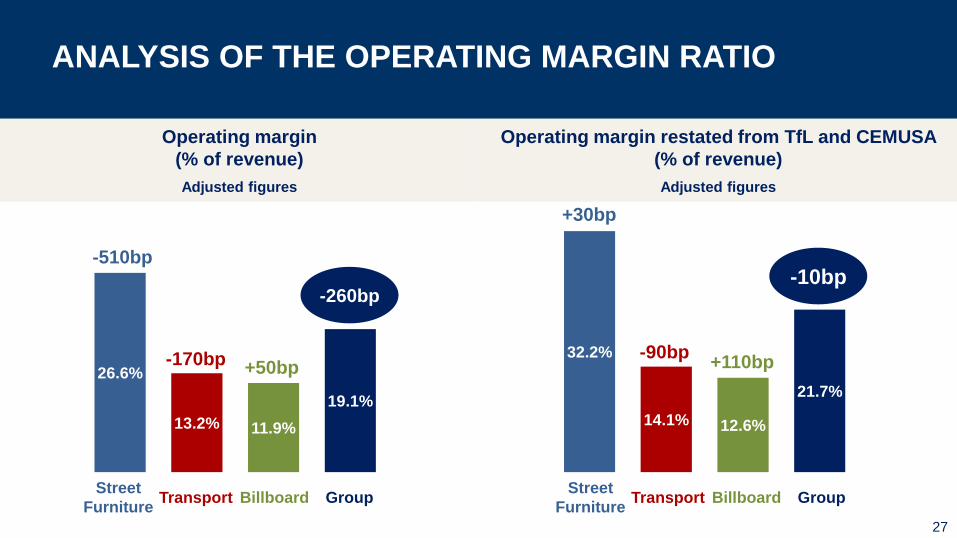
26.6%
13.2% 11.9%
19.1%
32.2%
14.1% 12.6%
21.7%
ANALYSIS OF THE OPERATING MARGIN RATIO
Operating margin restated from TfL and CEMUSA
(% of revenue)
Adjusted figures
Operating margin
(% of revenue)
Adjusted figures
27
Street
FurnitureTransport Billboard Group
+50bp
-510bp
-170bp
-260bp
Street
FurnitureTransport Billboard Group
+110bp
+30bp
-90bp
-10bp
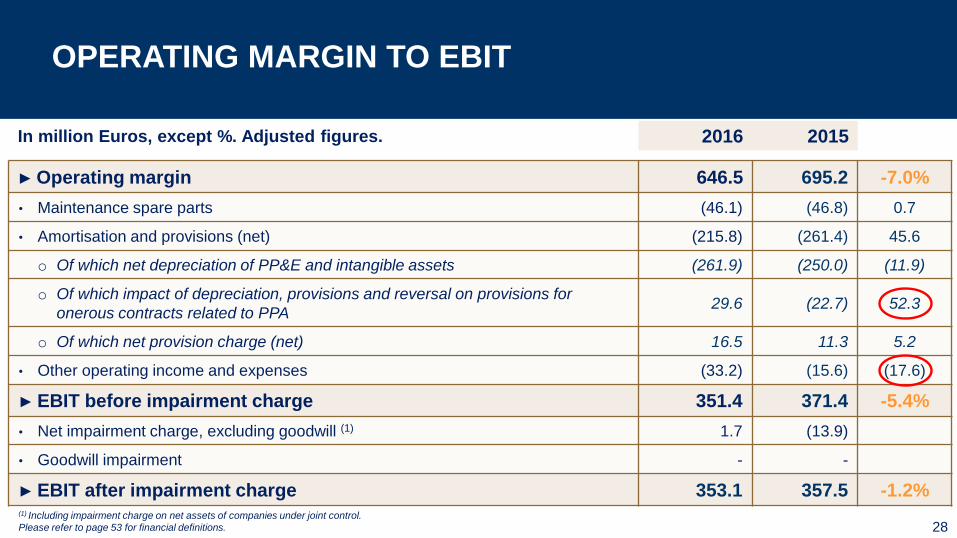
OPERATING MARGIN TO EBIT
In million Euros, except %. Adjusted figures. 2016 2015
► Operating margin 646.5 695.2 -7.0%
• Maintenance spare parts (46.1) (46.8) 0.7
• Amortisation and provisions (net) (215.8) (261.4) 45.6
o Of which net depreciation of PP&E and intangible assets (261.9) (250.0) (11.9)
o Of which impact of depreciation, provisions and reversal on provisions for
onerous contracts related to PPA29.6 (22.7) 52.3
o Of which net provision charge (net) 16.5 11.3 5.2
• Other operating income and expenses (33.2) (15.6) (17.6)
► EBIT before impairment charge 351.4 371.4 -5.4%
• Net impairment charge, excluding goodwill (1) 1.7 (13.9)
• Goodwill impairment - -
► EBIT after impairment charge 353.1 357.5 -1.2%
28(1) Including impairment charge on net assets of companies under joint control.
Please refer to page 53 for financial definitions.
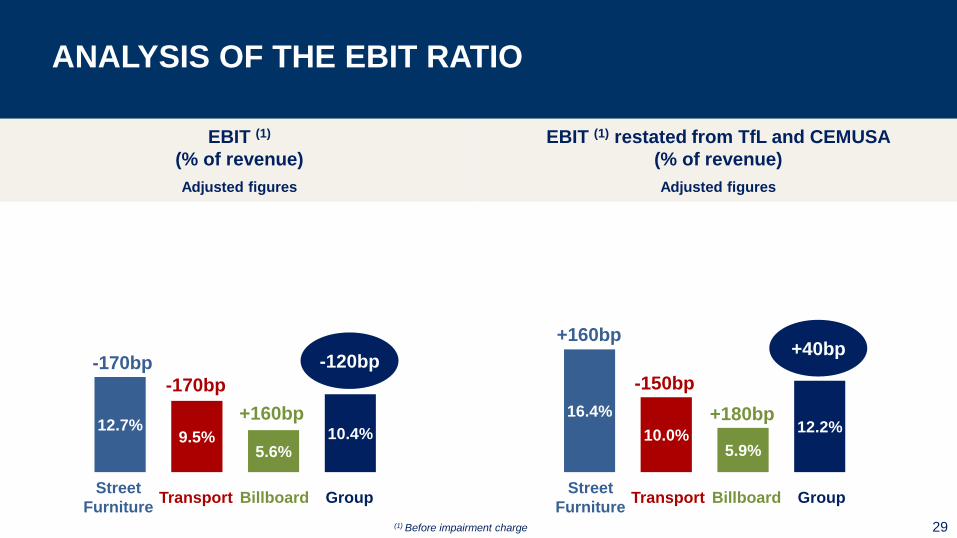
16.4%
10.0%5.9%
12.2%12.7%9.5%
5.6%10.4%
ANALYSIS OF THE EBIT RATIO
EBIT (1) restated from TfL and CEMUSA
(% of revenue)
Adjusted figures
EBIT (1)
(% of revenue)
Adjusted figures
29(1) Before impairment charge
+160bp
-170bp
-170bp
-120bp
+180bp
+160bp
-150bp
+40bp
Street
FurnitureTransport Billboard Group
Street
FurnitureTransport Billboard Group
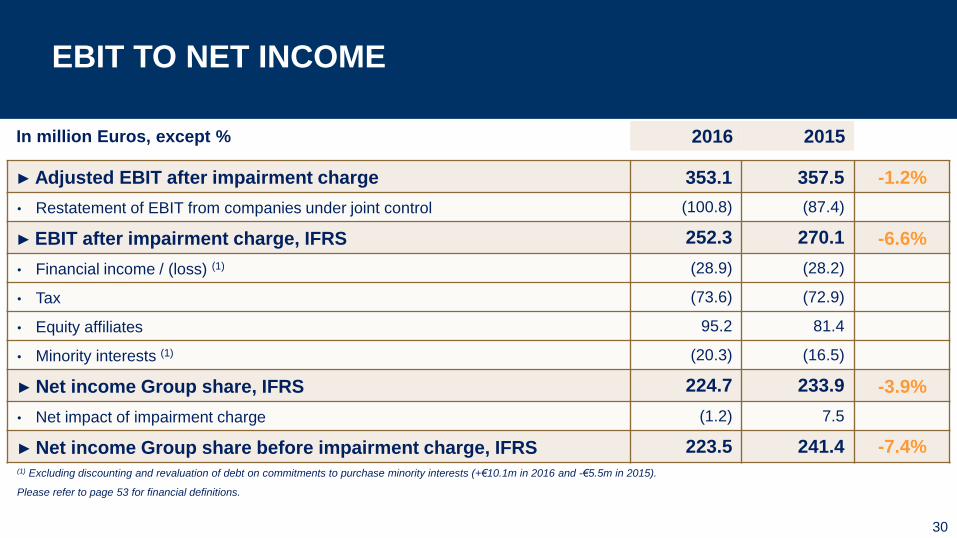
EBIT TO NET INCOME
In million Euros, except % 2016 2015
► Adjusted EBIT after impairment charge 353.1 357.5 -1.2%
• Restatement of EBIT from companies under joint control (100.8) (87.4)
► EBIT after impairment charge, IFRS 252.3 270.1 -6.6%
• Financial income / (loss) (1) (28.9) (28.2)
• Tax (73.6) (72.9)
• Equity affiliates 95.2 81.4
• Minority interests (1) (20.3) (16.5)
► Net income Group share, IFRS 224.7 233.9 -3.9%
• Net impact of impairment charge (1.2) 7.5
► Net income Group share before impairment charge, IFRS 223.5 241.4 -7.4%(1) Excluding discounting and revaluation of debt on commitments to purchase minority interests (+€10.1m in 2016 and -€5.5m in 2015).
Please refer to page 53 for financial definitions.
30
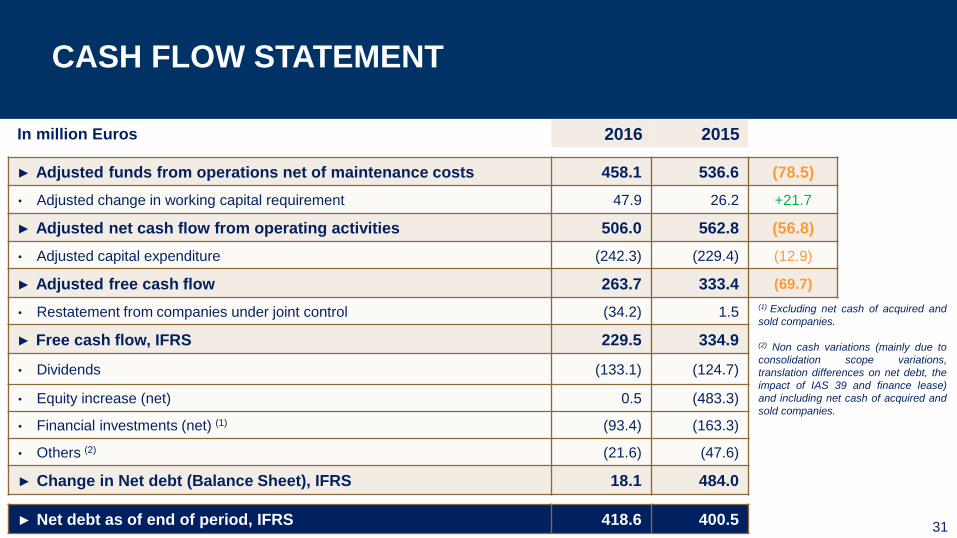
CASH FLOW STATEMENT
31
In million Euros 2016 2015
► Adjusted funds from operations net of maintenance costs 458.1 536.6 (78.5)
• Adjusted change in working capital requirement 47.9 26.2 +21.7
► Adjusted net cash flow from operating activities 506.0 562.8 (56.8)
• Adjusted capital expenditure (242.3) (229.4) (12.9)
► Adjusted free cash flow 263.7 333.4 (69.7)
• Restatement from companies under joint control (34.2) 1.5
► Free cash flow, IFRS 229.5 334.9
• Dividends (133.1) (124.7)
• Equity increase (net) 0.5 (483.3)
• Financial investments (net) (1) (93.4) (163.3)
• Others (2) (21.6) (47.6)
► Change in Net debt (Balance Sheet), IFRS 18.1 484.0
► Net debt as of end of period, IFRS 418.6 400.5
(1) Excluding net cash of acquired and
sold companies.
(2) Non cash variations (mainly due to
consolidation scope variations,
translation differences on net debt, the
impact of IAS 39 and finance lease)
and including net cash of acquired and
sold companies.
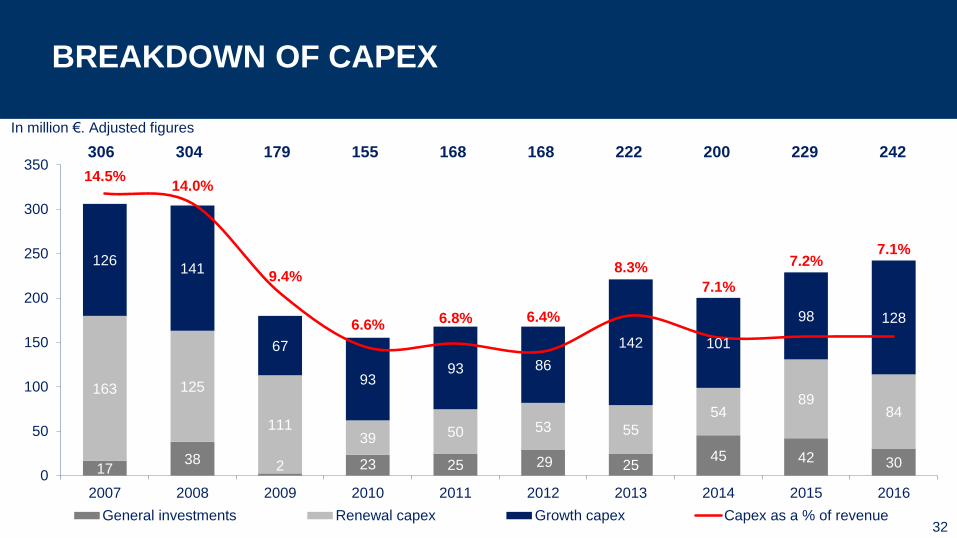
1738 2 23 25 29 25
45 42 30
163 125
11139 50 53 55
5489
84
126141
67
9393 86
142 101
98 128
14.5%14.0%
9.4%
6.6% 6.8% 6.4%
8.3%
7.1%
7.2%7.1%
0
50
100
150
200
250
300
350
2007 2008 2009 2010 2011 2012 2013 2014 2015 2016
General investments Renewal capex Growth capex Capex as a % of revenue
200304 229179 155 168306 168 222 242
In million €. Adjusted figures
BREAKDOWN OF CAPEX
32
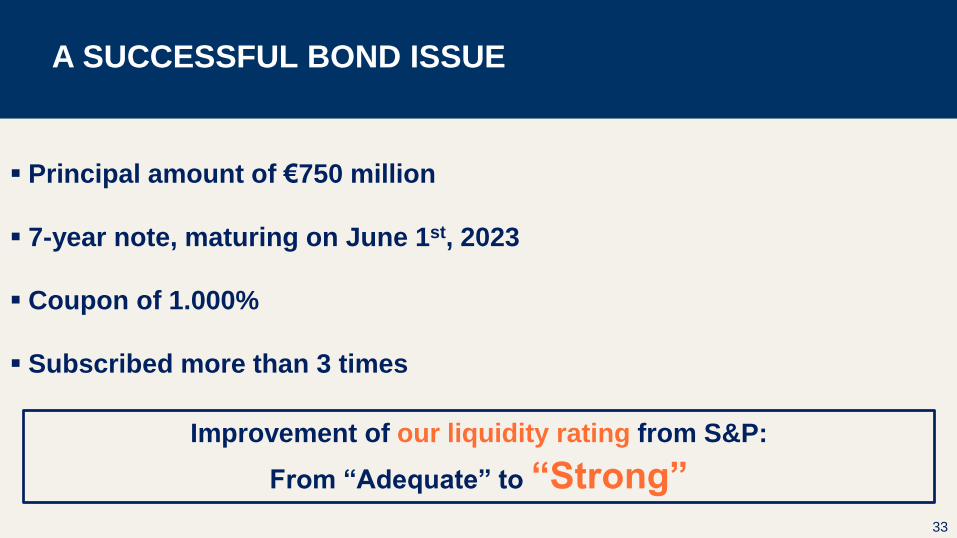
Principal amount of €750 million
7-year note, maturing on June 1st, 2023
Coupon of 1.000%
Subscribed more than 3 times
A SUCCESSFUL BOND ISSUE
33
Improvement of our liquidity rating from S&P:
From “Adequate” to “Strong”
2016 FINANCIAL HIGHLIGHTS
# Record revenue driven by M&A, TfL and Digital with a slowdown in H2
# Margins impacted by CEMUSA and TfL, as anticipated
# Costs, working capital requirements and capex under control
# Solid free cash flow & strengthened financial flexibility
# Dividend per share for 2016 proposed at €0.56
34
GROWTH STRATEGY AND OUTLOOK
Jean-François Decaux
Co-CEO
6%15%5%
11%
6%
13%21%
33%
62%
28%
Population GDP
Small cities (<150k)
Cities 150k-2m
Cities 2m-5m
Cities 5m-10m
Megacities (>10m)
17%
39%
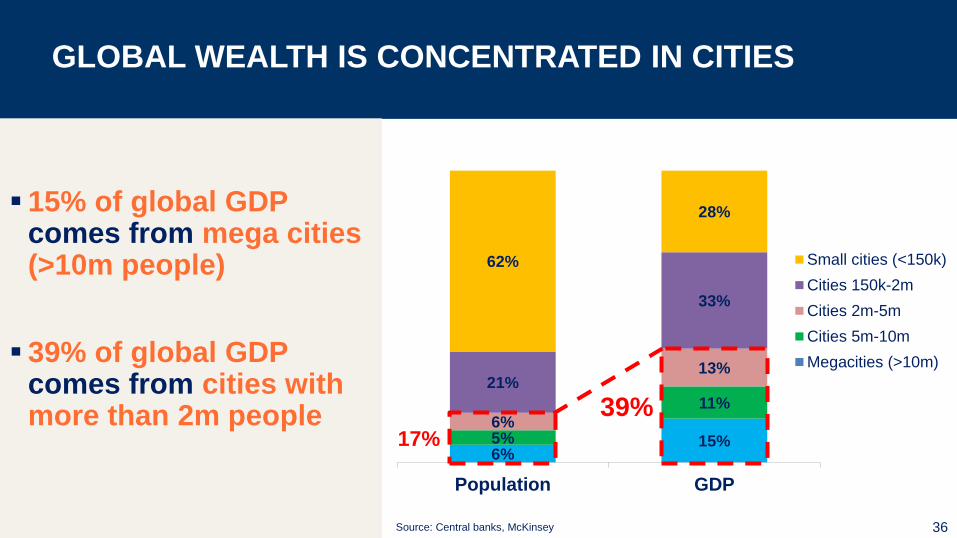
GLOBAL WEALTH IS CONCENTRATED IN CITIES
36Source: Central banks, McKinsey
15% of global GDP comes from mega cities (>10m people)
39% of global GDP comes from cities with more than 2m people
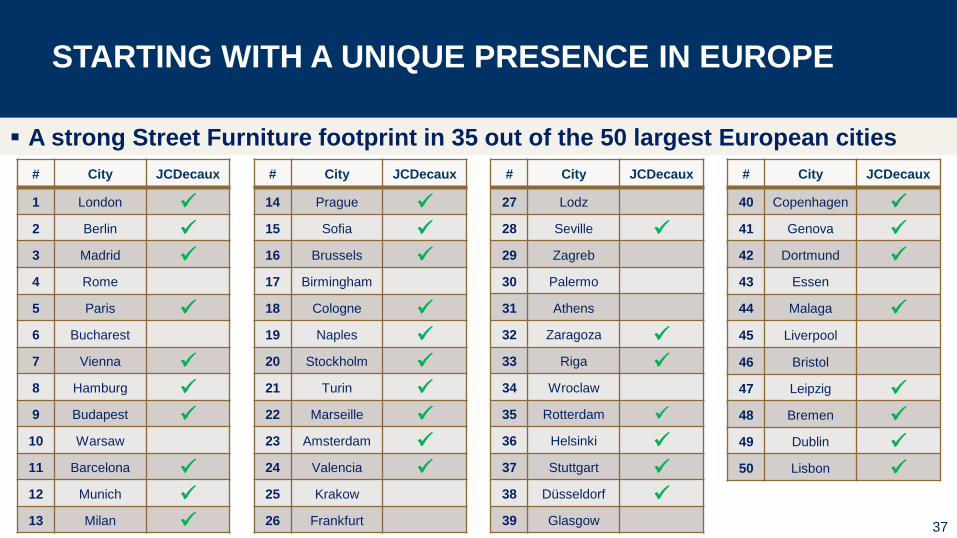
STARTING WITH A UNIQUE PRESENCE IN EUROPE
A strong Street Furniture footprint in 35 out of the 50 largest European cities
# City JCDecaux
1 London
2 Berlin
3 Madrid
4 Rome
5 Paris
6 Bucharest
7 Vienna
8 Hamburg
9 Budapest
10 Warsaw
11 Barcelona
12 Munich
13 Milan 37
# City JCDecaux
14 Prague
15 Sofia
16 Brussels
17 Birmingham
18 Cologne
19 Naples
20 Stockholm
21 Turin
22 Marseille
23 Amsterdam
24 Valencia
25 Krakow
26 Frankfurt
# City JCDecaux
27 Lodz
28 Seville
29 Zagreb
30 Palermo
31 Athens
32 Zaragoza
33 Riga
34 Wroclaw
35 Rotterdam
36 Helsinki
37 Stuttgart
38 Düsseldorf
39 Glasgow
# City JCDecaux
40 Copenhagen
41 Genova
42 Dortmund
43 Essen
44 Malaga
45 Liverpool
46 Bristol
47 Leipzig
48 Bremen
49 Dublin
50 Lisbon
0
100
200
300
400
500
600
JCDecaux's city centers presence
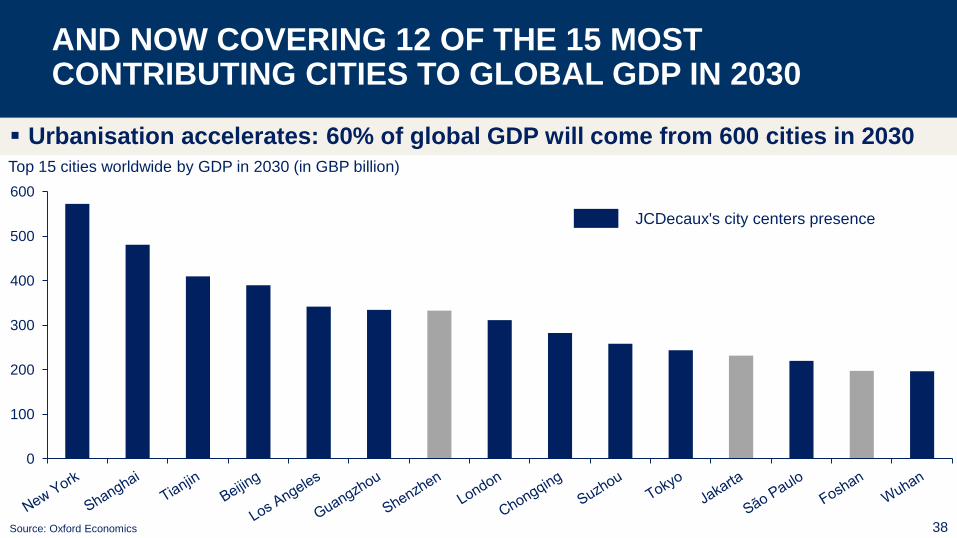
Top 15 cities worldwide by GDP in 2030 (in GBP billion)
AND NOW COVERING 12 OF THE 15 MOST CONTRIBUTING CITIES TO GLOBAL GDP IN 2030
38Source: Oxford Economics
Urbanisation accelerates: 60% of global GDP will come from 600 cities in 2030
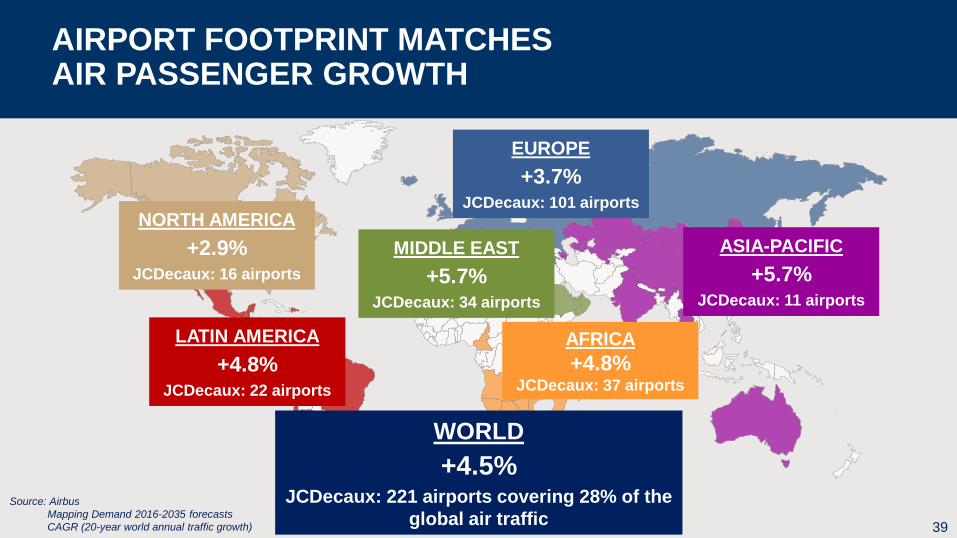
AIRPORT FOOTPRINT MATCHESAIR PASSENGER GROWTH
39
Source: Airbus
Mapping Demand 2016-2035 forecasts
CAGR (20-year world annual traffic growth)
NORTH AMERICA
+2.9%JCDecaux: 16 airports
LATIN AMERICA
+4.8%JCDecaux: 22 airports
EUROPE
+3.7%JCDecaux: 101 airports
AFRICA
+4.8%JCDecaux: 37 airports
MIDDLE EAST
+5.7%JCDecaux: 34 airports
WORLD
+4.5%JCDecaux: 221 airports covering 28% of the
global air traffic
ASIA-PACIFIC
+5.7%JCDecaux: 11 airports
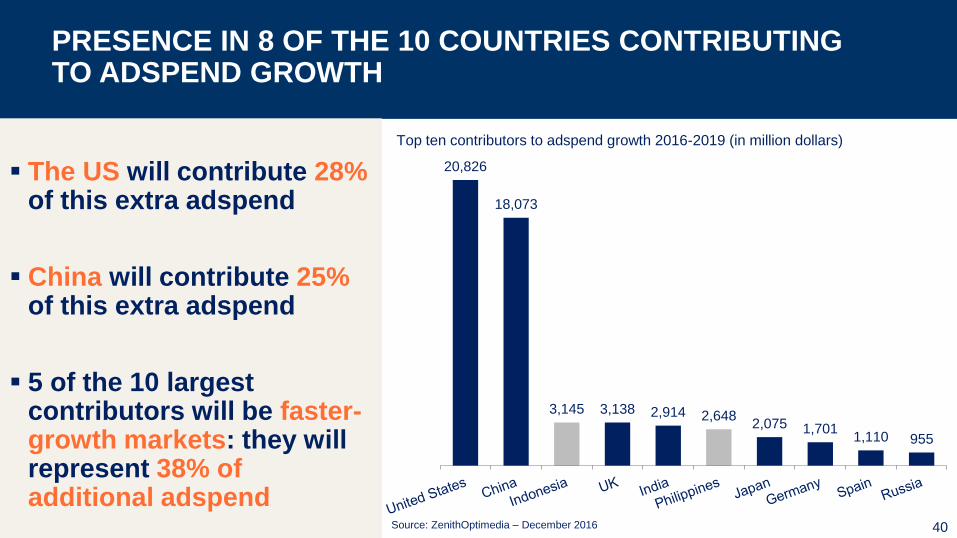
20,826
18,073
3,145 3,138 2,914 2,6482,075 1,701
1,110 955
Top ten contributors to adspend growth 2016-2019 (in million dollars)
The US will contribute 28%of this extra adspend
China will contribute 25% of this extra adspend
5 of the 10 largest contributors will be faster-growth markets: they will represent 38% of additional adspend
PRESENCE IN 8 OF THE 10 COUNTRIES CONTRIBUTINGTO ADSPEND GROWTH
40Source: ZenithOptimedia – December 2016
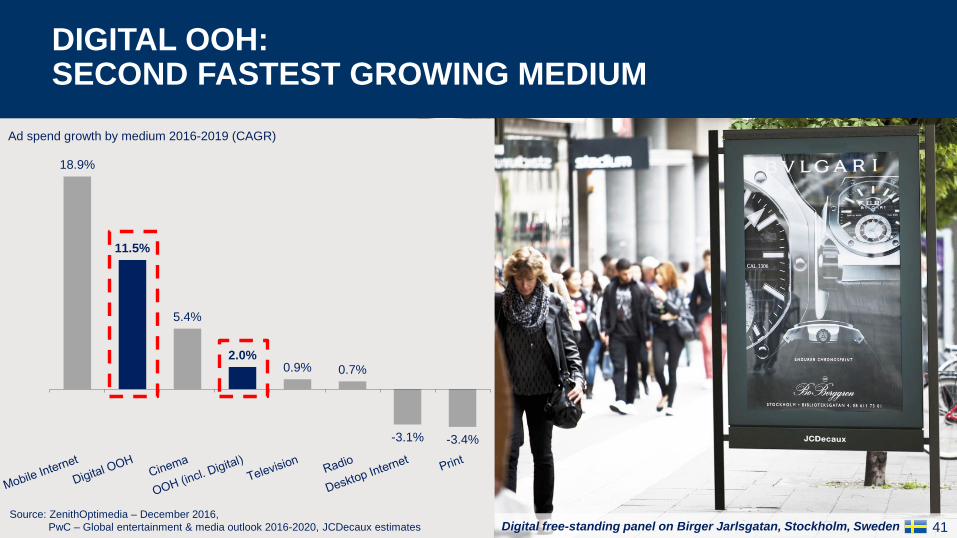
18.9%
11.5%
5.4%
2.0%0.9% 0.7%
-3.1% -3.4%
Ad spend growth by medium 2016-2019 (CAGR)
Digital free-standing panel on Birger Jarlsgatan, Stockholm, Sweden
DIGITAL OOH:SECOND FASTEST GROWING MEDIUM
41Source: ZenithOptimedia – December 2016,
PwC – Global entertainment & media outlook 2016-2020, JCDecaux estimates
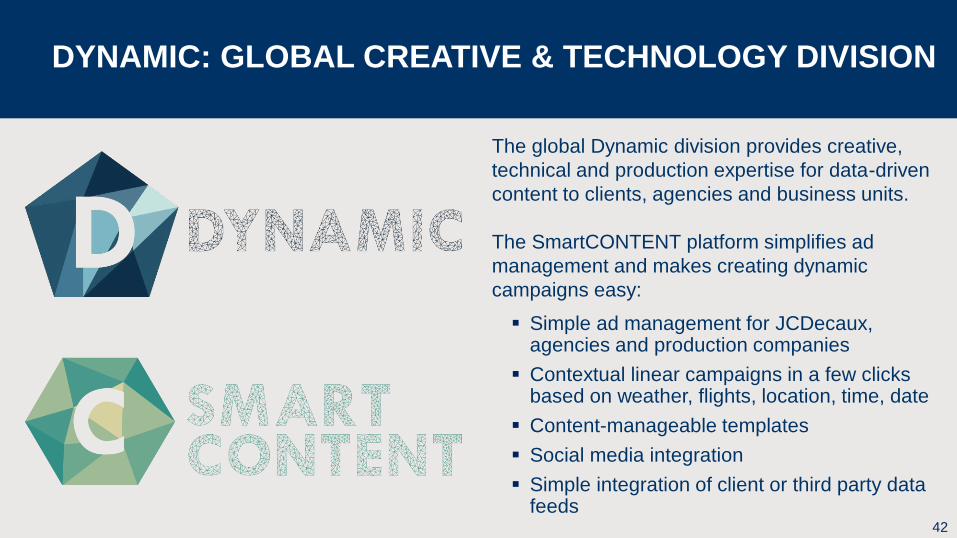
DYNAMIC: GLOBAL CREATIVE & TECHNOLOGY DIVISION
The global Dynamic division provides creative,
technical and production expertise for data-driven
content to clients, agencies and business units.
The SmartCONTENT platform simplifies ad
management and makes creating dynamic
campaigns easy:
Simple ad management for JCDecaux, agencies and production companies
Contextual linear campaigns in a few clicks based on weather, flights, location, time, date
Content-manageable templates
Social media integration
Simple integration of client or third party data feeds
42
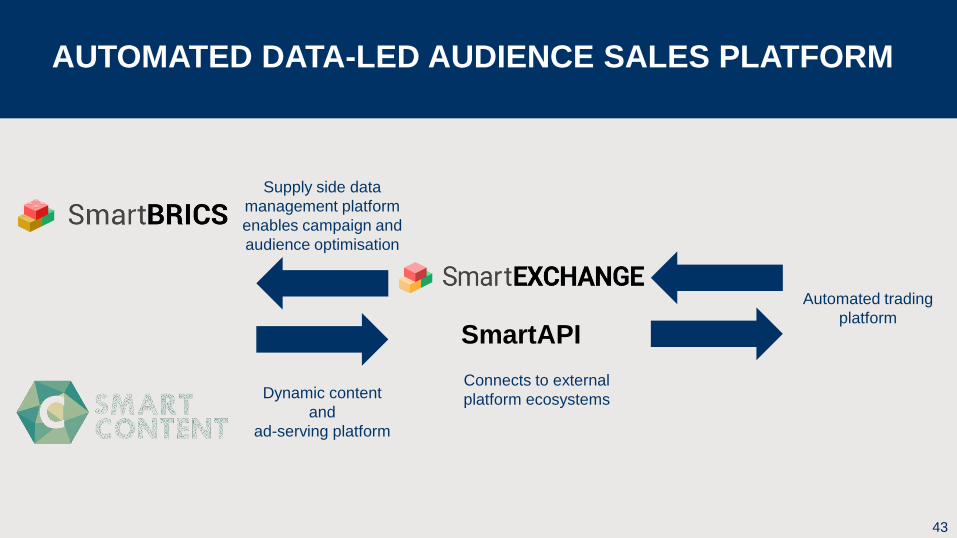
AUTOMATED DATA-LED AUDIENCE SALES PLATFORM
43
Connects to external
platform ecosystemsDynamic content
and
ad-serving platform
Supply side data
management platform
enables campaign and
audience optimisation
SmartAPI
Automated trading
platform
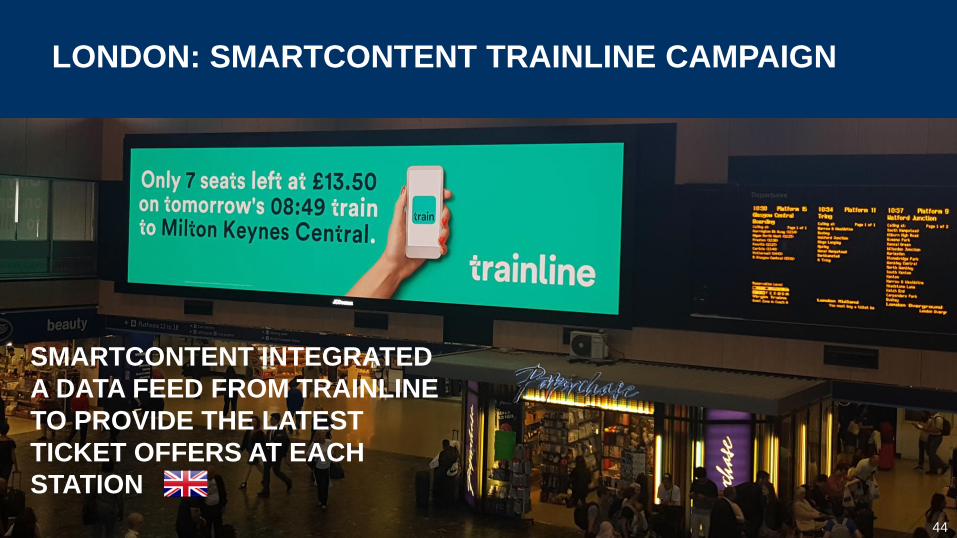
LONDON: SMARTCONTENT TRAINLINE CAMPAIGN
44
SMARTCONTENT INTEGRATED
A DATA FEED FROM TRAINLINE
TO PROVIDE THE LATEST
TICKET OFFERS AT EACH
STATION
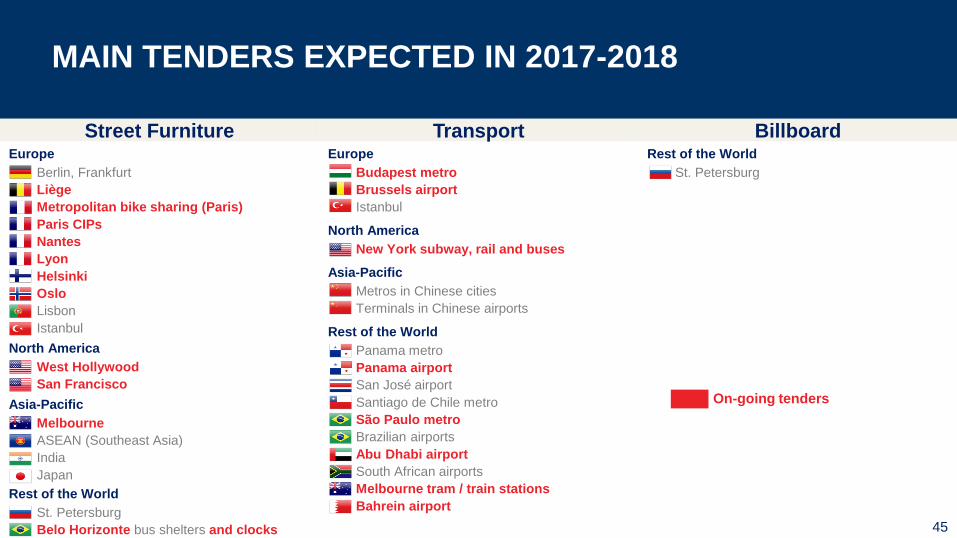
MAIN TENDERS EXPECTED IN 2017-2018
Street FurnitureEurope
Berlin, Frankfurt
Liège
Metropolitan bike sharing (Paris)
Paris CIPs
Nantes
Lyon
Helsinki
Oslo
Lisbon
Istanbul
North America
West Hollywood
San Francisco
Asia-Pacific
Melbourne
ASEAN (Southeast Asia)
India
Japan
Rest of the World
St. Petersburg
Belo Horizonte bus shelters and clocks
Transport BillboardEurope
Budapest metro
Brussels airport
Istanbul
North America
New York subway, rail and buses
Asia-Pacific
Metros in Chinese cities
Terminals in Chinese airports
Rest of the World
Panama metro
Panama airport
San José airport
Santiago de Chile metro
São Paulo metro
Brazilian airports
Abu Dhabi airport
South African airports
Melbourne tram / train stations
Bahrein airport
On-going tenders
45
Rest of the World
St. Petersburg
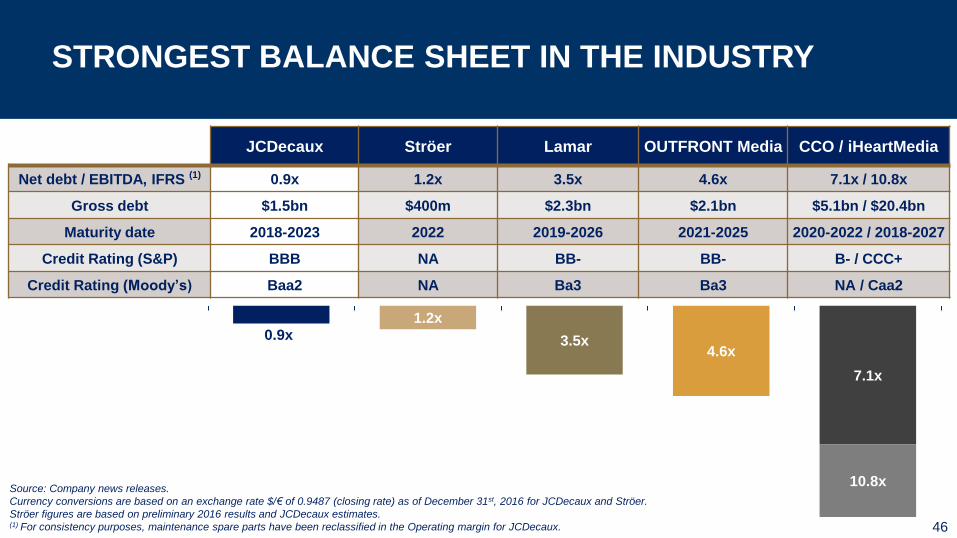
0.9x1.2x
3.5x4.6x
7.1x
10.8x
STRONGEST BALANCE SHEET IN THE INDUSTRY
JCDecaux Ströer Lamar OUTFRONT Media CCO / iHeartMedia
Net debt / EBITDA, IFRS (1) 0.9x 1.2x 3.5x 4.6x 7.1x / 10.8x
Gross debt $1.5bn $400m $2.3bn $2.1bn $5.1bn / $20.4bn
Maturity date 2018-2023 2022 2019-2026 2021-2025 2020-2022 / 2018-2027
Credit Rating (S&P) BBB NA BB- BB- B- / CCC+
Credit Rating (Moody’s) Baa2 NA Ba3 Ba3 NA / Caa2
Source: Company news releases.
Currency conversions are based on an exchange rate $/€ of 0.9487 (closing rate) as of December 31st, 2016 for JCDecaux and Ströer.
Ströer figures are based on preliminary 2016 results and JCDecaux estimates.(1) For consistency purposes, maintenance spare parts have been reclassified in the Operating margin for JCDecaux. 46
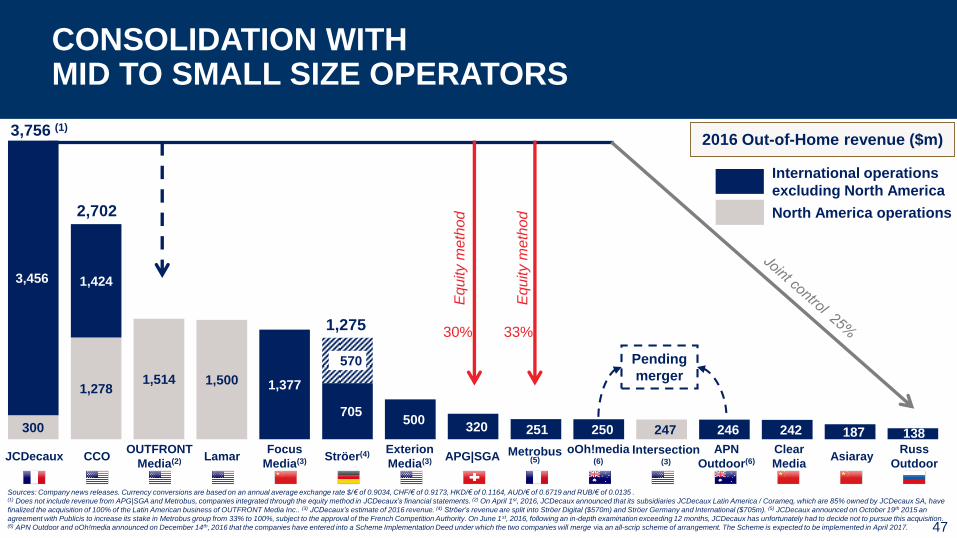
300
1,2781,514 1,500
705
247
3,456 1,424
1,377
570
500 320 251 250 246 242 187 138
CONSOLIDATION WITHMID TO SMALL SIZE OPERATORS
3,756 (1)
North America operations
International operations
excluding North America
2016 Out-of-Home revenue ($m)
47
Sources: Company news releases. Currency conversions are based on an annual average exchange rate $/€ of 0.9034, CHF/€ of 0.9173, HKD/€ of 0.1164, AUD/€ of 0.6719 and RUB/€ of 0.0135 .(1) Does not include revenue from APG|SGA and Metrobus, companies integrated through the equity method in JCDecaux’s financial statements. (2) On April 1st, 2016, JCDecaux announced that its subsidiaries JCDecaux Latin America / Corameq, which are 85% owned by JCDecaux SA, have
finalized the acquisition of 100% of the Latin American business of OUTFRONT Media Inc.. (3) JCDecaux’s estimate of 2016 revenue. (4) Ströer’s revenue are split into Ströer Digital ($570m) and Ströer Germany and International ($705m). (5) JCDecaux announced on October 19th 2015 an
agreement with Publicis to increase its stake in Metrobus group from 33% to 100%, subject to the approval of the French Competition Authority. On June 1st, 2016, following an in-depth examination exceeding 12 months, JCDecaux has unfortunately had to decide not to pursue this acquisition. (6) APN Outdoor and oOh!media announced on December 14th, 2016 that the companies have entered into a Scheme Implementation Deed under which the two companies will merge via an all-scrip scheme of arrangement. The Scheme is expected to be implemented in April 2017.
Pending
merger
2,702
1,275
oOh!media(6)
APN
Outdoor(6)JCDecaux CCOOUTFRONT
Media(2) LamarFocus
Media(3) Ströer(4) APG|SGARuss
OutdoorAsiarayMetrobus
(5)Intersection
(3)
Clear
Media
Exterion
Media(3)
30% 33%
Eq
uity
me
tho
d
Eq
uity
me
tho
d
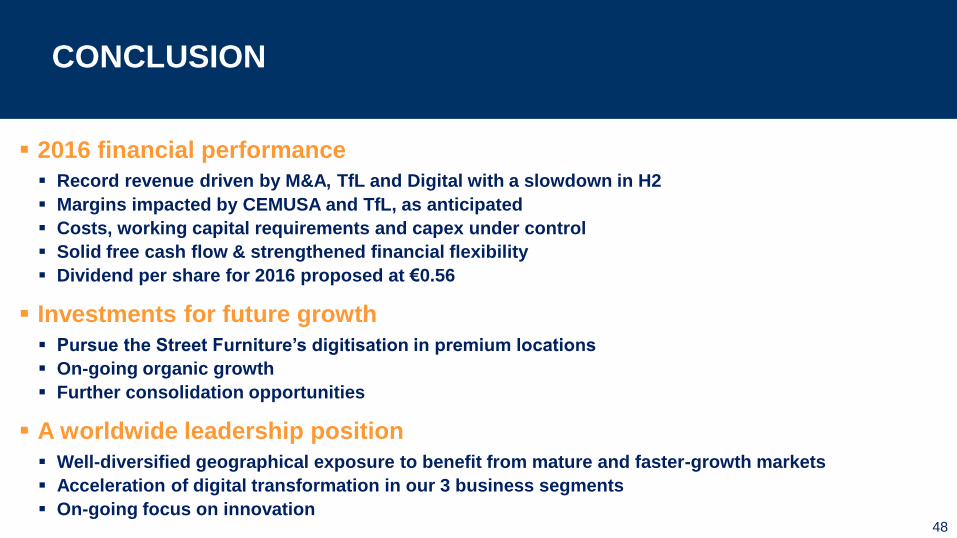
CONCLUSION
48
2016 financial performance
Record revenue driven by M&A, TfL and Digital with a slowdown in H2
Margins impacted by CEMUSA and TfL, as anticipated
Costs, working capital requirements and capex under control
Solid free cash flow & strengthened financial flexibility
Dividend per share for 2016 proposed at €0.56
Investments for future growth
Pursue the Street Furniture’s digitisation in premium locations
On-going organic growth
Further consolidation opportunities
A worldwide leadership position
Well-diversified geographical exposure to benefit from mature and faster-growth markets
Acceleration of digital transformation in our 3 business segments
On-going focus on innovation
Q1 2017 OUTLOOK
49
“As far as Q1 2017 is concerned, given the strong comparable in
Q1 2016 and an uncertain global economic as well as political
outlook, we expect our adjusted organic revenue growth to be
slightly negative.”
Under IFRS 11, applicable from January 1st, 2014, companies under joint control previouslyconsolidated using the proportionate method are accounted for using the equity method.
However, operating data of the companies under joint control will continue to be proportionatelyintegrated in the operating management Group reports on which operating management relies in theirdecision making.
Indeed, operating management considers this information to measure the operating performance and toinform their decision making. Consequently, the operating data presented in this document is“adjusted” to reflect the contribution of companies under joint control.
As regards the Profit & Loss, it concerns all aggregates down to the EBIT. As regards the cash flowstatement, it concerns all aggregates down to the free cash flow.
We systematically present the reconciliations between the IFRS data and the adjusted data, incompliance with the AMF’s instructions. Reconciliations are provided on slides 51 and 52.
IMPLEMENTATION OF IFRS 11
50
2016 2015
In million Euros Adjusted
Impact of
companies
under joint
control
IFRS Adjusted
Impact of
companies
under joint
control
IFRS
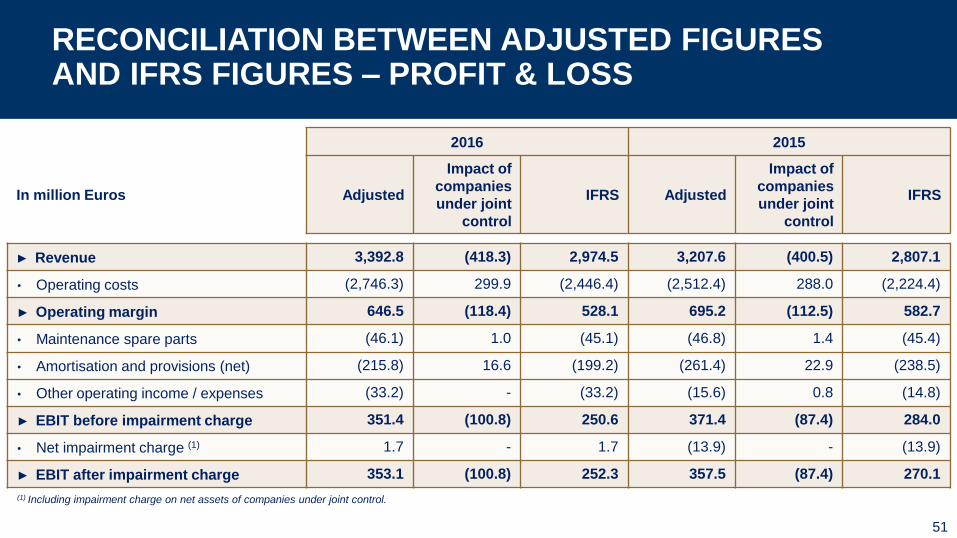
► Revenue 3,392.8 (418.3) 2,974.5 3,207.6 (400.5) 2,807.1
• Operating costs (2,746.3) 299.9 (2,446.4) (2,512.4) 288.0 (2,224.4)
► Operating margin 646.5 (118.4) 528.1 695.2 (112.5) 582.7
• Maintenance spare parts (46.1) 1.0 (45.1) (46.8) 1.4 (45.4)
• Amortisation and provisions (net) (215.8) 16.6 (199.2) (261.4) 22.9 (238.5)
• Other operating income / expenses (33.2) - (33.2) (15.6) 0.8 (14.8)
► EBIT before impairment charge 351.4 (100.8) 250.6 371.4 (87.4) 284.0
• Net impairment charge (1) 1.7 - 1.7 (13.9) - (13.9)
► EBIT after impairment charge 353.1 (100.8) 252.3 357.5 (87.4) 270.1
RECONCILIATION BETWEEN ADJUSTED FIGURES AND IFRS FIGURES – PROFIT & LOSS
51
(1) Including impairment charge on net assets of companies under joint control.
2016 2015
In million Euros Adjusted
Impact of
companies
under joint
control
IFRS Adjusted
Impact of
companies
under joint
control
IFRS
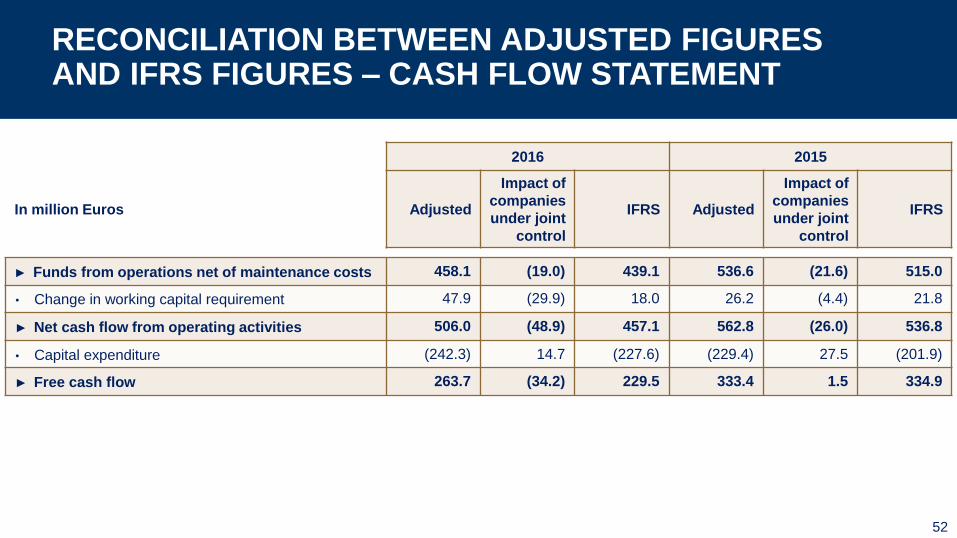
► Funds from operations net of maintenance costs 458.1 (19.0) 439.1 536.6 (21.6) 515.0
• Change in working capital requirement 47.9 (29.9) 18.0 26.2 (4.4) 21.8
► Net cash flow from operating activities 506.0 (48.9) 457.1 562.8 (26.0) 536.8
• Capital expenditure (242.3) 14.7 (227.6) (229.4) 27.5 (201.9)
► Free cash flow 263.7 (34.2) 229.5 333.4 1.5 334.9
RECONCILIATION BETWEEN ADJUSTED FIGURES AND IFRS FIGURES – CASH FLOW STATEMENT
52
FINANCIAL DEFINITIONS
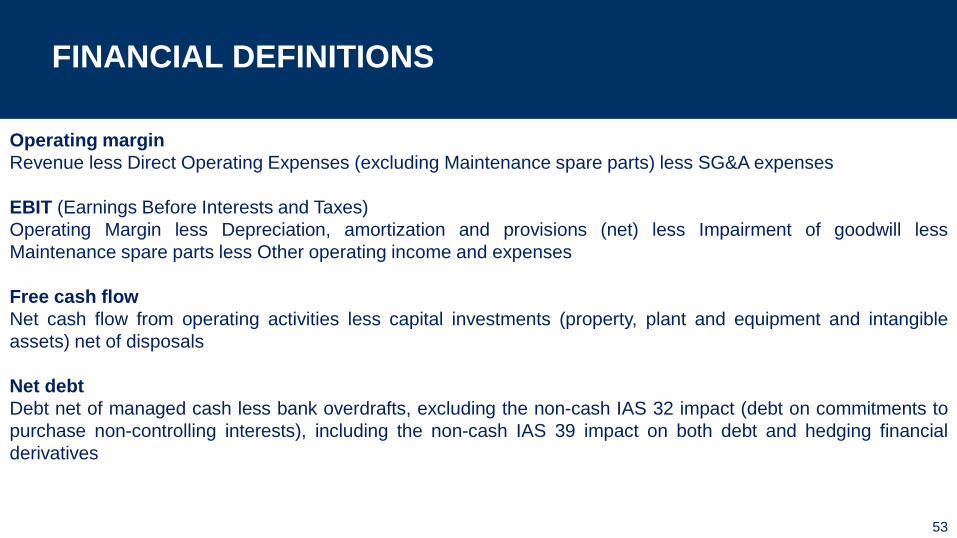
Operating margin
Revenue less Direct Operating Expenses (excluding Maintenance spare parts) less SG&A expenses
EBIT (Earnings Before Interests and Taxes)
Operating Margin less Depreciation, amortization and provisions (net) less Impairment of goodwill less
Maintenance spare parts less Other operating income and expenses
Free cash flow
Net cash flow from operating activities less capital investments (property, plant and equipment and intangible
assets) net of disposals
Net debt
Debt net of managed cash less bank overdrafts, excluding the non-cash IAS 32 impact (debt on commitments to
purchase non-controlling interests), including the non-cash IAS 39 impact on both debt and hedging financial
derivatives
53
FORWARD LOOKING STATEMENTS
This presentation may contain some forward-looking statements. These statements are
not undertakings as to the future performance of the Company. Although the Company
considers that such statements are based on reasonable expectations and assumptions
on the date of publication of this release, they are by their nature subject to risks and
uncertainties which could cause actual performance to differ from those indicated or
implied in such statements.
These risks and uncertainties include without limitation the risk factors that are described
in the annual report registered in France with the French Autorité des Marchés
Financiers.
Investors and holders of shares of the Company may obtain copy of such annual report
by contacting the Autorité des Marchés Financiers on its website www.amf-france.org or
directly on the Company website www.jcdecaux.com.
The Company does not have the obligation and undertakes no obligation to update or
revise any of the forward-looking statements.54