Embed Size (px)
Citation preview

Six years of operating experience with DryFiningTMfuel enhancement process
Sandra Broekema, Una Nowling, and Nenad Sarunac14 December 2016
1

Upgrading 1000 TPH lignite since 12/2009 Dries fuel from 38 down to 30 percent moisture by weight HHV increase 6200 to 6800 Btu/lb Net plant heat rate gain of 4.5% Emission reductions:
► SO2 by >40%► Mercury by 35 to 40%► NOx by 20% to 30%► CO2 by 4%
Coal Creek Station – 2 x 600 MW
Dryer house
Coal Creek Station
2

DryFining mass balance illustration
DryFine
3 3

• Coal is crushed to ¼ inch minus and fed to the first stage of the FBDThe DryFining process: Stage 1
4 4
1st Stage
Dust Collector
Dust Collector Fan
ScrubbingBox
2nd Stage
Feed Stream(Crushed Wet Coal ) Dilution Air
Product Stream
Auger
Segregation Stream
3rd Stage
3 rd StageFluidizing Air (Cold PA)
1 st and 2 nd Stage Fluidizing Air (Heated Cold PA)
Moist Fluidizing Air & Elutriated FinesScrewFeeder

• Coal is dried in a fluidized bed using low-grade waste heat from the power station
The DryFining process: Stage 2
5 5
1st Stage
Dust Collector
Dust Collector Fan
ScrubbingBox
2nd Stage
Feed Stream(Crushed Wet Coal ) Dilution Air
Product Stream
Auger
Segregation Stream
3rd Stage
3 rd StageFluidizing Air (Cold PA)
1 st and 2 nd Stage Fluidizing Air (Heated Cold PA)
Moist Fluidizing Air & Elutriated FinesScrewFeeder

• Dried coal is cooled slightly in the third stage before delivery to the product coal belt and silosThe DryFining process: Stage 3
6
1st Stage
Dust Collector
Dust Collector Fan
ScrubbingBox
2nd Stage
Feed Stream(Crushed Wet Coal ) Dilution Air
Product Stream
Auger
Segregation Stream
3rd Stage
3 rd StageFluidizing Air (Cold PA)
1 st and 2 nd Stage Fluidizing Air (Heated Cold PA)
Moist Fluidizing Air & Elutriated FinesScrewFeeder
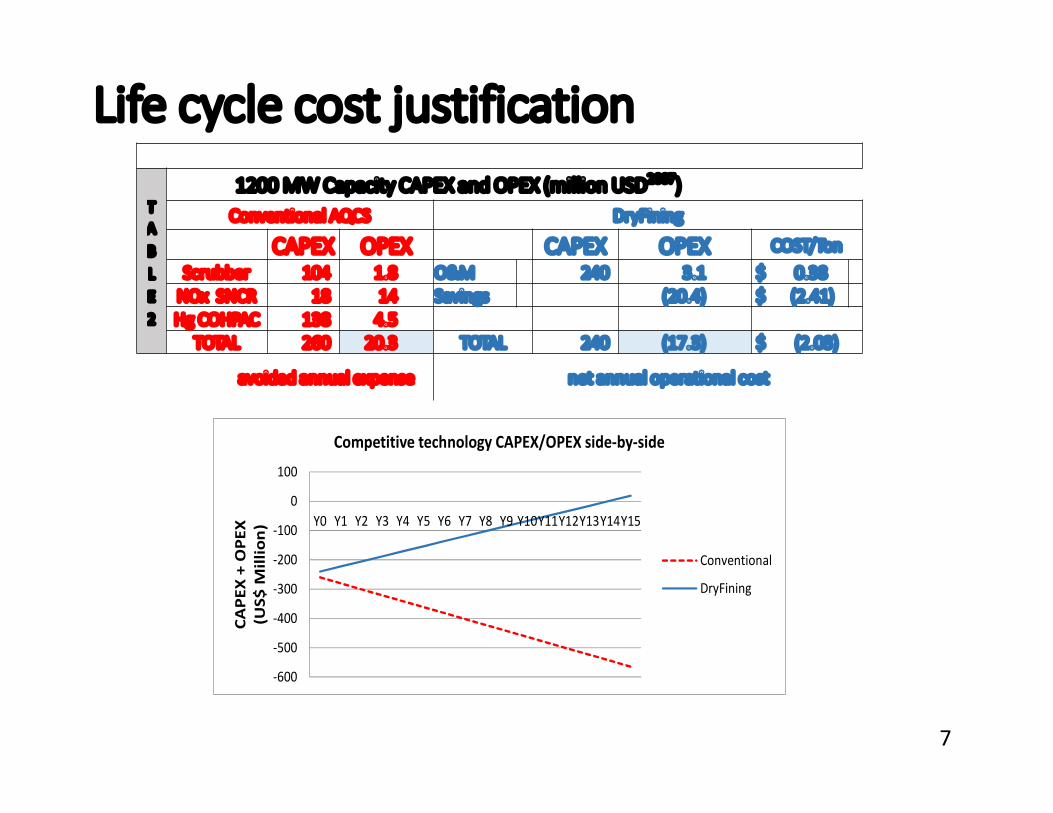
-600-500-400-300-200-100
0100
Y0 Y1 Y2 Y3 Y4 Y5 Y6 Y7 Y8 Y9 Y10Y11Y12Y13Y14Y15
CAPEX
+ OPEX
(US
$ Millio
n)
Competitive technology CAPEX/OPEX side-by-side
ConventionalDryFining
Life cycle cost justification
7
TABLE2
1200 MW Capacity CAPEX and OPEX (million USD2007) Conventional AQCS DryFining
CAPEX OPEX CAPEX OPEX COST/TonScrubber 104 1.8 O&M 240 3.1 $ 0.38 NOx SNCR 18 14 Savings (20.4) $ (2.41)
Hg COHPAC 138 4.5TOTAL 260 20.3 TOTAL 240 (17.3) $ (2.03)avoided annual expense net annual operational cost
7

Net operational savings per ton of fuel
$(0.08)$(0.18)
$(0.12)$0.09
$0.17 $0.42
$0.53 $0.27 $0.28
$0.65 $2.03
$(0.50) $- $0.50 $1.00 $1.50 $2.00 $2.50
Reduced HgReduced NOXReduced SO2Reduced CO2
Reduce Fan & Mill PowerReduced Maintenance
Fuel SavingsNet Savings
DryFining Net Savings USD/Ton
DryFining PowerDryFining LaborDryFining Parts
8 8

•Reduced coal flow through the power block•Reduced flue gas production•Increased boiler efficiency•Reduced auxiliary power consumption•Improved net plant heat rate•Improved emissions control performance•Reduced carbon intensity
Benefits of advanced beneficiation
9

EPRI VISTA conceptual case studies
10

• A 665 MW (gross) sub-critical boiler, designed for NAPP/CAPP coal, currently burning 30 percent PRB coal• Estimated 180 MW derate if 100 percent PRB was burned
• Due to mill grinding and mill drying capability, both directly impacted by the coal moisture content• Modeled PRB coal moisture reduction from 23.9 percent to 15.9 percent via DryFining• Result: 59 MW derate with 100 percent PRB, gain 121 MW• Goals:
• Estimate O&M cost differences• Estimate maximum PRB coal use potential
Case study 1: 665 MW PRB retrofit
11

Case study 1: estimated CAPEX
12
Estimated CAPEX for DryFining retrofit of 665 MW PRB DryFining modules including fluidizing air fans, internal heating coils, dust collector & stub stack $9,000,000 External heat exchangers $2,250,000 Controls $1,000,000 Air Jig $187,500 Crusher $495,000 Sub-total equipment (FOB factory) $12,932,500 Installation (80% factor) $10,346,000 Engineering, License & Contingency $10,223,663 Total installed cost (+/- 30%) $33,500,000

Case study 1: O&M cost savings
13
Potential O&M cost reductions for 665 MW Retrofit PRB Power Station Impacts Reduced annual coal burn (tonnes per year) 202,440 Reduced auxiliary power/station service (GWh/year) 8.72 Improved unit availability (GWh/year) 34.51 Recovered unit capacity (GWh/year) 427.33 Cost impacts (replacement generation cost of $30/MWh and delivered coal cost of $62/tonne) Differential annual maintenance $162,000 Differential annual coal burn rate $12,551,280 Differential annual auxiliary power $261,600 Improved annual unit availability $1,035,300 Recovered annual unit capacity $12,819,900 Total annual savings $26,830,080

• Greater NPHR benefit as the PRB blend percentage increasesCoal blend sensitivity - NPHR
14

• Spray flow was reduced for both main and reheat steam, as PRB content increased
Coal blend – steam generator impacts
15

• Mill equivalent forced outage hours decreased significantly with dried PRB use, due to reduced fuel burn rate and reduced moisture content.
Coal blend sensitivity – mill EFOR
16

• Dried PRB use could be increased to 60% by mass without any derate. Additional generation was possible at all blend levels over 30%
Coal blend sensitivity – derate risk
17

• Annual CO2 emissions were reduced due to heat rate improvement.
Coal blend sensitivity – CO2 emissions
18

• A 860 MW (gross) reference plant operating on Indonesian WARA• Modelled Indonesian WARA coal moisture reduction from 40 percent to 25 percent using using Proates (boiler) and EbsilonProfessional (steam turbine cycle) • Goals:
• Thermal integration to estimate moisture removal achievable• Calculate net unit efficiency across various power cycles• Estimate impact on new build CAPEX with and without DryFining
Case study 2: 860 MW reference plant
19

Properties of selected coalsCoal Units ND lignite
Sub-bituminous(Wyoming PRB)Bituminous (hard) coal (Illinois No.6)
Indonesian (Wara)German brown coal (Niederlausitz)
C %, wt 35.68 48.18 63.75 40.20 27.00H %, wt 2.40 3.31 4.50 2.66 1.90S %, wt 1.04 0.37 2.51 0.14 0.80O %, wt 8.53 11.87 6.88 13.58 10.30N %, wt 0.64 0.70 1.12 0.63 0.30H2O %, wt 40.00 30.24 11.12 40.76 55.80Ash %, wt 11.72 5.33 9.99 2.03 3.90HHV Btu/lb 6,147 8,340 11,670 6,937 4,457LHV Btu/lb 5,603 7,722 11,143 6,269 3,70420

21
Case study 2: HHV vs. coal moisture

Case study 2: Net unit efficiency
33.8
35.6
38.8
41.9
36.6
38.6
41.9
45.3
36.4
38.4
41.8
45.1
3233343536373839404142434445464748
Subcritical Supercritical USC A-USC
Net U
nit Ef
ficien
cy [%
-HHV]
Indonesian Coal: WaraIndonesian, TM=41%Indonesian, TM=35%Indonesian, TM=30%Indonesian, TM=25%Indonesian, TM=20%Indonesian, TM=15%Indonesian, TM=10%Bituminous (Hard), TM=11%
Reference Plant
22

Case study 2: Net unit efficiency
0123456789
101112131415
5 10 15 20 25 30 35 40
Net U
nit Ef
ficien
cy Im
provem
ent [%
-point
, HHV
]
Total Coal Moisture Content, TM [%]
Indonesian Coal: Wara SubcriticalSCUSCA-USCSUBC with ICDSSC with ICDSUSC with ICDSA-USC
ICDS = LT Integrated Coal Drying System
Waste HeatWaste + Process Heat
Reference Plant
23

300
350
400
450
500
550
600
650
5 10 15 20 25 30 35 40
Coal F
low Ra
te [g/
kWh-g
ross]
Total Coal Moisture Content, TM [%]
Supercritical unit using dried Indonesian Wara
Case study 2: Coal flow rate change
ICDS = LT Integrated Coal Drying System
Efficiency improvement
Evaporated Coal Moisture
24
13
2
4

Case study 2: New build economicsA-USC Power Plant:Fuel Powder River Basin (PRB)Overnight Cost $2,933/MWh
1.00
1.05
1.10
1.15
1.20
1.25
5,000 7,000 9,000 11,000 13,000 15,000
Relat
ive Ca
pital C
ost
Coal Heating Value, Btu/lb HHV
EPRI, “MATERIALS FOR ADVANCED ULTRASUPERCRITICAL STEAM TURBINES”Final Technical ReportReporting Period: Oct.1, 2009 - Sep. 30, 2015DOE Cooperative Agreement: DE-FE0000234 Ohio Coal Development Office Grant Agreement: D-05-02(B)
Holt N, G. Booras and D. Todd, The Gasification Technologies Conference, San Francisco, CA 2003.
25
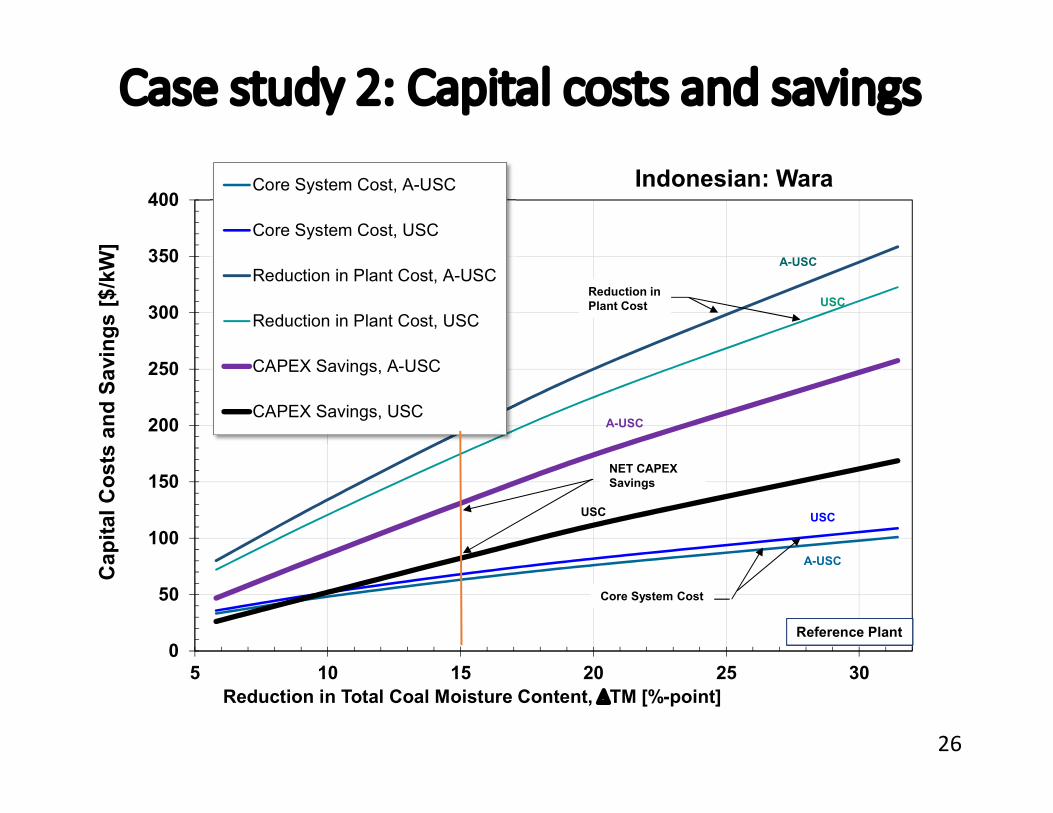
Case study 2: Capital costs and savings
0
50
100
150
200
250
300
350
400
5 10 15 20 25 30
Capit
al Cos
ts an
d Savi
ngs [
$/kW]
Reduction in Total Coal Moisture Content, DTM [%-point]
Indonesian: WaraCore System Cost, A-USCCore System Cost, USCReduction in Plant Cost, A-USCReduction in Plant Cost, USCCAPEX Savings, A-USCCAPEX Savings, USC
NET CAPEX Savings
A-USC
USC
Core System Cost
Reduction inPlant Cost
USC
A-USC
A-USC
USC
Reference Plant
26

Water recovery potential at 60 percent
50
100
150
200
250
300
350
400
5 10 15 20 25 30 35
Evap
orated
Coal M
oistur
e [klb
/hr]
Total Coal Moisture Content, TM [%]
Indonesian: WaraSubcriticalSCUSCA-USCCondensed, SubcriticalCondensed, SCCondensed, USCCondensed, A-USC
27
860 MW Reference Plant
60% Recovery

• Pulverized coal combustion will continue to play a significant role in power generation for the foreseeable future• Higher quality fuels increase efficiency and performance, especially in advanced power cycles • Advanced beneficiation, like DryFining, can deliver cost-effective fuel enhancement providing greater fuel flexibility, derate recovery and efficiency improvement• New construction is ideally suited to optimize the thermal integration to reduce both CAPEX and OPEX
Summary
28
TECHNICAL CONTACTSUna NowlingBlack & VeatchOverland Park, KS USA [email protected]
Nenad SarunacUniversity of North CarolinaCharlotte, NC [email protected]
BUSINESS CONTACTSandra BroekemaGreat River EnergyMinneapolis, MN USA(612) [email protected]
29