Embed Size (px)
Citation preview
April 2018
2017-18 Enrollment Projection Report Public Schools of Brookline, MA
Enrollment Working Group
Enrollment Working Group
1 �
2017-18 Enrollment Projection Report
Public Schools of Brookline, MA
Table of Contents Overview of Report ........................................................................................................... 3
Enrollment Working Group ............................................................................................. 3
Enrollment Projections with a Historic Context ............................................................ 4
Methodology of the Projection ................................................................................................................. 4 Summary of School Buildings .................................................................................................................. 8
School Boundary Assignments ...................................................................................... 15
History of Buffer Zones ........................................................................................................................... 15 Census Data ............................................................................................................................................. 15 Tuition Paying Students ......................................................................................................................... 18 Students Admitted through Grants and State Aid .................................................................................. 21
Enrollment Projection Data .............................................................................................. 23
Ten Year Enrollment Projections .................................................................................. 23
Historical Birth-to-K Progression Rates ........................................................................ 25
Brookline Births per Year .............................................................................................. 26
New Housing/Development Projection Model ............................................................. 27
Additional Charts/Tables ................................................................................................. 29
Enrollment Projections vs. Actual ................................................................................ 29
Kindergarten Births to Kindergarten Enrollment ......................................................... 31
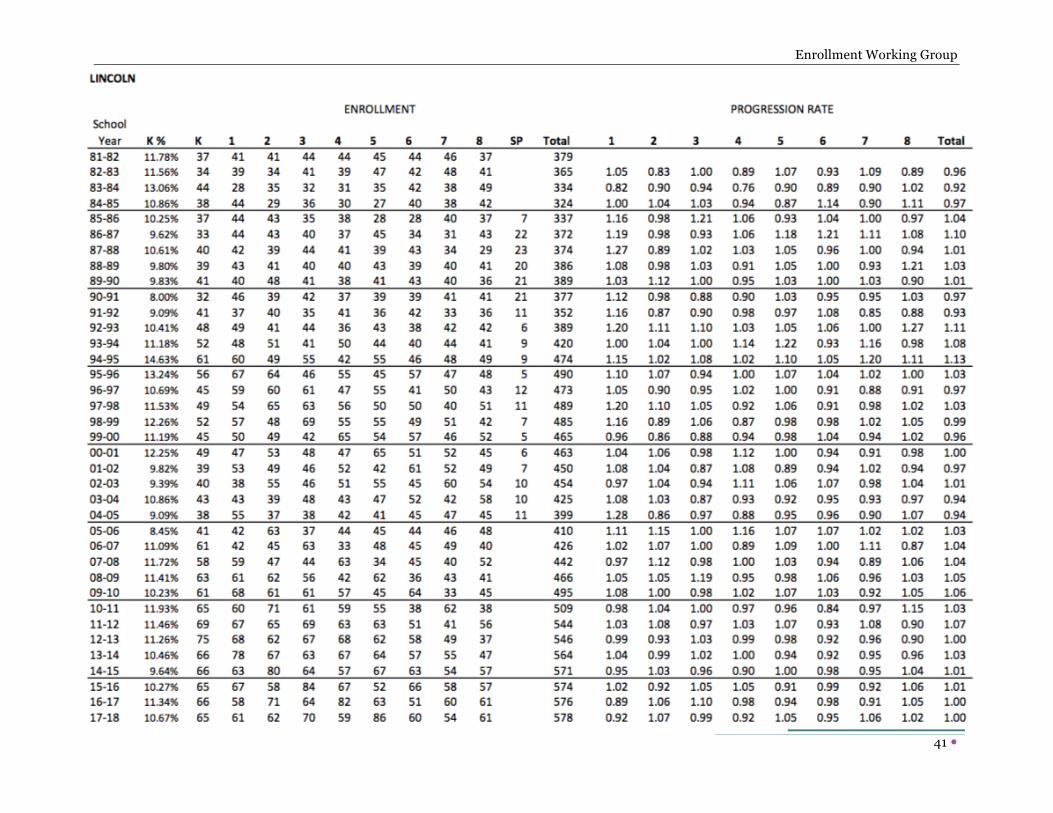
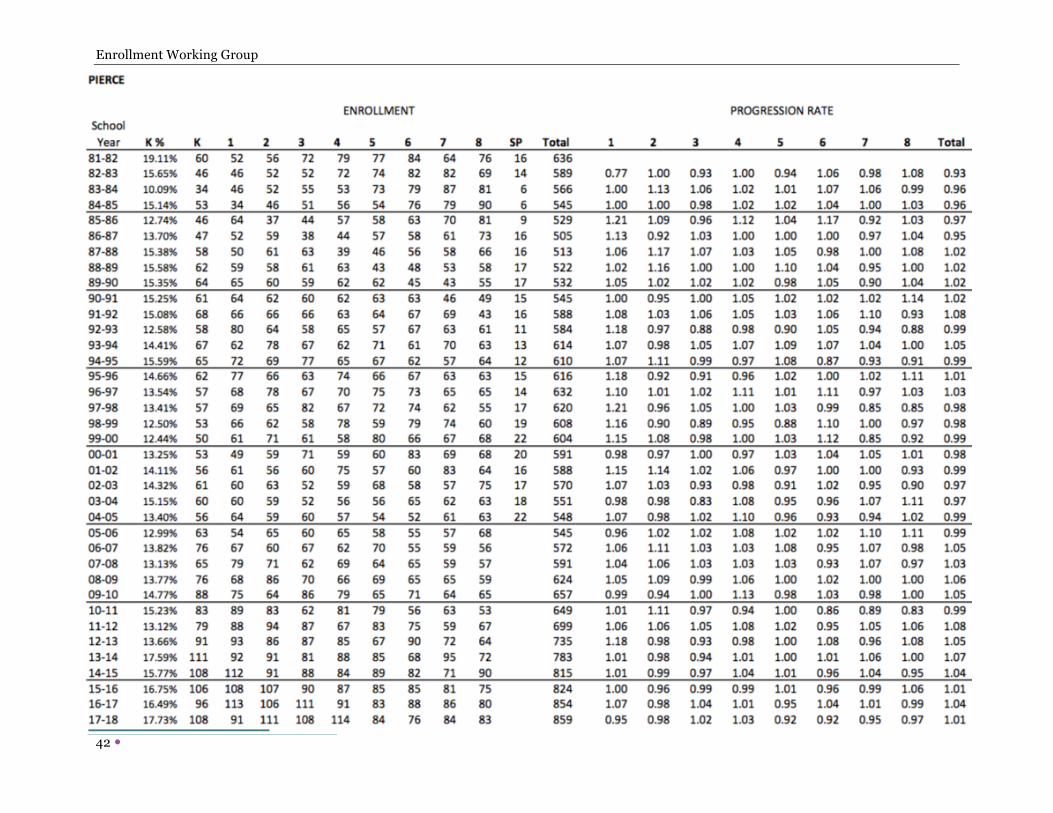
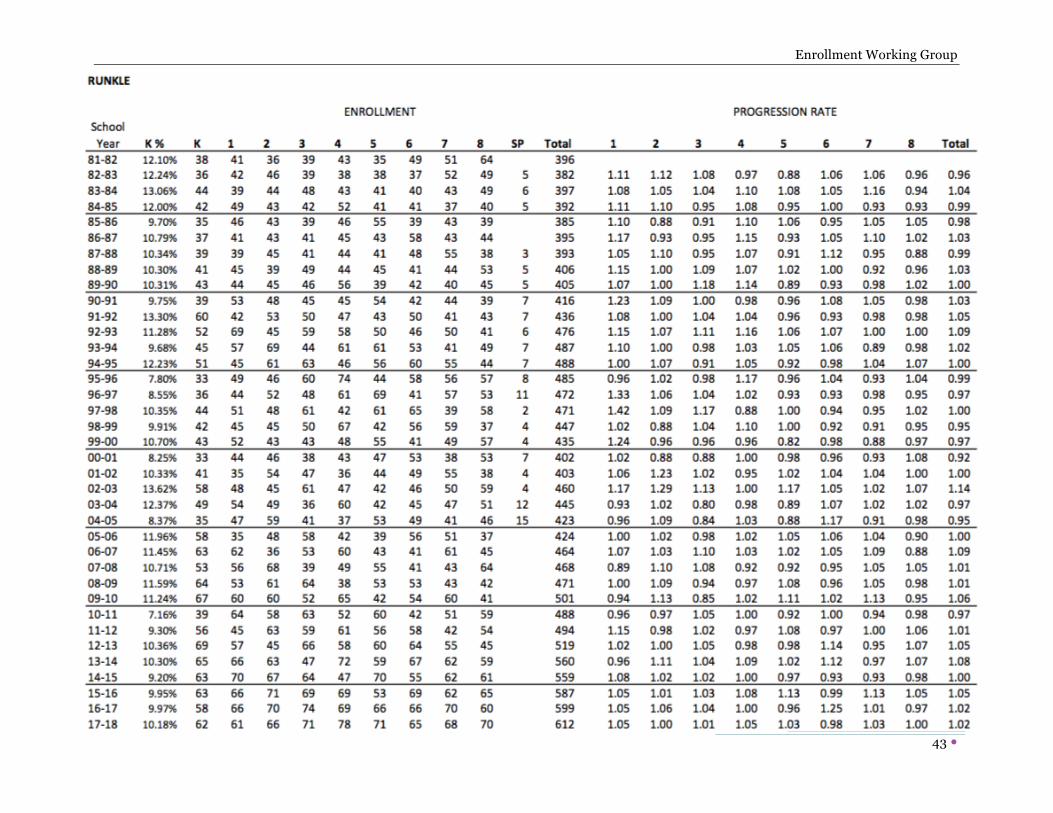
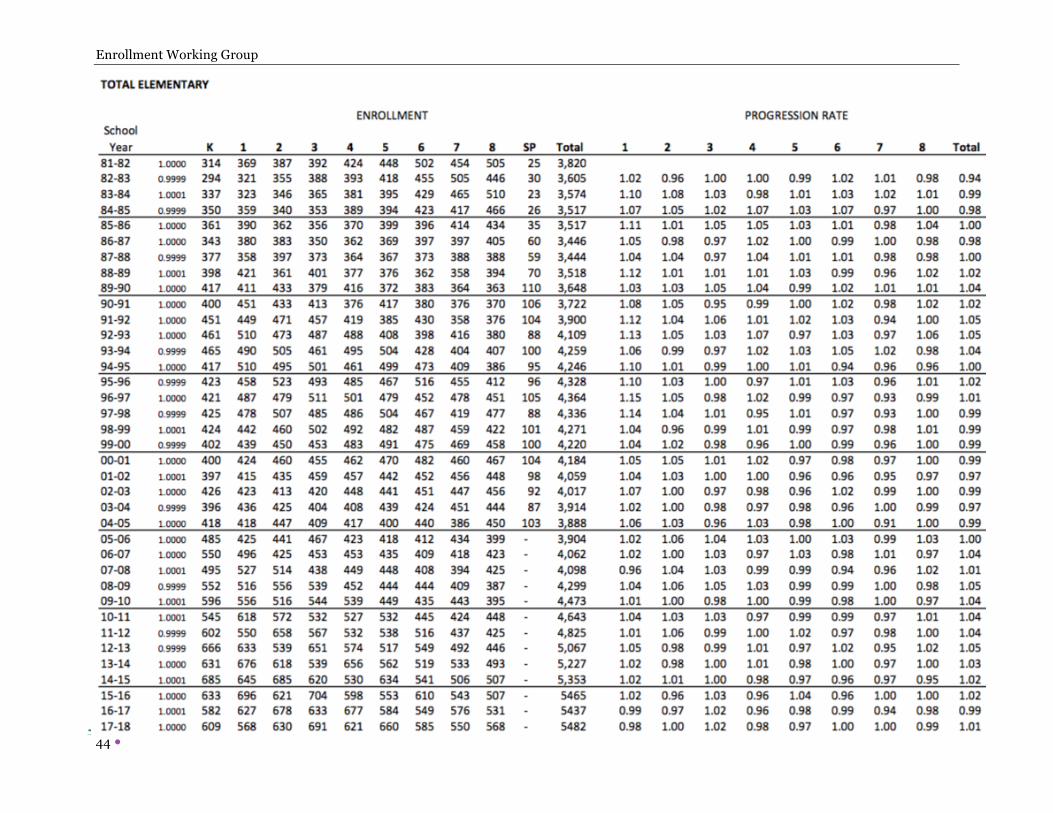
Brookline School Progression Rates: FY 1977- FY 2018 ............................................. 32
Brookline School Enrollment: FY 1977 – FY 2018 ...................................................... 34
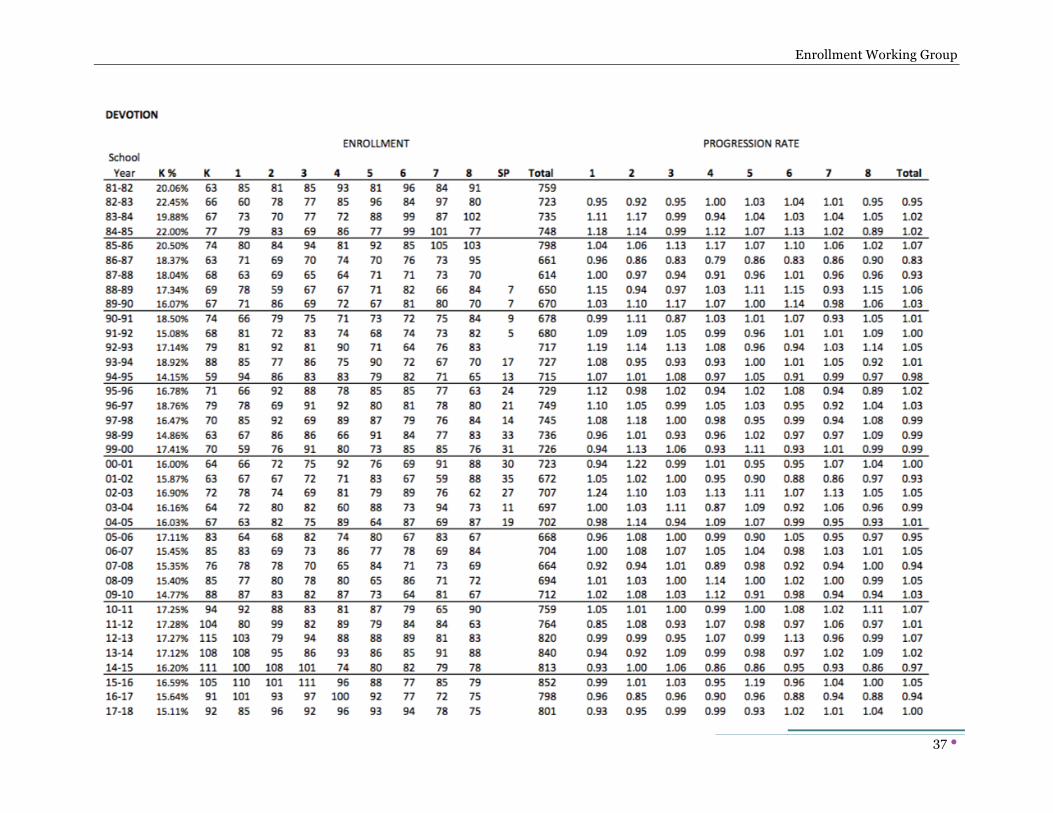
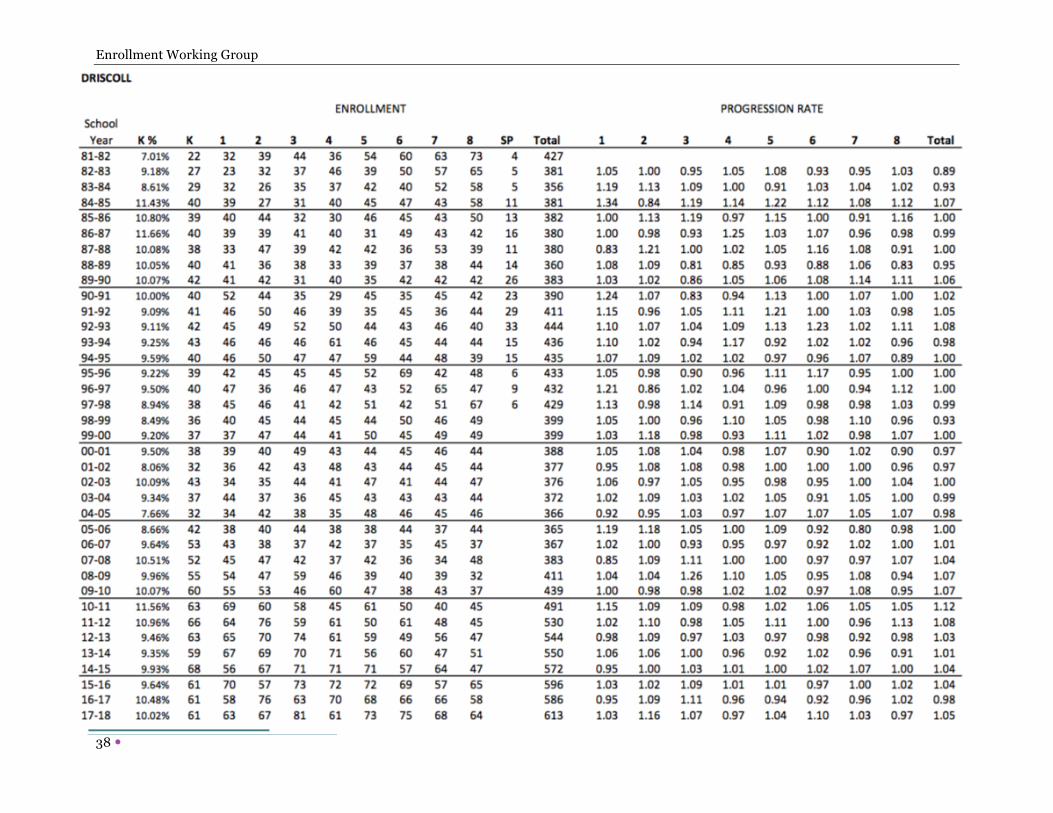
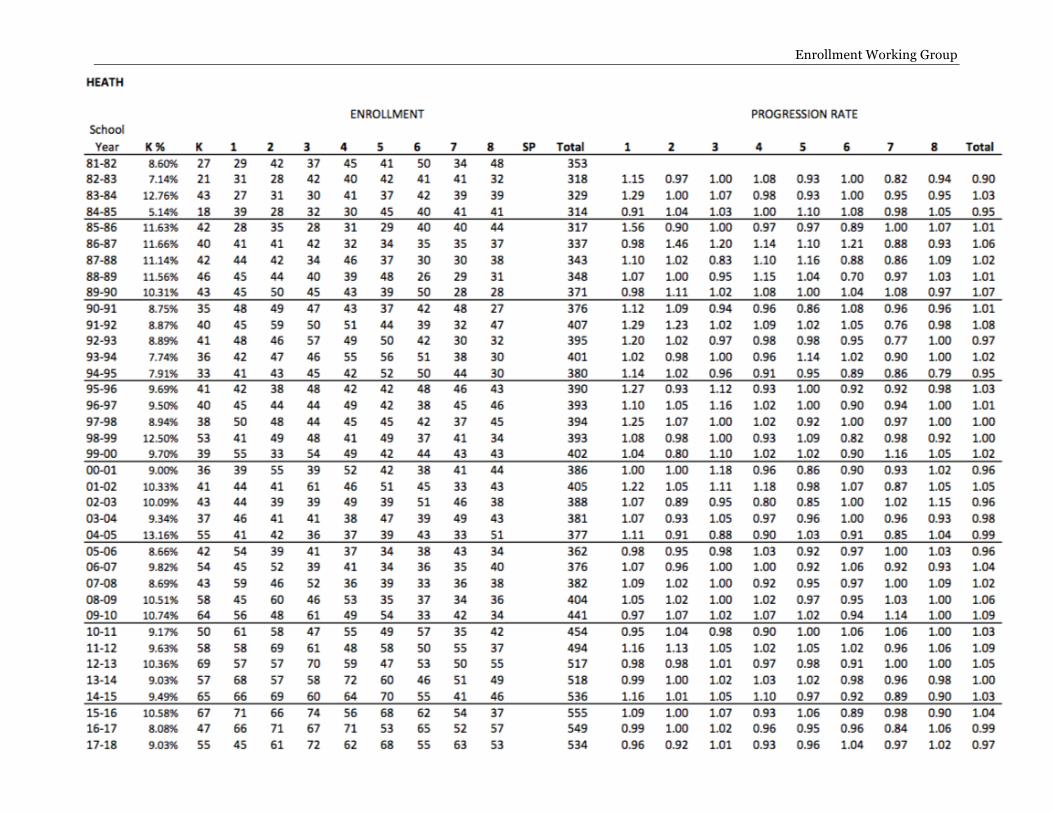
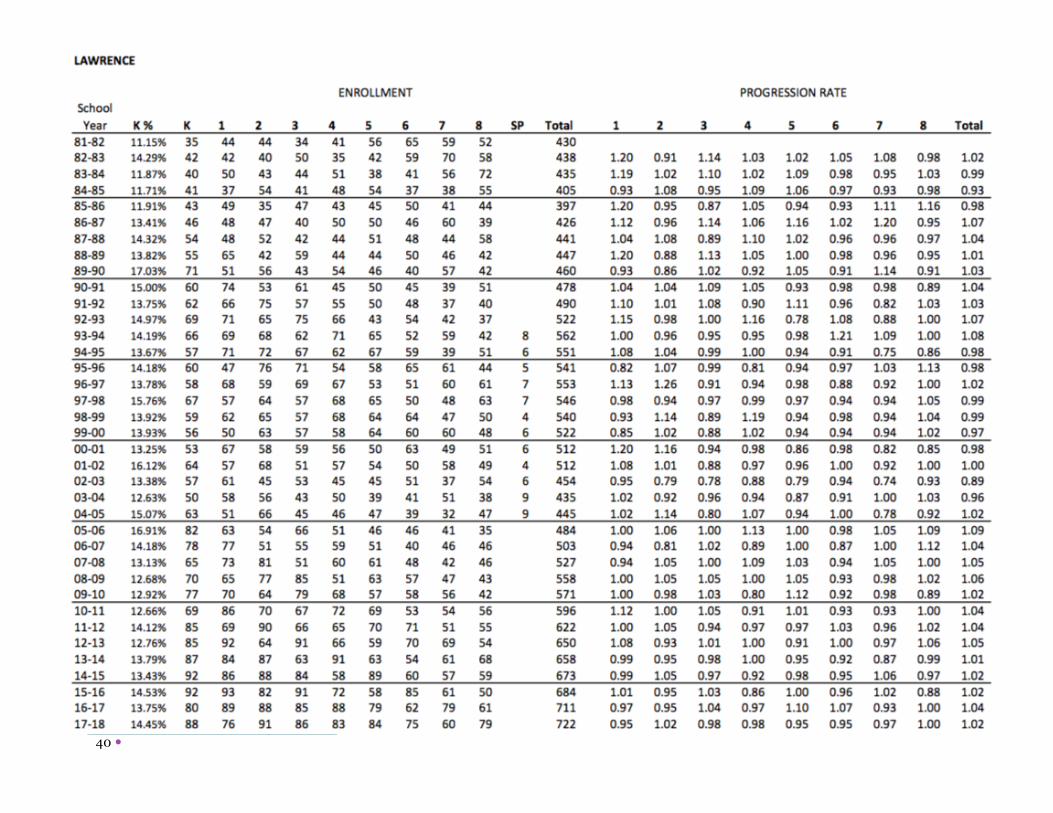
K – 8 Enrollment by School: FY 1977 – FY 2018 ........................................................ 36
K-8 Enrollment Projections by School .......................................................................... 45
Birth and Graduation Years .......................................................................................... 48

Enrollment Working Group
2 �
Residential Zoning & Permitting .................................................................................. 49
Number of Housing Units Stable Since 2000 ........................................................................................ 49 Future Development ............................................................................................................................... 50 Potential Large Development Projects .................................................................................................... 51
Enrollment Working Group
3 �
INTRODUCTION
Overview of Report The 2017 Preliminary Enrollment Report is the second formal enrollment report generated by the Public Schools of Brookline under a staff Enrollment Working Group set up by the Superintendent of Schools. The goal and purpose of this report is to provide various town planners with student projections as it may relate to their department and for future capital improvement and infrastructure planning. The report attempts to be responsive to the many questions and concerns regarding the dramatic enrollment growth that has occurred over the last ten years and is anticipated to continue over the next ten years.
The report and its content will continue to be updated as more information and data becomes available. There are more questions than answers than this report can address. Development of the questions to be answered going forward is ongoing and highlighted at the end of the report. More will be added and reviewed in the future.
Enrollment Working Group The membership of the internal staff working group and contributors to this report includes representatives from the following departments:
School Department Andrew Bott, Superintendent Mary Ellen Dunn, Deputy Superintendent for Administration and Finance Ben Lummis, Special Assistant for Strategy and Performance Erin Cooley, Director of Data Analysis & Information Management Charles Chang, Manager of Data Systems and Applications Janice McHugh, Administrative Assistant formerly to the Superintendent Ruth Quinn Berdell, Consultant/Demographer Matt Gillis, Director of Operations
Additional Advisors Assessor’s Department
Gary McCabe, Chief Assessor Hinlan Wong, Assistant Assessor/Data Specialist
Town Information Technology Jed Fehrenbach, GIS Administrator
Planning and Community Development Kara Brewton, Economic Development Director Evan Lehrer, Economic Development and Long-Term Planner
Enrollment Working Group
4 �
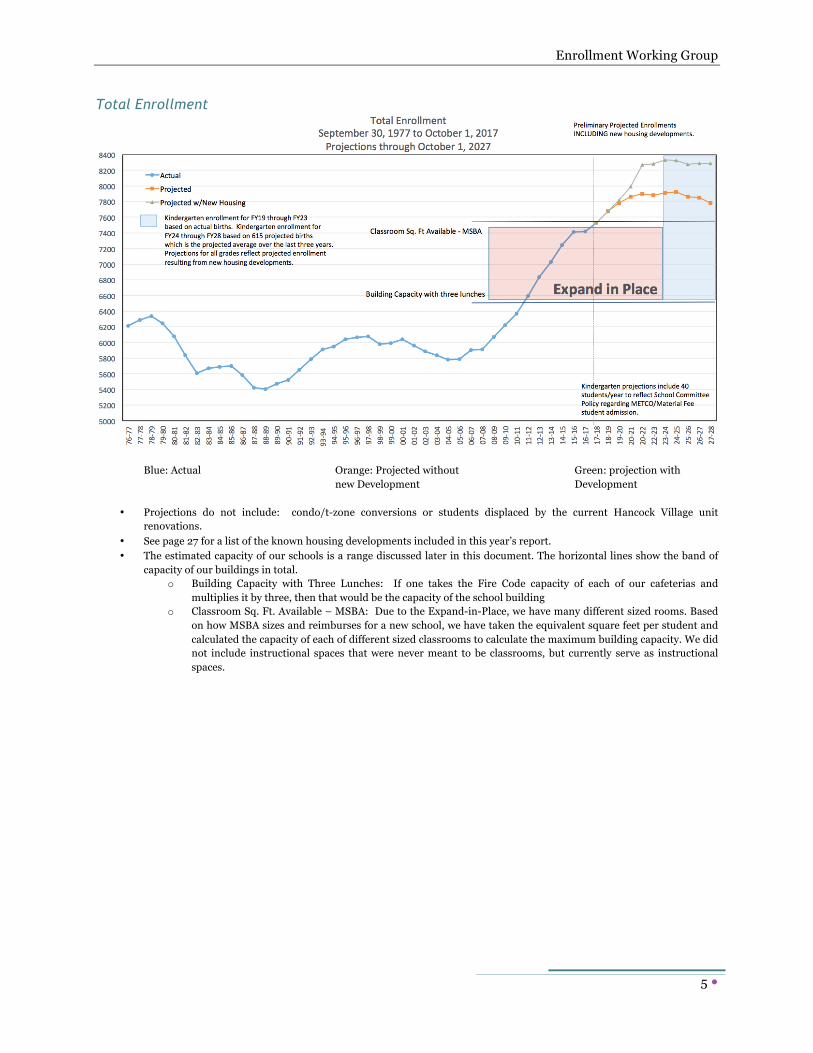
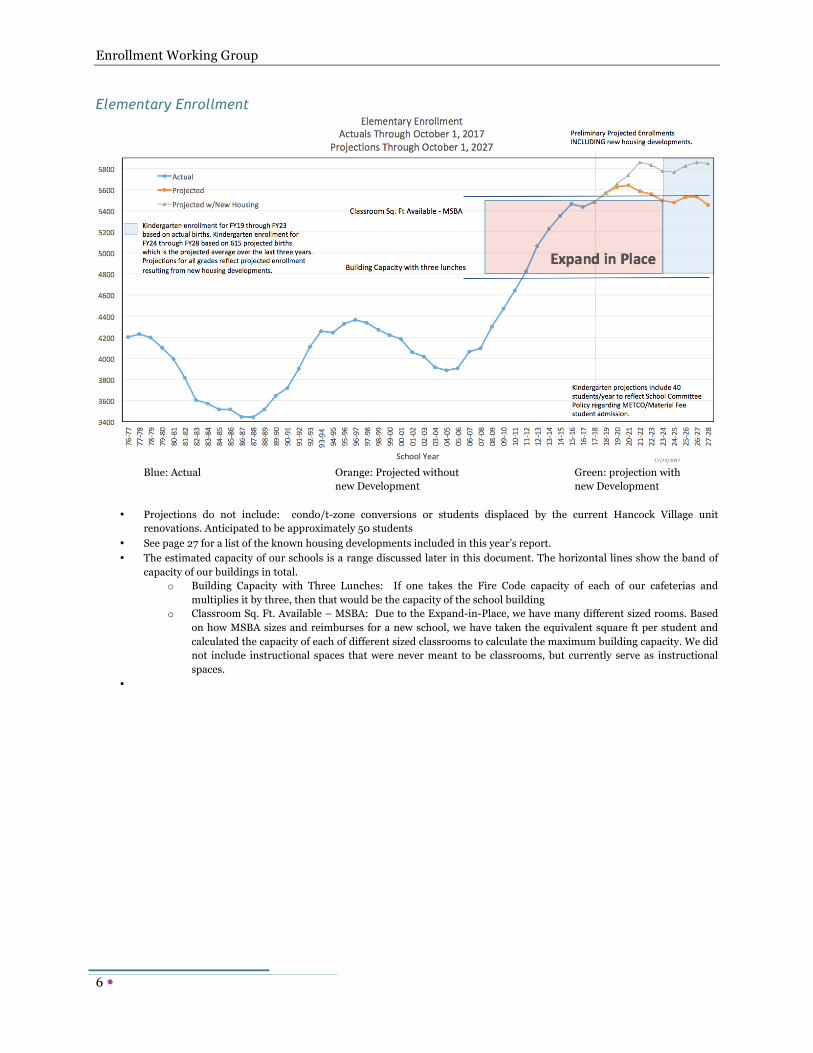
Enrollment Projections with a Historic Context The enrollment history charts below show the enrollment projection over time. The two projections show enrollment with and without new development. These charts use actual PSB enrollment from the 1977-78 School Year through October 1, 2017. Projected enrollments go through October 1, 2027.
The Enrollment Projection without new development (orange) shows a three-year average of births and the five-year progression rate (cohort survival rate). 2027-2028 begins to show the impact of a flat, estimated birth rate (615). Combining an estimated birth rate that is flat and a five-year progression rate results in a decline that is based in the methodology.
The Enrollment Projection with new development (green) shows a three-year average of births and an adjustment to the five-year progression rate due to new housing units being added to the current population. The methodology for this projection is included later in the report.
The gap between the enrollment with and without new development is the area where planning needs to focus for future program, infrastructure, and physical plant.
Methodology of the Projection The enrollment projection is based on an established birth to cohort survival rate, using progression rates that are recalculated each year. The Birth to Kindergarten Progression Rates are derived by comparing current Kindergarten enrollment to the total of births to mothers residing in the Town of Brookline. It is the net of new residents to the town, individuals moving out of town, children attending private school, and children with a delayed entry into Kindergarten. Progression Rates for all other grades, are derived by comparing the grade enrollment with the corresponding cohort from the prior year; it is the net of in-and out-migration of students and grade retention.
All of the data and assumptions are included and highlighted at various places within the report. The projection includes the METCO and Materials Fee students in two places. The primary place they are included is in the cohort survival progression rate as they are in the FY 18 Actual Enrollment per grade and are part of how the progression rate is calculated. In addition 40 students are included in the new Kindergarten projection for FY19 (an average of 20 for METCO and 20 for Materials Fee). No other students are added in any other grade level or year as the mobility rate of student in and out of grades is captured in the calculation of the progression rate. The METCO and Materials Fee programs are not increased as part of this projection. METCO remains at 300 and the Materials Fee program remains at approximately under 200.
The report also includes a projection of students anticipated from new housing developments. The model under development is comparing recent or similar properties as the ones being proposed with the district student information over the last three years to see what correlation can be made for number of students and potential grade level.
The report does not include any projection or estimate for Condo/T-Zone residential conversions that are permitted through the Building Department. A separate study and analysis will need to be conducted outside of this projection and report. The projection also does not include students that have been displaced with the 2015-2018 refurbishment and updates to existing units at Hancock Village in the Baker district. This is estimated to be approximately 50 students per year, but is unknown due to the mobility of families in the complex.
Enrollment Working Group
5 �
Total Enrollment
Blue: Actual Orange: Projected without Green: projection with new Development Development
• Projections do not include: condo/t-zone conversions or students displaced by the current Hancock Village unit renovations.
• See page 27 for a list of the known housing developments included in this year’s report. • The estimated capacity of our schools is a range discussed later in this document. The horizontal lines show the band of
capacity of our buildings in total. o Building Capacity with Three Lunches: If one takes the Fire Code capacity of each of our cafeterias and
multiplies it by three, then that would be the capacity of the school building o Classroom Sq. Ft. Available – MSBA: Due to the Expand-in-Place, we have many different sized rooms. Based
on how MSBA sizes and reimburses for a new school, we have taken the equivalent square feet per student and calculated the capacity of each of different sized classrooms to calculate the maximum building capacity. We did not include instructional spaces that were never meant to be classrooms, but currently serve as instructional spaces.
Enrollment Working Group
6 �
Elementary Enrollment
Blue: Actual Orange: Projected without Green: projection with
new Development new Development
• Projections do not include: condo/t-zone conversions or students displaced by the current Hancock Village unit renovations. Anticipated to be approximately 50 students
• See page 27 for a list of the known housing developments included in this year’s report. • The estimated capacity of our schools is a range discussed later in this document. The horizontal lines show the band of
capacity of our buildings in total. o Building Capacity with Three Lunches: If one takes the Fire Code capacity of each of our cafeterias and
multiplies it by three, then that would be the capacity of the school building o Classroom Sq. Ft. Available – MSBA: Due to the Expand-in-Place, we have many different sized rooms. Based
on how MSBA sizes and reimburses for a new school, we have taken the equivalent square ft per student and calculated the capacity of each of different sized classrooms to calculate the maximum building capacity. We did not include instructional spaces that were never meant to be classrooms, but currently serve as instructional spaces.
•
Enrollment Working Group
7 �
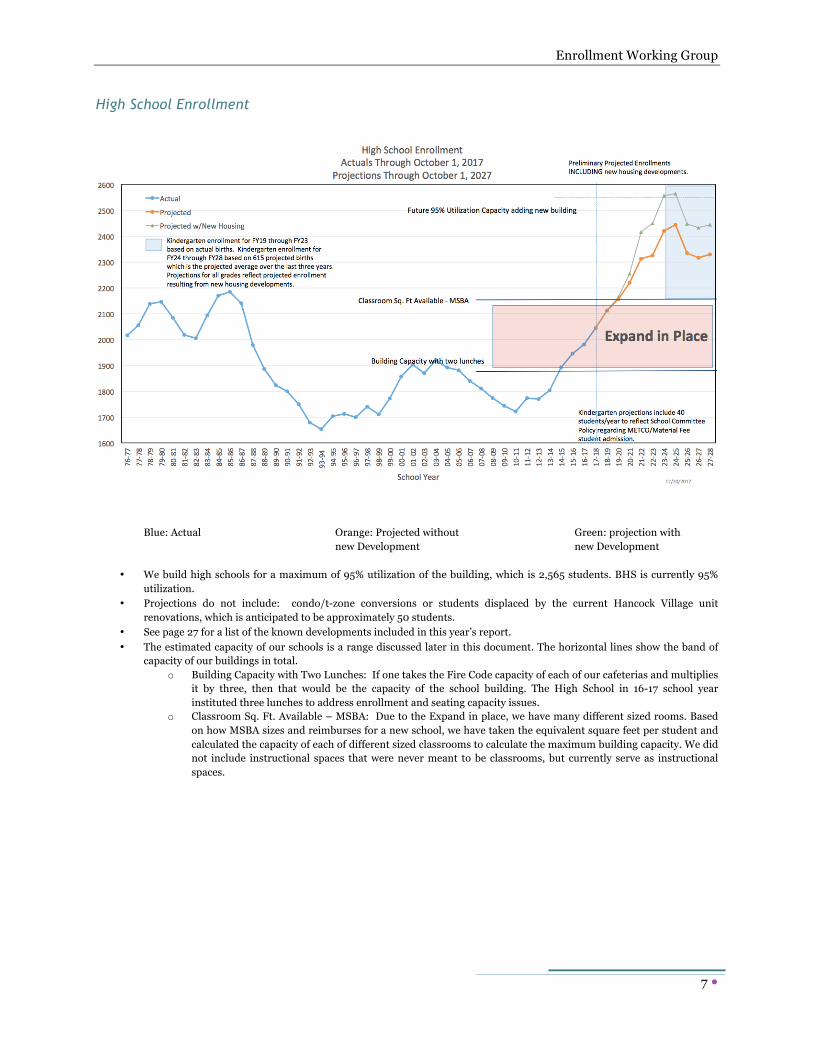
High School Enrollment
Blue: Actual Orange: Projected without Green: projection with new Development new Development
• We build high schools for a maximum of 95% utilization of the building, which is 2,565 students. BHS is currently 95% utilization.
• Projections do not include: condo/t-zone conversions or students displaced by the current Hancock Village unit renovations, which is anticipated to be approximately 50 students.
• See page 27 for a list of the known developments included in this year’s report. • The estimated capacity of our schools is a range discussed later in this document. The horizontal lines show the band of
capacity of our buildings in total. o Building Capacity with Two Lunches: If one takes the Fire Code capacity of each of our cafeterias and multiplies
it by three, then that would be the capacity of the school building. The High School in 16-17 school year instituted three lunches to address enrollment and seating capacity issues.
o Classroom Sq. Ft. Available – MSBA: Due to the Expand in place, we have many different sized rooms. Based on how MSBA sizes and reimburses for a new school, we have taken the equivalent square feet per student and calculated the capacity of each of different sized classrooms to calculate the maximum building capacity. We did not include instructional spaces that were never meant to be classrooms, but currently serve as instructional spaces.
Enrollment Working Group
8 �
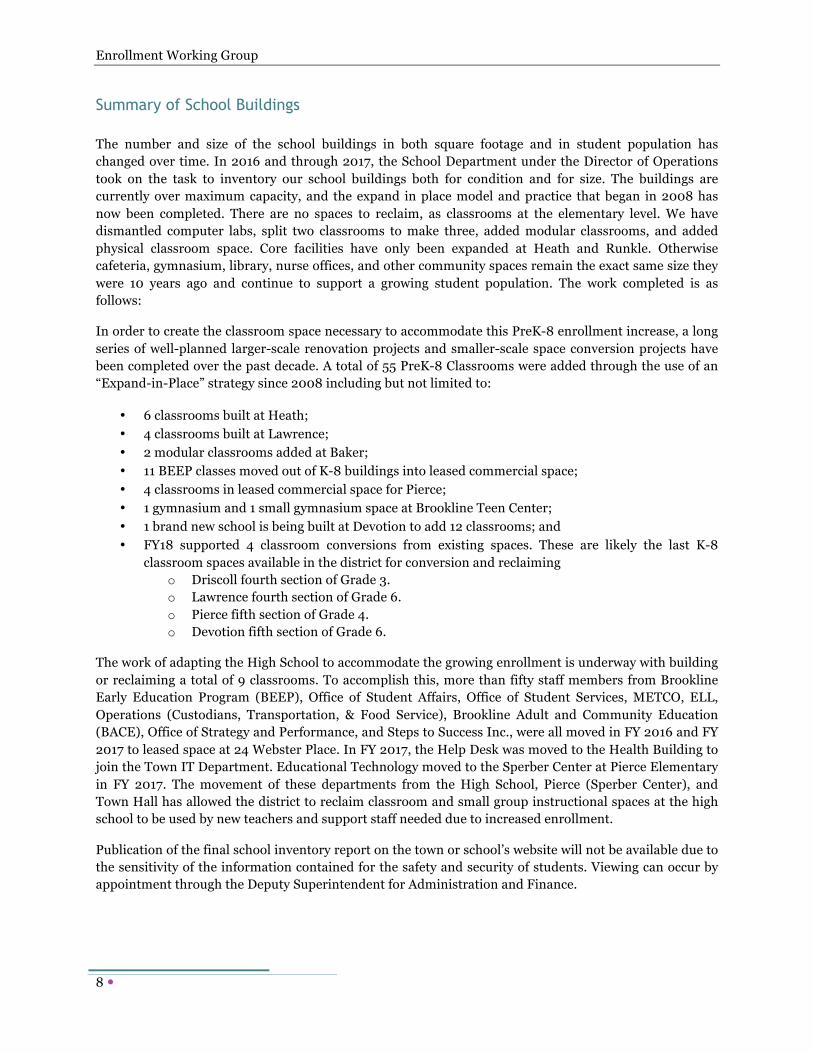
Summary of School Buildings The number and size of the school buildings in both square footage and in student population has changed over time. In 2016 and through 2017, the School Department under the Director of Operations took on the task to inventory our school buildings both for condition and for size. The buildings are currently over maximum capacity, and the expand in place model and practice that began in 2008 has now been completed. There are no spaces to reclaim, as classrooms at the elementary level. We have dismantled computer labs, split two classrooms to make three, added modular classrooms, and added physical classroom space. Core facilities have only been expanded at Heath and Runkle. Otherwise cafeteria, gymnasium, library, nurse offices, and other community spaces remain the exact same size they were 10 years ago and continue to support a growing student population. The work completed is as follows:
In order to create the classroom space necessary to accommodate this PreK-8 enrollment increase, a long series of well-planned larger-scale renovation projects and smaller-scale space conversion projects have been completed over the past decade. A total of 55 PreK-8 Classrooms were added through the use of an “Expand-in-Place” strategy since 2008 including but not limited to:
• 6 classrooms built at Heath; • 4 classrooms built at Lawrence; • 2 modular classrooms added at Baker; • 11 BEEP classes moved out of K-8 buildings into leased commercial space; • 4 classrooms in leased commercial space for Pierce; • 1 gymnasium and 1 small gymnasium space at Brookline Teen Center; • 1 brand new school is being built at Devotion to add 12 classrooms; and • FY18 supported 4 classroom conversions from existing spaces. These are likely the last K-8
classroom spaces available in the district for conversion and reclaiming o Driscoll fourth section of Grade 3. o Lawrence fourth section of Grade 6. o Pierce fifth section of Grade 4. o Devotion fifth section of Grade 6.
The work of adapting the High School to accommodate the growing enrollment is underway with building or reclaiming a total of 9 classrooms. To accomplish this, more than fifty staff members from Brookline Early Education Program (BEEP), Office of Student Affairs, Office of Student Services, METCO, ELL, Operations (Custodians, Transportation, & Food Service), Brookline Adult and Community Education (BACE), Office of Strategy and Performance, and Steps to Success Inc., were all moved in FY 2016 and FY 2017 to leased space at 24 Webster Place. In FY 2017, the Help Desk was moved to the Health Building to join the Town IT Department. Educational Technology moved to the Sperber Center at Pierce Elementary in FY 2017. The movement of these departments from the High School, Pierce (Sperber Center), and Town Hall has allowed the district to reclaim classroom and small group instructional spaces at the high school to be used by new teachers and support staff needed due to increased enrollment.
Publication of the final school inventory report on the town or school’s website will not be available due to the sensitivity of the information contained for the safety and security of students. Viewing can occur by appointment through the Deputy Superintendent for Administration and Finance.

Enrollment Working Group
9 �
School Building Capacity The following charts illustrate the minimum and maximum capacity of our existing 8 elementary schools. The number of PreK-12 Classroom utilized and the changes made over time to address capacity within the existing infrastructure have had impact on the district’s ability to absorb future projected growth and even the population when the projection begins to level off. The estimated capacity of our buildings is below. We show three methodologies as all will work and all provide very different educational experiences to students.
PreK-12 School Building Capacity & Utilization
Building Capacity based on size of Cafeteria: The School Committee, school leadership, and the parent community would prefer to have school lunches occur in three sittings between the hours of 11:30 a.m. and 1:oo p.m. The chart bellows shows the maximum number of students each school could serve in three lunch periods based on its current cafeteria seating capacity. Based on this student capacity, the chart also shows the number of homeroom classes that would exist given an average of 21 students per class. The number of rooms does not include ancillary spaces for special education, ELL, or other district programs. This chart can be in interpreted as the original “right size” of the building, as the Town has not enlarged the common core spaces such as the cafeterias. MSBA requires a Cafeteria space for two lunches but allow for a variance for 3 lunches depending on the total number of students, the size of the cafeteria, or the sections being planned.
School Actual Cafe SF 10/1/17
Cafeteria Seating
Capacity
Capacity w/ 3 Lunches
@ Fire Code
Capacity
Maximum # of Homeroom Classes @ 21 students to be within Lunch Room
Fire Capacity
# of Lunches
Baker 2,980 200 600 29 3 Devotion - (New Construction) 5,100 350 1,050 45 3 Driscoll 3,175 150 450 21 3 Heath 2,753 212 636 30 3 Lawrence 2,200 138 414 20 3 Lincoln 1,967 184 552 26 3 Pierce 3,871 200 600 29 3 Runkle 2,800 186 558 27 3 Total 24,846 1,620 4,860 226 3 10/1/17 Enrollment 24,846 1,620 5,482 268 3
Variance: Open Capacity/(Deficit Capacity) (622)
classrooms (42)
classrooms 0
Enrollment Working Group
10 �
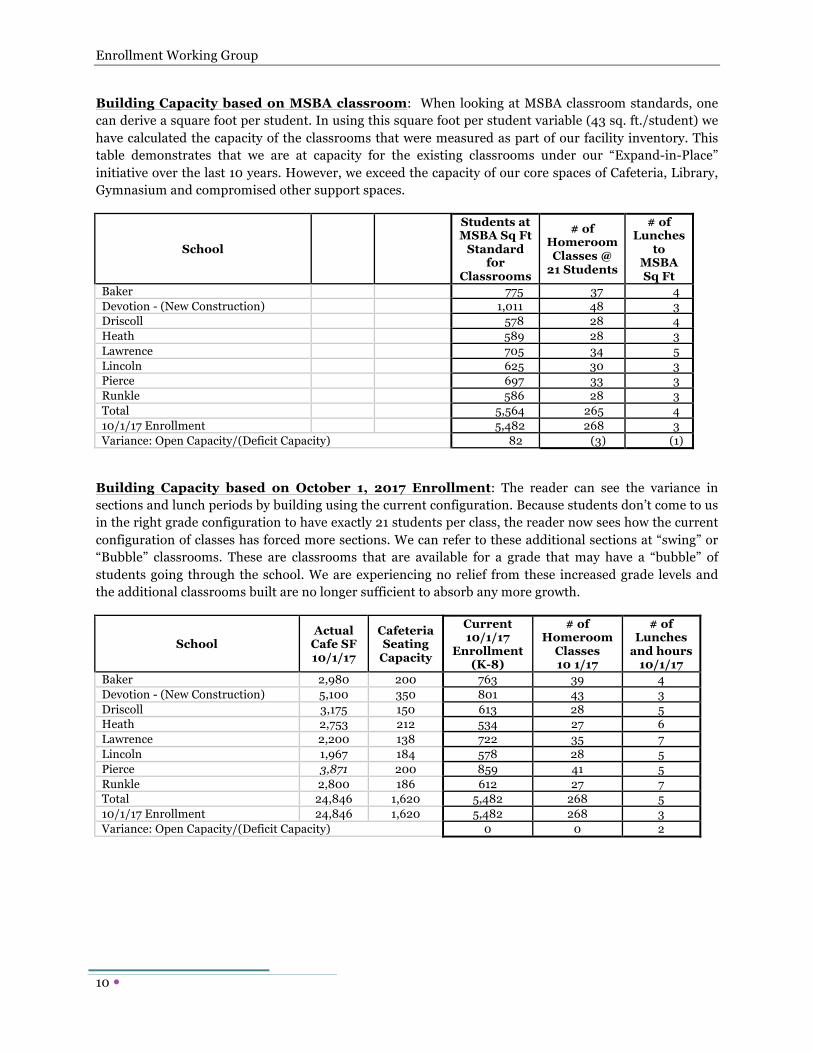
Building Capacity based on MSBA classroom: When looking at MSBA classroom standards, one can derive a square foot per student. In using this square foot per student variable (43 sq. ft./student) we have calculated the capacity of the classrooms that were measured as part of our facility inventory. This table demonstrates that we are at capacity for the existing classrooms under our “Expand-in-Place” initiative over the last 10 years. However, we exceed the capacity of our core spaces of Cafeteria, Library, Gymnasium and compromised other support spaces.
School
Students at MSBA Sq Ft
Standard for
Classrooms
# of Homeroom Classes @
21 Students
# of Lunches
to MSBA Sq Ft
Baker 775 37 4 Devotion - (New Construction) 1,011 48 3 Driscoll 578 28 4 Heath 589 28 3 Lawrence 705 34 5 Lincoln 625 30 3 Pierce 697 33 3 Runkle 586 28 3 Total 5,564 265 4 10/1/17 Enrollment 5,482 268 3 Variance: Open Capacity/(Deficit Capacity) 82 (3) (1)
Building Capacity based on October 1, 2017 Enrollment: The reader can see the variance in sections and lunch periods by building using the current configuration. Because students don’t come to us in the right grade configuration to have exactly 21 students per class, the reader now sees how the current configuration of classes has forced more sections. We can refer to these additional sections at “swing” or “Bubble” classrooms. These are classrooms that are available for a grade that may have a “bubble” of students going through the school. We are experiencing no relief from these increased grade levels and the additional classrooms built are no longer sufficient to absorb any more growth.
School Actual
Cafe SF 10/1/17
Cafeteria Seating
Capacity
Current 10/1/17
Enrollment (K-8)
# of Homeroom
Classes 10 1/17
# of Lunches
and hours 10/1/17
Baker 2,980 200 763 39 4 Devotion - (New Construction) 5,100 350 801 43 3 Driscoll 3,175 150 613 28 5 Heath 2,753 212 534 27 6 Lawrence 2,200 138 722 35 7 Lincoln 1,967 184 578 28 5 Pierce 3,871 200 859 41 5 Runkle 2,800 186 612 27 7 Total 24,846 1,620 5,482 268 5 10/1/17 Enrollment 24,846 1,620 5,482 268 3 Variance: Open Capacity/(Deficit Capacity) 0 0 2
Enrollment Working Group
11 �
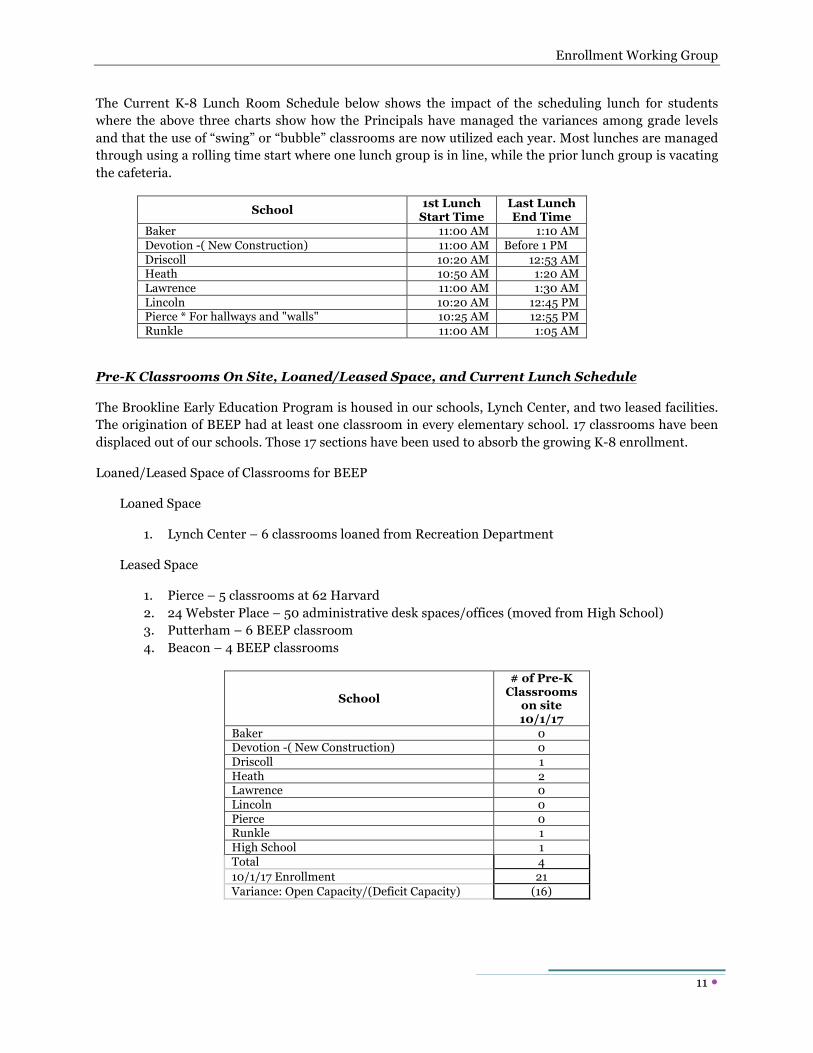
The Current K-8 Lunch Room Schedule below shows the impact of the scheduling lunch for students where the above three charts show how the Principals have managed the variances among grade levels and that the use of “swing” or “bubble” classrooms are now utilized each year. Most lunches are managed through using a rolling time start where one lunch group is in line, while the prior lunch group is vacating the cafeteria.
School 1st Lunch Start Time
Last Lunch End Time
Baker 11:00 AM 1:10 AM Devotion -( New Construction) 11:00 AM Before 1 PM Driscoll 10:20 AM 12:53 AM Heath 10:50 AM 1:20 AM Lawrence 11:00 AM 1:30 AM Lincoln 10:20 AM 12:45 PM Pierce * For hallways and "walls" 10:25 AM 12:55 PM Runkle 11:00 AM 1:05 AM
Pre-K Classrooms On Site, Loaned/Leased Space, and Current Lunch Schedule
The Brookline Early Education Program is housed in our schools, Lynch Center, and two leased facilities. The origination of BEEP had at least one classroom in every elementary school. 17 classrooms have been displaced out of our schools. Those 17 sections have been used to absorb the growing K-8 enrollment.
Loaned/Leased Space of Classrooms for BEEP
Loaned Space
1. Lynch Center – 6 classrooms loaned from Recreation Department
Leased Space
1. Pierce – 5 classrooms at 62 Harvard 2. 24 Webster Place – 50 administrative desk spaces/offices (moved from High School) 3. Putterham – 6 BEEP classroom 4. Beacon – 4 BEEP classrooms
School # of Pre-K
Classrooms on site 10/1/17
Baker 0 Devotion -( New Construction) 0 Driscoll 1 Heath 2 Lawrence 0 Lincoln 0 Pierce 0 Runkle 1 High School 1 Total 4 10/1/17 Enrollment 21 Variance: Open Capacity/(Deficit Capacity) (16)
Enrollment Working Group
12 �
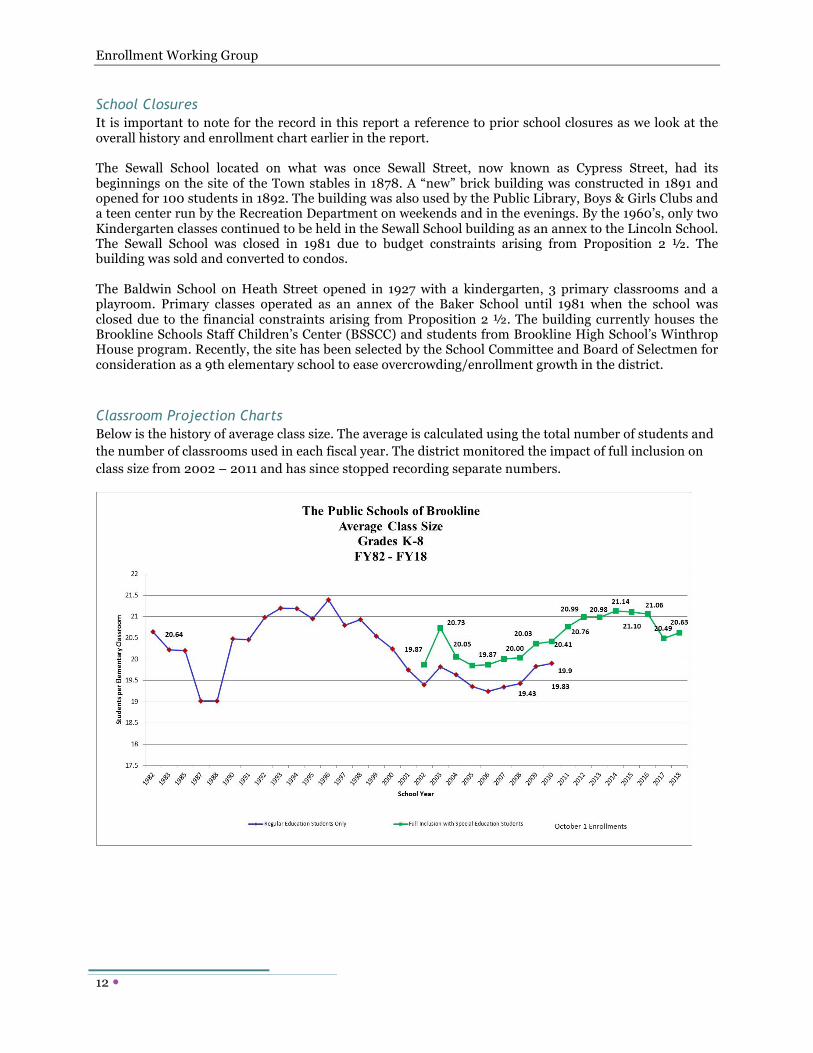
School Closures It is important to note for the record in this report a reference to prior school closures as we look at the overall history and enrollment chart earlier in the report. The Sewall School located on what was once Sewall Street, now known as Cypress Street, had its beginnings on the site of the Town stables in 1878. A “new” brick building was constructed in 1891 and opened for 100 students in 1892. The building was also used by the Public Library, Boys & Girls Clubs and a teen center run by the Recreation Department on weekends and in the evenings. By the 1960’s, only two Kindergarten classes continued to be held in the Sewall School building as an annex to the Lincoln School. The Sewall School was closed in 1981 due to budget constraints arising from Proposition 2 ½. The building was sold and converted to condos. The Baldwin School on Heath Street opened in 1927 with a kindergarten, 3 primary classrooms and a playroom. Primary classes operated as an annex of the Baker School until 1981 when the school was closed due to the financial constraints arising from Proposition 2 ½. The building currently houses the Brookline Schools Staff Children’s Center (BSSCC) and students from Brookline High School’s Winthrop House program. Recently, the site has been selected by the School Committee and Board of Selectmen for consideration as a 9th elementary school to ease overcrowding/enrollment growth in the district. Classroom Projection Charts Below is the history of average class size. The average is calculated using the total number of students and the number of classrooms used in each fiscal year. The district monitored the impact of full inclusion on class size from 2002 – 2011 and has since stopped recording separate numbers.
Enrollment Working Group
13 �
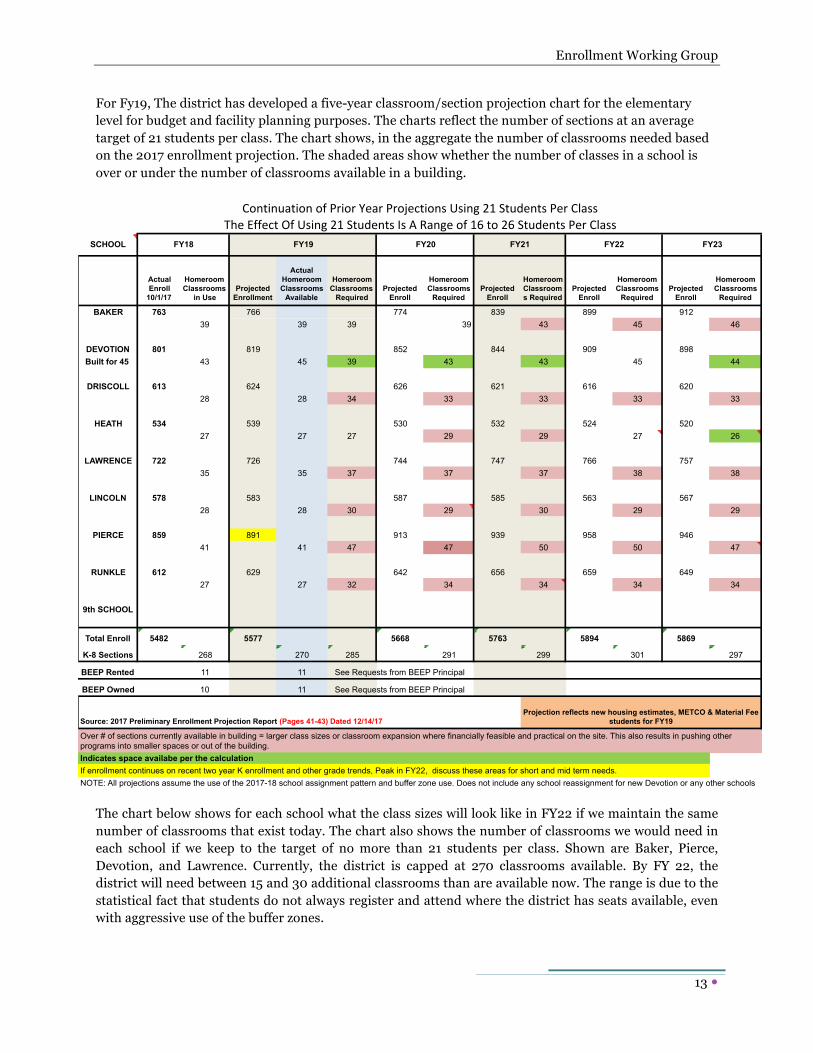
For Fy19, The district has developed a five-year classroom/section projection chart for the elementary level for budget and facility planning purposes. The charts reflect the number of sections at an average target of 21 students per class. The chart shows, in the aggregate the number of classrooms needed based on the 2017 enrollment projection. The shaded areas show whether the number of classes in a school is over or under the number of classrooms available in a building.
The chart below shows for each school what the class sizes will look like in FY22 if we maintain the same number of classrooms that exist today. The chart also shows the number of classrooms we would need in each school if we keep to the target of no more than 21 students per class. Shown are Baker, Pierce, Devotion, and Lawrence. Currently, the district is capped at 270 classrooms available. By FY 22, the district will need between 15 and 30 additional classrooms than are available now. The range is due to the statistical fact that students do not always register and attend where the district has seats available, even with aggressive use of the buffer zones.
SCHOOL
Actual Enroll
10/1/17
HomeroomClassrooms
in UseProjected
Enrollment
Actual Homeroom Classrooms
Available
Homeroom Classrooms
RequiredProjected
Enroll
Homeroom Classrooms
RequiredProjected
Enroll
Homeroom Classrooms Required
Projected Enroll
Homeroom Classrooms
RequiredProjected
Enroll
Homeroom Classrooms
Required
BAKER 763 766 774 839 899 91239 39 39 39 43 45 46
DEVOTION 801 819 852 844 909 898Built for 45 43 45 39 43 43 45 44
DRISCOLL 613 624 626 621 616 62028 28 34 33 33 33 33
HEATH 534 539 530 532 524 52027 27 27 29 29 27 26
LAWRENCE 722 726 744 747 766 75735 35 37 37 37 38 38
LINCOLN 578 583 587 585 563 56728 28 30 29 30 29 29
PIERCE 859 891 913 939 958 94641 41 47 47 50 50 47
RUNKLE 612 629 642 656 659 64927 27 32 34 34 34 34
9th SCHOOL
Total Enroll 5482 5577 5668 5763 5894 5869
K-8 Sections 268 270 285 291 299 301 297
BEEP Rented 11 11 See Requests from BEEP Principal
BEEP Owned 10 11 See Requests from BEEP Principal
Indicates space availabe per the calculationIf enrollment continues on recent two year K enrollment and other grade trends, Peak in FY22, discuss these areas for short and mid term needs.NOTE: All projections assume the use of the 2017-18 school assignment pattern and buffer zone use. Does not include any school reassignment for new Devotion or any other schools
Over # of sections currently available in building = larger class sizes or classroom expansion where financially feasible and practical on the site. This also results in pushing other programs into smaller spaces or out of the building.
ContinuationofPriorYearProjectionsUsing21StudentsPerClassTheEffectOfUsing21StudentsIsARangeof16to26StudentsPerClass
Source: 2017 Preliminary Enrollment Projection Report (Pages 41-43) Dated 12/14/17Projection reflects new housing estimates, METCO & Material Fee
students for FY19
FY18 FY19 FY20 FY21 FY22 FY23
Enrollment Working Group
14 �
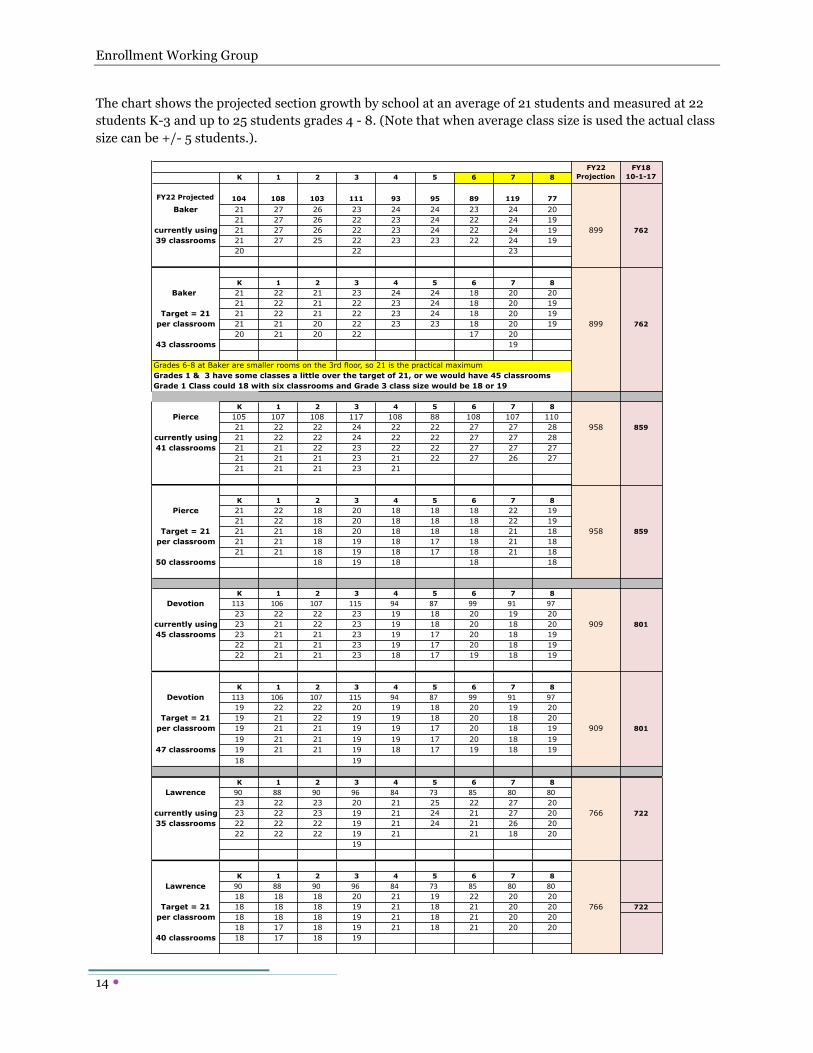
The chart shows the projected section growth by school at an average of 21 students and measured at 22 students K-3 and up to 25 students grades 4 - 8. (Note that when average class size is used the actual class size can be +/- 5 students.).
K 1 2 3 4 5 6 7 8
FY22 Projected 104 108 103 111 93 95 89 119 77Baker 21 27 26 23 24 24 23 24 20
21 27 26 22 23 24 22 24 19currently using 21 27 26 22 23 24 22 24 19 899 76239 classrooms 21 27 25 22 23 23 22 24 19
20 22 23
K 1 2 3 4 5 6 7 8Baker 21 22 21 23 24 24 18 20 20
21 22 21 22 23 24 18 20 19Target = 21 21 22 21 22 23 24 18 20 19
per classroom 21 21 20 22 23 23 18 20 19 89920 21 20 22 17 20
43 classrooms 19
Grades 6-8 at Baker are smaller rooms on the 3rd floor, so 21 is the practical maximumGrades 1 & 3 have some classes a little over the target of 21, or we would have 45 classroomsGrade 1 Class could 18 with six classrooms and Grade 3 class size would be 18 or 19
K 1 2 3 4 5 6 7 8Pierce 105 107 108 117 108 88 108 107 110
21 22 22 24 22 22 27 27 28 958 859currently using 21 22 22 24 22 22 27 27 2841 classrooms 21 21 22 23 22 22 27 27 27
21 21 21 23 21 22 27 26 2721 21 21 23 21
K 1 2 3 4 5 6 7 8Pierce 21 22 18 20 18 18 18 22 19
21 22 18 20 18 18 18 22 19Target = 21 21 21 18 20 18 18 18 21 18 958 859
per classroom 21 21 18 19 18 17 18 21 1821 21 18 19 18 17 18 21 18
50 classrooms 18 19 18 18 18
K 1 2 3 4 5 6 7 8Devotion 113 106 107 115 94 87 99 91 97
23 22 22 23 19 18 20 19 20currently using 23 21 22 23 19 18 20 18 20 909 80145 classrooms 23 21 21 23 19 17 20 18 19
22 21 21 23 19 17 20 18 1922 21 21 23 18 17 19 18 19
K 1 2 3 4 5 6 7 8Devotion 113 106 107 115 94 87 99 91 97
19 22 22 20 19 18 20 19 20Target = 21 19 21 22 19 19 18 20 18 20
per classroom 19 21 21 19 19 17 20 18 19 909 80119 21 21 19 19 17 20 18 19
47 classrooms 19 21 21 19 18 17 19 18 1918 19
K 1 2 3 4 5 6 7 8Lawrence 90 88 90 96 84 73 85 80 80
23 22 23 20 21 25 22 27 20currently using 23 22 23 19 21 24 21 27 20 766 72235 classrooms 22 22 22 19 21 24 21 26 20
22 22 22 19 21 21 18 2019
K 1 2 3 4 5 6 7 8Lawrence 90 88 90 96 84 73 85 80 80
18 18 18 20 21 19 22 20 20Target = 21 18 18 18 19 21 18 21 20 20 766 722
per classroom 18 18 18 19 21 18 21 20 2018 17 18 19 21 18 21 20 20
40 classrooms 18 17 18 19
FY22 Projection
FY18 10-1-17
762
Enrollment Working Group
15 �
School Boundary Assignments History of Buffer Zones The Public Schools of Brookline established the use of buffer zones in 1981 as a way to balance enrollments/class sizes at the elementary school level. Buffer zones have provided the district a tool for maintaining equity among the schools without having to redistrict, especially with new or expanding developments in parts of the Town.
Since 1981, buffer zones have been reviewed and/or expanded more than a half-dozen times, the most recent expansion voted in 2012 to include areas in the north Brookline side of town.
As an enrollment tool, buffer zones allow for the assignment of families to one or more of the schools that are in proximity to their street address. A family may state a preference for a school of their choice, but the final decision is that of the Superintendent or their designee (Office of Student Affairs). Enrollments at the particular grade level that the child is entering play a large part in the assignment. Once the assignment is made, all of the children in the same family will be assigned to the same school.
Chronology:
1981 – Buffer Zones established (Dexter Park, 175-185 Freeman St. (Dev/Law))
1984 – Buffer Zone policy (Driscoll Buffer zone w/Pierce & Runkle added; Devotion Buffer Zone Committee formed)
1993 – Enrollment Task Force (1989-1993): Recommended increase number of Buffer Zones1,2
2001 – Baker School Buffer Zones / Enrollment Cap (Baker/Heath/Lincoln/Runkle) 3
2002 – Baker School Enrollment Cap Reviewed
2004 – Buffer Zones expanded (Cypress Lofts); maps added for clarity4
2012 – Buffer Zones expanded primarily in North Brookline (Chestnut Hill Ave to the North)5
2018 – New Devotion opens September of 2018 with additional capacity, buffer zone and student assignment review required.
Census Data Under M.G.L. Chapter 51, Section 4, a yearly census is mandated. The Town Clerk conducts the annual census of all Brookline’s households and publishes the results in a printed residents’ list (commonly known as the "Street List"). The publication contains an alphabetical-numerical list of all residents seventeen and older, as of January 1st of each year. The Town Census collects “the name, date of birth, occupation, veteran status, nationality, if not a citizen of the United States, and residence on January 1 of the preceding year and the current year, of each person three years of age or older residing in their respective cities and towns.”6 1 Memorandum to the School Committee: Enrollment Committee Recommendations vis-à-vis Buffer 2 Memorandum to School Committee: Enrollment Committee Recommendations, April 5, 1993 3 Brookline School Committee Record, Volume 2001, Vote: 6/7/01 – a. Baker Buffer Zone (Baker/Heath/Lincoln/Runkle) & b. Two year Cap on K-2 new enrollments 4 Brookline School Committee Record, Volume 2004, Vote: 3/25/04, page 65 - Cypress Lofts 5 School Committee Policy – P. J15-J16 6 https://malegislature.gov/Laws/GeneralLaws/PartI/TitleVIII/Chapter51/Section4
Enrollment Working Group
16 �
In addition as part of the census, “A list of all persons 3 to 21 years of age, inclusive, shall be transmitted by the board of registrars to the respective school committee not later than April 1 of each year. The list shall contain the name, residence and age or date of birth of each such person; but the names of persons 3 to 16 years of age, inclusive, shall not be disclosed to any person other than the respective school committee or board of trustees of a county agricultural school or a police department.” 7 Responding to the annual census is important for many reasons:
1. To maintain a person’s “active” voter status; 2. To maintain accurate population information; 3. To allocate State and Federal funds to the town; 4. To provide proof of residency for personal and/or legal requirements:
• In-state tuition at state colleges/universities • Housing benefits for the elderly or others • Veteran’s benefits • Insurance benefits • School enrollment
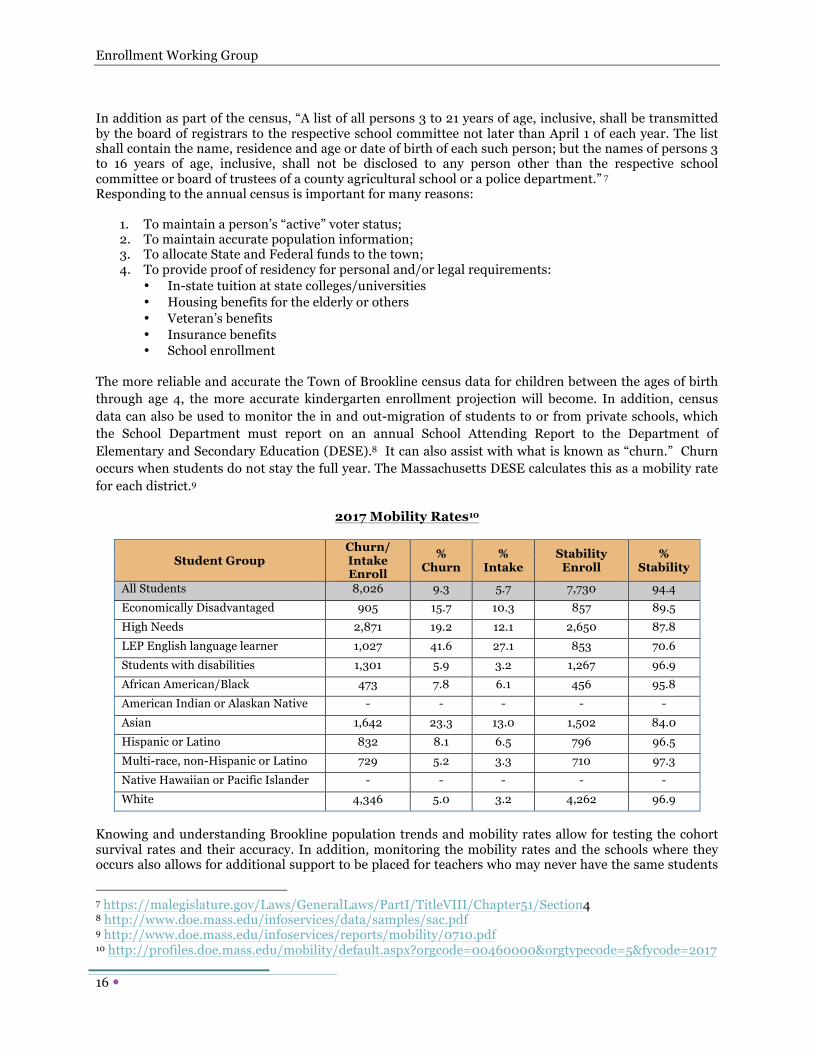
The more reliable and accurate the Town of Brookline census data for children between the ages of birth through age 4, the more accurate kindergarten enrollment projection will become. In addition, census data can also be used to monitor the in and out-migration of students to or from private schools, which the School Department must report on an annual School Attending Report to the Department of Elementary and Secondary Education (DESE).8 It can also assist with what is known as “churn.” Churn occurs when students do not stay the full year. The Massachusetts DESE calculates this as a mobility rate for each district.9
2017 Mobility Rates10
Student Group Churn/ Intake Enroll
% Churn
% Intake
Stability Enroll
% Stability
All Students 8,026 9.3 5.7 7,730 94.4 Economically Disadvantaged 905 15.7 10.3 857 89.5 High Needs 2,871 19.2 12.1 2,650 87.8 LEP English language learner 1,027 41.6 27.1 853 70.6 Students with disabilities 1,301 5.9 3.2 1,267 96.9 African American/Black 473 7.8 6.1 456 95.8 American Indian or Alaskan Native - - - - - Asian 1,642 23.3 13.0 1,502 84.0 Hispanic or Latino 832 8.1 6.5 796 96.5 Multi-race, non-Hispanic or Latino 729 5.2 3.3 710 97.3 Native Hawaiian or Pacific Islander - - - - - White 4,346 5.0 3.2 4,262 96.9
Knowing and understanding Brookline population trends and mobility rates allow for testing the cohort survival rates and their accuracy. In addition, monitoring the mobility rates and the schools where they occurs also allows for additional support to be placed for teachers who may never have the same students
7 https://malegislature.gov/Laws/GeneralLaws/PartI/TitleVIII/Chapter51/Section4 8 http://www.doe.mass.edu/infoservices/data/samples/sac.pdf 9 http://www.doe.mass.edu/infoservices/reports/mobility/0710.pdf 10 http://profiles.doe.mass.edu/mobility/default.aspx?orgcode=00460000&orgtypecode=5&fycode=2017
Enrollment Working Group
17 �
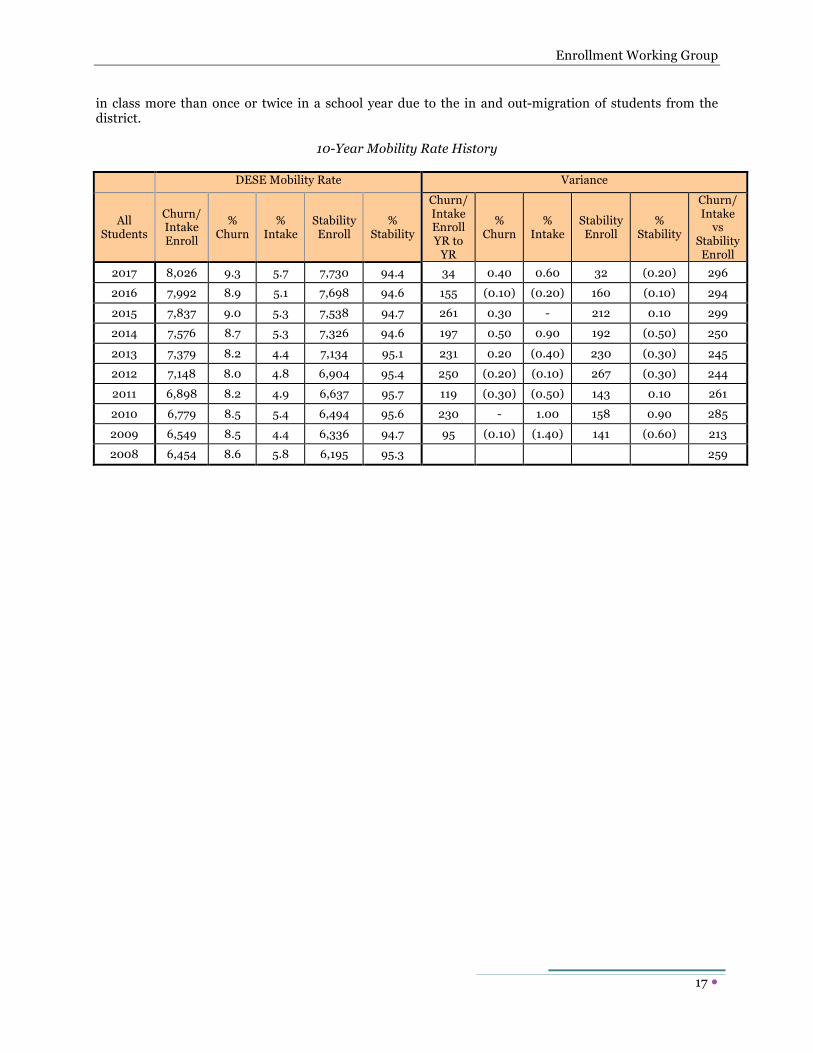
in class more than once or twice in a school year due to the in and out-migration of students from the district.
10-Year Mobility Rate History
DESE Mobility Rate Variance
All Students
Churn/ Intake Enroll
% Churn
% Intake
Stability Enroll
% Stability
Churn/ Intake Enroll YR to
YR
% Churn
% Intake
Stability Enroll
% Stability
Churn/ Intake
vs Stability Enroll
2017 8,026 9.3 5.7 7,730 94.4 34 0.40 0.60 32 (0.20) 296 2016 7,992 8.9 5.1 7,698 94.6 155 (0.10) (0.20) 160 (0.10) 294 2015 7,837 9.0 5.3 7,538 94.7 261 0.30 - 212 0.10 299 2014 7,576 8.7 5.3 7,326 94.6 197 0.50 0.90 192 (0.50) 250
2013 7,379 8.2 4.4 7,134 95.1 231 0.20 (0.40) 230 (0.30) 245 2012 7,148 8.0 4.8 6,904 95.4 250 (0.20) (0.10) 267 (0.30) 244 2011 6,898 8.2 4.9 6,637 95.7 119 (0.30) (0.50) 143 0.10 261 2010 6,779 8.5 5.4 6,494 95.6 230 - 1.00 158 0.90 285 2009 6,549 8.5 4.4 6,336 94.7 95 (0.10) (1.40) 141 (0.60) 213 2008 6,454 8.6 5.8 6,195 95.3 259
Enrollment Working Group
18 �
Tuition Paying Students The Public Schools of Brookline has historically accepted non-resident tuition students into the district prior to 1973. Students who were allowed to pay tuition to attend the Public Schools of Brookline came from Boston, children of employees of the Town of Brookline (all municipal departments), METCO (1966) and the SEVIS program (One Year International Exchange). The establishment of School Choice11 in 2004 forced the School Committee to change its policy. Current policies are outlined below.
The current policy is as follows:
1) Non-Resident, Tuition Paying Students a) Students are admitted to the Public Schools of Brookline on a space available basis, in
accordance with state law. b) An initial letter will be sent in response to all inquiries regarding the non-resident, tuition
payment program. The letter will be accompanied by an Application Packet. c) Completed applications must be returned no later than April 1st and accompanied by a non-
refundable $50 application fee. d) Applicants will be notified of their admission status no later than May 15. Those accepted will
receive an Admissions Contract. e) To reserve a seat for the following school year, the applicant must return the Admissions
Contract no later than May 31, with a $500 deposit. This deposit will be applied toward the second tuition payment due in January. The deposit is forfeited in the event that the student fails to enroll.
2) Non-Resident Teacher's Children a) Students are admitted on a space available basis after full tuition-paying students have been
admitted. b) An initial letter will be sent to teachers who have made inquiries regarding the non-resident,
reduced-tuition program. This letter, modified regarding dates, fees, and deposit, will be accompanied by an Application Packet, modified to omit the $50 fee.
c) Completed application forms must be returned no later than April 1. d) Applicants will be notified of their admission status no later than June 1. Those accepted will
receive an Admissions Contract. e) To reserve a seat for the following year, the applicant must return the Admissions Contract no
later than June 15, with a $50 deposit. This deposit will be applied toward the second tuition payment due in January. The deposit is forfeited in the event that the student fails to enroll.
3) Non-Resident School and Town Employee's Children a) Students are admitted on a space available basis after applicants in Categories 1 and 2 above
have been processed. (J 13) b) An initial letter will be sent to all employees who have made inquiries regarding the reduced-
tuition program. This letter will be accompanied by an Application Packet, modified to omit reference to the $40 fee.
c) Completed applications must be received no later than April 1st d) Applicants will be notified of their admission status no later than June 20. Acceptance letters
will be accompanied by an Admissions Contract. e) The Contract must be returned no later than June 30th accompanied by a $50 deposit. This
deposit will be applied toward the second tuition payment due in January. The deposit is forfeited in the event that the student fails to enroll in September.
11 http://www.doe.mass.edu/finance/schoolchoice/choicead.html
Enrollment Working Group
19 �
1) Non-Resident, Tuition Paying Students a. SEVIS - Student and Exchange Visitor Program The Public Schools of Brookline has accepted international students (F1 or F2 visas) under the US Immigration and Customs Enforcement Student and Exchange Visitor Program (SEVP or SEVIS) at the High School for many years.12 Due to the growing enrollment at Brookline High School, this program may require a sunset provision as we are projecting high school enrollment will exceed the High School’s current capacity of 2200 students in the next five years. There is currently one (1) student enrolled under SEVP for the year and eight (8) under the China Exchange.
b. Non-US Citizen Students The US Court Supreme Court ruling (Plyer v. Doe, 1982) upholding the 14th Amendment reinforces that an immigrant student cannot be denied a free and public education. Proof of Residency requirements, established by a school district, has been upheld as a district level decision.13 The district has posted its requirements
Frequently, the district will have preK-12 students who are attempting to enroll on visas (B) that do not allow them to be in the United States other than as a visitor. These students tend to be here on short-term basis and typically do not stay for the entire school year or arrive in the middle of the school year.
All international high school and elementary students must be in possession of a F-1 or F-2 visa to enroll in public schools which is granted when one or more of the parents is in the United States under an F-1 visa. However, it is not uncommon for one parent to have an F-1 and the rest of the family to be provided with Visitor Visas (B). Under visa regulations, students with B visas may only participate in recreation or other short-term programs. They are not to participate in a primary/secondary educational program.
2) Non-Resident Teacher’s Children and 3) Non-Resident School and Town Employee’s Children
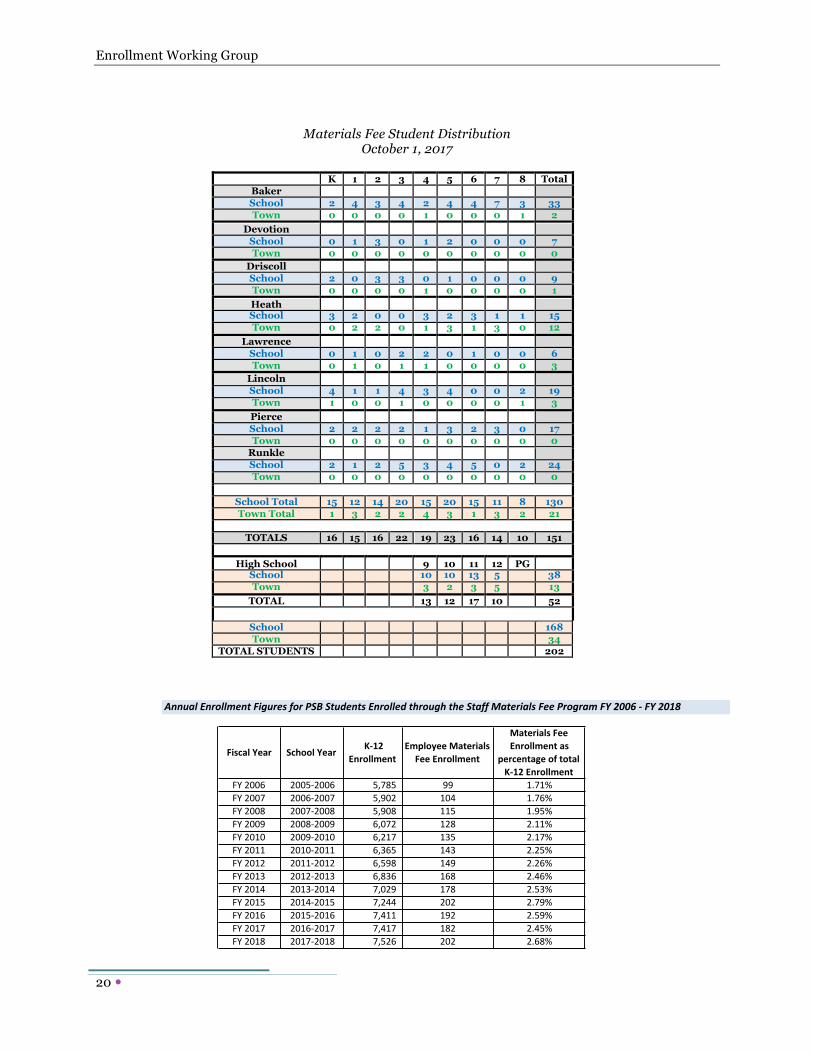
a. Materials Fee Program The Materials Fee Program began in the 1960s. The School Committee policy publishes rates back to 1987-1988 School year. It is a program that has been maintained and currently allows access to education for 202 students across all grades K-12. Of the 202 students, 27 have IEPs. All employees participate in a payroll reduction for tuition payments unless they choose to pay in full in advance of the school year. The children of non-resident teachers and non-resident school or Town employees are admitted per the guidelines set by the School Committee (School Committee Policy J.1.c). The following tables shows the PSB students enrolled in the Materials Fee Program by grade and school and annual enrollment of the Materials Fee Program since FY 2006.
12 https://www.ice.gov/sevis 13 http://www.brookline.k12.ma.us/domain/43
Enrollment Working Group
20 �
Materials Fee Student Distribution October 1, 2017
K 1 2 3 4 5 6 7 8 Total Baker School 2 4 3 4 2 4 4 7 3 33 Town 0 0 0 0 1 0 0 0 1 2
Devotion School 0 1 3 0 1 2 0 0 0 7 Town 0 0 0 0 0 0 0 0 0 0
Driscoll School 2 0 3 3 0 1 0 0 0 9 Town 0 0 0 0 1 0 0 0 0 1 Heath School 3 2 0 0 3 2 3 1 1 15 Town 0 2 2 0 1 3 1 3 0 12
Lawrence School 0 1 0 2 2 0 1 0 0 6 Town 0 1 0 1 1 0 0 0 0 3
Lincoln School 4 1 1 4 3 4 0 0 2 19 Town 1 0 0 1 0 0 0 0 1 3 Pierce School 2 2 2 2 1 3 2 3 0 17 Town 0 0 0 0 0 0 0 0 0 0
Runkle School 2 1 2 5 3 4 5 0 2 24 Town 0 0 0 0 0 0 0 0 0 0
School Total 15 12 14 20 15 20 15 11 8 130 Town Total 1 3 2 2 4 3 1 3 2 21
TOTALS 16 15 16 22 19 23 16 14 10 151
High School
9 10 11 12 PG School 10 10 13 5 38 Town 3 2 3 5 13
TOTAL 13 12 17 10 52
School 168 Town 34
TOTAL STUDENTS
202
AnnualEnrollmentFiguresforPSBStudentsEnrolledthroughtheStaffMaterialsFeeProgramFY2006-FY2018
FiscalYear SchoolYear K-12Enrollment
EmployeeMaterialsFeeEnrollment
MaterialsFeeEnrollmentas
percentageoftotalK-12Enrollment
FY2006 2005-2006 5,785 99 1.71%FY2007 2006-2007 5,902 104 1.76%FY2008 2007-2008 5,908 115 1.95%FY2009 2008-2009 6,072 128 2.11%FY2010 2009-2010 6,217 135 2.17%FY2011 2010-2011 6,365 143 2.25%FY2012 2011-2012 6,598 149 2.26%FY2013 2012-2013 6,836 168 2.46%FY2014 2013-2014 7,029 178 2.53%FY2015 2014-2015 7,244 202 2.79%FY2016 2015-2016 7,411 192 2.59%FY2017 2016-2017 7,417 182 2.45%FY2018 2017-2018 7,526 202 2.68%
Enrollment Working Group
21 �
Students Admitted through Grants and State Aid
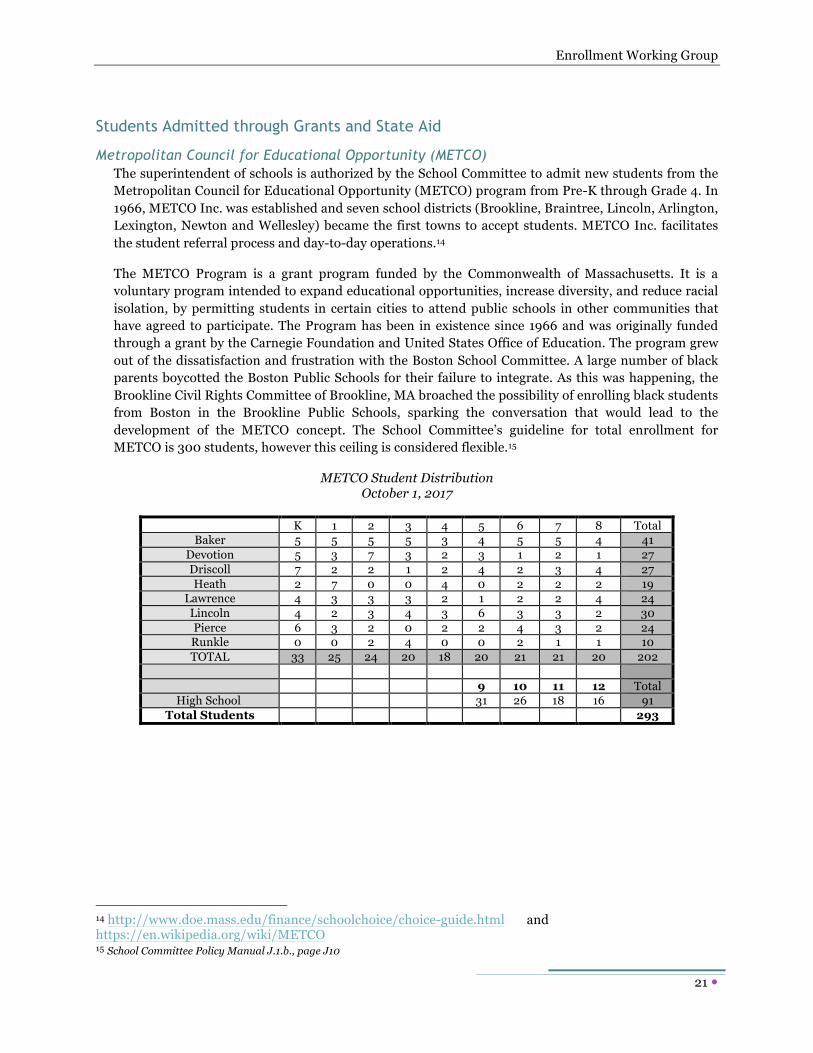
Metropolitan Council for Educational Opportunity (METCO) The superintendent of schools is authorized by the School Committee to admit new students from the Metropolitan Council for Educational Opportunity (METCO) program from Pre-K through Grade 4. In 1966, METCO Inc. was established and seven school districts (Brookline, Braintree, Lincoln, Arlington, Lexington, Newton and Wellesley) became the first towns to accept students. METCO Inc. facilitates the student referral process and day-to-day operations.14
The METCO Program is a grant program funded by the Commonwealth of Massachusetts. It is a voluntary program intended to expand educational opportunities, increase diversity, and reduce racial isolation, by permitting students in certain cities to attend public schools in other communities that have agreed to participate. The Program has been in existence since 1966 and was originally funded through a grant by the Carnegie Foundation and United States Office of Education. The program grew out of the dissatisfaction and frustration with the Boston School Committee. A large number of black parents boycotted the Boston Public Schools for their failure to integrate. As this was happening, the Brookline Civil Rights Committee of Brookline, MA broached the possibility of enrolling black students from Boston in the Brookline Public Schools, sparking the conversation that would lead to the development of the METCO concept. The School Committee’s guideline for total enrollment for METCO is 300 students, however this ceiling is considered flexible.15
METCO Student Distribution October 1, 2017
K 1 2 3 4 5 6 7 8 Total
Baker 5 5 5 5 3 4 5 5 4 41 Devotion 5 3 7 3 2 3 1 2 1 27 Driscoll 7 2 2 1 2 4 2 3 4 27 Heath 2 7 0 0 4 0 2 2 2 19
Lawrence 4 3 3 3 2 1 2 2 4 24 Lincoln 4 2 3 4 3 6 3 3 2 30 Pierce 6 3 2 0 2 2 4 3 2 24 Runkle 0 0 2 4 0 0 2 1 1 10 TOTAL 33 25 24 20 18 20 21 21 20 202
9 10 11 12 Total High School 31 26 18 16 91
Total Students 293
14 http://www.doe.mass.edu/finance/schoolchoice/choice-guide.html and https://en.wikipedia.org/wiki/METCO 15 School Committee Policy Manual J.1.b., page J10
Enrollment Working Group
22 �
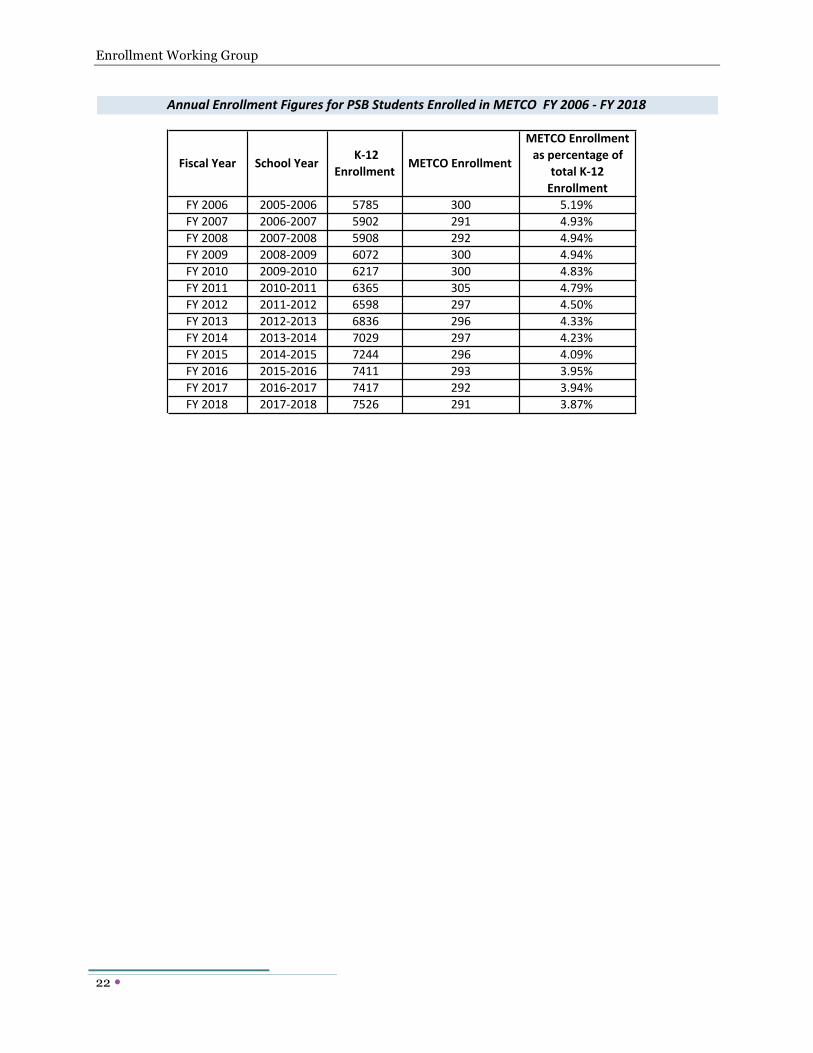
FiscalYear SchoolYear K-12Enrollment METCOEnrollment
METCOEnrollmentaspercentageof
totalK-12Enrollment
FY2006 2005-2006 5785 300 5.19%FY2007 2006-2007 5902 291 4.93%FY2008 2007-2008 5908 292 4.94%FY2009 2008-2009 6072 300 4.94%FY2010 2009-2010 6217 300 4.83%FY2011 2010-2011 6365 305 4.79%FY2012 2011-2012 6598 297 4.50%FY2013 2012-2013 6836 296 4.33%FY2014 2013-2014 7029 297 4.23%FY2015 2014-2015 7244 296 4.09%FY2016 2015-2016 7411 293 3.95%FY2017 2016-2017 7417 292 3.94%FY2018 2017-2018 7526 291 3.87%
AnnualEnrollmentFiguresforPSBStudentsEnrolledinMETCOFY2006-FY2018
Enrollment Working Group
23 �
Enrollment Projection Data
Ten Year Enrollment Projections
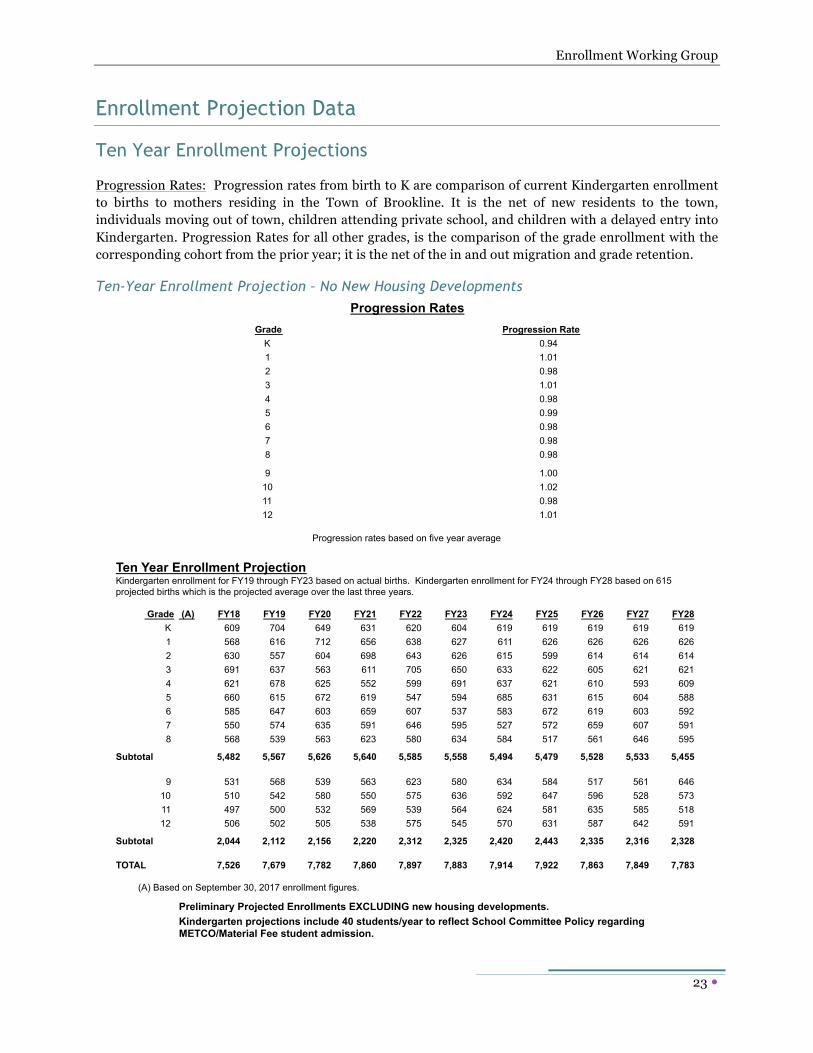
Progression Rates: Progression rates from birth to K are comparison of current Kindergarten enrollment to births to mothers residing in the Town of Brookline. It is the net of new residents to the town, individuals moving out of town, children attending private school, and children with a delayed entry into Kindergarten. Progression Rates for all other grades, is the comparison of the grade enrollment with the corresponding cohort from the prior year; it is the net of the in and out migration and grade retention.
Ten-Year Enrollment Projection – No New Housing Developments
Grade Progression RateK 0.941 1.012 0.983 1.014 0.985 0.996 0.987 0.988 0.98
9 1.0010 1.0211 0.9812 1.01
Ten Year Enrollment Projection
Grade (A) FY18 FY19 FY20 FY21 FY22 FY23 FY24 FY25 FY26 FY27 FY28K 609 704 649 631 620 604 619 619 619 619 6191 568 616 712 656 638 627 611 626 626 626 6262 630 557 604 698 643 626 615 599 614 614 6143 691 637 563 611 705 650 633 622 605 621 6214 621 678 625 552 599 691 637 621 610 593 6095 660 615 672 619 547 594 685 631 615 604 5886 585 647 603 659 607 537 583 672 619 603 5927 550 574 635 591 646 595 527 572 659 607 5918 568 539 563 623 580 634 584 517 561 646 595
Subtotal 5,482 5,567 5,626 5,640 5,585 5,558 5,494 5,479 5,528 5,533 5,455
9 531 568 539 563 623 580 634 584 517 561 64610 510 542 580 550 575 636 592 647 596 528 57311 497 500 532 569 539 564 624 581 635 585 51812 506 502 505 538 575 545 570 631 587 642 591
Subtotal 2,044 2,112 2,156 2,220 2,312 2,325 2,420 2,443 2,335 2,316 2,328
TOTAL 7,526 7,679 7,782 7,860 7,897 7,883 7,914 7,922 7,863 7,849 7,783
(A) Based on September 30, 2017 enrollment figures.
Progression Rates
Progression rates based on five year average
Kindergarten enrollment for FY19 through FY23 based on actual births. Kindergarten enrollment for FY24 through FY28 based on 615 projected births which is the projected average over the last three years.
Preliminary Projected Enrollments EXCLUDING new housing developments.Kindergarten projections include 40 students/year to reflect School Committee Policy regarding METCO/Material Fee student admission.
Enrollment Working Group
24 �
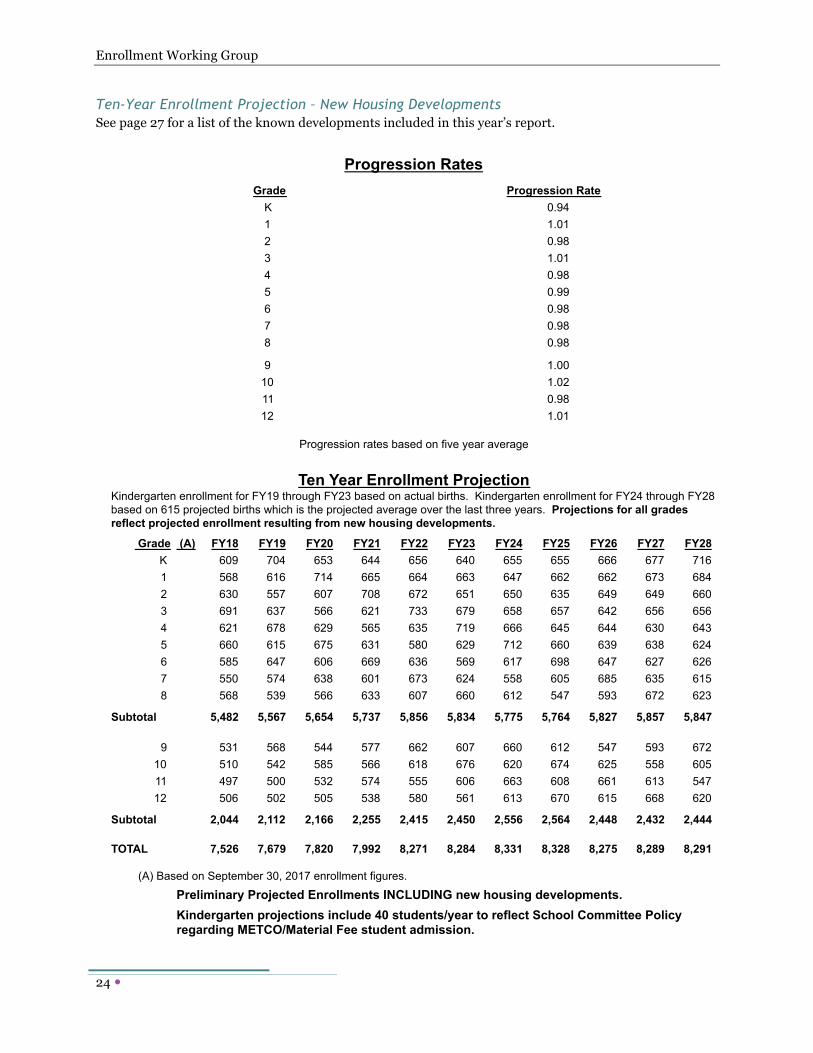
Ten-Year Enrollment Projection – New Housing Developments See page 27 for a list of the known developments included in this year’s report.
Grade Progression RateK 0.941 1.012 0.983 1.014 0.985 0.996 0.987 0.988 0.98
9 1.0010 1.0211 0.9812 1.01
Ten Year Enrollment Projection
Grade (A) FY18 FY19 FY20 FY21 FY22 FY23 FY24 FY25 FY26 FY27 FY28K 609 704 653 644 656 640 655 655 666 677 7161 568 616 714 665 664 663 647 662 662 673 6842 630 557 607 708 672 651 650 635 649 649 6603 691 637 566 621 733 679 658 657 642 656 6564 621 678 629 565 635 719 666 645 644 630 6435 660 615 675 631 580 629 712 660 639 638 6246 585 647 606 669 636 569 617 698 647 627 6267 550 574 638 601 673 624 558 605 685 635 6158 568 539 566 633 607 660 612 547 593 672 623
Subtotal 5,482 5,567 5,654 5,737 5,856 5,834 5,775 5,764 5,827 5,857 5,847
9 531 568 544 577 662 607 660 612 547 593 67210 510 542 585 566 618 676 620 674 625 558 60511 497 500 532 574 555 606 663 608 661 613 54712 506 502 505 538 580 561 613 670 615 668 620
Subtotal 2,044 2,112 2,166 2,255 2,415 2,450 2,556 2,564 2,448 2,432 2,444
TOTAL 7,526 7,679 7,820 7,992 8,271 8,284 8,331 8,328 8,275 8,289 8,291
(A) Based on September 30, 2017 enrollment figures.
Preliminary Projected Enrollments INCLUDING new housing developments.
Progression Rates
Progression rates based on five year average
Kindergarten enrollment for FY19 through FY23 based on actual births. Kindergarten enrollment for FY24 through FY28 based on 615 projected births which is the projected average over the last three years. Projections for all grades reflect projected enrollment resulting from new housing developments.
Kindergarten projections include 40 students/year to reflect School Committee Policy regarding METCO/Material Fee student admission.
Enrollment Working Group
25 �
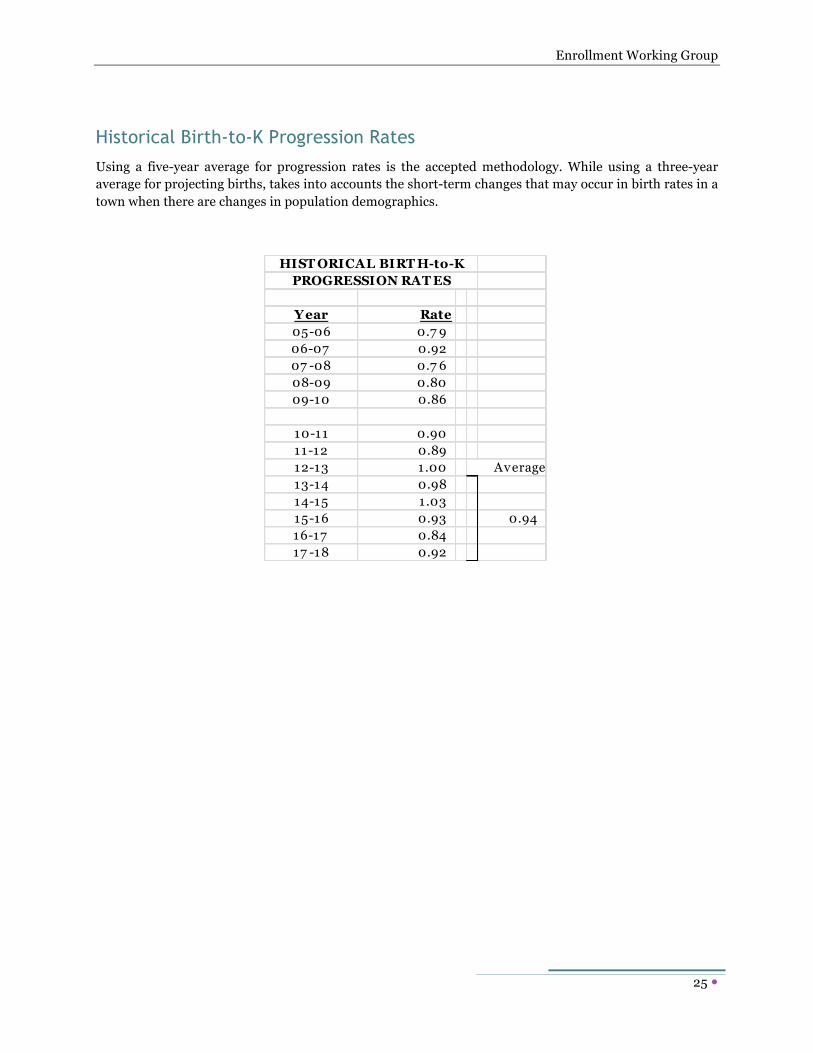
Historical Birth-to-K Progression Rates Using a five-year average for progression rates is the accepted methodology. While using a three-year average for projecting births, takes into accounts the short-term changes that may occur in birth rates in a town when there are changes in population demographics.
Year Rate05-06 0.7 9 06-07 0.92 07 -08 0.7 6 08-09 0.80 09-10 0.86
10-11 0.90 11-12 0.89 12-13 1.00 Average13-14 0.98 14-15 1 .03 15-16 0.93 0.94 16-17 0.84 17 -18 0.92
HIST ORICAL BIRT H-to-KPROGRESSION RAT ES
Enrollment Working Group
26 �
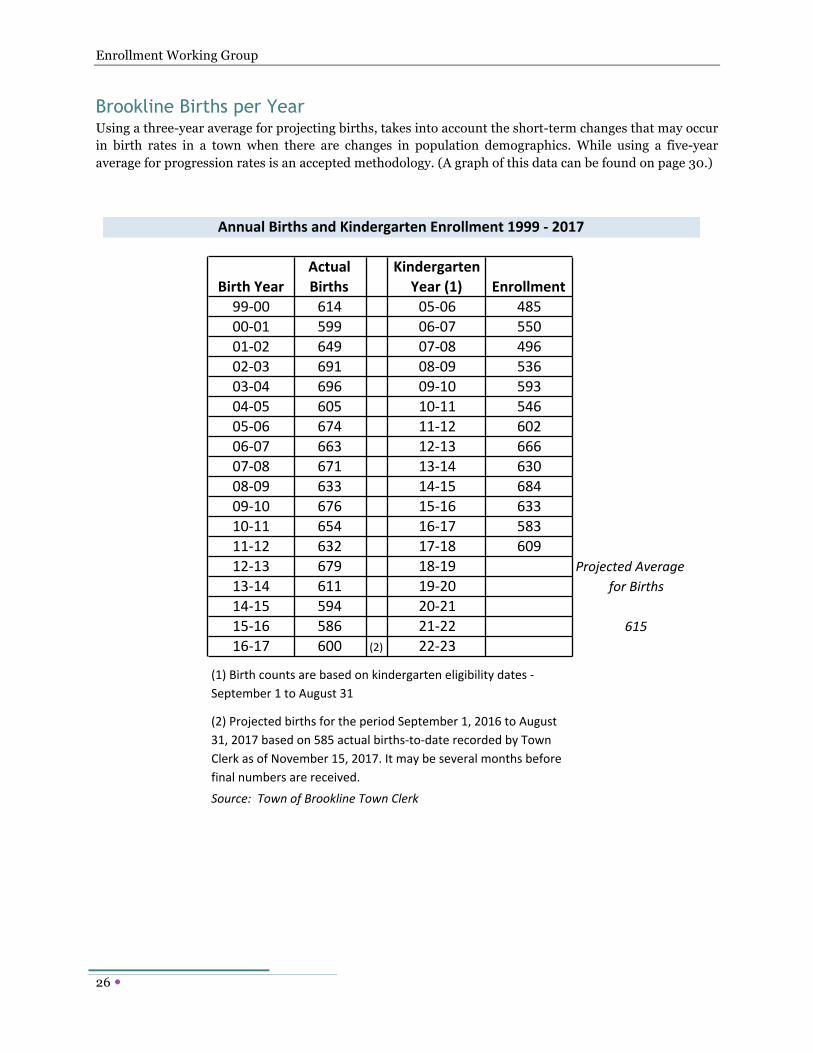
Brookline Births per Year Using a three-year average for projecting births, takes into account the short-term changes that may occur in birth rates in a town when there are changes in population demographics. While using a five-year average for progression rates is an accepted methodology. (A graph of this data can be found on page 30.)
BirthYearActualBirths
KindergartenYear(1) Enrollment
99-00 614 05-06 485
00-01 599 06-07 550
01-02 649 07-08 496
02-03 691 08-09 536
03-04 696 09-10 593
04-05 605 10-11 546
05-06 674 11-12 602
06-07 663 12-13 666
07-08 671 13-14 630
08-09 633 14-15 684
09-10 676 15-16 633
10-11 654 16-17 583
11-12 632 17-18 609
12-13 679 18-19 ProjectedAverage13-14 611 19-20 forBirths14-15 594 20-21
15-16 586 21-22 61516-17 600 (2) 22-23
Source:TownofBrooklineTownClerk
(1)Birthcountsarebasedonkindergarteneligibilitydates-
September1toAugust31
(2)ProjectedbirthsfortheperiodSeptember1,2016toAugust
31,2017basedon585actualbirths-to-daterecordedbyTown
ClerkasofNovember15,2017.Itmaybeseveralmonthsbefore
finalnumbersarereceived.
AnnualBirthsandKindergartenEnrollment1999-2017
Enrollment Working Group
27 �
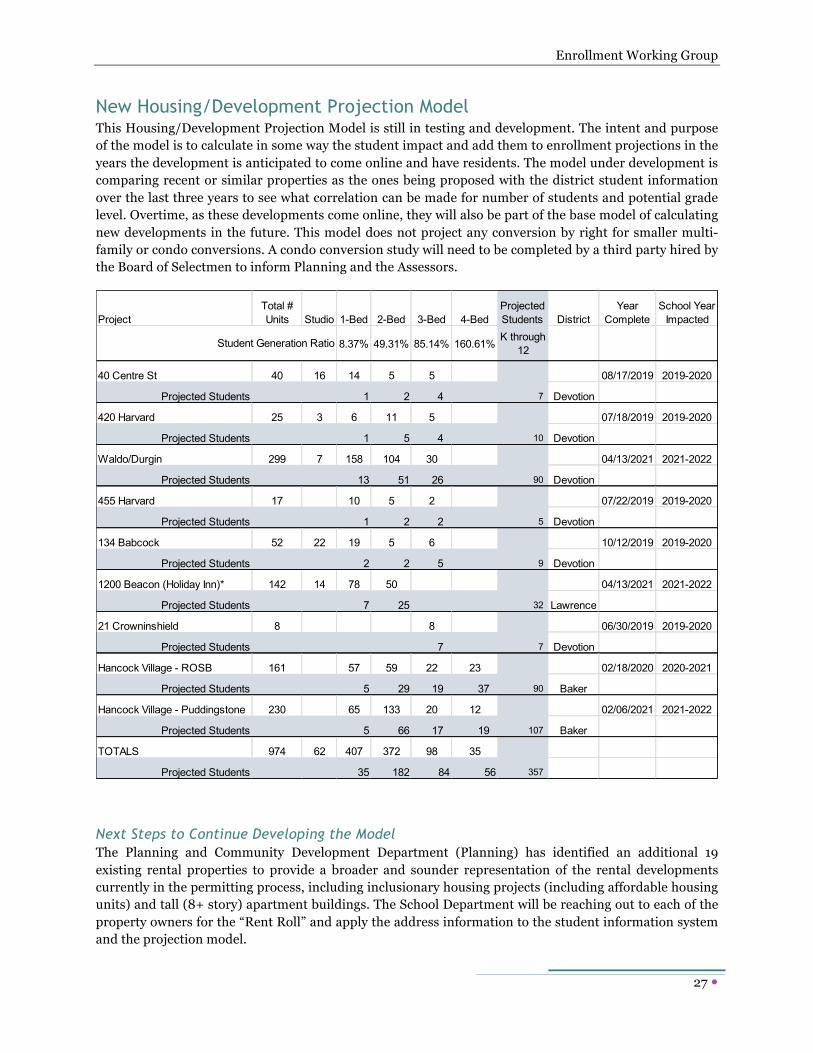
New Housing/Development Projection Model This Housing/Development Projection Model is still in testing and development. The intent and purpose of the model is to calculate in some way the student impact and add them to enrollment projections in the years the development is anticipated to come online and have residents. The model under development is comparing recent or similar properties as the ones being proposed with the district student information over the last three years to see what correlation can be made for number of students and potential grade level. Overtime, as these developments come online, they will also be part of the base model of calculating new developments in the future. This model does not project any conversion by right for smaller multi-family or condo conversions. A condo conversion study will need to be completed by a third party hired by the Board of Selectmen to inform Planning and the Assessors.
Next Steps to Continue Developing the Model The Planning and Community Development Department (Planning) has identified an additional 19 existing rental properties to provide a broader and sounder representation of the rental developments currently in the permitting process, including inclusionary housing projects (including affordable housing units) and tall (8+ story) apartment buildings. The School Department will be reaching out to each of the property owners for the “Rent Roll” and apply the address information to the student information system and the projection model.
ProjectTotal # Units Studio 1-Bed 2-Bed 3-Bed 4-Bed
Projected Students District
Year Complete
School Year Impacted
8.37% 49.31% 85.14% 160.61%K through
12
40 Centre St 40 16 14 5 5 08/17/2019 2019-2020
Projected Students 1 2 4 7 Devotion
420 Harvard 25 3 6 11 5 07/18/2019 2019-2020
Projected Students 1 5 4 10 Devotion
Waldo/Durgin 299 7 158 104 30 04/13/2021 2021-2022
Projected Students 13 51 26 90 Devotion
455 Harvard 17 10 5 2 07/22/2019 2019-2020
Projected Students 1 2 2 5 Devotion
134 Babcock 52 22 19 5 6 10/12/2019 2019-2020
Projected Students 2 2 5 9 Devotion
1200 Beacon (Holiday Inn)* 142 14 78 50 04/13/2021 2021-2022
Projected Students 7 25 32 Lawrence
21 Crowninshield 8 8 06/30/2019 2019-2020
Projected Students 7 7 Devotion
Hancock Village - ROSB 161 57 59 22 23 02/18/2020 2020-2021
Projected Students 5 29 19 37 90 Baker
Hancock Village - Puddingstone 230 65 133 20 12 02/06/2021 2021-2022
Projected Students 5 66 17 19 107 Baker
TOTALS 974 62 407 372 98 35
Projected Students 35 182 84 56 357
Student Generation Ratio
Enrollment Working Group
28 �
In future enrollment reports, the Enrollment Working Group may consider whether the model is representative of proposed developments with respect to both the building form (e.g., townhomes, mid-rise, high-rise) as well as the percentage of units required to offer preference to households of a minimum size. The minimum household size requirement is a condition of financing as part of developers’ Affirmative Fair Housing Marketing and Resident Selection Plan for affordable housing units. Presumably, each iteration of the enrollment report will be based on an evolving understanding of existing conditions and trends.
The Enrollment Working Group will continue to evaluate enrollment change by census block. If and when mapping indicates uneven enrollment growth in specific neighborhoods, the group will test potential correlation between enrollment increases and various types of property modifications (e.g., significant renovation, creation of additional bedrooms, conversion from rental to ownership, creation of additional units within buildings, construction of new residential structures, etc.)
For purposes of projecting school enrollment for facility planning purposes, the Planning Department will continue to work with the Enrollment Working Group to estimate and monitor the number of school children that could be generated by (re)development of a particular site in a particular school district. However, Planning is very concerned about the validity of adding these potential numbers to the underlying enrollment model that is based on birth and progression rates. As noted above, available historical data between Town-wide school enrollment and Town-wide housing growth does not suggest a correlation between the two factors.
Additional properties to monitor and consider including in the model include:
Inclusionary Projects:
Tall (8+ Story Apartment Buildings):
• 45 Marion • 1470 Beacon Street • 72-76 Kent Street & 73-77 Linden • 77 Marion Street/1405 Beacon Street • 110-112 Cypress Street • 6 Woodcliff Street Road • 75-81 Boylston Street • 20 Englewood Ave.
• 1440 Beacon St • 1401 Beacon St • 1284 Beacon St • 1443 Beacon St • 101 Monmouth • 1530 Beacon St • 175,185 Freeman St • 49 Marion St • 133 Park St/ 1371 Beacon • 1501 Beacon St • 1111 Beacon St
Enrollment Working Group
29 �
Additional Charts/Tables
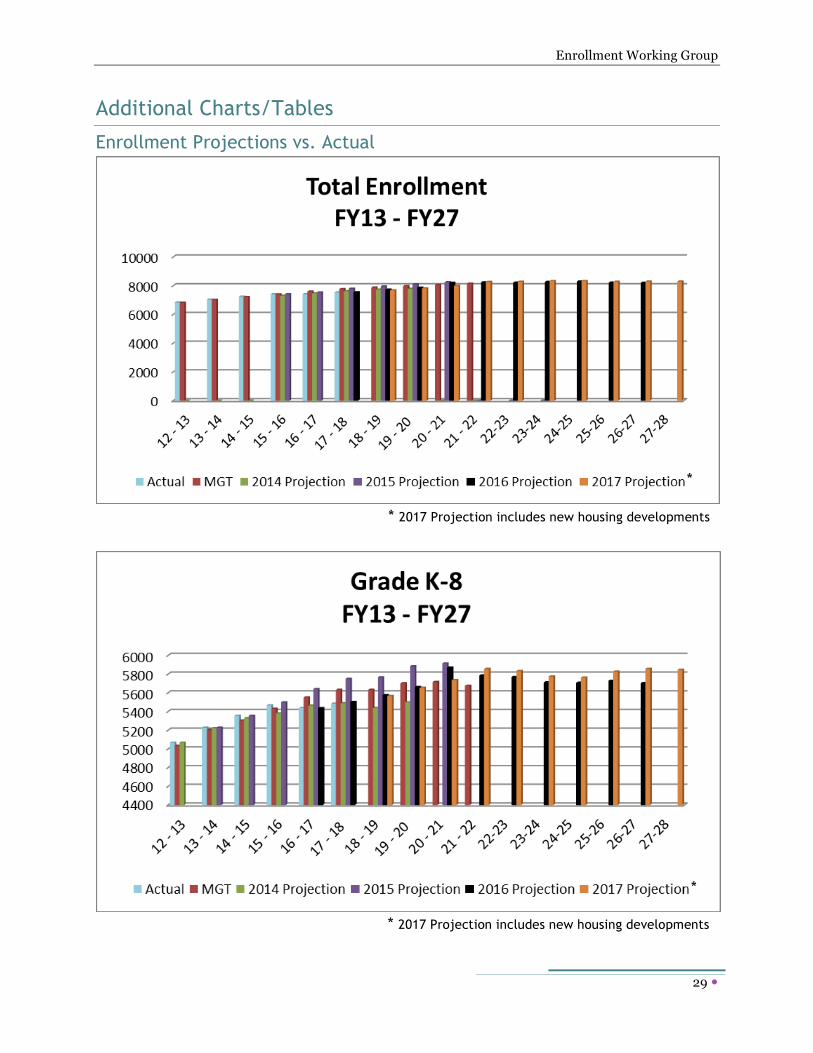
Enrollment Projections vs. Actual
* 2017 Projection includes new housing developments
* 2017 Projection includes new housing developments
*
*
Enrollment Working Group
30 �
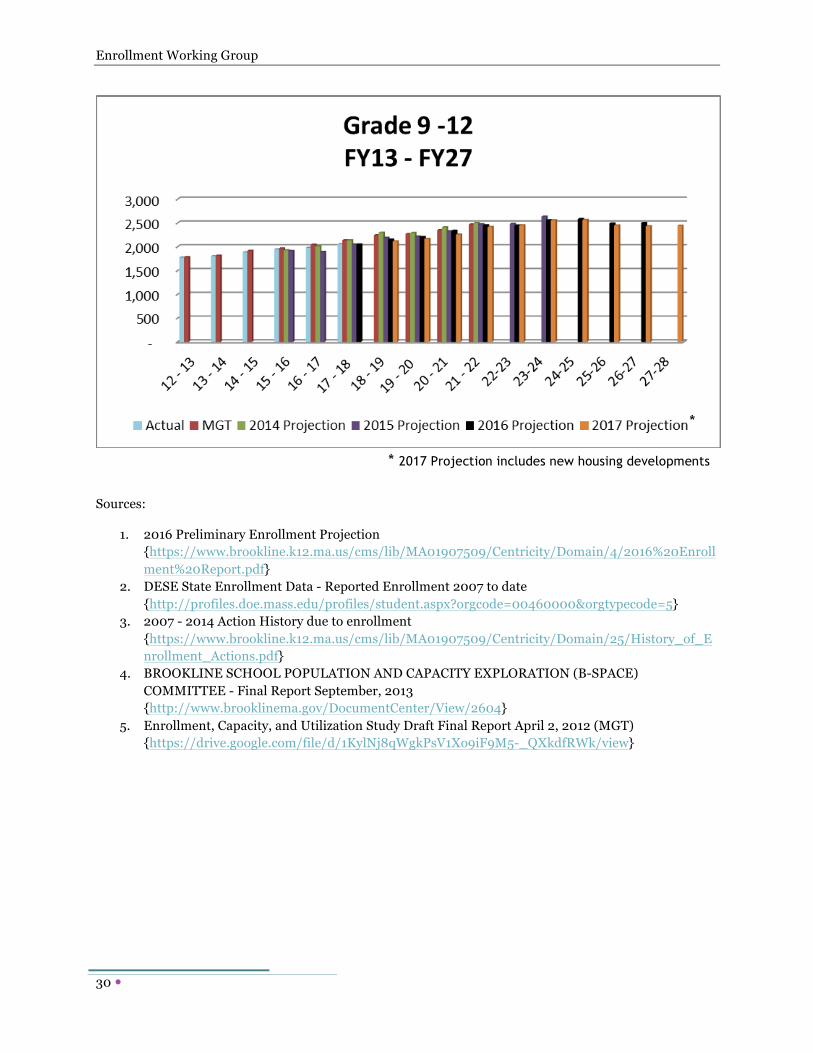
Sources:
1. 2016 Preliminary Enrollment Projection {https://www.brookline.k12.ma.us/cms/lib/MA01907509/Centricity/Domain/4/2016%20Enrollment%20Report.pdf}
2. DESE State Enrollment Data - Reported Enrollment 2007 to date {http://profiles.doe.mass.edu/profiles/student.aspx?orgcode=00460000&orgtypecode=5}
3. 2007 - 2014 Action History due to enrollment {https://www.brookline.k12.ma.us/cms/lib/MA01907509/Centricity/Domain/25/History_of_Enrollment_Actions.pdf}
4. BROOKLINE SCHOOL POPULATION AND CAPACITY EXPLORATION (B-SPACE) COMMITTEE - Final Report September, 2013 {http://www.brooklinema.gov/DocumentCenter/View/2604}
5. Enrollment, Capacity, and Utilization Study Draft Final Report April 2, 2012 (MGT) {https://drive.google.com/file/d/1KylNj8qWgkPsV1Xo9iF9M5-_QXkdfRWk/view}
* 2017 Projection includes new housing developments
*

Enrollment Working Group
31 �
Kindergarten Births to Kindergarten Enrollment
KBirths
300
350
400
450
500
550
600
650
700
750
800
99-0005-06
00-0106-07
01-0207-08
02-0308-09
03-0409-10
04-0510-11
05-0611-12
06-0712-13
07-0813-14
08-0914-15
09-1015-16
10-1116-17
11-1217-18
12-1318-19
13-1419-20
14-1520-21
15-1621-22
16-1722-23
BirthYearKindergartenSchoolYear
BirthtoKindergartenEnrollmentComparison
KEnrollment Births
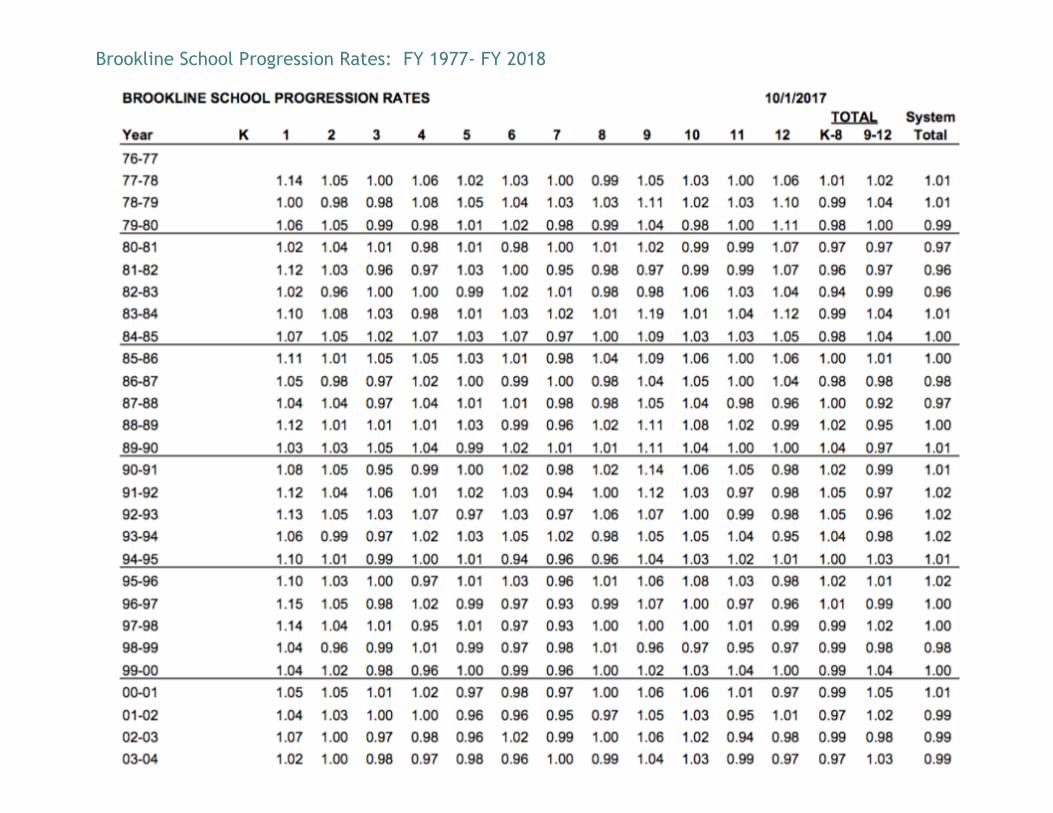
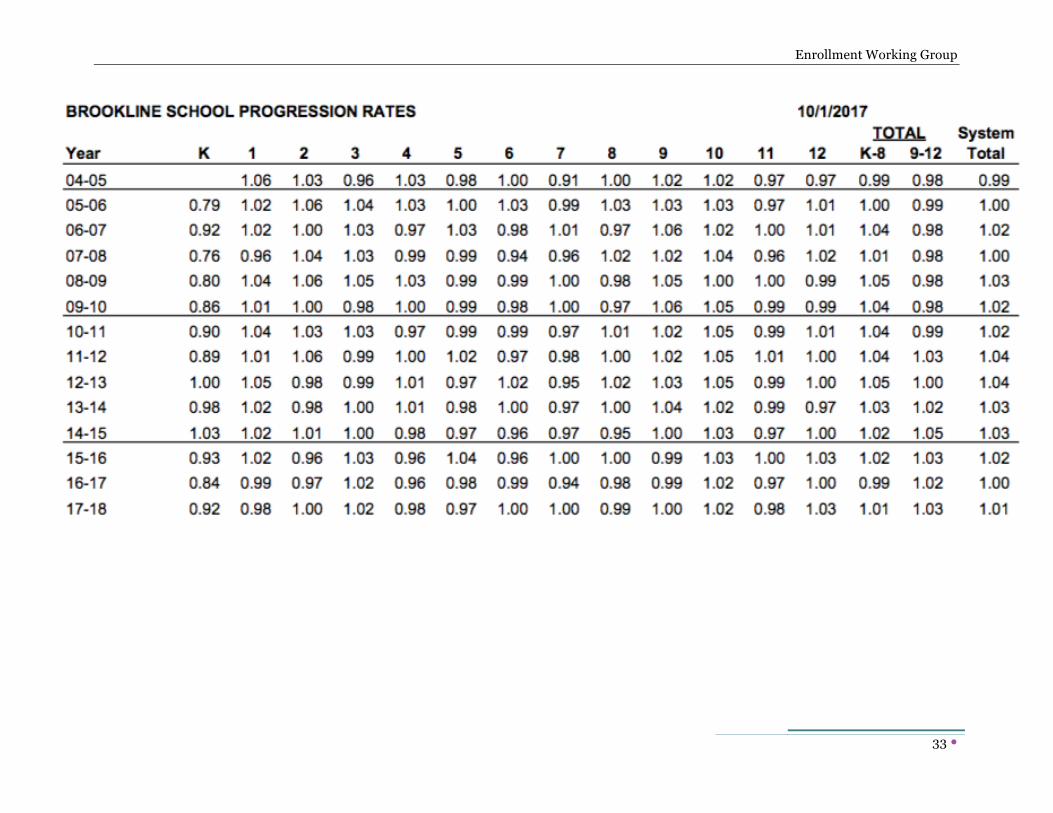
Brookline School Progression Rates: FY 1977- FY 2018
Enrollment Working Group
33 �
Enrollment Working Group
34 �
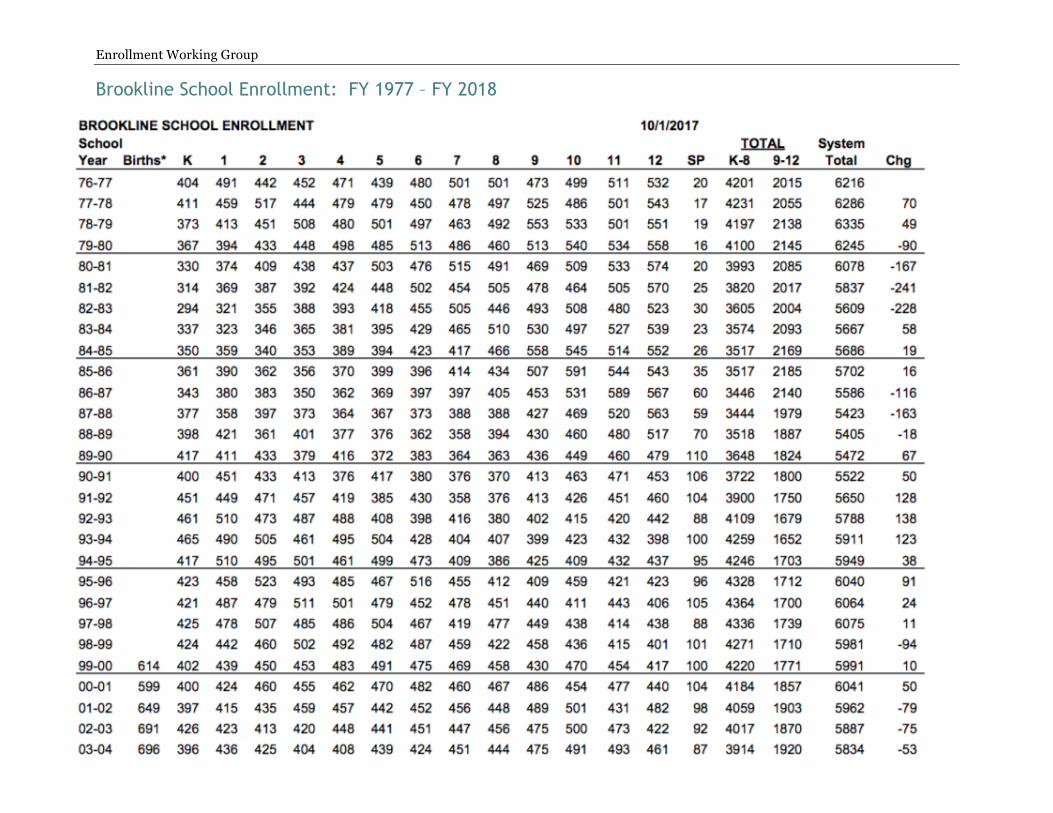
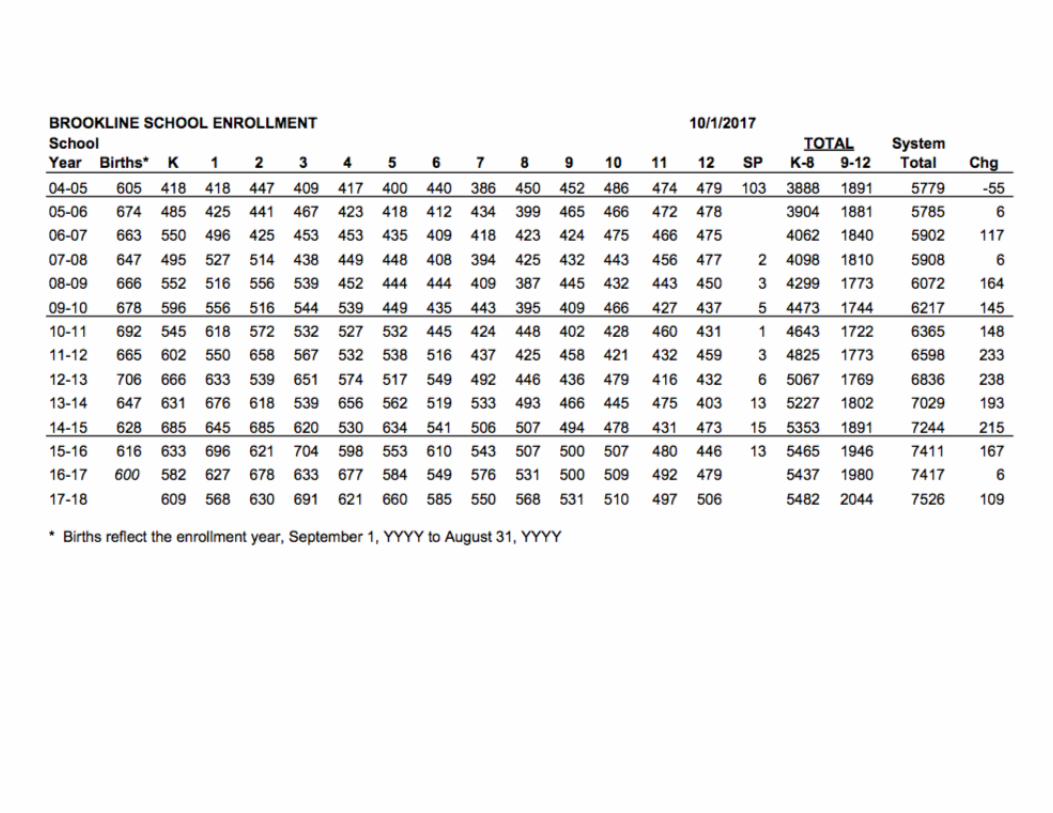
Brookline School Enrollment: FY 1977 – FY 2018
Enrollment Working Group
36 �
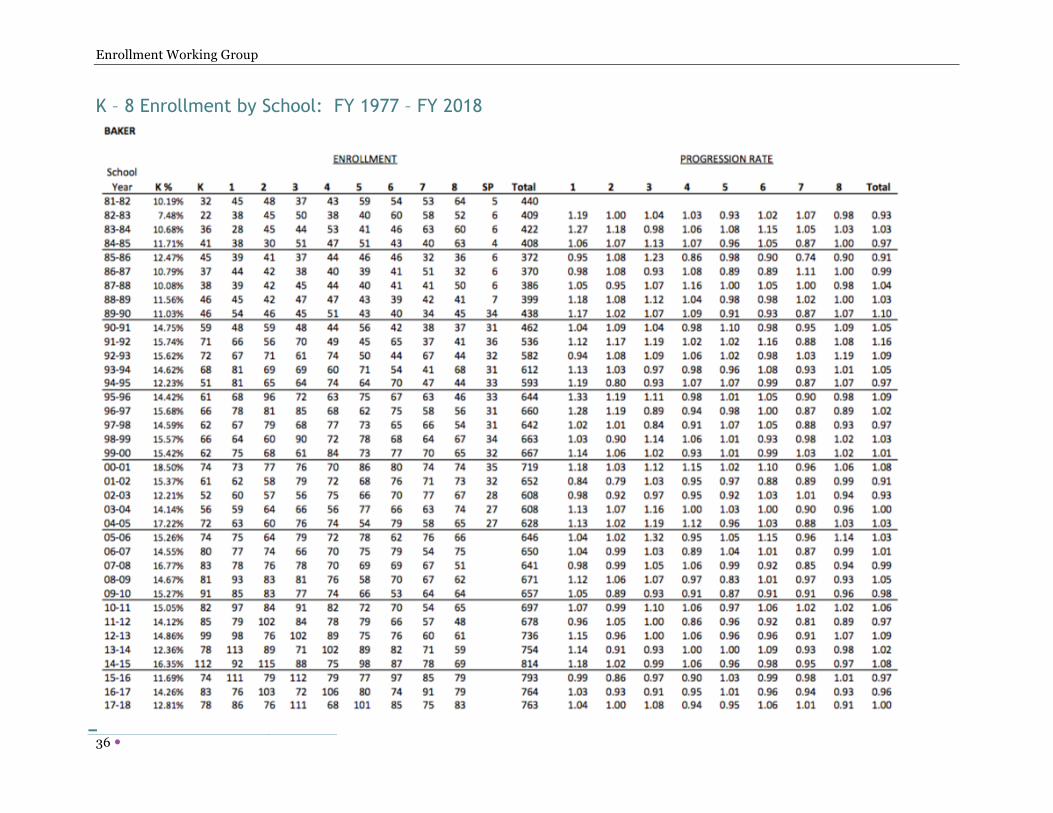
K – 8 Enrollment by School: FY 1977 – FY 2018
Enrollment Working Group
37 �
Enrollment Working Group
38 �
Enrollment Working Group
39 �
Enrollment Working Group
40 �
Enrollment Working Group
41 �
Enrollment Working Group
42 �
Enrollment Working Group
43 �
Enrollment Working Group
44 �
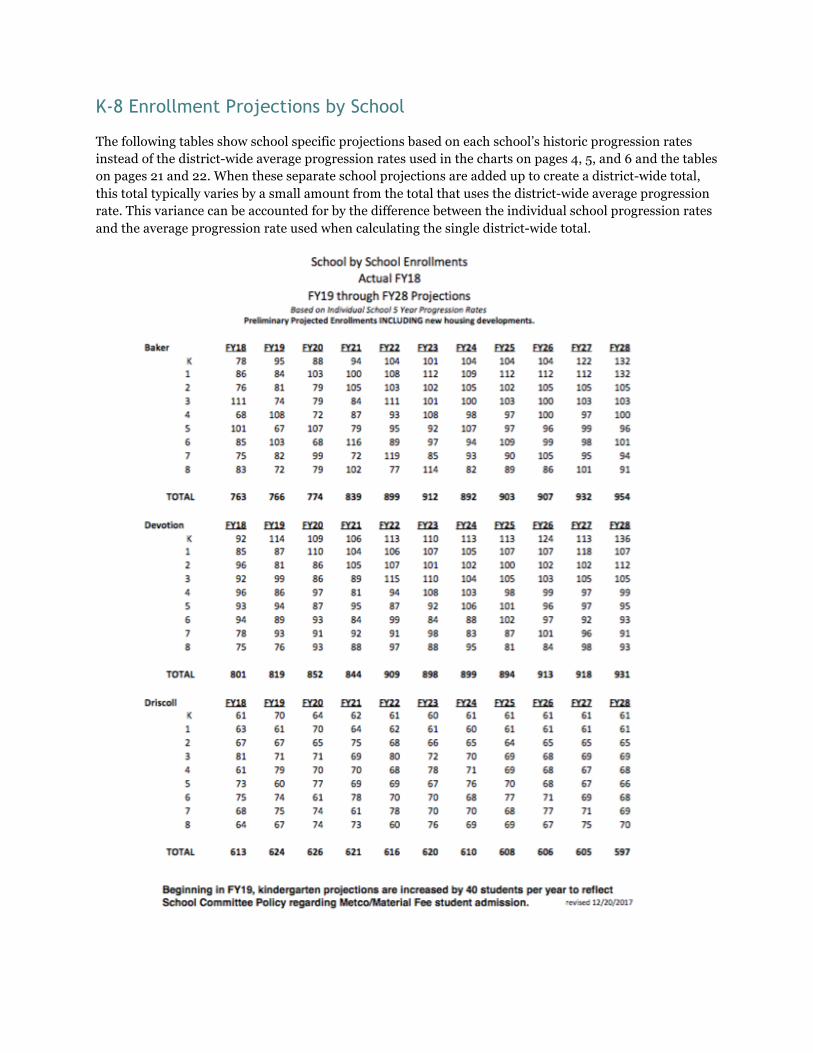
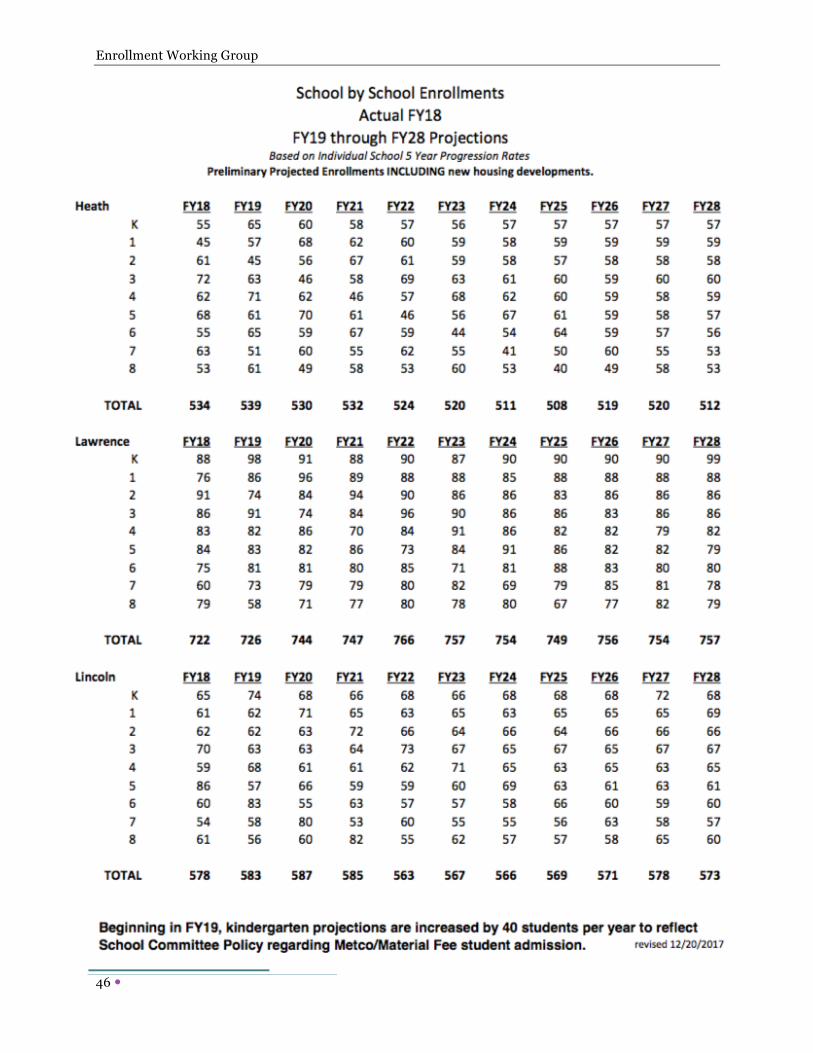
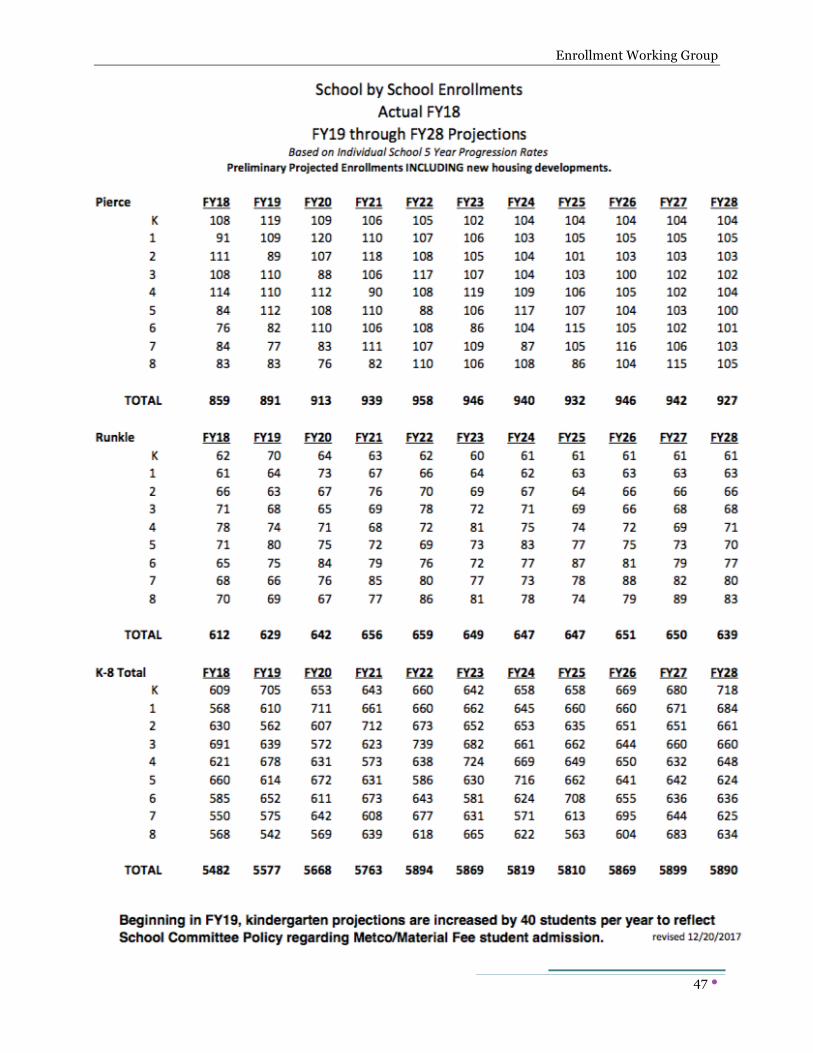
K-8 Enrollment Projections by School
The following tables show school specific projections based on each school’s historic progression rates instead of the district-wide average progression rates used in the charts on pages 4, 5, and 6 and the tables on pages 21 and 22. When these separate school projections are added up to create a district-wide total, this total typically varies by a small amount from the total that uses the district-wide average progression rate. This variance can be accounted for by the difference between the individual school progression rates and the average progression rate used when calculating the single district-wide total.
Enrollment Working Group
46 �
Enrollment Working Group
47 �
Enrollment Working Group
48 �
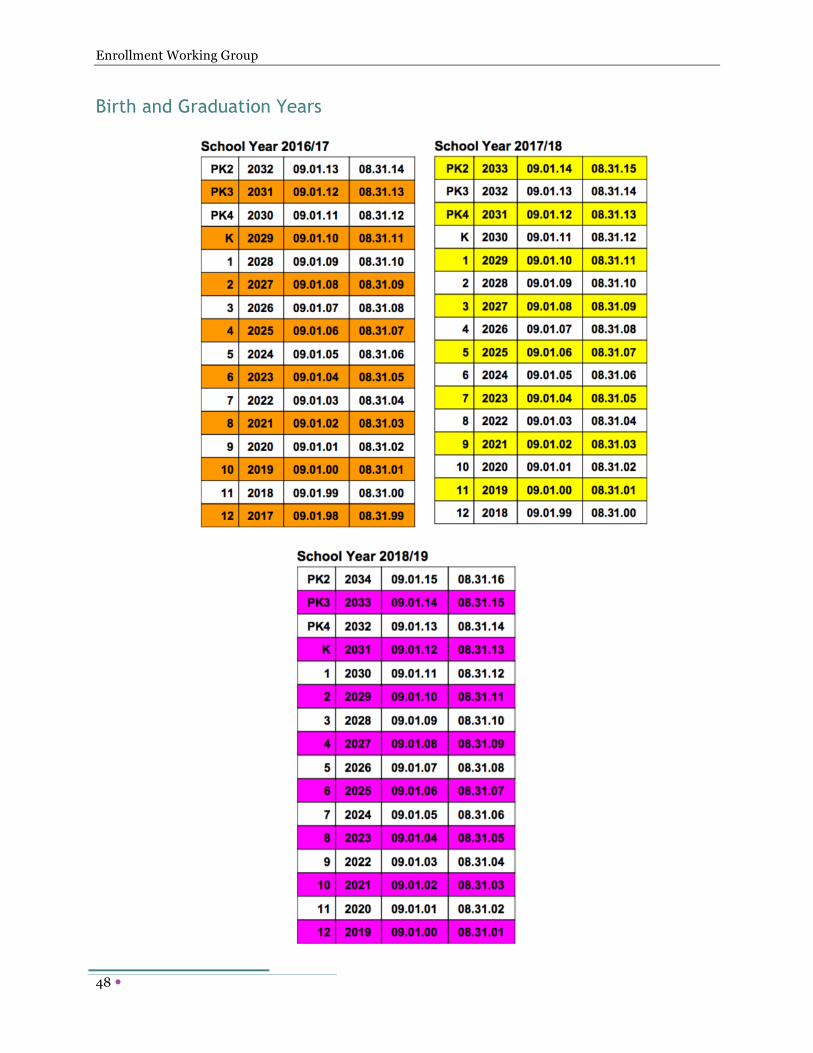
Birth and Graduation Years
Enrollment Working Group
49 �
Residential Zoning & Permitting In 1961-1962, Brookline zoning went through major map revisions, reducing the area of Town zoned for apartment land use, and adding Floor Area Ratio (FAR) as a tool to define density (in addition to height and lot coverage). Although the overall zoning change reduced the amount of land zoned for apartment use16, zones allowing multifamily uses in some cases changed to higher height allowances by right than previous zoning maps.17 In 1970, rent control was enacted, and the first major downzoning amendment was in 1973.18 The Town continued to downzone multifamily districts through zoning maps adopted in 1979, and 1986-1987.
In this current economically driven development cycle, the Greater Boston area has seen a very high demand for new apartment construction. These regional market forces have coincided with the quickly-closing timeframe when developers will be able to propose residential developments using a comprehensive permitting process at densities greater than those otherwise allowed by local zoning in Brookline, through the state’s Chapter 40B law and regulations, which applies only in communities with less than 10% affordable housing units. Once 10% of Brookline’s existing and permitted housing units are designated affordable per state standards, the Town will be able to return to its full local authority to permit residential development according to Brookline’s local zoning. This closing development window was highlighted to the general public when The Residences of South Brookline (the first 40B Hancock Village proposal of 161 rental units) was permitted, temporarily raising the town’s affordable housing inventory to 9.2%. However, that project’s construction delay meant that the 161 permitted units came off the state’s inventory of affordable units, and Brookline’s percentage of affordable housing units on the state’s inventory is now back to 8.6%.
Until Brookline reaches the 10% inventory threshold, any 40B applications filed with the Zoning Board of Appeals (ZBA) will be in the queue of potential 40B projects that must be considered by the ZBA. As illustrated in the attached list of pending 40B development projects already in the 40B permitting queue, this “closing window” effect may result in over 1,000 new residential units in this development cycle.
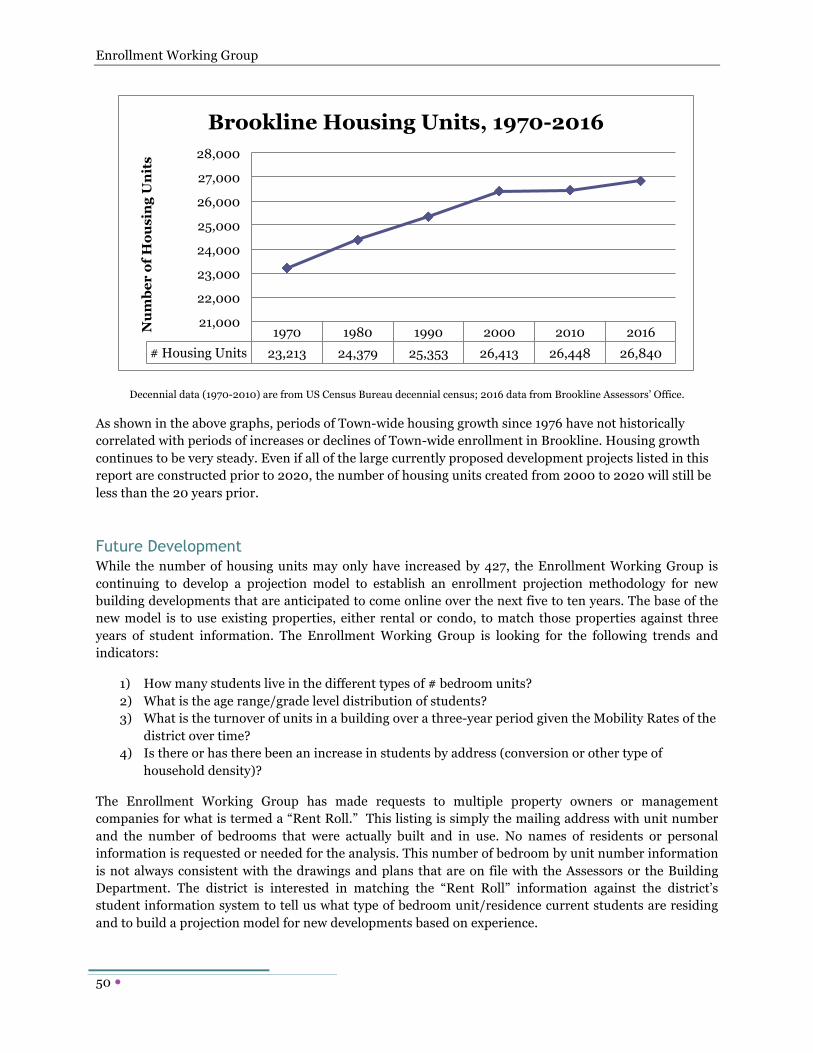
Number of Housing Units Stable Since 2000 Data from the United States Census Bureau’s decennial census show a consistent increase in the number of housing units added to the overall Brookline housing stock between 1970 and 2000, adding about 1,000 net new units every decade. In 2000-2010, that trend halted and there was no significant change in the overall housing stock. As of January 1, 2016, the Assessors’ records indicate 26,840 total housing units19.
16 1976 Comprehensive Plan, p. 3 17 New Zoning for Brookline Report, October 1961, page iii and preliminary zoning map 18 1989 Brookline Comprehensive Plan, p. 27 19 Includes taxable and non-taxable properties, e.g., Brookline Housing Authority units.
Enrollment Working Group
50 �
Decennial data (1970-2010) are from US Census Bureau decennial census; 2016 data from Brookline Assessors’ Office.
As shown in the above graphs, periods of Town-wide housing growth since 1976 have not historically correlated with periods of increases or declines of Town-wide enrollment in Brookline. Housing growth continues to be very steady. Even if all of the large currently proposed development projects listed in this report are constructed prior to 2020, the number of housing units created from 2000 to 2020 will still be less than the 20 years prior.
Future Development While the number of housing units may only have increased by 427, the Enrollment Working Group is continuing to develop a projection model to establish an enrollment projection methodology for new building developments that are anticipated to come online over the next five to ten years. The base of the new model is to use existing properties, either rental or condo, to match those properties against three years of student information. The Enrollment Working Group is looking for the following trends and indicators:
1) How many students live in the different types of # bedroom units? 2) What is the age range/grade level distribution of students? 3) What is the turnover of units in a building over a three-year period given the Mobility Rates of the
district over time? 4) Is there or has there been an increase in students by address (conversion or other type of
household density)?
The Enrollment Working Group has made requests to multiple property owners or management companies for what is termed a “Rent Roll.” This listing is simply the mailing address with unit number and the number of bedrooms that were actually built and in use. No names of residents or personal information is requested or needed for the analysis. This number of bedroom by unit number information is not always consistent with the drawings and plans that are on file with the Assessors or the Building Department. The district is interested in matching the “Rent Roll” information against the district’s student information system to tell us what type of bedroom unit/residence current students are residing and to build a projection model for new developments based on experience.
1970 1980 1990 2000 2010 2016 # Housing Units 23,213 24,379 25,353 26,413 26,448 26,840
21,000
22,000
23,000
24,000
25,000
26,000
27,000
28,000 N
umbe
r of
Hou
sing
Uni
ts
Brookline Housing Units, 1970-2016
Enrollment Working Group
51 �
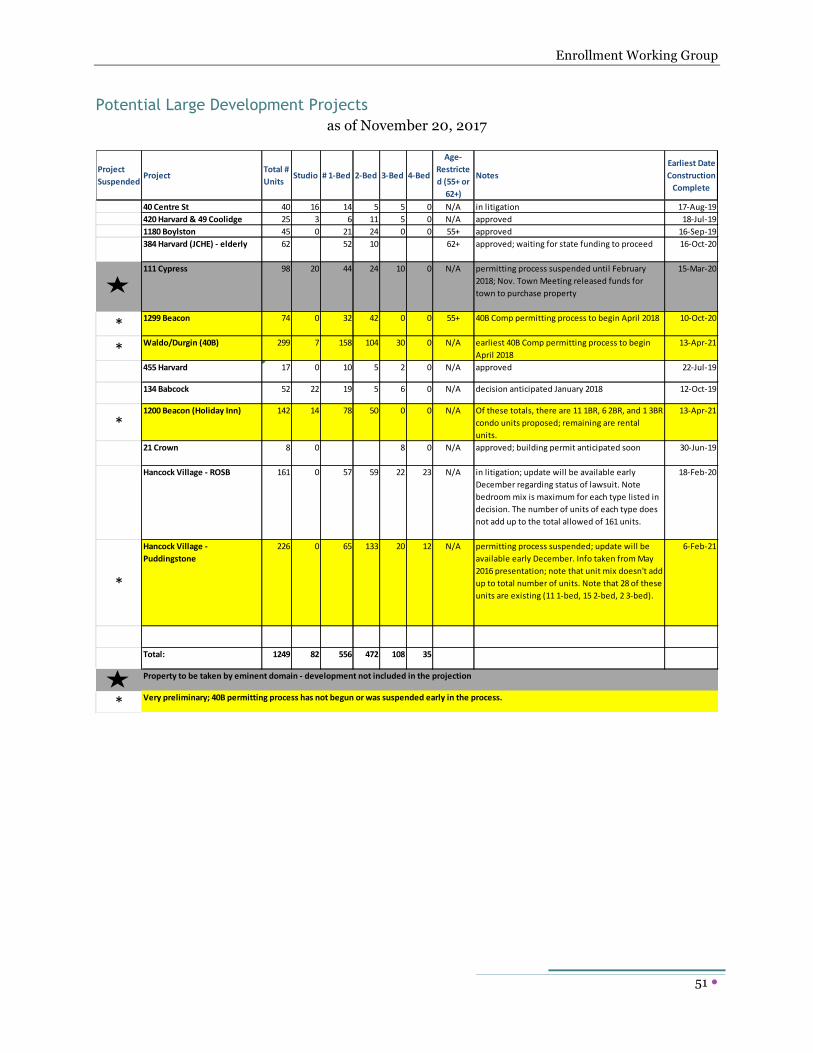
Potential Large Development Projects as of November 20, 2017
ProjectSuspended
ProjectTotal#Units
Studio #1-Bed 2-Bed 3-Bed 4-Bed
Age-Restricted(55+or62+)
NotesEarliestDateConstructionComplete
40CentreSt 40 16 14 5 5 0 N/A inlitigation 17-Aug-19420Harvard&49Coolidge 25 3 6 11 5 0 N/A approved 18-Jul-191180Boylston 45 0 21 24 0 0 55+ approved 16-Sep-19384Harvard(JCHE)-elderly 62 52 10 62+ approved;waitingforstatefundingtoproceed 16-Oct-20
*111Cypress 98 20 44 24 10 0 N/A permittingprocesssuspendeduntilFebruary
2018;Nov.TownMeetingreleasedfundsfortowntopurchaseproperty
15-Mar-20
* 1299Beacon 74 0 32 42 0 0 55+ 40BComppermittingprocesstobeginApril2018 10-Oct-20
* Waldo/Durgin(40B) 299 7 158 104 30 0 N/A earliest40BComppermittingprocesstobeginApril2018
13-Apr-21
455Harvard 17 0 10 5 2 0 N/A approved 22-Jul-19
134Babcock 52 22 19 5 6 0 N/A decisionanticipatedJanuary2018 12-Oct-19
*1200Beacon(HolidayInn) 142 14 78 50 0 0 N/A Ofthesetotals,thereare111BR,62BR,and13BR
condounitsproposed;remainingarerentalunits.
13-Apr-21
21Crown 8 0 8 0 N/A approved;buildingpermitanticipatedsoon 30-Jun-19
HancockVillage-ROSB 161 0 57 59 22 23 N/A inlitigation;updatewillbeavailableearlyDecemberregardingstatusoflawsuit.Notebedroommixismaximumforeachtypelistedindecision.Thenumberofunitsofeachtypedoesnotadduptothetotalallowedof161units.
18-Feb-20
*
HancockVillage-Puddingstone
226 0 65 133 20 12 N/A permittingprocesssuspended;updatewillbeavailableearlyDecember.InfotakenfromMay2016presentation;notethatunitmixdoesn'tadduptototalnumberofunits.Notethat28oftheseunitsareexisting(111-bed,152-bed,23-bed).
6-Feb-21
Total: 1249 82 556 472 108 35
* Verypreliminary;40Bpermittingprocesshasnotbegunorwassuspendedearlyintheprocess.
Propertytobetakenbyeminentdomain-developmentnotincludedintheprojection