Embed Size (px)
Citation preview
AKADEMIN FÖR TEKNIK OCH MILJÖ Avdelningen för industriell utveckling, IT och samhällsbyggnad
A methodology development for layout
planning regarding gates in marine terminals
A case study in a Swedish port
Amanda Berglund
Emelie Altzar
2017
Bachelor’s degree, thesis, 15p
Industrial Management and Logistics
Supervisor: Robin von Haartman
Examiner: Ming Zhao


i
Foreword
As this thesis represent the end of our journey at University of Gävle, we would like
to thank everyone involved in the three years at the program of Industrial
Management and Logistics. Thank you, our supporting family, friends and partners
for the motivation you have given us since this journey started.
We would like to thank our thesis supervisor Robin von Haartman for his
supervision and guidance throughout this project. We highly appreciate the time
you have been given us and all the feedback. We would also like to thank Ming
Zhao, our examiner for the guidance during the initiation of the thesis.
A special thank you to the persons at Yilport who have provided us with great
knowledge and valuable information. Thank you to all the interviewees both at
Yilport and Gävle hamn who has answered all our questions with enthusiasm and we
appreciate all the time you have given us.
Last but not least we would like to thank each other for three years of studies
together, where we have motivated and complemented each other on both personal
and academic level. This thesis has opened up and extended our knowledge and
motivated us for future research within the subject of logistics and improvements.
Thank you.
_________________ ________________
Amanda Berglund Emelie Altzar
University of Gävle, June 2017
ii
Abstract
Purpose: The research purpose is to, in a systematic way, build a method to
develop suggestions regarding layout planning of gates in a marine terminal and
additionally conduct a base for a simulation model.
Approach: Firstly, a literature review has been conducted in the fields relevant to
port security and gate configurations in marine terminals. Secondly, a case study has
been executed in a Swedish marine terminal. The case study consisted of interviews
and observations at the case company, who also provided this thesis with numerical
raw data. Additionally, a benchmarking was conducted at a company in the same
port area where interviews and observations was executed.
Findings: The findings in this thesis resulted in a methodology improvement,
which contains important procedure steps that need to be considered while
conducting a layout for a gate in a marine terminal. The procedure resulted in a
conceptual model that was conducted as a result of the literature review and verified
by being tested in the case study.
Limitation: The thesis is limited to one case company. Even though it verified and
validated the findings, additional case companies are recommended to fully validate
the conceptual model which applies for further research. Further limitations to this
thesis is that the financial- and technical factors will not be executed.
Theoretical implications: Companies who plans to increase the security in their
marine terminal area or implement a new gate system can benefit from the findings.
This thesis contributes to science by adding new theory.
Practical implications: This thesis conducted a conceptual model for a layout
procedure which recommends to follow while planning a layout for a gate in a
marine terminal. The model were verified with a case company and provided two
layout suggestions that can be implemented at the specific company.
Keywords: port security, gate configuration, gate layout, marine terminal, layout procedure

iii
Dictionary
Bulk material Material which is ordered, stored, issued and sold either
by weight, volume or footage. For example road salt,
sawn timber and anthracite.
Bulk terminal Port terminals that are handling and storing non-
containerized bulk cargo.
CFS Container freight station.
Containerization A system of standardized transport that use a steel
container to transport goods in.
Cost-benefit-analysis A systematic approach to estimating the weaknesses and
strengths of alternatives regarding costs.
IDT Improper documents.
IMO International Maritime Organization.
Innovation Could be defined as a new idea which is functional,
hopeful and has not been introduced by anyone before.
Intermodal terminal A terminal which is handling the cargo with different
transportation modes.
ISPS International Ship and Port facilities Security code.
KPI Key performance indicators
Multi-purpose terminal A terminal which is handling various types of cargo.
SLP Systematic layout planning.
Sub-system Group of connected parts that performs an important
task as a component of a larger system.
Tare The weight of an empty truck or container.
TEU Twenty-foot Equivalent Unit. An inexact unit of cargo
capacity often used to describe the capacity of container
terminals.
WIP Work in progress.

iv
Table of content
Foreword .....................................................................................................
Abstract .......................................................................................................
Dictionary ....................................................................................................
Table of content .........................................................................................
Figures ....................................................................................................
Tables .....................................................................................................
1. Introduction ........................................................................................ 1
1.1 Background .................................................................................... 1
1.2 Research purpose ............................................................................ 2
1.3 Research questions ........................................................................... 2
1.4 Research limitations ......................................................................... 2
2. Theoretical background........................................................................... 3
2.1 Security within marine terminals .......................................................... 3
2.2 Intermodal terminals ........................................................................ 4
2.3 Gate operations ............................................................................... 4
2.4 Gate configurations .......................................................................... 6
2.4.1 Weighbridge ............................................................................ 7
2.4.2 Truck dimensions ...................................................................... 7
2.5 Localization of gates ......................................................................... 8
2.6 Flow efficiency ............................................................................... 8
2.7 Queue theory ................................................................................. 9
2.8 Sustainability within layout planning ..................................................... 9
2.9 Simulation of layouts ....................................................................... 10
2.10 Systematic layout planning ............................................................. 11
2.10.1 Layout planning methods ............................................................ 12
3. Conceptual model ................................................................................ 15
4. Research methodology ........................................................................... 20
4.1 Approach ..................................................................................... 20
4.1.1 Interviews .............................................................................. 21
4.1.2 Observations ........................................................................... 22
4.1.3 Benchmarking ......................................................................... 23
4.1.4 Raw data from Yilport ............................................................... 24
4.2 Data analysis ................................................................................. 24
4.3 Critical review of methodology .......................................................... 25
v
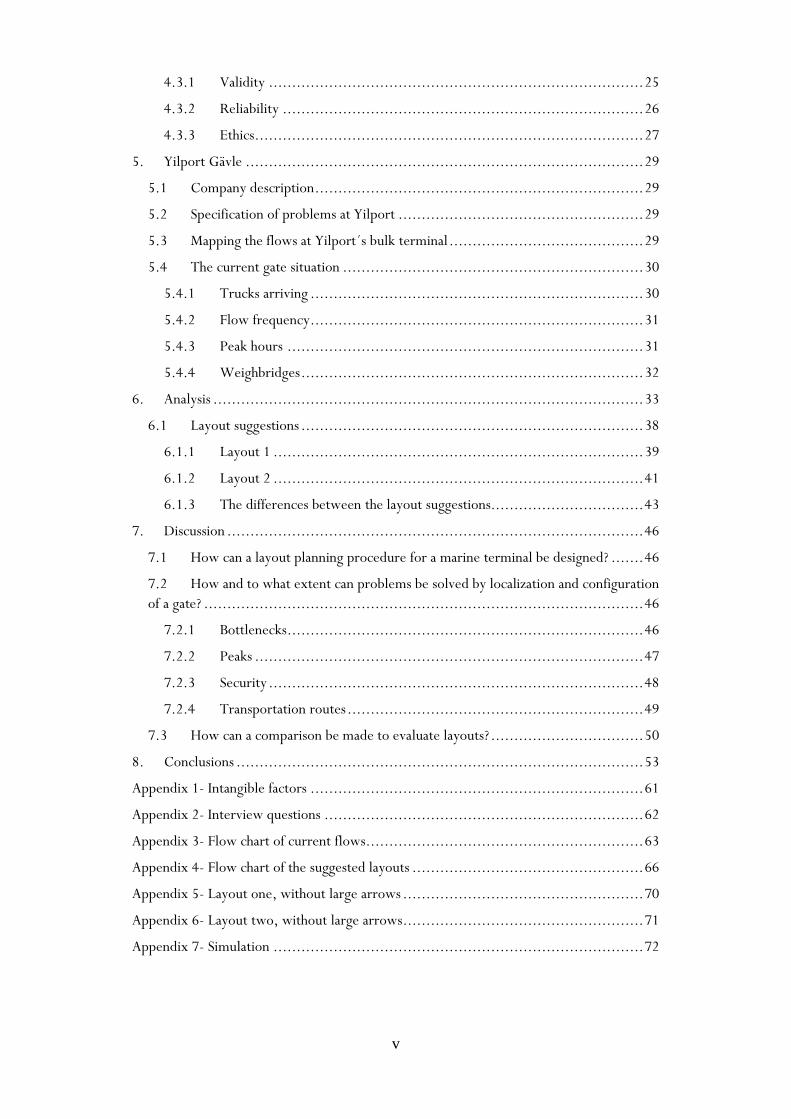
4.3.1 Validity ................................................................................. 25
4.3.2 Reliability .............................................................................. 26
4.3.3 Ethics .................................................................................... 27
5. Yilport Gävle ...................................................................................... 29
5.1 Company description ....................................................................... 29
5.2 Specification of problems at Yilport ..................................................... 29
5.3 Mapping the flows at Yilport´s bulk terminal .......................................... 29
5.4 The current gate situation ................................................................. 30
5.4.1 Trucks arriving ........................................................................ 30
5.4.2 Flow frequency ........................................................................ 31
5.4.3 Peak hours ............................................................................. 31
5.4.4 Weighbridges .......................................................................... 32
6. Analysis ............................................................................................. 33
6.1 Layout suggestions .......................................................................... 38
6.1.1 Layout 1 ................................................................................ 39
6.1.2 Layout 2 ................................................................................ 41
6.1.3 The differences between the layout suggestions................................. 43
7. Discussion .......................................................................................... 46
7.1 How can a layout planning procedure for a marine terminal be designed? ....... 46
7.2 How and to what extent can problems be solved by localization and configuration
of a gate? ............................................................................................... 46
7.2.1 Bottlenecks ............................................................................. 46
7.2.2 Peaks .................................................................................... 47
7.2.3 Security ................................................................................. 48
7.2.4 Transportation routes ................................................................ 49
7.3 How can a comparison be made to evaluate layouts? ................................. 50
8. Conclusions ........................................................................................ 53
Appendix 1- Intangible factors ........................................................................ 61
Appendix 2- Interview questions ..................................................................... 62
Appendix 3- Flow chart of current flows............................................................ 63
Appendix 4- Flow chart of the suggested layouts .................................................. 66
Appendix 5- Layout one, without large arrows .................................................... 70
Appendix 6- Layout two, without large arrows .................................................... 71
Appendix 7- Simulation ................................................................................ 72

vi
Figures
Figure 1. Systematic layout planning (Muther1973 p.2-2) ....................................... 13
Figure 2. Layout procedure (Andreasson 1997 p.13) ............................................. 14
Figure 3. The conceptual model ...................................................................... 15
Figure 4. Flowchart over Yilport area ............................................................... 30
Figure 5.The gate area that will be used ............................................................. 38
Figure 6. Layout suggestion one ...................................................................... 40
Figure 7. Layout suggestion two ...................................................................... 42
Tables
Table 1. Interviews ...................................................................................... 22
Table 2. Observations .................................................................................. 23
Table 3. Percentage of total flows that needs to weigh ........................................... 31
Table 4. Calculated differences ....................................................................... 45
1
1. Introduction
In this chapter an introduction to the subject of the thesis with its purpose, research questions
and limitations will be stated.
1.1 Background
Maritime security has since the terror attack 11th of September 2001 emerged as an
important international issue and since seaports are handling a large amount of
cargo, ports can be seen as a vulnerable target (Chang & Thai 2016;Yeo et al. 2013;
Yoon & Gim 2014). To enhance the security the International Ship and Port facility
Security code (ISPS) and International Convention for the Safety of Life at Sea
(SOLAS) regulations have been adopted internationally (Yoon & Gim 2014).
World trade has been increasing dramatically in the last two decades (Kotachi et al.
2013). It all started with the introduction of containers in maritime shipping year
1956 which was revolutionary (Fabiano et al. 2010). The introduction lowered the
freight transportation costs, brought improvements in port handling efficiency and
was greatly boosting the trade flows (Chen et al. 2011). An additional reason is that
marine transportation is the most economical, and for some bulk cargo the only
means to use (Altiok 2000).
In present, about 90 percentage of the world's cargo value is transported by sea
which means that the maritime trade is important to international transportation
(Altiok 2000; Phan & Kim 2015; Yoon & Gim 2014), this in fact has resulted in that
the growth has created many challenges for seaports (Chen et al. 2011). Many
seaports are running their facilities at, or near, their maximum capacity which has
led to long waiting times for trucks, delays and increased environmental impacts
(Chen et al. 2011). The introduction of larger vessels has also led to that more cargo
are being loaded at the same time, which has resulted in problems like peaks and
congestions for the trucks within marine terminals and at gates (Motono et al. 2016;
Phan & Kim 2015).
To solve the problems that commonly occurs at gates at marine terminals, one
method that can be used is layout planning (Chen et al. 2013). By the use of layout
planning the security systems at the gate in the marine terminal can be considered
and examined to fit the needs of the organization (Zhang et al. 2017). To evaluate if
the layout will solve the specific problems, Banks (1998) states that the use of
simulation is a good problem solving methodology. Simulation can therefore be used
as a decision support tool to determine the infrastructure layout (Keceli 2016).

2
There is a lack of existing theory regarding gate operations for multi-purpose
terminals (Keceli 2016), and for that reason the subject is up-to-date and important
to gain more knowledge about. This thesis work will therefore bring new value to
the existing theory and introduce a methodology procedure for gate layouts in
marine terminals. This thesis will also indicate that layout planning of gates at a
marine terminal can increase the security at the port.
1.2 Research purpose
The research purpose is to, in a systematic way, build a method to develop
suggestions regarding layout planning of gates in a marine terminal and additionally
conduct a base for a simulation model.
1.3 Research questions
How can a layout planning procedure for a marine terminal be designed?
How and to what extent can problems be solved by localization and
configuration of a gate?
How can a comparison be made to evaluate layouts?
1.4 Research limitations
The study is limited to layout planning for an entrance gate for trucks and road
vehicle traffic at a marine terminal. The technical and economic aspect will not be
considered in this thesis project but will need to be considered in the upcoming
detailed planning of the gate entrance.

3
2. Theoretical background
The literature review is based on academic journals which all treats the subjects; logistics in
port operations and the problems that can occur around gates in marine terminals as well as
layout planning. The academic journals are found in the databases Science direct, Emerald
and Discovery. Keywords to find the appropriate journals are e.g. port logistics, gate
operations, queue theory, gates and port security. Other literature, books and reports are used
to gain more understanding of the fundamental concepts. This chapter is structured by the
problems that are found in the literature review which is based on the research aim. The topics
that will be described will contain information about security within marine terminals, overall
gate operations and configuration, intermodal terminals, flow efficiency and layout planning.
2.1 Security within marine terminals
Following the tragic terror attacks 11th of September 2001 and the increasing world
trade, the maritime security has attracted more attention (Chang & Thai 2016;
Kotachi et al. 2013). Ports, due to the large-volume flow of cargo and worldwide
connection, constitutes issues regarding both cargo theft and terrorism attacks. To
improve and strengthen maritime security there have been significant security
initiatives, such as the International Ship and Port Facilities Security code (ISPS)
through which ports and ships can cooperate internationally to detect threats.
(Chang & Thai 2016; Yeo et al. 2013; Yoon & Gim 2014). ISPS was first adopted by
the United Nations’ international maritime organization (IMO) in December 2002
and is now a law. Following the terrorist attack, the security regarding ports and
international agreements were conducted extremely fast, even though the general
international cooperation process regarding law agreements often take time. (Yeo et
al. 2013). According to Nurthen (2003) the physical security at ports specifically
refers to gates and guards at the area, and he states that every truck that is entering
the marine terminal need to show required documents to be able to load or unload
goods.
It is important not only to detect external threats but internal threats as well. There
can for example be huge incidents if dangerous cargo are mistreated. The impact of
those scenarios can therefore put both the personnel and the materials at risks. The
implementation of security systems do often as a result that consist more systems
than ISPS. Examples of these are Container Security Initiatives (CSI) and the
International Convention for the Safety of Life at Sea (SOLAS), among others
(Chang & Thai 2016; Yoon & Gim 2014). Unfortunately the requirements among
the different systems and initiatives are often overlapping and contradictory to each
other (Chang and Thai 2016).
4
Yoon and Gim (2014) argues that the systems requirements have changed the
logistics regarding worldwide supply chain security. The new security system has
led to a new role for trade and transportation of cargo. It is because of that, and the
increasing global trade, that a total of 90 percentage of the world's cargo value, now
are transported by sea (Kotachi et al. 2013; Yoon & Gim 2014).
According to Chang and Thai (2016) there are more to be expected from security
systems than only security itself. These implementations often have an impact on
service quality too, because it can offer a higher value. Chang and Thai (2016) also
states that high service quality results in a higher customer satisfaction, which impact
the customer loyalty. Because of the great volume of cargo transported by sea, the
safety and security to the specific cargo is an aspect that may affect the customer's
satisfaction. (Chang & Thai 2016). An alternative view is put forward by Yeo et al.
(2013) who states that implementation of security systems can enhance the security
costs to a level so high that it can diminish the competitiveness. The establishment of
the security framework in some cases lack of an integrated strategy which is crucial
in any operation. To the security level, there must be a cost-benefit-analysis to
verify the costs related to expected security. (Yeo et el. 2013).
2.2 Intermodal terminals
The development of globalization and containerization has led to the fact that ports
have to develop their infrastructure, capacity and services (Demirbas et al. 2014;
Dwarakish & Salim 2015; Rodrigue & Notteboom 2010). This has also resulted in
the concept intermodality, which functions as a key component in marine terminals
(Demirbas et al. 2014). Intermodality which is the integration of different transport
modes, has to ensure continuous flows, smoother connections, cost reduction and
good information flows (Demirbas et al. 2014; Kozan 2000). Those who choose to
use a intermodal terminal do often want to reduce handling times, secure delivery
times and have the ability to monitor their parcel (Kozan 2000).
2.3 Gate operations
Many seaports are running their facilities at, or near, their maximum capacity and
the great growth in international trade has created some challenges for them.
Because of the low capacity at many marine terminals, a lot of trucks have to wait at
gates at marked areas for an extended period of time. (Chen & Yang 2014; Chen et
al. 2011). This results in delays, which hamper the overall productivity of the freight
transportation system and also have a negative effect on the environmental impacts.
(Chen et al. 2011). Keceli (2016) also argue that another factor that can hamper the
5
efficiency in an intermodal terminal is if different types of cargo transports through
the same gates in both directions. The truck traffic for the different flows with
different cargo will in this case overlap each other at the gates and cause risks for
bottlenecks (Keceli 2016).
Many seaports are having problems with traffic congestions at their terminal and the
problems have been increasing over the last years due to more oversea
transportation. This resulted in more concentrated arrivals of road trucks during
peak hours. (Phan & Kim 2015). Due to the increasing oversea transportation the
vessels are built larger and larger, which causes higher peaks at seaport terminals and
even greater landside congestion since more cargo needs to fill the vessel (Motono
et al. 2016). The workflow for when a truck arrives at a port can be described as:
The truck arrives at the gate at the terminal and randomly chooses an entry gate.
The time for the arriving trucks are either within an assigned appointment time
window or at their preferred time. (Chen et al. 2011). During peak hours, or
anytime during the day, there is a risk for a queue (Phan & Kim 2015). The truck
drivers arrive with the required paperwork so they can enter the terminal and
proceed to the given area to load or unload cargo. During peak hours, or anytime
during the day, there might be a queue here as well. When the truck has been
loaded or unloaded the truck return to the terminal gate and randomly choose an
exit gate. Here, the possibility of queues are often low. (Chen et al. 2011).
To reduce the problems caused by the truck arrival pattern at ports during peak
hours, Phan and Kim (2015) states that an appointment system can be used. By
applying appointment systems for road trucks during peak hours, the peaks can be
smoother and thus reduce the waiting times and the environmental impacts. To find
out about the handling capacity during certain hours, the trucking companies can
communicate with the operators at the terminal, to plan the arrivals of trucks to
load or unload cargo at the terminal. They can therefore plan the dispatch of trucks
to the terminal.
The most commonly way to use an appointment system in maritime terminals is to
pre-set the maximum number of trucks who can pass a terminal gate within a
timeframe. (Phan & Kim 2015). To control truck traffic and the impact from them,
a fee program can be used at maritime terminals. The trucks that arrives during
certain hours a day, mostly peak hours, will be liable to pay a fee to load or unload
the trucks. The objective with the program is to smoothen the peaks and to get a
more efficient flow on the hinterland transport chains. (Giuliano & O´Brien 2008).
The problem can also be handled by a system that provides the information of the
accurate congestion status at the port to the truck drivers. The driver's
responsibility, however, is to announce and/or register their truck IDs, information
regarding their purpose at the port and cargo information a day before entrance.
(Motono et al. 2016).

6
To deal with the problem of landside congestion, there are many ports that uses
appointments for flattening the arrival peaks and/or additionally increase the
number of gate lanes (Motono et al. 2016). Unfortunately these efforts do not end
up solving the congestion problem to its fullest. Motono et al. (2016) discovered in
their research that yet another factor were crucial to enhance the congestions. They
stated that ports that implement peak reducing methods or building more lanes
takes for granted that the trucks are carrying the correct documents. However, in
many cases the truck arrive with improper documents (IDTs) which affect the gate
service time negatively. If ports demand the truck drivers to carry the right papers,
the service time and gate queues can be greatly reduced. Yet this can still be a
problem within terms of communication, therefore, a web-based IT system can be
suggested. A study on Hakata port in Japan, introduced such an IT system (that
provides information about container delivery, congestion status and which
information needed to enter the port) which eliminated the IDTs and made the gate
service time more efficient. (Motono et al. 2016).
2.4 Gate configurations
One critical issue for marine terminals is the gate capacity. If the capacity is limited
and not enough, it will lead to traffic congestion and high costs for the queueing
trucks. (Guan & Liu 2009). Queue reduction can be achieved by expansion of the
gate or by layout planning (Chen et al. 2013). When planning for a layout in a queue
based system, e.g. a gate system, there are some time-dependent parameters that
have to be considered. The arrival rate and number of servers are two of them. The
changes in those two parameters can have a substantial influence on a queueing
systems performance. (Schwarz et al. 2016). Even the gate service rate is a
parameter that is changing over time and have an impact on the performance of the
queueing system (Chen & Yang 2014). Many marine terminals are daily dealing with
the truck queues and it has become an important task for them. It is essential to
understand the traffic features of the vehicle flow and how the queue generates and
expand to estimate the length of the queue. The length of the queue is an important
factor when applying demand management to reduce congestion, and how to use
existing facilities. (Chen & Yang 2014). To tackle performance issues within port
facilities, numerical techniques is commonly used and simulation models is one of
them. The use of stochastic models have a great impact on improving the efficiency
of port terminal operations. (Cimpeanu et al. 2017).

7
According to Motono et al. (2016) there are many ports attempting to relieve the
congestion by increasing the lanes at the gate. Even expanding the terminal area or
adding additional cargo handling equipment are solutions that often are used in
marine terminals (Motono et al. 2016). During the day it often occurs that the gate
has two peak hours when more trucks are arriving at the same time (Chen et al.
2013; Motono et al. 2016).
2.4.1 Weighbridge
A weighbridge is the key measuring device in logistics, transportation system and
freight forwarding. The bridge has in general 4-12 load cells which are distributed
symmetrically under the receptor of the bridge. The load cells are connected to
measure the weight of the load. (Lin et al. 2015; Lin et al. 2017). According to
Mondragon et al. (2012) the weighbridges are commonly used in the bulk material
handling process as follows: When the trucks who need to use a weighbridge arrives
at the marine terminal, they first need to weigh the goods or the tare of the truck.
After the loading or unloading, the truck will return to the weighbridge to weigh
the tare of the truck or the goods loaded to count the weight of the goods. When
vessels arrives to the port for unloading bulk cargo the process are slightly different.
The trucks will first have to determine the tare weight at the weighbridge and only
then be loaded with the bulk material from the vessel, return to the weighbridge and
get the weight of the loaded goods. After that, the trucks will go to a certain area to
unload the bulk material and then back to the vessel to be loaded again. Normally
queues and distances have an impact on the timescale of the process. (Mondragon et
al. 2012). The flow at the weighbridge has systematic variations which changes
during certain time-intervals. The arrival statistics to the weighbridge is related to
the arrival rate at the gate. But the first bottleneck, which usually is the
documentation check, can change the arrival rate to the weighbridge and therefore it
can led to that queues occur. (Roadknight et al. 2012).
2.4.2 Truck dimensions
To plan a layout, several authors states that it is important to determine the current
condition and to collect input data (Yang et al. 2000; Tomkins & White 1984;
Andreasson 1997).
According to Transportstyrelsen (2017) the new EU regulations allow a maximum
width on trucks to be 2.6 meters, and the maximum allowed length reaches up to
25,25 meters. The numbers are including the cargo and goods transported by the
trucks. A truck with a length of 25.25 meter has a lock on 12.5 meters that needs to
be considered in the layout calculations so that the truck is able to turn.
8
The area required for trucks driving in curves is dependent on de complexity of axle
location, drive strategy and size of the truck. Nevertheless the greatest truck (25,25
m.) require a general drive width on 10.5 meter which hence correspond to the
requirement for smaller trucks. (Transportstyrelsen 2002).
2.5 Localization of gates
The condition of the infrastructural performance at a marine terminal can have an
impact on the efficiency of port operations and associated sections. Therefore it is
required to provide detailed considerations when designing the infrastructure at a
marine terminal. (Zhang et al. 2017). A multi-factor method can be used to both
consider the location balance and the travelling distance for the trucks and road
vehicles. By considering both those factors the proposed solution will fit both
physical and information infrastructure. (Tao & Qiu 2015).
When planning a layout in a marine terminal there are crucial factors that needs to
be considered (Parola & Sciomachen 2005). The travel time and the route trucks are
travelling from the gate to the service area for loading or unloading are some factors
that affects the flow and waiting time. (Chen et al. 2011; Motono et al. 2016).
Depending on how many different flows and service areas the terminals have, it will
affect the queueing network at the terminal. This proportions are constant during
time and can be analyzed by historical data. (Chen et al. 2011). According to
Mondragon et al. (2012) the time differs depending on the layout of the marine
terminal because of the distance between the berths and the area for tipping or
unloading.
2.6 Flow efficiency
Transport integration in ports often entails some issues, and a lot of them are
connected to transport chain efficiency. There are some evidence that the relation
between port performance and transport integrations exists. Since ports have
become links in global logistics chains the competition between ports have moved
towards a competition between transport chains instead of a competition between
ports. (Ducruet & Van der Horst 2009). There are some key factors all ports must
have to be competitive. These are a high quality on their hinterland transport chains
services and efficient hinterland transport chains. (Demirbas et al. 2014; Ducruet &
Van der Horst 2009; Parola & Sciomachen 2005). According to Parola and
Sciomachen (2005) the efficiency of the logistic chain as a whole is connected to
good coordination of the different transport-links in the system. There are also some
variables that can play an important role for the system as a whole e.g. the gate
where all the trucks arrives every day is an important part of the transport chain and
can influence the efficiency of the system. (Parola & Sciomachen 2005).

9
2.7 Queue theory
Queues occurs due to uncertainty in the environment, when the demand for service
exceeds the ability to provide the service required. There are several factors that
need to be in consideration while managing a queuing system. The average waiting
time and the probability of customers waiting in the system are two of the most
important ones. However, the number of servers shows a distinct differences
between different queue systems. (Zhao et al. 2014).
In an M/M/1 system which has exponential service time, customers arrives at a
random position and are being served in order by the system (Field & Harrison
1999). In a single server queue system, like an M/M/1 system, there are most
likely to observe independent random variables like; number of service completion,
number of arrivals, length of the queue, inter-arrival times and service times
(Chowdhury & Mukherjee 2013).
2.8 Sustainability within layout planning
To respond to the increased attention to sustainability in port operations, ports have
to focus on sustainable practices which includes economic, eco-social and
operational issues. By focusing on sustainable practices organizations can improve
their competitive position within the limits of environmental regulations while they
meet all their stakeholders’ expectations. (Kim & Chiang 2017). Zhang et al.
(2017) describes that port infrastructure need to be maintained to stay efficient and
sustainable because it need to be utilized for a long period of time. One way to find
sustainable solutions for the maintenance planning is by comparing and analyzing
different risks that can occur in the port area. The condition of infrastructural
performance can even affect the efficiency of port operations and also associated
sectors. Therefore it is important to have precise consideration for the design of
port infrastructure. Even an economic and efficient maintenance strategy is essential
to control the daily transportation within the port area. The strategies can be used to
ensure the safety of the port infrastructure and also ensure an optimal level of
serviceability. (Zhang et al. 2017).
According to Mamatok and Jin (2017) air pollution is generated from both seaside
and landside areas of a marine terminal and the different operations on the landside
generates a large amount. Environmental factors are therefore important in the daily
running of port activities. Partly to control the impacts associated with
transportation within the port area, because long truck queues at gates are one
example that can have bad impact on the environment. (Chen et al. 2011; Chen et
al. 2013). Some of the benefits organizations can achieve from application of
sustainable practices in port operations are; cost saving and efficiency

10
improvements, environmental impact minimization and prevention, improved
health and safety and also enhanced employee satisfaction and motivation (Kim &
Chiang 2017).
2.9 Simulation of layouts
Simulation is an imitation of operations of real world systems and processes over
time and are used as an essential problem solving methodology for the solution for
real world problems. Hence, simulation is commonly used to describe and analyze
the behavior of a system. (Banks 1998). With all the different resources working
and interacting in a marine terminal, the system can be too complex and therefore it
is hard to predict a behavior of the system without the use of simulation (Kotachi
2013). Cimpeanu et al. (2017) states that simulation has been successfully used
during the last decades to tackle the behavior of multi-component port systems and
to analyze terminal operations at a marine terminal. The previous exploration of the
terminal operations are the framework for the simulation model and the entire flow
is important to include in the model (Cimpeanu et al. 2017). Often when setting up
a simulation model a geographically map which shows the flows and the activities
will be used. The different activities can thus be detailed simulated in different
models to get the appropriated level of details needed. (Manivannan 1998). To
develop a generic simulation model, data needs to be collected from different papers
and ports, to be able to use the model for different ports without customizing the
model too much (Kotachi 2013). Creswell (2009) states that when the objective is
to test or verify a theory, the researcher will be analyzing the results in relation to
the theory and reflect on the confirmation or disconfirmation of it. To be able to
indicate valid and useful conclusions from a simulation model, the understanding for
the model building and key data inputs are essential factors that need to be
considered (Manivannan 1998). The model can even be used to predict and evaluate
performance gain in a gate system (Cimpeanu et al. 2017).

11
2.10 Systematic layout planning
Olhager (2013) describes a layout as the physical location of resources and states
that the layout design is an important issue concerning the overall production system
and effectiveness. Yang et al. (2000) states that the layout also has a distinct impact
on a manufacturing system as well. According to Gyulai et al. (2016) there are some
practical problems that needs to be in consideration when planning a layout. The
complexity regarding the problems, emerge out of the number of important factors
dependent on the organizations purpose. Generally the physical allocation of
resources, and related logistics including transportation minimizing, are the two
main factors. In addition to that, the layout must suit the overall requirements
regarding production, production numbers, work in progress (WIP) levels,
utilization of the machines etc. Yet another aspect and factor that need to be
determined is on which level the layout should be planned, as on a plant level or as
on a cell level. (Gyulai et el. 2016). Considering that more and more companies
uses flow orientation, the connection and transportation routes binding the
processes together are crucial, which increases the need of a good layout (Olhager
2013). According to Lumsden (2012) it is in fact the routes and how fast the
material flows that matters more than the machine occupancy in a flow orientated
philosophy. As a layout improves it positively influence both the productiveness and
the flow efficiency, however there is more benefits to achieve (Andreasson 1997). If
organizations wants to calculate how good the layout suits the organization itself, a
simulation model can be used (Gyulai et al. 2016). The simulation can then calculate
different kinds of key performance indicators (KPI), and according to Gyulai et al.
(2016) five of the most important KPI’s are:
Overlapping- where do the machines overlap with other machines and
objects.
Line length- how long are the routes that connects the machine to each
other.
Lead time- the average time for transportation, processing and waiting for
a product.
Utilization- how well do organizations use their resources /machines?
WIP- the calculated work in progress
While the layout is processed, Andreasson (1997) states that there is an opportunity
to question the company’s current processes. By doing so the company can correct
its error and obtain profits additional to the aim of the new layout. Some of the
benefits are hard to calculate. Yet Andreasson (1997) explains three advantages to
gain of a good layout:

12
Reduced material handling- and transportation costs
Whereas the layout affect the physical production flow, companies often seek to
reduce the transportation routes and hence the costs of the translocation. Material
handling cost such as unloading and loading goods in warehouse or other processes
can also be reduced by an enhanced layout. (Andreasson 1997).
Delays and queues
Material and products that awaits to be handled in a process increases the cost of
WIP. Partly it depends on the production planning, but a poorly designed layout can
affect the amount of WIP. The time to market with a less accurate layout is often
longer than needed and results in lower flexibility and unwanted bottlenecks.
(Andreasson 1997).
Better area utilization
By using the area in a better and more efficient way a reduction in facility cost can
be expected. A good layout can have a positive impact on both production, service,
surveillance and security, as personnel and other resources can be used more
efficiently. (Andreasson 1997).
2.10.1 Layout planning methods
When a new layout should be processed a handful of requirement needs to be
considered, which advocates the need of a project group. Yang et al. (2000)
explicitly states that a priority for good, high quality solutions is a project group
with accurate expertise in the area. Although there is no exact procedure or method
for layout designing, an approach often referred to in the literature, is the
Systematic layout planning (SLP) created by Richard Muther 1973 (Yang 2000;
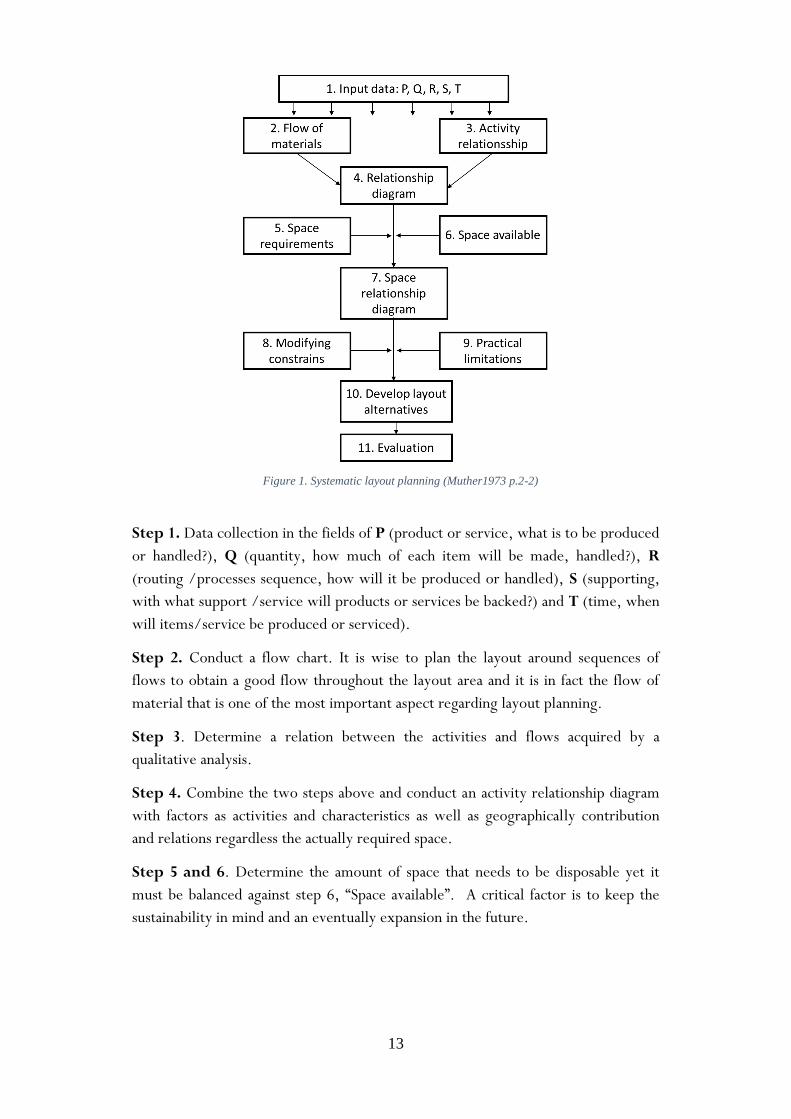
Tomkins & White 1984), see figure 1.
13
Step 1. Data collection in the fields of P (product or service, what is to be produced
or handled?), Q (quantity, how much of each item will be made, handled?), R
(routing /processes sequence, how will it be produced or handled), S (supporting,
with what support /service will products or services be backed?) and T (time, when
will items/service be produced or serviced).
Step 2. Conduct a flow chart. It is wise to plan the layout around sequences of
flows to obtain a good flow throughout the layout area and it is in fact the flow of
material that is one of the most important aspect regarding layout planning.
Step 3. Determine a relation between the activities and flows acquired by a
qualitative analysis.
Step 4. Combine the two steps above and conduct an activity relationship diagram
with factors as activities and characteristics as well as geographically contribution
and relations regardless the actually required space.
Step 5 and 6. Determine the amount of space that needs to be disposable yet it
must be balanced against step 6, “Space available”. A critical factor is to keep the
sustainability in mind and an eventually expansion in the future.
Figure 1. Systematic layout planning (Muther1973 p.2-2)

14
Step 7. This step is an additional step to step 4, which adds the actual area to the
relationship diagram. Thus this is a fundamentally layout and only include essential
considerations as processes, handling methods, operating practices etc.
Step 8 and 9. Which design constraints and limitations is there to consider? Every
idea needs to be tested against cost and safety as well as employee preferences to
even be taken to the next step.
Step 10. Develop multiple layout alternatives.
Step 11. Evaluate the alternative until only one remains and choose that one to
implement. Here it is essential to use a cost analysis for comparison and evaluation
as well as a evaluation of some intangible factors which can be found in appendix 1
(Muther 1973). Nevertheless, the organizations needs to be aware of hidden costs
which will not be included in the cost analysis, because of the simplest reason that it
cannot be measured. However the layout can also be evaluated by comparing the
advantages and disadvantages. In some cases it turns out that the best layout actually
is a combination of two layout proposals. (Muther 1973; Yang et al. 2000).
Another step- by step figure or procedural layout
design approach is Andreassons’ (1997) 10 steps layout
procedure (see figure 2). The aim for every step, cited
by Andreasson (1997, p.13) is self-explanatory and
written in the boxes building up the figure. Readers
that want more information is referred to Andreasson
(1997, p.13).
To conduct a layout procedural that functions in a marine terminal with its
regulation and the important security factors, the two figures described are
combined and adjusted for the specific research aim. They are used equally as much
and extended by literature that has importance in marine terminal layouts. The
model will be presented in the next chapter of this thesis as a conceptual model.
Figure 2. Layout procedure (Andreasson 1997 p.13)
15
3. Conceptual model
This chapter concerns the development of a conceptual model that has been evolved throughout
the literature review. The conceptual model is a procedure for layout planning regarding gates
in a marine terminal and is the adjusted model previous mentioned to correspond to the
research field.
To the best of the author’s knowledge there is no conceptual procedure regarding
transportation flows in a port organization with associated “sub-systems” (gates and
its configurations). What can be found in the literature is that the layout procedures
often concern the indoor facilities and the material flow more than it concern the
actual vehicle transportation. Whereas it is why the conceptual model for a layout
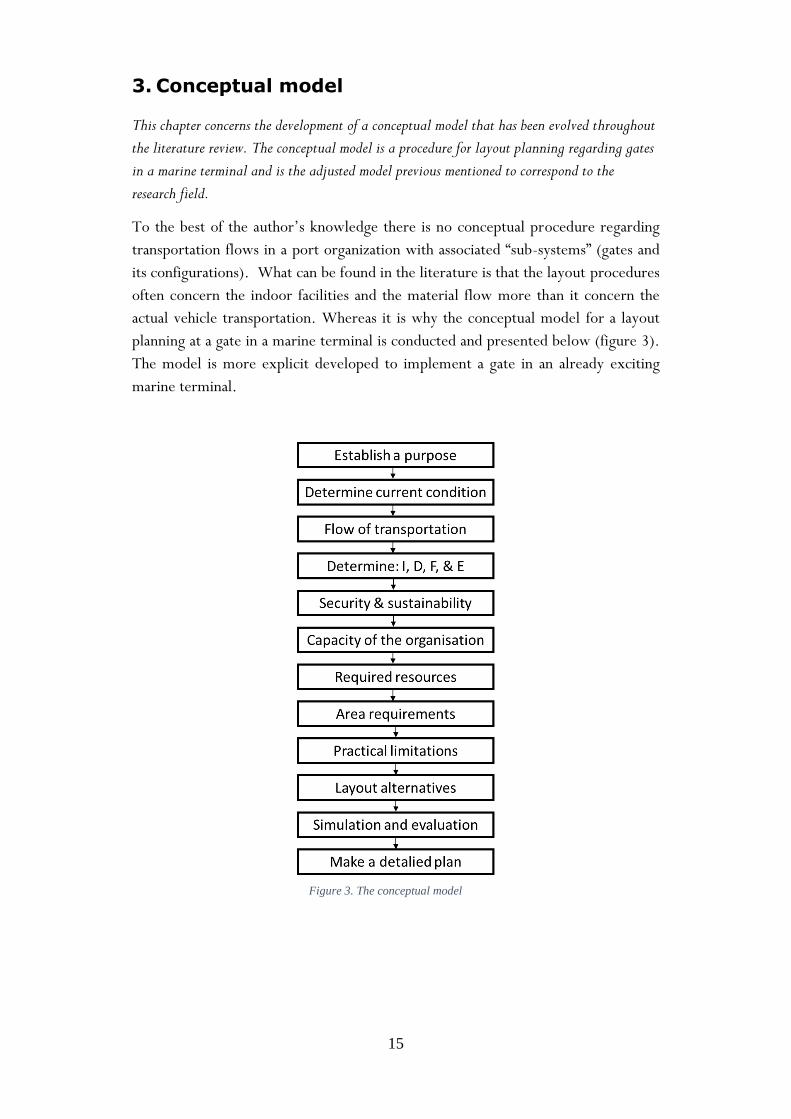
planning at a gate in a marine terminal is conducted and presented below (figure 3).
The model is more explicit developed to implement a gate in an already exciting
marine terminal.
Figure 3. The conceptual model

16
Step 1. Determine what will be achieved with the new layout.
According to Andreasson (1997) it is important to determine what the main purpose
is and why a new layout should be conducted. The actors involved can save a huge
amount of time by knowing exactly what is expected if much time are given to
formulate and clearly explain the purpose in the beginning of the change. In this step
there is also important to question the sustainability. (Andreasson 1997). The new
layout should be developed with a long term purpose and as Yang et al. (2000)
states there should be a project group to have responsibility for the whole process.
Step 2. Determine current condition regarding the layout.
Andreasson (1997) states that the current condition is important to determine as it
reveals if something has improved when a change has been made. To determine
what the current condition is, there are a couple of questions that needs to be
answered. For example; how is the company organized and what is the actual
purpose of the company? And what can be improved additionally to the layout? Is
there better ways to managing the organization and processes? Supplementary, some
KPI’s needs to be calculated, so that the results of a new layout can be compared to
the performance of the previous existing layout. (Andreasson 1997).
Step 3. Flow of transportation.
This is an extended version of the previous step “current condition”. The intention
in step 3 is to assimilate the relation between the resources, for example the
transportation as well as the characteristics of them (Muther 1973). According to
Muther (1973) the most significant aspect regarding layout planning is to determine
which routes the material flows through the organization. To establish this
knowledge a flowchart can be done (Olhager 2013).
Step 4. Determine I, D, F, & E
It is of great importance to determine and grade the; I (importance) of the flows and
which shall be of priority. D (distance), is also crucial because according to Ducruet
and Van der Horst (2009) the competition between ports do not lie at the port
itself, but rather within its transportations, there of the transportation routes and
the distance needs to be analyzed and determined. F (frequency), how often do the
specific organization and transportation vehicles use the specific routes on a daily
basis. E (economics) since a new layout often seeks to reduce costs (Andreasson
1997) it is important to determine which routes shall be prioritized dependent on
the profit of the specific flow.

17
Step 5. Security and sustainability.
After the terror attacks 11th of September the regulations and security within marine
terminals has increased and the ISPS has become a law (Kotachi et al. 2013; Yeo et
al. 2013). As earlier mentioned it is not only important to detect external threats
but internal too (Chang & Thai 2016), and due to the change of logistics in marine
terminals there is often more security systems than one that needs to be in
consideration and examined when a layout is planned (Yoon & Gim 2014). As well
as being observant regarding regulation and security systems, organizations needs to
be alert about the sustainability of the marine processes. Thus there is a critical need
for ports to be sustainable since they will be used frequently in an extended period
of time. Therefore it is also important to investigate the different kind of risks that
can occur in a port area to find the most sustainable solution. (Zhang et al. 2017).
Step 6. Capacity of the organization.
In a sustainable manner the gates capacity must exceed the capacity of the port
organization (Kozan 2000). In this step it is therefore of interest to calculate the
organizations capacity so that the gate process will not compose a bottleneck as
according to Keceil (2016) gates often do. Since the transportation within ports are
critical (Ducruet & Van der Horst 2009) the capacities of the “sub-system” (e.g.
gates) need to be in line with the capacity of the port to prevent bottlenecks (Kozan
2000). With this information the organization then can determine how much of a
capacity the gate shall have. A future expansion for the organization need to be of
consideration as well when planning the layout (Muther 1973).
Step 7. Required resources.
Andreasson (1997) states that it is necessary to identify the resources needed, along
with its needed area before the start of the actual gate layout planning. Parallel to
the resource planning the demand and processing times needs to be considered and
calculated. This means that there is crucial to understand the organization if the new
layout should be providential. (Andreasson 1997).

18
Step 8. Area requirement.
Apart from the actual size of the resources, it has to be more space around the
equipment for e.g. transportation and maintenance (Muther 973). Some factors that
needs to be in consideration is how is the area is formed, foursquare, circular, or
rectangular? If the area should be available from more direction than one and so on.
The easiest way to plan localization of the resources is to do it with paper patches or
in a computer program. Either way a plan must be conducted with the accurate
available area. (Andreasson 1997). According to Yang et al. (2000) this is a critical
moment because of the difficulty in expansion. Organization need to be aware of the
growing market and the possibility of a grooving port industry and need to have that
in mind when planning the layout. Important however, is that the area requirement
must be put in balanced with the area available (Muther 1973).
Step 9. Practical limitations.
It is central to question the technical configurations, for example if a resource affect
another resource, as well as the localization of the resources. In this stage it can even
be suitable to change the work sequence to improve the layout furthermore.
(Andreasson 1997). This can be applied when regarding routes as well. Do the
routes affect or will they cross each other. It is important to be aware of the
limitation before conducting a layout in practical (Yang et al. 2000).
Step 10. Layout alternatives.
In this step the organization should complete alternative layouts undertaking the
previous steps. The attempt is to accomplish so many straight, distinct and short
flows as possible so that the overall aim with a cost reduction is conceivable
(Andreasson 1977; Muther 1973). However, the alternative layouts is mainly made
to be a discussion foundation, to facilitate the discussions and hopefully give new
perspectives to think regarding eventually future problems (Andreasson 1997).
According to Yang et al. (2000) and Muther (1973) there is a need for more than
one alternative so that there are several or at least two candidates of a layouts to
evaluate and compare.

19
Step 11. Simulate and evaluate.
According to Andreasson (1997) it is important to have frequent discussions
regarding the layout proposal and upcoming questions with the concerned personnel
and staff. Pro’s and con’s to every alternative is important to discuss and analyze
(Andreasson 1997; Muther 1973) The work towards the finished layout should be
done by incremental improvements and one layout alternative after another should
be removed from the table until only one alternative remains (Andreasson 1997).
According to Gyulai et al. (2016) organization can evaluate the alternatives with the
five key performance indicators: (1) overlapping, (2) Line length, (3) Lead time, (4)
Utilization and (5) WIP. In the content of Muthers SPL procedure (1973) he thus
states that it is important to do a cost analysis to justify and compare the alternatives
as well.
Step 12. Make a detailed plan.
According to Andreasson (1997) the last step is that the layout design should be
planned in detail. This step should result in a layout that contains all equipment and
preferences so it can be used as a basis for the real implementation of the layout. It
do often not end up with one layout in detailed but rather two layouts combined
with its attributes in one detailed layout (Muther 1973).
20
4. Research methodology
In this chapter the chosen methodology will be presented and the approach will be described.
This thesis proceeds from a case study which is divided into four different sub-methods. The
methodology will at the end of this chapter be analyzed to identify the validity and reliability
of this thesis.
According to Ejvegård (2003) and Yin (2003) case studies are a well-known
research strategy which is commonly used in science studies. The use of a case study
as research strategy opens up and retains the holistic characteristics of real-life
events (Yin 2003). To be able to verify the conceptual model, a case study will be
performed at a company, Yilport Gävle (Yilport). Yin (2003) states that a case study
is a relevant approach to solve or reduce problems, and since the company has
distinct problems that need to be solved regarding security and gates, the method is
carefully chosen. Ejvegård (2003) describes case study more as a method to get
understanding than to describe a certain phenomenon. To be able to conduct
solutions to eliminate the problems at Yilport the authors of this thesis needed to
gain a lot of information to understand what the company needed. The research
questions in this thesis are “how” questions, which Yin (2003) describes can gain
distinct advantage to the study when a case study is used as a research method.
4.1 Approach
This case study is divided in four different sub-methods in order to gain important
information from different views to fulfil the purpose and answer the research
questions. The combining of multiple methods to maintain different approach angles
and different information is called triangulation (Biggam 2015; Eliasson 2010).
Triangulation often gives a more complete picture of the reality (Eliasson 2010) and
according to Biggam (2015) it gives the researcher a scope of different perspectives.
The different parts that have been used in this thesis are, interviews, observations,
benchmarking and raw data received from Yilport and hence, triangulation.
The term mixed methods- or multiple methods research stand for research projects
where the integration of both qualitative and quantitative approaches are used
(Bryman & Bell 2015). The combining of qualitative and quantitative research
strategies can give the researcher an extended understanding and also neutralize or
erase the possibility that biases can occur (Creswell 2009). In this thesis work the
different approaches had equal priority and has been used to gain different type of
information regarding gates and flows. Inductive and deductive approaches are two
important concepts that are commonly used in science studies and are two different
ways to make conclusions. The concepts are therefore each other's contrasts.

21
(Jakobsson 2011). For this thesis neither a deductive nor inductive approach was
chosen. The approach for this thesis is somewhere in the middle of the two
approaches whereas it both has started from a theory perspective and as well as from
a reality perspective. At the same time the aim has been to extend the existing
theory.
4.1.1 Interviews
A qualitative approach can be gained by the application of interviews (Creswell
2009; Travers 2001; Vieira et al. 2015) and was used in this thesis. The qualitative
strategy emphasizes an inductive approach to the relationship between research and
theory where the emphasis is focused on the generation of theories (Bryman & Bell
2015). An inductive approach can generally be described as to go from the “parts” to
the holistic view and are commonly proceed from the empirics (Jakobsson 2011).
Qualitative methods often helps the researcher to develop a complex understanding
of the problem and issues during the study and also to analyze and describe the
characteristics within different phenomenon (Creswell 2009; Jakobsson 2011). This
thesis work addressing a problem that Yilport has, among other marine terminals.
To be able to completely understand the operations and flows at Yilport a
qualitative approach was needed for the study.
Interview is a method for collecting data by verbal contact, either face to face or on
the phone (Jakobsson 2011). According to Ejvegård (2003) the method interviewing
takes a lot of time, both before to prepare and after to analyze. According to Ryen
(2004) qualitative interviews is used to gain information about a specific area of
interest. Because of that the interviewees had three interviews in this study, see
table 1 for details. The interviews were conducted with the employees at Yilport
who had the core expertise within the subject of interest. The persons were chosen
and asked if they could do the interview by face to face while the authors were at
Yilport to perform the observations (later to be described). Travers (2001)
describes that a lot of important information can be gained even from few
interviews. All the respondents were asked before the interview day if their work
title and company can be used in the study, and further if the person agreed to let
the interview be taped. Everyone agreed to both contentions. The interviews was all
based on open questions, which Jakobsson (2011) and Ryen (2004) describes as a
way to gain understanding for a phenomenon. The majority of the questions were
pre-defined to assure that the right questions were asked (see appendix 2). The
interviewers chose this type of questions to open up for further questions if needed
for a better understanding which according to Jakobsson (2011) this type of
questions does.
22
After every interview that were carried out the interviewers were discussing and
analyzing what have been said. According to Ejvegård (2003) and Wengraf (2001)
this is very important before transcribing the taped interview. Even transcribing the
interviews is important to do soon after the interview, to lose as little as possible of
the experience from the interview (Ejvegård 2003; Wengraf 2001). After discussing
and transcribing the interview all of them were sent back to respondent for approval
that the answers were correctly understood. Ejvegård (2003) describes this
phenomenon as very important because the interviewer can easily misinterpret the
respondent answer.
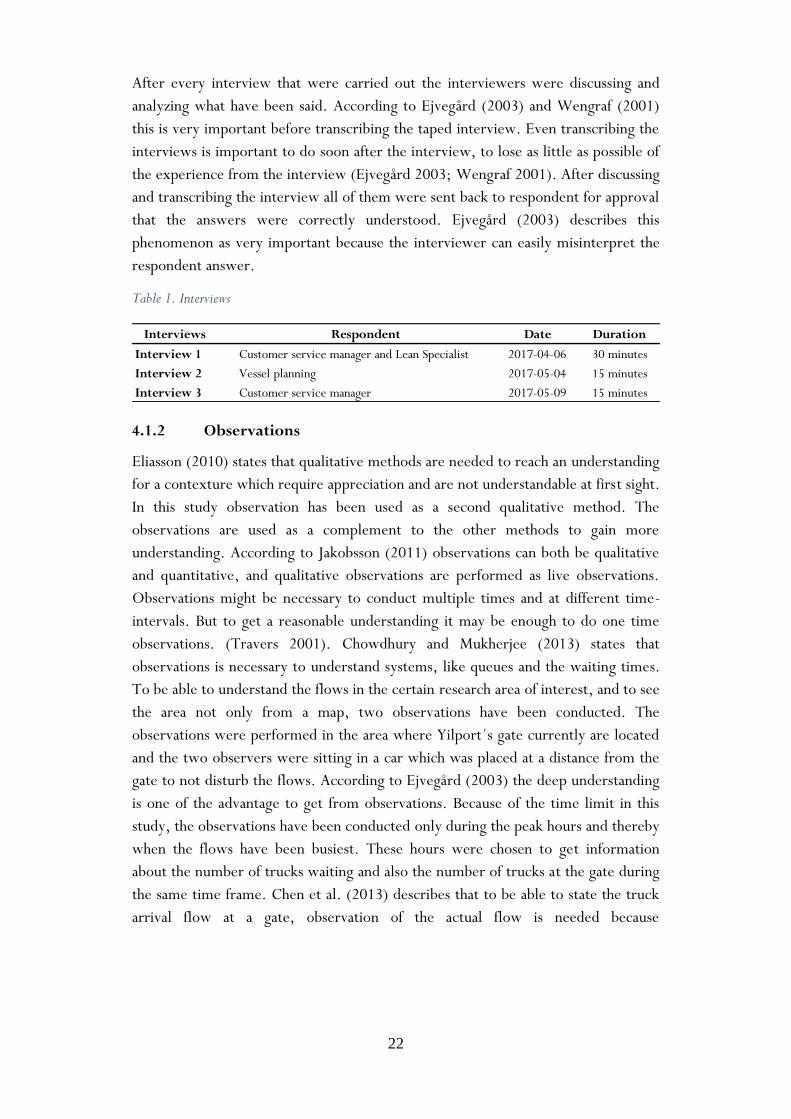
Table 1. Interviews
Interviews Respondent Date Duration
Interview 1 Customer service manager and Lean Specialist 2017-04-06 30 minutes
Interview 2 Vessel planning 2017-05-04 15 minutes
Interview 3 Customer service manager 2017-05-09 15 minutes
4.1.2 Observations
Eliasson (2010) states that qualitative methods are needed to reach an understanding
for a contexture which require appreciation and are not understandable at first sight.
In this study observation has been used as a second qualitative method. The
observations are used as a complement to the other methods to gain more
understanding. According to Jakobsson (2011) observations can both be qualitative
and quantitative, and qualitative observations are performed as live observations.
Observations might be necessary to conduct multiple times and at different time-
intervals. But to get a reasonable understanding it may be enough to do one time
observations. (Travers 2001). Chowdhury and Mukherjee (2013) states that
observations is necessary to understand systems, like queues and the waiting times.
To be able to understand the flows in the certain research area of interest, and to see
the area not only from a map, two observations have been conducted. The
observations were performed in the area where Yilport´s gate currently are located
and the two observers were sitting in a car which was placed at a distance from the
gate to not disturb the flows. According to Ejvegård (2003) the deep understanding
is one of the advantage to get from observations. Because of the time limit in this
study, the observations have been conducted only during the peak hours and thereby
when the flows have been busiest. These hours were chosen to get information
about the number of trucks waiting and also the number of trucks at the gate during
the same time frame. Chen et al. (2013) describes that to be able to state the truck
arrival flow at a gate, observation of the actual flow is needed because

23
terminals all around the world got different operations. Chen and Yang (2014) also
states that the observations of the length of the queue need to be accurate, which the
authors calculated during the observations. The calculation was conducted by
observing the size of the trucks, the number of them and their parking behavioral.
By using the data collected about trucks, the authors could calculate the length of
the queues.
The observations (see table 2) was performed on different weekdays during the peak
hours, which was collected from the data received from Yilport. During the
observations, notes were taken and questions were written down to make sure
important information was not missed. According to Holme and Solvang (1997) it is
important to write down what is observed during the observation because it is
common that there are phenomenon observers do not understand at first sight. The
questions were asked later during the interviews.
Table 2. Observations
Observations Location Date Duration
Observation 1 Yilport´s gate area 2017-05-04 90 minutes
Observation 2 Yilport´s gate area 2017-05-09 60 minutes
4.1.3 Benchmarking
Benchmarking was one of the four different parts of the research methodology and
the aim of this method was to gain important information and find important factors
to consider. When benchmarking is used as a research strategy it is used in a
comparing and evaluating aspects of its practice, process or performance (Jackson
2000). In this thesis work benchmarking were used to study the gate of Gävle hamn.
Mostly to find out important factors that influence the functionality and
configuration of the gate but also to see where weighbridges are located and how the
queue system and waiting area are designed. Gävle hamn were chosen for the
benchmarking because the company has rebuilt their gate during 2016 and are
therefore a useful candidate. Gävle hamn was also chosen because the company is
operating in the same harbor and possess the main gate for the port area, which
mean that all trucks that are entering to Yilport, first have to entrance the gate of
Gävle hamn. According to Andersen and Pettersen (1995) the problems are often
similar for companies operating in the same branch of industry. Yasin (2002)
describes benchmarking as a method to identify operational and strategic gaps and
also to search for information to fill in the gaps.

24
Demirbas et al. (2014) states that benchmarking can be used as a strategy to analyze
a marine terminal and its logistics services. Benchmarking can also be utilized to
identify the different interfaces within a port environment, how competitors
perform and also the process when an external company enter and leave the marine
terminal (Demirbas et al. 2014). The benchmarking was performed by observations
of the gate and the surroundings and a semi-structured interview with the
maintenance manager at Gävle hamn. The interview was 15 minutes with semi-
structured questions and 30 minutes of studying and analyzing a map of the gate at
Gävle hamn. The maintenance manager was chosen for the interview because of his
involvement in the rebuilding of the port of Gävle hamn and was asked by e-mail to
participate. Two other persons at Gävle hamn were asked for an interview as well
but they had almost the same competence as the maintenance manager so because of
the time frame, only one interview was performed.
4.1.4 Raw data from Yilport
Bryman and Bell (2015) states that quantitative research strategies are emphasizing
quantification in the collecting and analysis of data and entails a deductive approach
to the relationship between the research and existing theory. A deductive approach
can be used by proceeding from theory and trying out the assumptions with
hypotheses (Jakobsson 2011). Quantitative methods are used to identify variances
and relations between variables (Jakobsson 2011).
The raw data received from Yilport was used in this study to find out the different
parameters that will affect the layout planning for the gate. The data was first
processed to find out which data that could be used for this study. Later on it was
used to calculate how many trucks that was entering Yilport´s bulk terminal to load
or unload goods during 2016. It was also calculated which flow the different trucks
belonged to. According to Chen et al. (2011) the proportions of trucks who is
headed to different flows to load or unload goods are time-invariant and can be
estimated from historical data. The data also contained information that were used
to calculate the arrival times for the trucks and the peak hours and the arrival
frequency. Even the most frequent flows was calculated from the data.
4.2 Data analysis
Quantitative methods comprises mathematical procedures which are more or less
advanced to analyze data, that are designated with numbers. However, to be able to
analyze the data, advanced mathematical methods are not needed to find out how
different quantitative variables can be divided into certain groups. (Eliasson 2010).
25
All the data that has been collected or received from Yilport and Gävle hamn has
been important and meaningful for the study. That is because the different research
strategies has given the authors different angles of information within the theme of
the study. The different angles was necessary to establish the solution suggestions for
the current problems. Demirbas et al. (2014) states that in qualitative research a
thematic analysis is a conventional practice for identifying, analyzing and notifying
explicit and implicit ideas within the themes in relation to the data collected and
received. All the different data collected from the different methods has been
managed and analyzed one by one and compiled to easily see the outcome from each
method. The data has then been combined and analyzed in relation to the literature
review to establish a certainty in the solutions. From the empirical data and
theoretical analysis two layout suggestions for the gate has been designed. They
constitute the ground for simulation.
4.3 Critical review of methodology
4.3.1 Validity
According to Jakobsson (2011) and Eliasson (2010) the validity of a research is how
well the research actually measures what it aims to measure, and according to
Bryman and Bell (2015) it is the most important criterion regarding research. As a
concept the validity can be divided into internal- and external validity and also construct
validity, to mention a few. However the latest, construct validity, is a validation of a
measuring instrument whilst intern and extern validity assesses the actual research.
(Jakobsson 2011). Bryman and Bell (2015) states that the internal validity relates to
the causality of X number of variables, how one affect the other e.g. if ethics and
moral influence the results. The external validation on the other hand deal with the
question regarding generalization of the study’s results. When it comes to
quantitative research the external validation often is achieved by a great number of
representative samples. LeCompte and Goets (1982, referred in Bryman and Bell
2015) states that the external validation though can become a problem thus research
that uses case studies often lack to attain a representative sample. While de
definition of validity concerns measuring methods (Jakobsson 2011; Eliasson 2010;
Lantz 2014) Mason (1996, referred in Bryman and Bell 2015) argues that the
definition is closely related to a quantitative research. Although Mason then refers to
validation of a qualitative research as to whether ”you are observing, identifying, or
’Measuring’ what you say you are” (Bryman and Bell 2015 p.400). The internal
validity however can be seen as a strength regarding the qualitative research since
the researcher (s) often spend a long time in a specific group and therefore learns the
correspondence between observations and concepts. To question the use of
26
observation as a method, it in fact can have issues that hamper the results of the
research. Since a researcher observe the course of a event or a process, he or she
cannot know the result of the research process while observing. It can therefore
become a hinder in hindsight if the information gained from the observation not will
be of use. (Ejvegård 2003). Hence, this can hamper the validity of the research as if
it has not measured or observed what were supposed to. In this thesis the
observations gave the authors an enrichment awareness of the flows and the behavior
of how the trucks are arriving and parking at the current gate. This in turn, leads to
a higher validity as the authors observes what they actually wanted to observe. To
increase the validity of the thesis furthermore the authors made observation field
notes and transcriptions of the interviews. According to Riege (2003) it is essential
to have established verbal evidence for the data collection. Additional the authors
allowed the respondents to review the draft so no information was bias which is
another thing Riege (2003) states increases the validity.
Dependent on which methods have been used, it affect the validity and reliability of
the thesis. Hence, there is much done to strengthen the two concepts. Regarding
internal validity the data analysis has been cross-checked which is a way of
strengthen the internal validity according to Riege (2003). The interviews with
defined questions also assured that the interviewee asked the “right question”
regarding the purpose of the interviews. Regarding the number of case companies
for the thesis, as the authors chose only too execute one case study to validate and
verify the model. It would have brought a higher external validity to the thesis if
more case studies were conducted and if the population sample were greater.
Hence, it had assured that the results of the thesis is transferable to the whole target
population, marine terminals.
4.3.2 Reliability
Apart from the validity of a research, the reliability must also be considered as it
concerns the degree of how trustworthy the research is (Jakobsson 2011; Eliasson
2010). The reliability is all about questioning whether if the results is repeatable or
not. Researchers should explain the methodology procedure explicitly, so that if
another researcher want to re-do the study no methodology problem would
occur.(Bryman & Bell 2015). LeCompte and Goets (1982, referred in Bryman and
Bell 2015) argues that the reliability criterion thus can cause a problem since it is
impossible to have the exact same social setting years apart. (Bryman & Bell 2015).

27
According to Ejvegård (2003) an interaction with the individuals in the system can
generate a problem to the research, if they due to the interaction change their
behavior. Therefore, to not affect the flows or the individuals in the observed
processes the authors maintained an objectiveness by not interact with them in any
way and by observing from a great distance. Because of the distance the observed
individuals did not notice that they were observed which implied for that the
processes was performed as usually. Regarding the benchmarking there are
limitations that affect the reliability but also the validity. A decision was made to
only use one benchmarking organization (Gävle hamn) since it handles the same
flows. However, the results can be more trustworthy if more than one company is
studied and more than one person interviewed (Andersen & Pettersen 1995). The
authors to this thesis work had this in mind while searching for partners for
benchmarking, but according to the aim of the benchmarking and to fill in the gaps
in the knowledge of the authors, the best partner that was considered was Gävle
hamn. If this thesis work was supposed to be in progress for a longer period of time
more companies would have been studied to strengthen the reliability. Yet to
increase the reliability of this thesis the authors have been very strict and explicit
when chosen literature and methodology. Furthermore the recording of the
interviews results in a higher reliability as it is available for those who want to take a
part of it. Since interviews were one significant methodology it was crucial to
maintain a professional front to reduce the potential of a bias. Which leads to the
next subject in the critical review, ethics.
4.3.3 Ethics
According to Jakobsson (2011) interviewer bias is the effect of the respondents
answer dependent on the interviewers acting, behavioural and different attribute.
Thus the interviewers’ sex, attitude or education can affect the respondent.
(Jakobsson 2011). In this particular thesis one of the authors/ interviewee was
working at Yilport which made this an ethical issue. To maintain an objectiveness at
the interviews, the interviewee who worked at Yilport only questioned the question
that was settled before the interview, while the other interviewee managed the
follow-up questions. The author (who was an employee at Yilport), did not have
any leverage on or higher status than the respondents, which did not hamper the
answers given. Whereas the interviews were recorded the authors’ kept in mind
that it according to Ejvegård (2003) can be factors that negatively affect taped
interviews. One factor is triggered by if the respondent is uncomfortable with the
recording and only answers the questions shortly and thus do not speak out
(Ejvegård 2003). During the interviews this did not seemed to be a problem and the
respondents were answering the questions with explanations. This could be a result

28
of trust the respondent have for the interviewee which in this case is a good attribute
for this study in a manner of much information. Although this can affect the
reliability of the research in a negative manner because the respondents can feel less
trustful to other interviewees and because of that, not share full information.
According to Ryen (2004) the trust is built upon the emotional attitude between the
authors and respondent in the research processes and a too strong emotional
closeness can thus create an ethical dilemma. The trust that has to be mutual, can
prevent the researcher from watching and seeing from an objective perspective
(Ryen 2004). Because of this occurrence this thesis research were strengthened by
having two authors, whereas one is completely objective and the other one has
knowledge about the processes.
Confidentiality is also a critical manner regarding ethics and morals. In this thesis the
respondents will be described by work title since it is the competence the authors
strive to seek. In agreement with the case company it was carried out that there
were no need for anonymity, however, the raw data will not be published in this
thesis due to confidentiality. Nevertheless the interviewed respondents got
opportunities to review and comment the transcription and approve it before the
analysis started. The basic ethical principles; (1) the principle of respect for
autonomy, (2) the principle of beneficence, (3) the principle of nonmaleficence, (4)
the principle of justice, (Jakobsson 2011) were all considered throughout the thesis.
This mean that the authors showed respect for the respondents, strived to prevent
and expose damage, strived to do god and that everyone involved were treated in an
equal way.

29
5. Yilport Gävle
This chapter is built upon the interviews and observations that have been conducted at Yilport.
A case study was chosen to verify the methodology model conducted in this thesis.
5.1 Company description
Yilport is one of the companies that is operating in Gävle hamn. The company is an
intermodal terminal and the hinterland communications to the company is excellent
for both train, sea and road traffic, which is positive for future expansion
possibilities. Yilport´s area can be divided into different areas, the bulk terminal,
container terminal and CFS area (container freight station). Yilport´s container
terminal is the third largest in Sweden and are handling about 300 000 TEU
containers every year which makes the port the largest on the east coast of Sweden.
Yilport´s bulk terminal is 390 000 m2, contains 12 warehouses for storage of goods
and got 12 berths for in- and outgoing sea traffic. The bulk terminal is a multi-
purpose terminal and are handling different types of goods like sawn timber, road
salt, chrome and anthracite. Yilport got a global market and is aiming to always find
the most optimal transport solution with an environmental perspective in mind.
5.2 Specification of problems at Yilport
The problems that Yilport is facing in the current condition is that unauthorized
vehicles crossing their area in the marine terminal. This results in that Yilport find it
hard to obtain the security the company is responsible to have, both according to the
ISPS and to obtain a safe work environment. Another problem that Yilport have is
that the administration routines for when truck arrives to load or unload goods takes
too long time to process.
5.3 Mapping the flows at Yilport´s bulk terminal
The map (figure 4) shows Yilport´s area at the marine terminal. The different flows
in the bulk terminal are illustrated with the arrows in different colors to clarify
where the unloading or loading place are for the goods. They all starts from the
existing gate at Yilport´s area. The different goods are: sawn timber, pulp, chrome,
road salt and anthracite.
Some of the goods are located at multiple places, which is depending on the
customers, the different types of the goods or where the vessel was unloaded.

30
5.4 The current gate situation
5.4.1 Trucks arriving
In the current situation all trucks which are going to Yilport to load or unload, first
need to go through the entrance gate at Gävle hamn. They need to show their
documents at the gate to get through. Next stop for the trucks are at the gate of
Yilport´s bulk terminal, all flows are using the same gate as there is only one. The
drivers are parking outside the gate-building at a gravel-yard and then walking into
the building to call customer service and show their documents again. The truck
drivers then receive a working order to take with them so that they can be loaded or
unloaded.
Color description:
Yilport’s area
Sawn timber
Pulp
Chrome
Road salt
Anthracite
Figure 4. Flowchart over Yilport area

31
Type pf goods Flow frequence %/ year Needs to weigh
Sawn timber 40 No
Pulp 36 No
Crome 12 Yes
Road salt 8 Yes
Anthracite 3 Yes
Rarley handled goods 1 Not taken in account
5.4.2 Flow frequency
During 2016 approximately 8000 trucks entered Yilport´s bulk terminal to load or
unload goods to the five different flows illustrated in figure 4. The company is
counting on 232 workdays during 2016 which means that about 34 trucks arrives
every day. The frequency of the flows vary and during 2016 and a assembly of the
percentage is to be found in table 3. Sawn timber was the most frequent flow with
40 percent of the total flows. The next frequent flow that year was pulp with 36
percent of the total flows. These flows will even in the future be the most frequent
ones which means that they should be prioritized if needed. Chrome was about 12
percent, road salt about 8 percent and anthracite 3 percent of the total flows. One
thing to have in consideration is that road salt is more frequently loaded during the
winter season which means that a majority of the trucks arrives in just a few months.
The presented and described flows only constitute 99 percentage of the total flows.
The 1 remaining percentage regards goods that Yilport only handles rarely.
5.4.3 Peak hours
Yilport bulk terminal has open hours from 7 am to 7 pm for entrance on weekdays,
during that period of time trucks can come to the terminal to load or unload goods.
The data received from Yilport contains information on every single truck that
arrived to the bulk terminal, the entrance hour, which flow the truck was going to
and also when the truck were leaving the area and how long time the truck spent
there. Due to confidentiality the data will not be published in this thesis. This data
has been used to identify when peaks occur at the gate to the bulk terminal. To get a
good outcome, the data from 2016 has been used. The trucks have been sorted into
time intervals in order to analyze how many trucks are entering the gate at Yilport
per hour. This number has been calculated into a chart to easily see when the peaks
occur. The two peaks at the gate that has been identified are between 7-8 am and
between 11 am - 1 pm. Although, the first peak is higher. All flows to the bulk
terminal are included.
Table 3. Percentage of total flows that needs to weigh

32
5.4.4 Weighbridges
All goods that are entering and leaving Yilport´s bulk terminal are not weighted.
There are only certain flows that need to use a weighbridge. The goods that need to
be weighted before leaving the bulk terminal are road salt, chrome and anthracite.
Map of the current flows of bulk good that are using a weighbridge are described can
be found in appendix 3. When the trucks arrive at Yilport to load this types of goods
they first need to weigh the tare of the truck. When unloading bulk goods from
vessels trucks are used for some materials and depending on the customer and type
of goods a weighbridge is needed. Today Yilport are using the weighbridges located
at the gate of Gävle hamn which results in unnecessary long routes for the trucks and
an unnecessary high fee. Yilport got a weighbridge at the CFS area but the
weighbridge is too short to carry the trucks that are loading this type of goods. The
weighbridge is also located at the other side of Yilport´s area which means even
longer routes for the trucks.

33
6. Analysis
This chapter will analyze the conceptual model and validate it against the case company. As
the case company possesses problems regarding the security, the model will develop layout
suggestions that eliminate the current problem. Firstly, the procedure of how the layouts were
conducted by the conceptual model will be described below, and secondly, the layout suggestion
conducted will be presented. The comparison and evaluation of the two layouts however, will
be consummated in the next chapter.
The model which has been presented in Chapter 3 is developed to implement a gate
in an already existing marine terminal. The model has been verified by the layout
planning of a gate at Yilport´s marine terminal. The twelve steps that the conceptual
model contains have been described in this chapter as it is the procedure the authors
have used during the layout planning development at Yilport.
Step 1. Determine what will be achieved with the new layout.
The main purpose of the layout planning development at Yilport is to increase the
security and implement a new gate system at their marine terminal area. The
purpose was clearly described to the authors by the employees at Yilport so the
authors knew what Yilport expected from the layout, which Andreasson (1997)
describes as time saving and significant. During the whole layout planning procedure
the authors had sustainability and future expansion possibilities in mind to be able to
conduct a sustainable design, which Andreasson (1997) also states is important.
Step 2. Determine current condition.
The content of this step is to determine if something has improved, by doing that
the current condition must be described. Andreasson (1997) refers to questions that
need to be asked in this step (e.g. how the company is organized and what the
purpose of the company is? What can be improved in addition to the layout? And are
there better ways to managing the organization and processes?), the authors
answered them with the results from the case study and by analyzing the
organization’s behavior. (The answers will not be printed in this thesis because of
confidentiality.)
Andreasson (1997) also refers to key performance indicator, which in this thesis has
been the time taken by the trucks that are entering the gate and using the
weighbridge. The time has been analyzed from the raw data from Yilport and can be
compared with the new layout when it is implemented.
34
Step 3. Flow of transportation.
Since the flows in this research are of priority, it was important to determine which
routes the material flows through the organization, which Muther (1973) describes
as the most significant aspect of layout planning. To be able to clarify the flows
several flowcharts have been made (appendix 3 and figure3), which Olhager (2013)
states are one way to determine the flows. The flowcharts have been conducted by
the case study at Yilport and have been used to clearly see the relations between the
current processes and flows.
Step 4. Determine I, D, F, & E.
The information of the I, importance of the flows was identified during the
interviews at Yilport and the F, frequency was calculated from the raw data received
from the company. Both the most important and the frequent flows haver been of
priority when the localization of the gate has been determined. The D, distances for
the flows were determined and analyzed by the flowcharts and the raw data from
Yilport, which Ducruet and Van der Horst (2009) describes as important aspect.
The E, economics was one of the limitations to this thesis and is therefore left for
Yilport to calculate.
Step 5. Security and sustainability.
Since the ISPS has become a law (Kotachi et al. 2013; Yeo et al. 2013), Yilport has
to increase the security at their marine terminal, which will be done by the
implementation of a gate. The security within the marine terminal has been in
consideration during the whole layout procedure and has focused on designing a safe
and secure gate configuration. The different kind of risks that can occur has been
determined, which Zhang et al. (2017) states results in a sustainable solution. The
risks such as; unauthorized person in the area, damage and theft has been
determined by the benchmarking at Gävle hamn, the case study at Yilport and the
existing theory regarding the subject. To be able to decrease and eliminate the risks
the layout has been designed with nicety and the placement of the different lanes has
been done in order to obtain a safe work environment both for the in- and outgoing
trucks and the employees at Yilport. The lanes has because of that been designed in a
way to get straight flows which can decrease the risk of accidents in the gate area.
Additionally the separate lanes for trucks and employees at Yilport also reduce the
risk of accidents.

35
Step 6. Capacity of the organization.
The capacity of the organization was determined by the case study and calculated to
identify the capacity needed for the gate, according to Keceil (2016) this can be
done to prevent the possibility of bottlenecks. However, to be able to prevent the
possibility of bottlenecks at the gate and sub-system such as the weighbridge, the
current bottlenecks had to be established. The bottlenecks identified were the whole
processes for the truck drivers when they arrives to the current gate which also
including the current administration process. The long transportation routes for the
trucks which are using the weighbridge was another bottleneck. By the use of a
registration number scanner and a document scanner the truck drivers can stay in
the trucks and the process time will be much shorter. This also increases the safety
in the gate area.
Step 7. Required resources.
The required resources for this layout planning procedure were the area where the
gate should be planned. The lanes and turning places were the most important
factors of the area resources to consider because the trucks need a certain length and
width to be able to turn in a safe and efficient way. Yilport stated during the
interviews that efficient flows are important and to be able to get efficient flows the
area was planned in detail. By the observations at the area the authors got great
knowledge about the area and the organization which according to Andreasson
(1997) is crucial.
Step 8. Area requirement.
To be able to plan the area in detail, paper patches and a computer program
provided by Yilport was used and the scale of the map was calculated to get a faithful
picture of reality, which Andreasson (1997) describes as good methods to plan a
layout. The expansion possibilities for the company was in mind when planning for
the localization of the gate, which Yang et al. (2000) states is critical. The gate was
therefore placed in an area where there are several possible ways to expand the gate
in more than one direction, but as everything, the area has limitations.
Step 9. Practical limitations.
There are limitations of the area due to the fact that the gate will be placed in an
area with already existing buildings and infrastructure which needs to be in
consideration and can hamper the expansion possibilities of the gate. The marine
terminal is a multi- purpose terminal which also is a limitation because the trucks
are going to different places to load or unload goods and are therefore different
flows circulating in the area. The berths where vessels are unloading cargo are also

36
placed at different locations which results in that the transportation routes for the
trucks are going in different directions (figure 4). Another limitation to the area is
that there are more companies than Yilport operating in Gävle hamn and when
designing the gate these companies need to be in consideration. All the limitations
has been analyzed during the layout planning to be able to adjust the design of the
gate, which according to Yang et al. (2000) is an important step in a layout planning
procedure.
Step 10. Layout alternatives.
Both Yang et al. (2000) and Muther (1973) states that it is important to have
several, or at least two layouts to evaluate, which is why this thesis conduct two
layout suggestions. The layout suggestions have been designed with consideration of
all the factors from the earlier steps and the information gained from the case study
so that the layouts of the gates and its configurations is optimal for Yilport. Firstly,
the waiting area for the trucks were calculated and designed upon the raw data
received from Yilport. The authors used the data collected from previous year
(2016) to see the mean value of how many trucks were arriving to the company´s
marine terminal. For the waiting area, the peaks during certain time frames was
calculated to a highest mean of 4.5 trucks, which means that there was a need for
4.5 trucks in the area. To that number, additionally 25 percent were added for a
certainty to avoid traffic congestion at the waiting area. This means that the number
of waiting trucks that fit in the waiting area are 6 trucks. The probability that 6
trucks were arriving at the same time during a certain time frame and additionally
that a 7th truck was arriving was also calculated and it turned out to be almost
absent. Addition to that the waiting area was designed to fit trucks of the largest size
(25, 25 m). The gate was modelled with short and straight lanes, which Andreasson
(1997) describes efficient flows should be. The security was increased by the two
earlier mentioned scanners for trucks which has been applied in both layout
suggestions. An important factor for the design of the layout was the space the
trucks need to be able to make a turn and the lock space. Those numbers and the
area space needed were calculated upon the general length and width of trucks and
from the benchmarking at Gävle hamn.
Step 11. Simulate and evaluate.
To be able to evaluate the layout suggestions a simulation is needed. There are
certain factors that need a number analysis to be able to announce the best layout for
Yilport. One of them is how the capacity will be affected dependent on whether it is
one or two weighbridges and therefore which of the layouts that are more suitable
for the company. After the simulation has been performed there are several
37
incremental improvements that can be done, which Andreasson (1997), states
should be done in the finishing work of the layouts. The five KPI’s: (1) overlapping,
(2) Line length, (3) Lead time, (4) Utilization and (5)WIP can both be analyzed
before and after the simulation and Gyulai et al. (2016) states that they are usable
for the evaluation of the suggestions.
Step 12. Make a detailed plan.
This step need to be conducted by Yilport itself because there are two factors that
has been limited from this study, the economic and technical factors. The detailed
planning is important to perform as a basis for the real implementation of the layout.
However, the detailed plan is often a combination of the best attribution from the
suggested layouts (Andreasson 1997; Muther 1973).
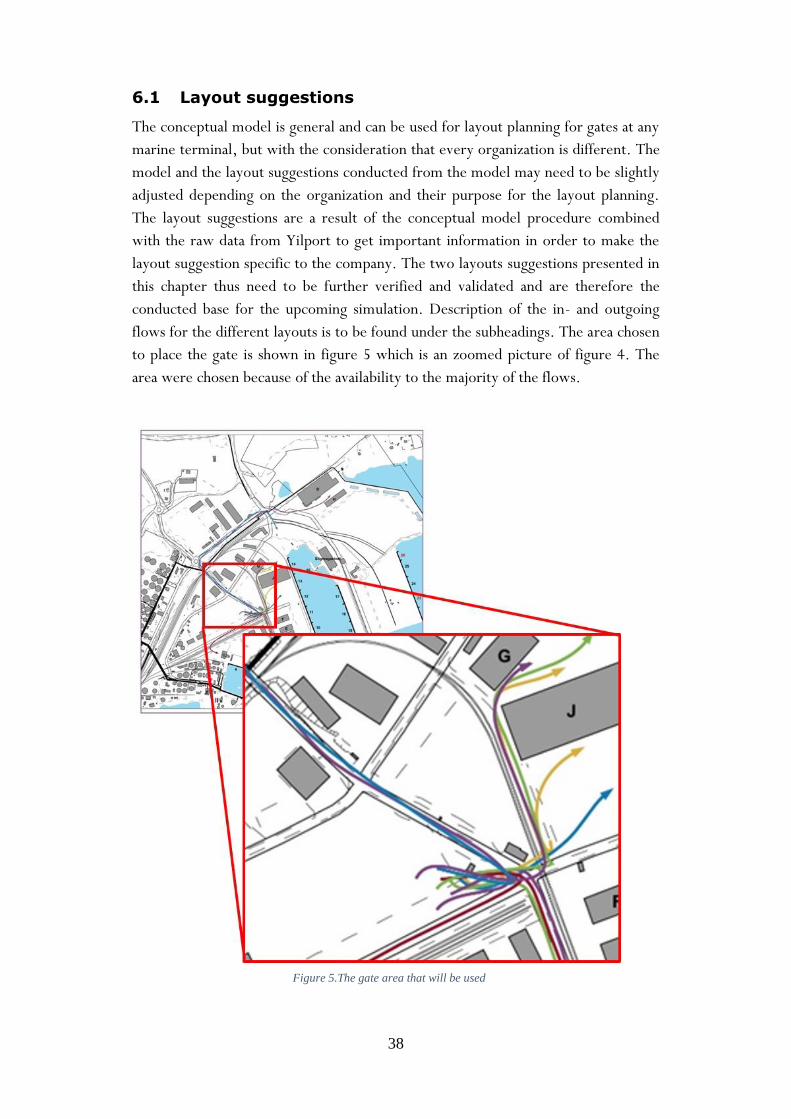
38
6.1 Layout suggestions
The conceptual model is general and can be used for layout planning for gates at any
marine terminal, but with the consideration that every organization is different. The
model and the layout suggestions conducted from the model may need to be slightly
adjusted depending on the organization and their purpose for the layout planning.
The layout suggestions are a result of the conceptual model procedure combined
with the raw data from Yilport to get important information in order to make the
layout suggestion specific to the company. The two layouts suggestions presented in
this chapter thus need to be further verified and validated and are therefore the
conducted base for the upcoming simulation. Description of the in- and outgoing
flows for the different layouts is to be found under the subheadings. The area chosen
to place the gate is shown in figure 5 which is an zoomed picture of figure 4. The
area were chosen because of the availability to the majority of the flows.
Figure 5.The gate area that will be used

39
6.1.1 Layout 1
The first layout got one entry passage for the employees at Yilport who does not
need to use the registration plate number scanner, registration plate number
confirmer and the document scanner (the blue arrow in figure 6). The employees
got key cards to scan at the red scanner in their lane. The trucks entering Yilport´s
area (the green arrow in figure 6) are first going past the registration plate number
scanner and then stop before the registration plate number confirmer. There are
enough space for 6 large trucks (25, 25 m) divided to three lanes between the
registration plate scanner and the registration plate confirmer. When a digital board
shows their registration plate number the truck can go forward to the document
scanner to show their documents. If the document is approved the gate will open
and a green light and an arrow forward will be shown on a screen. If the document
is not approved or if the driver does not have documents there will be a red light
and an arrow to turn right on a screen. The trucks got enough space to stop at the
side of the road that is going in the right direction, marked with the dots.
On the way out of the terminal (the red arrows in figure 6), there is a weighbridge
that can be used by everyone at Yilport´s area. To use the weighbridge the truck is
going in the right lane. If the truck is leaving Yilport´s area the truck will only
continuing forward to the gate out. If the truck is going back to Yilport´s area the
truck will turn right after the weighbridge and go back. The other lane out will only
go straight forward to the exit gate.
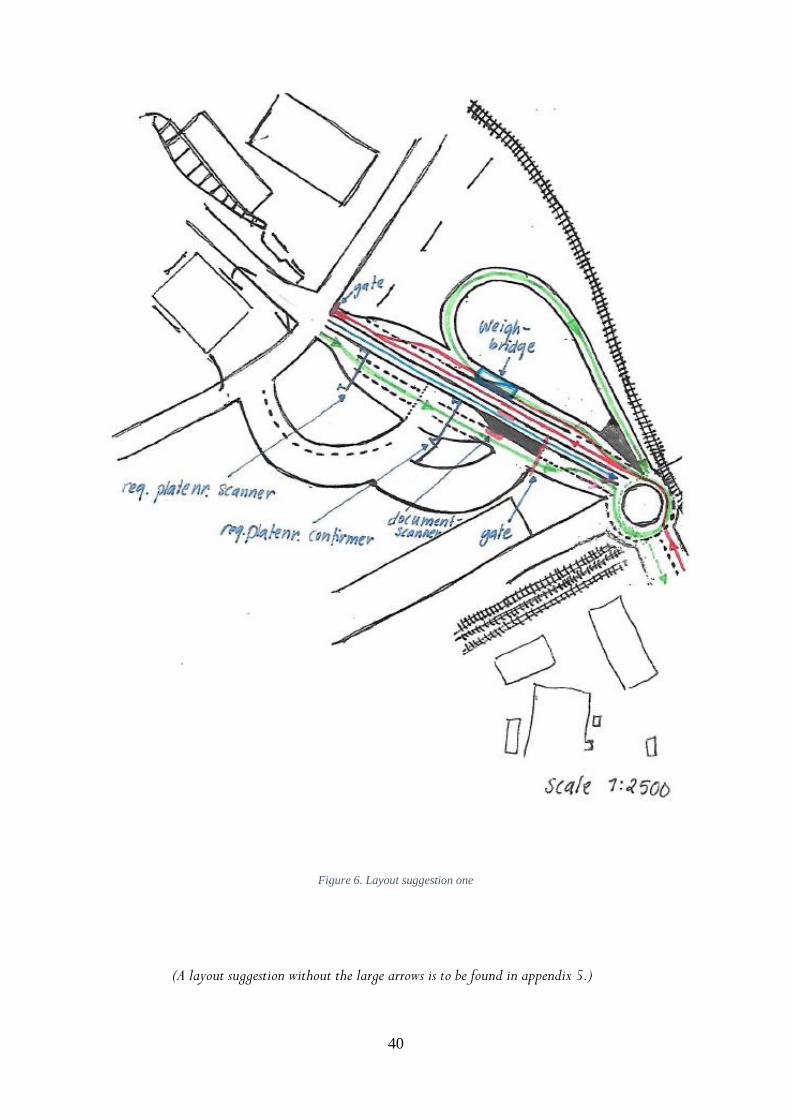
40
Figure 6. Layout suggestion one
(A layout suggestion without the large arrows is to be found in appendix 5.)

41
6.1.2 Layout 2
The second layout got one entry passage for the employees at Yilport who does not
need to use the registration plate number scanner, registration plate number
confirmer or the document scanner (the blue arrow in figure 7). The employees got
key cards to scan at the red scanner at their lane. The trucks entering Yilport´s area
(the green arrow in figure 7) are first going past the registration plate number
scanner and then stop before the registration plate number confirmer. There are
enough space for 6 large trucks (25, 25 m) divided to three lanes, between the
registration plate scanner and the registration plate confirmer. When the digital
board shows their registration plate number the truck can go forward to the
document scanner to show their documents and at the same time weigh the tare of
the truck if needed. If the document is approved the gate will open and a green light
and an arrow forward will be shown on a screen. If the document is not approved or
if the driver does not have documents there will be a red light and an arrow to turn
right on a screen. The trucks got enough space to stop at the side of the road that is
going in the right direction, marked with the dots.
On the way out (the red arrows in figure 7) there will be a weighbridge as well. To
use the weighbridge the truck is going in the right lane, and to leave Yilport´s area
the truck will only continuing forward to the gate out. The other lane out will only
go straight forward to the exit gate.
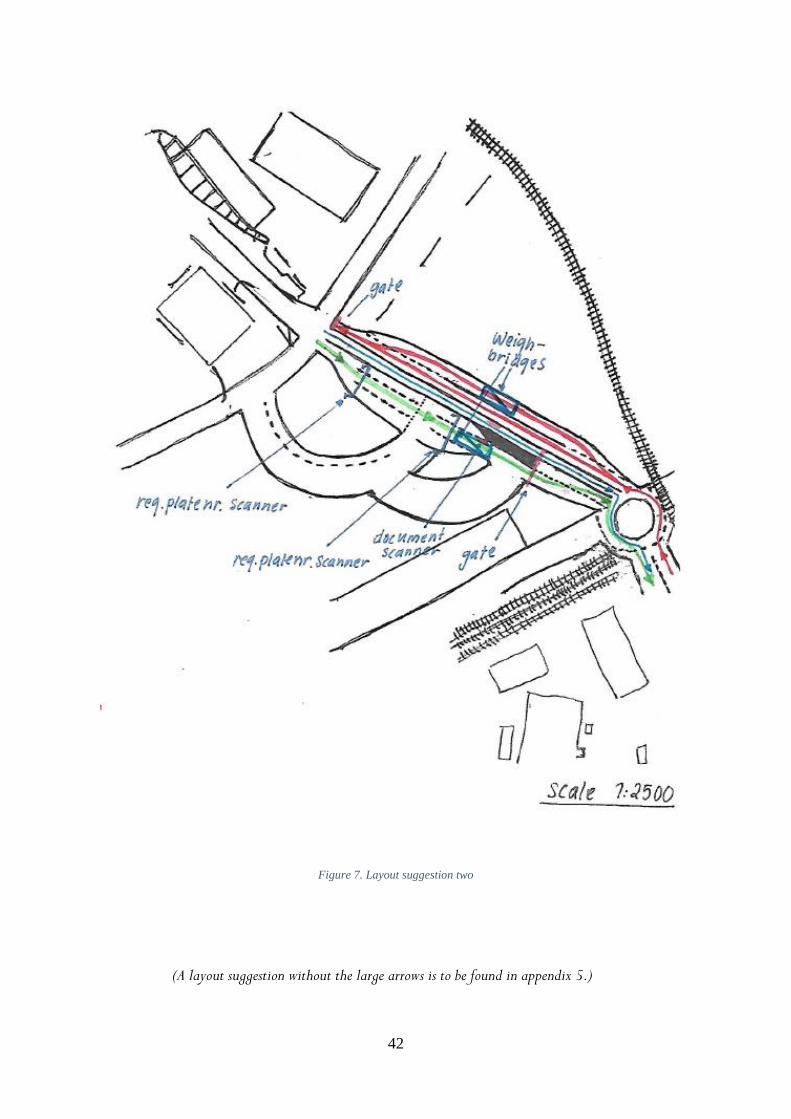
42
Figure 7. Layout suggestion two
(A layout suggestion without the large arrows is to be found in appendix 5.)
43
6.1.3 The differences between the layout suggestions
The major differences between the layouts are that Layout 1 has one weighbridge
and Layout 2 has two weighbridges. This results in that the capacity at Layout 2 are
higher. Present at Yilport, there are about 23 percentage of the flows that need to
use a weighbridge. To clarify the needed capacity at Yilport and the capacity
outcome from the two layout suggestions a simulation need to be performed. The
simulation can then reveal which layout that is most suitable for the organization
regarding the capacity. Other differences that can be seen in the layout suggestions
are that Layout 2 has straighter lanes and also less lanes, which results in more
expansion possibilities for Yilport in the future. That is because Layout 2 is using less
space of the area than Layout 1. Layout 2 has two weighbridges which means that
the length of the transportation will be shorter for the trucks that is using the
weighbridge and the time it takes will therefore be shorter as well. Before choosing
which of the layouts to pick, the economic aspects need to be considered by Yilport.
There are several direct costs, e.g. the purchase price of the weighbridges and also
maintenance costs that need to be in consideration. Because Layout 2 has two
weighbridges the costs will be higher, however two weighbridges will also assure
the functionality. If one weighbridge cannot be used for a reason the other
weighbridge can be used instead.
Another aspect to consider is that the combination of the two suggested layouts may
fit the organization in a better way. This refers to the flow when the goods need to
be weighted from the vessels, to then be stored in the marine terminal. In this flow
the goods are not supposed to leave the port so if a combination of the two layouts is
made, the trucks in this flow does not have to leave Yilport´s area.
However, calculation of the two layouts is important and have impact on which
layout to choose. Following calculations is essential and recommends to be used in
this manner.
Arrival rate (number/ time unit)
Service rate (number/ time unit) µUtilizationNumber of parallell stations s
Mean value of waiting truks NBuffer locations b
Availability Ab
Coefficient of variation for
processing time
Coefficient of variation for
interarrival
λ
= 1

44
0,2017
1-0,2017
= =0,2526 = 0,25 = Mean value of waiting trucks to the entire gate process.
90 x
Time spent in the gate- process = 121 seconds
x
= 15,88 = The average time spent in the queue to the document
scanner is 15,88 seconds.
General calculations which regards both layouts:
To calculate the average time spent in the queue to the document scanner, the
waiting time formula for exponential arrivals has been used.
An average of 23 percentage (see table 3, p.32) of the entering flows needs to use a
weighbridge. In time of the peak hour, when the arrival rate is at its highest.
Following calculation has been conducted.
Peak arrival rate: 6
% that needs to weigh: 23
6 x 0, 23 =1, 38 = the number of trucks that needs to use a weighbridge during
peak hour.
Ab = 1 = 1 =1 =100% = Availability of the process which shows that the number of buffer places is enough for the current condition and the
capacity of the gate process.
6/3600
1/90 x 1
6/3600
1/121 x 1
= =0,15 =15% = Utilization of the document scanner during peak hour.=
= =0,2017 =20,2% = Utilization of the entire gate process during peak hour.=

45
1,38/3600
1/20 x 1
1,38/3600
1/20 x 2
= = =0,0076 =0,76% = Utilization of each of the weighbridges during peak hours if two weigh bridges are used as in layout two.With the assumption that the truck are
entering and leaving during the peak hour.
= = =0,015 =1,5% = Utilization of the weighbridge during peak hours if one weigh bridge are used as in layout one. With the assumption that the truck are entering and leaving during the peak hour.
The differences between the utilization of the layouts are the utilization of the weigh
bridges and is shown below. All calculations use the mathematical formula of which
the utilization can be determined in a Poisson distribution:
The calculations reveals that the utilization of the weighbridge in layout one is to
prefer out of the utilization point of view. However, in the end, everything is
dependent on the cost-benefit-analysis and the future expansion plans. As Gyulai et
al. (2016) states the utilization is an important KPI, which determines that the
calculations above is well topical. When the processes is changing it is important to
have this kind of KPI to determine if there has been some improvements after the
change (Andreasson 1997).
The total time a truck spend in the process is dependent on which layout suggestion
that will be used. A calculation of the time each part takes in the total processes is to
be found in appendix 4. The appendix reveals that layout suggestion 1, has a total
process time of 226 seconds, while layout suggestion 2 has a total process time of
121 seconds.
Table 4. Calculated differences
Alternative suggestion Total process time / seconds Utilization of weighbridges
Layout 1 226 1,50%
Layout 2 121 0,76%
=
46
7. Discussion
In this chapter the research questions will be analyzed, discussed and answered.
7.1 How can a layout planning procedure for a marine
terminal be designed?
As described in chapter 3 a methodology procedure were conducted by the
literature review and in the chapter of analysis it was validated by empirical data.
The procedure follows the attributes to function as a layout planning procedure for a
marine terminal regarding gate operations and as two layouts were conducted, it
accomplished what the procedure supposed to. However, the model should not be
dismissed because of the fact that this thesis only verified it in one case study. In fact
it should draw attention as the model is evolved and built upon literature. As both
Andreasson (1997) and Muther (1973) argues for a step by step procedure the
conceptual model is not an innovation but rather an incremental improvement and a
methodology development.
7.2 How and to what extent can problems be solved by
localization and configuration of a gate?
There are several problems regarding localization and configuration of a gate that
have been identified in both the literature review and the empirical data. The
identified problems are: bottlenecks, peaks, security and transportation routes.
These problems can be solved by solutions that has been identified in the literature
review and tested by the layout suggestions that has been designed upon the case
study.
7.2.1 Bottlenecks
Bottlenecks at gates can occur when the capacity of the gate is not in line with the
capacity of the port (Kozan 2000). This problem has been identified in the case
study because the current gate only have one server for all the incoming flows and
the capacity at the bulk terminal is therefore higher due to the fact that the different
flows has their own capacity. According to Chen and Yang (2014) and Chen et al.
(2011) a lot of marine terminals are running their facilities at maximum capacity due
to the great growth in international trade. This can be one of the reasons why the
capacity is too low at a lot of marine terminals. According to Guan and Liu (2009)
who states that low capacity will lead to traffic congestions and unnecessary high
costs for the waiting trucks, it can be stated that higher capacity will be needed.

47
According to Chen et al. (2013) queue reduction can be achieved by either layout
planning or expansion of the gate and Schwarz et al. (2016) describes the arrival rate
and the servers, as two parameters that need to be in consideration. Both those
parameters have been considered in this thesis work due to the fact that they affect
the layout planning in a great manner. The arrival rate which has been calculated
from the received data has been used to identify the number of trucks arriving to
Yilport´s bulk terminal during certain hours. In terms of the servers the current
situation has been seen as a problem due to the long service time at the gate. This
lead to that the efficiency of the server has been in focus rather than the number of
servers. At Yilport the problem can be solved by changing the service rate of the
gate which according to Chen and Yang (2014) has a great impact on the
performance of the gate. In the layout suggestions the service time is therefore faster
than at the current gate. However, for other marine terminals the need of more
servers than one can be a more efficient solution.
Chen and Yang (2014) also states that the length of the queue is important, which is
another problem that has been noticed at Yilport, whereas there is no queue system
for the queuing trucks at the present gate. However, at present the queues are not a
major problem except during peak hours, but for a future possible expansion the
queuing problem need to be in consideration. To be able to fit all the trucks that is
waiting, an estimated analysis of the area has been accomplished to find out how
many lanes are needed in order to get a good flow and fit all the trucks waiting.
According to Motono et al. (2016) it is commonly to increase the number of lanes
to reduce traffic congestion. In the layout suggestions the space for waiting trucks
has therefore been designed upon the highest mean number of trucks that has been
arriving to the terminal during certain hours. For future expansions the number of
waiting places is a bit higher than the actual mean number, with an additional 25
percentage of space.
7.2.2 Peaks
Gates often have two peak hours during the day when more trucks arrives at the
same time (Chen et al. 2015; Motono et al. 2016). According to the case study at
Yilport the company also had two peak hours which Motono et al. (2016) states is
common at marine terminals. To reduce the peaks an appointment systems can be
used to plan the arrival of the trucks which in turn only allows a maximum number
of trucks arriving at a certain time (Phan & Kim 2015). Another solution can be to
add a fee program which results in that the trucks that arrives at certain hours will
be eligible to pay a fee for loading or unloading (Giuliano & O´Brien 2008). A third
solution to the problem can be as Motono et al. (2016) describes to have a system
connected between the marine terminal and the truck. The truck driver then need

48
to register their truck ID and information about their purpose to enter the marine
terminal one day ahead of their visit (Motono et al. 2016).
The different solutions may have different effects depending on the terminal and the
problem at the terminal, but for this case study the third suggestion may be a good
fit for Yilport. However, the problem may not be completely solved at any terminal
by just the application of one of the suggestion. According to Motono et al. (2016)
many trucks arrives to marine terminals with improper documents which effects the
service rate at the gate in a negative way. This problem can lead to long queues and
waiting time for trucks with the right documents. To be able to solve this problem
Motono et al. (2016) states that an IT-system that are sending important
information about the trucks and the goods can be implemented. Since this is way
that scientifically work. The layout suggestions are designed as they are with both
registration number- and document scanner. The truck drivers with IDT´s will be
rejected away from the gate quickly.
7.2.3 Security
Nowdays a lot of goods is transported by sea and therefore the need for strengthen
the security at marine terminals are important. In order to strengthen the security at
marine terminals some security initiatives has been coming up and one among them
is ISPS (Chang & Thai 2016; Yeo et al. 2013; Yoon & Gim 2014). Yilport is one
company that has problem with obtaining their ISPS responsibility and thus need to
solve the problem. Andreasson (1997) states that a good layout can have a positive
impact on the security and as well as area utilization which can be more efficient. By
planning for, and applying, a good layout it can therefore be easier to obtain the
security within a marine terminal.
According to Nurthen (2003) the security at gates is an important factor and
therefore it is important check every single truck that are entering the marine
terminal. Both layouts suggestions contains gates for both in – and outgoing vehicle
traffic and they also have several security check points in the lanes for traffic
entering Yilport´s area. The checkpoints for truck traffic are the registration plate
number scanner and the document scanner. For the employees at Yilport the
checkpoint is the scanner to show their key card. So, persons who is not ineligible
can therefore not enter the terminal. The authors are confident that this level of
security is good and will solve the problem that Yilport possesses. For other
companies with similar problems the configuration of the gate may need to be
designed in a different way to fit their requirements but the basic idea will be the
same. Chang and Thai (2016) also states that there are more benefits than only
security that can be achieved from security systems, the customer satisfaction for
example. Yeo et al. (2013) on the other hand argues that the implementation of
49
security systems can enhance the security costs to a too high level. A cost-benefit-
analysis to verify the costs related to the level of security expected can therefore be a
good suggestion to accomplish (Yeo et al. 2013; Muther 1973).
7.2.4 Transportation routes
The transportation within ports are critical and do often entails some issues
connected to transportation chain efficiency (Ducruet and Van der Horst 2009). It is
therefore important to determine the transportation routes within the marine
terminal which Muther (1973) describes as the most significant aspect in layout
planning. According to Olhager (2013) this can be done by creating a flowchart.
Several flowcharts has been done in order to identify and analyze the different flows
(the flowcharts can be found in appendix 3 and 4). The flowcharts are designed in
two different ways, whereas the flowcharts in appendix 3 are designed upon a map
and represent the current flows. In appendix 4, the flowcharts are designed with
boxes and represent the new layout suggestions. Olhager (2013) also states that the
transportation routes binds all the processes together and since that is crucial, a good
layout is important. To get efficient flows in the layout suggestions the gate has been
localized nearby the most frequent and also most important flows which Ducruet
and Van der Horst (2009) states is important. Andreasson (1997) agrees and argues
that to be able to reduce costs the layout planning for the flows need to be good and
seek to reduce the transportation routes.
Roadknight et al. (2012) argues that the arrival statistics to the weighbridge are
related to the arrival rate at the gate and according to Mondragon et al. (2012)
queues and distances has a significant impact on the time required for a truck to
weigh. From the empirical data the localization of a weighbridge nearby the gate is
planned. That is of a strategic reason because the trucks need to weigh the tare when
entering the terminal and then the goods when they have been loaded. By adding
weighbridges to the configuration of the gate, it will result in that Yilport save a lot
of transportation time and reduce the negative impact on the environment by
shorter routes which Chen et al. (2011) agrees to is important. The number of
weighbridges can be calculated by the use of simulation which Gyulai et al. (2016)
states is a good way to calculate how well the layout suits the specific organization.
This is why this thesis has conducted a base for a simulation. The simulation will be
performed as a complement to this thesis so that the case company can see how well
the suggestions fit their organization.

50
7.3 How can a comparison be made to evaluate layouts?
In the conceptual model the 11th step is to evaluate and compare the proposed
layouts. Both Andreasson (1997) and Muther (1973) has a steps regarding
evaluation, even if Andreasson did not name a step entirely to “evaluation” it is a
part in step 9; “Alternative and discussion”. According to Andreasson (1997) the
evaluation it is made by a group of individuals discussing the pro’s- and con’s
regarding the different layouts while Muther (1973) has a more complex sight at
evaluation. He states that it is necessary to develop a cost benefit analysis regardless
if the decision should be made upon it or if the analysis should enhance another
method. Unfortunately as all costs cannot be measured (Muther 1973), it is
impossible to calculate all the potential cost, this in turn leads to questioning the
righteousness of a decision based entirely on a cost benefit analysis. As well as
Andreasson (1997), Muther (1973) argues for a pro’s and con’s analysis but he also
states that certain factors need to be discussed e.g. ease of future expansion, ability
to meet capacity or requirements and space utilization (other factors is to be found
in appendix 1). If an organization follows the conceptual model a comparison by the
three mentioned factors can be done easily since the factors consider step 8 and 9, in
figure 3. The two layout proposals that has been formed in this thesis can therefore
be evaluated as follow:
As the layouts is built upon the conceptual model, the empirical data and the data
received from Yilport, the capacity requirements have been an undertaking
throughout the entire layout procedure. However as layout 1 only carry out one
weighbridge it is more likely that queues occur in that particularly layout rather than
in layout 2 (the one with two weighbridges), which can evaluate Layout 1 as it has a
lower capacity. To clarify the needed capacity at Yilport and the capacity outcome
from the two layout suggestions, a simulation can be performed. The simulation can
then reveal which layout that is the most suitable for the organization regarding the
capacity. When it comes to future expansion and space utilization, the construction
and layout of layout 2 is more likely to be chosen because it have used less space of
what is available than layout 1. Meaning that layout 2 has used the available space in
a more efficient way, as Andreasson (1997) advocating. As shown, if a comparison
only made by these three factors, layout 2 would be coveted. But as Muther (1973)
argues it is important to do a cost analysis of some kind. The layout 2 may be much
more expensive than the other because of the purchase price and the maintenance of
two weighbridges instead of one. However as the research limitations regards to
remove financial factors and the research purpose not is to determine the best
layout, the mentioned factors and cost bearing is only stated as an example.

51
According to Banks (1998) a simulation is often used to analyze a system, whereas it
also according to Cimpeanu et al. (2017) is a great tool to evaluate the performance
of a gate system. Since this thesis seek to find out if a specific methodology model is
applicable in a marine terminal verified by the results of the model (the suggested
layouts), it is argued that a simulation is a useful tool to evaluate and compare the
results. It is because of that, a base for a simulation has been accomplished to verify
how good the suggestions fit the organization further more (appendix 4). In addition
Gyulai et al. (2016) confirms this statement by imply that a simulation can calculate
how good the layouts fits the organization. An example of a simulation of the
specific area and processes for this thesis, conducted by an external partner, can be
found in appendix 7.
As earlier mentioned Gyulai et al. (2016) argues that the simulation can calculate
five important KPI’s; (1) Overlapping, (2) Line length, (3) Lead time, (4)
Utilization and (5) WIP. Although this evaluation is constructed to match an indoor
material layout it can be compared to the outdoor transportation flow. In an
evaluation regarding gates in a marine terminal the author’s states that overlapping
refers to if the flows overlap in some possible way with each other. Line length
concerns how long the routes are from gate to destination within the terminal. Lead
time is the time it take to process a truck in the gate. Utilization refers to if the
organization uses its resources in best way possible and lastly the WIP stands for
number of flows circulating within the port organizations area.
Furthermore, it is of great importance to evaluate and compare the sustainability
regarding the developed layouts. According to Kim and Chiang (2017) the attention
around port sustainability has increased in manners of the economic, eco-social and
operational issues. This raises questions often related to transportation. As Yilport
got a global market and always is aiming to find the most optimal transport solution
with an environmental perspective in mind, it reveals that the environmental factor
is an important factor for this company. The longer the routes and the longer the
ques, the greater impact on the environment (Chen et al. 2011; Chen et al. 2013)
and the greater the transportation cost (Andreasson 1997). As environmental
pollution often is a consequence of the transportation (Mamatok & Jin 2017) a good
layout can reduce both the transportation costs (Andreasson 1997) and the impact
on the environment into a more sustainable marine terminal. This is factors that
most sincerely needs to be in consideration, which indeed hamper the chances for a
layout with more complicated routes and flows.

52
Sustainability does not only consider the environmental impact but also the
sustainability regarding the operational issues (Kim & Chiang 2017). When a layout
is processed both Muther (1973) and Yang et al. (2000) argues that a future
expansion need to deliberate. As the increasing global trade (Chen & Yang 2014)
and the fact that 90 percentage of the world’s cargo value is transported by sea
(Kotachi et al. 2013; Yoon & Gim 2014) it can be assumed that marine terminals
will continue to expand since it is one of the most economical way of transportation
(Tayfur 2000). In Yilports organization the expansion, according to the interviews,
is a fact to stay competitive. Whereas the possibilities to an expansion need to be
legitimated if the layout should be able to sustain the requirements.
Regarding the sustainability the security within marine terminals is also a factor that
needs to be in consideration when evaluating a layout. As an effect of the terrorist
attacks the 11th of September, the ports has strengthen the security worldwide
(Chang & Thai 2016; Yeo et al. 2013; Yoon & Gim 2014). This mean that the
layout also has to be evaluated regarding the security as well. The proposed layout
needs to sustain the security initiatives such as ISPS and SOLAS and according to
Nurthen (2003) the security within terminals also refers to how protected the
terminal is by guards and gates surrounding the area. The proposed layouts in this
particularly thesis have the same gate system (although not the same configurations)
which makes it hard to evaluate and compare which of the following that has the
best suggestion regarding security. Beyond this thesis a comparison of the security
regarding the layouts in a marine terminal is to be seen as important. However as
Yilport wants to strengthen the security it can be referred to as a sustainable act
since it secure the terminal in a short-term as well as in a long-term.

53
8. Conclusions
The research purpose is to, in a systematic way, build a method to develop suggestions
regarding layout planning of gates in a marine terminal and additionally conduct a base for a
simulation model.
In this thesis methods for developing layouts have been reviewed and analyzed with
literature regarding marine terminals. The outcome of the analysis is a conceptual
model which functions as a procedure for layout planning of gates in an already
existing marine terminal (figure 3). To validate the conceptual model the company
Yilport were selected as a research target. The conceptual model was tested at
Yilport by applying the step-by step method to conduct several layout suggestions
for the gate. The layout suggestions show that the conceptual model is good and
working. The calculations made in this thesis recommends to calculate at any marine
terminal regarding layout changes. Additionally when the process is to be changed
the simulation is a good method to use to verify and convince the improvements of
the change to come. As the layout suggestions have been conducted upon the
conceptual model and an external simulation has been conducted by the developed
base, it is to be stated that the purpose of this thesis has been fulfilled.
Theoretical contributions
This thesis contributes to a methodology development regarding gates in marine
terminals. This contribution aims to add theory to the existing gap regarding gate
operation in multi-purpose terminals. The conceptual model provides a good
procedure for the layout planners who wants to, in a systematic way, develop layout
suggestions of gates in marine terminals.
Practical relevance
To the case company, Yilport, two layout suggestions have been conducted by the
step- by- step procedure, which accordingly validate the functionality of the
conceptual model. Since a simulation has been conducted and verifies that the layout
suggestions will function at Yilport, a full evaluation of the layout suggestions thus
have to be done additionally to this thesis regarding financial and technical aspects.
The calculations provided in the analysis is strongly recommended to use in terms of
layout changes both before and after the change.

54
Future research
There is a scope for further research as there are some limitations regarding the
model, like any other research the model need to be further validated. This can be
done by testing it at other terminals and in other case studies. As an ongoing
research effort the model needs to be continuously improved. The identified gap in
existing theory regarding gates at multi-purpose terminals still needs additional
research since this paper only contributes to fill in a part of the gap.
55
References
Altiok, T. (2000). Tandem queues in bulk port operations, Annal of operations
Research, 93 (2000): 1-14.
Andersen, B. and Pettersen, P-G. (1995). Benchmarking - en praktisk handbok. Lund:
Studentlitteratur AB.
Andreasson. B. (1997). Handledning i verkstadslayout- råd och tips när layouten skall
förändras. Mölndal: Institutet för Verkstadsteknisk Forskning.
Banks, J. (1998). Handbook of Simulation, Toronto: John Wiley & Sons, Inc.
Biggam, J. (2015). Succeeding with your Master’s Dissertation. Maidenhead: McGraw-
Hill Education.
Bryman, A. and Bell, E. (2015). Business research methods. United kingdom: Oxford
university press.
Chang. C-H. and Thai. V.V. (2016). Do port security quality and service quality
influence customer satisfation and loyalty?, Maritime policy & Management, 43(6):
720-736. DOI: 10.1080/03088839.2016.1151086.
Chen, G., Govindan, K. and Yang,Z. (2013). Managing truck arrivals with time
window to alleviate gate congestion at container terminals, International Journal of
Production Economics, 141 (2013): 179-188. DOI: 10.1016/j.jpe.2012.03.033.
Chen, G. and Yang, Z-Z. (2014). Methods for estimating vehicle queues at a
marine terminal: a computational comparison, International Journal of Applied
Mathematics and Computer Science, 24 (3): 611-619. DOI: 10.2478/amcs-2014-0044.
Chen, X., Zhou, X. and List, G.F. (2011). Using time-varying tolls to optimize
truck arrivals at ports, Transportation Research Part E, 47 (2011); 965–982.
DOI:10.1016/j.tre.2011.04.001.
Chowdhury, S. and Mukherjee, S.P. (2013). Estimation of traffic intensity based on
queue length in a single M/M/1 Queue, Communications in Statistics - Theory and
Methods, 42 (2013): 2376-2390. DOI: 10.1080/03610926.2011.609320.
Cimpeanu, R., Devine, M.T. and O’Brien, C. (2017). A simulation model for the
management and expansion of extended port terminal operations, Transportation
Research Part E: Logistics and Transportation Review, 98 (2017): 105-131.
DOI:/10.1016/j.tre.2016.12.005.
Creswell, J.W. (2009). Research design. Thousand Oaks: Sage Publications Inc.

56
Demirbas, D., Flint, H. and Bennett, D. (2014). Supply chain interfaces between a
port utilizing organisation and port operator, Supply Chain Management: An
International Journal, 19 (1): 79-97. DOI: 10.1108/SCM-04-2013-0137.
Ducruet, C. and Van der Horst, M. (2009). Transport integration at European
Ports: Measuring the Role and position of Intermediaries, European Journal of
Transport and Infrastructure Research, 9 (2): 121-142.
Dwarakish, G.S. and Salim, A.M. (2015). Review on the Role of Ports in the
Development of a Nation, Aquatic Procedia, 4 (2015): 295-301. DOI:
10.1016/j.aqpro.2015.02.040.
Ejvegård, R. (2003). Vetenskaplig metod. Lund: Studentlitteratur AB.
Eliasson, A. (2010). Kvantitativ metod från början. Lund : Studentlitteratur AB.
Fabiano, B., Currò, F., Reverberi, P. and Pastorio, R. (2010). Port saftey and the
container revolution: A statistical study on human factor and occupational accidents
over the long period, Safety science, 48 (2010): 980-990. DOI:
10.1016/j.ssci.2009.08.007.
Field, A.J. and Harrison, P.G. (1999). Sojourn times in a random queue with and
without preemption, European Journal of Operational Research, 112 (1999): 646-
653.
Giuliano, G. & O´Brien, T. (2008). Extended gate operations at the ports of Los
Angeles and Long Beach: a preliminary assessment, Maritime Policy & Management, 35
(2): 215-235. DOI: 10.1080/03088830801956854.
Guan, C. and Liu, R. (2009). Modeling Gate Congestion of Marine Container
Terminals, Truck Waiting Cost, and Optimization, Journal of the Transportation
Research Board, DOI: 10.3141/2100-07.
Gyulai. D., Szaller. Á. and Viharos. Z.J. (2016). Simulation-based Flexible Layout
Planning Considering Stochastic Effect, Procidia CIRP, 57 (2016): 177-182. DOI:
10.1016/j.procir.2016.11.031.
Holme, I.M. and Solvang, B.K. (1997). Forskningsmetodik - om kvalitativa och
kvantitativa metoder. Lund: Studentlitteratur AB.
Jakobsson, U. (2011). Forskningens termer och begrepp. Lund: Studentlitteratur AB.
Jackson, N. (2000). Benchmarking Educational Processes and Outcomes. In
Jackson, N. and Lund, H. (edi.). Benchmarking for Higher Education. Buckingham:
Open University Press, pp. 29-41.

57
Keceli, Y. (2016). A simulation model for gate operations in multipurpose cargo
terminals, Maritime policy & Management, 43(8): 945-958. DOI:
10.1080/03088839.2016.1169448.
Kim, S. and Chiang, B.G. (2017). The role of sustainability practices in
international port operations: an analysis of moderation effect, Journal of Korea Trade,
21 (2). DOI: 10.1108/JKT-03-2017-0025.
Kotachi. M., Rabadi. G. and Obeid. M.F. (2013). Simulation Modeling and
Analysis of Complex Port Operations with Multimodal Transportation, Procedia
Computer Science, 20: 229-234. DOI: 10.1016/j.procs.2013.09.266.
Kozan, E. (2000). Optimising Container Transfers at Multimodal Terminals,
Mathematical and Computer Modelling, 31 (2000): 235-243.
Lantz, B. (2014). Den statistiska undersökningen- grundläggande metodik och typiska
problem. Lund: Studentlitteratur AB.
Lin, H., Wang, Z., Li, Z. and Li, S. (2015). Weighing fusion method for truck scale
based on an optimal neural network with derivative constraints and a lagrange
multiplier, Measurement, 63 (2015): 322-329. DOI:
10.1016/j.measurement.2014.12.011.
Lin, H., Xiang, H., Wang, L. and Yang, J. (2017). Weighing Method for Truck
Scale Based on Neural Network with Weight-Smoothing Constraint, Measurement,
DOI: 10.1016/j.measurement.2017.02.038.
Lumsden. K. (2012). Logistikens grunder. Lund: Studentlitteratur AB.
Mamatok, Y. and Jin, C. (2017). An integrated framework for carbon footprinting
at container seaports: the case study of a Chinese port, Maritime Policy and
Management, 44 (2): 208-226. DOI: 10.1080/03088839.2016.1262077.
Manivannan, M.S. (1998). Simulation of Logistics and Transportation Systems. In
Banks, J. (edi.) Handbook of Simulation. Toronto: John Wiley & Sons, Inc, pp. 571-
604.
Mondragon, A.E.C., Lalwani, C.S., Mondragon, E.S.C., Mondragon C.E.C. and
Pawar, K.S. (2012). Intelligent transport systems in multimodal logistics: A case of
role and contribution through wireless vehicular networks in a sea port location,
International Journal of Production Economics, 137 (2012): 165-175. DOI:
10.1016/j.ijpe.2011.11.006.

58
Motono. I., Furuichi. M., Ninomiya. T., Suzuki., S. and Fuse. M. (2016). Insightful
obsevation on trailer queues at landside container terminal gates: What generates
congestion at the gates?, Research in Transportation Business & Management, 19: 118-
131. DOI: 10.1016/j.rtbm.2016.04.001.
Muther, R. (1973). Systematic layout planning. Kansas city: Management & industrial
research publications.
Nurthen, W. (2003). Urban infrastructure security, Technology in Society, 25 (2003):
543-547. DOI: 10.1016/j.techsoc.2003.09.017.
Olhager. J. (2013). Produktionsekonomi. Lund: Studentlitteratur AB.
Parola, F. and Sciomachen, A. (2005). Intermodal container flows in a port system
network: Analysis of possible growths via simulation models, International journal of
production economics, 97 (2005): 75-88. DOI: 10.1016/j.ijpe.2004.06.051.
Phan, M-H. and Kim, K.H. (2015). Negotiating truck arrival times among trucking
companies and a container terminal, Transportation Research Part E, 75 (2015): 132-
144. DOI: 10.1016/j.tre2015.01.004.
Roadknight, C., Aickelin, U. and Sherman, G. (2012). Validation of a
microsimulation of the Port of Dover, Journal of Computational Science, 3 (2012): 56-
66. DOI: 10.1016/j.jocs.2011.07.005.
Riege, A. M. (2003). Validity and reliability tests in case study research: a literature
review with ”hands-on” applications for each research phase, Qualitative Market
Research: An International Journal, 6 (2): 75-86. DOI: 10.1108/13522750310470055.
Rodrigue, J-P. and Notteboom, T. (2010). Comparative North American and
European gateway logistics: the regionalism of freight distribution, Journal of
Transport Geography, 18 (2010): 497-507. DOI: 10.1016/j.trangeo.2010.03.006.
Ryen, A. (2004). Kvalitativ intervju - från vetenskapsteori till fältstudier. Malmö: Liber
Schwarz, J.A., Selinka, G. and Stolletz, R. (2016). Performance analysis of time-
dependent queueing systems: Survey and classification, Omega, 63 (2016): 170-189.
DOI: 10.1016/j.omega.2015.10.013.
Tao, J. and Qiu, Y. (2015). A simulation optimization method for vechicles
dispatching among multiple container terminals, Expert Systems with Applications, 42
(2015): 3742-3750. DOI: 10.1016/j.eswa.2014.12.041.
Tomkins. J. A. and White. J. A. (1989). Facilites planning. New york: John Wiley &
sons.

59
Transportstyrelsen (2002).Vägutformning 94 (Rapport 2001:112). Borlänge:
transportstyrelsen.
http://www.trafikverket.se/contentassets/ae691194ff304b85a78e55e3ac13ed90/
del_3_grundvarden_version_s1.pdf [2017-05-10]
Transportstyrelsen (2017). Dimensioner.
https://www.transportstyrelsen.se/sv/vagtrafik/Yrkestrafik/Gods-och-
buss/Matt-och-vikt/Dimensioner/ [2017-05-10]
Travers, M. Qualitative Research Through Case Studies. London: Sage Publications Ltd.
Vieira, G.B.B., Neto, F.J.K. and Ribeiro, J.L.D. (2015). The Rationalization of
Port Logistics Activities: A Study at Port of Santos (Brazil), International Journal of e-
Navigation and Maritime Economy, 2 (2015): 73-86. DOI:
10.1016/j.enavi.2015.06.007.
Wengraf, T. (2001). Qualitative Research Interviewing. London: Sage Publications Ltd.
Yang. T., Su. C-T and Hsu. Y-R. (2000). Systematick layout planning: a study on
semiconductor wafer fabrication facilities, International Journal of Operations &
Production Management, 20 (11): 1359-1371. DOI: 10.1108/01443570010348299.
Yasin, M.M. (2002). The theory and practice of benchmarking: then and now,
Benchmarking: An International Journal, 9 (3): 217-243. DOI:
10.1108/14635770210428992.
Yeo. G-T., Pak. J-Y. and Yang. Z. (2013). Analysis of dynami effect on seaports
adopting port security policy, Transportations Research Part A, 49: 285-301. DOI:
10.1016/j.tra.2013.01.039.
Yin, R.K. (2003). Case study research. Thousand Oaks: Sage Publications, Inc.
Yoon. D. and Gim. J. (2014). A study of economic efficiency in port security
inspection, Journal of advanced transportation, 48: 443-453. DOI: 10.1002/atr.1191.
Zhang, Y., Kim, C-W., Tee, K.F. and Lam, J.S.L. (2017). Optimal sustainable life
cycle maintenance strategies for port infrastructure, Journal of Cleaner Production, 142
(2017): 1693-1709. DOI: 10.1016/j. clepro.2016.11.120.
Zhao, X., Hou, J. and Gilbert, K. (2014). Measuring the variance of customer
waiting time in service operations, Management Decision, 52 (2); 296-312. DOI:
10.1108/MD-01-2013-0012.
60
Appendix
Appendix 1. Intangible factors………………………………………………….61
Appendix 2. Interview questions………………………………………………..62
Appendix 3. Flow chart of current flows………………………………………..63
Appendix 4. Flow chart of suggested layouts…………………………………...66
Appendix 5. Layout one, without large arrows………………………………….70
Appendix 6. Layout two, without large arrows………………………………….71
Appendix 7. Simulation and evaluation………………………………………….72

61
Appendix 1- Intangible factors
1. Ease of future expansion
2. Adaptability and versatility
3. Flexibility of a layout
4. Flow of materials effectiveness
5. Material handling effectiveness
6. Storage effectiveness
7. Space utilization
8. Effectiveness of supporting-service integration
9. Safety and housekeeping
10. Working conditions and employee satisfaction
11. Ease of supervision and control
12. Appearance, promotional value, public or community relations
13. Quality of product
14. Maintenance problems
15. Fit with company organization structure
16. Equipment utilization
17. Utilization of natural conditions or surroundings
18. Ability to meet capacity or requirements
19. Plant security and pilferage
20. Compatibility with long-rang company plans
(Muther 1973 page.VI-1)
62
Appendix 2- Interview questions
Intervjufrågor till underhållschef på Gävle hamn
På vilket sätt var du involverad i ombyggnationen av Gävle hamns nya port?
Vilka var de viktigaste faktorerna vid utformningen av porten?
- hur beaktades social- och miljömässig hållbarhet?
Hur tänkte ni gällande placering och antal av vågbryggor?
Uppdaterade ni dem?
Vilka faktorer hade störst betydelse gällande säkerhet vid utformning av porten?
Intervjufrågor till kundtjänst chefen och till Lean specialisten på Yilport
Vilka är era största problem på Yilports område i dagsläget?
Varför?
Hur ser Yilports område ut?
Kan ni förklara/ beskriva kartan.
Hur ser Yilports beläggning ut?
Intervjufrågor till kundtjänst chefen
Vilken kapacitet skall porten/flaskhalsen ha?
Vilket/vilka flöden måste prioriteras vid placering av porten oberoende av frekvens?
Vilka flöden kräver en vågbrygga?
Intervjufrågor till fartygs planeraren
Vilka flöden kräver vågbryggor?
Vilka kajplatser används för dessa flöden?
- vilken/ vilka är mest frekventa?

63
Appendix 3- Flow chart of current flows
Map flow chrome
The map is showing the flow of when trucks are arriving at the marine terminal to
load chrome.
Step 1. On the way in to the marine terminal the truck has to stop at the gate of
Gävle hamn to show documents and then to weigh the tare of the truck. The truck is
then going to the current gate of Yilport to show documents and get a working
order.
Step 2a, 2b and 2c. The truck is going to the different areas to load goods
depending on who the customer is, where the goods has been unloaded from the
vessel and type of chrome.
Step 3a, 3b and 3c. The truck is going to the weighbridge located at the gate of
Gävle hamn to weigh the goods and then leave the marine terminal.
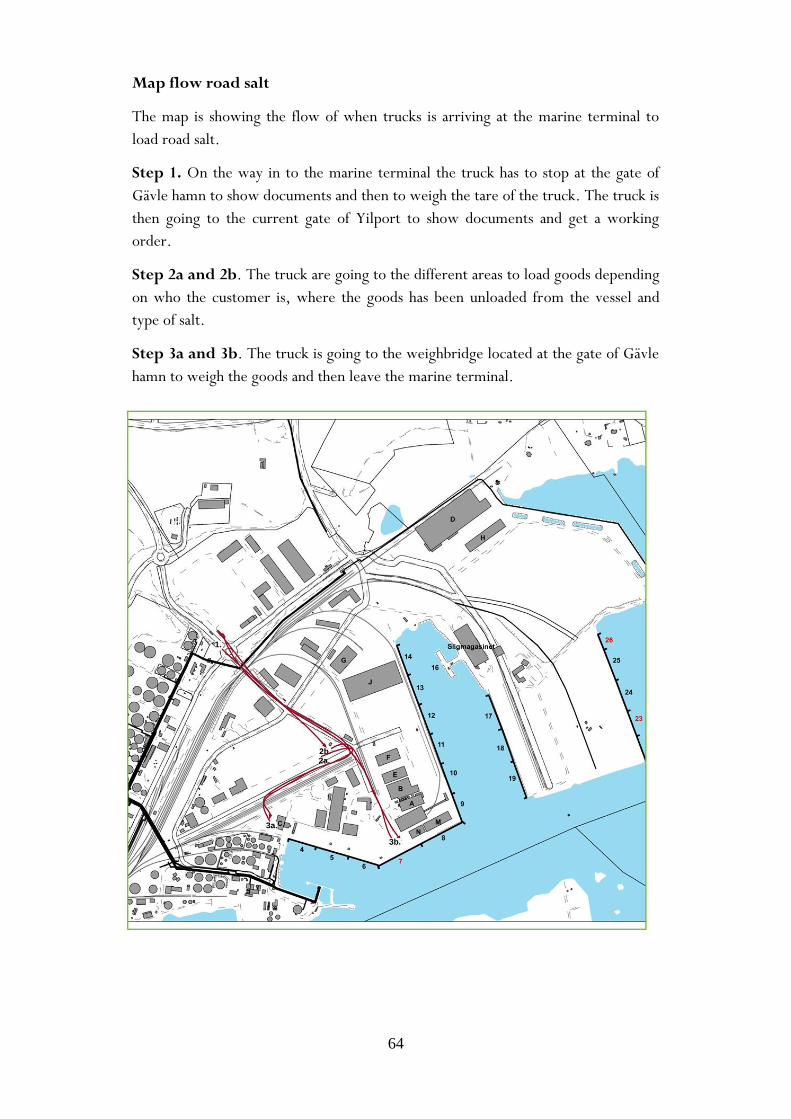
64
Map flow road salt
The map is showing the flow of when trucks is arriving at the marine terminal to
load road salt.
Step 1. On the way in to the marine terminal the truck has to stop at the gate of
Gävle hamn to show documents and then to weigh the tare of the truck. The truck is
then going to the current gate of Yilport to show documents and get a working
order.
Step 2a and 2b. The truck are going to the different areas to load goods depending
on who the customer is, where the goods has been unloaded from the vessel and
type of salt.
Step 3a and 3b. The truck is going to the weighbridge located at the gate of Gävle
hamn to weigh the goods and then leave the marine terminal.
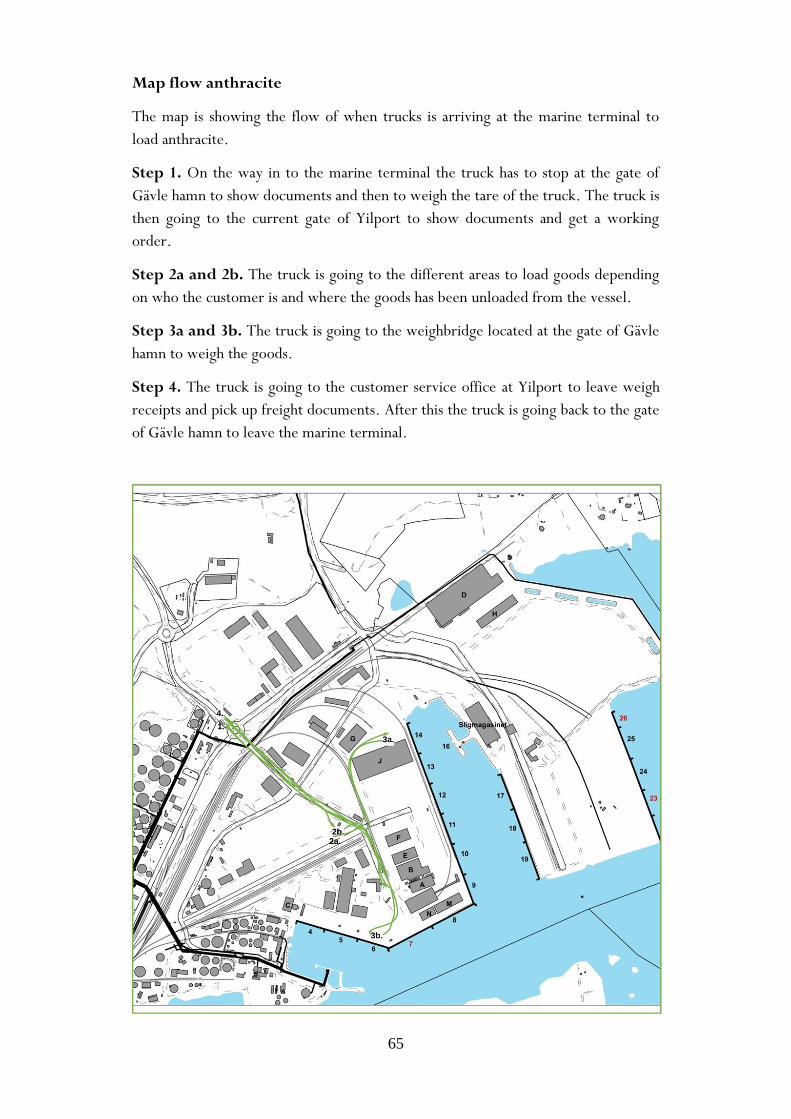
65
Map flow anthracite
The map is showing the flow of when trucks is arriving at the marine terminal to
load anthracite.
Step 1. On the way in to the marine terminal the truck has to stop at the gate of
Gävle hamn to show documents and then to weigh the tare of the truck. The truck is
then going to the current gate of Yilport to show documents and get a working
order.
Step 2a and 2b. The truck is going to the different areas to load goods depending
on who the customer is and where the goods has been unloaded from the vessel.
Step 3a and 3b. The truck is going to the weighbridge located at the gate of Gävle
hamn to weigh the goods.
Step 4. The truck is going to the customer service office at Yilport to leave weigh
receipts and pick up freight documents. After this the truck is going back to the gate
of Gävle hamn to leave the marine terminal.

66
Appendix 4- Flow chart of the suggested layouts
Frequency of the trucks.
7874 Trucks/year > 232 days/year > 12 h/day
12*232=2784> 7874/2784= 2.8 Trucks/h. > Random
On average there is peaks between 07:00-08:00 and 11:00-12:00 with 6 trucks on average at tops.
Because of a RANDOM inflow one cannot state how long time there is between the entering trucks, only that there is an average on 6 trucks/hour.
Although every truck should not be weigh. Only 23 percentage of all flows should be that. This make it an average on 1.38 trucks to be weigh in one hour at peak hours (count two). Which means less than that every other hour.
At daily basis it arrives ~34 trucks, of them only 7.8 ~8 trucks need a weighbridge.
Description of layout 1
A: When drivers drive through the scanner they do not need to stop, only drive through in a lane.
B: There is a marker on the road where the trucks need to stop and wait for C: to confirm the truck
C: It is now a sign that shows if the truck are expected and allowed to enter Yilports area ( Green light) and if not, a red light lights up which shows that they cannot enter the area. This happens by an electronic system connected with B:. When a driver passes B: it takes 20 seconds for the system to process the registration plate number data and to decide which color of the lamp to light up.
D: From B: to D it take approximately 20 seconds and here the driver stops again to scan the appropriate documents. This documents are then electronically transferred to the system which sends a work order to accurate truck helper within the terminal.
E: (From D: to E: it take about 11 sec.) if the documents are correct a gate opens within 3 seconds from confirmed documents so that the truck driver can enter the terminal area.
F: if the truck needs to weigh its tara (the weight of the truck and barer only) it would have to drive through the traffic circle to the weight bridge on the way out of the terminal. This takes approximately 60 sec.
G: The actual weighting takes approximately only 10 sec. for tara.
H: Driving from the weighbridge to the entry takes about 35 sec.

67

68
Description of layout 2
A: When drivers drive through the scanner they do not need to stop, only drive through in
a lane.
B: There is a marker on the road where the trucks need to stop and wait for C: to confirm
the truck
C: It is now a sign that shows if the truck are expected and allowed to enter Yilports area (
Green light) and if not, a red light lights up which shows that they cannot enter the area.
This happens by an electronic system connected with B:. When a driver passes B: it takes
20 seconds for the system to process the registration plate number data and to decide which
color of the lamp to light up.
D: From B: to D it take approximately 20 seconds and here the driver stops to scan the
appropriate documents. The documents are then electronically transferred to the system
which sends a work order to accurate truck helper within the terminal. At the same time
drivers scan the documents they can also weigh their tara (the weight of the truck and barer
only). The actual weighting takes approximately only 10 sec. for tara. But they can, as said,
do it at the same time because it is two different (but easy) systems that weighs and scan the
documents.
E: (From D: to E: it take about 11 sec.) if the documents are correct a gate opens within 3
seconds from the time of confirmed documents so that the truck driver can enter the
terminal area.
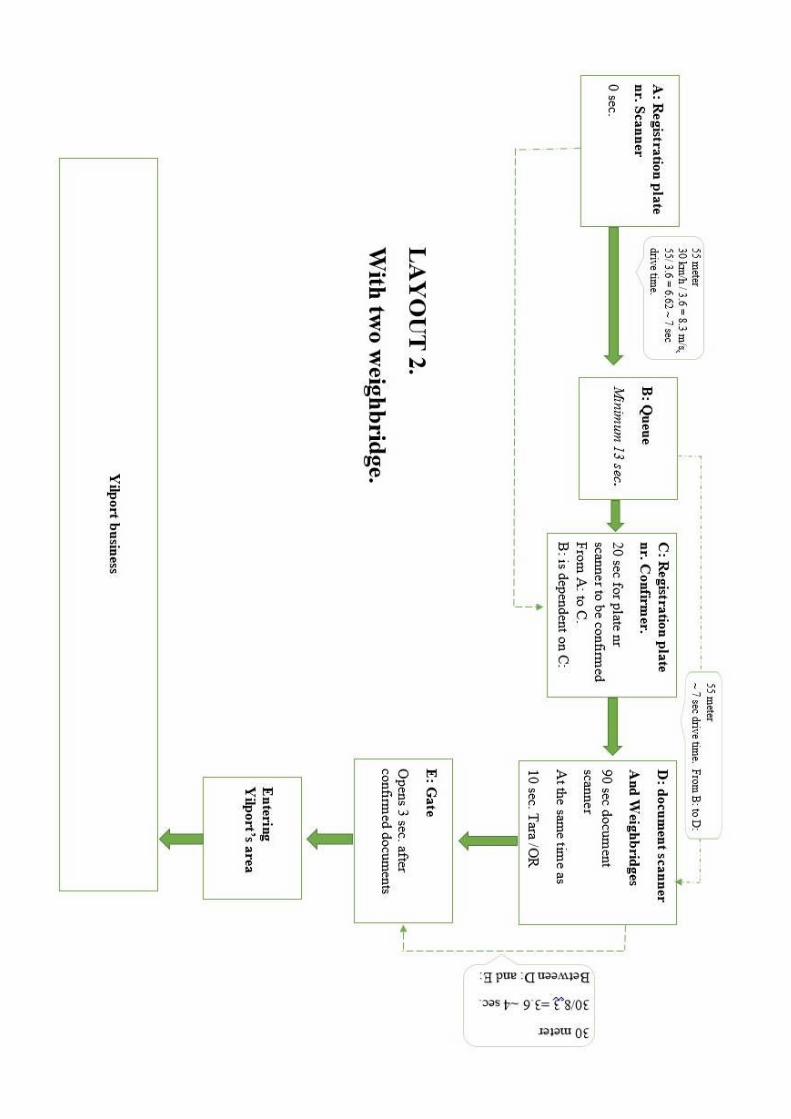
69

70
Appendix 5- Layout one, without large arrows

71
Appendix 6- Layout two, without large arrows
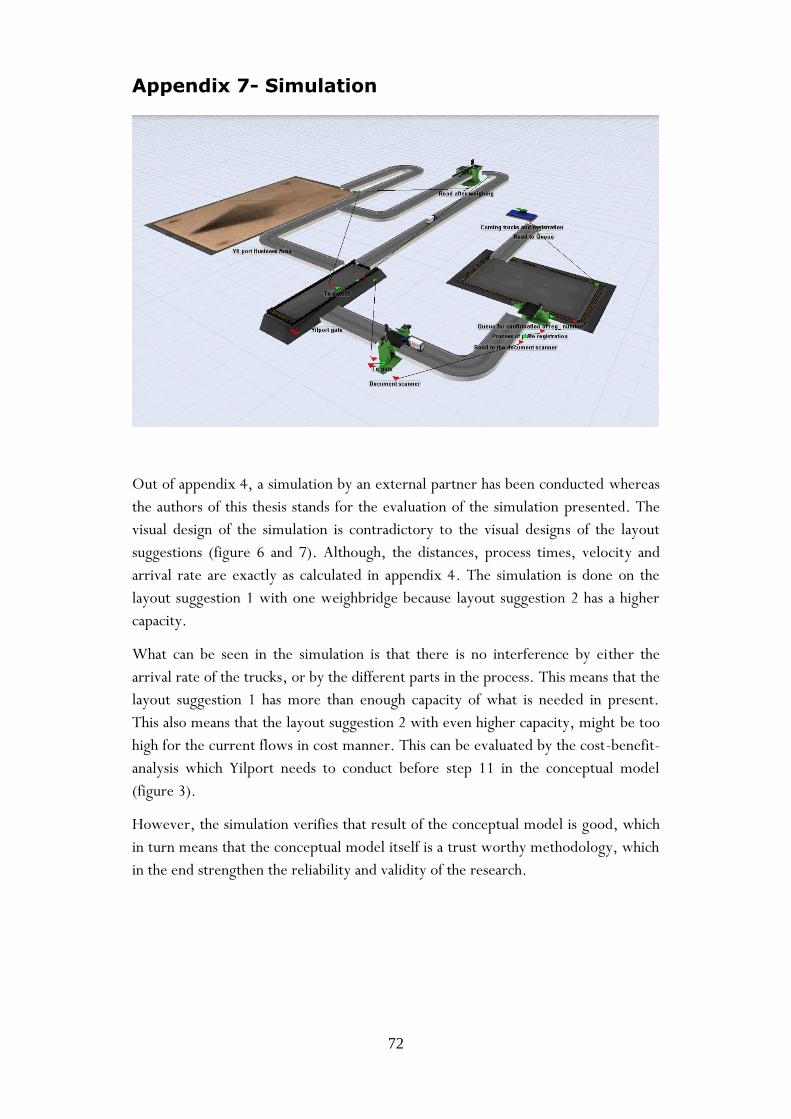
72
Appendix 7- Simulation
Out of appendix 4, a simulation by an external partner has been conducted whereas
the authors of this thesis stands for the evaluation of the simulation presented. The
visual design of the simulation is contradictory to the visual designs of the layout
suggestions (figure 6 and 7). Although, the distances, process times, velocity and
arrival rate are exactly as calculated in appendix 4. The simulation is done on the
layout suggestion 1 with one weighbridge because layout suggestion 2 has a higher
capacity.
What can be seen in the simulation is that there is no interference by either the
arrival rate of the trucks, or by the different parts in the process. This means that the
layout suggestion 1 has more than enough capacity of what is needed in present.
This also means that the layout suggestion 2 with even higher capacity, might be too
high for the current flows in cost manner. This can be evaluated by the cost-benefit-
analysis which Yilport needs to conduct before step 11 in the conceptual model
(figure 3).
However, the simulation verifies that result of the conceptual model is good, which
in turn means that the conceptual model itself is a trust worthy methodology, which
in the end strengthen the reliability and validity of the research.