Embed Size (px)
Citation preview

Dairy products factory-AlTafilah Governorate
1
A Pre-feasibility Study for the Establishment of
a Dairy Products Factory
2017

Dairy products factory-AlTafilah Governorate
2
List of contacts
1. EXECUTIVE SUMMARY ............................................................................................. 7
KEY HIGHLIGHT OF JORDAN .................................................................................................................. 7
2. MATKET ANALYSIS ................................................................................................. 14
Project Description ..................................................................................................................................... 14
Raw Materials Requirements .................................................................................................................. 14
Project Objectives ...................................................................................................................................... 15
Proposed Products ..................................................................................................................................... 15
Target segments .......................................................................................................................................... 15
Market Size Analysis .................................................................................................................................. 15
Competitors Analysis ................................................................................................................................. 16
Price Analysis and Pricing Policy ............................................................................................................ 16
Market Share ............................................................................................................................................... 17
Projected Revenues ................................................................................................................................... 18
3. TECHNICAL ANALYSIS ............................................................................................ 19
Required Human Resources .................................................................................................................... 19
SitA analysis ................................................................................................................................................. 22
Departments of the Factory ..................................................................................................................... 22
Technical Requirements Analysis ........................................................................................................... 23
1.1.1 Land and construction ............................................................................................................... 23
Machinery and Equipment ...................................................................................................................... 24
Vehicles and Transportation .................................................................................................................... 24
4. FINANCIAL ANALYSIS ............................................................................................. 25
Assumptions ................................................................................................................................................ 26
Capital Expenditures .................................................................................................................................. 28
Operating Expenses ................................................................................................................................... 32
General and Administrative Expenses ................................................................................................... 33
Marketing Expenses ................................................................................................................................... 33
Human Resources ...................................................................................................................................... 33

Dairy products factory-AlTafilah Governorate
3
Depreciations .............................................................................................................................................. 35
Loan ............................................................................................................................................................... 36
Income Statement ...................................................................................................................................... 36
Expected Cashflows Statement ............................................................................................................... 38
Expected Balance Sheet ............................................................................................................................ 39
Feasibility Indicators .................................................................................................................................. 41
Sensitivity Analysis ..................................................................................................................................... 42

Dairy products factory-AlTafilah Governorate
4
List of tables
Table 1 economical indicators .............................................................................................................................. 7
Table 2 Population Distribution according to Age Group ............................................................................. 9
Table 3 Income Tax and Exemptions ............................................................................................................... 14
Table 4 raw material required ........................................................................................................................... 14
Table 5 the proposed products ......................................................................................................................... 15
Table 6 rate of Imports and exports of dairy 2011-2015 ............................................................................ 16
Table 7Factory product prices compared with the markets (JD) ............................................................... 17
Table 8 average annual consumption per capita of dairy ........................................................................... 17
Table 9 projected revenues ................................................................................................................................ 18
Table 10 Analysis of the productive capacity of the plant .......................................................................... 19
Table 11 the required labor for the project ..................................................................................................... 19
Table 12 the required land for the project ...................................................................................................... 23
Table 13 Required Construction Work ............................................................................................................ 24
Table 14 Machinery and Equipment ................................................................................................................ 24
Table 15 Required Vehicles and Trasportation ............................................................................................. 24
Table 16 General Assumptions .......................................................................................................................... 26
Table 17 Annual Growth Rates Assumptions ................................................................................................ 26
Table 18 Expenses Assumptions ....................................................................................................................... 26
Table 19 Income Tax Assumptions ................................................................................................................... 27
Table 20 Weighted Average Cost of Capital ................................................................................................... 27
Table 21 Land Capital Expenditure................................................................................................................... 28
Table 22Construction Work Capital Expenditure ......................................................................................... 28
Table 23 machinery and equipments Work Capital Expenditure ............................................................. 29
Table 24 Transporation and Vehicles Capex .................................................................................................. 29
Table 25 Pre Operating Expenses ..................................................................................................................... 29
Table 26 Working Capital ................................................................................................................................... 30
Table 27 Expenses Summary ............................................................................................................................. 30
Table 28 Sources of Funding .............................................................................................................................. 30
Table 29 Operating Expenses ............................................................................................................................ 32
Table 30 General and Administrative Expenses ............................................................................................ 33
Table 31 Marketing Expenses ............................................................................................................................ 33

Dairy products factory-AlTafilah Governorate
5
Table 32 Expected Annual Salaries and Wages (2027-2018) .................................................................... 34
Table 33 Capex and Depreciation Expenses .................................................................................................. 35
Table 34 Depreciations and Additions on Construction Works ................................................................ 35
Table 35 Loan Details .......................................................................................................................................... 36
Table 36 Income Statement ................................................................................................................................ 37
Table 37 Expected Cashflows ............................................................................................................................ 38
Table 38 Expected Balance Sheet ...................................................................................................................... 40
Table 39 Free Net Cash flows Table ................................................................................................................. 41
Table 40 Payback Period ..................................................................................................................................... 42
Table 41 Financial Analysis Results .................................................................................................................. 42
Table 42 Sensitivity Analysis .............................................................................................................................. 43

Dairy products factory-AlTafilah Governorate
6
List of shapes
Figure 1 Population of Jordan .............................................................................................................................. 8
Figure 2 Sectors Contibution to Jordan’s Economy ...................................................................................... 10

Dairy products factory-AlTafilah Governorate
7
1. Executive Summary
The project aims to establish a factory for the manufacturing of milk and dairy products in AlTafilah
governorate, and this project is a unique project on the scale of the governorate especially as it
suffers from a shortage of those products.
The project, if established, will raise the level of the industrial sector in the governorate and
encourage investment in it. Based on the proposed market share and the prices that we will be
presenting later in detail, which were presented by the proposed project, the expected revenues
amounted to 3,246,336 JD during the first year of the project and gradually increase to 5,140,032
JD during the tenth year. The period of capital recovery is 5 years with an internal rate of return
equal to 26.13%, in addition to providing 35 jobs.
The following table shows the financial indicators of the project:
Table 1 economical indicators
Value Indicator
212,21,,2 Total Investment Cost (Jordan Dinars)
21.,2% Internal Rate of Return (IRR)
2 Pay-Back Period (Years)
21,,71122 Net Present Value (Jordan Dinars)
22 jobs opportunities that provided by the project
,,1,2,12,, Expectations annual revenue (for 10 years)
2,1,2212,, Total operating costs (for 10 years)
21,,,172, Gross profit (for 10 years)
Key Highlight of Jordan
Jordan Hashemite Kingdom area is 89342 Kilometers with a population exceed 9.8 Millions
distributed among 12 Governorates.
Jordan is bounded by Saudi Arabia, Iraq, Syria and Palestine from the South, East, North and west
respectively. Jordan climate is mostly arid desert with rainy season between November to April
Months.
Dairy products factory-AlTafilah Governorate
8
Jordan is a free market economy, ranked as the fifth freest economy in the MENA region in the
Index of Economic Freedom. Its free market economy enjoys strong partnerships amongst its
neighboring country as well as Europe and the USA. Jordan is a signatory of several bilateral and
multilateral trade agreements such as (Free Trade Agreement with the US and the EU, a Free Trade
Agreement with the EFTA states, an FTA with Singapore, A member of the Greater Arab Free Trade
Agreement (GAFTA) and a signatory of the Aghadir Agreement. Looking at the range of countries
these agreements cover and facilitate trade between, one is confident to say that Jordan has
business gateways and partnerships across the globe.
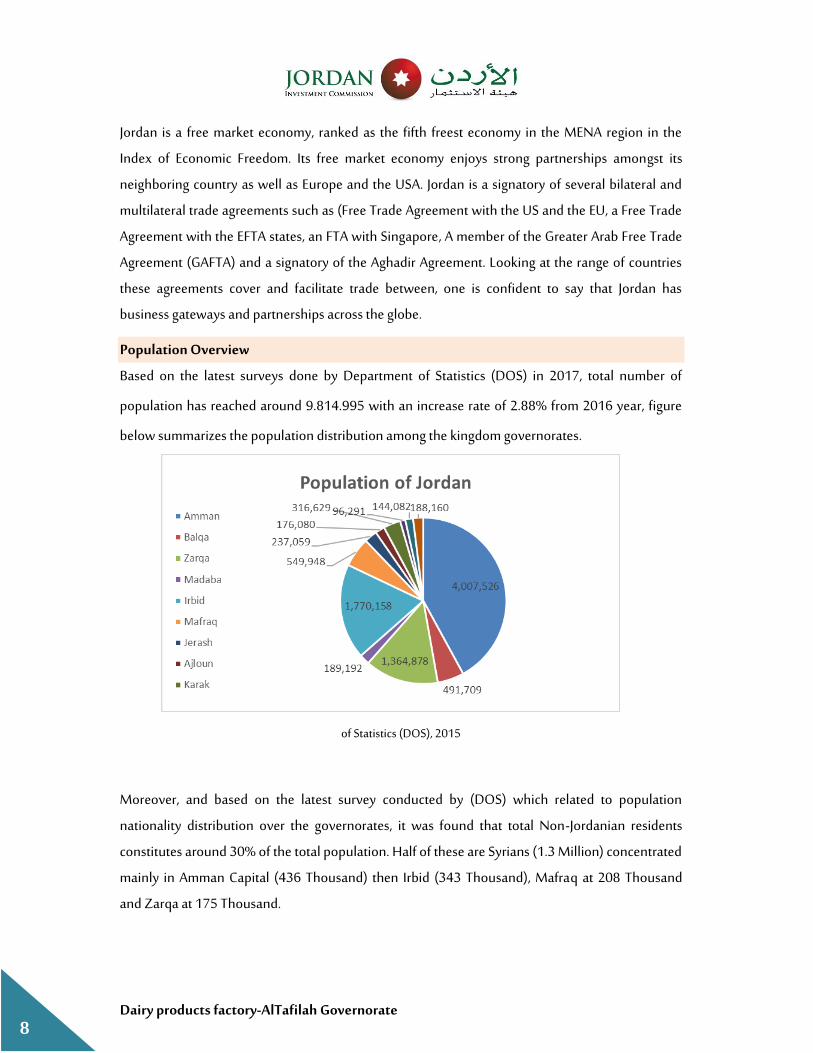
Population Overview
Based on the latest surveys done by Department of Statistics (DOS) in 2017, total number of
population has reached around 9.814.995 with an increase rate of 2.88% from 2016 year, figure
below summarizes the population distribution among the kingdom governorates.
Figure 1 Population of Jordan
of Statistics (DOS), 2015
Moreover, and based on the latest survey conducted by (DOS) which related to population
nationality distribution over the governorates, it was found that total Non-Jordanian residents
constitutes around 30% of the total population. Half of these are Syrians (1.3 Million) concentrated
mainly in Amman Capital (436 Thousand) then Irbid (343 Thousand), Mafraq at 208 Thousand
and Zarqa at 175 Thousand.
Dairy products factory-AlTafilah Governorate
9
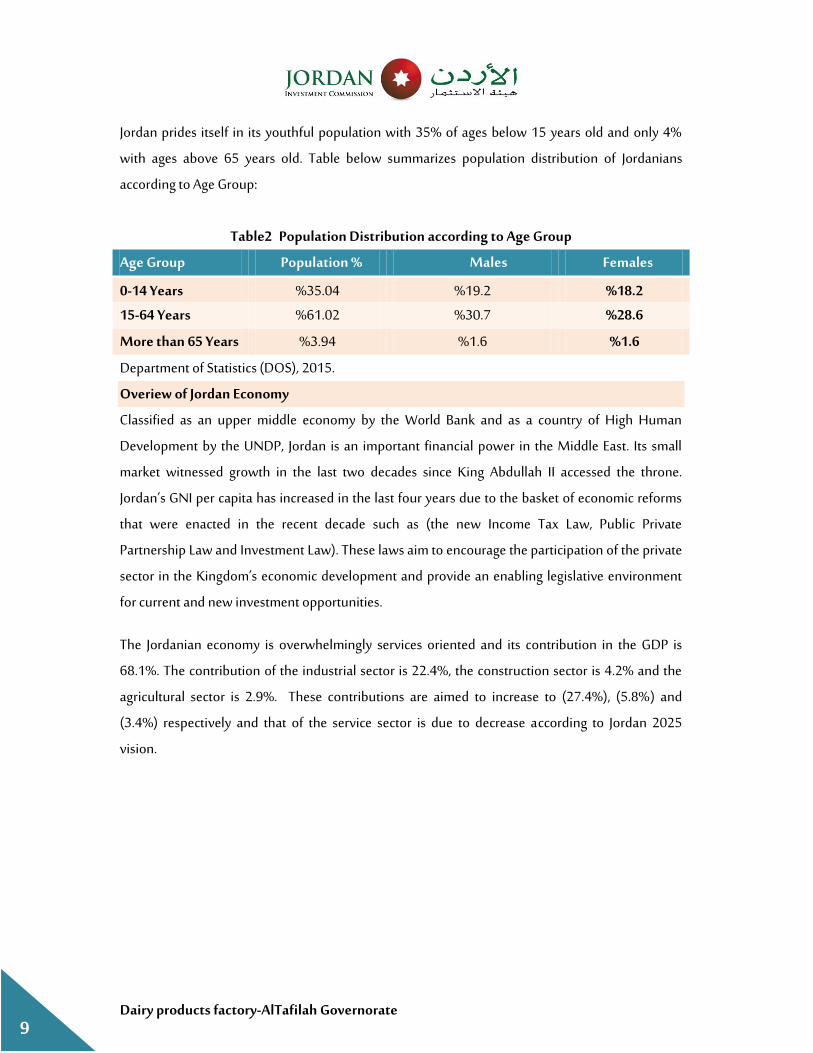
Jordan prides itself in its youthful population with 35% of ages below 15 years old and only 4%
with ages above 65 years old. Table below summarizes population distribution of Jordanians
according to Age Group:
Table 2 Population Distribution according to Age Group
Females Males Population % Age Group
%18.2 %19.2 %35.04 0-14 Years
%28.6 %30.7 %61.02 15-64 Years
%1.6 %1.6 %3.94 More than 65 Years
Department of Statistics (DOS), 2015.
Overiew of Jordan Economy
Classified as an upper middle economy by the World Bank and as a country of High Human
Development by the UNDP, Jordan is an important financial power in the Middle East. Its small
market witnessed growth in the last two decades since King Abdullah II accessed the throne.
Jordan’s GNI per capita has increased in the last four years due to the basket of economic reforms
that were enacted in the recent decade such as (the new Income Tax Law, Public Private
Partnership Law and Investment Law). These laws aim to encourage the participation of the private
sector in the Kingdom’s economic development and provide an enabling legislative environment
for current and new investment opportunities.
The Jordanian economy is overwhelmingly services oriented and its contribution in the GDP is
68.1%. The contribution of the industrial sector is 22.4%, the construction sector is 4.2% and the
agricultural sector is 2.9%. These contributions are aimed to increase to (27.4%), (5.8%) and
(3.4%) respectively and that of the service sector is due to decrease according to Jordan 2025
vision.

Dairy products factory-AlTafilah Governorate
10
70%
23%
4% 3%
Service sector
Indusrty sector
construction sector
Agriculture sector
Figure 2 Sectors Contibution to Jordan’s Economy
Jordan’s exports include variety of textiles, potassium, phosphates, fertilizers, vegetables and
pharmaceutical products. While it’s main imports are crude and refined petroleum. Distinguished
by its strategic location, on the crossroads between Asia, Africa and Europe with strong connections
to the Levant and the GCC, Jordan has a regional market of interest that represents US$3.8 trillion
market and compromising 380 million consumers.
Jordan infrastructure ranks comparatively well (38th out of 148 comparable economies), with an
extensive 8000 KM road network connecting Jordan domestically and externally The new Queen
Alia International Airport and the Port of Aqaba are the major gateways to the international market.
In addition to some mega projects such as the Red- Dead Sea Canal and the national railway
network that will be developed to position Jordan as a hub for regional commerce.
Jordan banking system is quite sophisticated, resilient and in compliance with international
standards, making it very attractive and trustworthy to investors. This is reflected in the fact that
50% of equity in licensed banks in Jordan is held by non-Jordanians, and non residents’ deposits in
Jordanian banks witnessed a steady growth of 19.2%.
Moreover, realizing the value of MSMEs to drive economic growth, the government has developed
the national Strategy for the encouragement of entrepreneurship and the development of micro
small and medium sized enterprises for 2015-2019. This shows the commitment of the Jordan

Dairy products factory-AlTafilah Governorate
11
government to enhance the private sector development and leveraging the country’s strong human
capital.
Jordan prides itself in its youthful population. It’s the country most valuable capital. A tech savvy
well educated and trained workforce attracts a lot of investors to Jordan. More than 20.4% of
Jordan’s GDP is dedicated to the education and capacity building for the labor force, this has
resulted in securing a 91% literacy rate and enabled Jordanians to be among most hired and
qualified middle-eastern workforce.
Such solid, diverse and resilient characteristics of the Jordanian economy and investment scene
position Jordan as a competitive investment destination.
Major Economic Indicators
GDP Growth
The Jordanian economy slowed and reached 2.4 percent in 2015 compared to growth rate of 3.1 in
2014 and similar to MENA growth rates.
The growth also slowed for trade, restaurants and hotels; manufacturing; transport; and electricity
and water. Meanwhile, finance, insurance, and business services advanced at a faster pace.
Inflation rate
Inflation rate decreased to 0.9 in 2015 after 2% decline in the previous year. Inflation Rate in Jordan averaged 3.1 percent from 2011 until 2015.
Unemployment
The unemployment rate in Jordan was recorded at 13 percent in 2015, comparing to 11.9 percent a year earlier. This increase due to the current instability in the labor market structure as well as high competition from low cost foreign labors especially from Syria.
External Sector
A number of risks manifested in 2015, the closure of land trade routes with Syria and Iraq and the
deepening instability in the region adversely impacted many external sector indicators such as
trade, tourism and direct Investment.

Dairy products factory-AlTafilah Governorate
12
Moreover, loans disbursements increased by JD 545.3 million, due to the use of the International
and Arab Monetary Funds (IMF and AMF) credit facilities. As an outcome of these developments,
the overall balance of the balance of payments registered a surplus of JD 328.7 million in 2015,
compared with a surplus of JD 1,550.7 million in 2014.
Further, net international investment position (IIP) witnessed an increase in the Kingdom’s net
obligations to abroad; to reach JD 24,357.5 million, compared to a net obligation of JD 22,578.8
million at the end of 2014 as a result of the increase in the stock of external financial assets and
liabilities of all resident economic sectors to reach JD 18,657.9 million and JD 43,015.5 million;
respectively.
External Debt in Jordan increased to 9390.50 JOD Million in 2015 from 8030.10 JOD Million in
2014. External Debt in Jordan averaged 5433.67 JOD Million from 1988 until 2015, reaching an all
time high of 9390.50 JOD Million in 2015 and a record low of 3640.20 JOD Million in 2008.
Investment Climate in Jordan
Investment in Jordan is considered as one of the vital sources to boost the economy considering
that Jordan's economy is among the smallest in the Middle East, with insufficient supplies of water,
oil, and other natural resources, underlying the government's heavy reliance on foreign assistance.
The country’s location, supported by myriad free trade agreements (FTAs) offering access to 1.5bn
consumers, enables the kingdom to be a strategic trade route to many of its neighboring countries
and regions.
Jordan aspires to create a competitive investment destination capitalizing on its many advantages
mentioned above. The government focused its efforts to implement significant advances in
structural and legal reform. These efforts are represented in the new Investment Law of 2014, the
tax law, in addition to other endeavors related to providing greater access to credit for MSMEs, and
by providing greater investment incentives to specific priority sectors identified by the new
Investment law and the Jordan 2025 vision.
Furthermore, in it endeavor to enhance the business environment, several geographically industrial
states were created across the kingdom. These range in type to include (industrial estates, free
zones and special economic zones). Under the new Investment Law, these zones are given a
number of incentives that include a tax rate of 0% on exports, sales tax, import duties, social service
tax, dividends tax and a 5% income tax from all economic and manufacturing activities undertaken
in the development zones. As for the investments in Free Zones, they enjoy Exemptions from
Dairy products factory-AlTafilah Governorate
13
customs duties, income tax exemptions and exemptions from land and building taxes among
others. Both development and free zones also enjoy facilitations regarding visa and residency
permits for investors and workers in addition to Repatriation of capital and profits in a convertible
currency. Such estates have succeeded in attracting relatively large amounts of FDI to Jordan.
Key National Invesment Priorities:
Jordan Investment commission worked on taking a leading role in the application of government
policies to promote and attract domestic and foreign investments and create an investment
environment that stimulates economic performance through investment promotion strategy
launched in 2016
Jordan investment commission aims to:
Regulating the special provisions governing Development Zones and Free Zones in the
Kingdom and developing them placing them in service of the national economy as well as
monitoring their functioning.
Developing plan and programs to stimulate domestic and foreign investments.
Establishing trade centers and organizing exhibitions as well as opening markets and
organizing trade missions in order to promote national products, in addition to marketing
and development of national exports and encouraging investment.
Taking appropriate decisions related to private or public institutions to improve Investors’
confidence in Jordan’s investment environment.
Investment Climate in Al-Tafielh:
Under the provisions of fifth article of the investment law No. 30 of 2014 and Income tax
regulations in the less developed areas, the reduction of the income tax system on the investment
projects are clarified in the table below:

Dairy products factory-AlTafilah Governorate
14
Table 3 Income Tax and Exemptions
Less Developed Areas Within the Development Zone or Free Zone
Income Tax is 20%
As per Investment Law categorization, Irbid
is classified in Class (B) where investors
enjoys 80% exemption on Income tax for 20
years, where net income tax after reduction
should not be less than 5%.
Income Tax is 5%
2. Matket analysis
Project Description
The project aims to establish a plant in AlTafilah governorate to produce milk and dairy products.
The idea of establishing the project is considered a good idea especially, when such products are
widely sold in markets and supermarkets because of their nutritional benefits and are
recommended for adults and young people and can be easily marketed.
The production capacity of the plant is estimated to be about 800 tons / year of fresh pasteurized
milk used for manufacturing various dairy products such as: milk, yogurt, white cheese, Labaneh
and Jameed.
Raw Materials Requirements
The required raw materials are summarized in the table below:
Table 4 raw material required
Cost (JD) Measuring unit Raw materials
,.27 L Fresh raw milk 0.36 Kg Sugar
,.17 Kg Salt
,.13 G Rennet
0.51 Kg Calcium chloride
10.68 Kg Stabilizers
2,.2 Kg Allowed artificial colors
,7.,, 1000 package Plastic containers
,,.,, 100, cover Aluminum covers
,,, 1000 one liter package Cartoon paper
22.,, bags 1000 Plastic bags
,.2, box Plastic boxes
Dairy products factory-AlTafilah Governorate
15
Project Objectives
The objectives of the project are summarized as follows:
• Encouraging investment in the industrial sector in the governorate.
• Supplying the local market with essential dairy products.
• Providing job opportunities and improving the living and social standards of the workers in the
project.
• Achieving financial return for the owners.
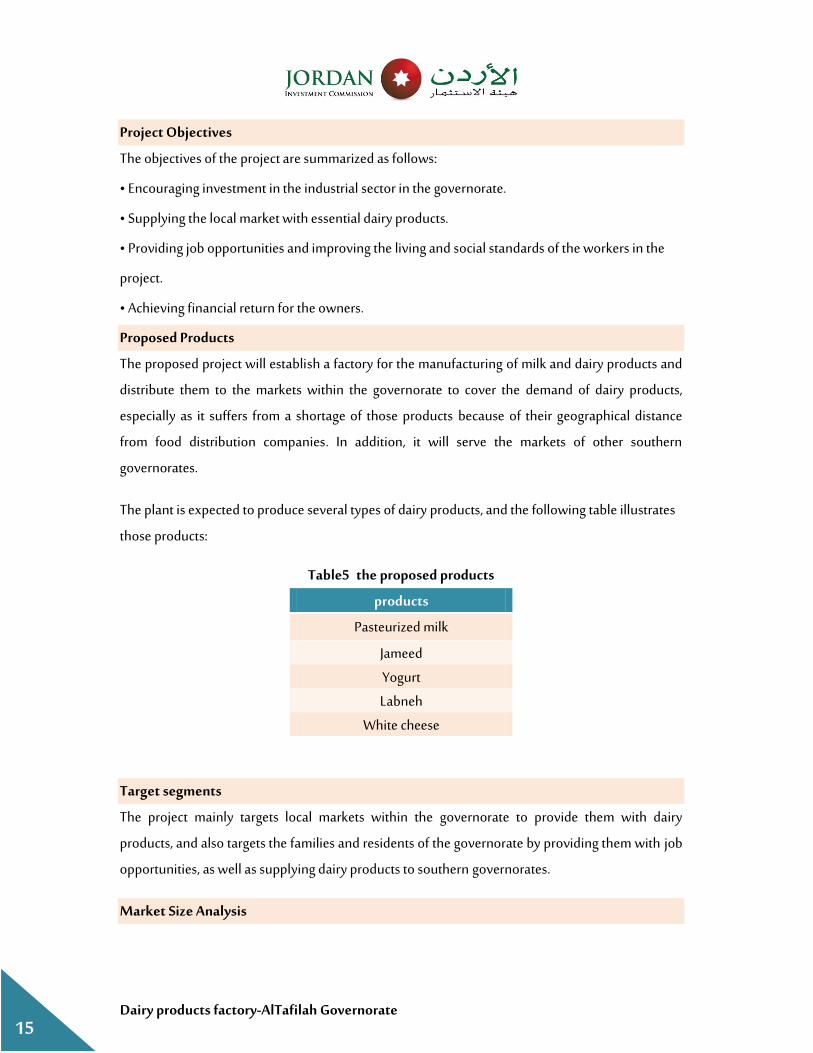
Proposed Products
The proposed project will establish a factory for the manufacturing of milk and dairy products and
distribute them to the markets within the governorate to cover the demand of dairy products,
especially as it suffers from a shortage of those products because of their geographical distance
from food distribution companies. In addition, it will serve the markets of other southern
governorates.
The plant is expected to produce several types of dairy products, and the following table illustrates
those products:
Table 5 the proposed products
products
Pasteurized milk
Jameed
Yogurt
Labneh
White cheese
Target segments
The project mainly targets local markets within the governorate to provide them with dairy
products, and also targets the families and residents of the governorate by providing them with job
opportunities, as well as supplying dairy products to southern governorates.
Market Size Analysis
Dairy products factory-AlTafilah Governorate
16
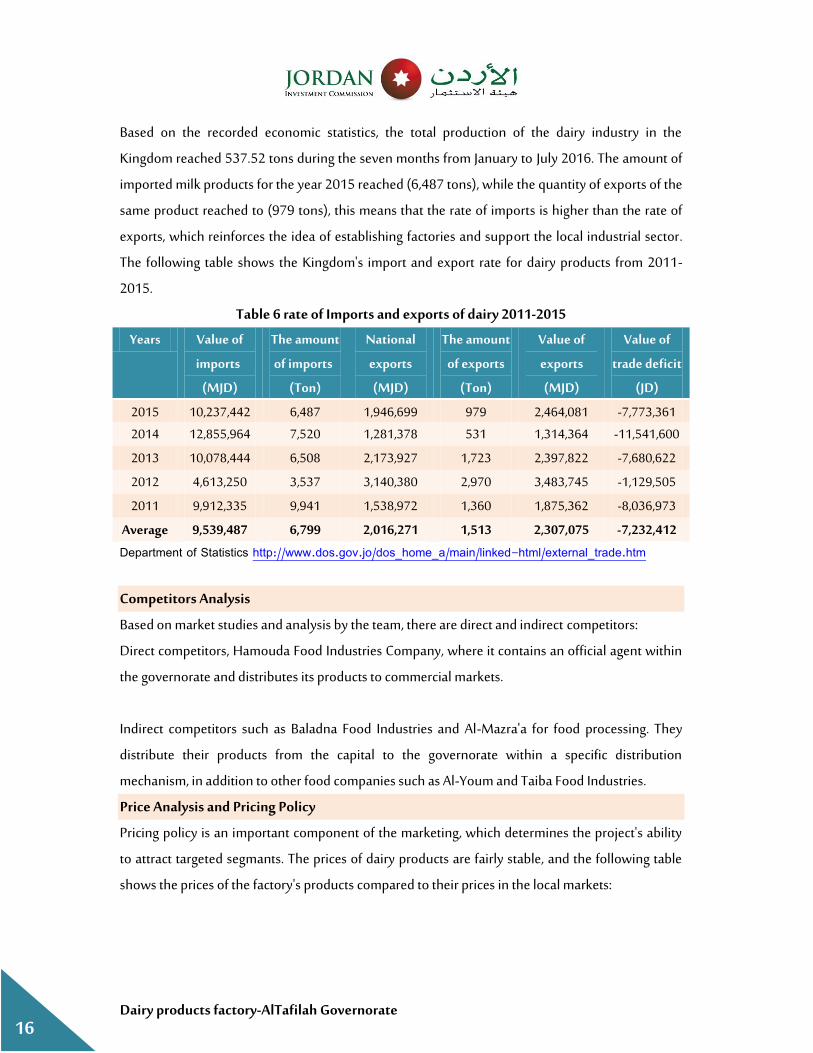
Based on the recorded economic statistics, the total production of the dairy industry in the
Kingdom reached 537.52 tons during the seven months from January to July 2016. The amount of
imported milk products for the year 2015 reached (6,487 tons), while the quantity of exports of the
same product reached to (979 tons), this means that the rate of imports is higher than the rate of
exports, which reinforces the idea of establishing factories and support the local industrial sector.
The following table shows the Kingdom's import and export rate for dairy products from 2011-
2015.
Table 6 rate of Imports and exports of dairy 2011-2015
Years Value of
imports
(MJD)
The amount
of imports
(Ton)
National
exports
(MJD)
The amount
of exports
(Ton)
Value of
exports
(MJD)
Value of
trade deficit
(JD)
2,,2 ,,12271,,2 11,27 1,946,699 ,7, 2,464,081 -7,773,361
-7,773,361
-7,773,361
2,,, 12,855,964
12,855,964
7122, 1,281,378 22, 1,314,364 -11,541,600
2013 10,078,444 112,2 2,173,927 ,1722 2,397,822 -7,680,622
2,,2 4,613,250 21227 3,140,380 21,7, 3,483,745 -1,129,505
2,,, 9,912,335 ,1,,, 1,538,972 ,121, 1,875,362 -8,036,973
Average 9353934,9 93999 232193291 13513 233293295 932323412-
Department of Statistics http://www.dos.gov.jo/dos_home_a/main/linked-html/external_trade.htm
Competitors Analysis
Based on market studies and analysis by the team, there are direct and indirect competitors:
Direct competitors, Hamouda Food Industries Company, where it contains an official agent within
the governorate and distributes its products to commercial markets.
Indirect competitors such as Baladna Food Industries and Al-Mazra'a for food processing. They
distribute their products from the capital to the governorate within a specific distribution
mechanism, in addition to other food companies such as Al-Youm and Taiba Food Industries.
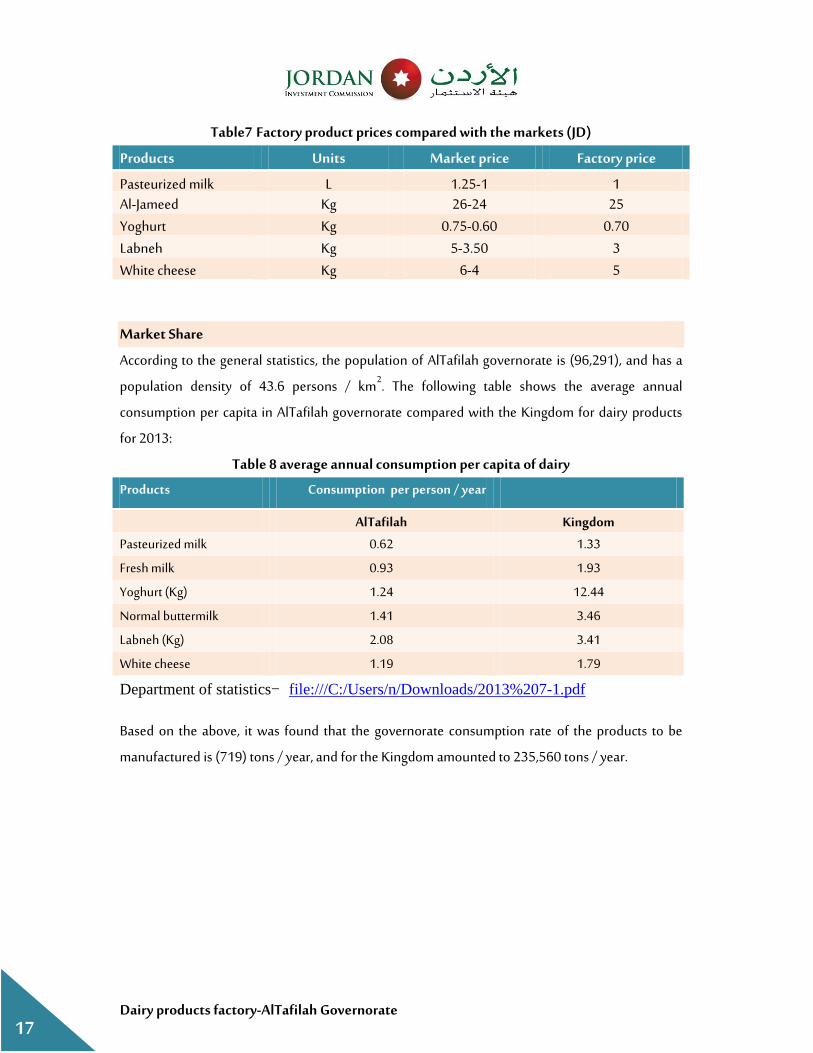
Price Analysis and Pricing Policy
Pricing policy is an important component of the marketing, which determines the project's ability
to attract targeted segmants. The prices of dairy products are fairly stable, and the following table
shows the prices of the factory's products compared to their prices in the local markets:
Dairy products factory-AlTafilah Governorate
17
Table 9 Factory product prices compared with the markets (JD)
Products Units Market price Factory price
Pasteurized milk L ,-,.22 , Al-Jameed Kg 2,-21 22 Yoghurt Kg ,.1,-,.72 ,.7, Labneh Kg 2.2,-2 2 White cheese Kg ,-1 2
Market Share
According to the general statistics, the population of AlTafilah governorate is (96,291), and has a
population density of 43.6 persons / km2. The following table shows the average annual
consumption per capita in AlTafilah governorate compared with the Kingdom for dairy products
for 2013:
Table 8 average annual consumption per capita of dairy
Products Consumption per person / year
AlTafilah Kingdom
Pasteurized milk ,.12 ,.22
Fresh milk ,.,2 ,.,2
Yoghurt (Kg) ,.2, ,2.,,
Normal buttermilk ,.,, 2.,1
Labneh (Kg) 2.,2 2.,,
White cheese ,.,, ,.7,
Department of statistics - file:///C:/Users/n/Downloads/2013%207-1.pdf
Based on the above, it was found that the governorate consumption rate of the products to be
manufactured is (719) tons / year, and for the Kingdom amounted to 235,560 tons / year.
Dairy products factory-AlTafilah Governorate
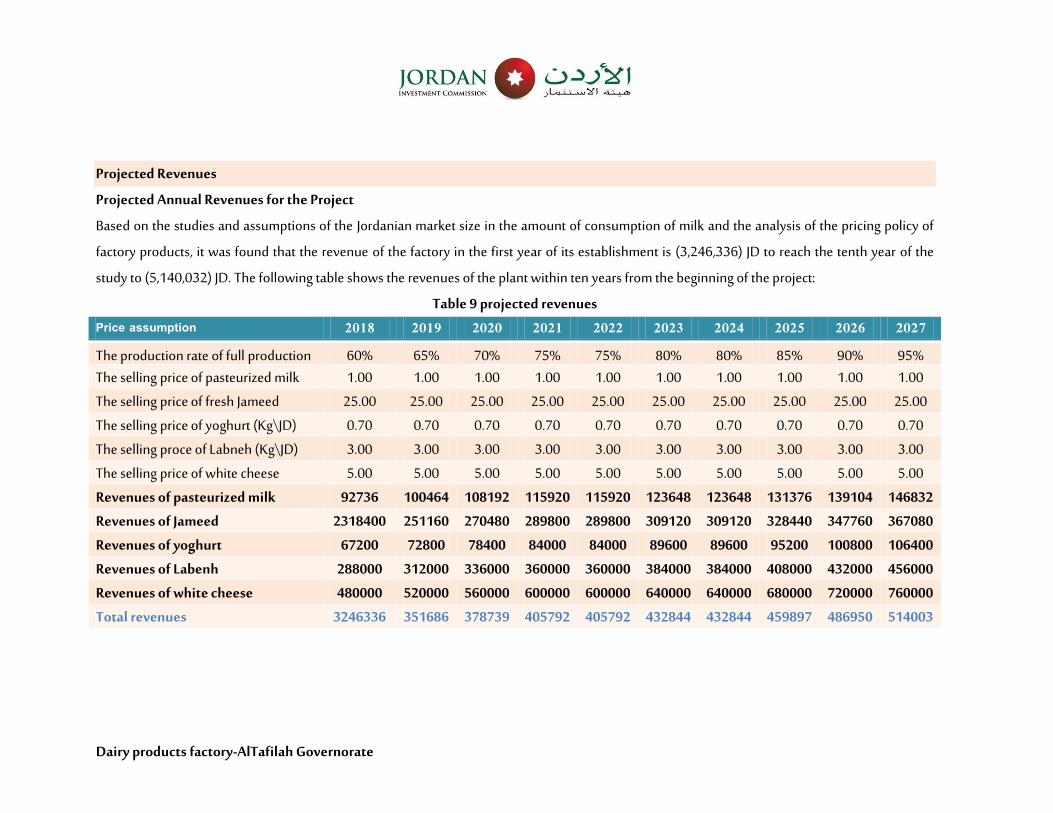
Projected Revenues
Projected Annual Revenues for the Project
Based on the studies and assumptions of the Jordanian market size in the amount of consumption of milk and the analysis of the pricing policy of
factory products, it was found that the revenue of the factory in the first year of its establishment is (3,246,336) JD to reach the tenth year of the
study to (5,140,032) JD. The following table shows the revenues of the plant within ten years from the beginning of the project:
Table 9 projected revenues
Price assumption 2018 2019 2020 2021 2022 2023 2024 2025 2026 2027
The production rate of full production
capacity
60% 65% 70% 75% 75% 80% 80% 85% 90% 95% The selling price of pasteurized milk
(L\JD)
1.00 1.00 1.00 1.00 1.00 1.00 1.00 1.00 1.00 1.00
The selling price of fresh Jameed
(Kg\JD)
25.00 25.00 25.00 25.00 25.00 25.00 25.00 25.00 25.00 25.00
The selling price of yoghurt (Kg\JD) 0.70 0.70 0.70 0.70 0.70 0.70 0.70 0.70 0.70 0.70
The selling proce of Labneh (Kg\JD) 3.00 3.00 3.00 3.00 3.00 3.00 3.00 3.00 3.00 3.00
The selling price of white cheese
(Kg\JD)
5.00 5.00 5.00 5.00 5.00 5.00 5.00 5.00 5.00 5.00
Revenues of pasteurized milk 92736 100464 108192 115920 115920 123648 123648 131376 139104 146832
Revenues of Jameed 2318400 251160
0
270480
0
289800
0
289800
0
309120
0
309120
0
328440
0
347760
0
367080
0 Revenues of yoghurt 67200 72800 78400 84000 84000 89600 89600 95200 100800 106400
Revenues of Labenh 288000 312000 336000 360000 360000 384000 384000 408000 432000 456000
Revenues of white cheese 480000 520000 560000 600000 600000 640000 640000 680000 720000 760000
Total revenues 3246336 351686
4
378739
2
405792
0
405792
0
432844
8
432844
8
459897
6
486950
4
514003
2

Dairy products factory-AlTafilah Governorate
19
The following table shows the analysis of the production capacity of the plant, where the total
capacity was imposed about (800) tons / year, and the proportion of each product is 20% of the
total production capacity.
Table 12 Analysis of the productive capacity of the plant
Production capacity
Annual production capacity (Kg) 800000
Production rate of pasteurized milk 20%
Production rate of Jameed 20%
Production rate of yoghurt 20%
Production rate of Labaneh 20%
Production rate of white cheese 20%
The convert coefficient (kg to liter) 0.966
3. Technical Analysis
The study aims to develop the technical specifications of the project, based on the results of the
market study, in addition to evaluating and reviewing investment and operational costs. The
technical study of the project includes an explanation and a general description of the aspects of
the project along with its components, in addition to the constructional and operational
requirements of the project.
Required Human Resources
This project requires a factory manager who oversees all operational matters in the factory, as well
as a financial manager to develop financial management plans and regulations, an accountant who
manages the financial affairs of the factory, as well as production line technicians and cleaners to
keep all facilities clean.
Table 11 the required labor for the project
Job title No.
General Manager ,
Factory manager ,

Dairy products factory-AlTafilah Governorate
20
Job title No.
Financial Manager ,
Quality manager ,
Human resources manager ,
Quality auditors 2
Accountant 2
Secretaries ,
Human resources staff 2
Guard 2
Total of indirect staff 15
Production line technicians ,,
Logistics Manager ,
Logistics staff 2
Maintenance technicians 2
Driver 2
Total of direct staff 21
Total 35
Job Description:
General Manager: perform all the tasks and responsibilities of the general manager, and
active participation in the identification and formulation of objectives, as well as planning
and organizing workflow facility to ensure the achievement of specific objectives.
Factory manager: Is working solo and within his authority, while his hiring by the person
who owns the project. Also is propose policies and action plans and to represent the
factory and workflow planning and management at the plant, following up the
implementation of plans and programmes in accordance with determined policies and
objectives of the plant optimally to achieve the interests of employers, and overseeing the
management of administrative and financial affairs in accordance with prescribed
instructions in this regard, managing subordinates, develop their skills, develop procedures
and ensure occupational safety and health requirements.
Dairy products factory-AlTafilah Governorate
21
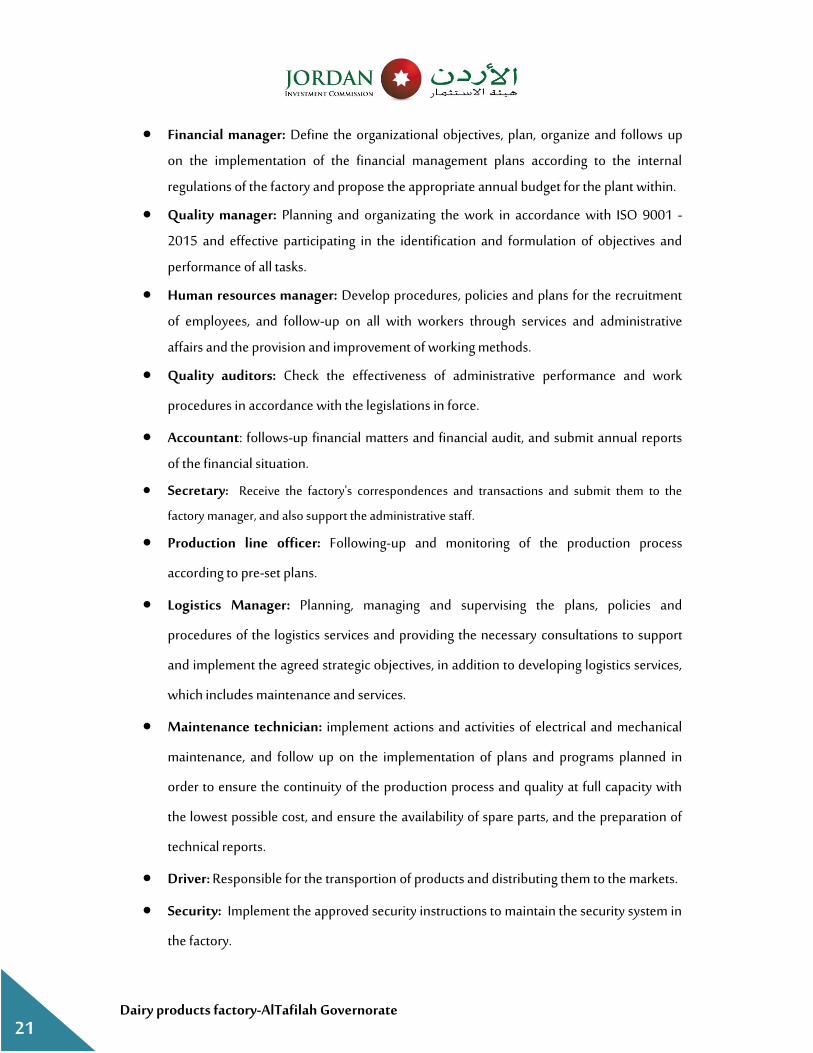
Financial manager: Define the organizational objectives, plan, organize and follows up
on the implementation of the financial management plans according to the internal
regulations of the factory and propose the appropriate annual budget for the plant within.
Quality manager: Planning and organizating the work in accordance with ISO 9001 -
2015 and effective participating in the identification and formulation of objectives and
performance of all tasks.
Human resources manager: Develop procedures, policies and plans for the recruitment
of employees, and follow-up on all with workers through services and administrative
affairs and the provision and improvement of working methods.
Quality auditors: Check the effectiveness of administrative performance and work
procedures in accordance with the legislations in force.
Accountant: follows-up financial matters and financial audit, and submit annual reports
of the financial situation.
Secretary: Receive the factory's correspondences and transactions and submit them to the
factory manager, and also support the administrative staff.
Production line officer: Following-up and monitoring of the production process
according to pre-set plans.
Logistics Manager: Planning, managing and supervising the plans, policies and
procedures of the logistics services and providing the necessary consultations to support
and implement the agreed strategic objectives, in addition to developing logistics services,
which includes maintenance and services.
Maintenance technician: implement actions and activities of electrical and mechanical
maintenance, and follow up on the implementation of plans and programs planned in
order to ensure the continuity of the production process and quality at full capacity with
the lowest possible cost, and ensure the availability of spare parts, and the preparation of
technical reports.
Driver: Responsible for the transportion of products and distributing them to the markets.
Security: Implement the approved security instructions to maintain the security system in
the factory.

Dairy products factory-AlTafilah Governorate
22
Site Analysis
It is proposed that the plant should be located on a land outside the organization on an area of
10,000 square meters and away from any source of microbial contamination, toxins or unpleasant
odors, such as the livestock market, oil refineries, open sewage or others, in addition to the
availability of water in appropriate quantities and quality If possible, with a possible disposal of
wastes. The following points should be considered:
Taking into account future expansion possibilities.
Isolate management sections and laboratories from producion sections, also should be in
separate buildings and production lines from each other with wide dividers
Placing the tanks of raw milk in a high place to avoid frequent pumping.
Building warehouses and stores at the level of the production lines to facilitate the entry of
materials and finished products.
Working conditions should be good within the factory, such as lighting, heating,
ventilation, cleaning and other.
Departments of the Factory
Dairy plant should consist of the following:
– Department of receiving raw milk: In this department, the acidity of the milk is
determined by which if the milk is accepted or rejected, milk is then weighted, refrigerated
and stored in large tanks until processing.
– Production Department: It is the largest department in the factory, consisting of several
production lines.
– Storage Department consists of two parts:
The First, consists of several large refrigerated rooms to store ready-made dairy
products after they are manufactured until they are marketed.
The second, consists of several non-refrigerated warehouses for storing auxiliary
materials in production, such as packaging materials from sterile milk bottles,
plastic or metal packaging, and other production requirements.

Dairy products factory-AlTafilah Governorate
23
– Laboratories: equipped with all the necessary equipment, tools and materials for checking
and evaluating raw milk, as well as finished products, their quality and their conformity
with the standard specifications of each product.
– Management and Marketing Department: includes the administrative offices, public
facilities, restaurants and bathrooms.
– Water treatment Department: In order to become usable in the plant, by following a
series of mechanical and chemical processes in the following order:
1. Sedimentation and filtration to dispose of organic matter related to water.
2. Remove the water shortage resulting from the presence of calcium carbonate, which
causes many problems, the most important of which is the deposition of calcareous
layer on the surface of the heating panels, which reduces thermal conductivity of
these panels, and the water shortage causes the increase in the amount of washing.
3. Sterilization of chlorinated water to eliminate pathogenic microorganisms.
The supply of hot water and steam necessary for manufacturing and washing operations, through a
complete heating circuit, which includes the boiler and its necessary accessories.
- Provision of cold water, necessary for dairy products cooling after being manufactured, or to cool
the milk in a full cooling cycle after sterilization.
Technical Requirements Analysis
1.1.1 Land and construction
The project will be constructed on an area of 10,000 m2. The following table shows the required
land:
Table 12 the required land for the project
Area sq.m
2م
Land
10,000 The required land
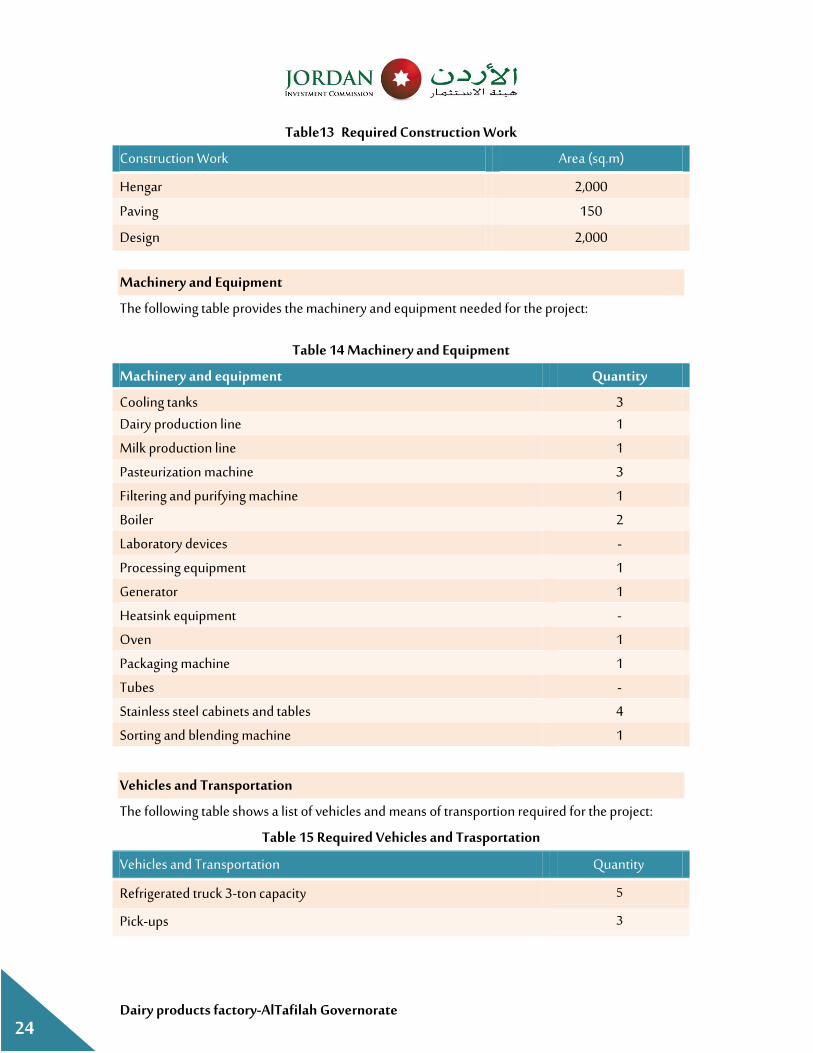
The required construction works for the project are represented as follows:
Dairy products factory-AlTafilah Governorate
24
Table 13 Required Construction Work
Construction Work Area (sq.m)
Hengar 21,,,
Paving ,2,
Design 21,,,
Machinery and Equipment
The following table provides the machinery and equipment needed for the project:
Table 14 Machinery and Equipment
Machinery and equipment Quantity
Cooling tanks 3 Dairy production line 1
Milk production line 1
Pasteurization machine 3
Filtering and purifying machine 1
Boiler 2
Laboratory devices -
Processing equipment 1
Generator 1
Heatsink equipment -
Oven 1
Packaging machine 1
Tubes -
Stainless steel cabinets and tables ,
Sorting and blending machine 1
Vehicles and Transportation
The following table shows a list of vehicles and means of transportion required for the project:
Table 15 Required Vehicles and Trasportation
Vehicles and Transportation Quantity
Refrigerated truck 3-ton capacity 5
Pick-ups 3

Dairy products factory-AlTafilah Governorate
25
4. Financial Analysis
The Financial Part illustrates all the assumptions which were used when we have developed the
study including project expenses related to capital expenditures, operating expenses ( Fixed and
Variable costs) followed by illustrating project revenues.
Assumptions
Calculation Assumptions:
The weighted average cost of capital used in the study is 12.26% as it was calculated
considering risk free and debt Interest rates as well as Market risk premiums to consider
alternative opportunity costs for investor.
Icome tax on the net project income is 5 % during the life time of the project.
Project working capital has been estimated and added to project cash outflows at the
beginning of the project and annual increase in working capital has been also estimated
and added to the operating expenses then net working capital has been added to total cash
inflows at the end of project lifetime.
The time span for the financial study is 10 years starting from 2018, where annual increase
rates have been estimated as per the tables below:

Dairy products factory-AlTafilah Governorate
26
Assumptions
Table 16 General Assumptions
General Information
All Financial Numbers (Currency) Jordan Dinars
Financial Study Time Span (Years)
0
,,
Expected Project First Operating Year 2,,2
Last Year in the Financial Study 2,27
Table 1 Currency Exchange Rates
Exchange Rates Jordan Dinars
American Dollar ,.7,2
Euro ,.71,
Table 17 Annual Growth Rates Assumptions
Annual Growth Rates Average
Annual Population Growth Rate 2.20%
Annual Sales Price Increase Rate 3.00%
Annual Expenses Increase Rate 3.00%
Annual Increase Rate in Employees Salaries 4.1% (, ) and (2) Source: Inflation Rates, Central Bank of Jordan
(3) Source: Social Security
Table 18 Expenses Assumptions
Expenses Assumptions
Raw Materials and Packaging from Total Revenues %2,
Utilities Expenses from Total Revenues %,,
Maintenance Expenses from Total Revenues %,
Depreciation Expenses from Total Revenues %,
Insurance Expenses from Total Assets Value %,.2
Marketing Expenses from Total Revenues %2

Dairy products factory-AlTafilah Governorate
27
Table 19 Income Tax Assumptions
Income Tax Assumptions Value
Average Income Tax in Jordan (,) %2,
Income Tax Deduction (2) %2,
Income Tax after Deduction 5%
Compulsary Reserve Percentage (2) 10%
Other Assumptions Value
Annual Monthly Salaries have been calculated after multiplying monthly salaries by: (,) 16
Risk Premuim
Risk Free Rate of Return (,) 6.50%
Return to Debt Maturity (2) 9.48%
Market Risk Premuim (2) 10.12%
Income Tax Rate 5%
Beta (,) 0.89
Growth Rate 4.00% (, ) Source :Damodaran's Country Default Spreads and Risk Premiums Report
(2 ) Source :Central Bank of Jordan
(2 ) Source :Damodaran's Country Default Spreads and Risk Premiums Report
(, ) Source :Damodoran Beta By Sector, , pages.stern.nyu.edu
Table 20 Weighted Average Cost of Capital
Weighted Average Cost of Capital
Average Return on Risk Free Investment 1.2,%
Return to Debt Maturity ,.,2%
Market Risk Premuim ,,.,2%
Income Tax Rate 2%
Bets ,.,,
Equity ,1,,,12,2
Loans Value ,12,712,2
Loans
Cost of Borrowing before Tax ,.,2%
Cost of Borrowing After Tax ,.,,%
Loans Value ,12,712,2

Dairy products factory-AlTafilah Governorate
28
Loans Percentage 1,%
Equity
Cost of Equity ,1.,%
Equity Value ,1,,,12,2
Equety Percentage ,,%
Gross
Project Value 212,21,,2
Weighted Average Cost of Capital ,2.,2%
Capital Expenditures
The estimated cost of the project is 2,512,005 JD and it covers land costs, construction works,
machinery and equipment, furniture, pre-operating expenses and working capital. The following
tables summarize the details of these expenses:
Table 21 Land Capital Expenditure
Land Cost (Jordan Dinar/Meters Square) Area (m2) Cost
إلاجمالية
/ دينار
أردني
Required Land 2 ,,1,,, 2,1,,,
Gross Cost 523222
Table 22Construction Work Capital Expenditure
Construction Works Cost (JOD per Squared
Meters)
Area
(Squared Meters)
Gross
Cost /
Jordan
Dinar
Hunger 100 21,,, 200,000
paving 12 ,2, 1,800
Design and blueprints 7 21,,, 14,000
Other Works 21,580
Total 237,380
Dairy products factory-AlTafilah Governorate
29
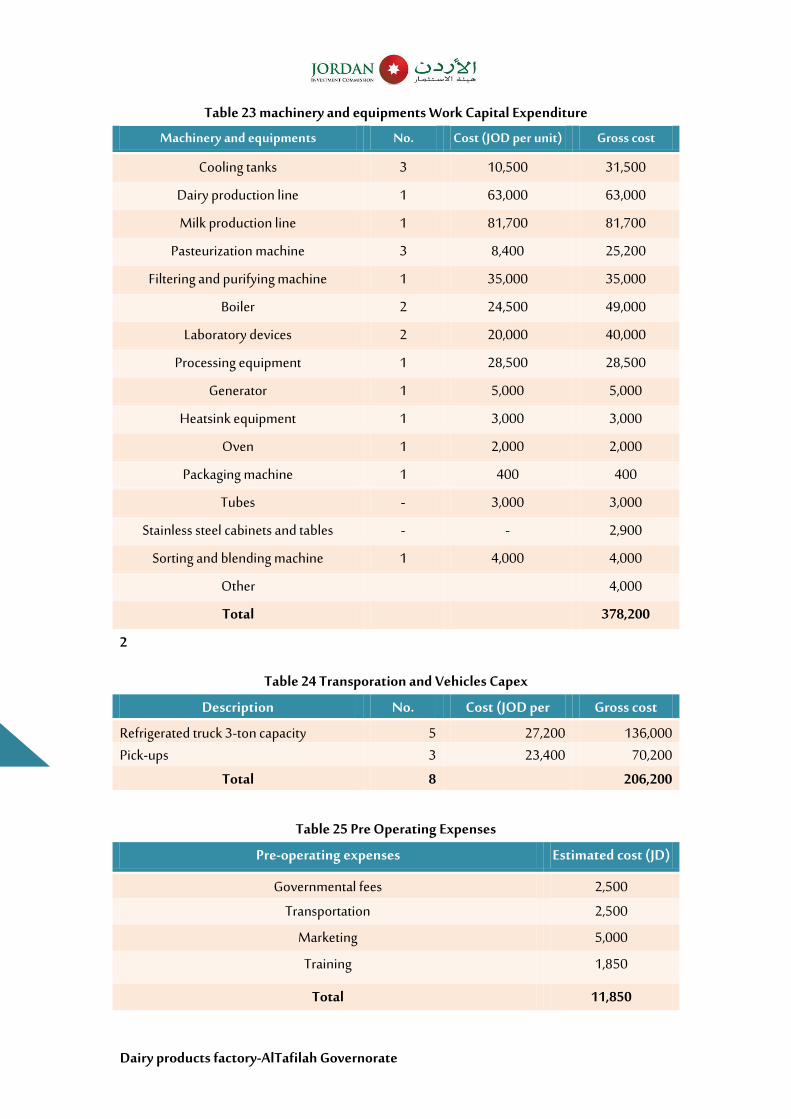
Table 23 machinery and equipments Work Capital Expenditure
Machinery and equipments No. Cost (JOD per unit) Gross cost
Cooling tanks 3 10,500 31,500
Dairy production line 1 63,000 63,000
Milk production line 1 81,700 81,700
Pasteurization machine 3 8,400 25,200
Filtering and purifying machine 1 35,000 35,000
Boiler 2 24,500 49,000
Laboratory devices 2 2,1,,, 40,000
Processing equipment 1 28,500 28,500
Generator 1 5,000 5,000
Heatsink equipment , 21,,, 3,000
Oven 1 2,000 2,000
Packaging machine 1 400 400
Tubes - 21,,, 3,000
Stainless steel cabinets and tables - - 2,900
Sorting and blending machine 1 ,1,,, 4,000
Other 4,000
Total 378,200
2
Table 24 Transporation and Vehicles Capex
Description No. Cost (JOD per
unit)
Gross cost
Refrigerated truck 3-ton capacity 2 2712,, ,211,,, Pick-ups 2 221,,, 7,12,,
Total , 2293222
Table 25 Pre Operating Expenses
Pre-operating expenses Estimated cost (JD(
Governmental fees 212,,
Transportation 212,,
Marketing 21,,,
Training ,122,
Total 113,52

Dairy products factory-AlTafilah Governorate
30
The initial working capital reflects the project's amounts needed to cover all the expenses during
operation until the project starts generating income, the following table shows the components
of the initial working capital:
Table 26 Working Capital
Working Capital No. of
Months
% Estimated Cost
(JD) Operating expenses 6 2,% ,1,22112,
General and administrative expenses 6 2,% ,21,72
Marketing expenses 6 2,% 2,1,22
Indirect Salaries 6 2,% ,,12,,
Total 133,23211
Table 27 Expenses Summary
Capital expenditure summary Cost (JD) Contingency Cost (JD) %
Land 50,000 10% 55,000 2.2%
Construction works 237,380 10% 261,118 ,,.,%
Machinery &Equipment 378,200 10% 416,020 ,1.1%
Furniture 18,000 10% 19,800 ,.2%
Vehicles 206,200 10% 226,820 ,.,%
Pre-Operating Expenses 11,850 10% 13,035 ,.2%
Working capital 1,382,011 10% 1,520,212 1,.2%
Total (JD) 2,283,641 2,512,005 100%
Sources of Funding
The financing structure of the project consists of loans and Equity. The investment cost of this
project is estimated at (212,21,,2) JD, where 1,% of the project will be financed through loans
(,12,712,2) JD, and the remaining (40%) through (Equity) with (,1,,,12,2) JD. The following
table summarizes the general structure of the required financing:
Table 28 Sources of Funding
Funding Sources Amount Percentage
Equity
(Self Financing)
1,004,802 ,,%
Loans 1,507,203 1,%
Total 235123225 122%

Dairy products factory-AlTafilah Governorate
31
Use of Fund Falue Ratio
Capital Expenditures 978,758 22.,1%
Pre-Operating Expenses 13,035 ,.22%
Working Capital 1,520,212 1,.22%
Total 235123225 122.22%

Dairy products factory-AlTafilah Governorate
32
Operating Expenses
The following table sumarizes the expected operating expenses for the proposed project (2018-2027):
Table 29 Operating Expenses
Description 2018 2019 2020 2021 2022 2023 2024 2025 2026 2027
Raw Materials and Packaging from Revenues ,11221,12 ,17221,22 ,12,211,1 21,221,1, 21,221,1, 21,1,122, 21,1,122, 212,,1,22 21,2,1722 2127,1,,1
Utilities from Revenues 22,112, 22,1121 272172, ,,217,2 ,,217,2 ,2212,2 ,2212,2 ,2,12,2 ,211,2, 2,,1,,2
Maintenance from Revenues 221,12 221,1, 27127, ,,127, ,,127, ,2122, ,2122, ,21,,, ,211,2 2,1,,,
Disposables from Revenues 221,12 221,1, 27127, ,,127, ,,127, ,2122, ,2122, ,21,,, ,211,2 2,1,,,
Direct Salaries ,2711,, ,,212,2 ,,,1,,2 ,221222 ,1,12,2 ,1212,2 ,721,,2 ,2212,, ,2,171, ,,712,,
Others 2,21,22 222127, 2,,172, 2171,,, 217172, 2221,21 2221272 2,21211 22,1221 2221,27
Total 2,365,361 2,556,067 2,747,027 2,938,252 2,945,253 3,137,041 3,144,628 3,337,026 3,529,747 3,722,806
Dairy products factory-AlTafilah Governorate
33
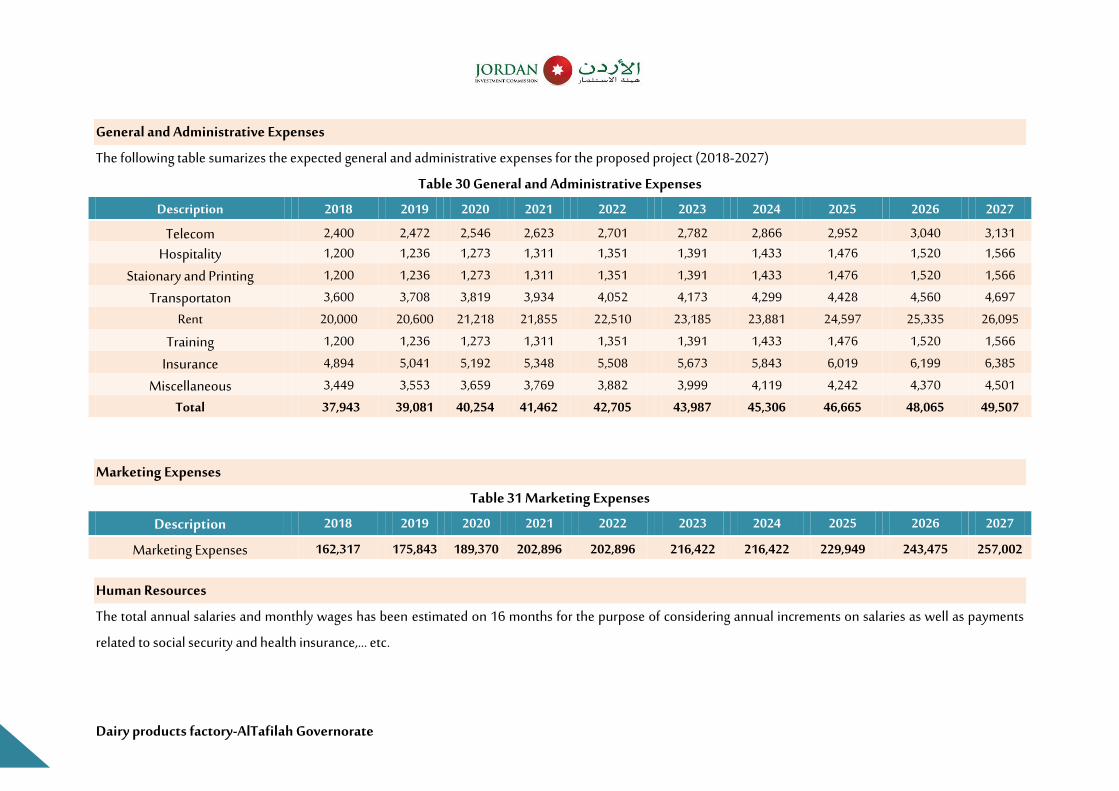
General and Administrative Expenses
The following table sumarizes the expected general and administrative expenses for the proposed project (2018-2027)
Table 30 General and Administrative Expenses
Description 2018 2019 2020 2021 2022 2023 2024 2025 2026 2027
Telecom 21,,, 21,72 212,1 21122 217,, 21722 21211 21,22 21,,, 21,2, Hospitality ,12,, ,1221 ,1272 ,12,, ,122, ,12,, ,1,22 ,1,71 ,122, ,1211
Staionary and Printing ,12,, ,1221 ,1272 ,12,, ,122, ,12,, ,1,22 ,1,71 ,122, ,1211
Transportaton 211,, 217,2 212,, 21,2, ,1,22 ,1,72 ,12,, ,1,22 ,121, ,11,7
Rent 2,1,,, 2,11,, 2,12,2 2,1222 2212,, 221,22 22122, 2,12,7 221222 211,,2
Training ,12,, ,1221 ,1272 ,12,, ,122, ,12,, ,1,22 ,1,71 ,122, ,1211
Insurance ,12,, 21,,, 21,,2 212,2 212,2 21172 212,2 11,,, 11,,, 11222
Miscellaneous 21,,, 21222 2112, 2171, 21222 21,,, ,1,,, ,12,2 ,127, ,12,,
Total 37,943 39,081 40,254 41,462 42,705 43,987 45,306 46,665 48,065 49,507
Marketing Expenses
Table 31 Marketing Expenses
Description 2018 2019 2020 2021 2022 2023 2024 2025 2026 2027
Marketing Expenses 162,317 175,843 189,370 202,896 202,896 216,422 216,422 229,949 243,475 257,002
Human Resources
The total annual salaries and monthly wages has been estimated on 16 months for the purpose of considering annual increments on salaries as well as payments
related to social security and health insurance,… etc.

Dairy products factory-AlTafilah Governorate
34
The following table summerizes the expected annual salaries and wages, considering annual increment on salaries as per the income statement:
Table 32 Expected Annual Salaries and Wages (2027-2018)
Job Title No. Monthly salary (JD) Total monthly
salaries
Total annual wages )دينار(
General Manager , 21,,, 21,,, ,21,,,
Financial Manager , 21,,, 21,,, 221,,,
Quality manager , ,12,, ,12,, 2,1,,,
Human resources manager , ,122, ,122, 2,1,,,
Quality auditors 2 2,, ,1,,, ,11,,,
Accountant 2 2,, ,12,, 2,1,,,
Secretaries , ,2, ,2, 712,,
Human resources staff 2 2,, ,1,,, ,11,,,
security 2 22, 7,, ,,12,,
Indirect employes 14 123422 19,3422
Factory manager , ,12,, ,12,, 2,1,,,
Production line technicians ,, 22, 212,, ,,1,,,
Logistics Manager , ,122, ,122, 2,1,,,
Maintenance technicians 2 2,, 1,, ,11,,
Driver 2 22, ,172, 221,,,
Logistics staff 2 2,, ,1,,, ,11,,,
Direct emplyes 21 ,3922 1393922

Dairy products factory-AlTafilah Governorate
35
Job Title No. Monthly salary (JD) Total monthly
salaries
Total annual wages )دينار(
Total 35 21,000 336,000
Depreciations
The following tables illustrate cost of Capex and Depreciaition rates:
Table 33 Capex and Depreciation Expenses
Equipment costs and capital expenditure, annual consumption rates Cost (JOD) Consumption ratio Annual additions
Land 221,,, ,.,% ,.,%
Construction Works 21,1,,2 2.,% ,.,%
Machinaries ,,11,2, ,,.,% 2.,%
Furniture ,,12,, ,,.,% 2.,%
Vehicles 221122, ,,.,% ,.,%
Gross Total (JOD) 99,395,
Table 34 Depreciations and Additions on Construction Works
Summary of capital costs and additions and consumption annually 221, 2219 2222 2221 2222 2223 2224 2225 2229 2229
Total Fixed Assets ,721722 ,221,12 ,,712,2 ,1,,712,2 ,1,,712,2 ,1,271222 ,1,271,72 ,1,,21172 ,1,2,1122 ,1,7,1227
Total Depreciation Expenses 7,122, 2,122, 2,12,, 221,72 221,71 2,1,,7 2212,2 2112,2 271,,7 221222
Total Accumulated Depreciation 7,122, ,2,127, 2,,177, 2221,22 ,,11,2, ,,,1221 2721212 11,127, 7,,1221 22712,,
Total Additions , ,12,, ,1221 ,17,2 ,1,71 ,,12,, ,,1,2, ,,11,7 ,,1,2, ,,12,,
Total Net Book Values 2,,1,22 2221,,2 721122, 12,12,, 1,,1,,, 22712,2 ,121,,, 22117,1 2,,12,, 2221,22

Dairy products factory-AlTafilah Governorate
36
Loan
The table below summarizes all details related to the loan such as annual installments and payment methods for the remaining amount of the loan for each year of
the project.
Table 35 Loan Details
Loan value 135293223
Annual Interst Rate 9.48% Loans Period 5
Loan Starts at year: 2,,7
Annual Payment 2,21222
Number of Payments 5
The following table shows the loan payments:
year Annual Payment Interest Capital The remainder of the loan
2219 1,507,203 221, 392,328 142,883 249,446 1,257,757 2219 392,328 119,235 273,093 984,664 2222 392,328 93,346 298,982 685,682 2221 392,328 65,003 327,326 358,356 2222 392,328 33,972 358,356 0
Income Statement

Dairy products factory-AlTafilah Governorate
37
Through all the information and financial analysis of the project's financial expenses have statment income for the years (2018 – 2027) as shown in the following
table:
Table 36 Income Statement
Description 2018 2019 2020 2021 2022 2023 2024 2025 2026 2027
Revenues
Sales Revenues 212,11221 212,1121, 2172712,2 ,1,271,2, ,1,271,2, ,12221,,2 ,12221,,2 ,12,21,71 ,121,12,, 21,,,1,22
Gross Operating Revenues 212,11221 212,1121, 2172712,2 ,1,271,2, ,1,271,2, ,12221,,2 ,12221,,2 ,12,21,71 ,121,12,, 21,,,1,22
Operating Expenses (21212121,) (212211,17) (217,71,27) (21,221222) (21,,21222) (21,271,,,) (21,,,1122) (212271,21) (2122,17,7) (2172212,1)
Gross Operating Profit 22,1,72 ,1,17,7 ,1,,,1212 ,1,,,1112 ,1,,21117 ,1,,,1,,7 ,1,22122, ,121,1,2, ,122,1727 ,1,,71221
Gross Profit Percentage 27% 27% 27% 22% 27% 22% 27% 27% 22% 22%
Salaries and Benefits (Indirect Staff) (,,21,,,) (2,1122,) (2,21,,2) (22212,7) (2221,,,) (2,212,7) (2221,,,) (21212,2) (272112,) (22,1222)
General and Administraive Expenses (271,,2) (2,1,2,) (,,122,) (,,1,12) (,217,2) (,21,27) (,212,1) (,11112) (,21,12) (,,12,7)
Markeing Expenses (,1212,7) (,7212,2) (,2,127,) (2,212,1) (2,212,1) (2,11,22) (2,11,22) (22,1,,,) (2,21,72) (2271,,2)
Pre Operating Expenses (,21,22)
Gross Indirect Expenses (,,,11,2) (,2,1,2,) (,,,1121) (,121,72) (,7212,2) (2,21,21) (2,,122,) (22,1,27) (2121,1,) (2,,12,7)
Income before Interest, Depreciation and Tax ,1,122, 22,1222 2,2172, 12,1,,2 12,1,7, 1221,2, 11,11,, 7221,,2 77,12,7 222127,
Fixed Assets Depreciations (7,122,) (2,122,) (2,12,,) (221,72) (221,71) (2,1,,7) (2212,2) (2112,2) (271,,7) (221222)
Income before Tax and Interests 22,1,1, ,2,1,27 2,,1222 21,12,, 22,12,1 1,,122, 22,122, 1211,22 1271,,, 727122,
Bank Interests (,,21222) (,,,1222) (,212,1) (121,,2) (221,72) (,) (,) (,) (,) (,)
Income Before Tax 2,71,77 22,1222 ,2,1,2, 2,,12,2 2,11,22 1,,122, 22,122, 1211,22 1271,,, 727122,
Income Tax (,2122,) (,11,,2) (2,1,2,) (2212,1) (2212,1) (2,12,2) (2,12,2) (2,12,,) (2,122,) (211212)
Net Profit 22,1722 222122, ,,,1,2, ,7,1,,1 ,,,1,77 27,1,,2 2221,,, 1,,1272 122122, 7,,1,2,

Dairy products factory-AlTafilah Governorate
38
Description 2018 2019 2020 2021 2022 2023 2024 2025 2026 2027
Net Profit Percentage 7% ,% ,,% ,2% ,2% ,2% ,2% ,2% ,2% ,,%
Compulsory Reserves (221,72) (221221) (,,1,,2) (,71,,,) (,,1,,2) (271,,,) (2212,,) (1,1,27) (121222) (7,1,,2)
Retained Earnings 2,,122, 2,,122, 21,1,,, ,12,21,27 ,17221,,7 2122,172, 2172,121, 212,212,1 2122212,2 ,12,2127,
Expected Cashflows Statement
The table belwo summarizes project cashflows statement, where net cash flows are positive during all years as below
Table 37 Expected Cashflows
221, 2219 2222 2221 2222 2223 2224 2225 2229 2229
Cash Inflows from Operating Activities
Net Profit 22,1722 222122, ,,,1,2, ,7,1,,1 ,,,1,77 27,1,,2 2221,,, 1,,1272 122122, 7,,1,2,
Bank Interests ,,21222 ,,,1222 ,212,1 121,,2 221,72 , , , , ,
Depreciation 7,122, 2,122, 2,12,, 221,72 221,71 2,1,,7 2212,2 2112,2 271,,7 221222
Total Operating Cashflows before
Additions to Working Capital
,211,21 22212,2 27,117, 1211277 1,21222 122122, 1,,1222 1,,112, 7,,1227 72,1,,2
Inventory (Increase/Decrease) (,22121,) (,,1272) (,,1272) (,,1272) , (,,1272) , (,,1272) (,,1272) (,,1272)
Accounts Receviables (Increase/Decrease) (27,1222) (2212,,) (2212,,) (2212,,) , (2212,,) , (2212,,) (2212,,) (2212,,)
Accounts Paybales (Increase/Decrease) ,2212,2 ,2121, ,21,2, ,21,,, ,172, ,,1,2, ,12,7 ,,1222 ,,121, ,,1,,,
Working Capital (Increase/Decrease) (22,12,,) (,,1,21) (,,12,2) (,,1221) ,172, (,,1122) ,12,7 (,,1222) (,,1,22) (,,1217)

Dairy products factory-AlTafilah Governorate
39
221, 2219 2222 2221 2222 2223 2224 2225 2229 2229
Net Cashflows from Operating Activities 2211122 2,212,, 22,1727 1,11,2, 1,,1,72 1221222 1,2127, 17,1,2, 72,1722 71,11,,
Cashflows from Investments Activities
Fixed Assets (Procurement) (,721722) (,12,,) (,1221) (,17,2) (,1,71) (,,12,,) (,,1,2,) (,,11,7) (,,1,2,) (,,12,,)
Net Cashflows from Investments Activities (,721722) (,12,,) (,1221) (,17,2) (,1,71) (,,12,,) (,,1,2,) (,,11,7) (,,1,2,) (,,12,,)
Cashflows from Financing Activities
Capital ,1,,,12,2
Loan Amortization (2,,1,,1) (2721,,2) (2,21,22) (2271221) (2221221) , , , , ,
Bank Interest Rate (,,21222) (,,,1222) (,212,1) (121,,2) (221,72) (,) (,) (,) (,) (,)
Loans ,12,712,2 , , , , , , , , ,
Net Cashflows from Financing Activities 21,,,1171 (2,21222) (2,21222) (2,21222) (2,21222) , , , , ,
Net (Increase/Decrease) in Cash ,127711,, ,,,172, ,221,22 2,,1272 2,7117, 12212,, 12,122, 11,1,22 7,,1222 7221,22
Cashflows at the Beginning of Period , ,127711,, ,1,721222 ,112,122, ,1222112, 21,,2122, 2117,1172 212,212,, 21,121,2, ,117217,2
Cashflows at the End of Period ,127711,, ,1,721222 ,112,122, ,1222112, 21,,2122, 2117,1172 212,212,, 21,121,2, ,117217,2 21,221221
Expected Balance Sheet
The balance sheet is one of the main statements which the project depends on, as it reflects the financial position of the entity and is usually estimated on the last
day of the financial year.
All financial information and analysis of the project shall be the estimated for the years (2018-2027) as shown in the table below:

Dairy products factory-AlTafilah Governorate
40
Table 38 Expected Balance Sheet
Description 221, 2219 2222 2221 2222 2223 2224 2225 2229 2229
Assets
Current Assets
Cash 1,377,601 1,478,352 1,631,284 1,835,659 2,043,331 2,671,675 3,303,504 3,963,959 4,673,793 5,432,226
Inventory 135,264 146,536 157,808 169,080 169,080 180,352 180,352 191,624 202,896 214,168
Accounts Receivable 270,528 293,072 315,616 338,160 338,160 360,704 360,704 383,248 405,792 428,336
Total current Assets 1,783,393 1,917,960 2,104,708 2,342,899 2,550,571 3,212,731 3,844,560 4,538,831 5,282,481 6,074,730
Non Current Assets
Fixed Assets (net) 899,438 828,498 756,820 684,390 611,190 537,202 462,410 386,796 310,340 233,023
Total Non Current Assets 899,438 828,498 756,820 684,390 611,190 537,202 462,410 386,796 310,340 233,023
Total Assets 2,682,831 2,746,457 2,861,529 3,027,289 3,161,760 3,749,933 4,306,970 4,925,626 5,592,821 6,307,754
Liabilities
Current Liabilities
Paybles 185,548 199,409 213,333 227,323 229,073 243,204 245,101 259,384 273,749 288,197
Remaining amount of Loan 273,093 298,982 327,326 358,356 (0) (0) (0) (0) (0) 0
Total current Liabilities 458,641 498,391 540,659 585,679 229,073 243,204 245,101 259,384 273,749 288,197
Non Current Liabilities
Long Terms Loans 984,664 685,682 358,356 0 0 0 0 0 0 0
Total Long Term Liabilities 984,664 685,682 358,356 0 0 0 0 0 0 0
Total Liabilities 1,443,305 1,184,073 899,015 585,679 229,073 243,204 245,101 259,384 273,749 288,197

Dairy products factory-AlTafilah Governorate
41
Description 221, 2219 2222 2221 2222 2223 2224 2225 2229 2229
Owners Equity
Shareholders Contributions 1,004,802 1,004,802 1,004,802 1,004,802 1,004,802 1,004,802 1,004,802 1,004,802 1,004,802 1,004,802
Statutory Reseve 23,472 55,758 95,771 143,681 192,789 250,193 305,707 366,144 431,427 501,475
Retained Profits 211,251 501,824 861,941 1,293,127 1,735,097 2,251,734 2,751,361 3,295,296 3,882,843 4,513,279
Total Equity 1,239,525 1,562,384 1,962,514 2,441,610 2,932,687 3,506,729 4,061,869 4,666,242 5,319,072 6,019,556
Total Liabilities and Equity 2,682,831 2,746,457 2,861,529 3,027,289 3,161,760 3,749,933 4,306,970 4,925,626 5,592,821 6,307,754
Feasibility Indicators
There are more than one method to calculate the discounted cash flow statement. However, in this study, WACC was used to calculate the discounted cash flows
and net investment value. The Company's financing structure is based on equity and loans, therefore the discounted rate should be adjusted according to WACC
based on the following assumptions, the following table illustrates the net expected free cash flow of the project:
Table 39 Free Net Cash flows Table
Net Cashflows Pre- Operating 2,,2 2,,, 2,2, 2,2, 2,22 2,22 2,2, 2,22 2,21 2,27 Final value
Net Free Cashflows (212,21,,2) 2,,17,7 ,,21,7, 2,2121, 2,117,2 1,,1,,, 12212,, 12,122, 11,1,22 7,,1222 7221,22 ,17,11,,,
Discount Factor ,.,, ,.7, ,.12 ,.27 ,.2, ,.,2 ,.,, ,.21 ,.22 ,.2, ,.21 ,.21
Net Present Value for Cash Flows (235123225) 199349, 31239,4 32,39,4 3213494 2923539 2523,44 2293921 2113991 2233229 193359, 235223942
Dairy products factory-AlTafilah Governorate
42
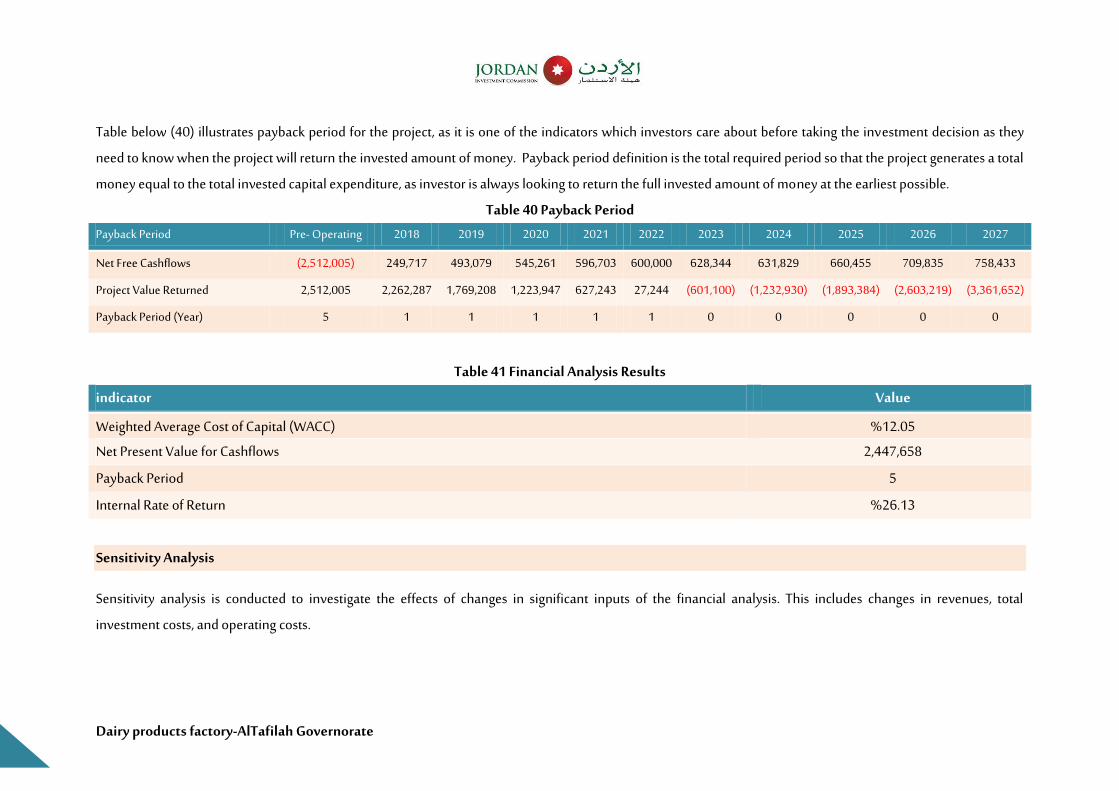
Table below (40) illustrates payback period for the project, as it is one of the indicators which investors care about before taking the investment decision as they
need to know when the project will return the invested amount of money. Payback period definition is the total required period so that the project generates a total
money equal to the total invested capital expenditure, as investor is always looking to return the full invested amount of money at the earliest possible.
Table 40 Payback Period
Payback Period Pre- Operating 2,,2 2,,, 2,2, 2,2, 2,22 2,22 2,2, 2,22 2,21 2,27
Net Free Cashflows (212,21,,2) 2,,17,7 ,,21,7, 2,2121, 2,117,2 1,,1,,, 12212,, 12,122, 11,1,22 7,,1222 7221,22
Project Value Returned 212,21,,2 212121227 ,171,12,2 ,12221,,7 12712,2 2712,, (1,,1,,,) (,12221,2,) (,12,2122,) (211,212,,) (2121,1122)
Payback Period (Year) 2 , , , , , , , , , ,
Table 41 Financial Analysis Results
indicator Value
Weighted Average Cost of Capital (WACC) ,2.,2%
Net Present Value for Cashflows 21,,71122
Payback Period 2
Internal Rate of Return 21.,2%
Sensitivity Analysis
Sensitivity analysis is conducted to investigate the effects of changes in significant inputs of the financial analysis. This includes changes in revenues, total
investment costs, and operating costs.

Dairy products factory-AlTafilah Governorate
43
Table 42 Sensitivity Analysis
Sensitivity Analysis Internal Rate of Return Payback Period WACC
Original Scenario 21.,2% 2 12.05% Revenues declined by 10% 22.,2% 2 12.05%
Operating Expenses Increased by 10% ,,.12% 2 12.05%
Conclusions and Recommendations
Based on the profitability analysis and considering that project inrernal rate of return is higher than WACC, it is concluded that the project is feasible as the net
present value for the project is positive 2,447,658 Jordan Dinars considering that the project provides 35 Job Opportunitites for the governorate residents.