Embed Size (px)
Citation preview
1
Pre-Feasibility Study
Establishment of A Commercial Shopping Center (Mall)
Zarqa
April 2017
Pre-Feasibility Study Establishment of A Commercial Shopping Center (Mall) - Zarqa
2
Table of Contents
1. EXECUTIVE SUMMARY ................................................................................................... 4
2. THE MACROECONOMIC ENVIRONMENT ......................................................................... 7
2.1 AN OVERVIEW OF THE HASHEMITE KINGDOM OF JORDAN .......................................................... 7
2.2 POPULATION ....................................................................................................................... 8
3.2 ECONOMIC INDICATORS IN THE KINGDOM ............................................................................. 10
2.4 THE JORDANIAN INVESTMENT ENVIRONMENT ......................................................................... 13
2.5 THE ECONOMIC ENVIRONMENT IN THE SHORT AND MEDIUM TERM ............................................ 16
3. MARKET STUDY ............................................................................................................ 17
3.1 PROJECT DESCRIPTION ........................................................................................................ 17
3.2 EXPECTED SERVICES DESCRIPTION ......................................................................................... 18
3.3 DEMAND ANALYSIS ............................................................................................................ 18
3.4 MARKETING STRATEGY ....................................................................................................... 27
3.5 EXPECTED MARKET SHARE ................................................................................................... 29
4. TECHNICAL STUDY ........................................................................................................ 30
4.1 THE DESIGNED CAPACITY .................................................................................................... 30
4.2 REQUIRED FIXED ASSETS ..................................................................................................... 30
4.3 REQUIRED HUMAN RESOURCES ............................................................................................ 31
4.4 REQUIRED LICENSES ........................................................................................................... 34
4.5 PROJECT TIMETABLE ........................................................................................................... 34
5. FINANCIAL STUDY ......................................................................................................... 35
5.1 FINANCIAL ASSUMPTIONS .................................................................................................... 35
5.2 INVESTMENT COST ............................................................................................................. 36
5.3 FINANCING ....................................................................................................................... 36
5.4 REVENUES ........................................................................................................................ 36
5.5 THE PROJECTED COSTS ....................................................................................................... 40
5.6 PROJECTED FINANCIAL STATEMENTS ..................................................................................... 42
5.7 FINANCIAL, ECONOMIC AND SOCIAL ANALYSIS ........................................................................ 45
6. RISK AND SENSITIVITY ANALYSIS ................................................................................... 48
6.1 RISK ANALYSIS ................................................................................................................... 48
6.2 SENSITIVITY ANALYSIS ......................................................................................................... 52

Pre-Feasibility Study Establishment of A Commercial Shopping Center (Mall) - Zarqa
3
Pre-Feasibility Study Establishment of A Commercial Shopping Center (Mall) - Zarqa
4

Pre-Feasibility Study Establishment of A Commercial Shopping Center (Mall) - Zarqa
5
1. Executive Summary
This study aims at determining the Pre-Feasibility Study for the establishment of a Commercial
Shopping Center (Mall) in Zarqa Governorate. The mall will provide all the services needed by
the customers while shopping, to meet their family and personal needs in one safe and clean
place, and a one that ensures the existence of car parking away from the overcrowded places
within the business districts. The mall includes a hypermarket, clothes stores, footwear stores,
gifts stores and accessories stores. In addition, the mall includes restaurants, recreational area
for children and adults, cafes and others. The reason behind establishing the Mall is due to the
current over crowdedness of the business district, and the difficulty of finding suitable parking
for shoppers, and the lack of a comprehensive recreational center that is suitable for families in
the Governorate.
Table :1 Initial Indicators of the Project
Project Name Multi-purpose Commercial Shopping Center (Mall)
Sector Service / Real Estate / Commercial
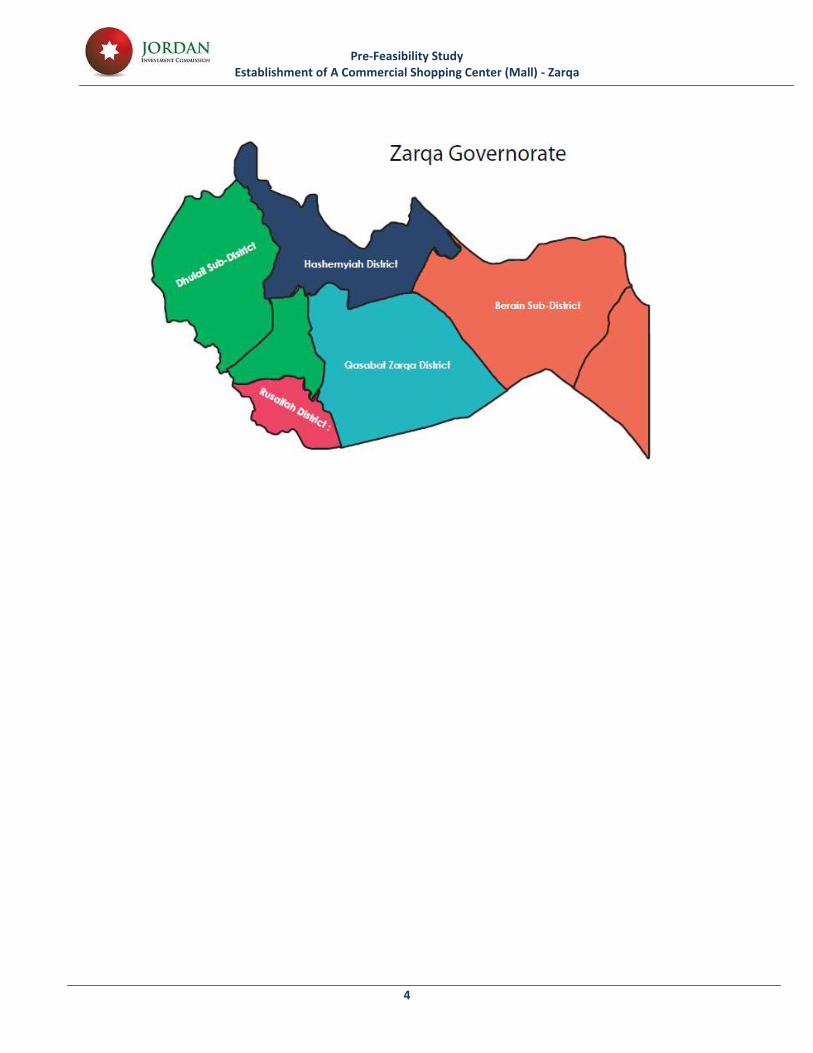
Governorate Zarqa
Region Qasabat Az Zarqa
Products/Services
The project could include the provision of at least the following
services:
Hypermarket.
Restaurants (franchise or local).
Clothing, footwear, accessories, gifts, perfumes stores
(international and local).
Electronics shops.
Banking services.
Services shops such as a pharmacy, Dry cleaning, plated
jewelry, etc.
Bags and gift shops of leather products.
Major Telecommunications Companies such as Zain, Orange,
and Umniah.
Famous and reputable cafes.
Recreational Center for children and adults.
Parking spaces for shoppers and visitors of the mall, which
can accommodate more than 800 cars inside the mall and
about 100 cars around the mall.
Other services (kiosks that often used to sell candies, ice
cream, chips potatoes and mobile phones and their
accessories, etc ...).
Project Description The project is based on developing a multi-purpose property in the
Zarqa, to provide leasing services for tenants to invest in
Pre-Feasibility Study Establishment of A Commercial Shopping Center (Mall) - Zarqa
6
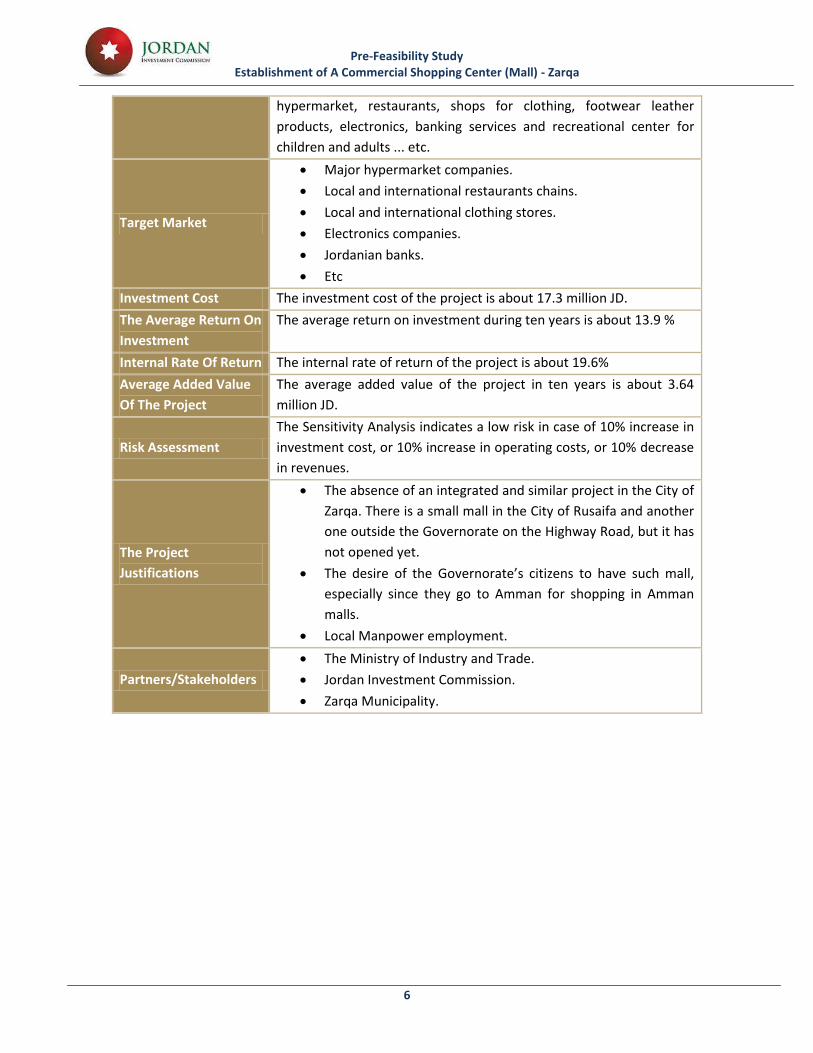
hypermarket, restaurants, shops for clothing, footwear leather
products, electronics, banking services and recreational center for
children and adults ... etc.
Target Market
Major hypermarket companies.
Local and international restaurants chains.
Local and international clothing stores.
Electronics companies.
Jordanian banks.
Etc
Investment Cost The investment cost of the project is about 17.3 million JD.
The Average Return On
Investment
The average return on investment during ten years is about 13.9 %
Internal Rate Of Return The internal rate of return of the project is about 19.6%
Average Added Value
Of The Project
The average added value of the project in ten years is about 3.64
million JD.
Risk Assessment
The Sensitivity Analysis indicates a low risk in case of 10% increase in
investment cost, or 10% increase in operating costs, or 10% decrease
in revenues.
The Project
Justifications
The absence of an integrated and similar project in the City of
Zarqa. There is a small mall in the City of Rusaifa and another
one outside the Governorate on the Highway Road, but it has
not opened yet.
The desire of the Governorate’s citizens to have such mall,
especially since they go to Amman for shopping in Amman
malls.
Local Manpower employment.
Partners/Stakeholders
The Ministry of Industry and Trade.
Jordan Investment Commission.
Zarqa Municipality.

Pre-Feasibility Study Establishment of A Commercial Shopping Center (Mall) - Zarqa
7
2. The Macroeconomic Environment
2.1 An Overview of the Hashemite Kingdom of Jordan
The Hashemite Kingdom of Jordan is a landlocked country surrounded by land except at its
southern extremity at the port of Aqaba, where that area is the only sea exit area in Jordan. The
Kingdom is bordered at its west side by Palestine and the Mediterranean Sea, at its south and
east by the Kingdom of Saudi Arabia, at north east by Iraq and at north by Syria.
Figure 1: Map of the Hashemite Kingdom of Jordan
Jordan is marked by three climatic zones from west to east including the Jordan Valley, most of
which lies below sea level and is considered subtropical, and upland areas to the east of the
Jordan Valley, ranging in height from 100 to 1500 meters above sea level and this is one of the
areas dominated by Mediterranean climate, and the desert areas stretching to the east of the
highlands.
The total area of the Kingdom is approximately 89.3 thousand square kilometers, and the semi-
desert conditions prevail in over 80% of this area where there are some wet lands settings like
Azraq Basin.
The kingdom is divided administratively into twelve governorates distributed into three regions:
the Northern Region (includes the governorates of Irbid, Mafraq, Jerash and Ajloun) while the
Central Region (includes the governorates of the capital, Zarqa, Balqa, Madaba) and the
Southern Region (includes the governorates of Karak, Tafila, Ma'an, Aqaba), and the major cities
are Amman (the capital), Zarqa and Irbid.

Pre-Feasibility Study Establishment of A Commercial Shopping Center (Mall) - Zarqa
8
2.2 Population
Based on the General Census of Population and Housing in 2015, the population in the kingdom
amounted to about 9.5 million people with a population density of 107.3 inhabitants per km2,
where the Capital City knocked off other governorates by population amounting to about 4
million people and a population density of 538.8 inhabitants per km2, mainly because Amman is
the most attractive governorate for Jordanians and for those coming to Jordan from other
countries, followed by Irbid Governorate with a population of 1.8 million people, and then Zarqa
Governorate with a population of 1.4 million. Tafila Governorate which is considered to be the
least populous governorate whose population is about 96 thousand people.
Table :2 Number of population and population density in the Kingdom for 2015
Governorate Population (people) Area (Km2) Population density
(people/ km2)
Central Region
Capital 4007526 ,,5,7 528.8
Zarqa 1364878 4761 286.7
Balqa 491709 1120 439.0
Madaba 189192 749 201.3
North Region
Irbid 1770158 1572 1126.1
Mafraq 549948 26551 20.7
Jerash 237059 410 578.2
Ajloun 176080 420 419.2
Southern Region
Karak 316629 3495 90.6
Tafeileh 96291 2209 43.6
Maan 144082 32832 4.4
Aqaba 188160 6905 27.2
Total of Kingdom 9531712 88793.5 107.3 Source: Department of Statistics, Jordan General Population and Housing Census, 2015
On the other hand, the population growth rate has reached about 3% in 2010 and increased to
9% during the years 2013 and 2014 and then dropped a little during 2015 to reach about 8%,
according to demographic surveys for the Department of Statistics. The reason for the high
growth rates is attributed to the influx of large numbers of refugees from Syria to the Kingdom
which resulted in a marked decline in per capita real GDP index by 5.4% to JD 1,197.4, based on
the Statements of the Central Bank of Jordan.
The unemployment rate among Jordanians also witnessed a rise by 1.1 percentage to reach to
13%, due to the structural imbalances that the labor market is suffering from and the acquisition
of the low-paid foreign workers on a large number of new jobs in the economy, according to the
Central Bank of Jordan.

Pre-Feasibility Study Establishment of A Commercial Shopping Center (Mall) - Zarqa
9
Table :3 Number of population and population growth in the Kingdom, thousand
2010 2011 2012 2013 2014 2015
population 6698.0 6993.0 7427.0 8114.0 8804.0 9531.7
growth rate 2% 4% 6% 7% 7% 8%
Source: Department of Statistics
Figure 2: population growth rate in the Kingdom
0%
1%
2%
3%
4%
5%
6%
7%
8%
9%
10%
2010 2011 2012 2013 2014 2015
growth rate
Pre-Feasibility Study Establishment of A Commercial Shopping Center (Mall) - Zarqa
10
2.3 Economic Indicators in the Kingdom 1
Countries across the Middle East are still suffering from instability and closure or partial closure
of borders; including the borders of important markets for the Kingdom’s products. These
factors led to a decline in the performance of many of the economic sectors, including the
external sector, national exports, touristic income, and Foreign Direct Investment (FDI), and they
contributed to a slowdown in the economic growth to about 2.4% in 2015, compared to 3.1% in
2014. The growth achieved in 2015 came from growth across several economic sectors,
especially in the finance, insurance, and real estate services; the transport, storage, and
communications services; the mining industry; the manufacturing industry; and the agriculture
sector. These sectors contributed a combined 1.8 percentage points (or 75%) of the growth rate
achieved during 2015, reflecting the diversity of the economic growth sources in the Kingdom.
Additionally, the general price level registered a decline in the prices of oil, commodities, and
other related services in the global markets. Therefore, the general price level, measured by the
relative change in the average consumer price index deflated by 0.9% in 2015, compared to the
inflation of 2.9% in 2014.
The budget deficit, after aid, increased by 1.2% to a record 3.5% of GDP, compared with 2.3% in
the previous year. In addition, the Balance of Payments’ Current Account recorded a deficit of
8.9% of GDP, compared with 7.3% in 2014. At the end of 2015, the net public debt amounted to
22,847.5 million Jordanian Dinars (85.8% of the GDP), with an increase of 5.0% of the GDP.
However, the total public debt reached 24,876.5 million Jordanian Dinars (93.4% of GDP). This
increase resulted from financing both the general budget deficit and the guarantees for loans
for the National Electricity Company and the Water Authority, as well as the slowdown of
economic growth during 2015. The indebtedness of the National Electricity Company and the
Water Authority recorded 6.7 billion Jordanian Dinars at the end of 2015.
On the monetary and banking front, most monetary indicators experienced positive
development in performance in 3915, primarily in the Central Bank’s foreign reserves, which
maintained comfortable levels that amounted to about $14.2 billion. The dollarisation rate
decreased, which reflected positive demand for Jordanian Dinars in comparison to other major
foreign currencies. With regards to the activities of licensed banks, the outstanding balance of
credit increased by 9.5%, to reach 21,103.5 million Jordanian Dinars at the end of 2015. The
total deposits registered with licensed banks increased by 7.7%, to reach 32,598.5 million
Jordanian Dinars at the end of 2015. The increase in deposits came as a result of the high dinar
deposits, which increased by 2,001.4 million Jordanian Dinars (8.3%), and higher foreign
currency deposits, which increased by 336.1 million Jordanian Dinars (5.4%).
1 The Central Bank of Jordan

Pre-Feasibility Study Establishment of A Commercial Shopping Center (Mall) - Zarqa
11
Furthermore, many of the external sector indicators registered a drop in performance in 2015
due to the deepening instability in the region and almost full closure of the borders with Iraq
and Syria. However, the drop in oil prices in the global markets contributed to the decline in the
Kingdom’s imports bill for energy, as it dropped by 40.6%, which in turn contributed to a decline
in total imports and the trade deficit by 11.4% and 14.0%, respectively. Thus, the Current
Account, excluding aid, declined to 11.9% of GDP, compared to 12.4% in 2014.
The Current Account deficit increased after aid, to reach 2,365.6 million Jordanian Dinars (8.9%
of GDP) in 2015, compared with a deficit of 1,851.7 million Jordanian Dinars (7.3% of GDP) in
2014. This decline is due mainly to the decline in total exports by 6.6% and the decline in surplus
in the services account by 27.7%, as touristic income decreased by 7.1%, and the decline in the
surplus in the current transfers account decreased as a result of reduced foreign aid.
Capital and financial accounts resulted in a net inflow of 1,593.7 million Jordanian Dinars in
3915, compared to 797.9 million Jordanian Dinars in 3914; this was due to the Kingdom’s higher
net obligations towards the outside world. Foreign Direct Investment registered a net inflow of
909.4 million Jordanian Dinars, and the reserved investment registered an inflow of 918.4
million Jordanian Dinars due to the Kingdom issuing Eurobonds that are worth $2.0 billion in the
global markets. The withdrawal of bank loans on behalf of the Central Bank increased the use of
funds from the International and Arab Monetary Funds by 543.3 million Jordanian Dinars. This
led to the registration of a surplus in the overall Balance of Payments of 328.7 million Jordanian
Dinars during 2015, compared to a surplus of 1,550.7 million Jordanian Dinars during 2014.
According to the Central Bank of Jordan, the increased international investment at the end of
2015 showed an increase in the external net liabilities of the Kingdom, which reached 24,357.5
million Jordanian Dinars, compared with 22,578.8 million Jordanian Dinars at the end of 2014.
This was due to an increase in the external balance of assets and financial liabilities for all of the
economic sectors in the Kingdom, which reached to 18,657.9 million Jordanian Dinars and
43,015.5 million Jordanian Dinars, respectively, during 2015.
Table :4 main economic indicators 2011 to 2015 in millions of dinars
2111 2112 2113 2114 2112
Population (millions) 6.993 7.427 8.114 8.804 9.532
Unemployment rate 12.9 12.2 12.6 11.9 13.0
Production and Prices
GNP at current market prices 20,288.8 21,690.0 23,611.2 25,141.2 26,289.6
GDP at current market prices 20,476.6 21,965.5 23,851.6 25,437.1 26,637.4
The rate of growth in GDP at constant market prices (%)
2.6 2.7 2.8 3.1 2.4
The total national disposable income at current prices
23,743.5 24,774.9 28,424.5 30,302.1 30,234.7
The rate of growth in gross national disposable income at current prices (%)
4.7 –0.2 8.6 3.1 –2.4
Change in the index of consumer prices 4.2 4.5 4.8 2.9 –0.9
Pre-Feasibility Study Establishment of A Commercial Shopping Center (Mall) - Zarqa
12
2111 2112 2113 2114 2112
(%)
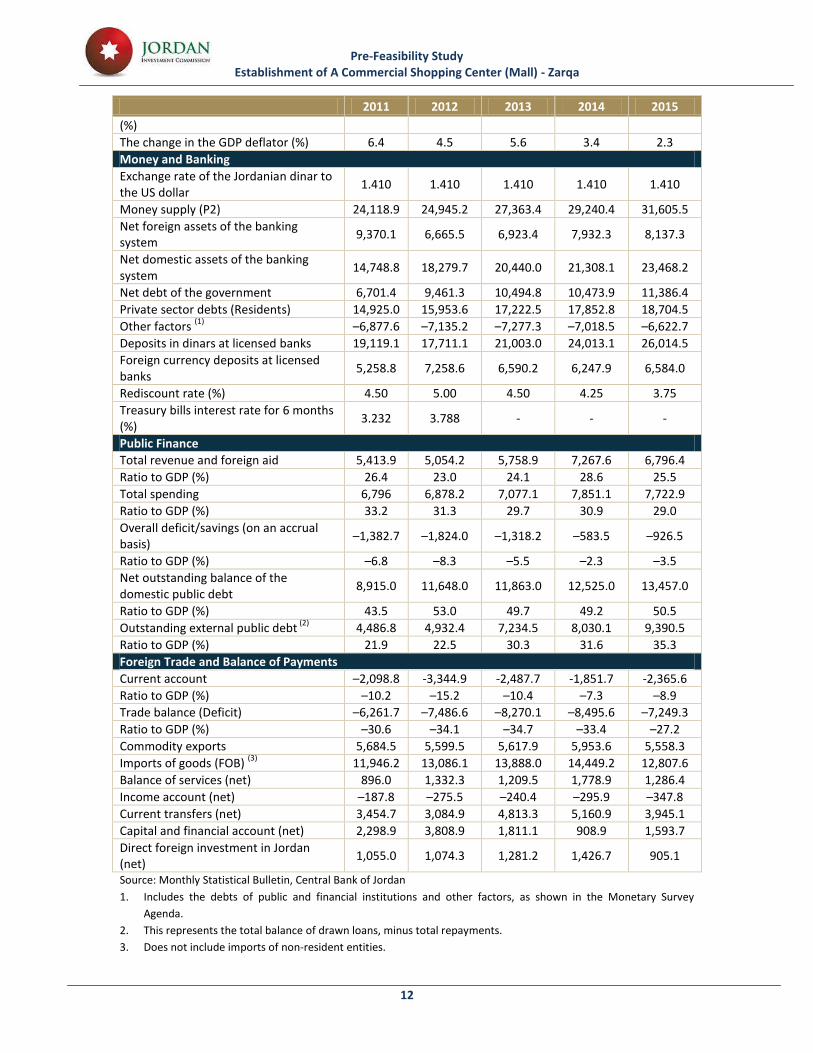
The change in the GDP deflator (%) 6.4 4.5 5.6 3.4 2.3
Money and Banking
Exchange rate of the Jordanian dinar to the US dollar
1.410 1.410 1.410 1.410 1.410
Money supply (P2) 24,118.9 24,945.2 27,363.4 29,240.4 31,605.5
Net foreign assets of the banking system
9,370.1 6,665.5 6,923.4 7,932.3 8,137.3
Net domestic assets of the banking system
14,748.8 18,279.7 20,440.0 21,308.1 23,468.2
Net debt of the government 6,701.4 9,461.3 10,494.8 10,473.9 11,386.4
Private sector debts (Residents) 14,925.0 15,953.6 17,222.5 17,852.8 18,704.5
Other factors (1)
–6,877.6 –7,135.2 –7,277.3 –7,018.5 –6,622.7
Deposits in dinars at licensed banks 19,119.1 17,711.1 21,003.0 24,013.1 26,014.5
Foreign currency deposits at licensed banks
5,258.8 7,258.6 6,590.2 6,247.9 6,584.0
Rediscount rate (%) 4.50 5.00 4.50 4.25 3.75
Treasury bills interest rate for 6 months (%)
3.232 3.788 - - -
Public Finance
Total revenue and foreign aid 5,413.9 5,054.2 5,758.9 7,267.6 6,796.4
Ratio to GDP (%) 26.4 23.0 24.1 28.6 25.5
Total spending 6,796 6,878.2 7,077.1 7,851.1 7,722.9
Ratio to GDP (%) 33.2 31.3 29.7 30.9 29.0
Overall deficit/savings (on an accrual basis)
–1,382.7 –1,824.0 –1,318.2 –583.5 –926.5
Ratio to GDP (%) –6.8 –8.3 –5.5 –2.3 –3.5
Net outstanding balance of the domestic public debt
8,915.0 11,648.0 11,863.0 12,525.0 13,457.0
Ratio to GDP (%) 43.5 53.0 49.7 49.2 50.5
Outstanding external public debt (2)
4,486.8 4,932.4 7,234.5 8,030.1 9,390.5
Ratio to GDP (%) 21.9 22.5 30.3 31.6 35.3
Foreign Trade and Balance of Payments
Current account –2,098.8 -3,344.9 -2,487.7 -1,851.7 -2,365.6
Ratio to GDP (%) –10.2 –15.2 –10.4 –7.3 –8.9
Trade balance (Deficit) –6,261.7 –7,486.6 –8,270.1 –8,495.6 –7,249.3
Ratio to GDP (%) –30.6 –34.1 –34.7 –33.4 –27.2
Commodity exports 5,684.5 5,599.5 5,617.9 5,953.6 5,558.3
Imports of goods (FOB) (3)
11,946.2 13,086.1 13,888.0 14,449.2 12,807.6
Balance of services (net) 896.0 1,332.3 1,209.5 1,778.9 1,286.4
Income account (net) –187.8 –275.5 –240.4 –295.9 –347.8
Current transfers (net) 3,454.7 3,084.9 4,813.3 5,160.9 3,945.1
Capital and financial account (net) 2,298.9 3,808.9 1,811.1 908.9 1,593.7
Direct foreign investment in Jordan (net)
1,055.0 1,074.3 1,281.2 1,426.7 905.1
Source: Monthly Statistical Bulletin, Central Bank of Jordan
1. Includes the debts of public and financial institutions and other factors, as shown in the Monetary Survey
Agenda.
2. This represents the total balance of drawn loans, minus total repayments.
3. Does not include imports of non-resident entities.
Pre-Feasibility Study Establishment of A Commercial Shopping Center (Mall) - Zarqa
13
2.4 The Jordanian Investment Environment
Investment Law No. 30 for 2014
Investment Law no. 30 for 2014 is considered an appropriate legislative framework to attract
foreign investments and stimulate local investments. It is considered a competitor to other
investment laws in the region because it contains many advantages, incentives, and guarantees,
and it offers a range of incentives and benefits in and outside the Development and Free Zones.
The law includes a series of public provisions, such as foreign investment guarantees (depositing
and withdrawal of capital, investment management, and transfers) and the inadmissibility of the
disbarment of investment property. The law offers provisions to settle investment disputes,
protection, and encouragement of mutual investment agreements between the Kingdom and
other countries.
The following shows the major incentives granted by the law:
Incentives and Benefits outside the Development and Free Zones
The production inputs for the industrial and crafts sectors are exempted from customs
duties.
The return of the general sales tax on the production inputs for the industrial and crafts
sectors within 30 days.
Production inputs and fixed assets of the industrial and crafts sectors are exempted from
customs duties and are granted a reduction in general sales tax to 0%.
Returning to the sales tax on the services needed to practice economic activity within 30
days.
The goods that are necessary for the economic activities of the following sectors are
exempted from customs duties and are subject to 0% general sales tax:
- Agriculture and livestock, hospitals and specialised medical centres, hotels and touristic
facilities, touristic entertainment and recreation centres, call centres, scientific research
centres and laboratories, art and media production, convention centres and exhibitions,
transfers and/or distributions and/or extraction of water, gas and oil derivatives, air
transport, maritime transport, and railways.
Incentives and Benefits inside the Development and Free Zones
5% income tax on the income generated from economic activity within the Development
Zone.
5% income tax on income generated from economic activity in the industrial sector.
Tax exemptions that are granted in the Kingdom on goods and services exports.
Reduction of sales tax to 0% on goods and services that are used by the establishment in
order to exercise its activity inside the Development Zone.

Pre-Feasibility Study Establishment of A Commercial Shopping Center (Mall) - Zarqa
14
7% sales tax on specific services provided by a registered company in the zone when these
services are consumed in the zone.
Exemptions from customs duties except for a specified number of goods.
The Reduction of Income Tax in the Least Developed Areas for Regulation No. 44 for 2016
The reduction of income tax in the least developed areas for Regulation No. 44 for 2016
was approved. It aims to create an attractive environment for investments that promote
economic development through the reduction of income tax outside the Development
Zones and in the least developed areas in the Kingdom. The regulation specified the areas
that are considered least developed and identified the activities that are excluded from this
reduction.
Under the provisions of Articles 4 and 5 of this regulation, the areas that were categorised
as least developed and enjoy the reduction in income tax are divided into four categories;
each category enjoys a reduction in income tax on their activities for a period of 20 years.
Category A includes the Northern Valley District, Deir Alla District, Shouneh Al-Janoubieh
District, the Southern Valley District, Rweished District, the Northern Desert District, the
North Western Desert District, Al-Azraq Province, Al-Jiza District except for the borders of
the new Al-Jiza municipality, Al-Moakar District except for the borders of Al-Moakar
municipality, and the Governorate of Aqaba except for the Aqaba Special Economic Zone.
The reduction rate for this category is 100%.
Category B includes the Governorates of Maan, Tafileh, Karak, and Ajloun. The reduction
rate for this category is 80%.
Category C includes the Governorates of Jarash, Mafraq, and Irbid except the borders of
the Greater Irbid Municipality. The reduction rate for this category is 60%.
Category D includes the Governorates of Madaba, Balqa, Amman except for the Greater
Amman Municipality, and Zarqa except for the borders of Zarqa Municipality and Russaifeh
Municipality. The reduction rate for this category is 40%.
Trade and Free Trade Agreements
The most important agreements are:
Jordan joining the World Trade Organisation in 2000, which led to the opening of the
markets of 150 countries for Jordanian exports in goods and services, and provided new
opportunities of access to other countries within a clear and transparent environment of
laws, regulations, and procedures.
A series of regional trade agreements, such as the Jordan Partnership Agreement with the
European Union, Agadir Agreement, Free Trade Arab Agreement, the free trade agreement
between Jordan and the European Free Trade Association, and the adoption of the Euro-
Mediterranean simplification of the rules of the Origin System, which includes the decision
Pre-Feasibility Study Establishment of A Commercial Shopping Center (Mall) - Zarqa
15
to simplify the rules of the origins of Jordanian products between Jordan and the European
Union came into effect on July 19, 2016, and will remain in effect until December 31, 2026.
A series of bilateral trade agreements with many countries, such as the free trade
agreement between Jordan and the United States of America, the Qualified Industrial
Zones Agreement, the free trade agreement between Jordan and Singapore, the free trade
agreement with Turkey, the free trade agreement with Canada, and many other
agreements.
Jordan has signed more than 35 agreements with Arab and foreign countries in order to
prevent double taxation between Jordan and these countries, thus protecting investors’
rights.
The Agreement of Promotion and Protection of Investments and the Movement of Capital
between the Arab Countries was signed in 2000 with 11 Arab countries who are members
of the Arab Economic Unity Council, in order to establish an appropriate environment for
investments and economic cooperation between investors in the Arab countries, thus
pushing and stimulating investment activities by providing encouragement and mutual
protection for Arab investments.
Human Development Report for 2015
The Human Development Report that was issued by the United Nations Development Program
in 3915 showed that Jordan fell 2 points to number 89. Please note that Jordan’s place on the
Human Development Report index value has improved slightly.
Global Competitiveness Report
The Kingdom’s rank has improved by one point in the Global Competitiveness Report for the
year 2016/2017, at 63 out of 138 countries compared to 64 out of 140 countries in the
2015/2016 report. It is considered an insignificant improvement, especially because of the
reduction in the number of countries participating in this year’s report. Amongst the Arab
countries, Jordan was ranked after the United Arab Emirates, Qatar, the Kingdom of Saudi
Arabia, Kuwait, and Bahrain, who were ranked 16, 18, 29, 34, and 39, respectively.
Doing Business Report
In the Doing Business Report that was issued by the World Bank Group, Jordan is still ranked
118, up one rank from the 2016 report, because of the variation in the performance of the
different sub-indicators. Jordan ranked ninth among the Arab countries; the United Arab
Emirates was ranked first among the Arab countries at 26, followed by Bahrain at 63 and Oman
at 66.

Pre-Feasibility Study Establishment of A Commercial Shopping Center (Mall) - Zarqa
16
2.5 The Economic Environment in the short and medium term
Risks analysis implemented by BMI indicates that the Jordan's political and economic risks in the
short and medium term are less than the overall average of the world and the Middle East. The
state's risks and the operational risk are estimated to be within the acceptable levels. The
international institutions' forecasts point out that the economic and foreign trade indicators are
expected to achieve acceptable rates of growth with the exception of the continued increase in
internal and external indebtedness.
Table :2 Assessment of short and long-term risks
Long term Short term Operational
risks State risks political Economic political economic
Jordan 63.1 39.2 66.6 46.2 58.7 55.4
Turkey 60.2 49.4 58.4 56.9 55.9 56.1
Egypt 53.3 45 52.4 48.7 42.9 47.5
Lebanon 45.8 54 55.4 53.5 44.2 49.5
West Bank and Gaza
33.1 38.1 32.2 36.5 32.5 34.3
Syria 22.9 24.4 22.4 23.6 29.3 26.1
Regional average 49.4 46.9 51.2 48.7 46.6 48.3
global average 64.1 50.7 61.3 51.9 49.8 54.6 Source: the economy and state risks, IHS, 15/09/2016
Table :6 The most important key economic indicators 2016-2020
Indicator 2016 2017 2018 2019 2020
The growth rate of GDP 2.6 2.7 2.8 3.2 3.1
GDP (in USD billions) 39.6 42.1 44.8 47.8 50.9
Population (In millions) 9.8 10.1 10.4 10.7 11.0
Consumer Price Index (% change) -0.7 1.8 3.3 4 3.2
Exports (in USD billions) 7.3 7.6 8.2 8.8 9.6
Imports (in USD billions) 18.3 19.2 20.1 21.3 22.8
Foreign direct investment, the net value (in USD billions)
1.5 1.5 1.6 1.6 1.7
Foreign direct investment, the net value (% of GDP)
3.7 3.7 3.6 3.4 3.3
Foreign exchange reserves (in USD billions) 13.9 14.9 15.7 16.8 17.7
Total external debt (in USD billions) 24.4 27.8 30.7 33.7 36
Total external debt (% of GDP) 61.6 66 68.6 70.4 70.6
Total external debt (% of foreign currency earnings)
127.3 138.3 143.6 147.5 147.8
Source: the economy and state risks, IHS, 15/09/2016
Pre-Feasibility Study Establishment of A Commercial Shopping Center (Mall) - Zarqa
17
3. Market Study
3.1 Project Description
The project is the establishment of a Commercial Shopping Mall (Mall) in the city of Zarqa, to
provide leasing services for the hypermarkets, restaurants, shops to sell clothing, footwear
leather products, electronics, banking services and recreational center for children and adults, ...
etc. These services will be provided in a safe and clean environment within a six-storey building,
as follows:
Two floors for parking (B2, B3), with an area of 9,000 m2 per floor and a capacity of
more than 800 cars.
Four floors dedicated to leasing shops and commercial and recreational activities above
mentioned, with an area of about 7,500 m2 per floor, or a total area of 30,000 m2,
detailed as follows:
o The first basement floor includes the hypermarket and services shops, such as
laundry, ironing, bags and gifts shops... etc.
o The ground floor, which serves as the main floor and has the main and external
entrances to the mall, and include the major stores for clothing, shoes,
electronics and other. This floor usually includes famous international shops and
brands chains, or what comes after in level, whether international or local shops
located in the governorate and has its reputation and market share.
o First floor, which includes major commercial shops, as it preferably to rent one
shop of the same classification, in addition to other shops.
o The second floor includes a recreational games center with an area of 3,300 m2
and a height that exceed 10 meters in some parts to include games that suit all
members of the family. The floor also includes famous restaurants, cafe, juice
and sweet shops, with an attempt to lease one shop of the same classification.
o All floors contain small kiosks placed in strategic places inside the mall, and thus
increase the percentage of space exploitation and increase the rented area.
These kiosks are often used for fast-rotating goods such as candies, ice cream,
potato, chips, mobile accessories and gifts ... etc.
Guarding, cleaning and lighting services for all entrances and corridors of the mall, to
ensure a permanent safe and clean environment.
The Mall will be designed to comply with international and local malls requirements, taking into
consideration the needs of the Governorate’s citizens in relation to their desire to obtain
shopping and entertainment services very similar to what are found in Amman, and in a safe
environment with a large number of parking spaces.
Pre-Feasibility Study Establishment of A Commercial Shopping Center (Mall) - Zarqa
18
3.2 Expected Services Description
The expected project services include the provision of areas for rent, at least for the following:
The hypermarket.
Restaurants (franchise or local).
Clothing, shoes, accessories gifts and perfumes stores (international and local) similar to
malls in Amman and the Gulf States.
Electronics shops.
Banking services.
Services shops, such as a pharmacy, Dry Cleaning, Ironing steam and plated jewelry…
etc.
Bags and gifts shops of leather products.
Major Telecommunications Companies such as Zain, Orange, and Umniah.
Famous and reputable cafes.
Recreational Center for children and adults.
Safe and clean environment.
Car parking for mall shoppers and visitors for more than 800 cars inside the mall, and
about 100 cars in front of the mall.
Others, such as kiosks, which often used to sell candies, ice cream, chips, potatoes and
mobile phone shops and accessories ... etc.
3.3 Demand Analysis
The demand on the services provided by the mall is affected by:
- The number of population.
- The intensity of commercial activity.
- Crowding of the shopping areas in the Governorate and absence of parking spaces.
- Rent prices.
- Changes in shopping habits.
Since currently there are no Malls in the Zarqa city, but there are hypermarkets chains such as
Safeway (two branches) and Sameh Mall (4 branches), we will reference in this part to the main
internationally and locally recognized criterions to measure the success of the idea of
establishing the mall. The most important of these criterions is “the area that the Mall covers for
each person who will deal with the mall services “Per capita mall space - PCMS". In order to
determine this criterion, we will resort to the following data regrading the number of
population, as the Zarqa Governorate is considered the third Jordanian Governorate in terms of
population as the number of residents of Zarqa Governorate is estimated at 1.36 million people,
which accounts for 14% of the total population of the kingdom.

Pre-Feasibility Study Establishment of A Commercial Shopping Center (Mall) - Zarqa
19
Considering the Governorate geographical area, the population density is up to 286.7 persons /
km2, or almost twice and a half as much as the national average. However, this density varies
from one District to another inside Zarqa Governorate, as the density is up to 175.4 persons /
km2 in Zarqa Qasabah District to reach a maximum of (10853.6 person / km2) in the District of
Rusaifa. At the level Sub-Districts in the District of Zarqa, the population density varies
dramatically, reaching the lowest in the Al-Zraq Sub-District of about 13.2 people / km2 ,while
the maximum in the Zarqa Sub-District up to 2502.4 people / km2.
Table :7 Population and Population Density in Zarqa Governorate for 2015
Population
density
(person /
km2)
Area /
Governorate
Area
Area
(km2)
Population /
Governorate Population Administrative Divisions
1,5.4 76.1% 4574.4 58.8% 802265 Zarqa Qasabah District
3593.4 5.4% 259.3 4,.5% 648882 Zarqa Sub-Districts
154.1 2.4% 160.2 1.8% 34682 Berin Sub-District
2,1.2 4.2% 206.6 5.6% ,6,92 Dolail Sub-District
12.3 83.7% 3948.3 2.8% 5177, Al-Zraq Sub-District
19852.6 9.7% 44.4 25.2% 481799 District of Rusaifa
566.8 2.9% 142.4 5.7% 89,12 District of Al-Hashemiyah
386., 199.9% 4761.3 199% 12648,8 Total Zarqa Governorate
19,.2 88793.5 7521,13 The kingdom
5.4% 14.2%
Percentage of the
Governorate to the
Kingdom
Source: Department of Statistics, The General Census of Population and Housing in 2015, the calculation the study
team
It is noteworthy that the proposed Mall site (New Zarqa and near the District of Al-Hashemiyah)
covers more than half the population of Zarqa Qasabah District, in addition to the District of Al-
Hashemiyah, as it covers a circle with radius of a distance that can be traveled in a quarter of an
hour drive, this means about 500,000 people by the year 2020, which is the expected date to
launch the Mall. And in case of expanding the circle to cover the area traveled in half an hour by
car, and then it can be said that the mall services will cover more than 1.2 million people.
By dividing the two figures on the Mall area which is amounted to 30,000 m2, we find that the
number of people covered by the mall services per square meter of the mall equals 16.67
person / m2 or 1.55 person / ft2 of the people who are 15-minute away by car. For those who
are 30-minutes drive, the coverage rate stands at 40 people / m2 or 3.72 person/ft2. According
to international studies, the coverage rate of up to 4 persons / ft2 is considered appropriate. And
by assuming that the average visits to the Mall is six times a year by the people of no more 15
minutes drive, while those who are between 15-30 -minutes away by car, they will visit the mall

Pre-Feasibility Study Establishment of A Commercial Shopping Center (Mall) - Zarqa
20
twice a year. With the adoption of these figures, we find that the average number of daily
visitors to the mall will be more than 8,200 people on most days of the year, and will reach more
than 12 thousand visitors during summer and holiday seasons and Back to School Festival.
To determine the purchasing power of visitors, we will use the results of the Household
Expenditure Survey in 2013, and reflecting them on the potential customer numbers, in order to
get to the second criterion, which measures how much a person would spend on a range of
goods and services provided by the Mall divided by the Mall area. The following tables show the
average household and per capita expenditure on a range of goods and services provided by
rented stores in the Mall.
Table :8 The Annual Average Household and Per Capita Expenditure on Food items in Zarqa
Governorate
Food Average household
expenditure (JD)
Average per capita
expenditure (JD)
Grains and Their Products 234.4 63.3
Meat and Poultry 661.1 129.0
Fish 45.7 9.0
Dairy Products and Eggs 491.8 78.4
Oils and Fats 155 30.2
Fruits 165., 32.3
Vegetables 383.3 55.1
Dry and Canned Legumes 34.8 4.8
Spices and Food Additives 54.8 10.7
Nuts 43.4 8.3
Sugar and its Products, and Honey 187.6 37.0
Tea, Coffee and Cocoa 113 21.9
Other Food 338.2 44.5
Drinks and Beverages 145 28.3
Total 2833 552.7
Table :9 Annual Average Household and Per Capita Expenditure on Tobacco and Cigarettes in Zarqa
Governorate
Average per capita expenditure (JD)
Average household expenditure (JD)
Tobacco and Cigarettes
74.6 484., Tobacco and Cigarettes
74.6 484., Total

Pre-Feasibility Study Establishment of A Commercial Shopping Center (Mall) - Zarqa
21
Table :11 Annual Average Household and Per Capita Expenditure on beauty and personal care
products in Zarqa Governorate
Average per capita expenditure (JD)
Average household expenditure (JD)
Beauty and personal care materials
45.0 165.4 Beauty and personal care materials
Table :11 Annual Average Household and Per Capita Expenditure on clothing and footwear in Zarqa
Governorate
Average per capita expenditure (JD)
Average household expenditure (JD)
clothing and footwear
8.9 45., Men Ready to Wear Clothing
13.9 ,1.3 Women Ready to Wear Clothing
13.9 ,1.2 Boys and Girls Ready to Wear Clothing
0.2 1 Fabrics, and cloth design and embroidery costs
9.4 48.4 Footwear
46.4 32,.6 Total
Table :12 Annual Average Household and Per Capita Expenditure on housing and its accessories in Zarqa
Governorate
Average per capita expenditure (JD)
Average household expenditure (JD)
Housing and its accessories
13.6 67., Furniture, carpets and bedspreads
9.3 4,.6 Household equipment
2.4 13.5 Utensils and household items
20.8 196., Household Cleaning Products
46.1 326.5 Total Source: 2013 Survey household income and expenditure survey, the Department of Statistics.
* Selected varieties such as those that can be sold in the Mall.
Table :13 Annual Average Household and Per Capita Expenditure on Products that can be Sold in the
Mall
Average per capita expenditure (JD)
Average household expenditure (JD)
Range of goods and services
552.7 3822.9 Food
74.6 484., Tobacco and cigarettes
45.0 165.4 Beauty and Personal Care
46.4 32,.6 Clothing and footwear
46.1 326.5 Housing and its accessories
19.2 53.3 Culture, recreation and sport
12.5 64.3 other consumer expenses
807.6 4,073.7 Total * The Calculation of the Study Team

Pre-Feasibility Study Establishment of A Commercial Shopping Center (Mall) - Zarqa
22
Accordingly, the total expenditure on goods and services similar to what is found in the Mall in
Zarqa Governorate amounted to 969.12 million JD. By assuming that the new Mall will receive
20% of the this spending amount, then the spending rate in the Mall will be close to 194 million
JD, or equivalent of 6,460 JD per square meter, depending on visitors from nearby areas (30
minutes drive by car).
Overview of Main Competitors
There are many markets in Governorate, the main and the largest is the main market in the
Business District and the New Zarqa markets. As for the Malls, there are no Malls in the city, but
there are hypermarket chains such as two Safeway branches, and four Sameh Mall branches,
and there are no chains for Carrefour or C-Town. Thus there are no direct competitors for the
proposed Mall. However, the following tables show an overview of the main Malls, which may
be similar to the proposed Mall, as well as the famous Malls in Amman in order to identify their
main characteristics, advantages and strengths, so they can serve as a guide to the proposed
mall to the extent possible.
Areefa Mall Name
Tabarbour - Near Workshops Circle Location
The mall was established on a land with an area of 16 dunums, and a built-up area of about 18,000 m2. The mall consists of four floors, and includes a variety of shops and a hypermarket in addition to a series of restaurants, and offers a variety of banking services, and contains a large number of parking spaces. The estimated number of visitors to the mall is almost 5,000 visitors a day. Each shop has an area of 30 m2 at a rental cost estimated at 500 JD per square meter per year.
General Description
The mall includes a hypermarket (Sameh Mall), which offers a diverse range of services, including food, beverages, clothing, personal care and household products.
The mall includes 19 restaurants.
The mall has a parking lot with an estimated area of about 10 dunums.
The mall offers banking services, through banks branches.
The mall includes one recreational center.
Main Services
Source: Field studies and multiple interviews of the Study Team.
Highway Mall Name
Amman- Zarqa Highway, next to Jawad Bakeries Location
The mall was established in 2016, and has not been opened yet. The Mall is established on a land with an area of 3794 m2, and a boilt-up area estimated at 6,000 m2. The mall consists of two floors with an area of 3000 m2 per floor, and includes a variety of shops and a number of restaurants and cafes, in addition to a hypermarket and a parking area. The Mall offers banking services through the banks, and has a
General Description
Pre-Feasibility Study Establishment of A Commercial Shopping Center (Mall) - Zarqa
23
recreational center on the second floor. Each shop has an area of 28 m2 at a rental cost of 7,000 JD for the first year and 8,000 JD for the second and third years (equivalent to 250 JD per square meter per year) as the contract period is for 3 years, and can be renewed with the approval of both parties.
The Mall includes hypermarket (Arjan Mall) with an area estimated at 1,000 m2, which offers a diverse range of services, including food, beverages, clothing, personal care and household products.
The Mall includes 14 restaurants and one cafe.
The Mall includes parking spaces for about 270 cars.
The Mall offers banking services, through banking branches
The Mall includes one recreational center on the second floor.
Main Services
Source: Field studies and multiple interviews of the Study Team.
Bab Mecca Mall Name
Yajouz Road - Northern Mountain Traffic Light Location
Bab Mecca Mall was established on leased land from the Municipality of Rusaifa on an area of 2,800 m2 for a period of 30 years at a cost of 30,000 JD per year. The built-up area is about 4,500 m2. The mall consists of 4 floors and offers a variety of services from various shops that spread over the ground and first floors, and a hypermarket on the first floor, and a recreational center on the second floor, in addition to a number of restaurants, cafes and ATMs. The number of visitors to the mall estimated at 2,000 visitors a day in the summer, and between 200 to 500 visitors a day in the winter. Each shop has an area of 18 m2 at a rental cost that varies according to floor, as it estimated at 400 JD per month for the first floor (equivalent to 260 JD per square meter per year), in addition to 3,000 dinars in case of shop goodwill, and 450 JD a month for shops in the basement (which is equivalent to 300 JD per meter per year) in addition to 15,000 JD in case of shop goodwill. The ground floor is full, while the first floor has two vacant stores.
General Description
The Mall includes Hypermarket (Carrefour), which offers a diverse range of services, including food, beverages, clothing, personal care and household products.
The Mall includes two restaurants and one a café.
The Mall has a parking space to accommodate about 100 cars.
The Mall offers banking services, through banks branches.
The Mall includes one recreational center on the second floor.
Main Services
Source: Field studies and multiple interviews of the Study Team.
City Mall Name
Amman Location
The Mall was established in 2007 by Al-Khair Company for Jordanian Real General Description
Pre-Feasibility Study Establishment of A Commercial Shopping Center (Mall) - Zarqa
24
Estate Investments in the city of Amman, with an area of 160,000 square meters. The mall consists of five floors with more than 150 international stores and a series of international restaurants and cafes. The Mall includes parking space with valet parking service. Number of visitors to the mall is estimated at 30,000 visitors a day.
The Mall includes more than 150 shops offering a variety of services from clothes, perfumes, various accessories to electronics, gifts and books shops.
The Mall includes a Hypermarket (Carrefour), which offers a diverse range of services, including food, beverages, clothing, personal care and household products.
The Mall includes about 40 restaurant and café, in addition to a hall for restaurants.
The Mall includes parking space consists of three floors, and can accommodate up to 2400 car with valet parking service.
City Mall includes 12 different banks.
The Mall includes a pharmacy.
The Mall includes a movie theater.
The Mall includes a big recreational games center with an area about 6000 square meters, to accommodate about 1,000 people, and includes nine main games in addition to about 81 video games.
The Mall includes branches of different Telecommunications Companies.
Main Services
Source: The official website of the Mall.
Mecca Mall Name
Jordan, Amman Location
The Mall was established in 2003 by Kurdi Group in the City of Amman, with an area of 195,000 square meters. The mall consists of four floors, in addition to the ground floor. The Mall includes more than 200 international stores as well as a hypermarket, bank services and communication services. The estimated number of visitors to the mall is estimated at 35,000 visitors a day.
General Description
The Mall includes more than 150 shops offering a variety of services from clothes, perfumes, various accessories to electronics, gifts and books shops.
The Mall includes a hypermarket (Miles), which offers a diverse range of services, including food, beverages, clothing, personal care and household products.
The Mall includes about 35 restaurants and café, in addition to a hall for restaurants.
The Mall includes parking space that can accommodate more than 1,000 cars.
The Mall offers banking services, through banks branches.
The Mall includes a pharmacy.
Main Services

Pre-Feasibility Study Establishment of A Commercial Shopping Center (Mall) - Zarqa
25
The Mall includes a movie theater that has seven main display screens.
The Mall includes a recreational games center.
The Mall includes branches of different Telecommunications Companies.
Source: The official website of the Mall.
Taj Mall Name
Jordan, Amman Location
The Mall was established in 2011 in the City of Amman, with an area of 150,000 square meters. The Mall includes about 190 international stores as well as a hypermarket, bank services and communication services.
General Description
The Mall includes more than 150 shops offering a variety of services from clothes, perfumes, various accessories to electronics, gifts and books shops.
The Mall includes a hypermarket (Cosmo), which offers a diverse range of services, including food, beverages, clothing, personal care and household products as well as electrical appliances.
The Mall includes about 50 restaurants and cafes, in addition to a hall for restaurants.
The Mall includes parking space that can accommodate more than 1,500 cars.
The Mall includes 16 different cinema halls, with a total area of 7,000 square meters that can accommodate 1,700 people.
The Mall includes a recreational games center (Magic Planet).
The Mall offers banking services, through banks branches.
The Mall includes a pharmacy.
The Mall includes branches of different Telecommunications Companies.
Main Services
Source: The official website of the Mall.
Irbid City Mall Name
Jordan, Irbid Location
The Mall was established in 2013 on an area of 18 dunums and a built-up area of 87,000 square meters by Marseille Real Estate Investment Company. The mall consists of three floors in addition to the ground floor and the basement. It offers a variety of services that include a hypermarket, a range of restaurants and cafes, banking services, telecommunication services and entertainment hall.
General Description
The Mall includes about 170 shops offering a variety of services from clothes, perfumes, accessories shops, in addition to electronics, gifts and books shops.
The Mall includes a hypermarket (Carrefour) with an area estimated at 10,000 square meters, which offers a diverse range of services, including food, beverages, clothing, personal care and household products.
Main Services
Pre-Feasibility Study Establishment of A Commercial Shopping Center (Mall) - Zarqa
26
The Mall includes Aabout 35 restaurants and cafes, in addition to the restaurants hall.
The Mall includes a parking space that can accommodate more than 1,000 cars.
The Mall includes banking services through banks and ATMs. Source: The official website of the Mall.
Istiklal Mall Name
Amman - Istiklal Street Location
The Mall was established in 2005 on an area of 12 dunums and a built-up area of 40,000 square meters. The Mall consists of 4 floors and a several local shops and brands. It contains many cafes and restaurants, and it provides outdoor Parking. The number of visitors to the mall is estimated at 18,000 to 25,000 visitors a day.
General Description
The Mall includes about 200 shops offering a variety of services from clothes, perfumes, accessories shops, and a variety of electronics, gifts and books shops.
The Mall includes a hypermarket (C-Town), which offers a diverse range of services, including food, beverages, clothing, personal care and household products.
The Mall includes parking space that can accommodate more than 10,000 cars.
The Mall includes recreational games center in the second-floor, and has different games for kids and adults.
Main Services
Source: Library Studies of the Studying Team.

Pre-Feasibility Study Establishment of A Commercial Shopping Center (Mall) - Zarqa
27
3.4 Marketing Strategy
The project targets all investors in the commercial and the services sectors from all over the
kingdom and in Zarqa Governorate, to enable the residents of Zarqa Governorate to get
shopping and entertainment services in one place (Mall) that meet the needs of all family
members.
Expected Services and Products
The expected project services include the provision of areas for rent, at least for the following:
The hypermarket.
Restaurants (franchise or local).
Clothing, shoes, accessories gifts and perfumes stores (international and local) similar to
malls in Amman and the Gulf States.
Electronics shops.
Banking services.
Services shops, such as a pharmacy, Dry Cleaning, Ironing steam and plated jewelry…
etc.
Bags and gifts shops of leather products.
Major Telecommunications Companies such as Zain, Orange, and Umniah.
Famous and reputable cafes.
Recreational Center for children and adults.
Safe and clean environment.
Car parking for mall shoppers and visitors for more than 800 cars inside the mall, and
about 100 cars in front of the mall.
Others, such as kiosks, which often used to sell candies, ice cream, chips, potatoes and
mobile phone shops and accessories ... etc.
Expected Prices
Since currently there are no malls in Zarqa, the prices found in nearby Malls in Amman, Rusaifa
and Irbid have been reviewed. In addition, the prices in the commercial markets scattered in
Zarqa City have been collected. The prices ranged from 4.000 to 10.000 JD per year for the shop,
which has an area about 30 square meters. By taking the average of the leased space of 20-30
square meters, then the price per square meter will range from (133-500) JD / year / m2. Thus,
we have determined the pricing strategy for the project in order to fit with the prevailing prices
in Zarqa City, taking into account the additional services provided by the mall compared to those
provided by the current markets. The following is the expected average rent prices in the Mall.
Pre-Feasibility Study Establishment of A Commercial Shopping Center (Mall) - Zarqa
28
Table :14 Expected Average Rent Prices
Statement Average Annual Rent (JD / m2)
Hypermarkets 199
Banks 335
Services Shops 159
Shops with large spaces 139
Regular Shops (20-30 m2 for the shop) / Ground Floor 239
Regular Shops (20-30 m2 for the shop) / First Floor 335
Recreational Games Center 135
Restaurants 389
Kiosks 1,000
Mall Services Fee (lighting and air conditioning the walkways
in summer and winter, security guard, maintaining the
cleanliness of Mall walkways and an effective Mall
Management that can be referred to)
15% of the annual rent
Promotion
Promotional strategy for the project includes the following:
Focusing on the administrative staff who is experienced in marketing and management
of shopping malls, in order to attract the most potential tenants of the Mall.
Offering price discounts and payment facilities for the first tenants who are interested
to rent in the mall specially from of international companies and agencies in order to
encourage them. In addition, a series of incentives and discounts can be offered for
locally known major traders in the Kingdom and the Governorate.
Designing a website and using the social media.
Brochures for the Mall and its services.
Advertisements in local newspapers and other media at the beginning of the project.
Placing billboards on the main streets and on roads leading to the Mall.
Conducting a grand opening ceremony and invite all concerned parties to this
ceremony.
Allocating a big budget for promotion, as the mall needs a constant publicity and
advertising, through all means of publicity, advertisement and media with a focus on
recurring festivals and events during the year.
Selling
Sales strategy for the project includes the following:
Direct selling to potential tenants, such as hypermarkets, chain stores and international
and local commercial brands, etc.
Services
Services Provision Strategy for the project includes the following:

Pre-Feasibility Study Establishment of A Commercial Shopping Center (Mall) - Zarqa
29
Qualified management team that includes the Mall Manager, Marketing Manager,
maintenance technicians and administrators who follow the needs of the tenants.
The presence of a Security and Protection Company that provide security services to the
Mall, the tenants and the Mall customers.
The presence of a Cleaning Company that conduct cleanliness of the passageways and
entrances to the Mall around the clock.
Providing air conditioning in summer / winter.
Providing enough spaces for cars parking inside and outside the mall, even during peak
times.
Membership in the International Council of Shopping Centers (ICSC), knowing that the
membership costs is reasonable as it does not exceed US 800 a year, and in return, the
mall will get many services either free or at discounted prices, such as mentioning the
Mall name in the International Directory of Shopping Centers, as this will facilitates the
possibility of attracting investors from leading international brands, as well as enhance
the promotion of the Mall. It should also be noted that there is an international
university emanating from this Assembly “University of Shopping Centers”, which is
concerned with the teaching of disciplines needed for Malls and shopping centers.
Obtaining local and international quality certificates, which give more confidence to
tenants and mall visitors.
Respecting the rules of hygiene, cleanliness and public safety.
Maintenance of equipment on an ongoing basis.
Attaching great importance on the decent appearance of the employees.
Attaching great importance on the good and decent treatment of tenants.
Attaching great importance on providing new and innovative services, and using the
technology to deal with the tenants and visitors.
Credibility in dealing with tenants.
Conducting promotional activities occasionally, such as kids’ festivals and other, in
addition to joint activities with the tenants to attract more visitors and customers to the
Mall.
3.5 Expected Market Share
As previously mentioned, the Mall is one of its kinds in Zarqa Governorate, and thus its market
share is measured by its designed capacity design, or its ability to accommodate potential
tenants of various fields in the commercial and service sectors. As previously explained, the mall
has been designed to have a total area of 30,000 m2, divided into four main floors, in addition to
two floors for parking area of about 9,000 m2, as each floor can accommodate more than 800
cars.

Pre-Feasibility Study Establishment of A Commercial Shopping Center (Mall) - Zarqa
30
4. Technical Study
4.1 The Designed Capacity
The mall is designed to have a total area of 30,000 m2, divided into four main floors, in addition
to two floors for parking area of about 9,000 m2, as each floor can accommodate more than 800
cars. The following is a description of area distribution:
The basement second and third floor (B2, B3): with an area of each 9,000 m2 allocated for
car parking.
The basement first floor (B1): has an area 7500 m2,and includes a hypermarket, shops,
banks and services shops such as laundry, bags, leather products and gifts shops etc ...
Ground floor GF: has an area 7500 m2, and is considered the main floor in the mall. It
includes all the main entrances to the mall, and the main shops, which includes major
international and local brands. This floor is considered the highest income generating
floor.
First floor: has an area of 7500 m2, and includes shops that need large areas, in addition to
famous shops in the Kingdom and the Governorate.
Second floor: has an area of 7500 m2, and includes recreational games center, restaurants
and cafes.
Kiosks, as they are spread all over the four-storey Mall, and come in small sizes (5-6 m2),
and are placed to fill gaps in sensitive and important places on each floor. They have the
highest rent price.
These details have been reached based on the field survey results and the analysis of the market
size previously mentioned.
It is noteworthy mentioning the importance of paying attention to the “Tenants Mix”, so that
tenants are carefully selected at each floor, while maintaining the non-recurrence of the
powerful competitors, as the presence of a single tenant from each category should be enough.
In special cases, two tenants of the same category may be allowed, taking into account the low
possibility of affecting one another, or affecting other secondary competitor tenants.
In general, it has taken into account the possibility of future expansion through the construction
of new floors on the same building if necessary.
4.2 Required Fixed Assets
The table below shows the total cost of fixed assets, which amounted to 16.7 million JD.

Pre-Feasibility Study Establishment of A Commercial Shopping Center (Mall) - Zarqa
31
Table :12 Total Cost of Fixed Assets of the Mall *
Value (JD) Price (JD) Unit Item
2,000,000 200 10,000 Land m2
2,520,000 140 18,000 Parking floors buildings (2)
11,400,000 380 30,000 The Mall floors buildings (4) **
15,000 - - furniture
30,000 - - Information Technology
700,000 - - Solar Energy System
16,665,000 Total
* The numbers are estimated from the Market Study
** The figures include the cost of engineering supervision, construction and finishing works, all infrastructure
requirements and electromechanical works.
4.3 Required Human Resources
The following table shows the human resources required for the project. The number of
required staff is about 15 employees, with a total salaries of 141,600 JD (administrative: 103,800
JD, and operational: 37,800 JD) annually.
Table :16 Required Human Resources for the Project and its Costs
Operational (JD/annually)
Administrative (JD/annually)
Total salary (JD/annually)
Salary (JD/monthly)
Number of Employees
Item
- 48,000 48,000 4,000 1 Director General
- 5,400 5,400 450 1 Secretariat
14,400 - 14,400 1,200 1 Mall Manager
- 24,000 24,000 1,000 2 Managers (Marketing, and Administrative and Financial)
- 8,400 8,400 700 1 Leasing Administrator
- 9,600 9,600 400 2 Accounting
- 8,400 8,400 259 2 Administrator
12,600 - 12,600 259 3 Technicians
6,000 - 6,000 500 1 Security Officer and Public Relations
4,800 - 4,800 400 1 Procurement
37,800 103,800 141,600
15 Total

Pre-Feasibility Study Establishment of A Commercial Shopping Center (Mall) - Zarqa
32
The following table also shows the general job description of the main jobs required in the
project.
Table :17 General Job Description of the main jobs required in the project
Job Description Job
The Director General shall perform the following tasks:
Directing administrative staff.
Determining the vision, mission and the strategy of the Mall, and reflecting them in all means of communicating with employees, tenants and Mall goers.
Major customers’ files and concluding big deals.
Setting prices for the Mall services, and signing contracts (partnerships).
Following-up and coordinating the work in all the Mall facilities.
Evaluating the success of the Mall in achieving the objectives set for it (the performance).
Reporting the Mall/Company performance to the Board of Directors.
Director General
The Marketing Manager performs the following tasks:
Identifying the available opportunities to attract new tenants and setting priorities to reach them, and the preparation for signing contracts between them and the Director General.
Providing offers and negotiation on fees and prices within the mall's policy to sign new contracts.
Conducting surveys and market research.
Reflecting the needs of customers, and reporting them to the Director General / the Owner.
Preparing for festivals and promotions inside and outside the Mall.
Developing and implementing expansion plans and increase sales.
Documenting all contact information and addresses of customers.
Representing the Mall / Company in meetings related to his/her work.
Marketing Manager
The Mall Manager performs the following tasks:
Managing the Mall smoothly.
Following-up tenants and urged them to abide by the Mall policy and system, in terms of working hours and not disturbing other tenants while doing decoration.
Participating with the Director General and Marketing Manager in developing the Mall policy.
Following-up the movement inside the mall, and keeping the Mall environment safe and clean through following-up the security company and the cleaning company.
Managing the relationship with tenants, and reflecting their needs and reporting them to the Director General.
Maintaining the absence of issues between tenants among themselves for any reason, and to take all possible measures to maintain calm and tranquility in the Mall, and notifying the owner with the main emergency events.
Mall Manager

Pre-Feasibility Study Establishment of A Commercial Shopping Center (Mall) - Zarqa
33
Job Description Job
Managing the operational process of the Mall, and working on their sustainability and following-up the rest of the staff.
Submitting periodic reports to the Director General.
The Leasing Administrator shall perform the following tasks:
Developing a plan for leasing within the Mall strategic plan, in consultation with the Director General and Marketing Manager.
Clarifying and carrying out essential tasks for renting the mall, and bringing in tenants, and thus generate income.
Allocating the required or permitted capital expenditure to the tenants.
Setting specific tasks to the Team Work, to ensure achieving the given and specified dates for delivery.
Setting budget for the leasing activities in consultation with the Director General and the Director of Administrative and Financial.
Developing a plan to deal with the vacant shops (not leased), and those their lease contracts has expired.
Determining the potential increases on the rent cost since the beginning and the duration of each contract, taking into account the rise in the annual price “step - rent and CPI”.
Accelerating the leasing process by following-up the market and competitors, and preparing appropriate proposals for the owner and the tenant.
Leasing Administrator
The Leasing Administrator shall perform the following tasks:
Participating in the preparation of the Mall estimated budget in collaboration with the concerned managers.
Following-up to the preparation, reviewing, amending and adopting the administrative system and organization, which includes the procedures, rules regulations, organizational and functional structure, tasks, competencies, job description cards and a powers list.
Controlling the policies and procedures for financial plans, and making sure they comply with the laws and regulations.
Budget preparation, including salaries, allowances, operating expenses, maintenance and operation programs, projects under manufacturing and new projects.
Following-up cashing and financial performance.
the Director of Administration
and Finance
The Administrative Officer performs the following tasks:
Conducting procedures and policies that ensure the attendance and departure of employees, and paying their financial dues based on their attendance, and recording the employees’ leaves.
Preparing the payroll for the Mall staff, and the reports on the discipline at work.
Following-up periodic purchases and inventory.
Following-up the cleaning company and the security and guarding company under the guidance of concerned Director / Official.
Administrative Officer /
Accountant

Pre-Feasibility Study Establishment of A Commercial Shopping Center (Mall) - Zarqa
34
4.4 Required Licenses
The following table shows the necessary licenses from various authorities to implement the
project.
Table :18 Licenses Required for the Project
Analysis Statement
Ministry of Industry and Trade company registration
Municipality, Social Security, Income and Sales Tax Operation
4.5 Project Timetable
The following figure shows the timeline to implement the project, which amounts to 24 months,
as follows:
Stage
The first year (months) The second year (months)
1
2
3
4
2
6
7
8
9 1
1
11
12
13
14
15
16
17
18
19
21
21
22
23
24
Studies
Design, licensing, approvals and registration of the company
Construction and cleaning
Equipment, furniture
run and Employment and commissioning
Total Duration 24 months
Pre-Feasibility Study Establishment of A Commercial Shopping Center (Mall) - Zarqa
35
5. Financial Study
5.1 Financial Assumptions
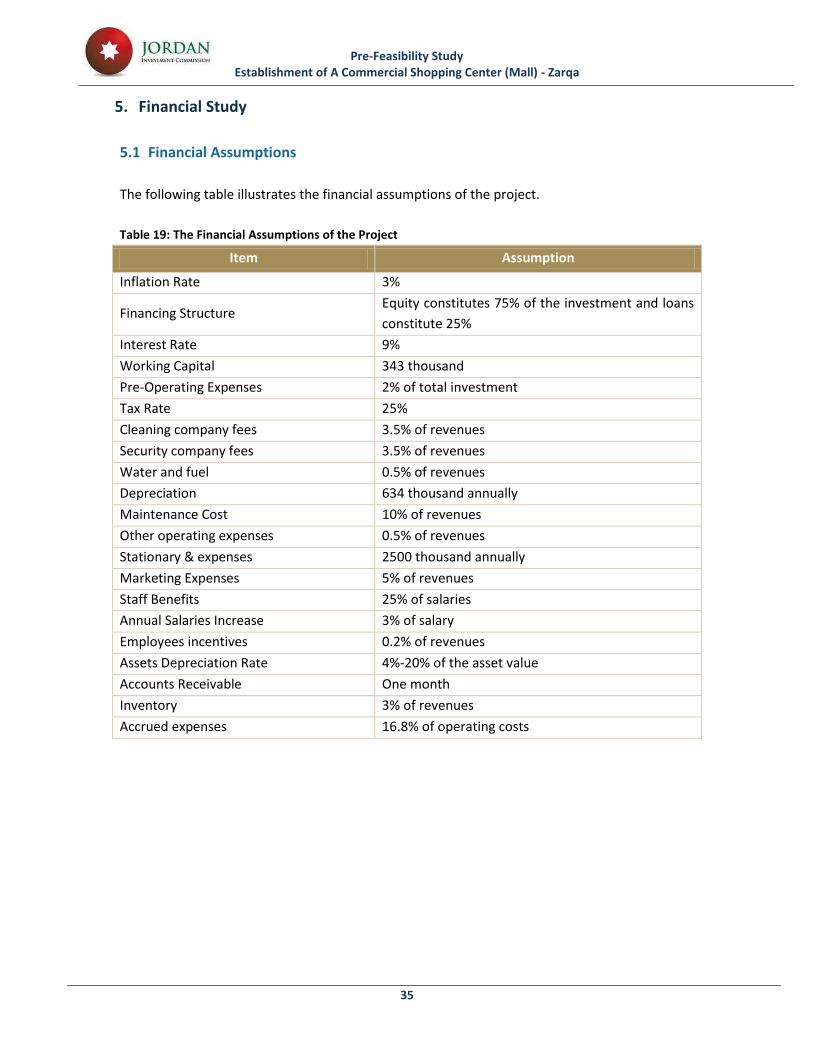
The following table illustrates the financial assumptions of the project.
Table 19: The Financial Assumptions of the Project
Item Assumption
Inflation Rate 3%
Financing Structure Equity constitutes 75% of the investment and loans
constitute 25%
Interest Rate 9%
Working Capital 343 thousand
Pre-Operating Expenses 2% of total investment
Tax Rate 25%
Cleaning company fees 3.5% of revenues
Security company fees 3.5% of revenues
Water and fuel 0.5% of revenues
Depreciation 634 thousand annually
Maintenance Cost 10% of revenues
Other operating expenses 0.5% of revenues
Stationary & expenses 2500 thousand annually
Marketing Expenses 5% of revenues
Staff Benefits 25% of salaries
Annual Salaries Increase 3% of salary
Employees incentives 0.2% of revenues
Assets Depreciation Rate 4%-20% of the asset value
Accounts Receivable One month
Inventory 3% of revenues Accrued expenses 16.8% of operating costs
Pre-Feasibility Study Establishment of A Commercial Shopping Center (Mall) - Zarqa
36
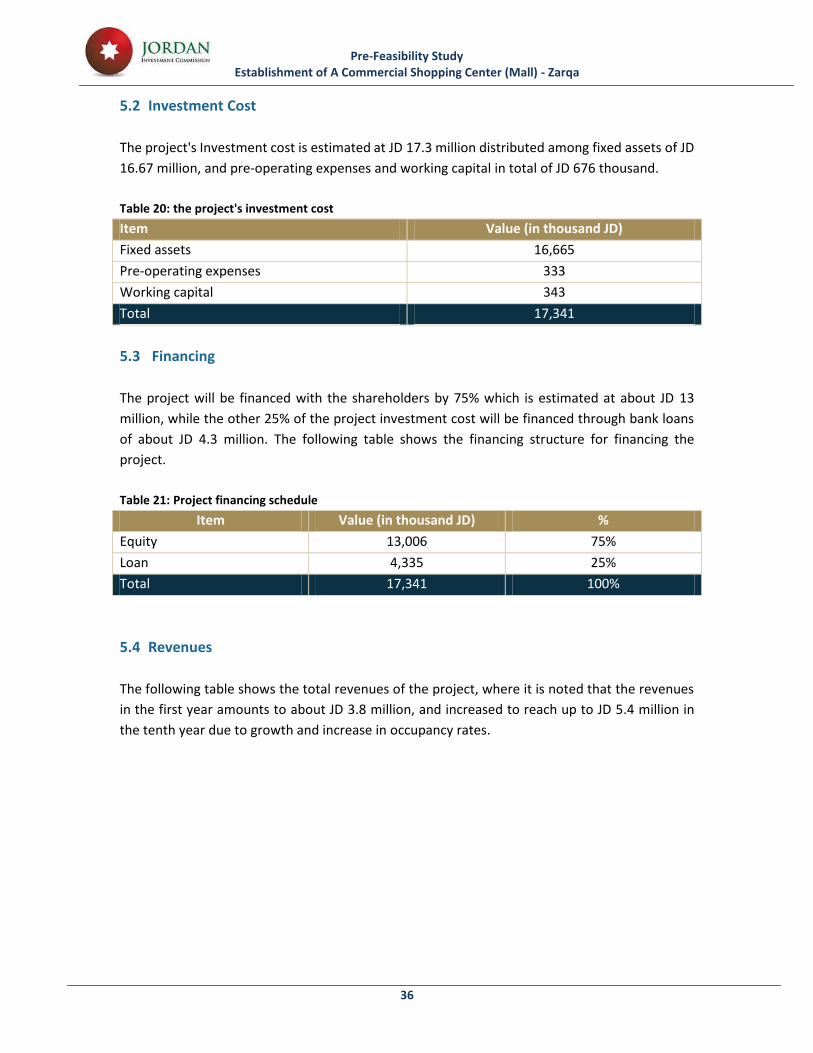
5.2 Investment Cost
The project's Investment cost is estimated at JD 17.3 million distributed among fixed assets of JD
16.67 million, and pre-operating expenses and working capital in total of JD 676 thousand.
Table 20: the project's investment cost
Item Value (in thousand JD)
Fixed assets 16,665
Pre-operating expenses 333
Working capital 343
Total 17,341
5.3 Financing
The project will be financed with the shareholders by 75% which is estimated at about JD 13
million, while the other 25% of the project investment cost will be financed through bank loans
of about JD 4.3 million. The following table shows the financing structure for financing the
project.
Table 21: Project financing schedule
Item Value (in thousand JD) %
Equity 13,006 75%
Loan 4,335 25%
Total 17,341 100%
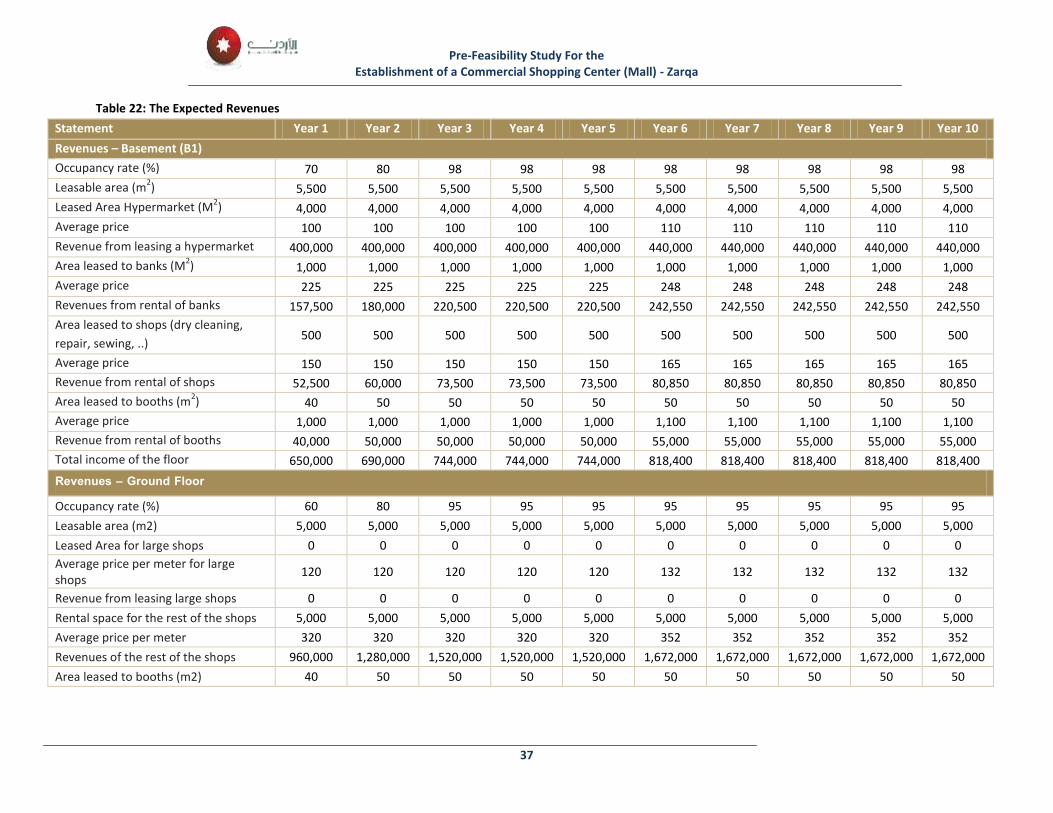
5.4 Revenues
The following table shows the total revenues of the project, where it is noted that the revenues
in the first year amounts to about JD 3.8 million, and increased to reach up to JD 5.4 million in
the tenth year due to growth and increase in occupancy rates.
Pre-Feasibility Study For the Establishment of a Commercial Shopping Center (Mall) - Zarqa
37
Table 22: The Expected Revenues
Statement Year 1 Year 2 Year 3 Year 4 Year 5 Year 6 Year 7 Year 8 Year 9 Year 10
Revenues – Basement (B1) Occupancy rate (%) ,9 89 78 78 78 78 78 78 78 78
Leasable area (m2) 5,599 5,599 5,599 5,599 5,599 5,599 5,599 5,599 5,599 5,599
Leased Area Hypermarket (M2) 4,999 4,999 4,999 4,999 4,999 4,999 4,999 4,999 4,999 4,999
Average price 199 199 199 199 199 119 119 119 119 119
Revenue from leasing a hypermarket 499,999 499,999 499,999 499,999 499,999 449,999 449,999 449,999 449,999 449,999
Area leased to banks (M2) 1,999 1,999 1,999 1,999 1,999 1,999 1,999 1,999 1,999 1,999
Average price 335 335 335 335 335 348 348 348 348 348
Revenues from rental of banks 15,,599 189,999 339,599 339,599 339,599 343,559 343,559 343,559 343,559 343,559
Area leased to shops (dry cleaning,
repair, sewing, ..) 599 599 599 599 599 599 599 599 599 599
Average price 159 159 159 159 159 165 165 165 165 165
Revenue from rental of shops 53,599 69,999 ,2,599 ,2,599 ,2,599 89,859 89,859 89,859 89,859 89,859
Area leased to booths (m2) 49 59 59 59 59 59 59 59 59 59
Average price 1,999 1,999 1,999 1,999 1,999 1,199 1,199 1,199 1,199 1,199
Revenue from rental of booths 49,999 59,999 59,999 59,999 59,999 55,999 55,999 55,999 55,999 55,999
Total income of the floor 650,000 690,000 744,000 744,000 744,000 818,400 818,400 818,400 818,400 818,400
Revenues – Ground Floor Occupancy rate (%) 69 89 75 75 75 75 75 75 75 75
Leasable area (m2) 5,999 5,999 5,999 5,999 5,999 5,999 5,999 5,999 5,999 5,999
Leased Area for large shops 9 9 9 9 9 9 9 9 9 9
Average price per meter for large shops
139 139 139 139 139 123 123 123 123 123
Revenue from leasing large shops 9 9 9 9 9 9 9 9 9 9
Rental space for the rest of the shops 5,999 5,999 5,999 5,999 5,999 5,999 5,999 5,999 5,999 5,999
Average price per meter 239 239 239 239 239 253 253 253 253 253
Revenues of the rest of the shops 769,999 1,389,999 1,539,999 1,539,999 1,539,999 1,6,3,999 1,6,3,999 1,6,3,999 1,6,3,999 1,6,3,999
Area leased to booths (m2) 49 59 59 59 59 59 59 59 59 59

Pre-Feasibility Study Establishment of A Commercial Shopping Center (Mall) - Zarqa
38
Statement Year 1 Year 2 Year 3 Year 4 Year 5 Year 6 Year 7 Year 8 Year 9 Year 10
Average price 1,999 1,999 1,999 1,999 1,999 1,199 1,199 1,199 1,199 1,199
Revenue from rental of booths 49,999 59,999 59,999 59,999 59,999 55,999 55,999 55,999 55,999 55,999
Total income of the floor 1,000,000 1,330,000 1,570,000 1,570,000 1,570,000 1,727,000 1,727,000 1,727,000 1,727,000 1,727,000
Revenues – First Floor Occupancy rate (%) ,9 89 75 75 75 75 75 75 75 75
Leasable area (m2) 5,599 5,599 5,599 5,599 5,599 5,599 5,599 5,599 5,599 5,599
Leased Area for large shops 2,599 2,599 2,599 2,599 2,599 2,599 2,599 2,599 2,599 2,599
Average price per meter for large shops
139 139 139 139 139 123 123 123 123 123
Revenue from leasing large shops 439,999 439,999 439,999 439,999 439,999 463,999 463,999 463,999 463,999 463,999
Rental space for the rest of the shops 3,999 3,999 3,999 3,999 3,999 3,999 3,999 3,999 3,999 3,999
Average price per meter 335 335 335 335 335 348 348 348 348 348
Revenues of the rest of the shops 215,999 269,999 43,,599 43,,599 43,,599 4,9,359 4,9,359 4,9,359 4,9,359 4,9,359
Area leased to booths (m2) 49 59 59 59 59 59 59 59 59 59
Average price 1,999 1,999 1,999 1,999 1,999 1,199 1,199 1,199 1,199 1,199
Revenue from rental of booths 49,999 59,999 59,999 59,999 59,999 55,999 55,999 55,999 55,999 55,999
Total income of the floor 775,000 830,000 897,500 897,500 897,500 987,250 987,250 987,250 987,250 987,250
Revenues – Second Floor Occupancy rate (%) ,9 89 78 78 78 78 78 78 78 78
Leasable area (m2) 5,599 5,599 5,599 5,599 5,599 5,599 5,599 5,599 5,599 5,599
Leased Area for Amusement Park (m2) 2,299 2,299 2,299 2,299 2,299 2,299 2,299 2,299 2,299 2,299
Average price per meter for Amusement Park
135 135 135 135 135 128 128 128 128 128
Revenue from leasing Amusement Park 413,599 413,599 413,599 413,599 413,599 452,,59 452,,59 452,,59 452,,59 452,,59
Rental space for restaurants 3,399 3,399 3,399 3,399 3,399 3,399 3,399 3,399 3,399 3,399
Average price per meter 389 389 389 389 389 298 298 298 298 298
Revenues of leasing restaurants 421,399 473,899 692,689 692,689 692,689 664,948 664,948 664,948 664,948 664,948
Area leased to booths (m2) 49 59 59 59 59 59 59 59 59 59
Average price 1,999 1,999 1,999 1,999 1,999 1,199 1,199 1,199 1,199 1,199

Pre-Feasibility Study Establishment of A Commercial Shopping Center (Mall) - Zarqa
39
Statement Year 1 Year 2 Year 3 Year 4 Year 5 Year 6 Year 7 Year 8 Year 9 Year 10
Revenue from rental of booths 49,999 59,999 59,999 59,999 59,999 55,999 55,999 55,999 55,999 55,999
Total income of the floor 883,700 955,300 1,066,180 1,066,180 1,066,180 1,172,798 1,172,798 1,172,798 1,172,798 1,172,798
Revenues
Revenues of the basement 650,000 690,000 744,000 744,000 744,000 818,400 818,400 818,400 818,400 818,400
Revenues of the ground floor 1,999,999 1,229,999 1,5,9,999 1,5,9,999 1,5,9,999 1,,3,,999 1,,3,,999 1,,3,,999 1,,3,,999 1,,3,,999
Revenues of the first floor ,,5,999 829,999 87,,599 87,,599 87,,599 78,,359 78,,359 78,,359 78,,359 78,,359
Revenues of the second floor 882,,99 755,299 1,966,189 1,966,189 1,966,189 1,1,3,,78 1,1,3,,78 1,1,3,,78 1,1,3,,78 1,1,3,,78
Revenue of mall services allowance 476,295 5,9,,75 641,653 641,653 641,653 ,95,81, ,95,81, ,95,81, ,95,81, ,95,81,
Total Revenues –Thousand JD 3,805 4,376 4,919 4,919 4,919 5,411 5,411 5,411 5,411 5,411
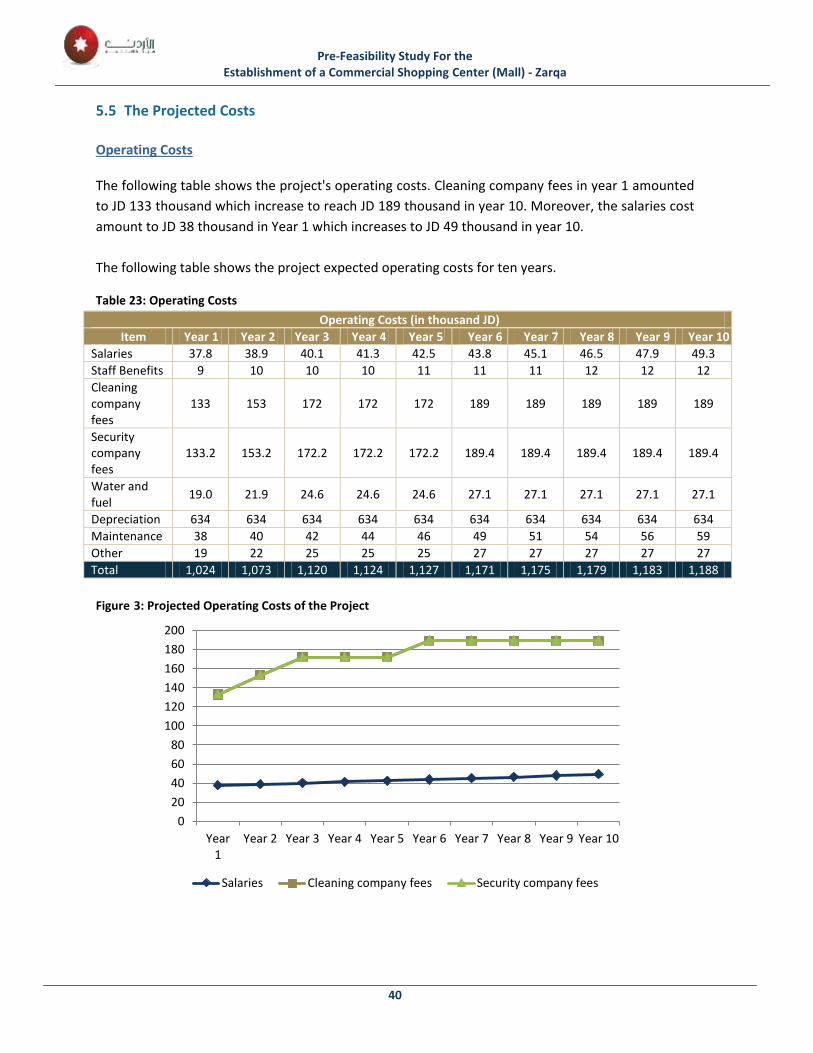
Pre-Feasibility Study For the Establishment of a Commercial Shopping Center (Mall) - Zarqa
40
5.5 The Projected Costs
Operating Costs The following table shows the project's operating costs. Cleaning company fees in year 1 amounted
to JD 133 thousand which increase to reach JD 189 thousand in year 10. Moreover, the salaries cost
amount to JD 38 thousand in Year 1 which increases to JD 49 thousand in year 10.
The following table shows the project expected operating costs for ten years.
Table 23: Operating Costs
Operating Costs (in thousand JD)
Item Year 1 Year 2 Year 3 Year 4 Year 5 Year 6 Year 7 Year 8 Year 9 Year 10
Salaries 37.8 38.9 40.1 41.3 42.5 43.8 45.1 46.5 47.9 49.3
Staff Benefits 9 10 10 10 11 11 11 12 12 12
Cleaning company fees
133 153 172 172 172 189 189 189 189 189
Security company fees
133.2 153.2 172.2 172.2 172.2 189.4 189.4 189.4 189.4 189.4
Water and fuel
19.0 21.9 24.6 24.6 24.6 27.1 27.1 27.1 27.1 27.1
Depreciation 634 634 634 634 634 634 634 634 634 634
Maintenance 38 40 42 44 46 49 51 54 56 59
Other 19 22 25 25 25 27 27 27 27 27
Total 1,024 1,073 1,120 1,124 1,127 1,171 1,175 1,179 1,183 1,188
Figure 3: Projected Operating Costs of the Project
0
20
40
60
80
100
120
140
160
180
200
Year1
Year 2 Year 3 Year 4 Year 5 Year 6 Year 7 Year 8 Year 9 Year 10
Salaries Cleaning company fees Security company fees
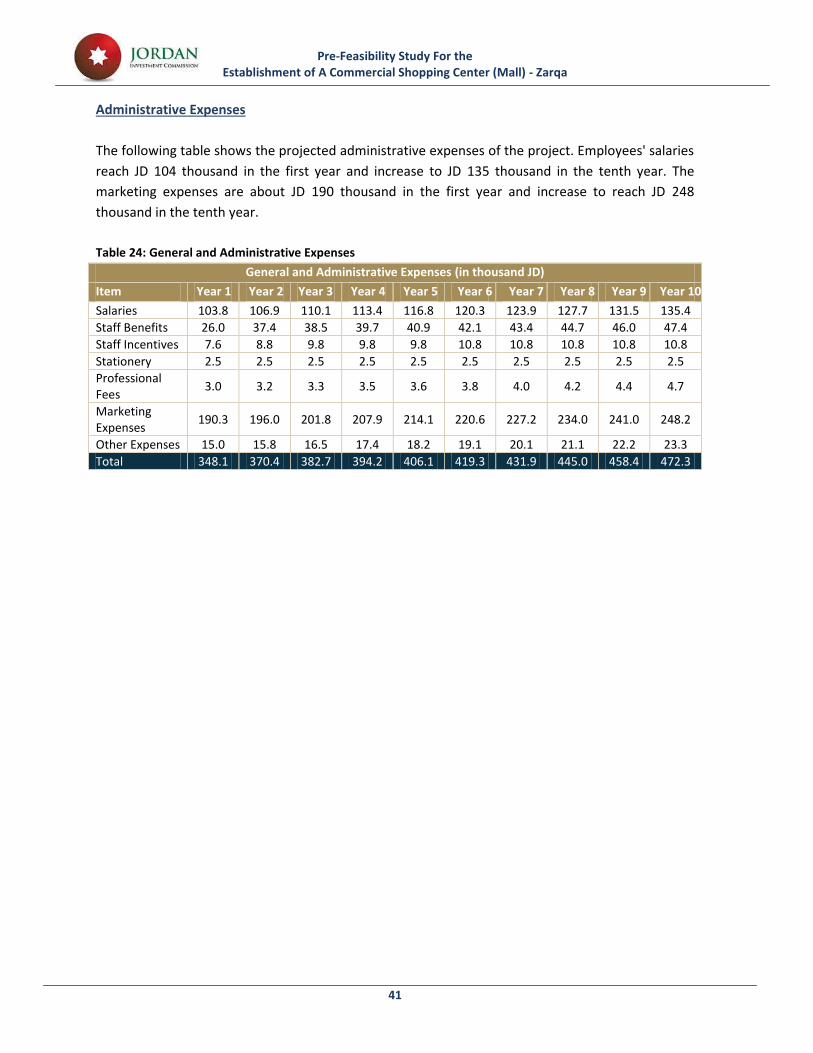
Pre-Feasibility Study For the Establishment of A Commercial Shopping Center (Mall) - Zarqa
41
Administrative Expenses
The following table shows the projected administrative expenses of the project. Employees' salaries
reach JD 104 thousand in the first year and increase to JD 135 thousand in the tenth year. The
marketing expenses are about JD 190 thousand in the first year and increase to reach JD 248
thousand in the tenth year.
Table 24: General and Administrative Expenses
General and Administrative Expenses (in thousand JD)
Item Year 1 Year 2 Year 3 Year 4 Year 5 Year 6 Year 7 Year 8 Year 9 Year 10
Salaries 192.8 196.7 119.1 112.4 116.8 139.2 132.7 13,., 121.5 125.4
Staff Benefits 36.9 2,.4 28.5 27., 49.7 43.1 42.4 44., 46.9 4,.4
Staff Incentives ,.6 8.8 7.8 7.8 7.8 19.8 19.8 19.8 19.8 19.8
Stationery 2.5 2.5 2.5 2.5 2.5 2.5 2.5 2.5 2.5 2.5
Professional Fees
3.0 3.2 3.3 3.5 3.6 3.8 4.0 4.2 4.4 4.7
Marketing Expenses
190.3 196.0 201.8 207.9 214.1 220.6 227.2 234.0 241.0 248.2
Other Expenses 15.0 15.8 16.5 17.4 18.2 19.1 20.1 21.1 22.2 23.3
Total 348.1 370.4 382.7 394.2 406.1 419.3 431.9 445.0 458.4 472.3
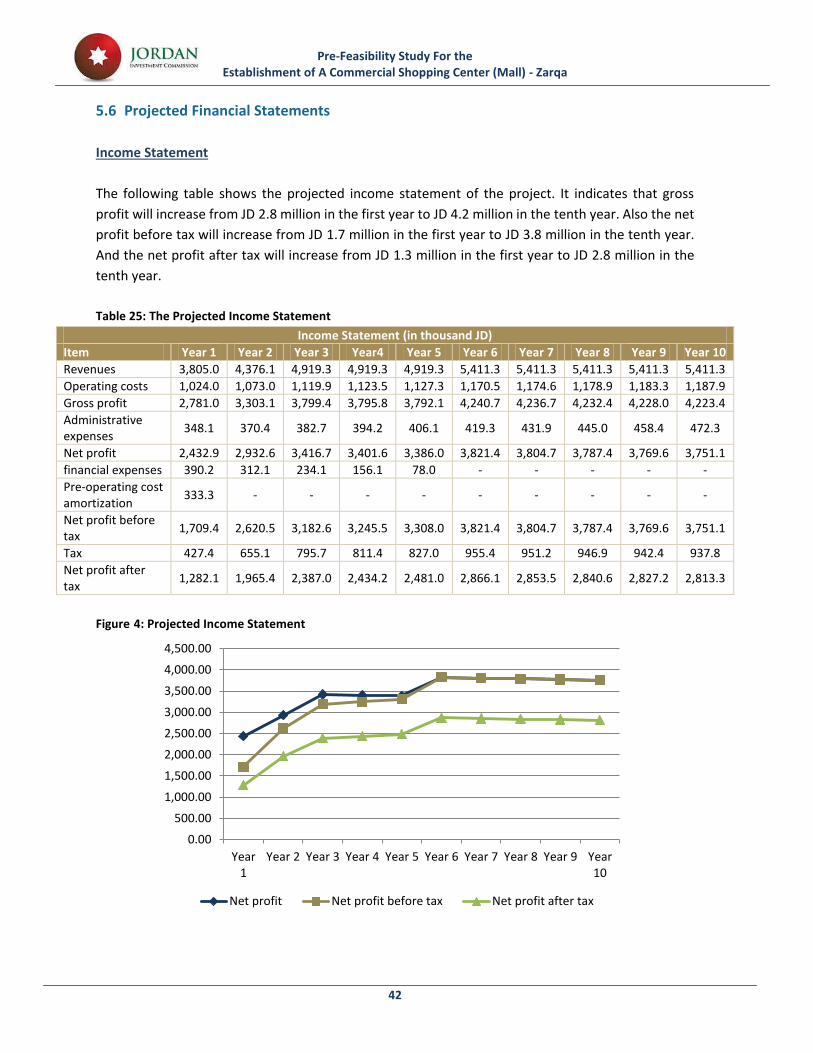
Pre-Feasibility Study For the Establishment of A Commercial Shopping Center (Mall) - Zarqa
42
5.6 Projected Financial Statements
Income Statement
The following table shows the projected income statement of the project. It indicates that gross
profit will increase from JD 2.8 million in the first year to JD 4.2 million in the tenth year. Also the net
profit before tax will increase from JD 1.7 million in the first year to JD 3.8 million in the tenth year.
And the net profit after tax will increase from JD 1.3 million in the first year to JD 2.8 million in the
tenth year.
Table 25: The Projected Income Statement
Income Statement (in thousand JD)
Item Year 1 Year 2 Year 3 Year4 Year 5 Year 6 Year 7 Year 8 Year 9 Year 10
Revenues 3,805.0 4,376.1 4,919.3 4,919.3 4,919.3 5,411.3 5,411.3 5,411.3 5,411.3 5,411.3
Operating costs 1,024.0 1,073.0 1,119.9 1,123.5 1,127.3 1,170.5 1,174.6 1,178.9 1,183.3 1,187.9
Gross profit 2,781.0 3,303.1 3,799.4 3,795.8 3,792.1 4,240.7 4,236.7 4,232.4 4,228.0 4,223.4
Administrative expenses
348.1 370.4 382.7 394.2 406.1 419.3 431.9 445.0 458.4 472.3
Net profit 2,432.9 2,932.6 3,416.7 3,401.6 3,386.0 3,821.4 3,804.7 3,787.4 3,769.6 3,751.1
financial expenses 390.2 312.1 234.1 156.1 78.0 - - - - -
Pre-operating cost amortization
333.3 - - - - - - - - -
Net profit before tax
1,709.4 2,620.5 3,182.6 3,245.5 3,308.0 3,821.4 3,804.7 3,787.4 3,769.6 3,751.1
Tax 427.4 655.1 795.7 811.4 827.0 955.4 951.2 946.9 942.4 937.8
Net profit after tax
1,282.1 1,965.4 2,387.0 2,434.2 2,481.0 2,866.1 2,853.5 2,840.6 2,827.2 2,813.3
Figure 4: Projected Income Statement
0.00
500.00
1,000.00
1,500.00
2,000.00
2,500.00
3,000.00
3,500.00
4,000.00
4,500.00
Year1
Year 2 Year 3 Year 4 Year 5 Year 6 Year 7 Year 8 Year 9 Year10
Net profit Net profit before tax Net profit after tax

Pre-Feasibility Study For the Establishment of A Commercial Shopping Center (Mall) - Zarqa
43
Projected Balance Sheet
The following table shows the projected balance sheet of the project during the first ten years. It
indicates that total assets will increase from JD 17.3 million in the year of incorporation to JD 20.6
million in the tenth year.
Table 26: Projected Balance Sheet
Projected Balance Sheet (in thousand JD)
Statement Year of incorporation
Year 1 Year 2 Year 3 Year 4 Year 5 Year 6 Year 7 Year 8 Year 9 Year 10
Assets
Cash 343 531 826 1,250 1,748 1,530 2,971 4,462 5,949 7,417 8,896
Receivables - 317 365 410 410 410 451 451 451 451 451
Inventory - 114 131 148 148 148 162 162 162 162 162
Pre- Paid Expenses
- 38 44 49 49 49 54 54 54 54 54
Other assets 343 1,000 1,365 1,856 2,355 2,137 3,638 5,129 6,616 8,085 9,564
Total Current Assets
16,665 16,665 16,665 16,665 16,665 17,395 17,395 17,395 17,395 17,410 17,410
Fixed Assets - 634 1,269 1,903 2,537 3,172 3,806 4,440 5,074 5,709 6,343
Cumulative Depreciation
333 - - - - - - - - - -
Pre-operating expenses Amortization
16,998 16,031 15,396 14,762 14,128 14,224 13,589 12,955 12,321 11,701 11,067
Net Fixed Assets 17,341 17,031 16,762 16,619 16,482 16,360 17,227 18,084 18,937 19,786 20,631
Total Assets 343 531 826 1,250 1,748 1,530 2,971 4,462 5,949 7,417 8,896
Shareholders Equity and Liabilities
Accrued Expenses and Payables
- 172 180 188 189 189 197 197 198 199 200
Long Term Loans 4,335 3,468.27 2,601.20 1,734.13 867.07 - - - - - -
Total Liabilities - 3,640 2,781 1,922 1,056 189 197 197 198 199 200
Shareholders Contributions
13,006 13,006 13,006 13,006 13,006 13,006 13,006 13,006 13,006 13,006 13,006
Retained Earnings - 385 974 1,690 2,421 3,165 4,025 4,881 5,733 6,581 7,425
Shareholders' Equity
13,006 13,391 13,980 14,696 15,427 16,171 17,031 17,887 18,739 19,587 20,431
Shareholders Equity and Liabilities
17,341 17,031 16,762 16,619 16,482 16,360 17,227 18,084 18,937 19,786 20,631

Pre-Feasibility Study For the Establishment of A Commercial Shopping Center (Mall) - Zarqa
44
Cash Flow Statement
The following table shows the projected cash flow statement of the project during the first ten
years. It indicates that the cash flow from operating will increase from JD 1.9 million in the first year
to JD 3.4 million in the tenth year; while the Cash at the ending period will increase from JD 343
thousand in the year of incorporation to JD 8.8 million in the tenth year.
Table 27: The Expected Cash Flows Statement
Cash Flow Statement (in thousand JD)
Statement Year of
incorporation
Year 1 Year 2 Year 3 Year 4 Year 5 Year 6 Year 7 Year 8 Year 9 Year 10
Operation Activities
Net Profit - 1,282 1,965 2,387 2,434 2,481 2,866 2,854 2,841 2,827 2,813
Depreciation - 968 634 634 634 634 634 634 634 634 634
Change In Working Capital
- (297) (62) (59) 1 1 (53) 1 1 1 1
Cash Flow From Operation
- 1,952 2,537 2,962 3,069 3,116 3,447 3,489 3,476 3,462 3,448
Investing Activities
Fixed Assets (16,998) - - - - (730) - - - (15) -
Cash From Investing Activities
(16,998) - - - - (730) - - - (15) -
Financing Activities
Capital (Equity) 13,006 - - - - - - - - - -
Loan 4,335 (867) (867) (867) (867) (867) - - - - -
Dividends - (897) (1,376) (1,671) (1,704) (1,737) (2,006) (1,997) (1,988) (1,979) (1,969)
Cash Flow From Financing Activities
17,341 (1,765) (2,243) (2,538) (2,571) (2,604) (2,006) (1,997) (1,988) (1,979) (1,969)
Net Cash Flow 343 188 295 424 498 (218) 1,441 1,491 1,487 1,468 1,479
Cash At The Beginning Period
0 343 531 826 1,250 1,748 1,530 2,971 4,462 5,949 7,417
Cash At The Ending Period
343 531 826 1,250 1,748 1,530 2,971 4,462 5,949 7,417 8,896
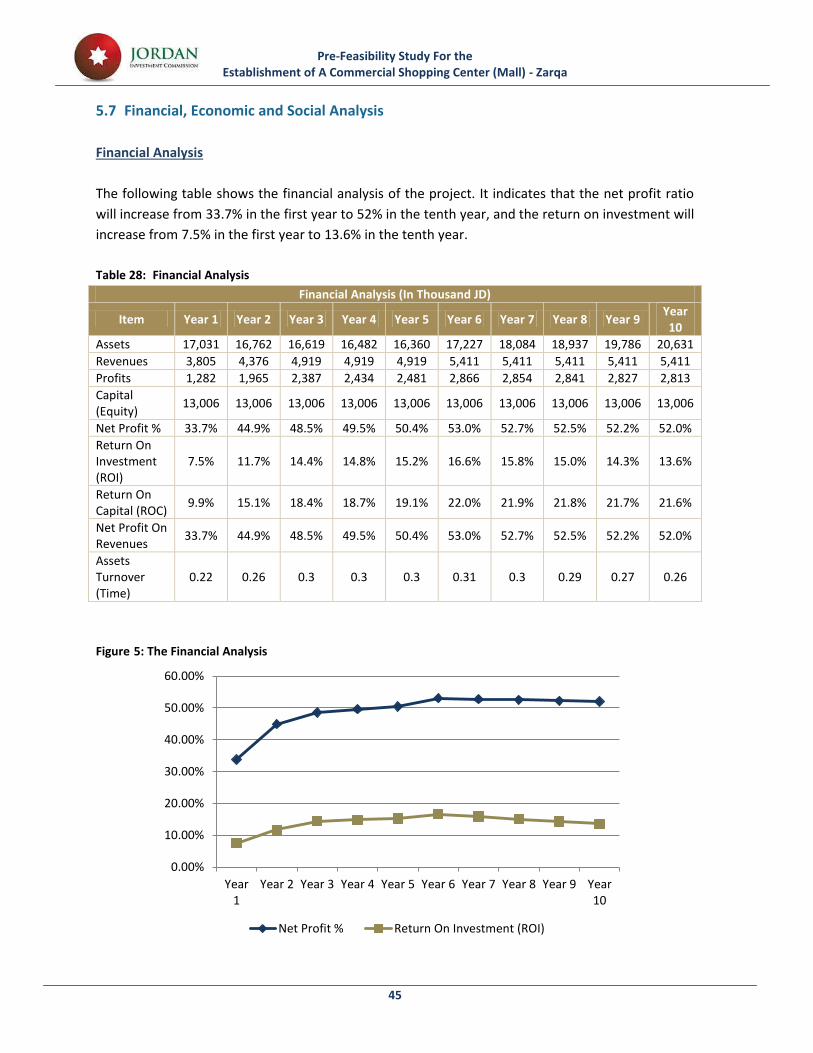
Pre-Feasibility Study For the Establishment of A Commercial Shopping Center (Mall) - Zarqa
45
5.7 Financial, Economic and Social Analysis
Financial Analysis
The following table shows the financial analysis of the project. It indicates that the net profit ratio
will increase from 33.7% in the first year to 52% in the tenth year, and the return on investment will
increase from 7.5% in the first year to 13.6% in the tenth year.
Table 28: Financial Analysis
Financial Analysis (In Thousand JD)
Item Year 1 Year 2 Year 3 Year 4 Year 5 Year 6 Year 7 Year 8 Year 9 Year 10
Assets 17,031 16,762 16,619 16,482 16,360 17,227 18,084 18,937 19,786 20,631
Revenues 3,805 4,376 4,919 4,919 4,919 5,411 5,411 5,411 5,411 5,411
Profits 1,282 1,965 2,387 2,434 2,481 2,866 2,854 2,841 2,827 2,813
Capital (Equity)
13,006 13,006 13,006 13,006 13,006 13,006 13,006 13,006 13,006 13,006
Net Profit % 33.7% 44.9% 48.5% 49.5% 50.4% 53.0% 52.7% 52.5% 52.2% 52.0%
Return On Investment (ROI)
7.5% 11.7% 14.4% 14.8% 15.2% 16.6% 15.8% 15.0% 14.3% 13.6%
Return On Capital (ROC)
9.9% 15.1% 18.4% 18.7% 19.1% 22.0% 21.9% 21.8% 21.7% 21.6%
Net Profit On Revenues
33.7% 44.9% 48.5% 49.5% 50.4% 53.0% 52.7% 52.5% 52.2% 52.0%
Assets Turnover (Time)
0.22 0.26 0.3 0.3 0.3 0.31 0.3 0.29 0.27 0.26
Figure 5: The Financial Analysis
0.00%
10.00%
20.00%
30.00%
40.00%
50.00%
60.00%
Year1
Year 2 Year 3 Year 4 Year 5 Year 6 Year 7 Year 8 Year 9 Year10
Net Profit % Return On Investment (ROI)

Pre-Feasibility Study For the Establishment of A Commercial Shopping Center (Mall) - Zarqa
46
Economic Analysis
The following table shows the economic analysis of the project during the first ten years, we
conclude that:
The Internal rate of return is 19.5%. It exceeded four times the return on assets, which
means the economic feasibility of the project
The present value of the project reached about JD 18.9 million. It exceeds the net present
value with JD 1.6 million, which means the economic feasibility of the project.
The profitability index of the project reached 1.46 times, which means that the expected
value of the project will increase by double the investment value, which proves that the
project is feasible.
The project payback period is 6.1 years.
Table 29: the Economic Analysis
Economic Analysis (in Thousand JD)
Statement Year of
incorporation
Year 1
Year 2
Year 3
Year 4
Year 5
Year 6
Year 7
Year 8
Year 9
Year 10
Net cash flow from operating and investing activities
(13,006) 1,085 1,670 2,095 2,202 2,249 3,447 3,489 3,476 3,462 3,448
terminal value - - - - - - - - - - 20,431
Net Cash flow (13,006) 1,085 1,670 2,095 2,202 2,249 3,447 3,489 3,476 3,462 23,879
Internal Rate of Return (IRR)
19.6%
present Value 18,925
Net present value 5,919
Profitability Index (Time)
1.46
Payback period (Year)
6.10
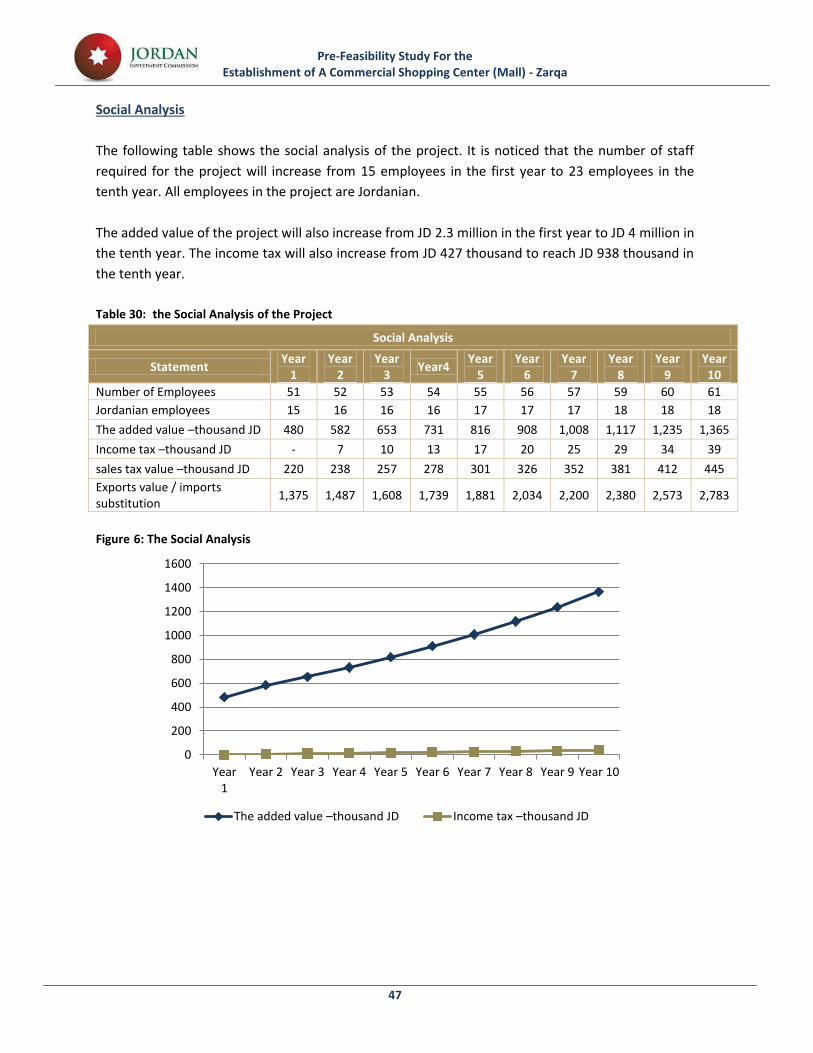
Pre-Feasibility Study For the Establishment of A Commercial Shopping Center (Mall) - Zarqa
47
Social Analysis
The following table shows the social analysis of the project. It is noticed that the number of staff
required for the project will increase from 15 employees in the first year to 23 employees in the
tenth year. All employees in the project are Jordanian.
The added value of the project will also increase from JD 2.3 million in the first year to JD 4 million in
the tenth year. The income tax will also increase from JD 427 thousand to reach JD 938 thousand in
the tenth year.
Table 30: the Social Analysis of the Project
Social Analysis
Statement Year
1 Year
2 Year
3 Year4
Year 5
Year 6
Year 7
Year 8
Year 9
Year 10
Number of Employees 51 52 53 54 55 56 57 59 60 61
Jordanian employees 15 16 16 16 17 17 17 18 18 18
The added value –thousand JD 480 582 653 731 816 908 1,008 1,117 1,235 1,365
Income tax –thousand JD - 7 10 13 17 20 25 29 34 39
sales tax value –thousand JD 220 238 257 278 301 326 352 381 412 445
Exports value / imports substitution
1,375 1,487 1,608 1,739 1,881 2,034 2,200 2,380 2,573 2,783
Figure 6: The Social Analysis
0
200
400
600
800
1000
1200
1400
1600
Year1
Year 2 Year 3 Year 4 Year 5 Year 6 Year 7 Year 8 Year 9 Year 10
The added value –thousand JD Income tax –thousand JD
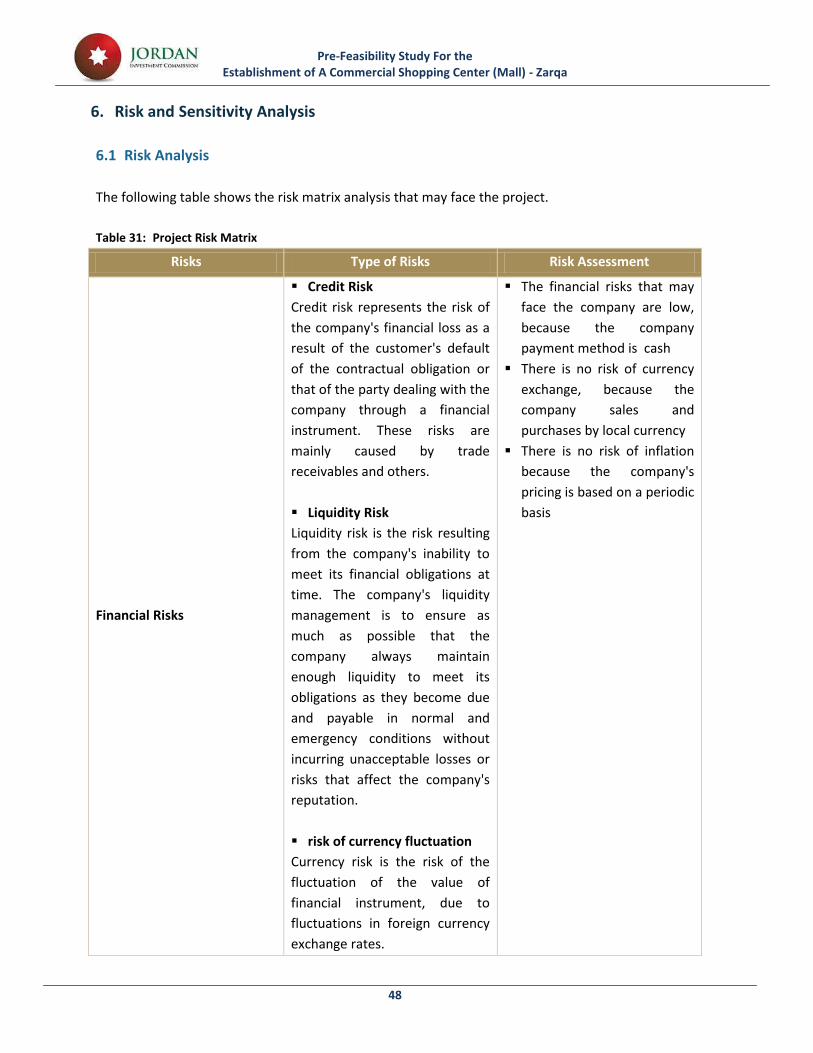
Pre-Feasibility Study For the Establishment of A Commercial Shopping Center (Mall) - Zarqa
48
6. Risk and Sensitivity Analysis
6.1 Risk Analysis
The following table shows the risk matrix analysis that may face the project.
Table 31: Project Risk Matrix
Risks Type of Risks Risk Assessment
Financial Risks
Credit Risk
Credit risk represents the risk of
the company's financial loss as a
result of the customer's default
of the contractual obligation or
that of the party dealing with the
company through a financial
instrument. These risks are
mainly caused by trade
receivables and others.
Liquidity Risk
Liquidity risk is the risk resulting
from the company's inability to
meet its financial obligations at
time. The company's liquidity
management is to ensure as
much as possible that the
company always maintain
enough liquidity to meet its
obligations as they become due
and payable in normal and
emergency conditions without
incurring unacceptable losses or
risks that affect the company's
reputation.
risk of currency fluctuation
Currency risk is the risk of the
fluctuation of the value of
financial instrument, due to
fluctuations in foreign currency
exchange rates.
The financial risks that may
face the company are low,
because the company
payment method is cash
There is no risk of currency
exchange, because the
company sales and
purchases by local currency
There is no risk of inflation
because the company's
pricing is based on a periodic
basis
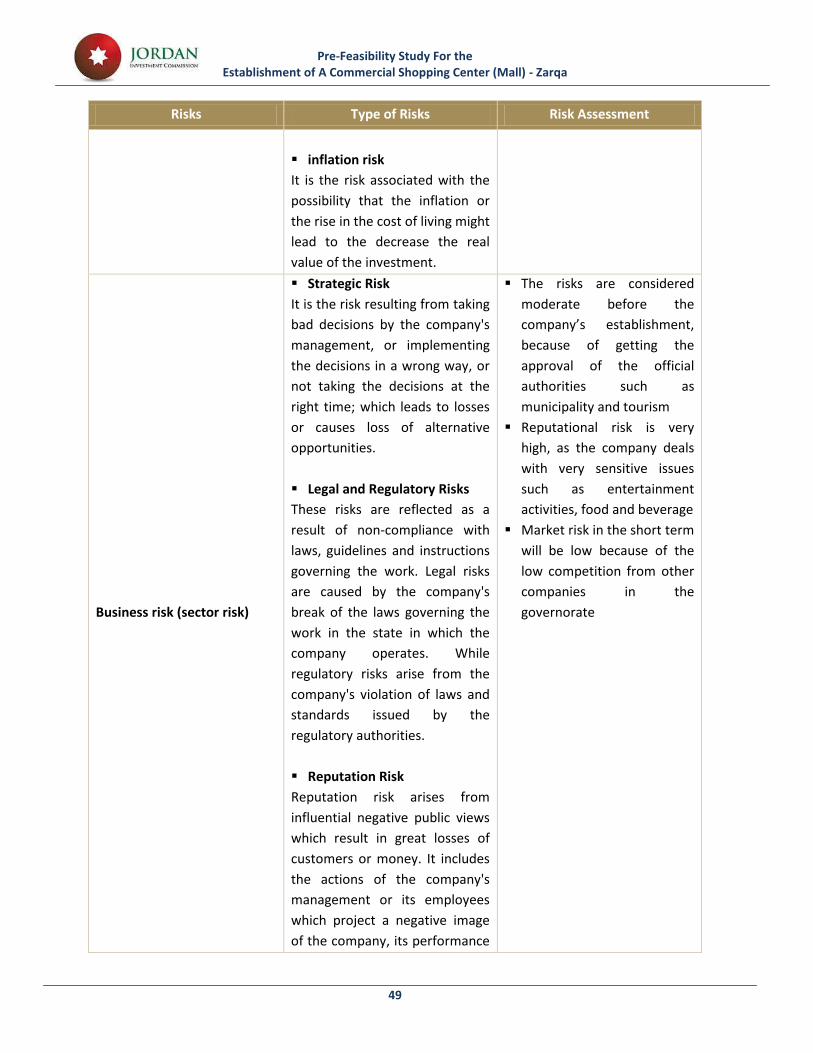
Pre-Feasibility Study For the Establishment of A Commercial Shopping Center (Mall) - Zarqa
49
Risks Type of Risks Risk Assessment
inflation risk
It is the risk associated with the
possibility that the inflation or
the rise in the cost of living might
lead to the decrease the real
value of the investment.
Business risk (sector risk)
Strategic Risk
It is the risk resulting from taking
bad decisions by the company's
management, or implementing
the decisions in a wrong way, or
not taking the decisions at the
right time; which leads to losses
or causes loss of alternative
opportunities.
Legal and Regulatory Risks
These risks are reflected as a
result of non-compliance with
laws, guidelines and instructions
governing the work. Legal risks
are caused by the company's
break of the laws governing the
work in the state in which the
company operates. While
regulatory risks arise from the
company's violation of laws and
standards issued by the
regulatory authorities.
Reputation Risk
Reputation risk arises from
influential negative public views
which result in great losses of
customers or money. It includes
the actions of the company's
management or its employees
which project a negative image
of the company, its performance
The risks are considered
moderate before the
company’s establishment,
because of getting the
approval of the official
authorities such as
municipality and tourism
Reputational risk is very
high, as the company deals
with very sensitive issues
such as entertainment
activities, food and beverage
Market risk in the short term
will be low because of the
low competition from other
companies in the
governorate
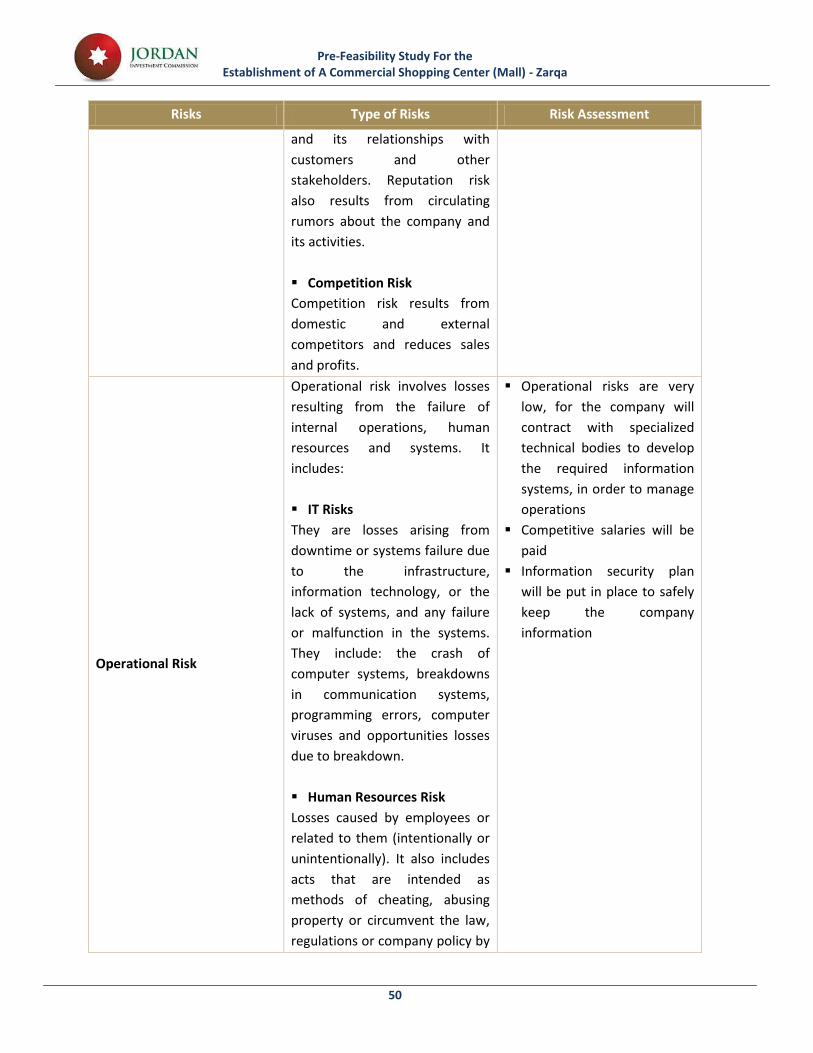
Pre-Feasibility Study For the Establishment of A Commercial Shopping Center (Mall) - Zarqa
50
Risks Type of Risks Risk Assessment
and its relationships with
customers and other
stakeholders. Reputation risk
also results from circulating
rumors about the company and
its activities.
Competition Risk
Competition risk results from
domestic and external
competitors and reduces sales
and profits.
Operational Risk
Operational risk involves losses
resulting from the failure of
internal operations, human
resources and systems. It
includes:
IT Risks
They are losses arising from
downtime or systems failure due
to the infrastructure,
information technology, or the
lack of systems, and any failure
or malfunction in the systems.
They include: the crash of
computer systems, breakdowns
in communication systems,
programming errors, computer
viruses and opportunities losses
due to breakdown.
Human Resources Risk
Losses caused by employees or
related to them (intentionally or
unintentionally). It also includes
acts that are intended as
methods of cheating, abusing
property or circumvent the law,
regulations or company policy by
Operational risks are very
low, for the company will
contract with specialized
technical bodies to develop
the required information
systems, in order to manage
operations
Competitive salaries will be
paid
Information security plan
will be put in place to safely
keep the company
information
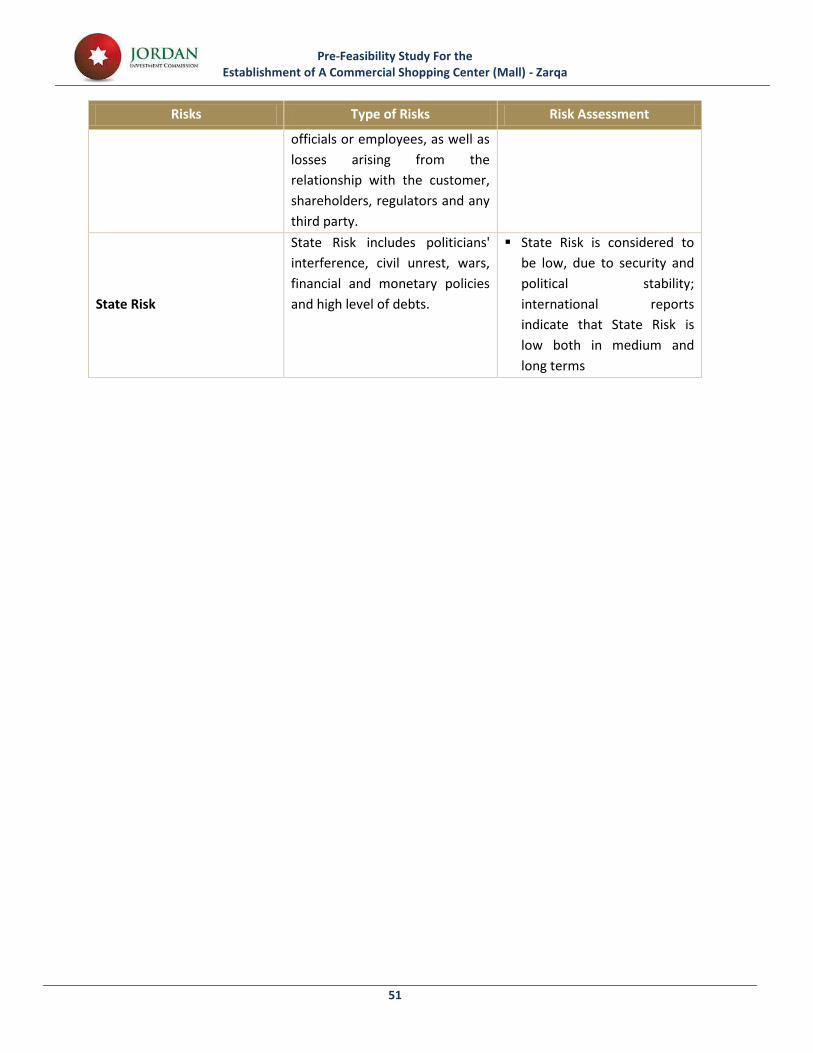
Pre-Feasibility Study For the Establishment of A Commercial Shopping Center (Mall) - Zarqa
51
Risks Type of Risks Risk Assessment
officials or employees, as well as
losses arising from the
relationship with the customer,
shareholders, regulators and any
third party.
State Risk
State Risk includes politicians'
interference, civil unrest, wars,
financial and monetary policies
and high level of debts.
State Risk is considered to
be low, due to security and
political stability;
international reports
indicate that State Risk is
low both in medium and
long terms
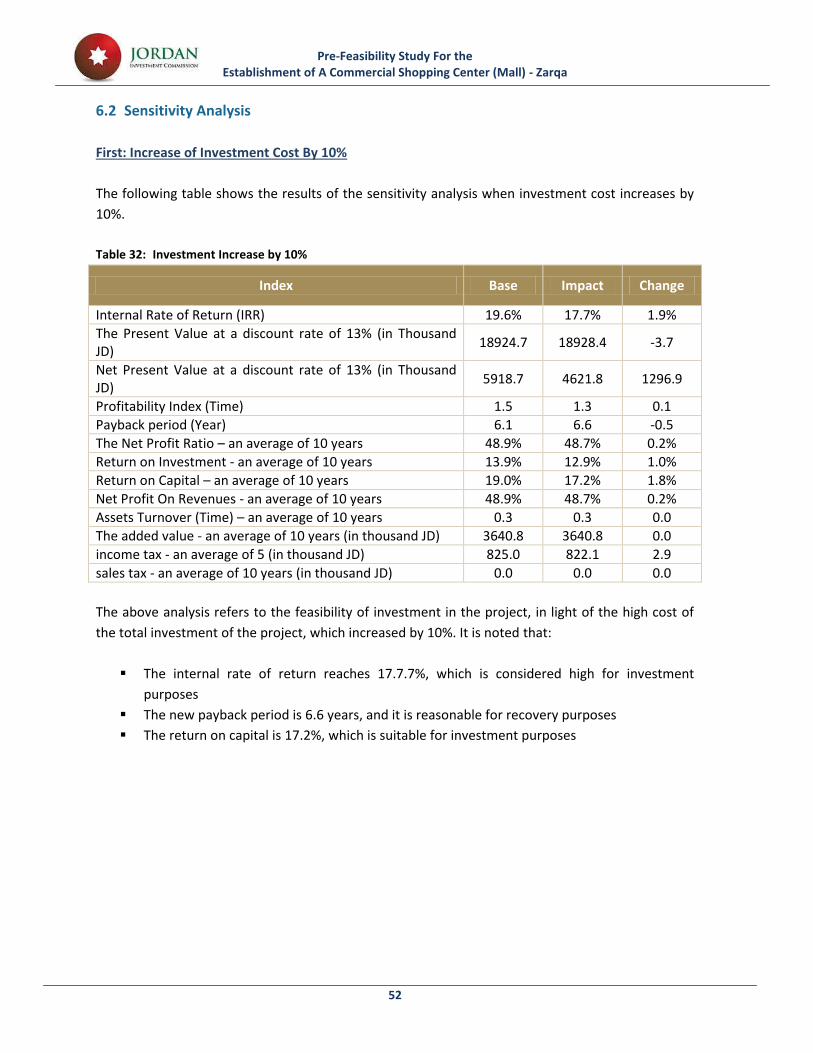
Pre-Feasibility Study For the Establishment of A Commercial Shopping Center (Mall) - Zarqa
52
6.2 Sensitivity Analysis
First: Increase of Investment Cost By 10%
The following table shows the results of the sensitivity analysis when investment cost increases by
10%.
Table 32: Investment Increase by 10%
Index Base Impact Change
Internal Rate of Return (IRR) 19.6% 17.7% 1.9%
The Present Value at a discount rate of 13% (in Thousand JD)
18924.7 18928.4 -3.7
Net Present Value at a discount rate of 13% (in Thousand JD)
5918.7 4621.8 1296.9
Profitability Index (Time) 1.5 1.3 0.1
Payback period (Year) 6.1 6.6 -0.5
The Net Profit Ratio – an average of 10 years 48.9% 48.7% 0.2%
Return on Investment - an average of 10 years 13.9% 12.9% 1.0%
Return on Capital – an average of 10 years 19.0% 17.2% 1.8%
Net Profit On Revenues - an average of 10 years 48.9% 48.7% 0.2%
Assets Turnover (Time) – an average of 10 years 0.3 0.3 0.0
The added value - an average of 10 years (in thousand JD) 3640.8 3640.8 0.0
income tax - an average of 5 (in thousand JD) 825.0 822.1 2.9
sales tax - an average of 10 years (in thousand JD) 0.0 0.0 0.0
The above analysis refers to the feasibility of investment in the project, in light of the high cost of
the total investment of the project, which increased by 10%. It is noted that:
The internal rate of return reaches 17.7.7%, which is considered high for investment
purposes
The new payback period is 6.6 years, and it is reasonable for recovery purposes
The return on capital is 17.2%, which is suitable for investment purposes
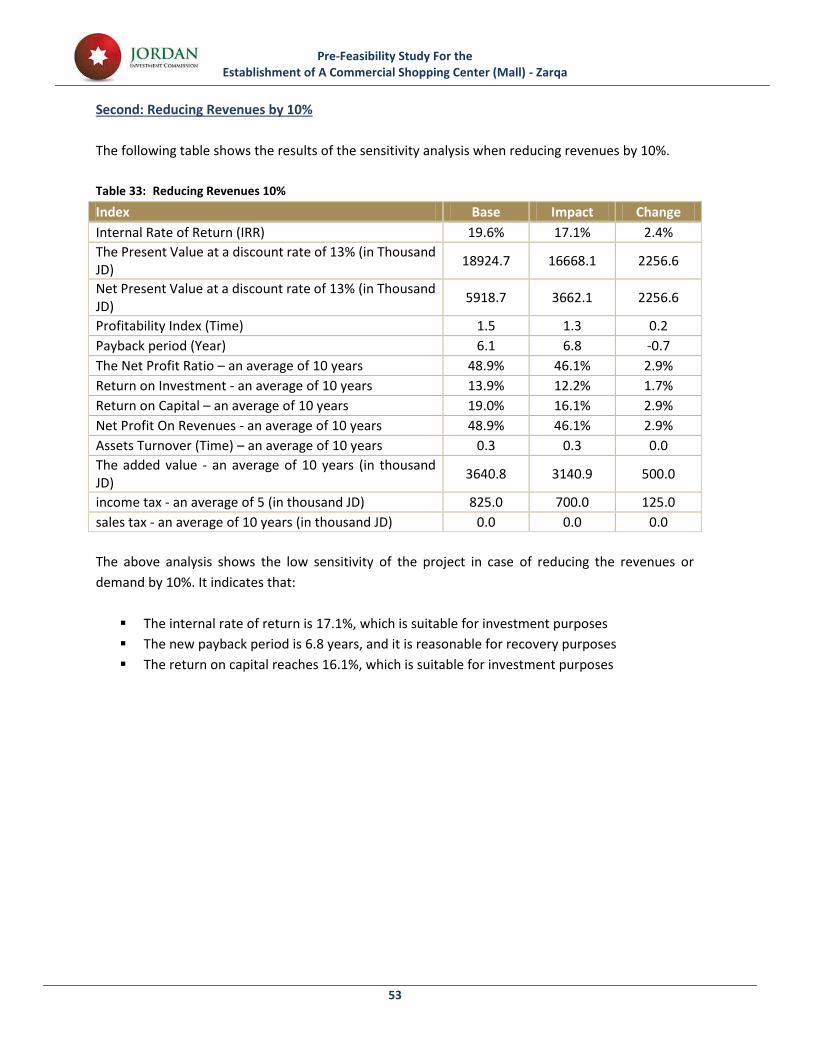
Pre-Feasibility Study For the Establishment of A Commercial Shopping Center (Mall) - Zarqa
53
Second: Reducing Revenues by 10%
The following table shows the results of the sensitivity analysis when reducing revenues by 10%.
Table 33: Reducing Revenues 10%
Index Base Impact Change
Internal Rate of Return (IRR) 19.6% 17.1% 2.4%
The Present Value at a discount rate of 13% (in Thousand JD)
18924.7 16668.1 2256.6
Net Present Value at a discount rate of 13% (in Thousand JD)
5918.7 3662.1 2256.6
Profitability Index (Time) 1.5 1.3 0.2
Payback period (Year) 6.1 6.8 -0.7
The Net Profit Ratio – an average of 10 years 48.9% 46.1% 2.9%
Return on Investment - an average of 10 years 13.9% 12.2% 1.7%
Return on Capital – an average of 10 years 19.0% 16.1% 2.9%
Net Profit On Revenues - an average of 10 years 48.9% 46.1% 2.9%
Assets Turnover (Time) – an average of 10 years 0.3 0.3 0.0
The added value - an average of 10 years (in thousand JD)
3640.8 3140.9 500.0
income tax - an average of 5 (in thousand JD) 825.0 700.0 125.0
sales tax - an average of 10 years (in thousand JD) 0.0 0.0 0.0
The above analysis shows the low sensitivity of the project in case of reducing the revenues or
demand by 10%. It indicates that:
The internal rate of return is 17.1%, which is suitable for investment purposes
The new payback period is 6.8 years, and it is reasonable for recovery purposes
The return on capital reaches 16.1%, which is suitable for investment purposes
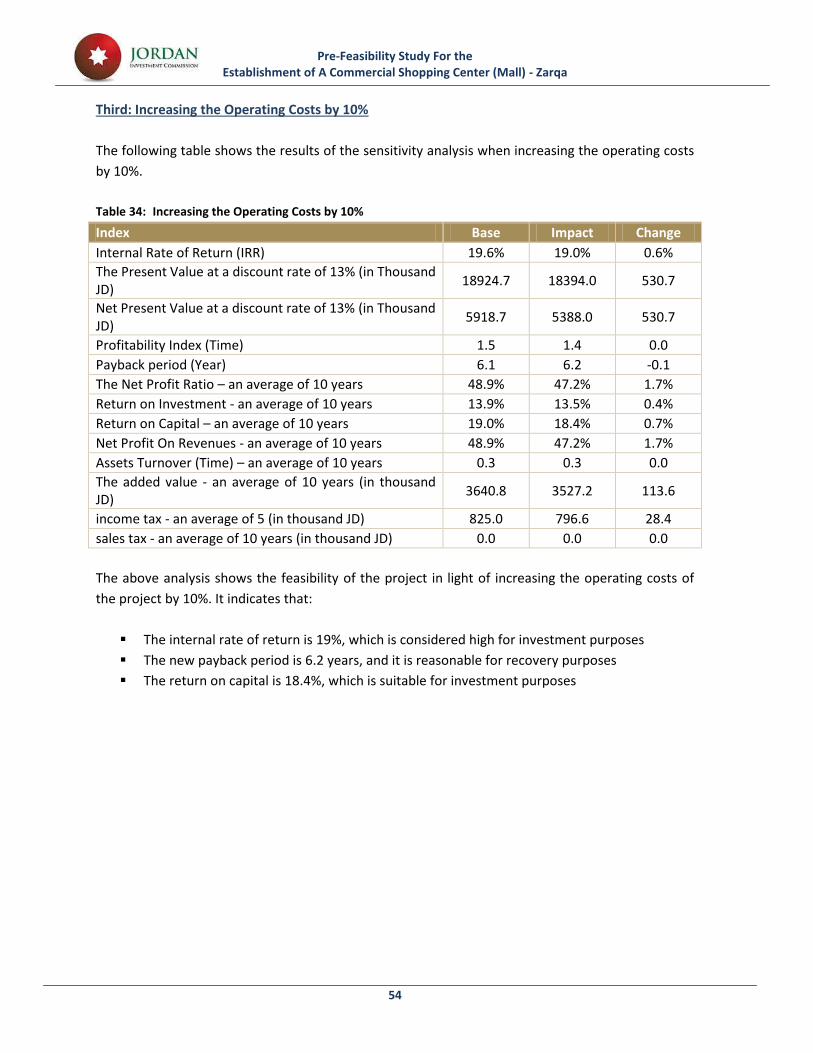
Pre-Feasibility Study For the Establishment of A Commercial Shopping Center (Mall) - Zarqa
54
Third: Increasing the Operating Costs by 10%
The following table shows the results of the sensitivity analysis when increasing the operating costs
by 10%.
Table 34: Increasing the Operating Costs by 10%
Index Base Impact Change
Internal Rate of Return (IRR) 19.6% 19.0% 0.6%
The Present Value at a discount rate of 13% (in Thousand JD)
18924.7 18394.0 530.7
Net Present Value at a discount rate of 13% (in Thousand JD)
5918.7 5388.0 530.7
Profitability Index (Time) 1.5 1.4 0.0
Payback period (Year) 6.1 6.2 -0.1
The Net Profit Ratio – an average of 10 years 48.9% 47.2% 1.7%
Return on Investment - an average of 10 years 13.9% 13.5% 0.4%
Return on Capital – an average of 10 years 19.0% 18.4% 0.7%
Net Profit On Revenues - an average of 10 years 48.9% 47.2% 1.7%
Assets Turnover (Time) – an average of 10 years 0.3 0.3 0.0
The added value - an average of 10 years (in thousand JD)
3640.8 3527.2 113.6
income tax - an average of 5 (in thousand JD) 825.0 796.6 28.4
sales tax - an average of 10 years (in thousand JD) 0.0 0.0 0.0
The above analysis shows the feasibility of the project in light of increasing the operating costs of
the project by 10%. It indicates that:
The internal rate of return is 19%, which is considered high for investment purposes
The new payback period is 6.2 years, and it is reasonable for recovery purposes
The return on capital is 18.4%, which is suitable for investment purposes