Embed Size (px)
Citation preview
VYSOKÉ UČENÍ TECHNICKÉ V BRNĚ BRNO UNIVERSITY OF TECHNOLOGY
FAKULTA CHEMICKÁ ÚSTAV FYZIKÁLNÍ A SPOTŘEBNÍ CHEMIE
FACULTY OF CHEMISTRY INSTITUTE OF PHYSICAL AND APPLIED CHEMISTRY
AGGREGATION BEHAVIOR OF POLYSACCHARIDES IN AQUEOUS SOLUTIONS AGREGAČNÍ CHOVÁNÍ POLYSACHARIDŮ VE VODNÝCH ROZTOCÍCH
DISERTAČNÍ PRÁCE PhD THESIS
AUTOR PRÁCE Ing. FILIP MRAVEC AUTHOR
VEDOUCÍ PRÁCE Doc. Ing. MILOSLAV PEKAŘ, CSc. SUPERVISOR BRNO 2008
2
ABSTRAKT Tato práce je zaměřena na agregační chování nativního a hydrofobně modifikovaného
hyaluronanu, v různých molekulových hmotnostech a stupních substituce, ve vodném
prostředí. Pro studium bylo vybráno šest fluorescenčních sond s různými vlastnostmi (pyren;
nilská červeň; perylen; akridinová oranž; 6-(p-toluidino)-2-nafthalenesulfonová kyselina;
PRODAN). a výsledky získané pomocí těchto sond byly porovnány s jednoduchým
anionaktivním tenzidem (dodecylsíran sodný). U všech použité sond byly testovány jejich
spektrální vlastnosti v závislosti na polaritě okolí a/nebo na koncentraci. Pro stanovení
vlastností nepolárního jádra hyaluronového agregátu byly vybrány dvě sondy (pyren, nilská
červeň). U domén byly sledovány polarita a viskozita vnitřního prostředí a jejich závislost na
iontové síle a teplotě. Pro modifikované hyaluronany bylo stanoveno, že jejich kritická
agregační koncentrace klesá s rostoucí molekulovou hmotností a stupněm substituce. Pro
vlastní doménu platí, že její kompaktnost roste s rostoucí iontovou silou, ale klesá s rostoucí
teplotou.
ABSTRACT This thesis is focused on aggregation properties of native and hydrophobized hyaluronan,
in different molecular weights and degree of substitution, in aqueous solutions. These samples
were studied using six different fluorescence probes (Pyrene; Nile red; Perylene; Acridine
orange; 6-(p-Toluidino)-2-naphthalenesulfonic acid; PRODAN) and results were compared
with simple anionic surfactant (Sodium dodecyl sulfate). All used probes were tested for their
spectral properties in dependence on polarity and/or concentration. Two of them (Pyrene, Nile
red) were selected to determine apolar core properties of novel hydrophobicaly modified
hyaluronan. Domains were tested for polarity and viscosity, and dependencies of these two
parameters on ionic strength and temperature. For modified hyaluronans were found that
critical aggregation concentration decreasing with increasing degree of substitution and
molecular weight. Domain qualities show their compactness increasing with increasing ionic
strength and decreasing with increasing temperature.
KLÍ ČOVÁ SLOVA Hyaluronan, Polymerní micely, Fluorescenční sonda, Polarita, Mikroviskozita, CAC, CMC,
SDS
KEYWORDS Hyaluronan, Polymeric micelle, Fluorescence probe, Polarity, Microviscosity, CAC, CMC,
SDS
3
MRAVEC, F. Aggregation behavior of polysaccharides in aqueous solutions. Brno, 2008.
119 s. Disertační práce na Fakultě chemické Vysokého učení technického v Brně, Ústavu
fyzikální a spotřební chemie. Vedoucí disertační práce Doc. Ing. Miloslav Pekař, CSc.
PROHLÁŠENÍ
Prohlašuji, že jsem disertační práci vypracoval samostatně a že všechny použité literární
zdroje jsem správně a úplně citoval. Disertační práce je z hlediska obsahu majetkem Fakulty
chemické VUT v Brně a může být využita ke komerčním účelům jen se souhlasem vedoucího
disertační práce a děkana FCH VUT.
................................ podpis doktoranda
Poděkování: Mé díky patří především vedoucímu mé disertační práce Doc. Ing. Miloslavu
Pekařovi, CSc. za trpělivost a dlouhodobý systematický přístup. Dále děkuji RNDr.
Vladimírovi Velebnému, CSc., řediteli firmy CPN spol. s.r.o., za poskytnutí vzorků a
inspirativních nápadů. Rovněž nemalé díky patří mým kolegyním Ing. Radce Baarové,
Ing. Radce Lenartové. Ing. Monice Londinové, Ing. Dagmar Slezákové a Bc. Tereze Halasové
a Bc. Petře Kučerové za spolupráci na takto rozsáhlém tématu a dlouhé diskuse nad výsledky.
Samozřejmě chci poděkovat mé ženě Ludmile za neutuchající podporu.
4
TABLE OF CONTENTS
1. Introduction ................................................................................................. 7
1.1. Causa Hyaluronate ......................................................................................................... 7
1.2. Modified polysaccharides, sugar-based surfactants, polymers ......................................8
1.3. Interaction between polymers and surfactants ............................................................. 11
2. Theoretical background............................................................................13
2.1. Hyaluronic acid, hyaluronan, hyaluronates and associative systems........................... 13
2.1.1. Brief historical overview.............................................................................................................. 13
2.1.2. Chemical and physical properties ................................................................................................ 13
2.1.3. Hyaluronan Modification............................................................................................................. 14
2.1.4. Micelle formation......................................................................................................................... 16
2.2. Fluorescence spectroscopy........................................................................................... 17
2.2.1. Electronic transition in polyatomic molecule............................................................................... 17
2.2.1.1. Einstein’s coefficients. Transition moment. .......................................................................... 18
2.2.1.2. Selection rule ........................................................................................................................ 19
2.2.1.3. The Franck–Condon principle.............................................................................................. 20
2.2.2. Characteristics of fluorescence emission ..................................................................................... 21
2.2.2.1. Radiative and non-radiative transitions................................................................................ 21
2.2.2.2. Fluorescence......................................................................................................................... 22
2.2.3. Lifetimes ...................................................................................................................................... 23
2.2.4. Quantum yields ............................................................................................................................ 24
2.2.5. Steady-state fluorescence intensity .............................................................................................. 24
2.2.6. Quenching.................................................................................................................................... 25
2.2.6.1. Collisional-quenching mechanism........................................................................................ 25
2.2.7. Polarization and anisotropy.......................................................................................................... 25
2.2.7.1. Characterization of polarization and anisotropy.................................................................. 26
2.2.7.2. Instantaneous anisotropy...................................................................................................... 26
2.2.7.3. Steady-state anisotropy......................................................................................................... 27
2.2.8. Fluorescence Resonance Energy Transfer (FRET) ...................................................................... 27
2.2.8.1. Energy transfer in micelles ................................................................................................... 29
3. Application of the fluorescence spectroscopy .........................................30
3.1. PROBES FOR AGGREGATION BEHAVIOR INVESTIGATION .......................... 30
3.2. Polarity probes.............................................................................................................. 31
3.2.1. Photoinduced charge transfer....................................................................................................... 31
3.2.2. Polarity induced changes in vibronic bands................................................................................. 32
3.3. Determination of microviscosity, fluidity .................................................................... 32
3.3.1. Fluorescence polarization measurements..................................................................................... 33
5
3.3.1.1. Isotropic media ..................................................................................................................... 33
3.3.1.2. Ordered systems.................................................................................................................... 34
3.3.2. Intramolecular excimer formation................................................................................................ 34
3.3.3. Molecular rotors........................................................................................................................... 34
3.4. Fluorescence quenching studies ................................................................................... 35
3.4.1. Estimation of average location of fluorophore and quencher ...................................................... 35
3.4.2. Using fluorescence quenching in determination of aggregation number N .................................36
4. Aim of the work .........................................................................................38
5. Materials and methods..............................................................................39
5.1. PROBE’S PROPERTIES............................................................................................. 39
5.1.1. Pyrene .......................................................................................................................................... 39
5.1.2. Nile red ........................................................................................................................................ 39
5.1.3. Perylene ....................................................................................................................................... 39
5.1.4. Acridine orange............................................................................................................................ 39
5.1.5. 6-(p-Toluidino)-2-naphthalenesulfonic acid (TNS) ..................................................................... 40
5.1.6. PRODAN ..................................................................................................................................... 40
5.2. Colloidal systems ......................................................................................................... 40
5.2.1. SDS .............................................................................................................................................. 40
5.2.2. Hyaluronan derivatives - carbamate derivatives .......................................................................... 41
5.3. Determination of critical micelle concentration........................................................... 42
5.3.1. Pyrene 1:3 ratio method as detection of CMC ............................................................................. 42
5.3.2. Perylene-based determination of CAC......................................................................................... 44
5.4. Experimental conditions............................................................................................... 44
6. Results and discussion...............................................................................45
6.1. WATER-INSOLUBLE PROBES IN AGGREGATION............................................. 45
6.1.1. Pyrene .......................................................................................................................................... 46
6.1.1.1. Simple Surfactant System...................................................................................................... 46
6.1.1.2. Native hyaluronan................................................................................................................. 48
6.1.1.3. Hydrophobized hyaluronan .................................................................................................. 49
6.1.1.4. Influence of ionic strength .................................................................................................... 51
6.1.2. Nile red ........................................................................................................................................ 53
6.1.2.1. Simple Surfactant System...................................................................................................... 53
6.1.2.2. Native hyaluronan................................................................................................................. 56
6.1.2.3. Hydrophobized hyaluronan .................................................................................................. 57
6.1.3. Perylene ....................................................................................................................................... 59
6.1.3.1. Simple Surfactant System...................................................................................................... 59
6.1.3.2. Native hyaluronan................................................................................................................. 60
6.1.3.3. Hydrophobized hyaluronan .................................................................................................. 60
6
6.2. WATER-SOLUBLE PROBES IN AGGREGATION................................................. 62
6.2.1. Acridine Orange........................................................................................................................... 63
6.2.1.1. Simple Surfactant System...................................................................................................... 63
6.2.1.2. Native hyaluronan................................................................................................................. 64
6.2.1.3. Hydrophobized hyaluronan .................................................................................................. 68
6.2.2. TNS.............................................................................................................................................. 72
6.2.2.1. Simple Surfactant System...................................................................................................... 73
6.2.2.2. Native hyaluronan................................................................................................................. 74
6.2.3. PRODAN ..................................................................................................................................... 76
6.2.3.1. Simple Surfactant System...................................................................................................... 76
6.2.3.2. Native hyaluronan................................................................................................................. 79
6.2.3.3. Hydrophobized hyaluronan .................................................................................................. 80
6.3. Fluorescence probes in investigation of core quality ................................................... 82
6.3.1. Domain polarity ........................................................................................................................... 83
6.3.1.1. Pyrene and its polarity scale................................................................................................. 83
6.3.1.2. Nile red and its polarity scale............................................................................................... 87
6.3.2. Domain viscosity ......................................................................................................................... 91
7. Conclusion ..................................................................................................96
8. References...................................................................................................98
9. Abbreviations...........................................................................................106
10. Appendix...................................................................................................108
7
1. INTRODUCTION
Biopolymers and their derivatives rise up as very interesting materials in wide area of
medical, pharmacological, and engineering application. They are characteristic for their
quality as biocompatibility and biodegradability. They exhibit fascinating properties and are
inspiration for their role-playing in living organisms. They must prove specifically
interactions with a large variety of different substances.
Hyaluronic acid is a naturally occurring polysaccharide, presents in all vertebrates and in
some Steptococci strains. Native hyaluronan play an important role in the ophthalmology,
viscosurgery, viscosupplementation, and wound healing. Its modification can fortify
hyaluronan’s unique properties and opens a new fields for application this polysaccharide.
Hyaluronan is producing in Czech Republic at high level of quality by Contipro Group from
Dolní Dobrouč. Thus, they are the reasons for introducing this research field to our university.
Native and hydrophobically modified hyaluronan is in front of our research. Progress in
application field necessarily contains investigation of aggregation behavior in solution,
solubilization properties and the others properties following from structure.
One of the most sensitive, progressive, and modern methods successfully used in
investigation of polymer surfactant, is fluorescence spectroscopy. Widely used fluorescence
probe method looks useful in our research; because of it contains additional information about
investigated system – micellar properties, polarity, fluidity, dimensions.
We hope we are able to contribute with our results to clarification of complicated relations
in this interesting system.
We start with brief summary of presence state of works on the field of polymeric micelles
and polysaccharide derivatives with regard to fluorescence spectroscopy utilization.
1.1. Causa Hyaluronate
Pelletier et al. [1] have applied fluorescence probe method for characterization the dilute
solution behavior of modified sodium hyaluronate and sodium alginate. These two polymers
were esterified by long alkyl chains (C12H25 or C18H37). They also used viscometry, 1H and 13C NMR spectroscopy, SEC coupled to a multi-angle laser light scattering detection for
systems characterization. As fluorescence probe was applied “molecular rotor”
1,1-dicyano-(4’-N,N-dimethylaminophenyl)-1,3-butadiene (TICT-probe). They confirmed the
existence of hydrophobic domain in the aqueous solutions by shift fluorescence maximum
and ratio of quantum yields in the presence and absence of polymer.
HA was also used as a tumor-targeting moiety in drug delivery system with N-(2-
hydroxypropyl)methacrylamide (HPMA) polymer [2]. HMPA–HA–DOX bioconjugate with a
lysosomally degradable peptide linkage clearly demonstrated better internalization and
cytotoxicity as compared to non-targeting HMPA-DOX conjugate. The IC50 value of HPMA–
8
HA–DOX against HBL-100 (breast) cell line was 0.52 µM for 36 wt % loading of HA, which
is more than one order of magnitude better than that of non-targeting HMPA–DOX (18.7
µM). It was found that the systemic toxicity of HMPA–HA–DOX to the primary cells of
murine fibroblast was very low (IC50 = 21.2 µM).
Graft copolymers have been synthesized [3], using hyaluronic acid (HA) as a hydrophilic
backbone and polylactic acid (PLA) as aliphatic polyester; HA–TBA derivative, the reaction
was performed in dimethylsulfoxide adding as a reagent the N-hydroxysuccinimide derivative
of PLA. Characterization techniques were FT-IR, 1H NMR spectroscopy and gel permeation
chromatography, and rheology.
Amphiphilic hydrogel nanoparticles have been prepared by covalent attachment of
hydrophobic tetradecylamine (TDA) to hyaluronic acid (HA) in the presence of 1-ethyl-3(3-
dimethylaminopropyl)carbodiimide and N-hydroxysulfosuccinimide [4]. This derivative was
investigated by using 1H NMR, dynamic light scattering, FLUORESCENCE
SPECTROSCOPY (Pyrene), and transmission electron microscopy (TEM).
Creuzet et al. [5] prepared alkylated derivatives of hyaluronan. HA derivatives were
selectively modified with adipic dihydrazide (HA-ADH) with a substitution degree of 0.08;
then, alkyl chains with different chain lengths were introduced with a substitution degree
around 0.05. Characterization techniques were NMR, FLUORESCENCE SPECTROSCOPY
(Pyrene).
A novel hyaluronan (HA) derivative was synthesized through silylation [6] reaction to
improve the hydrophobicity of HA, to enhance its solubility in common organic solvents, and
to make it more reactive for further derivatizations (e.g. esterification).
Partially acylated hyaluronates, respectively having a different acyl chain and
polysaccharide chain, were prepared as water-soluble derivatives with substitution degrees of
approximately 1/33. The formation of exciplexes under oil-free conditions suggested that the
partial acyl hyaluronates having a hydrophobic-hydrophilic combination such as HA37-P
might form a micellar polymer in water by themselves [7]. This group also studied
hyaluronates with partial palmitoylation [8, 9].
1.2. Modified polysaccharides, sugar-based surfactants, polymers
Zana and Aoudia [10] have investigated aggregation behavior, critical micelle
concentration (cmc) and micelle aggregation number (N) in aqeous solutions of dodecyl
maltoside (DM), octyl glucoside (OG) and Hecameg (6-O-(N-heptylcarbamoyl)methyl-α-D-
glucopyranoside) with addition of the three water soluble polymers, polyoxyethylene (POE),
polyoxypropylene (POP), and polyvinyl pyrrolidone (PVP) by means of fluorescence probing
a time resolved flurescence quenching. They have reported that the N is nearly invariant with
temperature and concentration for DM and Hecameg. OG micelles showed a rather flat
9
minimum of N at around 30 °C. Hecameg and OG showed intermicellar exchanges of
quenchers becoming significant at T>30 °C. DM and OG did not interact with POE and PVP
based on the invariance of N. Interaction with POP has been occurred, and it resulted in a
decreasing of the micelle aggregation number at low temperature. All N was observed up the
60. They have used cetylpyridinium chloride and tetradecyl-p-cyanopyridinium chloride as
quenchers. The surfactant critical micelle concentrations were determined from the variation
of the ratio 1:3 of the intensities in emission spectra of pyrene solubilized in the micellar
solution.
Nichifor and co-workers [11] used fluorescent techniques to characterize the hydrophobic
domain formed by the side chains of polysaccharides carrying N-alkyl-N,N-dimethyl-N-(2-
hydroxypropyl)ammonium chloride pendant groups in dilute aqeuos solution. They have used
pyrene, N-phenylnaphtylamine, and 1,6-diphenyl-3,5,6-hexatriene. They reported that bellow
a certain concentrations the polymers are in extended form because of the electrostatic
interactions. With increasing concentrations, the increasing of ionic strength causes the
changes in conformation to the less extended form, resulting in the association of hydrophobic
side chain. This early state is sensed by fluorophores with different chemical structures and
hydrophobicities and depends strongly on the polymer’s chemical compositions. By
increasing polymer concentration, more small aggregates are formed along a polymer chain
until almost all hydrophobes are included. An association process continues by an increase in
aggregate size. The characteristic of microdomains depend significantly on the length of the
hydrophobic chain and degree of substitutions.
Duval-Terrié and co-workers [12] have used a set of amphiphilic pullulan derivatives of
high modification ratio. They display surface activity, and from this point, they can behave as
molecular surfactants. Two different critical concentrations were evidenced, related to two
different steps of organization. Amphiphilic pullulans may indeed be involved in hydrophobic
associations in bulk solution while adsorbing at the air – water surface. Their behavior in
dilute solutions was investigated by surface tension mesurment and with polarity probe, the
Coomassie Brilliant Blue dye. Amphiphilic pullulans were used to solubilize integral
membrane proteins.
Simon, Dugast, Le Cerf, Picton, and Muller investigated amphiphilic
carboxymethylpullulans, differing in their degree of octyl-bearing groups, in dilute solutions
[13]. To examine conformation and aggregation states in dilute solution they have used
viscometry and flow field-flow fractionation with multi-angle laser light scattering
(4F/MALLLS). They reported polymer/polymer interactions tendency increases with grafting
degree. At lower grafting degree polymer exists in isolated chain stadium. For greater degree
of substitution, strongly compact structure has been evidenced due to strong intramolecular
hydrophobic association. The critical concentration appears to be largely function of the
content of octyl groups and presents a minimum for about 20 % of C8 groups. In the all cases,
10
there is competition between intramolecular and intermolecular interactions depending mainly
on hydrophobic degree and concentration. The transition between dilute and semi-dilute
regime is not classical overlapping phenomenon. For the higher amount of C8, the transition
between intramolecular association and intermolecular associations seems difficult to obtain
in low concentration rage.
Fischer and co-workers [14] used fluorescence spectroscopy to investigate
hydrophobically modified pectin derivatives. These derivatives display an associative
tendency in semidilute aqueous solutions results in the formation of hydrophobic
microdomains. Fluorescent molecular rotors witness the variation of the medium polarity. In
addition, they can also provide further information, particularly about the local cohesion of
the microenvironment of the probe. CAC values derived from polarity changes, using
molecular rotor as the fluorescent probe, are significantly different from those determined
from the cohesion of the microenvironment, accessible only with the molecular rotor.
Hydrophobically modified chitosan derivatives are being studied, with the main focus on
various alkylated chitosan [15, 16], acylated chitosan, e.g. linolenic acid-modified chitosan
[17, 18], palmitoyl chitosan [19-21], and deoxycholic acid-modified chitosan (DAMC) [22-
25]. However, due to the rigidity of the molecular chains in water, it is difficult for
hydrophobically modified chitosan derivatives to form perfect spherical-shaped self-
aggregated nanoparticles [26]. Therefore, we believe that changing the rigidity of chitosan
molecular chains by hydrophilic modification will improve the morphology of this kind of
self-aggregated nanoparticles.
Ortona et al. [27] published way of chitosan derivatization, by applying a very versatile
and quantitative amination reaction. Linear aliphatic chains of length variable from five to 12
carbon atoms have been grafted on the chitosan backbone at 10% in mole of the glycosidic
units. Viscosity and FLUORESCENCE SPECTROSCOPY (Pyrene) have been used to
analyze the intra- and inter-aggregation properties of these modified chitosans, Cn-CHITs,
and to compare them with those of chitosan itself.
Sashiwa and Aiba [28] have published article, in 2004, about chemically modified chitin
and chitosan. Chitin and chitosan are structurally similar to heparin, chondroitin sulfate, and
hyaluronic acid. As well as these mucopolysaccharides (contains carboxyl and sulfuryl
groups – anionic polymers) chitosan is almost the only cationic polysaccharide. Chemical
modification presented in this paper provides derivatives that are soluble at neutral and basic
pH. Modified chitosan is member of polymeric self-assembly systems family (SA’s). His size
could be varied from 130 to 300 nm in diametr. They have reported using deoxycholicacid-
modified chitosan in delivery of adriamycin and using chitosan derivates as physically
crosslinked hydrogel.
About partially modified water soluble polysaccharides pullulan, dextran and mannan
which form by self-assembly hydrogel nanoparticles wrote Akiyoshi and Sunamoto [29].
11
They substituted pullulan by 1.7 cholesterol moieties per 100 glucose units of pullulan. Size-
exclusion column chromatography, light scattering, fluorescence spectroscopy, and electron
micrography were used in investigation solution properties of the hydrophobized
polysaccharides. The particle size (hydrodynamic radius RH) decreases with increase in the
number of cholesterol moieties. A transmission electron micrograph showed that spherical
particles have a narrow size of distribution. The fluorescence quenching study using pyrene –
cetylpyridinium chloride system reveals that one hydrophobic domain consist of
approximately four cholesterol groups. Pullulan with long alkyl chain (ALP) also formed
monodispersive nanoparticles by self-aggregation. One hydrophobic domain of the ALP
selfaggregate consisted of 12-17 alkyl groups. Various water-soluble proteins were
complexed by the CHP self-aggregates; complex showed an excellent colloidal stability.
Sinquin and co-worker presented in 1994 work about behavior of the long-alkyl-chain
derivates of sodium alginate in aqueous solution. They used for evidence aggregation
behavior the fluorescence spectroscopy and rheological measurements. As fluorescence probe
they voted pyrene in concentration ~1 10–6 M. [30].
Work of Benjalloun and co-workers [31] is preliminary work that evidences the
potentialities of molecular rotors as fluorescent probes to detect the formation of hydrophobic
microdomains for amphiphilic polymer, not only on the polarity aspects. Fluorescent rotors
can be advantageously used in the cases where pyrene is excluded due to quenching of its
excited state. They applied fluorescent rotors on homopolymers a copolymers of
3-vinylpyridinium salts. As signal of presentation of the microdomain they used break change
on the wavelength maxima depends on polymer concentration. They have found good
correlation between final plateau value of hypsochromic shift of fluorescence spectra and the
average side-chain length.
1.3. Interaction between polymers and surfactants
Nilsson and Evertsson have measured the microviscosity in dilute solution containing
mixed micelles of the anionic surfactant SDS and non-ionic cellulose ethers of different
hydrophobicity [32]. They have reported that at the critical surfactant concentration where the
clustering process start the microviscosity in the system increases to a maximum, after which
it decreases to an asymptotic level. They used for determination microviscosity by
fluorescence way microviscosity probe 1,3-bis(pyren-1yl)propane.
For determination structural changes of the complex formed by the hyaluronic acid [33],
as its salt, partially modified by a covalently bound fluorescence probe,
4-fluoro-7-nitrobenz-2-oxa-1,3-diazole, and dodecyltrimethylammonium bromide was used
fluorescent depolarization measurement provided by W.F.Reed. He found that conformation
strongly depends on the ionic strength and the surfactant type.
12
In their brief note, Winnik , Regismond, and Goddard, have reported using fluorescence
of pyrene in investigation of the interaction between Quatrisoft (polymer based on chloride
salt of a N,N-dimethyl-N-dodecyl derivative of hydroxyethylcellulose) and a homologous
series of alkyltrimethylamonium halides [34]. As the most important tool, in this case they
marked the pyrene 1:3 ratio. From their fluorescence measurements, it has clearly shown that,
despite the unfovorable electrostatic repulsion, alkyltrimethylamonium surfactants associate
with cationic cellulosic polyectrolytes when these polymers contain hydrophobic groups.
Interesting conclusion is observed decreasing the CMC with increasing length of chain in
surfactant.
13
2. THEORETICAL BACKGROUND
2.1. Hyaluronic acid, hyaluronan, hyaluronates and associative systems
2.1.1. Brief historical overview
In 1934, Karl Meyer and his assistant, John Palmer, isolated a novel glycosaminoglycan
from the vitreous of bovine eyes. They showed that this substance contained only a uronic
acid and an aminosugar. They named the new substances as hyaluronic acid, from hyaloid
(vitreous) + uronic acid. This macromolecule is most frequently referred to as hyaluronan,
reflecting the fact that it exists in vivo as a polyanion and not in the protonated acid form.
During the 1930s and 1940s, hyaluronan was isolated from many sources such as the vitreous
body, synovial fluids, umbilical cord, skin, and rooster comb and also from Streptococci.
The physical-chemical characterization of hyaluronan was carried out during the 1950s
and 1960s. In 1954, the Meyer’s laboratory finally completed the determination of precise
chemical structure of the basic disaccharide motif forms hyaluronan. Result also showed that
structure is stabilized by virtue of electrostatic interactions.
In 1972, Hardigan and Muir discovered that hyaluronan interacts with cartilage
proteoglycans and serves as the central structural backbone of cartilage.
In 1980s was found the secondary and the tertiary structure which hyaluronan form in
aqueous solution. This was investgated by rotary shadowing-electron microscopy.
After 1980, the research spread in many directions, mainly because until that time it had
been assumed that hyaluronan belonged to the proteoglycans, and that its biosynthesis
proceeded in a similar manner.
2.1.2. Chemical and physical properties
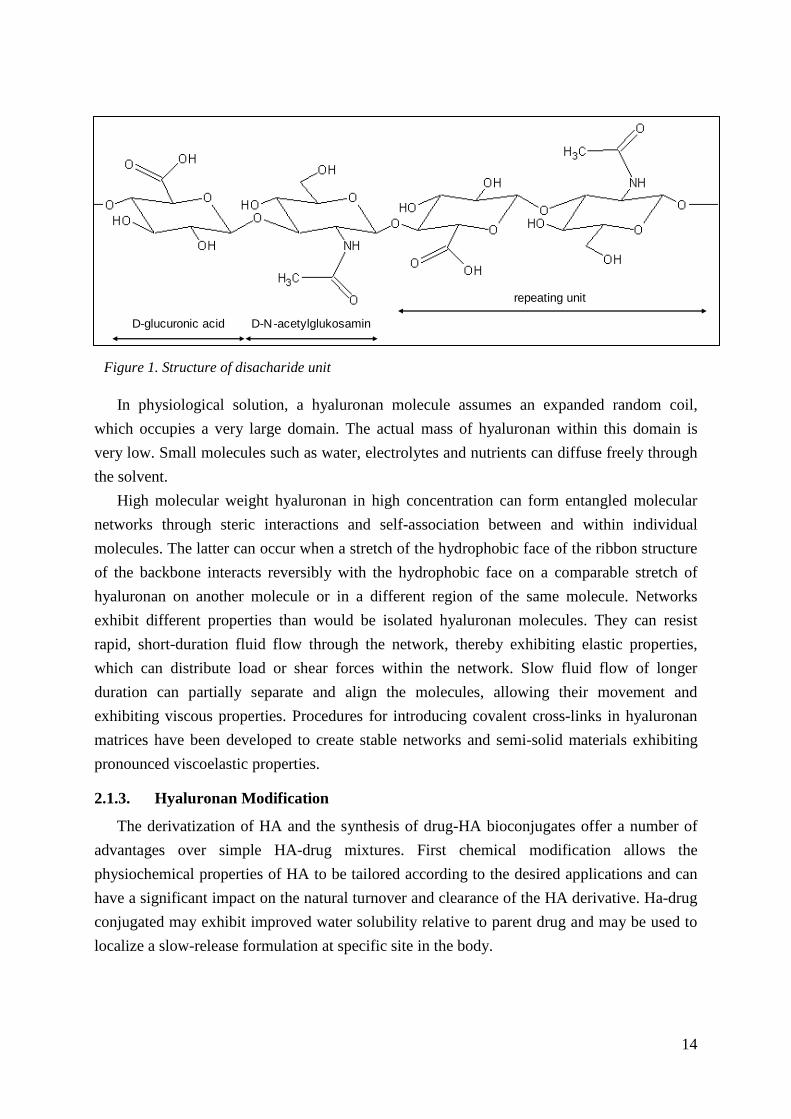
Hyaluronan consists of basic disaccharide units of D-glucoronic acid and D-N-
acetylglucosamine, these being linked together through alternating β-1,4 and β-1,3 glycosidic
bonds (Figure 1.).
The number of repeat disaccharides in a completed hyaluronan molecule can reach 10 000
or more with a molecular mass of ~4 10–6×g mol–1 [35]. At pH 7, the carboxyl groups are
predominantly ionized. In physiological solution, the backbone of a hyaluronan molecule is
stiffened by a combination of the chemical structure of the disaccharide, internal hydrogen
bonds, and interactions with solvent. In addition, the preferred shape in water features
hydrophobic patches on alternating sides of the flat, tape-like secondary structure. The two
sides are identical, so that hyaluronan molecules are ambidextrous, enabling them to
aggregate via specific interactions in water to form meshworks, even at low concentrations.
14
In physiological solution, a hyaluronan molecule assumes an expanded random coil,
which occupies a very large domain. The actual mass of hyaluronan within this domain is
very low. Small molecules such as water, electrolytes and nutrients can diffuse freely through
the solvent.
High molecular weight hyaluronan in high concentration can form entangled molecular
networks through steric interactions and self-association between and within individual
molecules. The latter can occur when a stretch of the hydrophobic face of the ribbon structure
of the backbone interacts reversibly with the hydrophobic face on a comparable stretch of
hyaluronan on another molecule or in a different region of the same molecule. Networks
exhibit different properties than would be isolated hyaluronan molecules. They can resist
rapid, short-duration fluid flow through the network, thereby exhibiting elastic properties,
which can distribute load or shear forces within the network. Slow fluid flow of longer
duration can partially separate and align the molecules, allowing their movement and
exhibiting viscous properties. Procedures for introducing covalent cross-links in hyaluronan
matrices have been developed to create stable networks and semi-solid materials exhibiting
pronounced viscoelastic properties.
2.1.3. Hyaluronan Modification
The derivatization of HA and the synthesis of drug-HA bioconjugates offer a number of
advantages over simple HA-drug mixtures. First chemical modification allows the
physiochemical properties of HA to be tailored according to the desired applications and can
have a significant impact on the natural turnover and clearance of the HA derivative. Ha-drug
conjugated may exhibit improved water solubility relative to parent drug and may be used to
localize a slow-release formulation at specific site in the body.
D-glucuronic acid D-N -acetylglukosamin
repeating unit
Figure 1. Structure of disacharide unit
15
The most commonly used modification procedures use as targets carboxyl group from the
glucuronic sub-unit and hydroxyl group on C6 from N-acetylglukosamine sub-unit. Main
procedures are (according to G. D. Prestwich [35-37]): a) Reaction with the carboxylic group
• Esterification (alkylation of the tetra(n-butyl)ammonium salt of hyaluronan with
an alkyl halide in dimethylformamide(DMF) solution - at higher percentage of
esterification is become insoluble in water).
• Carbodiimide-mediated reactions (generally performed in water at pH 4.75
where the carboxylic group is protonated; the most important derivative is the
HA-Taxol® bioconjugate, which is preparing with adipic dihydrazide and ester
activated Taxol®).
b) Reactions with hydroxyl groups
• Sulfation (for blood-compatible material for medical device coating).
• Esterification (with butyric acid, as the inducing cell differential agent, HA is
coupled to form novel drug-delivery system targeted specifically to tumor cells).
• Isourea coupling (this method contain cyanogens bromide activation of the HA
to produce highly reactive isourea intermediate).
• Periodate oxidation (reactive bisaldehyde functionalities can be generated from
the vicinal secondary alcohol functions on hyaluronan by oxidation with sodium
periodate).
c) Reducing end modification
d) Amide modification
e) Cross-linking strategies
• Bisepoxide and divinylsulfone cross-linking
• Internal esterification
• Photocross-linking
• Glutaraldehyde cross-linking
• Metal cation-mediated cross-linking
• Carbodiimide cross-linking
• Hydrazide cross-linking
• Crosslinking with residual proteins
• Multi-component reactions
• Surface modification
16
2.1.4. Micelle formation
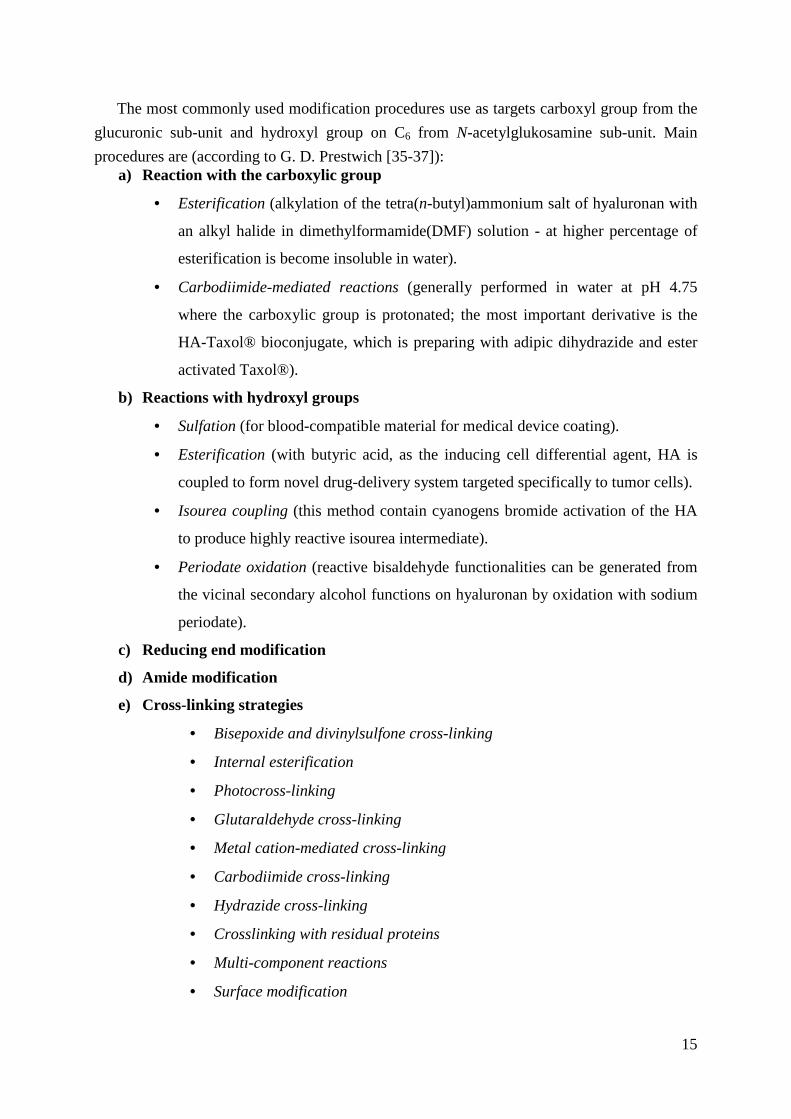
It is well known that surfactants, detergents, or surface-active substances are amphiphilic
molecules. These molecules are consisting of polar group or hydrophilic group (head-group)
and non-polar group or hydrophobic tail (tail-group). To minimize unfavourable solvophobic
interactions, they spontaneously aggregate to form variety of microstructures above a certain
critical concentration (termed CMC or CAC). These molecules associate in aqueous solution
to form large molecular aggregates of colloidal dimensions termed micelles [38]. We can say
that micelles are the simplest of all amphiphilic self-organizing structures. Because they
display rather narrow size distributions, we often can characterize micelles by a single
aggregation number N.
Micelle formation is a cooperative association process. Bellow the critical micelle
concentration the surfactants exist mostly as monomers. Above the CMC, there exists a
dynamic equilibrium between the monomers and micelles. Equilibrium is determined by
equilibrium constant Kn. Three mechanisms; by kinetic point of view, were determined to
describe micelle formation.
First is a stepwise addition of a monomer, S, to the aggregate, Sn-1, as in
nn SSS ↔+ −1 . (2.2.1)
If we neglect additional interactions between aggregates and between monomers, we can
write the equilibrium given in Eq. 2.2.1 as [ ]
[ ][ ]1−
=n
nn SS
SK . (2.2.2)
Previous idea, isodesmic model, is useful in dilute solutions when n is approximately from
0 to 100. In situations that n exceed 100, we must specify a rather intractable number of
equilibrium constants Kn. This model also assumes that Kn is independent of n and
aggregation is a continuous process that does not show the abrupt onset in a narrow
concentration range that typifies micelle formation. Isodesmic model is useful in a description
of the dye’s association in aqueous solutions.
Figure 2. Model of simple surfactant with counter ion (sodium dodecyl sulphate)
17
The second, phase separation, model approximates aggregation as a phase separation
process in which the activity of the monomer remains constant above the CMC. It captures
the start mechanism of aggregation but no stop mechanism.
The third mode is the closed-association model. It assumes that one aggregation number N
dominates. With only monomers and N-aggregates,
NSSN ↔⋅ . (2.2.3)
[ ][ ]N
NN
S
SK = . (2.2.4)
This model describes both start and stop features. The total surfactants concentration in
terms of moles of monomers is
[ ] [ ] [ ] [ ] [ ]SSNKSSNS NNNT +=+= . (2.2.5)
KN relates to the other equilibrium constants of eq. 1.1.2 by
∏= nN
N KK 2 . (2.2.6)
2.2. Fluorescence spectroscopy
2.2.1. Electronic transition in polyatomic molecule
An electronic transition consists of the promotion of an electron from an orbital of a
molecule in the ground state to an unoccupied orbital by absorption of a photon. The molecule
is then said to be in an excited state. A σ orbital can be formed either from two “s” atomic
orbitals, “s” and “p” orbitals, or from two “p” orbitals. The bond formed in this way is called
a σ bond. A π orbital, π bond, is formed from two “p” orbitals overlapping laterally. A
molecule may also possess non-bonding electrons on heteroatoms such as oxygen or nitrogen,
is called n orbital. Absorption of a photon of appropriate energy can promote for example one
of the π electrons to an antibonding orbital π*. he energy of these electronic transitions is
generally in the following order:
n → π* < π → π* < n →σ* < σ → π* < σ → σ*.
In absorption and fluorescence spectroscopy, two important types of orbitals are
considered: HOMO (highest occupied molecular orbital) and LUMO (lowest unoccupied
molecular orbital) [40].
When one electron of two electrons of opposite spins is promoted to a molecular orbital of
higher energy, its spin is in principle unchanged – total spin quantum number (S) remains
equal to zero. Because the multiplicities (M = 2S + 1) of both the ground and excited states is
equal to 1, both are called single state, denoted as Sx for general state. Molecule in a singlet
state may undergo conversion into a state where the promoted electron has changed its spin –
there are two electrons with parallel spins, so the multiplicity is equal to three. Such a state is
called a triplet because it corresponds to three states of equal energy. According to Hund’s
18
E1
E2
B12 B21 A21
Figure 3. Scheme for definition Einstein coefficients
rule, the triplet state has lower energy than that of the singlet state of the same configuration
[41, 42].
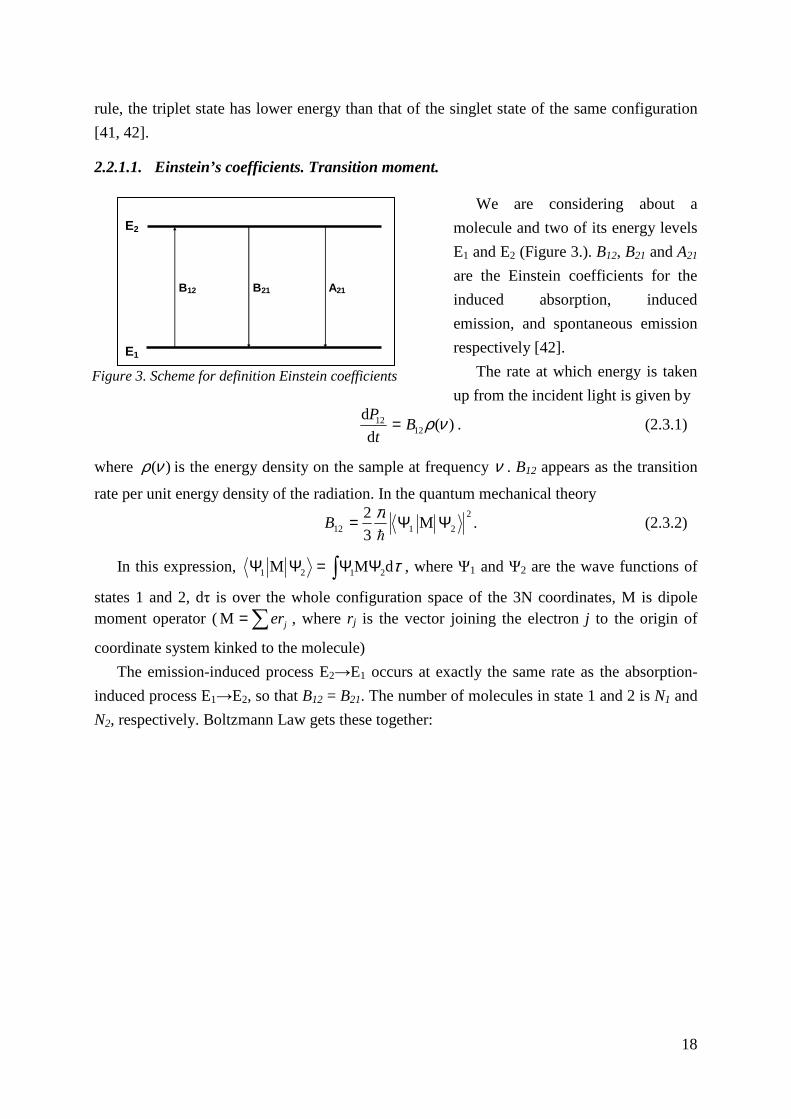
2.2.1.1. Einstein’s coefficients. Transition moment.
We are considering about a
molecule and two of its energy levels
E1 and E2 (Figure 3.). B12, B21 and A21
are the Einstein coefficients for the
induced absorption, induced
emission, and spontaneous emission
respectively [42].
The rate at which energy is taken
up from the incident light is given by
)(d
d12
12 νρBt
P = . (2.3.1)
where )(νρ is the energy density on the sample at frequency ν . B12 appears as the transition
rate per unit energy density of the radiation. In the quantum mechanical theory 2
2112 M3
2 ΨΨ=h
πB . (2.3.2)
In this expression, τdMM 2121 ∫ ΨΨ=ΨΨ , where Ψ1 and Ψ2 are the wave functions of
states 1 and 2, dτ is over the whole configuration space of the 3N coordinates, M is dipole moment operator ( ∑= jerM , where r j is the vector joining the electron j to the origin of
coordinate system kinked to the molecule)
The emission-induced process E2→E1 occurs at exactly the same rate as the absorption-
induced process E1→E2, so that B12 = B21. The number of molecules in state 1 and 2 is N1 and
N2, respectively. Boltzmann Law gets these together:
19
( )[ ] ( )kThkTEEN
N/exp/exp 21
2
1 ν=−− . (2.3.3)
After several modifications, we get
213
3
21
8B
c
hA
νπ= , (2.3.4)
and note that the ratio A21/B21 is proportional the cube of the frequency. For this reason for
long wavelengths (e.g. radiofrequencies), the spontaneous emission is negligible.
2.2.1.2. Selection rule
a) Spin-forbidden transition. Transitions between states of different multiplicities are
forbidden. The intersystem crossing between S1 to T1 is possible thanks to spin-orbit
coupling. The efficiency of this coupling varies with the fourth power of the atomic
number.
b) Symmetry-forbidden transition. A transition can be forbidden for symmetry reasons.
Symmetry –forbidden transition can nevertheless be observed because the molar
vibrations cause some departure from perfect symmetry (vibronic coupling).
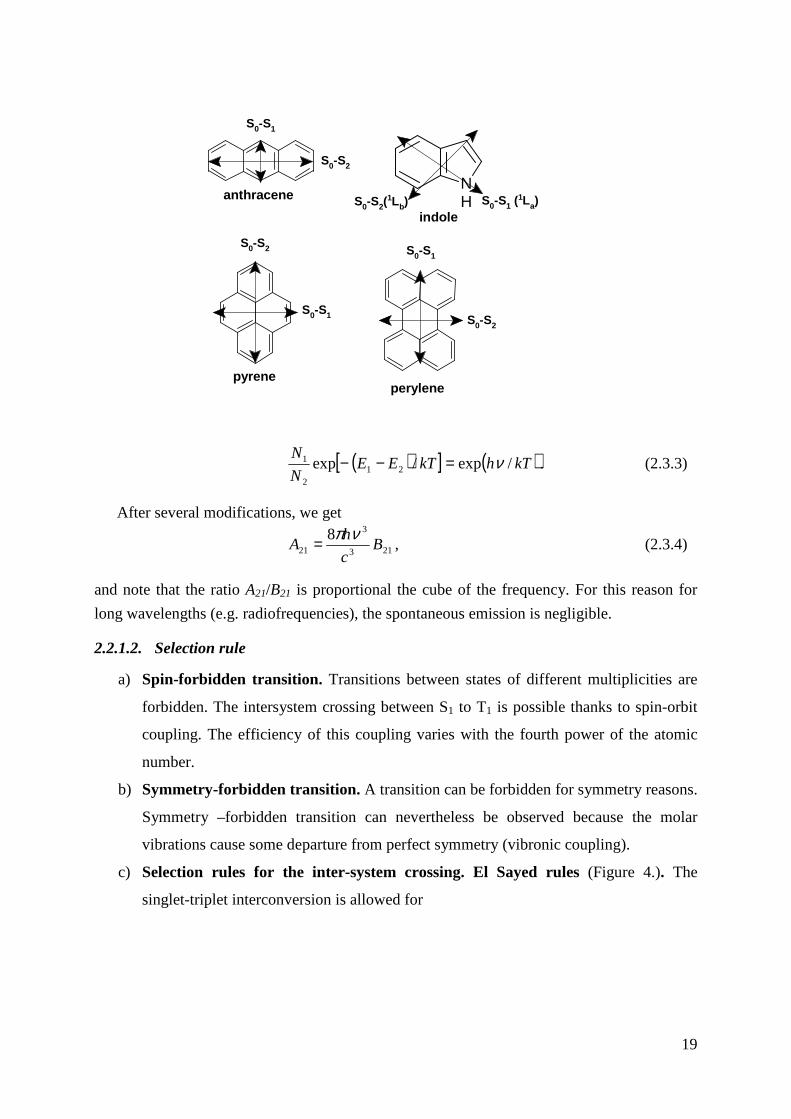
c) Selection rules for the inter-system crossing. El Sayed rules (Figure 4.). The
singlet-triplet interconversion is allowed for
pyrene
S0-S1
S0-S2
anthracene
S0-S1
S0-S2
perylene
S0-S1
S0-S2
NH
indoleS0-S1 (
1La)S0-S2(1Lb)
20
O O
1(n,ππππ*) 3(ππππ,ππππ*)
O O
1(n,ππππ*) 3(n,ππππ*)
X
O
1(ππππ,ππππ*)
O
3(n,ππππ*)
O
1(ππππ,ππππ*)
O
3(ππππ,ππππ*)
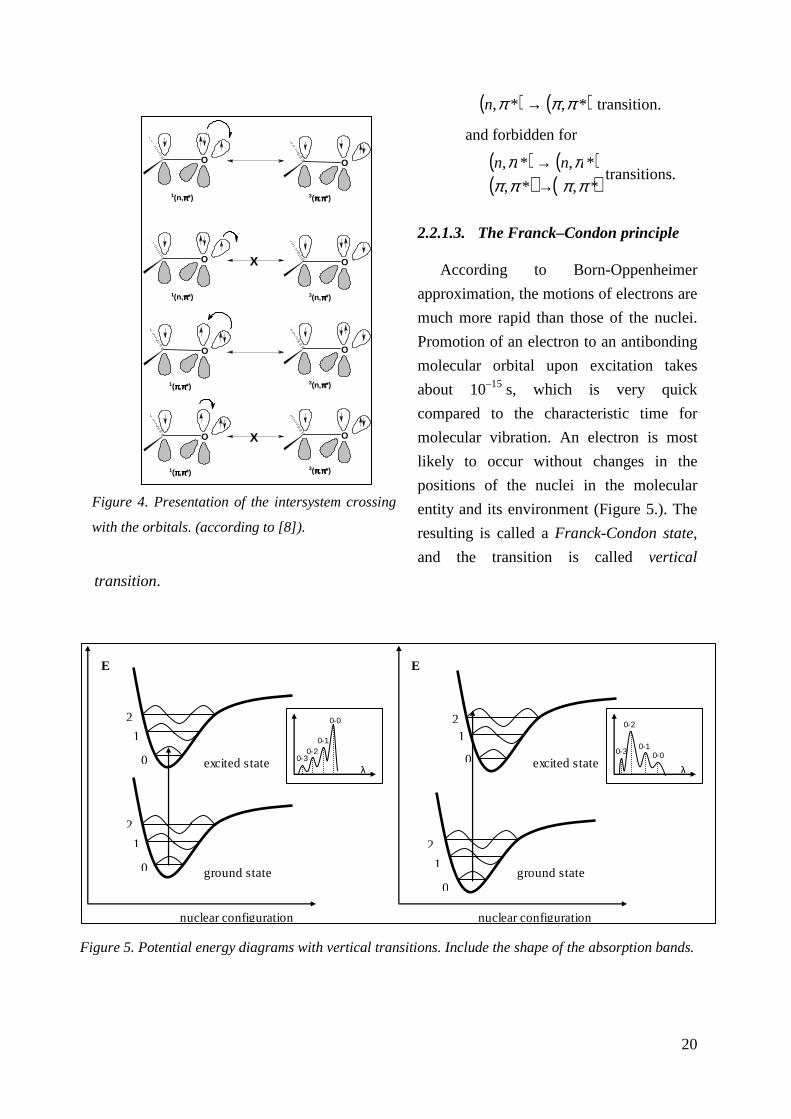
X
Figure 4. Presentation of the intersystem crossing
with the orbitals. (according to [8]).
( ) ( )*,*, πππ →n transition.
and forbidden for
( ) ( )( ) ( )*,*,
*,*,
ππππππ
→→ nn
transitions.
2.2.1.3. The Franck–Condon principle
According to Born-Oppenheimer
approximation, the motions of electrons are
much more rapid than those of the nuclei.
Promotion of an electron to an antibonding
molecular orbital upon excitation takes
about 10–15 s, which is very quick
compared to the characteristic time for
molecular vibration. An electron is most
likely to occur without changes in the
positions of the nuclei in the molecular
entity and its environment (Figure 5.). The
resulting is called a Franck-Condon state,
and the transition is called vertical
transition.
excited state
ground state0
1
2
0
1
2
0
1
2
0
12
excited state
ground state
E E
nuclear configuration nuclear configuration
λ
0-0
0-10-2
0-3
λ0-0
0-1
0-2
0-3
Figure 5. Potential energy diagrams with vertical transitions. Include the shape of the absorption bands.
21
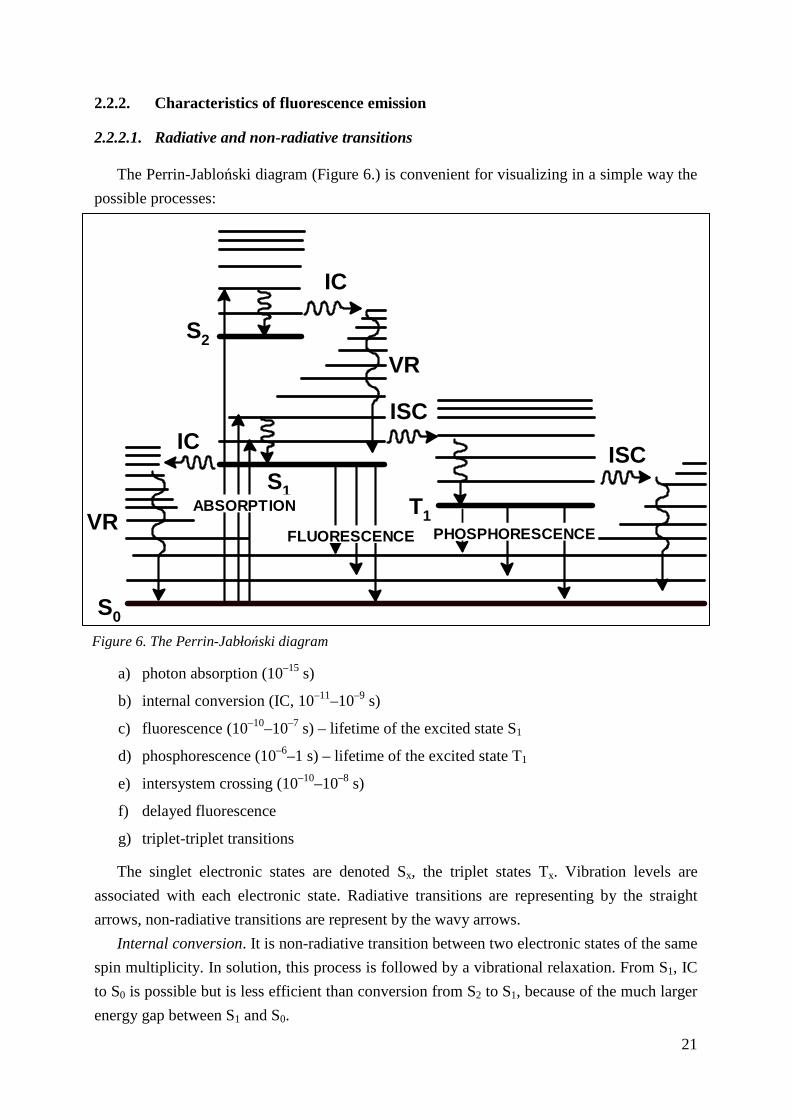
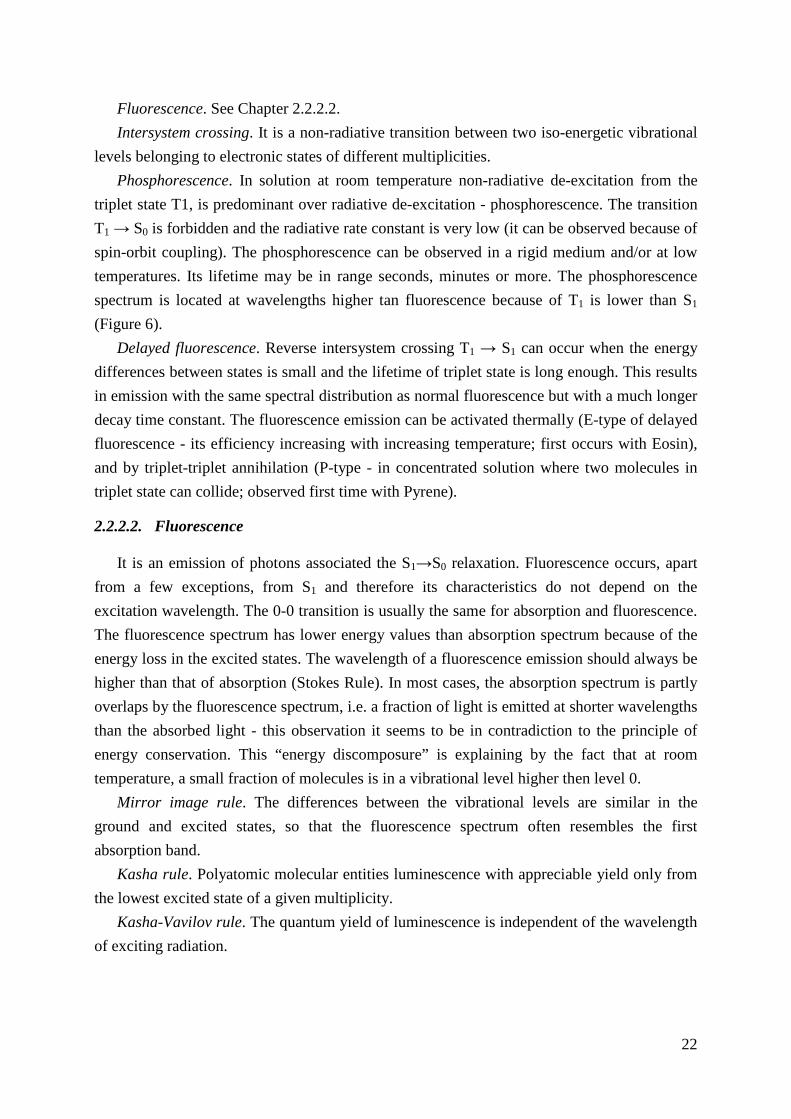
2.2.2. Characteristics of fluorescence emission
2.2.2.1. Radiative and non-radiative transitions
The Perrin-Jabloński diagram (Figure 6.) is convenient for visualizing in a simple way the
possible processes:
a) photon absorption (10–15 s)
b) internal conversion (IC, 10–11–10–9 s)
c) fluorescence (10–10–10–7 s) – lifetime of the excited state S1
d) phosphorescence (10–6–1 s) – lifetime of the excited state T1
e) intersystem crossing (10–10–10–8 s)
f) delayed fluorescence
g) triplet-triplet transitions
The singlet electronic states are denoted Sx, the triplet states Tx. Vibration levels are
associated with each electronic state. Radiative transitions are representing by the straight
arrows, non-radiative transitions are represent by the wavy arrows.
Internal conversion. It is non-radiative transition between two electronic states of the same
spin multiplicity. In solution, this process is followed by a vibrational relaxation. From S1, IC
to S0 is possible but is less efficient than conversion from S2 to S1, because of the much larger
energy gap between S1 and S0.
S1
S2
T1
S0
ISCIC
ISC
IC
VR
VRABSORPTION
FLUORESCENCE PHOSPHORESCENCE
Figure 6. The Perrin-Jabłoński diagram
22
Fluorescence. See Chapter 2.2.2.2.
Intersystem crossing. It is a non-radiative transition between two iso-energetic vibrational
levels belonging to electronic states of different multiplicities.
Phosphorescence. In solution at room temperature non-radiative de-excitation from the
triplet state T1, is predominant over radiative de-excitation - phosphorescence. The transition
T1 → S0 is forbidden and the radiative rate constant is very low (it can be observed because of
spin-orbit coupling). The phosphorescence can be observed in a rigid medium and/or at low
temperatures. Its lifetime may be in range seconds, minutes or more. The phosphorescence
spectrum is located at wavelengths higher tan fluorescence because of T1 is lower than S1
(Figure 6).
Delayed fluorescence. Reverse intersystem crossing T1 → S1 can occur when the energy
differences between states is small and the lifetime of triplet state is long enough. This results
in emission with the same spectral distribution as normal fluorescence but with a much longer
decay time constant. The fluorescence emission can be activated thermally (E-type of delayed
fluorescence - its efficiency increasing with increasing temperature; first occurs with Eosin),
and by triplet-triplet annihilation (P-type - in concentrated solution where two molecules in
triplet state can collide; observed first time with Pyrene).
2.2.2.2. Fluorescence
It is an emission of photons associated the S1→S0 relaxation. Fluorescence occurs, apart
from a few exceptions, from S1 and therefore its characteristics do not depend on the
excitation wavelength. The 0-0 transition is usually the same for absorption and fluorescence.
The fluorescence spectrum has lower energy values than absorption spectrum because of the
energy loss in the excited states. The wavelength of a fluorescence emission should always be
higher than that of absorption (Stokes Rule). In most cases, the absorption spectrum is partly
overlaps by the fluorescence spectrum, i.e. a fraction of light is emitted at shorter wavelengths
than the absorbed light - this observation it seems to be in contradiction to the principle of
energy conservation. This “energy discomposure” is explaining by the fact that at room
temperature, a small fraction of molecules is in a vibrational level higher then level 0.
Mirror image rule. The differences between the vibrational levels are similar in the
ground and excited states, so that the fluorescence spectrum often resembles the first
absorption band.
Kasha rule. Polyatomic molecular entities luminescence with appreciable yield only from
the lowest excited state of a given multiplicity.
Kasha-Vavilov rule. The quantum yield of luminescence is independent of the wavelength
of exciting radiation.
23
After excitation of a population of molecules by a very short pulse of light, the
fluorescence intensity decreases exponentially with a characteristic time, reflecting the
average lifetime of the molecules in the S1 excited state.
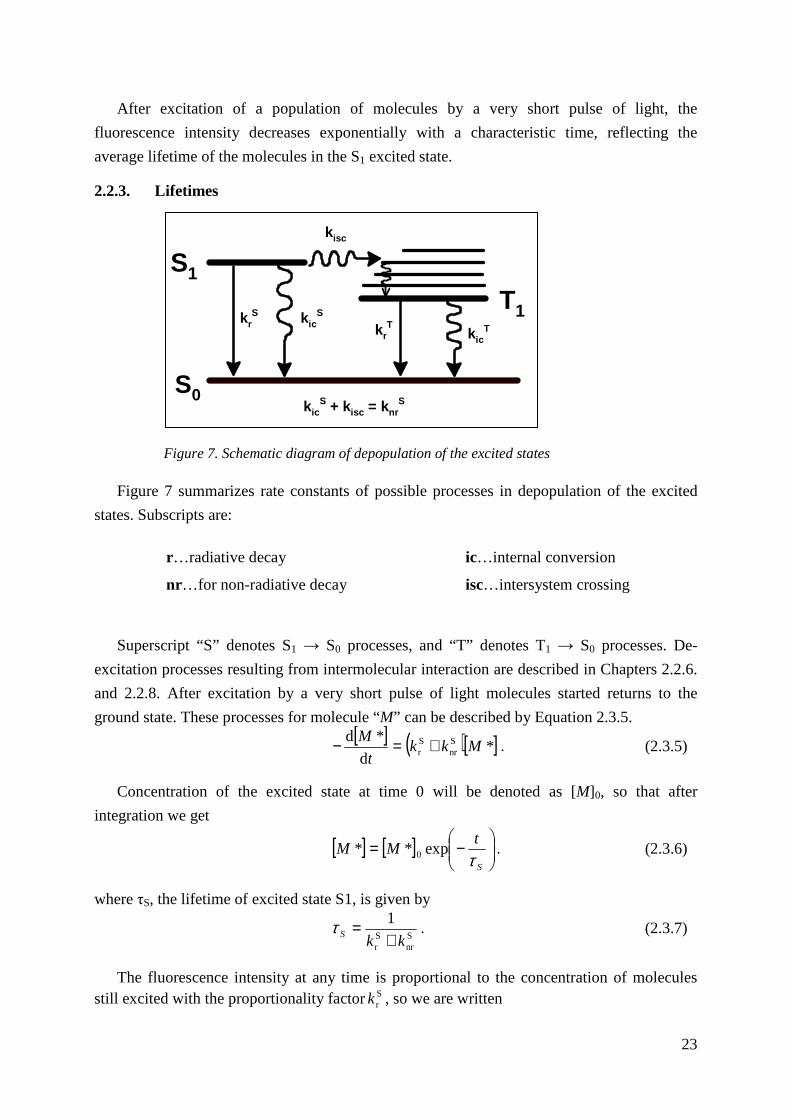
2.2.3. Lifetimes
Figure 7 summarizes rate constants of possible processes in depopulation of the excited
states. Subscripts are:
r…radiative decay ic…internal conversion
nr…for non-radiative decay isc…intersystem crossing
Superscript “S” denotes S1 → S0 processes, and “T” denotes T1 → S0 processes. De-
excitation processes resulting from intermolecular interaction are described in Chapters 2.2.6.
and 2.2.8. After excitation by a very short pulse of light molecules started returns to the
ground state. These processes for molecule “M” can be described by Equation 2.3.5. [ ] ( )[ ]*d
*d Snr
Sr Mkk
t
M +=− . (2.3.5)
Concentration of the excited state at time 0 will be denoted as [M]0, so that after
integration we get
[ ] [ ]
−=
S
tMM
τexp** 0 . (2.3.6)
where τS, the lifetime of excited state S1, is given by
Snr
Sr
1
kkS +
=τ . (2.3.7)
The fluorescence intensity at any time is proportional to the concentration of molecules still excited with the proportionality factorSrk , so we are written
Figure 7. Schematic diagram of depopulation of the excited states
S1
T1
S0
krS kic
S
kisc
krT
kicT
kicS + kisc = knr
S
24
[ ] [ ]
−==
S
tMkMkti
τexp**)( 0
Sr
SrF . (2.3.8)
It’s obvious the δ-pulse response of the system, iF(t), decrease according to a single
exponential.
The fluorescence decay time τS is one of the most important characteristic of a fluorescent
molecule because it defines the time window of observation of dynamic phenomena. No
accurate information on the rate of phenomena occurring at time-scale shorter than about
τ/100 or longer than about 10τ can be obtained.
2.2.4. Quantum yields
The fluorescence quantum yield ΦF is the fraction of excited molecules that return to the
ground state S0 with emission of fluorescence photons:
Skkk
k τSrS
nrSr
Sr
FΦ =+
= . (2.3.9)
According to Eq. 2.3.8 and integration, we get
[ ]∫∞
Φ==0 FS
SrF d)(
*
1 τkttiM
. (2.3.10)
Using radiative lifetime τr as Sr1 k , the fluorescence quantum yield can be also written as
r
S
ττ
=FΦ . (2.3.11)
2.2.5. Steady-state fluorescence intensity
In steady-state measurements, we illuminate the sample, with molecule’s concentration
[M], by the photons with the constant amount N0. Expression αN0 represents the amount of
absorbed photons per unit volume involved in excitation process - pseudo-first rate constant for absorption of the photon is very large ( 15
a s10 −≈k ). Rate constants for radiative and
non-radiative decay have values between 107 and 1010 s–1.
Under continuous illumination, the concentration [M*] remains constant. This means M*
is in steady-state. The rate of change [M*] is equal to zero, and [ ] ( )[ ]*α0d
*d Snr
Sr0a MkkNk
t
M +−== . (2.3.12)
Expression 0aαNk represents the amount of absorbed photon per unit volume and per unit
time. It can be written as 0αI where 0I represents intensity of incident light (moles of photon
per litre and second). So, the steady concentration of the M* can be written as
[ ]Snr
Sr
0α*kk
IM
+= . (2.3.13)
25
According to Equation 2.3.8 for steady-state fluorescence intensity we obtain
[ ] F0Snr
Sr
Sr
0SrF αα* Φ=
+== I
kk
kIMki . (2.3.14)
2.2.6. Quenching
We introduce to the system, solvent – probe, another apolar component – fluorescent
quencher. If the excited molecule of fluorescence comes close to the quencher, a rapid non-
radiative decay of the fluorescent state occurs and the probe molecules do not produce any
fluorescence.
2.2.6.1. Collisional-quenching mechanism
When an excited state M* is quenched by collision with a quencher Q, the simplest form of
the rate equation is [ ] [ ]( )[ ]** d/d MQkkItM qMSex +−= , (2.3.15)
which under steady-state condition leads to the Stern-Volmer equation [ ] [ ] ( )[ ]QkkMM SqMq /1/ *
0* += . (2.3.16)
There are SSk τ=−1 as lifetime of excited state, qMk as the collisional quenching rate
constant and ratio SqM kk / as the Stern-Volmer quenching constantSVK . Variations in
fluorescence intensities II /0 versus [Q] (in which I0 and I are intensities in the absence and
presence of Q respectively) fit by a least square’s method to the best straight-line yields to the
experimental parameter Kobs.
2.2.7. Polarization and anisotropy
Upon excitation with polarized light, the emission from many samples is also polarized.
The extent of polarization of the emission is described in terms of the anisotropy (r). Samples
exhibiting non-zero anisotropies are said to display polarized emission.
A number of phenomena can cause depolarization of the emission: rotational diffusion,
energy transfer, angle between absorption and emission dipole, scattering the incident light,
etc.
Fields of application of fluorescence polarization contain: a) spectroscopy - difference between excited states
b) polymers - chain dynamics; local viscosity in polymer environments
c) micellar system - internal microviscosity of micelles; fluidity
d) biological membranes - fluidity; phase transition temperature
e) molecular biology - DNA-protein interaction
f) immunology - immunoassays
26
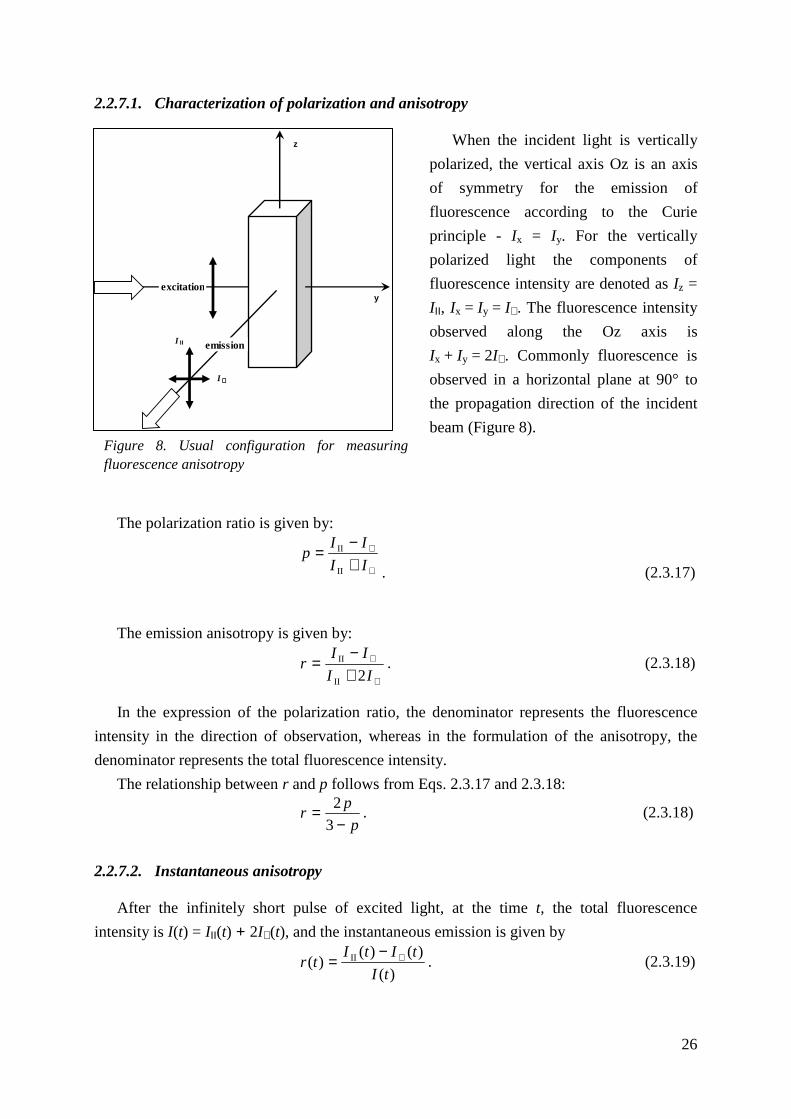
2.2.7.1. Characterization of polarization and anisotropy
When the incident light is vertically
polarized, the vertical axis Oz is an axis
of symmetry for the emission of
fluorescence according to the Curie
principle - Ix = Iy. For the vertically
polarized light the components of
fluorescence intensity are denoted as Iz =
III, Ix = Iy = I⊥. The fluorescence intensity
observed along the Oz axis is
Ix + Iy = 2I⊥. Commonly fluorescence is
observed in a horizontal plane at 90° to
the propagation direction of the incident
beam (Figure 8).
The polarization ratio is given by:
⊥
⊥
+−
=II
IIp
II
II
. (2.3.17)
The emission anisotropy is given by:
⊥
⊥
+−
=II
IIr
2II
II . (2.3.18)
In the expression of the polarization ratio, the denominator represents the fluorescence
intensity in the direction of observation, whereas in the formulation of the anisotropy, the
denominator represents the total fluorescence intensity.
The relationship between r and p follows from Eqs. 2.3.17 and 2.3.18:
p
pr
−=
3
2. (2.3.18)
2.2.7.2. Instantaneous anisotropy
After the infinitely short pulse of excited light, at the time t, the total fluorescence
intensity is I(t) = III(t) + 2I⊥(t), and the instantaneous emission is given by
)(
)()()( II
tI
tItItr ⊥−
= . (2.3.19)
Figure 8. Usual configuration for measuring fluorescence anisotropy
excitationy
z
I II
I ⊥⊥⊥⊥
emission
27
Each polarized component evolves according to
[ ] [ ])(13
)()( ; )(21
3
)()(II tr
tItItr
tItI −=+= ⊥ . (2.3.20)
2.2.7.3. Steady-state anisotropy
Steady state anisotropy r is measured under the continuous illumination [40, 41, 42].
With the general definition of an averaged quantity, with the total normalized fluorescence
intensity as the probability law, we obtain
∫
∫∞
∞
=
0
0
d)(
d)()(
ttI
ttItrr . (2.3.21)
So, in the case of a single exponential decay with the excite-state lifetime τ, the steady-
state anisotropy is given by
∫∞
−=0
d)/exp()(1
tttrr ττ
. (2.3.22)
In the case samples contains a mixture of fluorophores, the important relation is that total
emission anisotropy is the weighted sum of the individual anisotropies:
∑=i
ii rfr . (2.3.23)
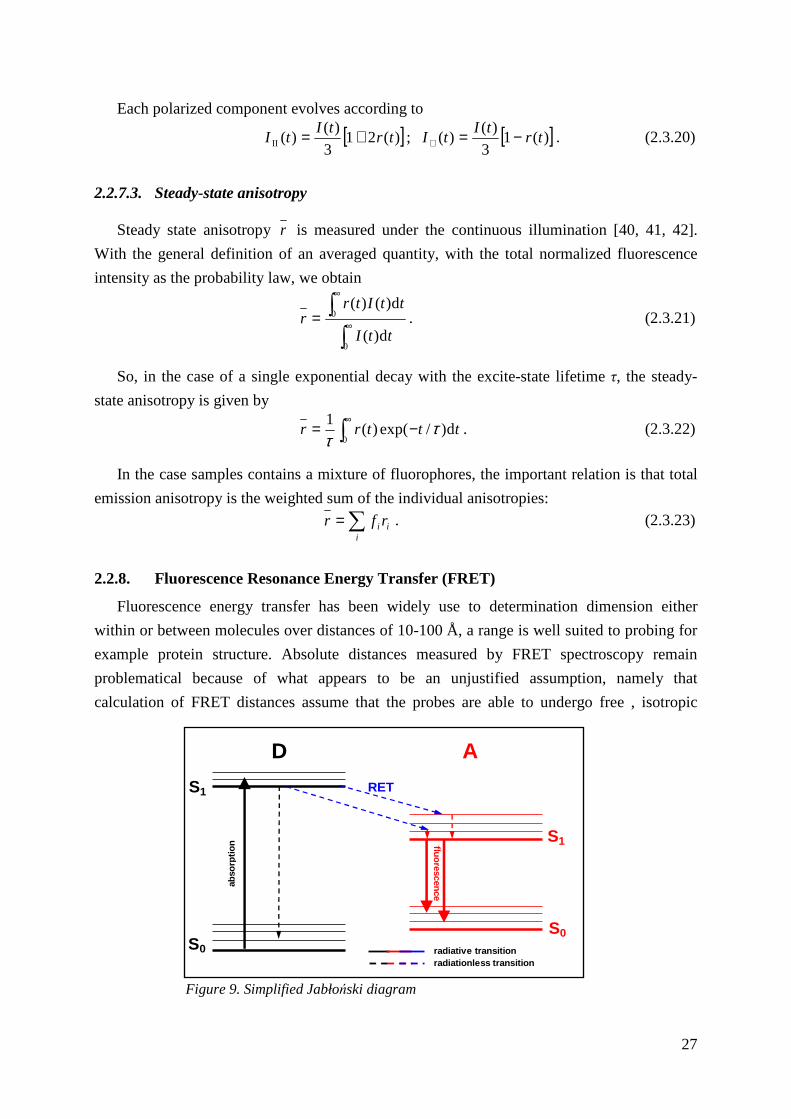
2.2.8. Fluorescence Resonance Energy Transfer (FRET)
Fluorescence energy transfer has been widely use to determination dimension either
within or between molecules over distances of 10-100 Å, a range is well suited to probing for
example protein structure. Absolute distances measured by FRET spectroscopy remain
problematical because of what appears to be an unjustified assumption, namely that
calculation of FRET distances assume that the probes are able to undergo free , isotropic
D A
S1
S0
S1
S0 radiative transitionradiationless transition
RET
abso
rptio
n fluorescence
Figure 9. Simplified Jabłoński diagram
28
motion. Common sense suggests that a large (300–500 g mol–1) hydrophobic FRET probe
covalently bound to polymer chain can not undergo true rotational freedom [43].
Simplified mechanism of radiationless (resonance) energy transfer from donor to acceptor
is displayed in Figure 9 Condition for FRET: a) a donor has a high quantum yield (φD)
b) existence overlap of donor emission spectrum and acceptor absorption spectrum (JDA)
c) there is an appropriate alignment of the absorption and emission transition moments
and their separation vector ( parameter κ2)
d) the donor-acceptor distances are within (1 ± 0.5)R0 of each other.
ad a) The quantum yield of the donor is defined as the ratio of the number of photons
emitted to the number absorbed. It is parameter which depends on the immediate
environment of the probe.
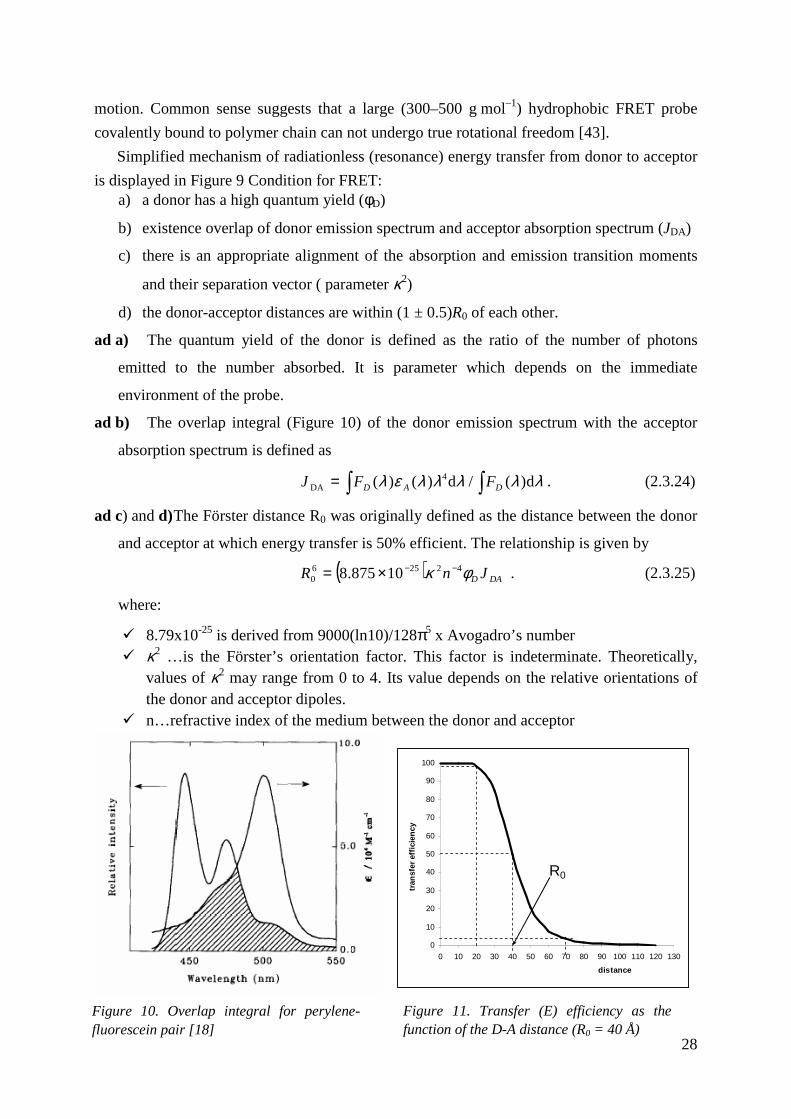
ad b) The overlap integral (Figure 10) of the donor emission spectrum with the acceptor
absorption spectrum is defined as
∫∫= λλλλλελ d)(/d)()( 4DA DAD FFJ . (2.3.24)
ad c) and d) The Förster distance R0 was originally defined as the distance between the donor
and acceptor at which energy transfer is 50% efficient. The relationship is given by
( ) 10875.8 422560 DAD JnR φκ −−×= . (2.3.25)
where:
� 8.79x10⁻²⁵ is derived from 9000(ln10)/128π5 x Avogadro’s number � κ2 …is the Förster’s orientation factor. This factor is indeterminate. Theoretically,
values of κ2 may range from 0 to 4. Its value depends on the relative orientations of the donor and acceptor dipoles.
� n…refractive index of the medium between the donor and acceptor
Figure 10. Overlap integral for perylene-fluorescein pair [18]
0
10
20
30
40
50
60
70
80
90
100
0 10 20 30 40 50 60 70 80 90 100 110 120 130
distance
tran
sfer
eff
icie
ncy
R0
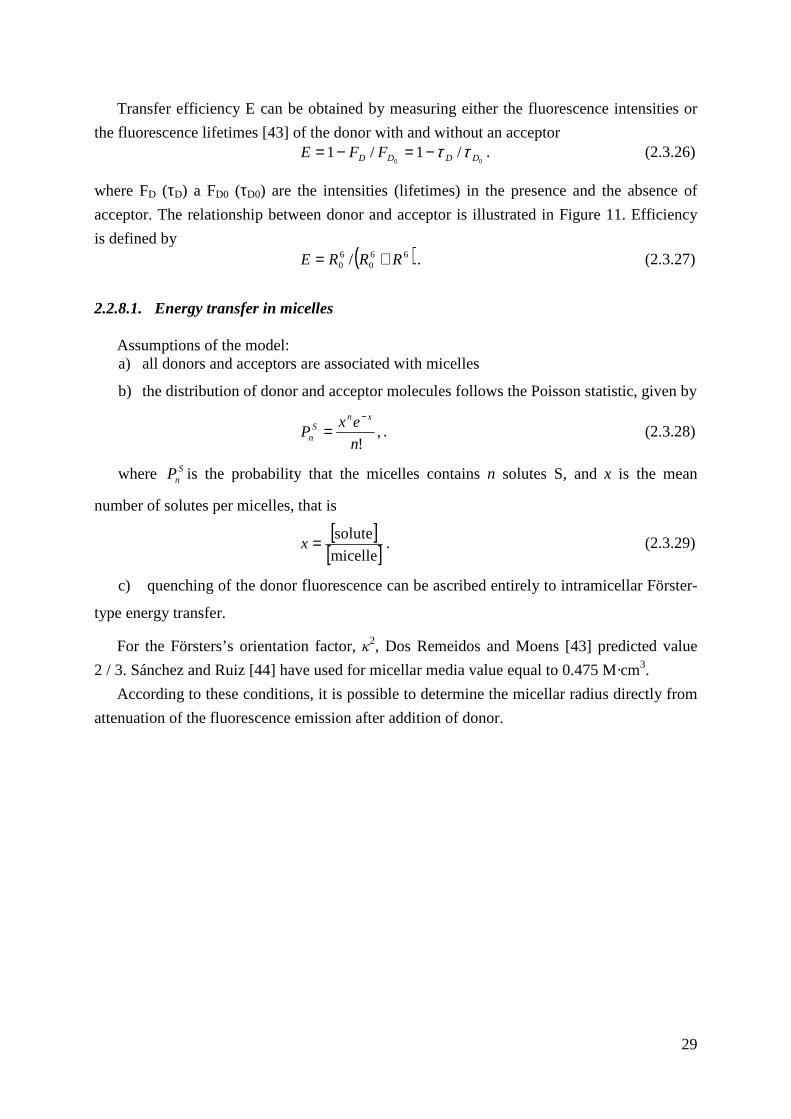
Figure 11. Transfer (E) efficiency as the function of the D-A distance (R0 = 40 Å)
29
Transfer efficiency E can be obtained by measuring either the fluorescence intensities or
the fluorescence lifetimes [43] of the donor with and without an acceptor
00/1/1 DDDD FFE ττ−=−= . (2.3.26)
where FD (τD) a FD0 (τD0) are the intensities (lifetimes) in the presence and the absence of
acceptor. The relationship between donor and acceptor is illustrated in Figure 11. Efficiency
is defined by ( )66
060 / RRRE += . (2.3.27)
2.2.8.1. Energy transfer in micelles
Assumptions of the model: a) all donors and acceptors are associated with micelles
b) the distribution of donor and acceptor molecules follows the Poisson statistic, given by
,!n
exP
xnS
n
−
= . (2.3.28)
where SnP is the probability that the micelles contains n solutes S, and x is the mean
number of solutes per micelles, that is
[ ][ ]micelle
solute=x . (2.3.29)
c) quenching of the donor fluorescence can be ascribed entirely to intramicellar Förster-
type energy transfer.
For the Försters’s orientation factor, κ2, Dos Remeidos and Moens [43] predicted value
2 / 3. Sánchez and Ruiz [44] have used for micellar media value equal to 0.475 M·cm3.
According to these conditions, it is possible to determine the micellar radius directly from
attenuation of the fluorescence emission after addition of donor.
30
3. APPLICATION OF THE FLUORESCENCE SPECTROSCOPY
3.1. PROBES FOR AGGREGATION BEHAVIOR INVESTIGATION
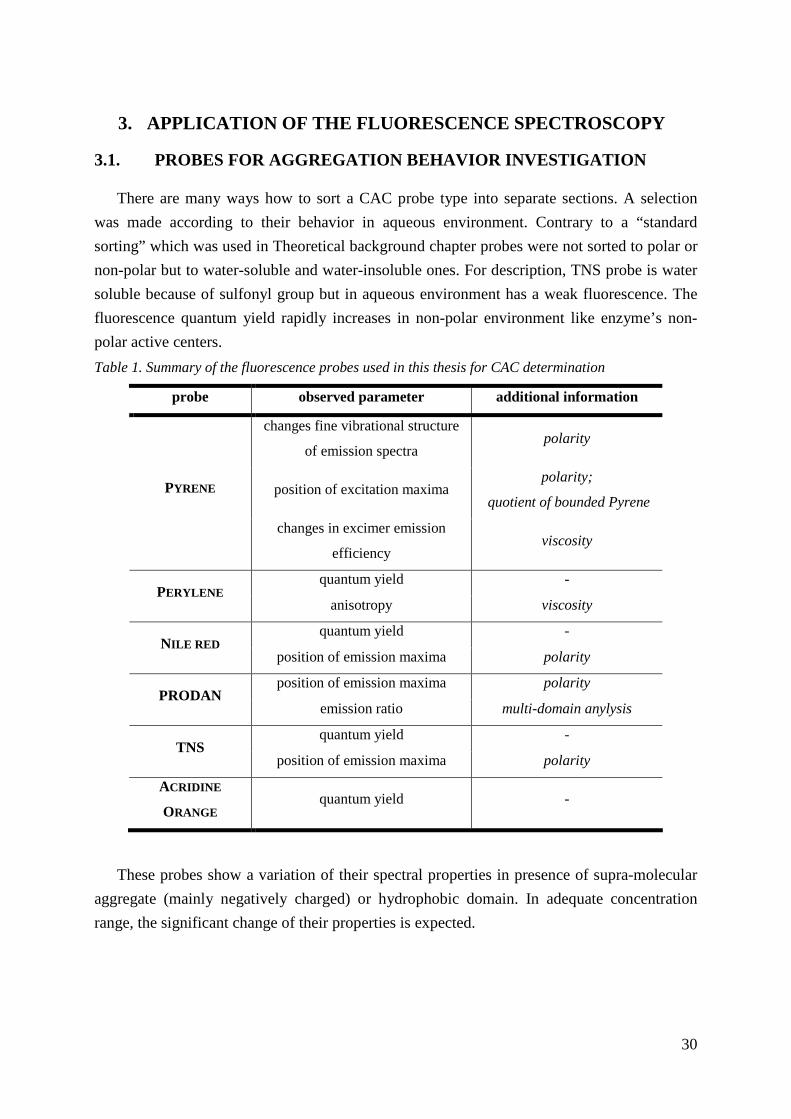
There are many ways how to sort a CAC probe type into separate sections. A selection
was made according to their behavior in aqueous environment. Contrary to a “standard
sorting” which was used in Theoretical background chapter probes were not sorted to polar or
non-polar but to water-soluble and water-insoluble ones. For description, TNS probe is water
soluble because of sulfonyl group but in aqueous environment has a weak fluorescence. The
fluorescence quantum yield rapidly increases in non-polar environment like enzyme’s non-
polar active centers.
Table 1. Summary of the fluorescence probes used in this thesis for CAC determination
probe observed parameter additional information
changes fine vibrational structure
of emission spectra polarity
position of excitation maxima polarity;
quotient of bounded Pyrene PYRENE
changes in excimer emission
efficiency viscosity
quantum yield - PERYLENE
anisotropy viscosity
quantum yield - NILE RED
position of emission maxima polarity
position of emission maxima polarity PRODAN
emission ratio multi-domain anylysis
quantum yield - TNS
position of emission maxima polarity
ACRIDINE
ORANGE quantum yield -
These probes show a variation of their spectral properties in presence of supra-molecular
aggregate (mainly negatively charged) or hydrophobic domain. In adequate concentration
range, the significant change of their properties is expected.
31
3.2. Polarity probes
3.2.1. Photoinduced charge transfer
The dipole moment of an aromatics molecule in the excited state eµ differs from that in
ground state gµ . Most of polarity probes undergo intramolecular charge transfer upon
excitation so that eµ > gµ . Following excitation, the solvent cage undergoes a relaxation
leading to a relaxed state of minimum free energy. The higher the polarity of the solvent, the
lower energy of the relaxed state and the larger red-shift of the emission spectrum. It is
important to note that the rate of solvent relaxation depends on the solvent viscosity.
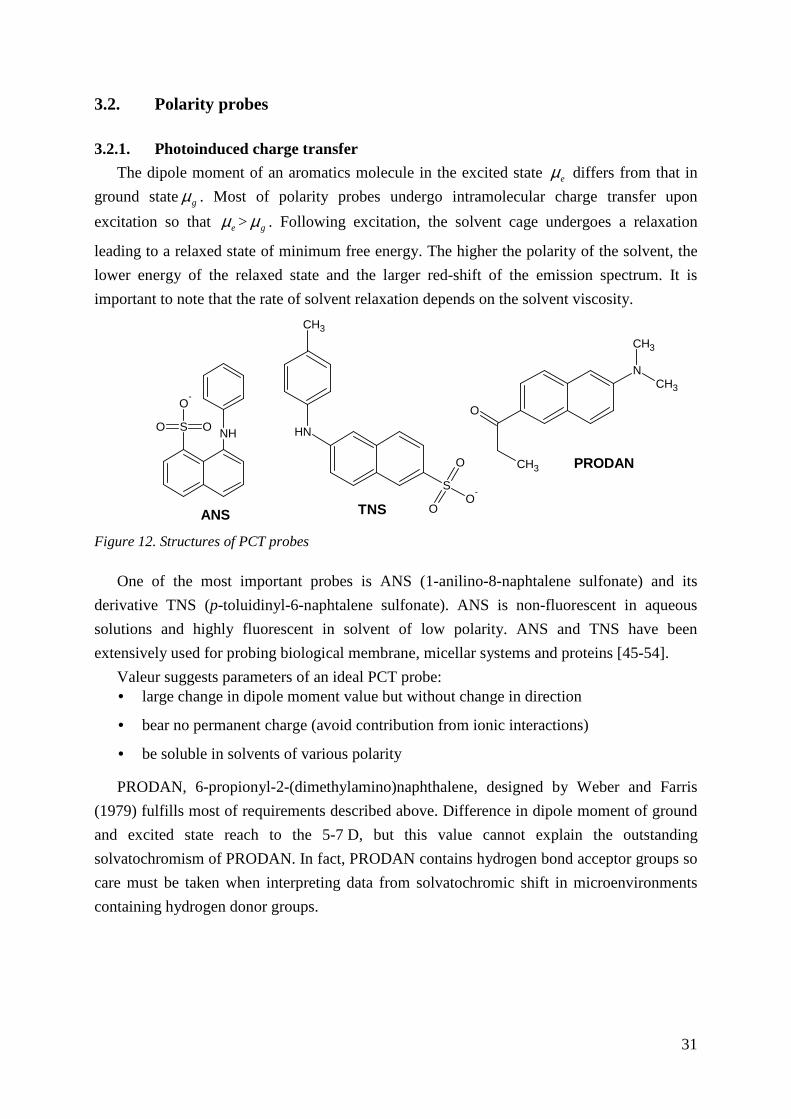
Figure 12. Structures of PCT probes
One of the most important probes is ANS (1-anilino-8-naphtalene sulfonate) and its
derivative TNS (p-toluidinyl-6-naphtalene sulfonate). ANS is non-fluorescent in aqueous
solutions and highly fluorescent in solvent of low polarity. ANS and TNS have been
extensively used for probing biological membrane, micellar systems and proteins [45-54].
Valeur suggests parameters of an ideal PCT probe: • large change in dipole moment value but without change in direction
• bear no permanent charge (avoid contribution from ionic interactions)
• be soluble in solvents of various polarity
PRODAN, 6-propionyl-2-(dimethylamino)naphthalene, designed by Weber and Farris
(1979) fulfills most of requirements described above. Difference in dipole moment of ground
and excited state reach to the 5-7 D, but this value cannot explain the outstanding
solvatochromism of PRODAN. In fact, PRODAN contains hydrogen bond acceptor groups so
care must be taken when interpreting data from solvatochromic shift in microenvironments
containing hydrogen donor groups.
NHSO O
O-
CH3
NH
S
O
OO
-
CH3
CH3
N
CH3
O
ANS TNS
PRODAN
32
3.2.2. Polarity induced changes in vibronic bands
In some aromatic molecules with a high degree of symmetry, the first singlet absorption ( )10 SS → may be symmetry forbidden. The intensities of the various forbidden vibronic
bands are highly sensitive to solvent polarity (Ham effect). In polar solvents, the intensity of
the 0-0 band increases at the expense of the others.
The relative changes in intensity of the vibronic bands in the Pyrene fluorescence
spectrum has its origin in the extent of vibronic coupling between the weakly allowed first
excited state and the strongly allowed second excited state; dipole-induced dipole interaction
between the solvent and Pyrene play a major role.
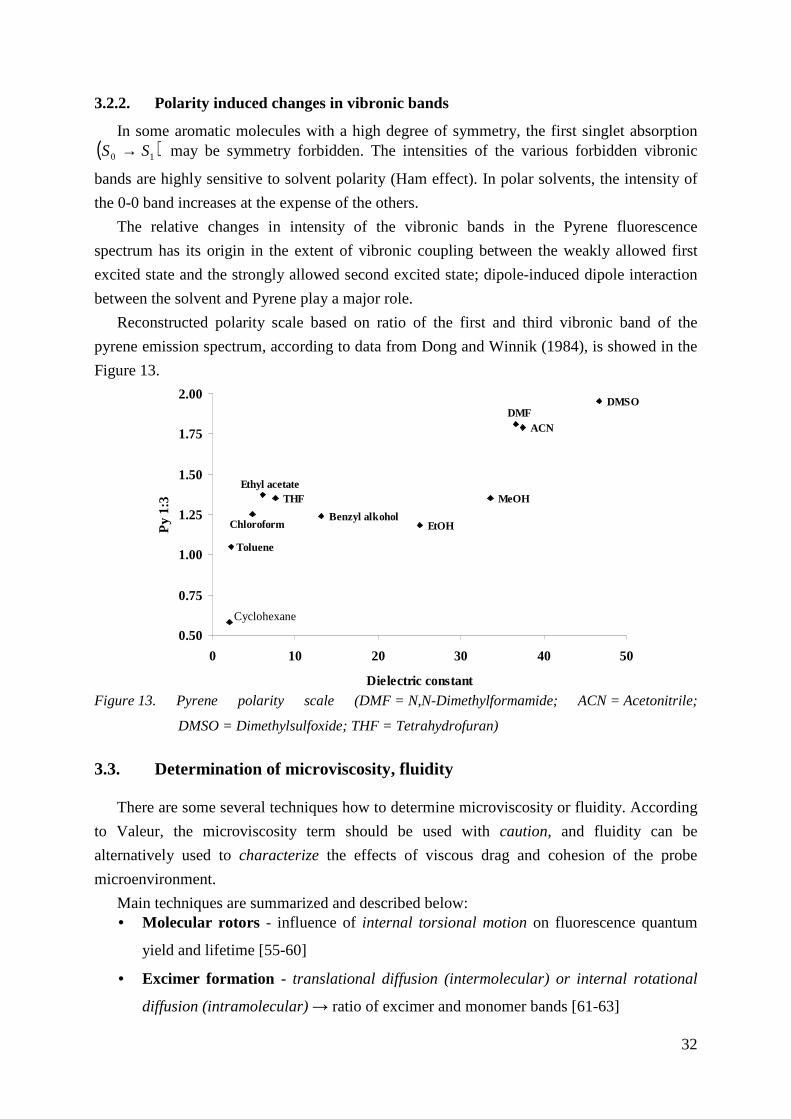
Reconstructed polarity scale based on ratio of the first and third vibronic band of the
pyrene emission spectrum, according to data from Dong and Winnik (1984), is showed in the
Figure 13.
Figure 13. Pyrene polarity scale (DMF = N,N-Dimethylformamide; ACN = Acetonitrile;
DMSO = Dimethylsulfoxide; THF = Tetrahydrofuran)
3.3. Determination of microviscosity, fluidity
There are some several techniques how to determine microviscosity or fluidity. According
to Valeur, the microviscosity term should be used with caution, and fluidity can be
alternatively used to characterize the effects of viscous drag and cohesion of the probe
microenvironment.
Main techniques are summarized and described below: • Molecular rotors - influence of internal torsional motion on fluorescence quantum
yield and lifetime [55-60]
• Excimer formation - translational diffusion (intermolecular) or internal rotational
diffusion (intramolecular) → ratio of excimer and monomer bands [61-63]
DMSO
ACNDMF
MeOH
EtOHBenzyl alkohol
THFEthyl acetate
Chloroform
Toluene
Cyklohexan0.50
0.75
1.00
1.25
1.50
1.75
2.00
0 10 20 30 40 50
Dielectric constant
Py
1:3
Cyclohexane
33
• Fluorescence quenching - translational diffusion → fluorescence quantum yield
• Fluorescence polarization (steady-state, time-resolved) - rotational diffusion of the
whole probe → emission anisotropy [64-72]
3.3.1. Fluorescence polarization measurements Requirements for polarization probe:
• minimum disturbance of the medium to be probed
• symmetry and directions of the transition moments - isotropic rotations
• minimum specific interactions with the surrounding molecules
• minimum sensitivity of the excited state lifetime to the microenvironment when only
steady-state anisotropy is measured
On the topic of disturbance of the medium, small molecules are to be preferred, but the
measurement is then often sensitive to specific interaction with the surrounding molecules.
3.3.1.1. Isotropic media
Rotations are isotropic when the probe has a spherical shape, but most fluorescent probes
are aromatics and less or more planar. When the direction of the absorption and emission
transition moments coincide with the long molecular axis (rod-like molecules - DPB, DPH),
the rotation can be considered as isotropic because any rotation about this long axis has no
effect on the emission anisotropy.
For isotropic motion in isotropic medium, we obtain for instantaneous and steady state
emission anisotropies: )6exp()( 0 tDrtr r−= , (3.3.1)
( )τrDrr
6111
0
+= , (3.3.2)
where rD means the rotational diffusion coefficients and τ means the lifetime of the probe.
In principle, the value of the viscosity η could be calculated from Stokes-Einstein relation:
V6
T
r8
T3 ηπη
kkDr == , (3.3.3)
where r is the hydrodynamics radius of the sphere and V its hydrodynamic volume. Introducing the rotational correlation time as 1)6( −= rc Dτ , equation 3.3.2 can be rewritten as
+=
crr ττ
111
0
, (3.3.4)
34
3.3.1.2. Ordered systems
In anisotropic media such as bilayers and liquid crystals, the hindered rotation is observed. In this media anisotropy does not decay to zero, but to a steady value∞r , and instantaneous
emission anisotropy can written as ( ) ∞∞ +−−= rtrrtr c )/exp()( 0 τ . (3.3.5)
3.3.2. Intramolecular excimer formation
Bifluorophoric molecules consisting of two identical fluorophores linked by a short
flexible chain may form an excimer (e.g. see Figure 3.1.1 c). Intramolecular excimer
formation requires close approach of the two moieties through internal rotations the lifetime
of excited state. Diffusion processes or microheterogenity of the medium does not affect this
process. The efficiency of excimer formation does not depend on the concentration of
fluorophores. Efficiency can be denoted as ratio of the fluorescence intensities of monomer ( MI ) and excimer (EI ). Its relationship to monomer concentration is described as
1E
/
M
E kk
k
I
I
r
r τ= , (3.3.6)
where Eτ is the excimer lifetime, rk and /rk is radiative rate constants of the monomer
and excimer, respectively. 1k is the diffusional rate constant, and if assumed to be this
constant independent of time, it can be expressed by the following simplified form -
Smoluchowski relation: DNRk cπ41 = , (3.3.7)
where cR is the distance of closest approach, D is the mutual diffusion coefficient, N is equal
to 1000/AN , AN being Avogadro’s number.
It is important that ratio is proportional to the excited-state lifetime of the excimer, which
is reduced by oxygen quenching. The rate of oxygen quenching decrease with increasing
viscosity and its effect on excimer formation becomes negligible at viscosities higher than
0.1 N.s.m-2.
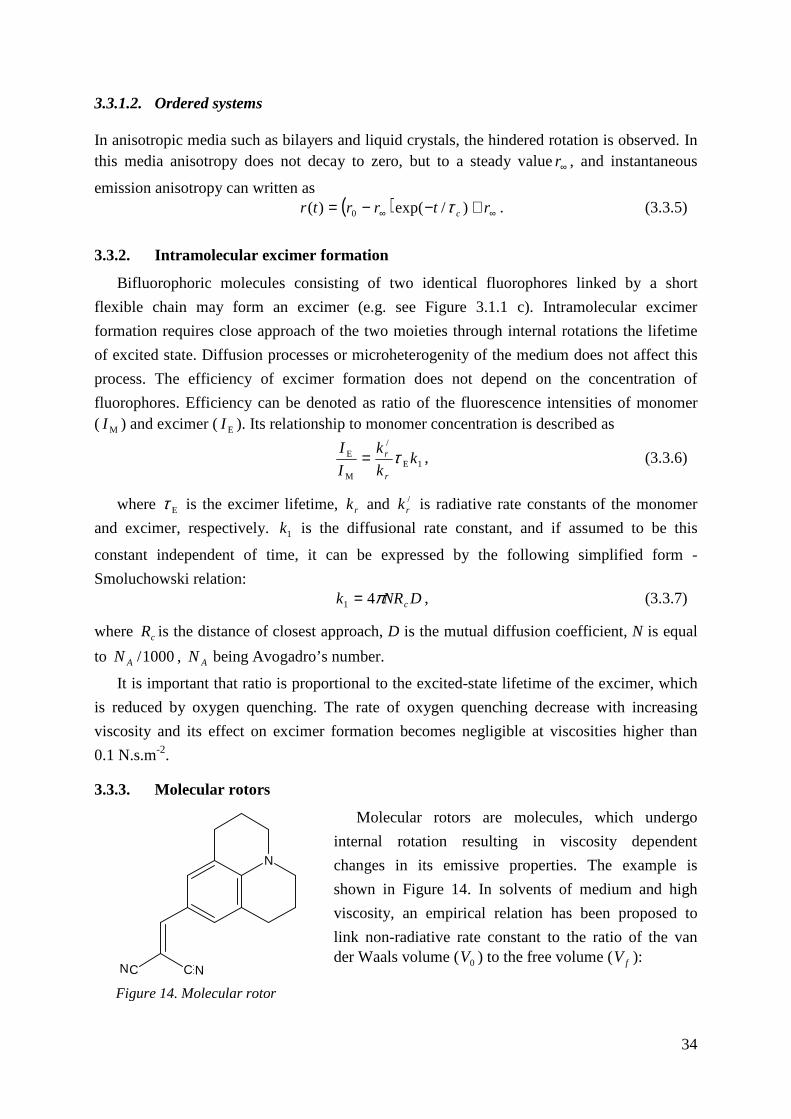
3.3.3. Molecular rotors
Molecular rotors are molecules, which undergo
internal rotation resulting in viscosity dependent
changes in its emissive properties. The example is
shown in Figure 14. In solvents of medium and high
viscosity, an empirical relation has been proposed to
link non-radiative rate constant to the ratio of the van der Waals volume (0V ) to the free volume (fV ):
NN CC
N
Figure 14. Molecular rotor
35
−=
fnrnr V
Vxkk 00 exp , (3.3.8)
whrere 0nrk is the free-rotor reorientation rate and x is a constant for a particular probe.
Fluorescence quantum yield is related to the radiative and non-radiative rate constant (Eq.
2.3.9) and so we obtain
=
Φ−Φ
fnr
nr
F
F
V
Vx
k
k 00
exp1
. (3.3.9)
Combination with Doolittle equation, which compare relationship between viscosity and free volume (“ ( )fVV00 expηη = ”) yields
x
F
F aη=Φ−
Φ1
. (3.3.10)
For small quantum yields and when changes in viscosity are achieved by variations of
temperature, Eq. 3.3.10 should be rewritten as ( )x
F b Tη≅Φ . (3.3.11)
It is important denote, that the effective viscosity probed by a molecular rotor appears to be less than the bulk viscosity η because of free volume effects.
3.4. Fluorescence quenching studies
The kinetics of the quenching of probes incorporated into microaggregates depends on a
variety of factors: solubility and partition of the quencher between aqueous medium and
micellar phase, relative location of probe and quencher, and their mobility inside the
aggregates. These characteristic depend on the chemical and spatial structures of the probe,
the quencher, and the microheterogenous system [73]. Determination of fraction of the probe partition between the pseudophase and medium is useful. Ratio ( )sAA IIIE += / , where IA is
the intensity fluorescence measured from aggregate, or membrane, and Is is the intensity in
supernatant solution. M. Deumié and co-workers described that fluorescence of Py, PDA and
BaP in the supernatant was least hundred times less than fluorescence from the solution of
erythrocyte membranes [74].
3.4.1. Estimation of average location of fluorophore and quencher
Fluorescence measurement using quenchers can also be employed to estimate the location
of probe/fluorophore and quencher [73, 74]. It is necessary to use various quenchers located at
different depths in the aggregates and a totally incorporated probe in the same phase as the
quenchers or the quenching of various probe at different depths by one quencher. In order to
evaluate the relative proximity of the quencher-fluorophore from the steady-state quenching
rate constant, both species should be totally incorporated into aggregates or else the intra-
aggregate concentration must be known and employed in calculations. In aggregates, where
36
diffusion-controlled quenching process is allowed, the quenching rate constant is not directly
related to the local quencher concentration around the fluorophore; it is related to its rate of
accessing the probe locus [72].
In the presence of long-lifetime family of pyrene and its derivatives, we can verify the
incorporation of the probe in compact aggregate (e.g. membrane) by the absence of excimer
[73].
3.4.2. Using fluorescence quenching in determination of aggregation number N
• steady state point of view
If the concentration of micelles equals [M], the average number of quenchers per micelle,
q, is defined by
[ ][ ]M
Qq = . (3.4.1)
A random placing of m objects (quenchers) in n boxes (micelles) results in a Poisson
distribution for large m and n. This distribution implies that the probability P(p) of having p
objects in an arbitrary box is
( ) ( )!
exp
p
qqpP p −= . (3.4.2)
where ]/[][/ MQnmq == . In particular, P(0) signifies the probe ability of finding an empty
micelle box
( ) )exp(0 qP −= (3.4.3)
since 0! = 1. The steady state fluorescence at a quencher concentration [Q] is thus
[ ][ ]
−=M
QII exp0 (3.4.4)
The slope, [ ]QII q vs.ln
0
, gives the concentration of micelles[ ]M . From this value we can
determine the aggregation number N (eq. 3.4.4)
[ ]( )[ ]M
CMCSN tot −= , (3.4.5)
where [ ]totS is total surfactant concentration.
• time resolved point of view
Steady-state fluorescence quenching works only for small N. Time-resolved fluorescence
is method that is more sophisticated. In systems, where is only fluorescence probe, the
fluorescence intensity I decay exponentially (Equation 3.1.8)
37
−=0
exp)0()(τ
tItI , (3.4.6)
where 0τ is the fluorescence lifetime.
The addition of quencher to system leads to fact, that fluorescence intensity of probe
decay more rapidly. With quencher, fluorescence shows nonexponential decay, this can be
described by Equation 3.1.9.
[ ]1)exp()0(
)(ln
0
−−+−=
tkq
t
I
tIQτ
. (3.4.7)
38
4. AIM OF THE WORK
Aim of this work is to investigate aggregation behavior of native and hydrophobicaly
modified Hyaluronan in aqueous solution by fluorescence probe method.
1) From literary sources, select most suitable group of fluorescence probes for investigation
of the aggregation process and qualities of a hydrophobic core.
2) Verify or/and specify spectral behavior of these probes in model system – solvents and
simple surfactant systems.
3) Collect information about aggregation process of native and hydrophobicaly modified
hyaluronan from fluorescence probes point of view.
4) With selected probe(s), investigate hydrophobic core qualities in modified hyaluronan
solution. Determine influence of the ionic strength and temperature on core qualities.
39
5. MATERIALS AND METHODS
5.1. PROBE’S PROPERTIES
5.1.1. Pyrene
For details, see Chapter 4.2.1
5.1.2. Nile red
Nile red (CAS # 7385-67-3) is one of the most useful probes. Nile red (NR) is a
hydrophobic, highly fluorescent, solvatochromic probe that has been extensively applied to
examine the structure, dynamics and environment in biological and microheterogeneous
systems. The remarkable sensitivity of its absorption and fluorescence characteristics to the
microenvironment has been exploited in many studies included polarity in zeolites, lipid
bilayer, ionic liquids, and liquid crystals [75].
Large shifts in the absorption and emission bands are due to large changes in the excited
state dipole moment of the molecule. This corresponds to nearly complete charge separation
between the diethylamino group which acts as an electron donor and the quinoid part of the
molecule which is the electron acceptor. The charge separation may be explained by the
formation of the twisted intramolecular charge transfer state (TICT state) of the molecule in
polar solvents due to the rotation of the flexible diethylamino group attached to the rigid
structure of the molecule [76].
Fluorescence intensity and position of emission maxima were selected as observed
parameters for Nile red. Nile red has very low fluorescence quantum yield in the presence of
water molecules. This made NR an ideal probe for aggregation investigation in aqueous
solution [77-83].
5.1.3. Perylene
Perylene (CAS # 198-55-0) is thermally and chemically stable fluorescent probe. It has
high fluorescence quantum yield, ~ 0.98 in CHCl3, and short fluorescent lifetime, ~ 5.5 ns. In
ground state S0, has planar configuration. Efficiency of ISC process is too low but is
compensated for long phosphorescence lifetime (~ 0.3 ms).
5.1.4. Acridine orange
Acridine orange (as hydrochloride hydrate, CAS # 65-61-2) is a cationic dye mainly used
in nucleic acid staining. It is cationic dye, which is protonated at a pH lower than 10-10.5.
Acridine orange (AO) is a much-studied member of a class of cationic dyes whose planar
molecules aggregate in aqueous solution to cause concentration-dependent spectral changes
(metachromasy). Direct evidence for the aggregation of AO has been obtained from proton
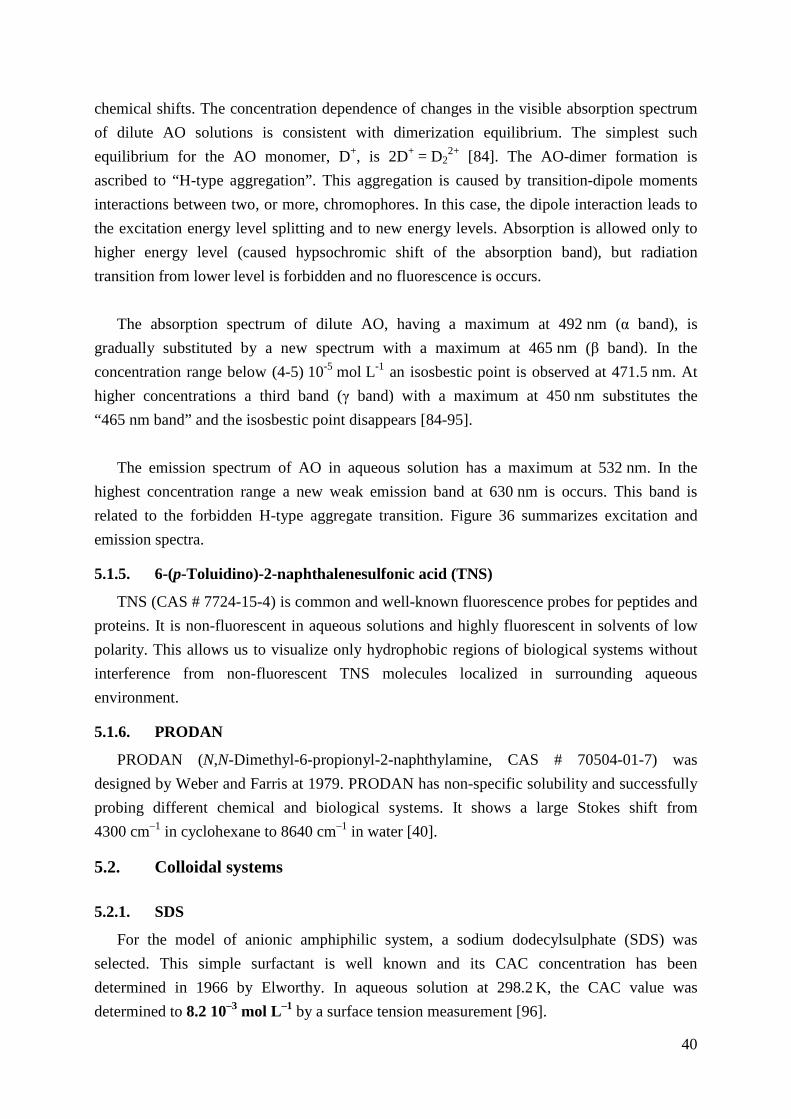
40
chemical shifts. The concentration dependence of changes in the visible absorption spectrum
of dilute AO solutions is consistent with dimerization equilibrium. The simplest such
equilibrium for the AO monomer, D+, is 2D+ = D22+ [84]. The AO-dimer formation is
ascribed to “H-type aggregation”. This aggregation is caused by transition-dipole moments
interactions between two, or more, chromophores. In this case, the dipole interaction leads to
the excitation energy level splitting and to new energy levels. Absorption is allowed only to
higher energy level (caused hypsochromic shift of the absorption band), but radiation
transition from lower level is forbidden and no fluorescence is occurs.
The absorption spectrum of dilute AO, having a maximum at 492 nm (α band), is
gradually substituted by a new spectrum with a maximum at 465 nm (β band). In the
concentration range below (4-5) 10-5 mol L-1 an isosbestic point is observed at 471.5 nm. At
higher concentrations a third band (γ band) with a maximum at 450 nm substitutes the
“465 nm band” and the isosbestic point disappears [84-95].
The emission spectrum of AO in aqueous solution has a maximum at 532 nm. In the
highest concentration range a new weak emission band at 630 nm is occurs. This band is
related to the forbidden H-type aggregate transition. Figure 36 summarizes excitation and
emission spectra.
5.1.5. 6-(p-Toluidino)-2-naphthalenesulfonic acid (TNS)
TNS (CAS # 7724-15-4) is common and well-known fluorescence probes for peptides and
proteins. It is non-fluorescent in aqueous solutions and highly fluorescent in solvents of low
polarity. This allows us to visualize only hydrophobic regions of biological systems without
interference from non-fluorescent TNS molecules localized in surrounding aqueous
environment.
5.1.6. PRODAN
PRODAN (N,N-Dimethyl-6-propionyl-2-naphthylamine, CAS # 70504-01-7) was
designed by Weber and Farris at 1979. PRODAN has non-specific solubility and successfully
probing different chemical and biological systems. It shows a large Stokes shift from
4300 cm–1 in cyclohexane to 8640 cm–1 in water [40].
5.2. Colloidal systems
5.2.1. SDS
For the model of anionic amphiphilic system, a sodium dodecylsulphate (SDS) was
selected. This simple surfactant is well known and its CAC concentration has been
determined in 1966 by Elworthy. In aqueous solution at 298.2 K, the CAC value was
determined to 8.2 10–3 mol L–1 by a surface tension measurement [96].
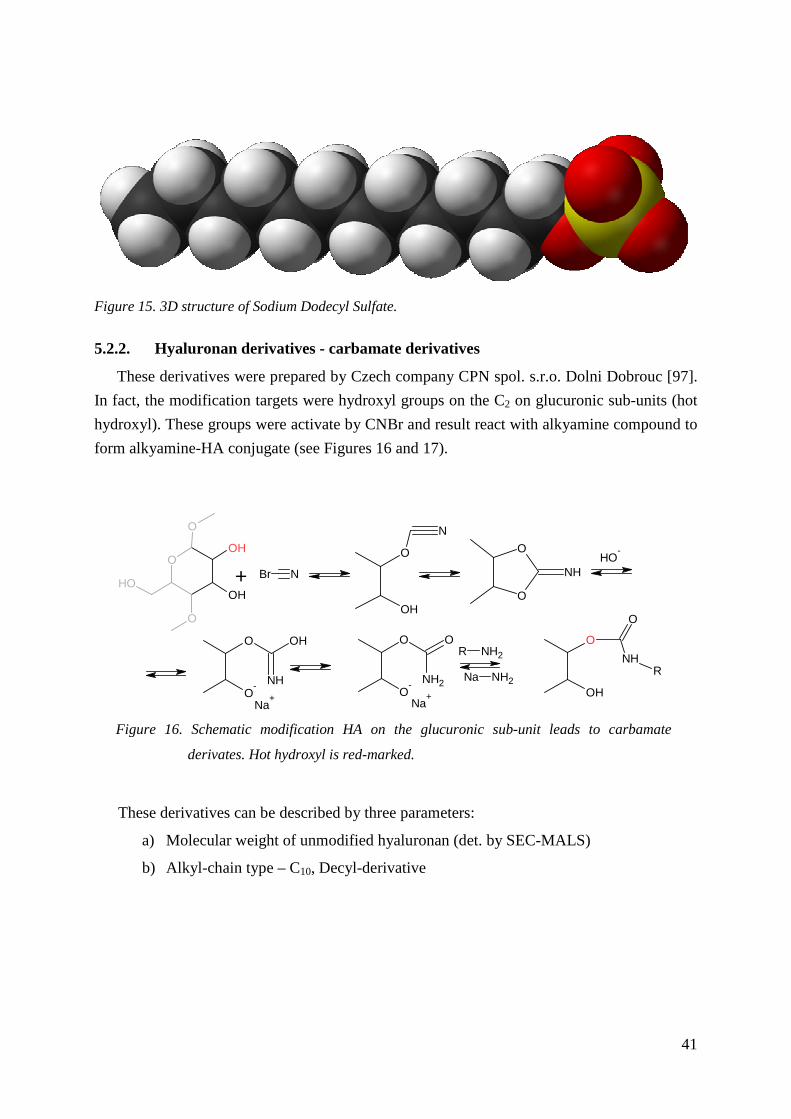
41
Figure 15. 3D structure of Sodium Dodecyl Sulfate.
5.2.2. Hyaluronan derivatives - carbamate derivatives
These derivatives were prepared by Czech company CPN spol. s.r.o. Dolni Dobrouc [97].
In fact, the modification targets were hydroxyl groups on the C2 on glucuronic sub-units (hot
hydroxyl). These groups were activate by CNBr and result react with alkyamine compound to
form alkyamine-HA conjugate (see Figures 16 and 17).
These derivatives can be described by three parameters:
a) Molecular weight of unmodified hyaluronan (det. by SEC-MALS)
b) Alkyl-chain type – C10, Decyl-derivative
Figure 16. Schematic modification HA on the glucuronic sub-unit leads to carbamate
derivates. Hot hydroxyl is red-marked.
Br N
N
O
OH
+ NH
O
OOH
-
NH
OH
O-
O
Na+
NH2
O
O-
O
Na+
NH2R
R
OH
NH
O
O
NH2Na
O
O
OH
O
OH
OH
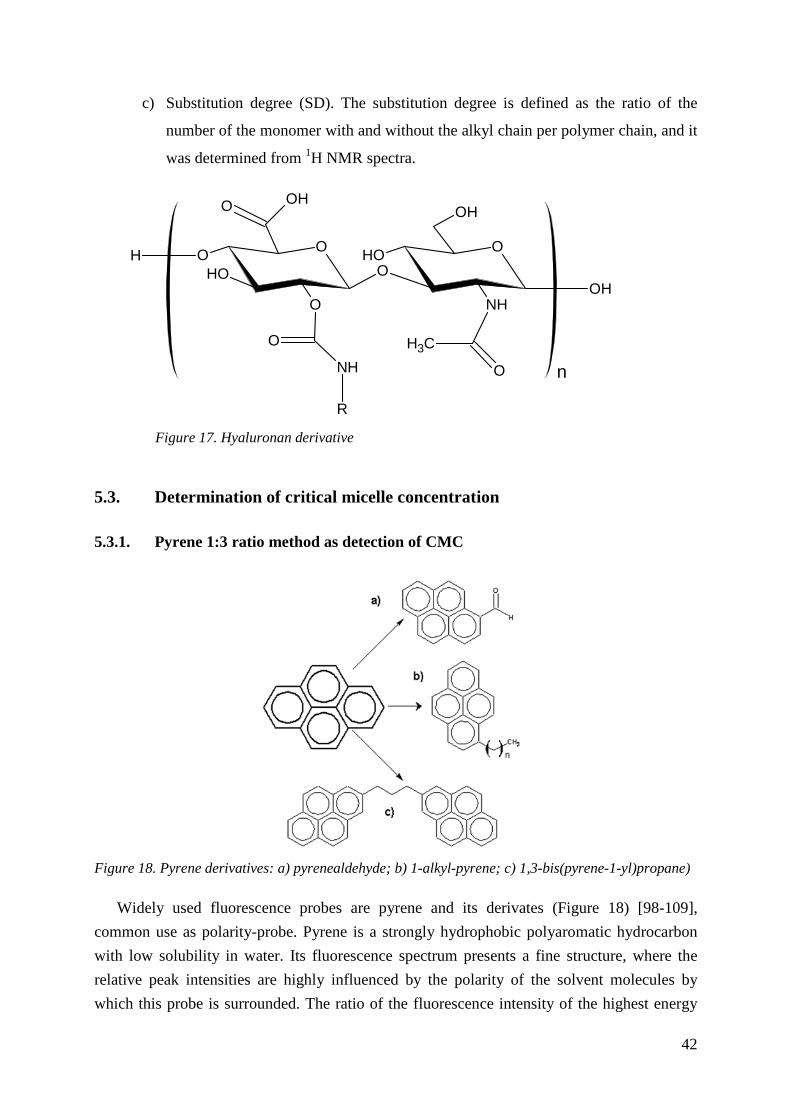
42
c) Substitution degree (SD). The substitution degree is defined as the ratio of the
number of the monomer with and without the alkyl chain per polymer chain, and it
was determined from 1H NMR spectra.
5.3. Determination of critical micelle concentration
5.3.1. Pyrene 1:3 ratio method as detection of CMC
Figure 18. Pyrene derivatives: a) pyrenealdehyde; b) 1-alkyl-pyrene; c) 1,3-bis(pyrene-1-yl)propane)
Widely used fluorescence probes are pyrene and its derivates (Figure 18) [98-109],
common use as polarity-probe. Pyrene is a strongly hydrophobic polyaromatic hydrocarbon
with low solubility in water. Its fluorescence spectrum presents a fine structure, where the
relative peak intensities are highly influenced by the polarity of the solvent molecules by
which this probe is surrounded. The ratio of the fluorescence intensity of the highest energy
n
O
H
R
O
NH
O
OHNH
OOH
OH
O
O
OHO
OH
O
CH3
Figure 17. Hyaluronan derivative
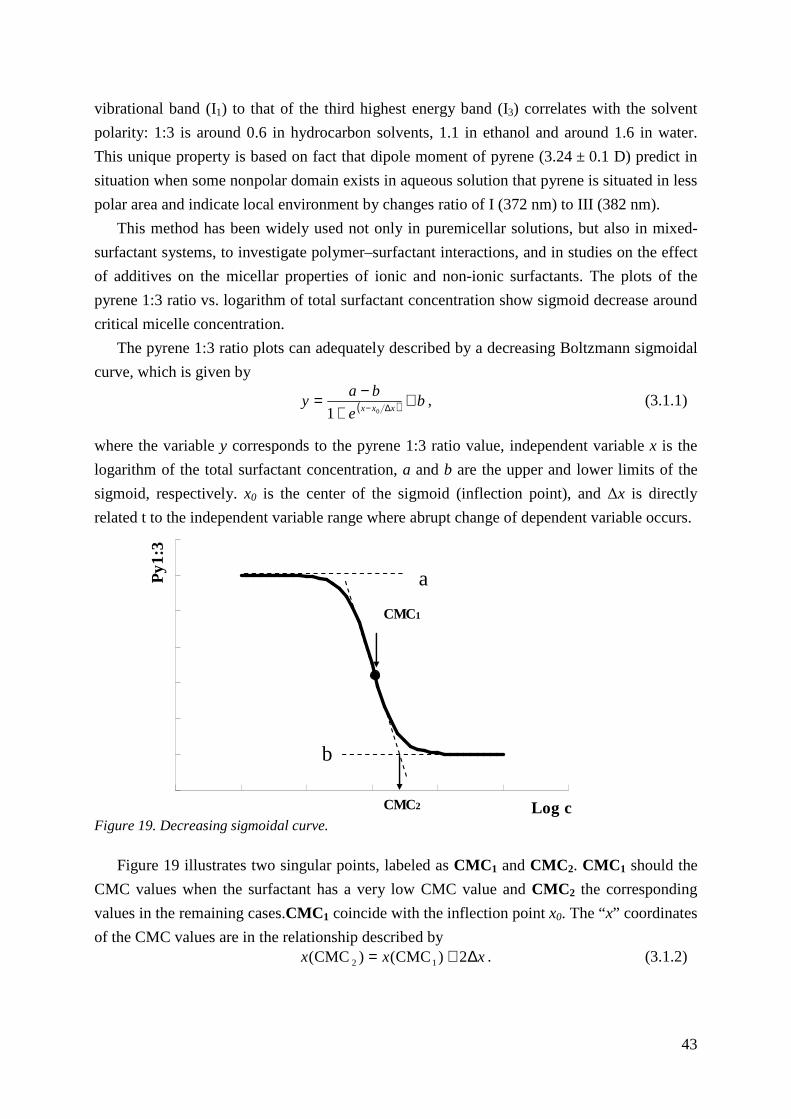
43
vibrational band (I1) to that of the third highest energy band (I3) correlates with the solvent
polarity: 1:3 is around 0.6 in hydrocarbon solvents, 1.1 in ethanol and around 1.6 in water.
This unique property is based on fact that dipole moment of pyrene (3.24 ± 0.1 D) predict in
situation when some nonpolar domain exists in aqueous solution that pyrene is situated in less
polar area and indicate local environment by changes ratio of I (372 nm) to III (382 nm).
This method has been widely used not only in puremicellar solutions, but also in mixed-
surfactant systems, to investigate polymer–surfactant interactions, and in studies on the effect
of additives on the micellar properties of ionic and non-ionic surfactants. The plots of the
pyrene 1:3 ratio vs. logarithm of total surfactant concentration show sigmoid decrease around
critical micelle concentration.
The pyrene 1:3 ratio plots can adequately described by a decreasing Boltzmann sigmoidal
curve, which is given by
( ) be
bay
xxx+
+−= ∆− 01
, (3.1.1)
where the variable y corresponds to the pyrene 1:3 ratio value, independent variable x is the
logarithm of the total surfactant concentration, a and b are the upper and lower limits of the
sigmoid, respectively. x0 is the center of the sigmoid (inflection point), and ∆x is directly
related t to the independent variable range where abrupt change of dependent variable occurs.
Figure 19. Decreasing sigmoidal curve.
Figure 19 illustrates two singular points, labeled as CMC1 and CMC2. CMC1 should the
CMC values when the surfactant has a very low CMC value and CMC2 the corresponding
values in the remaining cases.CMC1 coincide with the inflection point x0. The “x” coordinates
of the CMC values are in the relationship described by xxx ∆+= 2)CMC()CMC( 12 . (3.1.2)
Log c
Py1
:3
a
b
CMC2
CMC1
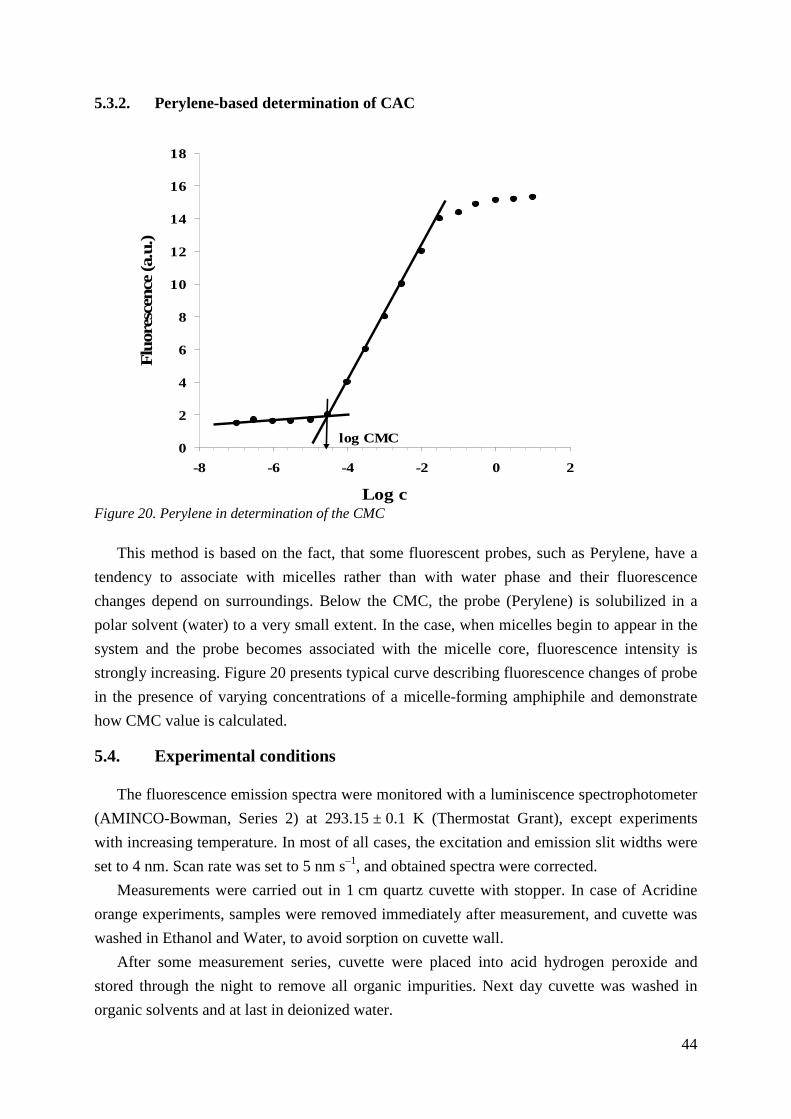
44
5.3.2. Perylene-based determination of CAC
Figure 20. Perylene in determination of the CMC
This method is based on the fact, that some fluorescent probes, such as Perylene, have a
tendency to associate with micelles rather than with water phase and their fluorescence
changes depend on surroundings. Below the CMC, the probe (Perylene) is solubilized in a
polar solvent (water) to a very small extent. In the case, when micelles begin to appear in the
system and the probe becomes associated with the micelle core, fluorescence intensity is
strongly increasing. Figure 20 presents typical curve describing fluorescence changes of probe
in the presence of varying concentrations of a micelle-forming amphiphile and demonstrate
how CMC value is calculated.
5.4. Experimental conditions
The fluorescence emission spectra were monitored with a luminiscence spectrophotometer
(AMINCO-Bowman, Series 2) at 293.15 ± 0.1 K (Thermostat Grant), except experiments
with increasing temperature. In most of all cases, the excitation and emission slit widths were
set to 4 nm. Scan rate was set to 5 nm s–1, and obtained spectra were corrected.
Measurements were carried out in 1 cm quartz cuvette with stopper. In case of Acridine
orange experiments, samples were removed immediately after measurement, and cuvette was
washed in Ethanol and Water, to avoid sorption on cuvette wall.
After some measurement series, cuvette were placed into acid hydrogen peroxide and
stored through the night to remove all organic impurities. Next day cuvette was washed in
organic solvents and at last in deionized water.
0
2
4
6
8
10
12
14
16
18
-8 -6 -4 -2 0 2
Log c
Flu
ores
cenc
e (a
.u.)
log CMC
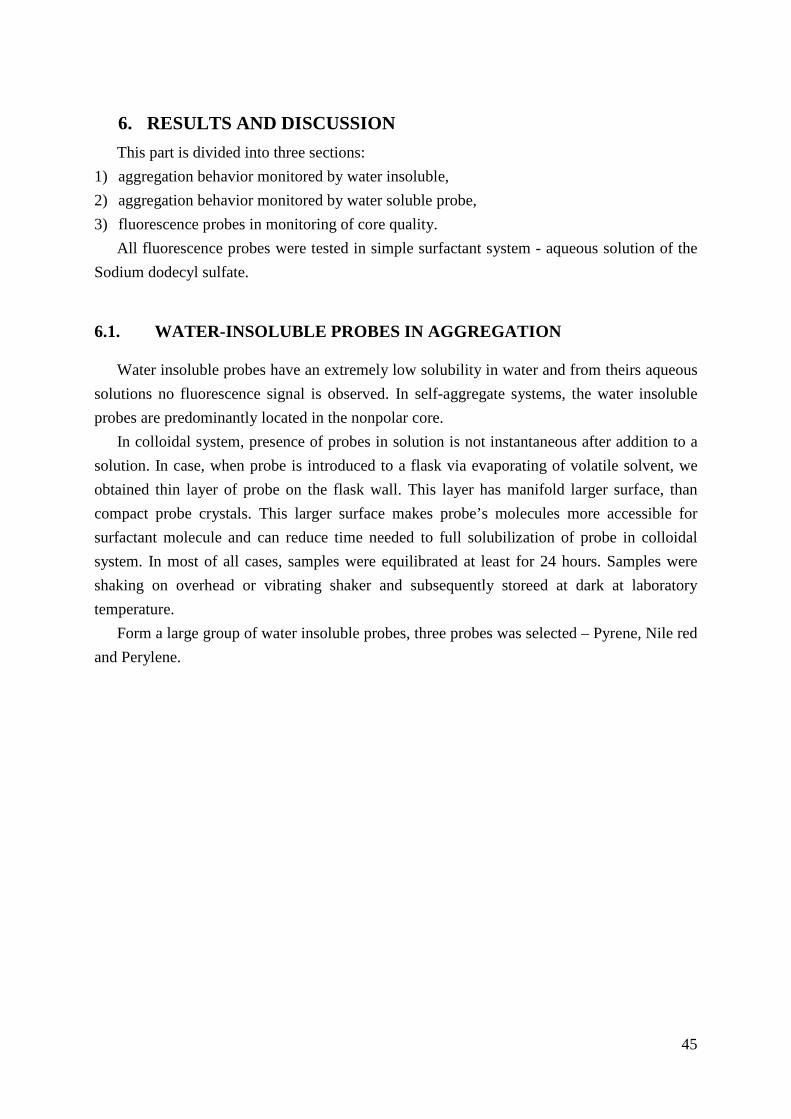
45
6. RESULTS AND DISCUSSION
This part is divided into three sections:
1) aggregation behavior monitored by water insoluble,
2) aggregation behavior monitored by water soluble probe,
3) fluorescence probes in monitoring of core quality.
All fluorescence probes were tested in simple surfactant system - aqueous solution of the
Sodium dodecyl sulfate.
6.1. WATER-INSOLUBLE PROBES IN AGGREGATION
Water insoluble probes have an extremely low solubility in water and from theirs aqueous
solutions no fluorescence signal is observed. In self-aggregate systems, the water insoluble
probes are predominantly located in the nonpolar core.
In colloidal system, presence of probes in solution is not instantaneous after addition to a
solution. In case, when probe is introduced to a flask via evaporating of volatile solvent, we
obtained thin layer of probe on the flask wall. This layer has manifold larger surface, than
compact probe crystals. This larger surface makes probe’s molecules more accessible for
surfactant molecule and can reduce time needed to full solubilization of probe in colloidal
system. In most of all cases, samples were equilibrated at least for 24 hours. Samples were
shaking on overhead or vibrating shaker and subsequently storeed at dark at laboratory
temperature.
Form a large group of water insoluble probes, three probes was selected – Pyrene, Nile red
and Perylene.
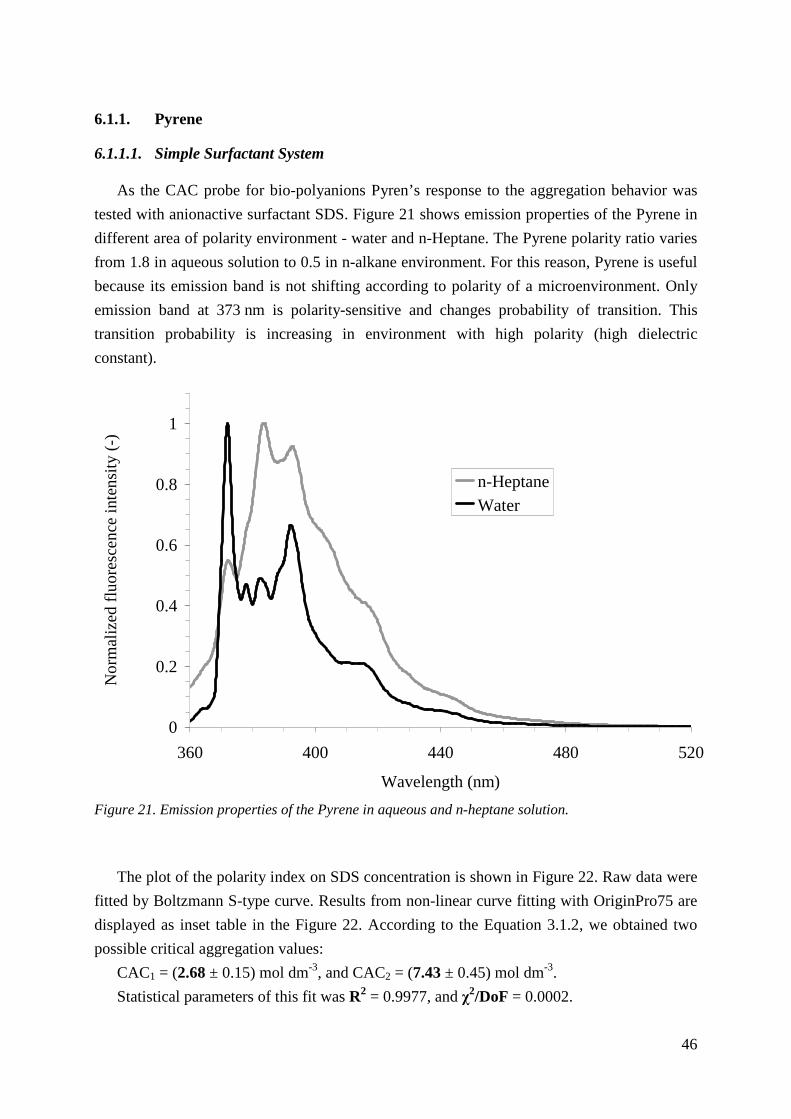
46
6.1.1. Pyrene
6.1.1.1. Simple Surfactant System
As the CAC probe for bio-polyanions Pyren’s response to the aggregation behavior was
tested with anionactive surfactant SDS. Figure 21 shows emission properties of the Pyrene in
different area of polarity environment - water and n-Heptane. The Pyrene polarity ratio varies
from 1.8 in aqueous solution to 0.5 in n-alkane environment. For this reason, Pyrene is useful
because its emission band is not shifting according to polarity of a microenvironment. Only
emission band at 373 nm is polarity-sensitive and changes probability of transition. This
transition probability is increasing in environment with high polarity (high dielectric
constant).
Figure 21. Emission properties of the Pyrene in aqueous and n-heptane solution.
The plot of the polarity index on SDS concentration is shown in Figure 22. Raw data were
fitted by Boltzmann S-type curve. Results from non-linear curve fitting with OriginPro75 are
displayed as inset table in the Figure 22. According to the Equation 3.1.2, we obtained two
possible critical aggregation values:
CAC1 = (2.68 ± 0.15) mol dm-3, and CAC2 = (7.43 ± 0.45) mol dm-3.
Statistical parameters of this fit was R2 = 0.9977, and χ2/DoF = 0.0002.
0
0.2
0.4
0.6
0.8
1
360 400 440 480 520
Wavelength (nm)
No
rmal
ize
d flu
ore
sce
nce
inte
nsi
ty (
-)
n-HeptaneWater
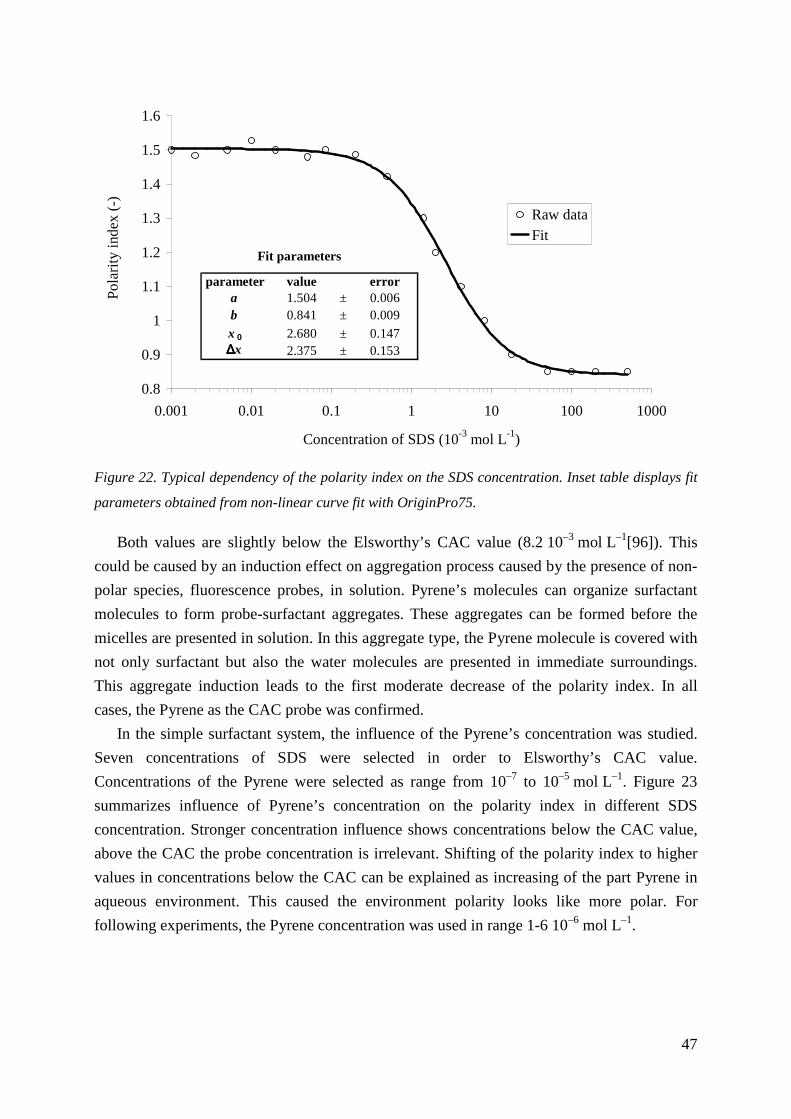
47
Figure 22. Typical dependency of the polarity index on the SDS concentration. Inset table displays fit
parameters obtained from non-linear curve fit with OriginPro75.
Both values are slightly below the Elsworthy’s CAC value (8.2 10–3 mol L–1[96]). This
could be caused by an induction effect on aggregation process caused by the presence of non-
polar species, fluorescence probes, in solution. Pyrene’s molecules can organize surfactant
molecules to form probe-surfactant aggregates. These aggregates can be formed before the
micelles are presented in solution. In this aggregate type, the Pyrene molecule is covered with
not only surfactant but also the water molecules are presented in immediate surroundings.
This aggregate induction leads to the first moderate decrease of the polarity index. In all
cases, the Pyrene as the CAC probe was confirmed.
In the simple surfactant system, the influence of the Pyrene’s concentration was studied.
Seven concentrations of SDS were selected in order to Elsworthy’s CAC value.
Concentrations of the Pyrene were selected as range from 10–7 to 10–5 mol L–1. Figure 23
summarizes influence of Pyrene’s concentration on the polarity index in different SDS
concentration. Stronger concentration influence shows concentrations below the CAC value,
above the CAC the probe concentration is irrelevant. Shifting of the polarity index to higher
values in concentrations below the CAC can be explained as increasing of the part Pyrene in
aqueous environment. This caused the environment polarity looks like more polar. For
following experiments, the Pyrene concentration was used in range 1-6 10–6 mol L–1.
0.8
0.9
1
1.1
1.2
1.3
1.4
1.5
1.6
0.001 0.01 0.1 1 10 100 1000
Concentration of SDS (10-3 mol L-1)
Po
larit
y in
de
x (-
)
Raw dataFit
parameter value errora 1.504 ± 0.006b 0.841 ± 0.009
x 0 2.680 ± 0.147∆∆∆∆x 2.375 ± 0.153
Fit parameters
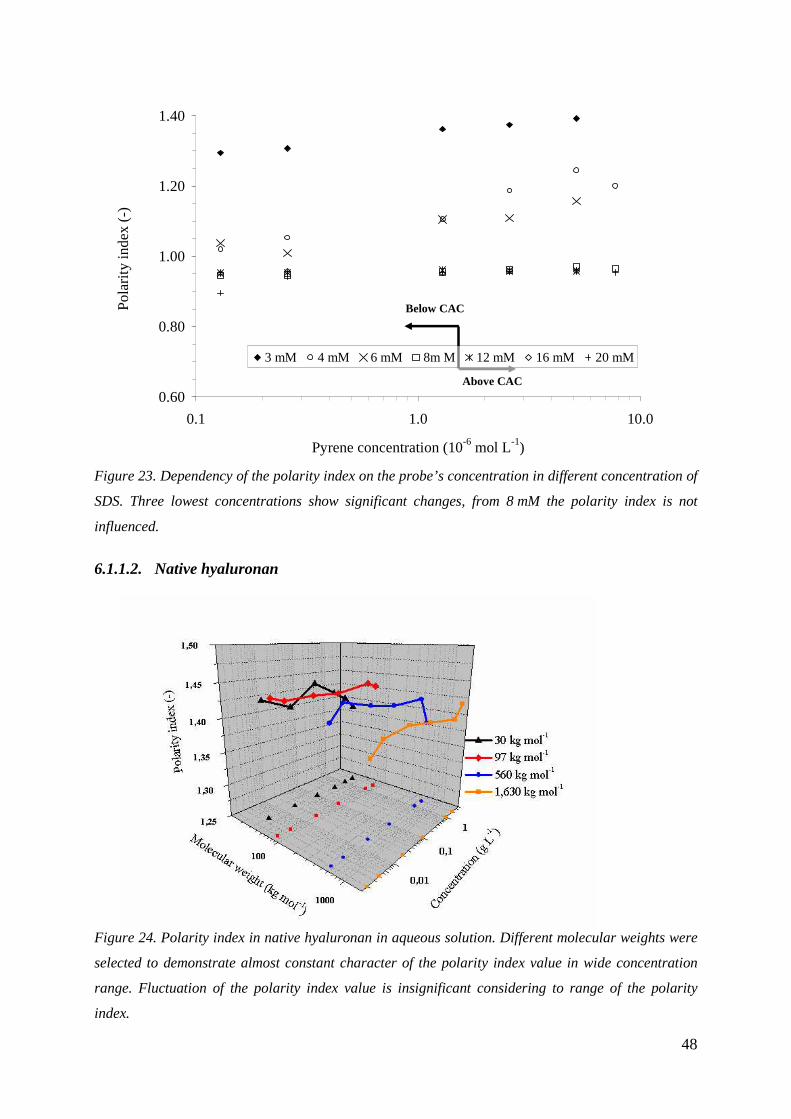
48
Figure 23. Dependency of the polarity index on the probe’s concentration in different concentration of
SDS. Three lowest concentrations show significant changes, from 8 mM the polarity index is not
influenced.
6.1.1.2. Native hyaluronan
Figure 24. Polarity index in native hyaluronan in aqueous solution. Different molecular weights were
selected to demonstrate almost constant character of the polarity index value in wide concentration
range. Fluctuation of the polarity index value is insignificant considering to range of the polarity
index.
0.60
0.80
1.00
1.20
1.40
0.1 1.0 10.0
Pyrene concentration (10-6 mol L-1)
Pol
arit
y in
dex
(-)
3 mM 4 mM 6 mM 8m M 12 mM 16 mM 20 mM
Below CAC
Above CAC
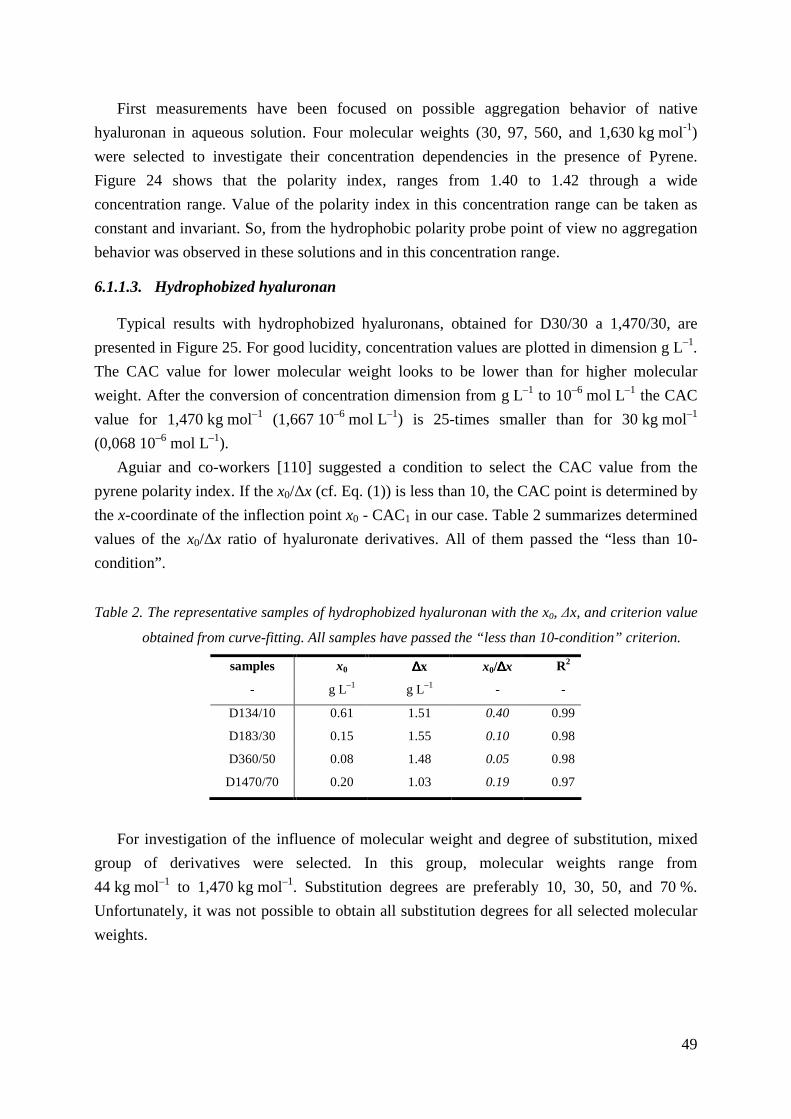
49
First measurements have been focused on possible aggregation behavior of native
hyaluronan in aqueous solution. Four molecular weights (30, 97, 560, and 1,630 kg mol-1)
were selected to investigate their concentration dependencies in the presence of Pyrene.
Figure 24 shows that the polarity index, ranges from 1.40 to 1.42 through a wide
concentration range. Value of the polarity index in this concentration range can be taken as
constant and invariant. So, from the hydrophobic polarity probe point of view no aggregation
behavior was observed in these solutions and in this concentration range.
6.1.1.3. Hydrophobized hyaluronan
Typical results with hydrophobized hyaluronans, obtained for D30/30 a 1,470/30, are
presented in Figure 25. For good lucidity, concentration values are plotted in dimension g L–1.
The CAC value for lower molecular weight looks to be lower than for higher molecular
weight. After the conversion of concentration dimension from g L–1 to 10–6 mol L–1 the CAC
value for 1,470 kg mol–1 (1,667 10–6 mol L–1) is 25-times smaller than for 30 kg mol–1
(0,068 10–6 mol L–1).
Aguiar and co-workers [110] suggested a condition to select the CAC value from the
pyrene polarity index. If the x0/∆x (cf. Eq. (1)) is less than 10, the CAC point is determined by
the x-coordinate of the inflection point x0 - CAC1 in our case. Table 2 summarizes determined
values of the x0/∆x ratio of hyaluronate derivatives. All of them passed the “less than 10-
condition”.
Table 2. The representative samples of hydrophobized hyaluronan with the x0, ∆x, and criterion value
obtained from curve-fitting. All samples have passed the “less than 10-condition” criterion.
samples x0 ∆∆∆∆x x0/∆∆∆∆x R2
- g L–1 g L–1 - -
D134/10 0.61 1.51 0.40 0.99
D183/30 0.15 1.55 0.10 0.98
D360/50 0.08 1.48 0.05 0.98
D1470/70 0.20 1.03 0.19 0.97
For investigation of the influence of molecular weight and degree of substitution, mixed
group of derivatives were selected. In this group, molecular weights range from
44 kg mol–1 to 1,470 kg mol–1. Substitution degrees are preferably 10, 30, 50, and 70 %.
Unfortunately, it was not possible to obtain all substitution degrees for all selected molecular
weights.
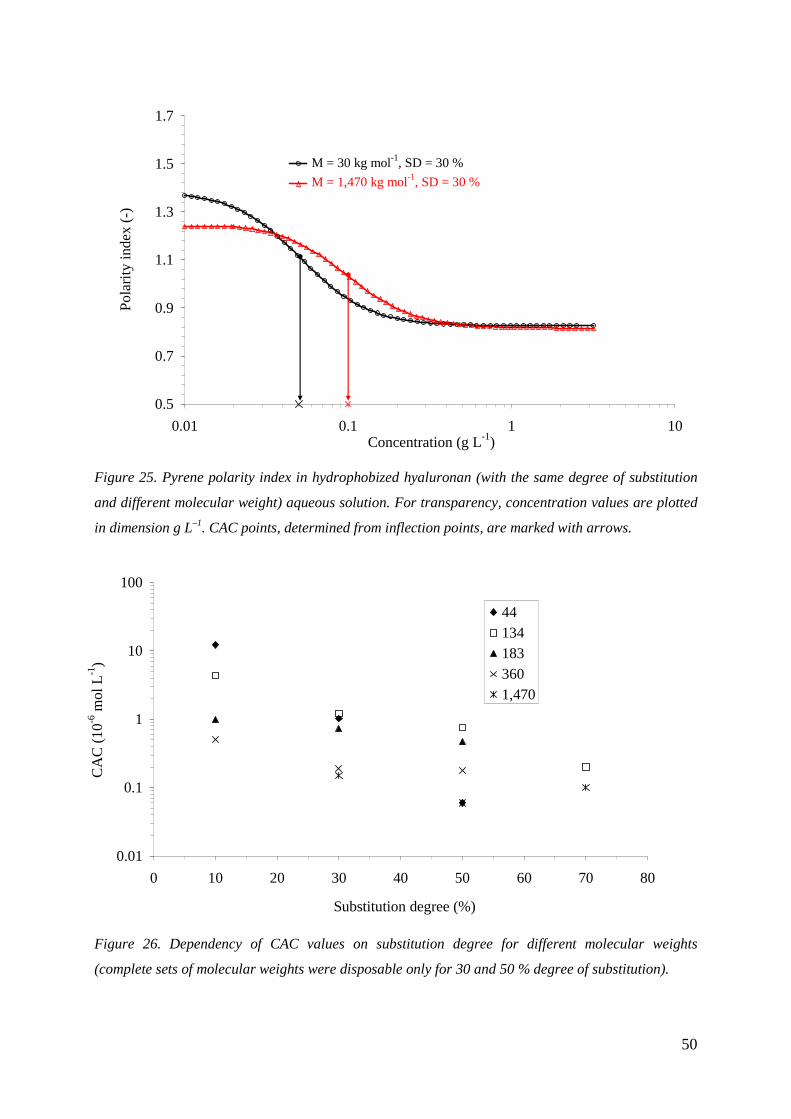
50
Figure 25. Pyrene polarity index in hydrophobized hyaluronan (with the same degree of substitution
and different molecular weight) aqueous solution. For transparency, concentration values are plotted
in dimension g L–1. CAC points, determined from inflection points, are marked with arrows.
Figure 26. Dependency of CAC values on substitution degree for different molecular weights
(complete sets of molecular weights were disposable only for 30 and 50 % degree of substitution).
0.5
0.7
0.9
1.1
1.3
1.5
1.7
0.01 0.1 1 10Concentration (g L-1)
Pol
arit
y in
dex
(-)
30/301,470/30
M = 30 kg mol-1, SD = 30 %
M = 1,470 kg mol-1, SD = 30 %
0.01
0.1
1
10
100
0 10 20 30 40 50 60 70 80
Substitution degree (%)
CA
C (
10-6 m
ol L
-1)
441341833601,470
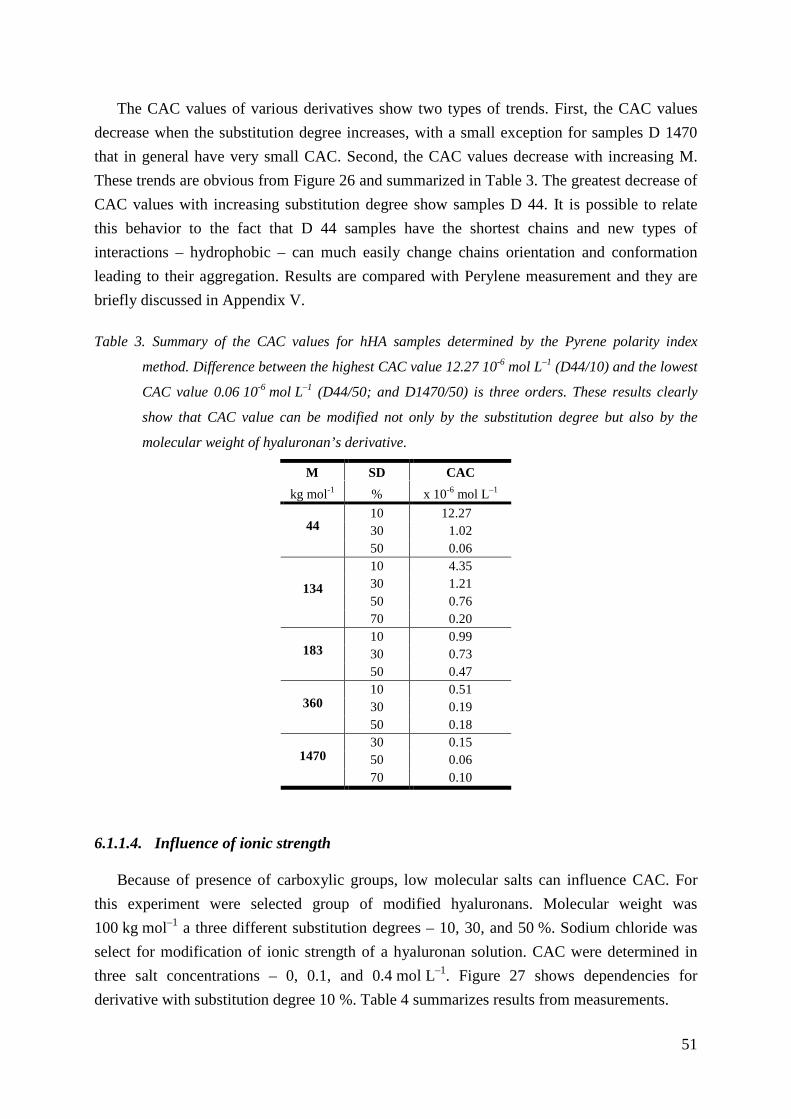
51
The CAC values of various derivatives show two types of trends. First, the CAC values
decrease when the substitution degree increases, with a small exception for samples D 1470
that in general have very small CAC. Second, the CAC values decrease with increasing M.
These trends are obvious from Figure 26 and summarized in Table 3. The greatest decrease of
CAC values with increasing substitution degree show samples D 44. It is possible to relate
this behavior to the fact that D 44 samples have the shortest chains and new types of
interactions – hydrophobic – can much easily change chains orientation and conformation
leading to their aggregation. Results are compared with Perylene measurement and they are
briefly discussed in Appendix V.
Table 3. Summary of the CAC values for hHA samples determined by the Pyrene polarity index
method. Difference between the highest CAC value 12.27 10-6 mol L–1 (D44/10) and the lowest
CAC value 0.06 10-6 mol L–1 (D44/50; and D1470/50) is three orders. These results clearly
show that CAC value can be modified not only by the substitution degree but also by the
molecular weight of hyaluronan’s derivative.
M SD CAC
kg mol-1 % x 10-6 mol L–1
10 12.27 30 1.02 44
50 0.06 10 4.35 30 1.21 50 0.76
134
70 0.20 10 0.99 30 0.73 183
50 0.47 10 0.51 30 0.19 360
50 0.18 30 0.15 50 0.06 1470
70 0.10
6.1.1.4. Influence of ionic strength
Because of presence of carboxylic groups, low molecular salts can influence CAC. For
this experiment were selected group of modified hyaluronans. Molecular weight was
100 kg mol–1 a three different substitution degrees – 10, 30, and 50 %. Sodium chloride was
select for modification of ionic strength of a hyaluronan solution. CAC were determined in
three salt concentrations – 0, 0.1, and 0.4 mol L–1. Figure 27 shows dependencies for
derivative with substitution degree 10 %. Table 4 summarizes results from measurements.
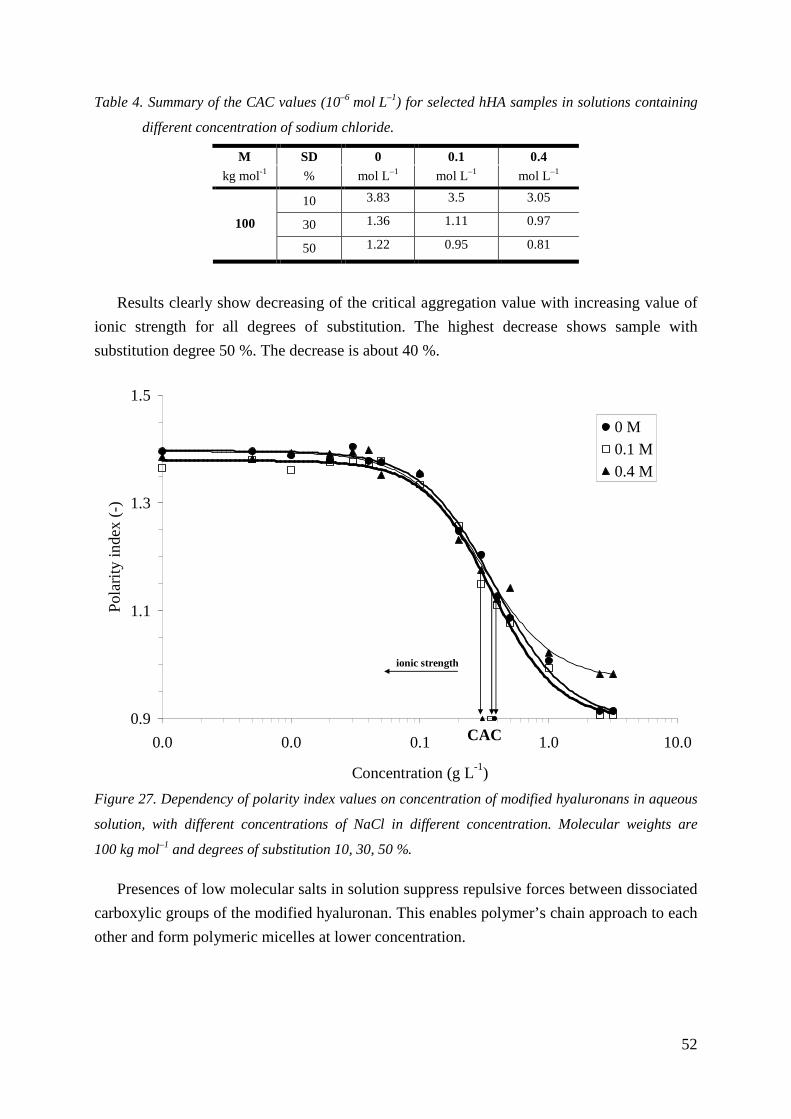
52
Table 4. Summary of the CAC values (10–6 mol L–1) for selected hHA samples in solutions containing
different concentration of sodium chloride.
M SD 0 0.1 0.4
kg mol-1 % mol L–1 mol L–1 mol L–1
10 3.83 3.5 3.05
30 1.36 1.11 0.97 100
50 1.22 0.95 0.81
Results clearly show decreasing of the critical aggregation value with increasing value of
ionic strength for all degrees of substitution. The highest decrease shows sample with
substitution degree 50 %. The decrease is about 40 %.
Figure 27. Dependency of polarity index values on concentration of modified hyaluronans in aqueous
solution, with different concentrations of NaCl in different concentration. Molecular weights are
100 kg mol–1 and degrees of substitution 10, 30, 50 %.
Presences of low molecular salts in solution suppress repulsive forces between dissociated
carboxylic groups of the modified hyaluronan. This enables polymer’s chain approach to each
other and form polymeric micelles at lower concentration.
0.9
1.1
1.3
1.5
0.0 0.0 0.1 1.0 10.0
Concentration (g L-1)
Pol
arit
y in
dex
(-)
0 M0.1 M0.4 M
CAC
ionic strength
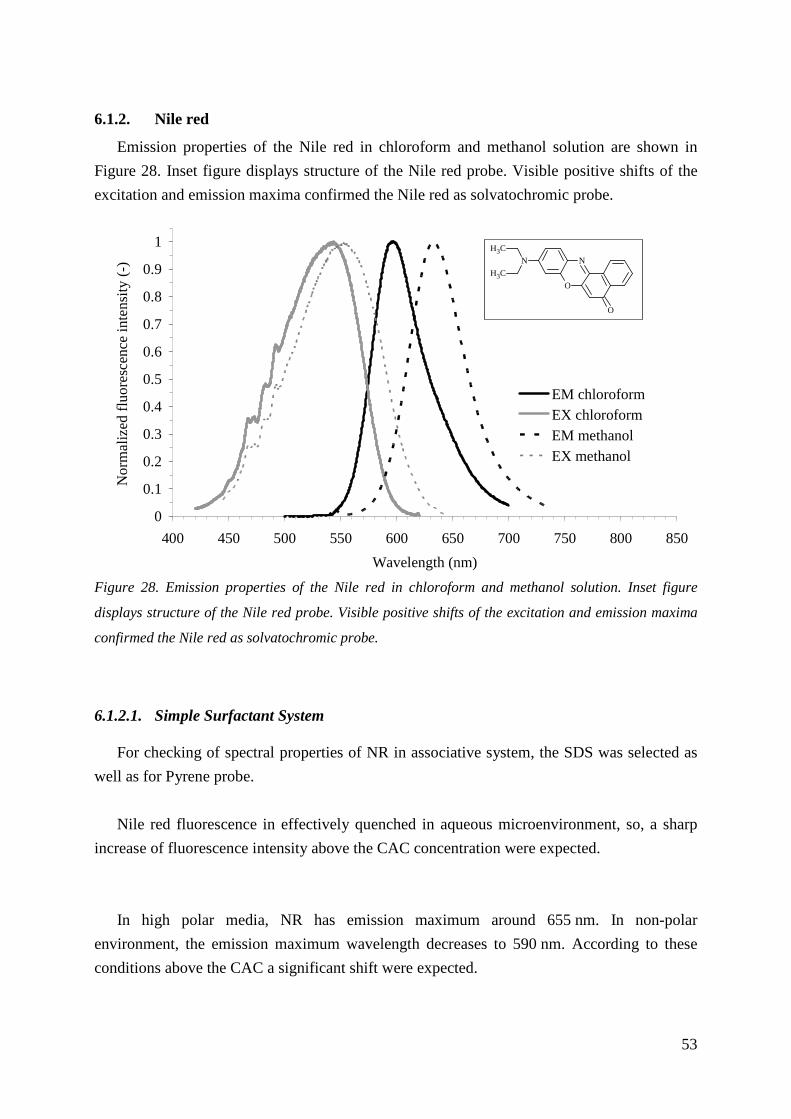
53
6.1.2. Nile red
Emission properties of the Nile red in chloroform and methanol solution are shown in
Figure 28. Inset figure displays structure of the Nile red probe. Visible positive shifts of the
excitation and emission maxima confirmed the Nile red as solvatochromic probe.
0
0.1
0.2
0.3
0.4
0.5
0.6
0.7
0.8
0.9
1
400 450 500 550 600 650 700 750 800 850
Wavelength (nm)
No
rma
lize
d flu
ore
scen
ce in
ten
sity
(-)
EM chloroformEX chloroformEM methanolEX methanol
O
N
O
N
CH3
CH3
Figure 28. Emission properties of the Nile red in chloroform and methanol solution. Inset figure
displays structure of the Nile red probe. Visible positive shifts of the excitation and emission maxima
confirmed the Nile red as solvatochromic probe.
6.1.2.1. Simple Surfactant System
For checking of spectral properties of NR in associative system, the SDS was selected as
well as for Pyrene probe.
Nile red fluorescence in effectively quenched in aqueous microenvironment, so, a sharp
increase of fluorescence intensity above the CAC concentration were expected.
In high polar media, NR has emission maximum around 655 nm. In non-polar
environment, the emission maximum wavelength decreases to 590 nm. According to these
conditions above the CAC a significant shift were expected.
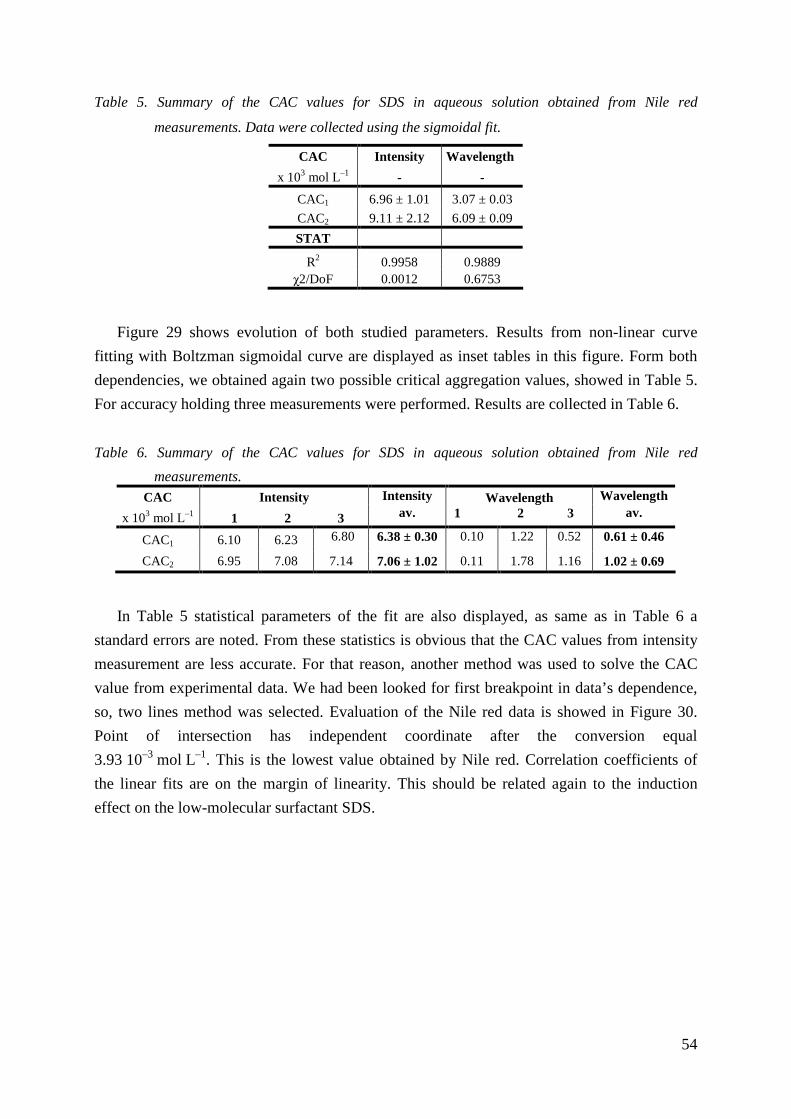
54
Table 5. Summary of the CAC values for SDS in aqueous solution obtained from Nile red
measurements. Data were collected using the sigmoidal fit.
CAC Intensity Wavelength
x 103 mol L–1 - -
CAC1 6.96 ± 1.01 3.07 ± 0.03
CAC2 9.11 ± 2.12 6.09 ± 0.09
STAT
R2 0.9958 0.9889 χ2/DoF 0.0012 0.6753
Figure 29 shows evolution of both studied parameters. Results from non-linear curve
fitting with Boltzman sigmoidal curve are displayed as inset tables in this figure. Form both
dependencies, we obtained again two possible critical aggregation values, showed in Table 5.
For accuracy holding three measurements were performed. Results are collected in Table 6.
Table 6. Summary of the CAC values for SDS in aqueous solution obtained from Nile red
measurements. CAC Intensity Intensity Wavelength
x 103 mol L–1 1 2 3 av. Wavelength
1 2 3 av.
CAC1 6.10 6.23 6.80 6.38 ± 0.30 0.10 1.22 0.52 0.61 ± 0.46
CAC2 6.95 7.08 7.14 7.06 ± 1.02 0.11 1.78 1.16 1.02 ± 0.69
In Table 5 statistical parameters of the fit are also displayed, as same as in Table 6 a
standard errors are noted. From these statistics is obvious that the CAC values from intensity
measurement are less accurate. For that reason, another method was used to solve the CAC
value from experimental data. We had been looked for first breakpoint in data’s dependence,
so, two lines method was selected. Evaluation of the Nile red data is showed in Figure 30.
Point of intersection has independent coordinate after the conversion equal
3.93 10–3 mol L–1. This is the lowest value obtained by Nile red. Correlation coefficients of
the linear fits are on the margin of linearity. This should be related again to the induction
effect on the low-molecular surfactant SDS.
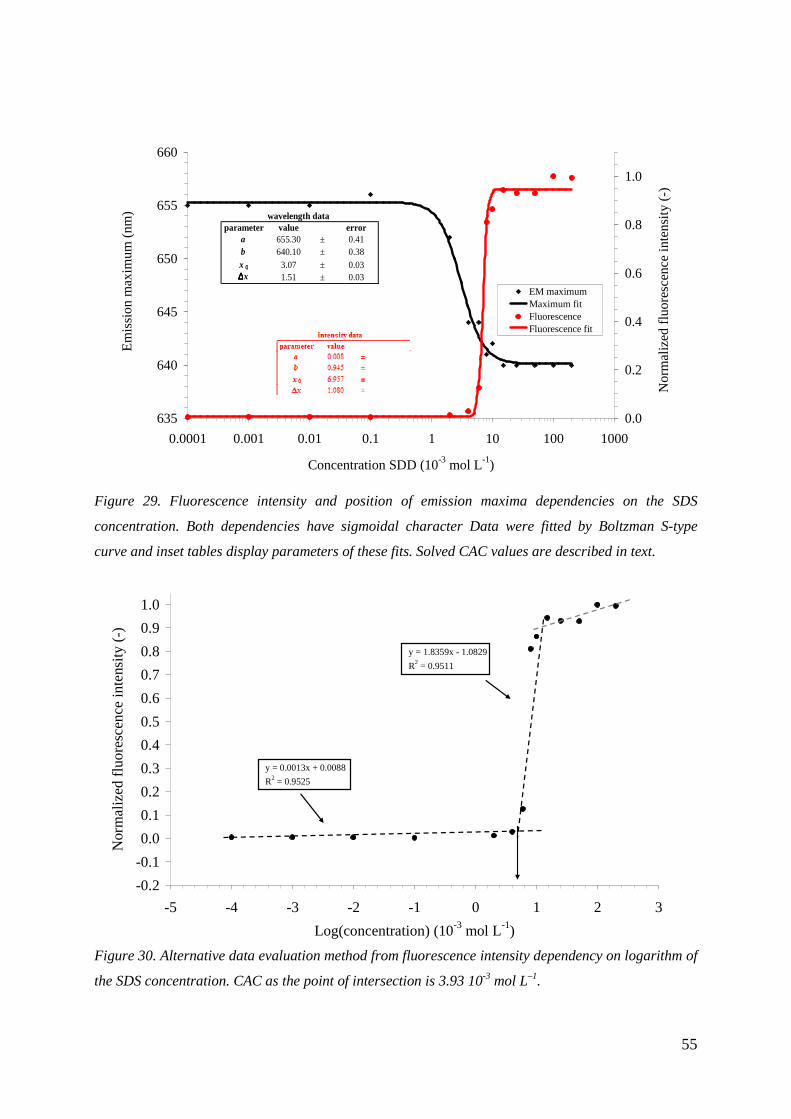
55
Figure 29. Fluorescence intensity and position of emission maxima dependencies on the SDS
concentration. Both dependencies have sigmoidal character Data were fitted by Boltzman S-type
curve and inset tables display parameters of these fits. Solved CAC values are described in text.
Figure 30. Alternative data evaluation method from fluorescence intensity dependency on logarithm of
the SDS concentration. CAC as the point of intersection is 3.93 10-3 mol L–1.
635
640
645
650
655
660
0.0001 0.001 0.01 0.1 1 10 100 1000
Concentration SDD (10-3 mol L-1)
Em
issi
on m
axim
um (
nm)
0.0
0.2
0.4
0.6
0.8
1.0
Nor
mal
ized
flu
ores
cenc
e in
tens
ity (
-)
EM maximumMaximum fitFluorescenceFluorescence fit
wavelength dataparameter value error
a 655.30 ± 0.41b 640.10 ± 0.38x 0 3.07 ± 0.03∆∆∆∆x 1.51 ± 0.03
-0.2
-0.1
0.0
0.1
0.2
0.3
0.4
0.5
0.6
0.7
0.8
0.9
1.0
-5 -4 -3 -2 -1 0 1 2 3
Log(concentration) (10-3 mol L-1)
Nor
ma
lize
d fl
uo
resc
ence
inte
nsity
(-)
y = 0.0013x + 0.0088
R2 = 0.9525
y = 1.8359x - 1.0829
R2 = 0.9511
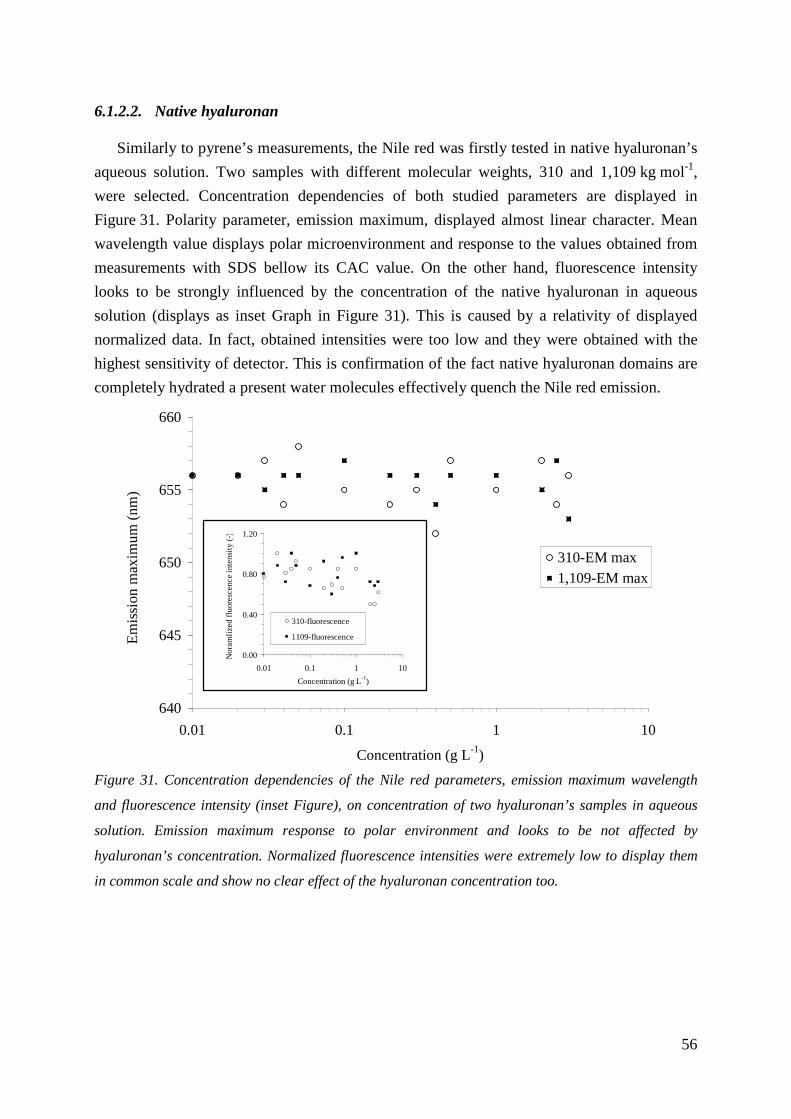
56
6.1.2.2. Native hyaluronan
Similarly to pyrene’s measurements, the Nile red was firstly tested in native hyaluronan’s
aqueous solution. Two samples with different molecular weights, 310 and 1,109 kg mol-1,
were selected. Concentration dependencies of both studied parameters are displayed in
Figure 31. Polarity parameter, emission maximum, displayed almost linear character. Mean
wavelength value displays polar microenvironment and response to the values obtained from
measurements with SDS bellow its CAC value. On the other hand, fluorescence intensity
looks to be strongly influenced by the concentration of the native hyaluronan in aqueous
solution (displays as inset Graph in Figure 31). This is caused by a relativity of displayed
normalized data. In fact, obtained intensities were too low and they were obtained with the
highest sensitivity of detector. This is confirmation of the fact native hyaluronan domains are
completely hydrated a present water molecules effectively quench the Nile red emission.
Figure 31. Concentration dependencies of the Nile red parameters, emission maximum wavelength
and fluorescence intensity (inset Figure), on concentration of two hyaluronan’s samples in aqueous
solution. Emission maximum response to polar environment and looks to be not affected by
hyaluronan’s concentration. Normalized fluorescence intensities were extremely low to display them
in common scale and show no clear effect of the hyaluronan concentration too.
640
645
650
655
660
0.01 0.1 1 10
Concentration (g L-1)
Em
issi
on m
axim
um
(n
m)
310-EM max1,109-EM max
0.00
0.40
0.80
1.20
0.01 0.1 1 10
Concentration (g L-1)
No
ram
lize
d flu
ore
sce
nce
inte
nsity
(-)
310-fluorescence
1109-fluorescence
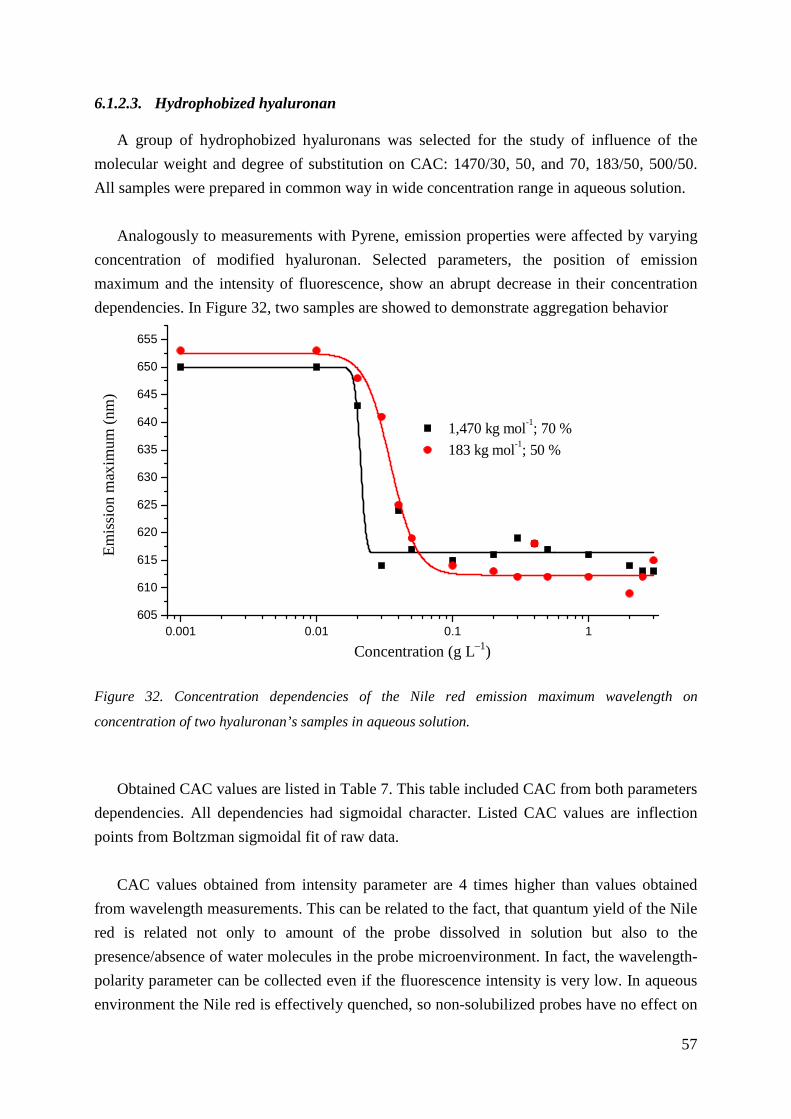
57
6.1.2.3. Hydrophobized hyaluronan
A group of hydrophobized hyaluronans was selected for the study of influence of the
molecular weight and degree of substitution on CAC: 1470/30, 50, and 70, 183/50, 500/50.
All samples were prepared in common way in wide concentration range in aqueous solution.
Analogously to measurements with Pyrene, emission properties were affected by varying
concentration of modified hyaluronan. Selected parameters, the position of emission
maximum and the intensity of fluorescence, show an abrupt decrease in their concentration
dependencies. In Figure 32, two samples are showed to demonstrate aggregation behavior
Figure 32. Concentration dependencies of the Nile red emission maximum wavelength on
concentration of two hyaluronan’s samples in aqueous solution.
Obtained CAC values are listed in Table 7. This table included CAC from both parameters
dependencies. All dependencies had sigmoidal character. Listed CAC values are inflection
points from Boltzman sigmoidal fit of raw data.
CAC values obtained from intensity parameter are 4 times higher than values obtained
from wavelength measurements. This can be related to the fact, that quantum yield of the Nile
red is related not only to amount of the probe dissolved in solution but also to the
presence/absence of water molecules in the probe microenvironment. In fact, the wavelength-
polarity parameter can be collected even if the fluorescence intensity is very low. In aqueous
environment the Nile red is effectively quenched, so non-solubilized probes have no effect on
0.001 0.01 0.1 1605
610
615
620
625
630
635
640
645
650
655
1,470 kg mol-1; 70 %
183 kg mol-1; 50 %
em
issi
on
ma
xim
m w
ave
leng
th (
nm
)
concentration (g dm-3)Concentration (g L–1)
E
mis
sio
n m
axim
um
(nm
)
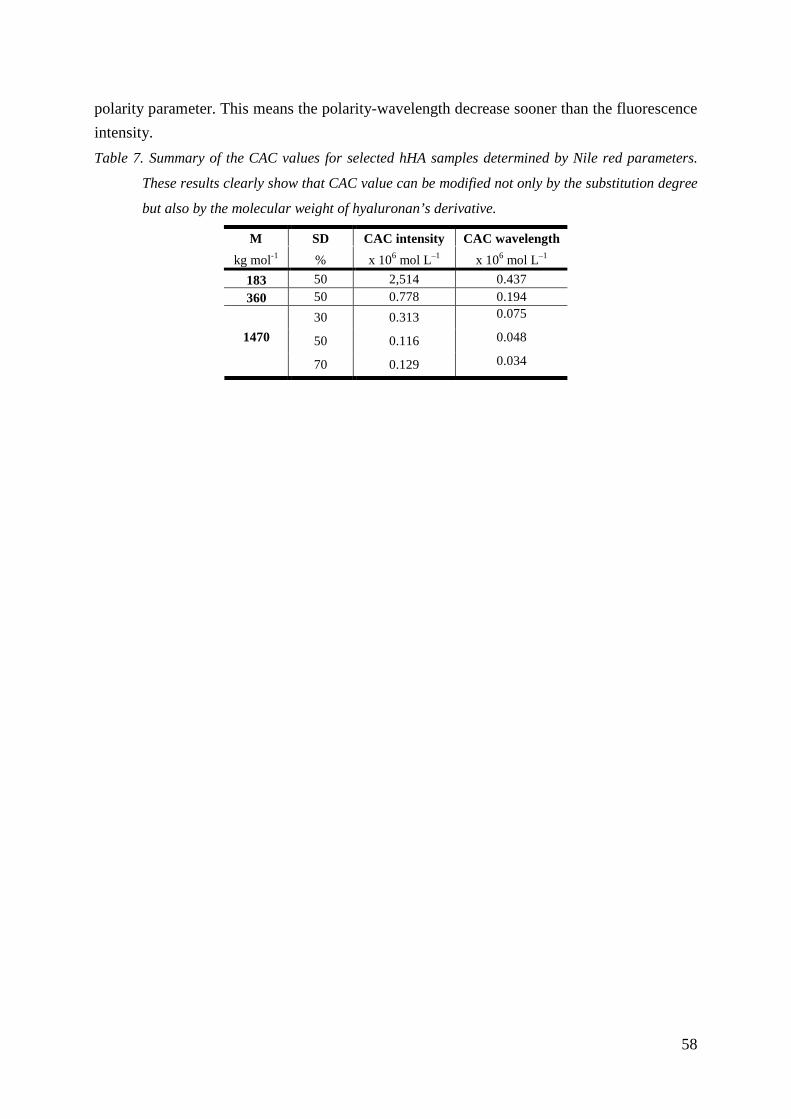
58
polarity parameter. This means the polarity-wavelength decrease sooner than the fluorescence
intensity.
Table 7. Summary of the CAC values for selected hHA samples determined by Nile red parameters.
These results clearly show that CAC value can be modified not only by the substitution degree
but also by the molecular weight of hyaluronan’s derivative.
M SD CAC intensity CAC wavelength
kg mol-1 % x 106 mol L–1 x 10⁶ mol L–1
183 50 2,514 0.437
360 50 0.778 0.194
30 0.313 0.075
50 0.116 0.048 1470
70 0.129 0.034
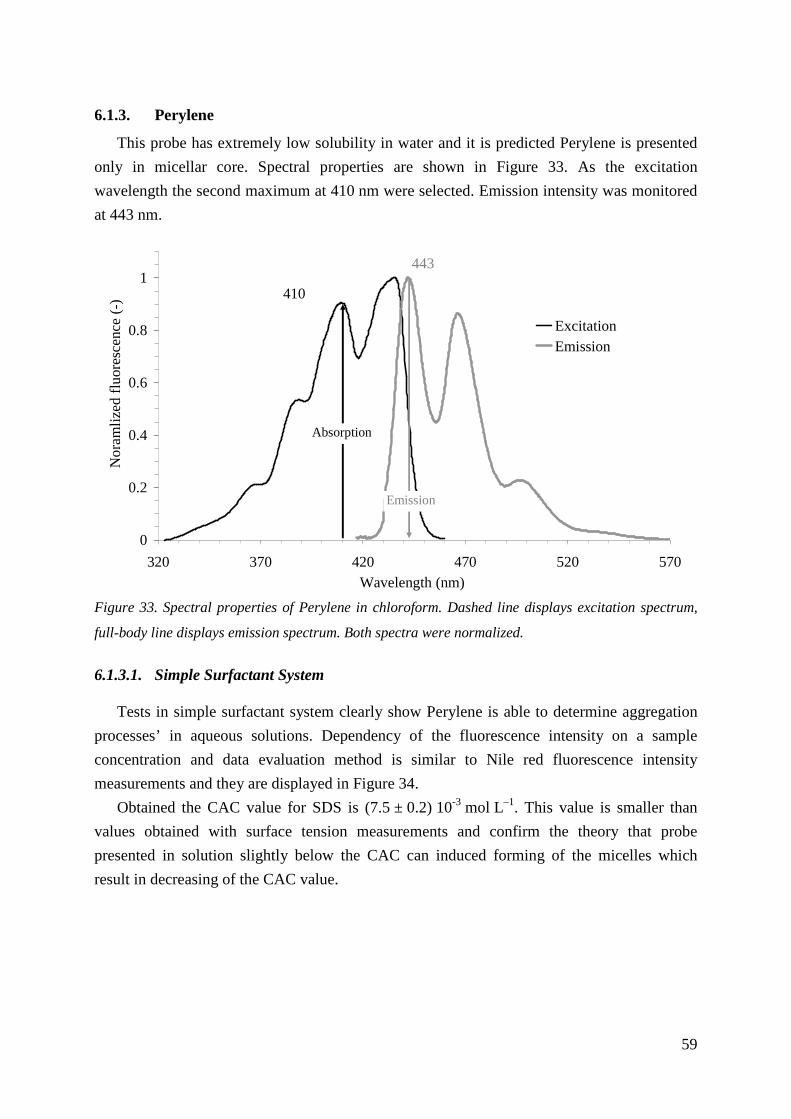
59
6.1.3. Perylene
This probe has extremely low solubility in water and it is predicted Perylene is presented
only in micellar core. Spectral properties are shown in Figure 33. As the excitation
wavelength the second maximum at 410 nm were selected. Emission intensity was monitored
at 443 nm.
Figure 33. Spectral properties of Perylene in chloroform. Dashed line displays excitation spectrum,
full-body line displays emission spectrum. Both spectra were normalized.
6.1.3.1. Simple Surfactant System
Tests in simple surfactant system clearly show Perylene is able to determine aggregation
processes’ in aqueous solutions. Dependency of the fluorescence intensity on a sample
concentration and data evaluation method is similar to Nile red fluorescence intensity
measurements and they are displayed in Figure 34.
Obtained the CAC value for SDS is (7.5 ± 0.2) 10-3 mol L–1. This value is smaller than
values obtained with surface tension measurements and confirm the theory that probe
presented in solution slightly below the CAC can induced forming of the micelles which
result in decreasing of the CAC value.
0
0.2
0.4
0.6
0.8
1
320 370 420 470 520 570Wavelength (nm)
No
ram
lize
d f
luor
esc
enc
e (
-)
ExcitationEmission
410 nm
443 nm
Absorption
Emission
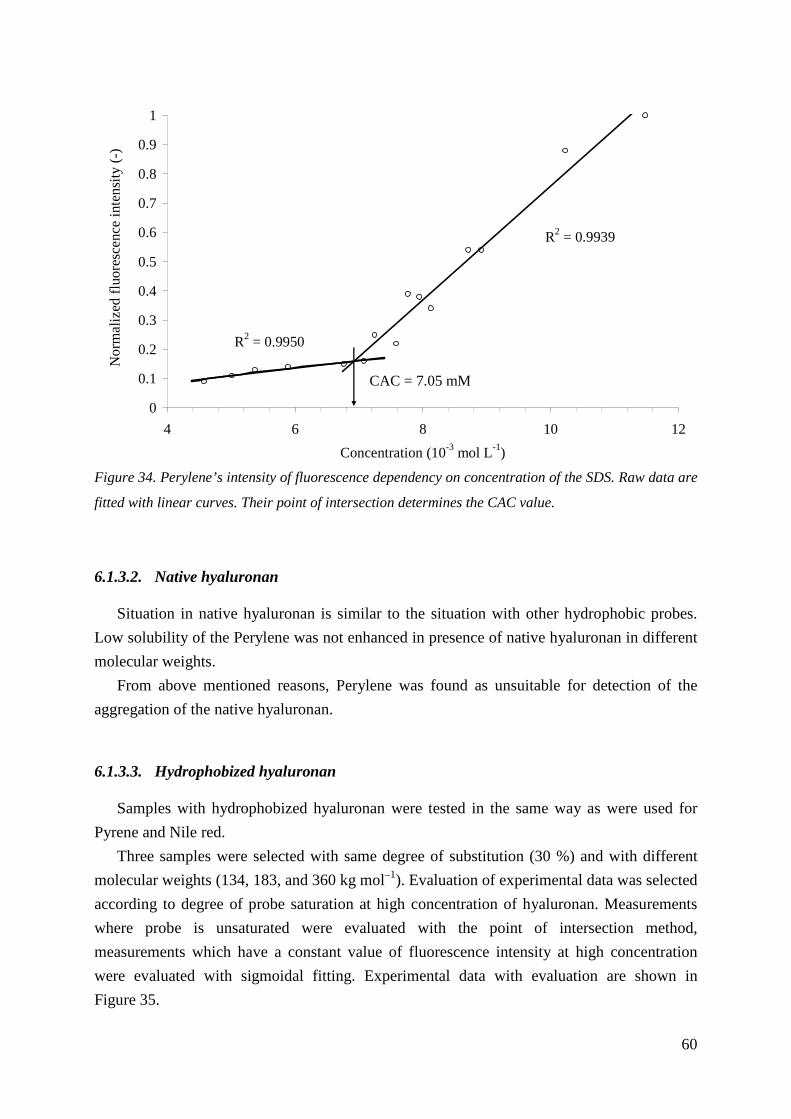
60
Figure 34. Perylene’s intensity of fluorescence dependency on concentration of the SDS. Raw data are
fitted with linear curves. Their point of intersection determines the CAC value.
6.1.3.2. Native hyaluronan
Situation in native hyaluronan is similar to the situation with other hydrophobic probes.
Low solubility of the Perylene was not enhanced in presence of native hyaluronan in different
molecular weights.
From above mentioned reasons, Perylene was found as unsuitable for detection of the
aggregation of the native hyaluronan.
6.1.3.3. Hydrophobized hyaluronan
Samples with hydrophobized hyaluronan were tested in the same way as were used for
Pyrene and Nile red.
Three samples were selected with same degree of substitution (30 %) and with different
molecular weights (134, 183, and 360 kg mol–1). Evaluation of experimental data was selected
according to degree of probe saturation at high concentration of hyaluronan. Measurements
where probe is unsaturated were evaluated with the point of intersection method,
measurements which have a constant value of fluorescence intensity at high concentration
were evaluated with sigmoidal fitting. Experimental data with evaluation are shown in
Figure 35.
R2 = 0.9939
R2 = 0.9950
0
0.1
0.2
0.3
0.4
0.5
0.6
0.7
0.8
0.9
1
4 6 8 10 12
Concentration (10-3 mol L-1)
No
rma
lized
flu
ores
cenc
e in
ten
sity
(-)
CAC = 7.05 mM
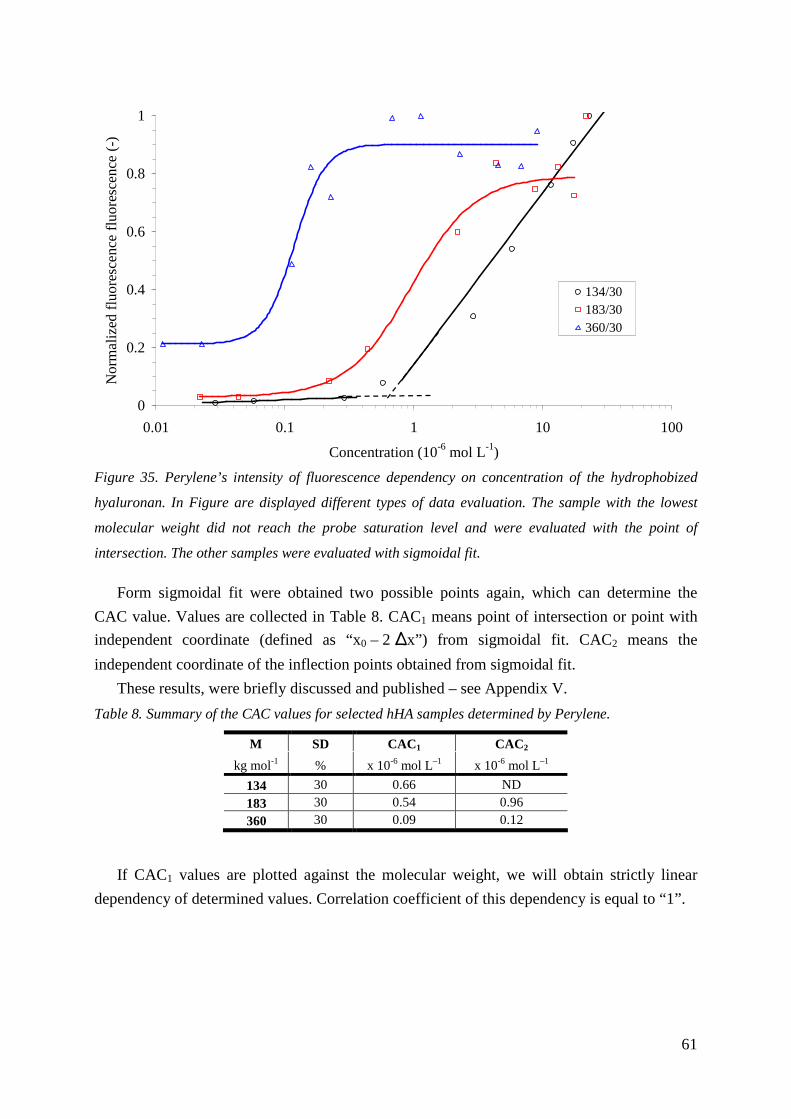
61
Figure 35. Perylene’s intensity of fluorescence dependency on concentration of the hydrophobized
hyaluronan. In Figure are displayed different types of data evaluation. The sample with the lowest
molecular weight did not reach the probe saturation level and were evaluated with the point of
intersection. The other samples were evaluated with sigmoidal fit.
Form sigmoidal fit were obtained two possible points again, which can determine the
CAC value. Values are collected in Table 8. CAC1 means point of intersection or point with
independent coordinate (defined as “x0 – 2 ∆x”) from sigmoidal fit. CAC2 means the
independent coordinate of the inflection points obtained from sigmoidal fit.
These results, were briefly discussed and published – see Appendix V.
Table 8. Summary of the CAC values for selected hHA samples determined by Perylene.
M SD CAC1 CAC2
kg mol-1 % x 10-6 mol L–1 x 10⁻⁶ mol L–1
134 30 0.66 ND
183 30 0.54 0.96
360 30 0.09 0.12
If CAC1 values are plotted against the molecular weight, we will obtain strictly linear
dependency of determined values. Correlation coefficient of this dependency is equal to “1”.
0
0.2
0.4
0.6
0.8
1
0.01 0.1 1 10 100
Concentration (10-6 mol L-1)
No
rma
lized
flu
ore
sce
nce
flu
ore
sce
nce
(-)
134/30183/30360/30
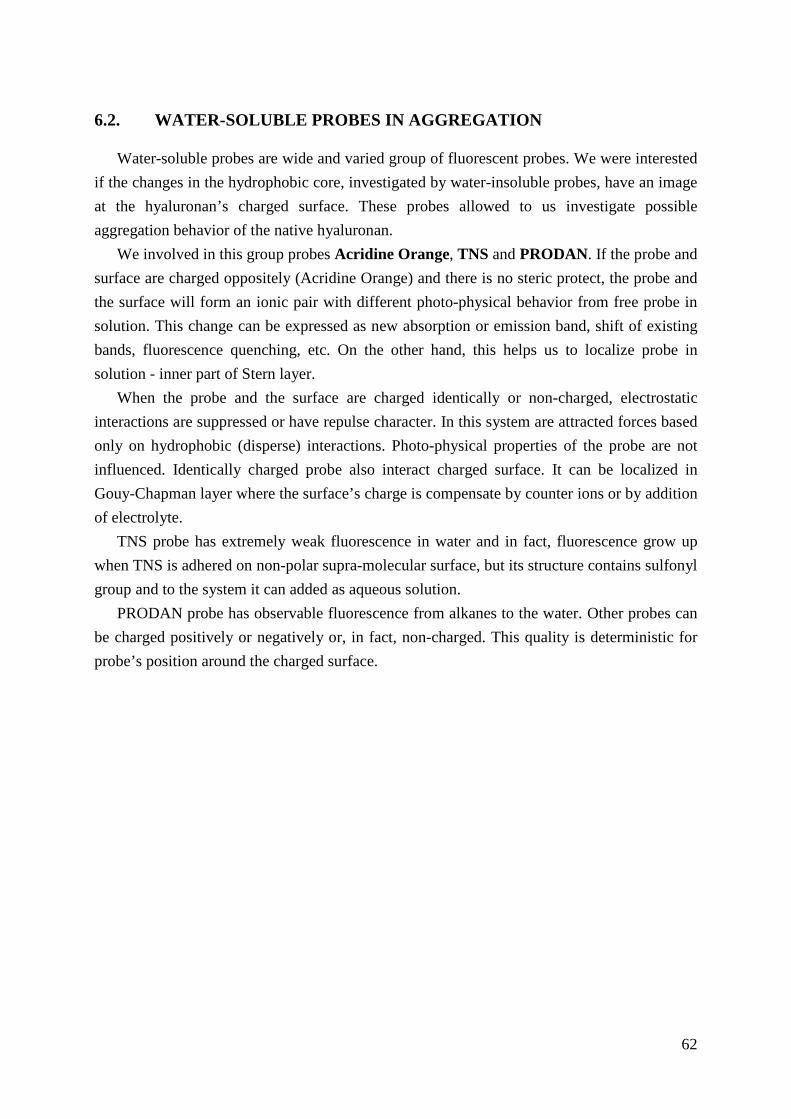
62
6.2. WATER-SOLUBLE PROBES IN AGGREGATION
Water-soluble probes are wide and varied group of fluorescent probes. We were interested
if the changes in the hydrophobic core, investigated by water-insoluble probes, have an image
at the hyaluronan’s charged surface. These probes allowed to us investigate possible
aggregation behavior of the native hyaluronan.
We involved in this group probes Acridine Orange, TNS and PRODAN. If the probe and
surface are charged oppositely (Acridine Orange) and there is no steric protect, the probe and
the surface will form an ionic pair with different photo-physical behavior from free probe in
solution. This change can be expressed as new absorption or emission band, shift of existing
bands, fluorescence quenching, etc. On the other hand, this helps us to localize probe in
solution - inner part of Stern layer.
When the probe and the surface are charged identically or non-charged, electrostatic
interactions are suppressed or have repulse character. In this system are attracted forces based
only on hydrophobic (disperse) interactions. Photo-physical properties of the probe are not
influenced. Identically charged probe also interact charged surface. It can be localized in
Gouy-Chapman layer where the surface’s charge is compensate by counter ions or by addition
of electrolyte.
TNS probe has extremely weak fluorescence in water and in fact, fluorescence grow up
when TNS is adhered on non-polar supra-molecular surface, but its structure contains sulfonyl
group and to the system it can added as aqueous solution.
PRODAN probe has observable fluorescence from alkanes to the water. Other probes can
be charged positively or negatively or, in fact, non-charged. This quality is deterministic for
probe’s position around the charged surface.
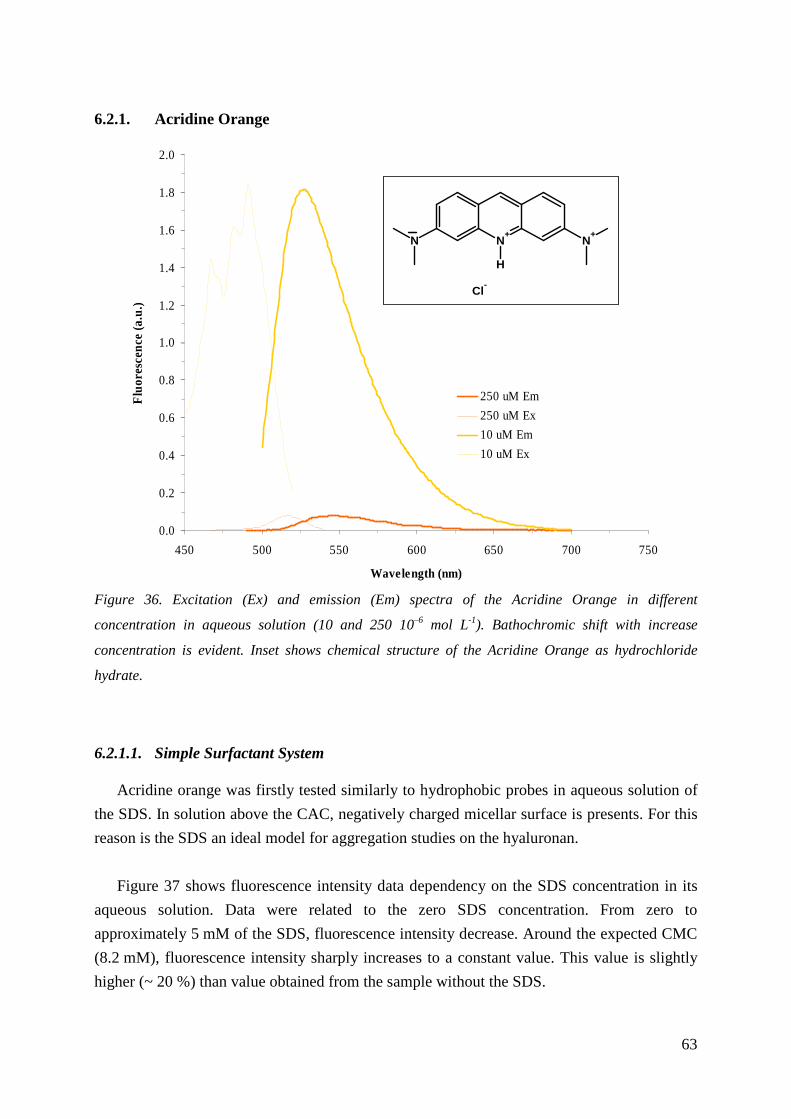
63
6.2.1. Acridine Orange
Figure 36. Excitation (Ex) and emission (Em) spectra of the Acridine Orange in different
concentration in aqueous solution (10 and 250 10–6 mol L-1). Bathochromic shift with increase
concentration is evident. Inset shows chemical structure of the Acridine Orange as hydrochloride
hydrate.
6.2.1.1. Simple Surfactant System
Acridine orange was firstly tested similarly to hydrophobic probes in aqueous solution of
the SDS. In solution above the CAC, negatively charged micellar surface is presents. For this
reason is the SDS an ideal model for aggregation studies on the hyaluronan.
Figure 37 shows fluorescence intensity data dependency on the SDS concentration in its
aqueous solution. Data were related to the zero SDS concentration. From zero to
approximately 5 mM of the SDS, fluorescence intensity decrease. Around the expected CMC
(8.2 mM), fluorescence intensity sharply increases to a constant value. This value is slightly
higher (~ 20 %) than value obtained from the sample without the SDS.
0.0
0.2
0.4
0.6
0.8
1.0
1.2
1.4
1.6
1.8
2.0
450 500 550 600 650 700 750
Wavelength (nm)
Flu
ores
cenc
e (a
.u.)
250 uM Em
250 uM Ex
10 uM Em
10 uM Ex
Cl-
H
N+
N N+
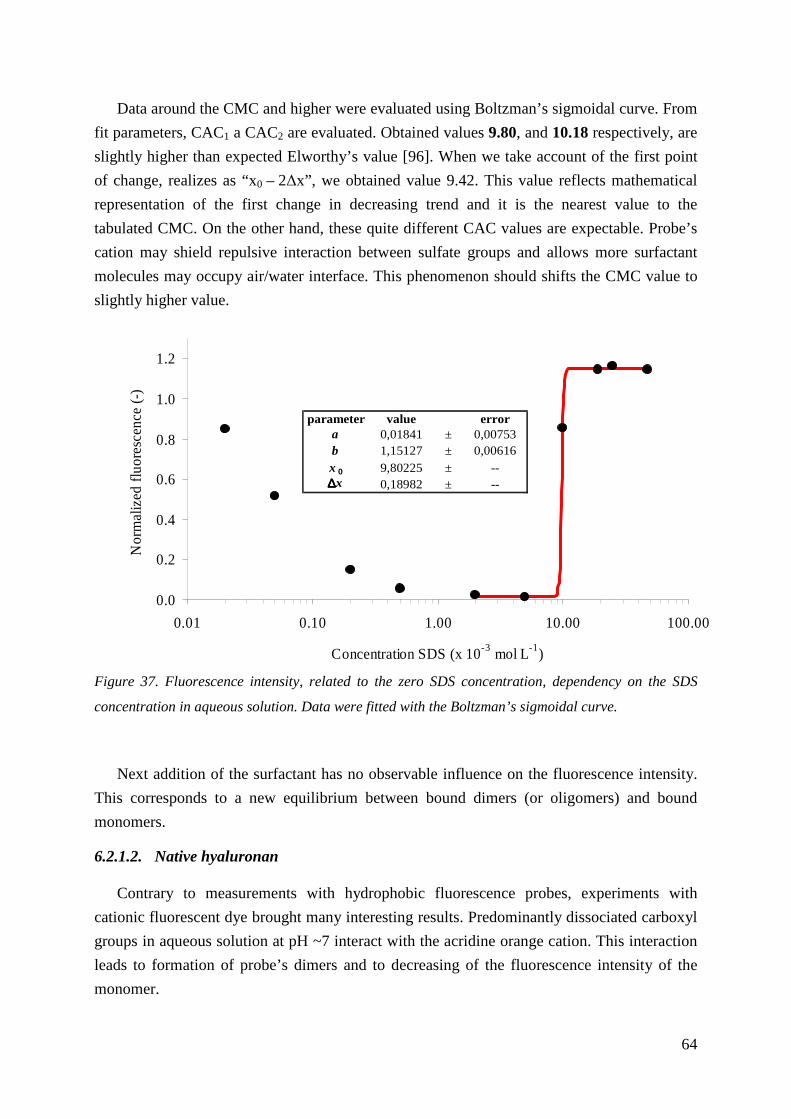
64
Data around the CMC and higher were evaluated using Boltzman’s sigmoidal curve. From
fit parameters, CAC1 a CAC2 are evaluated. Obtained values 9.80, and 10.18 respectively, are
slightly higher than expected Elworthy’s value [96]. When we take account of the first point
of change, realizes as “x0 – 2∆x”, we obtained value 9.42. This value reflects mathematical
representation of the first change in decreasing trend and it is the nearest value to the
tabulated CMC. On the other hand, these quite different CAC values are expectable. Probe’s
cation may shield repulsive interaction between sulfate groups and allows more surfactant
molecules may occupy air/water interface. This phenomenon should shifts the CMC value to
slightly higher value.
Figure 37. Fluorescence intensity, related to the zero SDS concentration, dependency on the SDS
concentration in aqueous solution. Data were fitted with the Boltzman’s sigmoidal curve.
Next addition of the surfactant has no observable influence on the fluorescence intensity.
This corresponds to a new equilibrium between bound dimers (or oligomers) and bound
monomers.
6.2.1.2. Native hyaluronan
Contrary to measurements with hydrophobic fluorescence probes, experiments with
cationic fluorescent dye brought many interesting results. Predominantly dissociated carboxyl
groups in aqueous solution at pH ~7 interact with the acridine orange cation. This interaction
leads to formation of probe’s dimers and to decreasing of the fluorescence intensity of the
monomer.
0.0
0.2
0.4
0.6
0.8
1.0
1.2
0.01 0.10 1.00 10.00 100.00
Concentration SDS (x 10-3 mol L-1)
Nor
mal
ized
flu
ores
cenc
e (-
)
parameter value errora 0,01841 ± 0,00753b 1,15127 ± 0,00616x 0 9,80225 ± --∆∆∆∆x 0,18982 ± --
65
Shape of the dependency of the AO’s fluorescence intensity on the concentration of the
native hyaluronan should be affected by the initial concentration of the probe. This influence
should be checked off if the fluorescence intensity is plotted against a ratio of a polymer
binding sites to the concentration of the probe – P/D, polymer-to-dye ratio. For the selected
hyaluronan’s molecular weights, typical dependencies are shown in Figure 38. Displayed
range is equal to a hyaluronan concentration range from 0 to 0.05 g L-1. In this dilute region, a
dependency can be separate to two linear curves. Theirs point of intersection is end-point of
titration, (P/D)e, a point of equivalence where all free carboxyl groups are occupied with at
least one dimer of acridine orange.
Figure 38. Dependency of the relative fluorescence intensity of AO on P/D for native hyaluronan in
aqueous solution with two different molecular weights – 106 and 253.9 kg mol–1. There is also shown
end-point of titration, (P/D)e, a point of equivalence where all free carboxyl groups are occupied with
at least one dimer of acridine orange.
Because of electrostatic origin of AO dimer formation on polyelectrolytes, influence of the
low molecular weight electrolytes addition was also studied. First experiment was focused on
a change of end-point of titration. Figure 39 shows dependency of the AO fluorescence
intensity in dilute region of HA aqueous solution in the presence of NaCl in two different
concentrations – 0.1 and 0.5 mol L–1. Due to an electrostatic shielding of carboxylic groups by
low-molecular weight salt, end-point of titration is moved to lower values. These values are in
the same order of magnitude.
0.4
0.5
0.6
0.7
0.8
0.9
1.0
0 1 2 3 4 5 6 7 8
P/D (-)
Re
lativ
e flu
ores
cenc
e in
tens
ity (
-)
106 kDa253,9 kDa
(P/D
) e
○ 106 kDa ■ 253.9 kDa
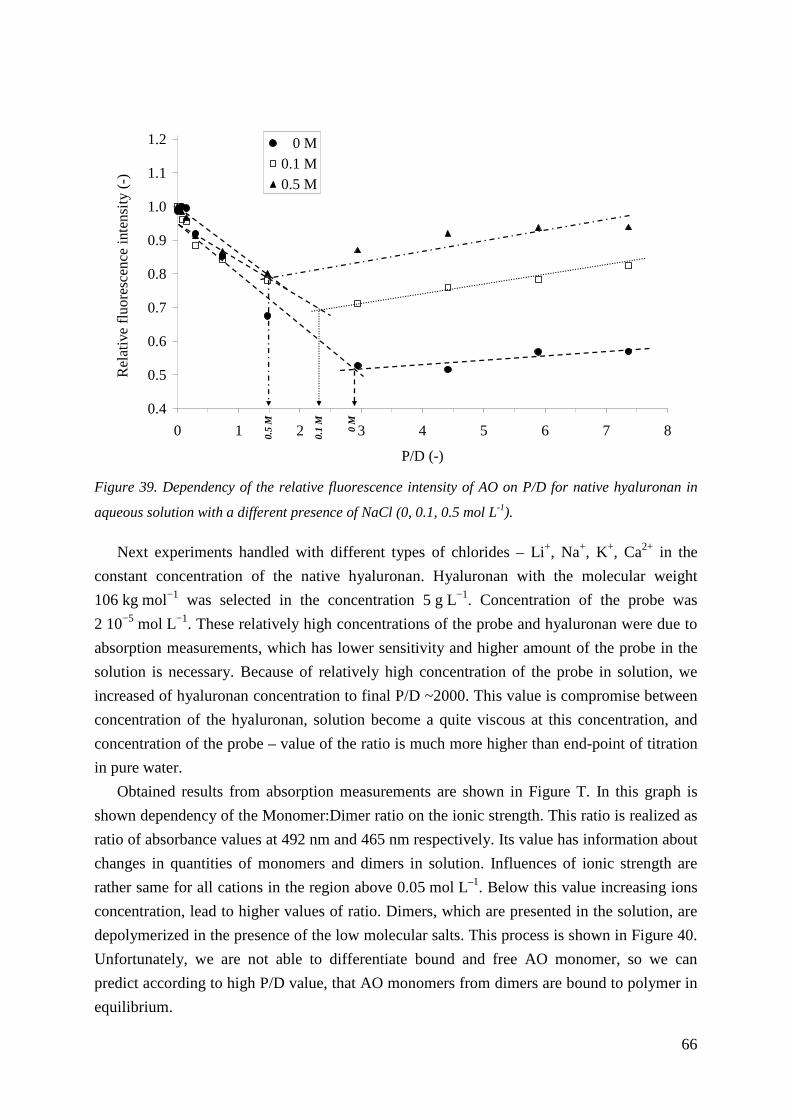
66
Figure 39. Dependency of the relative fluorescence intensity of AO on P/D for native hyaluronan in
aqueous solution with a different presence of NaCl (0, 0.1, 0.5 mol L-1).
Next experiments handled with different types of chlorides – Li+, Na+, K+, Ca2+ in the
constant concentration of the native hyaluronan. Hyaluronan with the molecular weight
106 kg mol−1 was selected in the concentration 5 g L−1. Concentration of the probe was
2 10−5 mol L−1. These relatively high concentrations of the probe and hyaluronan were due to
absorption measurements, which has lower sensitivity and higher amount of the probe in the
solution is necessary. Because of relatively high concentration of the probe in solution, we
increased of hyaluronan concentration to final P/D ~2000. This value is compromise between
concentration of the hyaluronan, solution become a quite viscous at this concentration, and
concentration of the probe – value of the ratio is much more higher than end-point of titration
in pure water.
Obtained results from absorption measurements are shown in Figure T. In this graph is
shown dependency of the Monomer:Dimer ratio on the ionic strength. This ratio is realized as
ratio of absorbance values at 492 nm and 465 nm respectively. Its value has information about
changes in quantities of monomers and dimers in solution. Influences of ionic strength are
rather same for all cations in the region above 0.05 mol L–1. Below this value increasing ions
concentration, lead to higher values of ratio. Dimers, which are presented in the solution, are
depolymerized in the presence of the low molecular salts. This process is shown in Figure 40.
Unfortunately, we are not able to differentiate bound and free AO monomer, so we can
predict according to high P/D value, that AO monomers from dimers are bound to polymer in
equilibrium.
0.4
0.5
0.6
0.7
0.8
0.9
1.0
1.1
1.2
0 1 2 3 4 5 6 7 8
P/D (-)
Rel
ativ
e f
luo
resc
ence
inte
nsi
ty (
-)
0 M0.1 M0.5 M
0.5
M
0.1
M
0 M
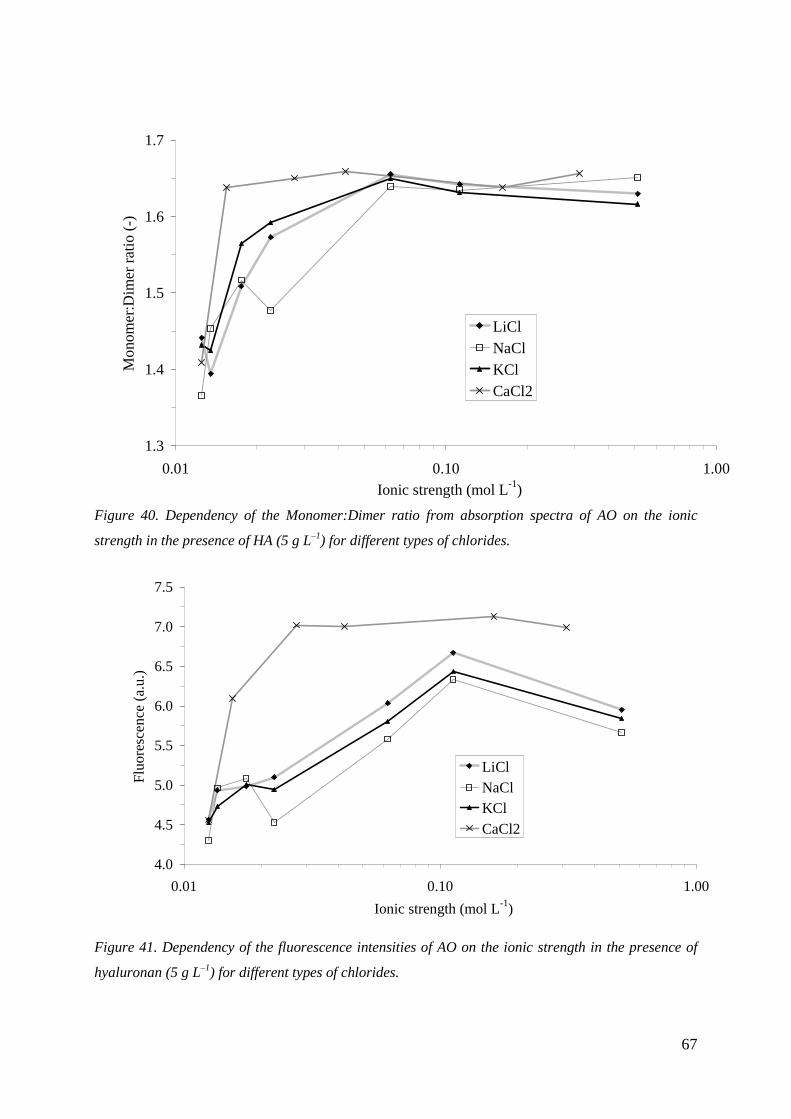
67
Figure 40. Dependency of the Monomer:Dimer ratio from absorption spectra of AO on the ionic
strength in the presence of HA (5 g L–1) for different types of chlorides.
4.0
4.5
5.0
5.5
6.0
6.5
7.0
7.5
0.01 0.10 1.00
Ionic strength (mol L-1)
Flu
ores
cenc
e (a
.u.)
LiClNaClKClCaCl2
Figure 41. Dependency of the fluorescence intensities of AO on the ionic strength in the presence of
hyaluronan (5 g L–1) for different types of chlorides.
1.3
1.4
1.5
1.6
1.7
0.01 0.10 1.00Ionic strength (mol L-1)
Mo
nom
er:
Dim
er
ratio
(-)
LiClNaClKClCaCl2
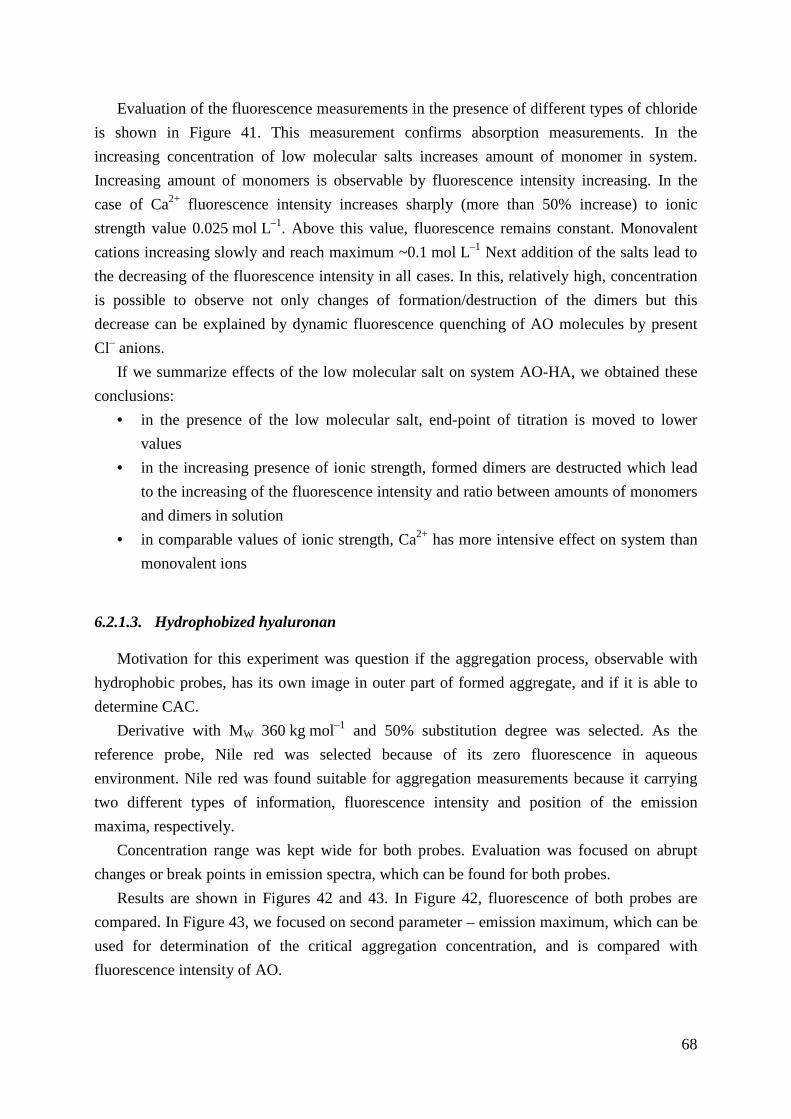
68
Evaluation of the fluorescence measurements in the presence of different types of chloride
is shown in Figure 41. This measurement confirms absorption measurements. In the
increasing concentration of low molecular salts increases amount of monomer in system.
Increasing amount of monomers is observable by fluorescence intensity increasing. In the
case of Ca2+ fluorescence intensity increases sharply (more than 50% increase) to ionic
strength value 0.025 mol L–1. Above this value, fluorescence remains constant. Monovalent
cations increasing slowly and reach maximum ~0.1 mol L–1 Next addition of the salts lead to
the decreasing of the fluorescence intensity in all cases. In this, relatively high, concentration
is possible to observe not only changes of formation/destruction of the dimers but this
decrease can be explained by dynamic fluorescence quenching of AO molecules by present
Cl– anions.
If we summarize effects of the low molecular salt on system AO-HA, we obtained these
conclusions:
• in the presence of the low molecular salt, end-point of titration is moved to lower
values
• in the increasing presence of ionic strength, formed dimers are destructed which lead
to the increasing of the fluorescence intensity and ratio between amounts of monomers
and dimers in solution
• in comparable values of ionic strength, Ca2+ has more intensive effect on system than
monovalent ions
6.2.1.3. Hydrophobized hyaluronan
Motivation for this experiment was question if the aggregation process, observable with
hydrophobic probes, has its own image in outer part of formed aggregate, and if it is able to
determine CAC.
Derivative with MW 360 kg mol–1 and 50% substitution degree was selected. As the
reference probe, Nile red was selected because of its zero fluorescence in aqueous
environment. Nile red was found suitable for aggregation measurements because it carrying
two different types of information, fluorescence intensity and position of the emission
maxima, respectively.
Concentration range was kept wide for both probes. Evaluation was focused on abrupt
changes or break points in emission spectra, which can be found for both probes.
Results are shown in Figures 42 and 43. In Figure 42, fluorescence of both probes are
compared. In Figure 43, we focused on second parameter – emission maximum, which can be
used for determination of the critical aggregation concentration, and is compared with
fluorescence intensity of AO.
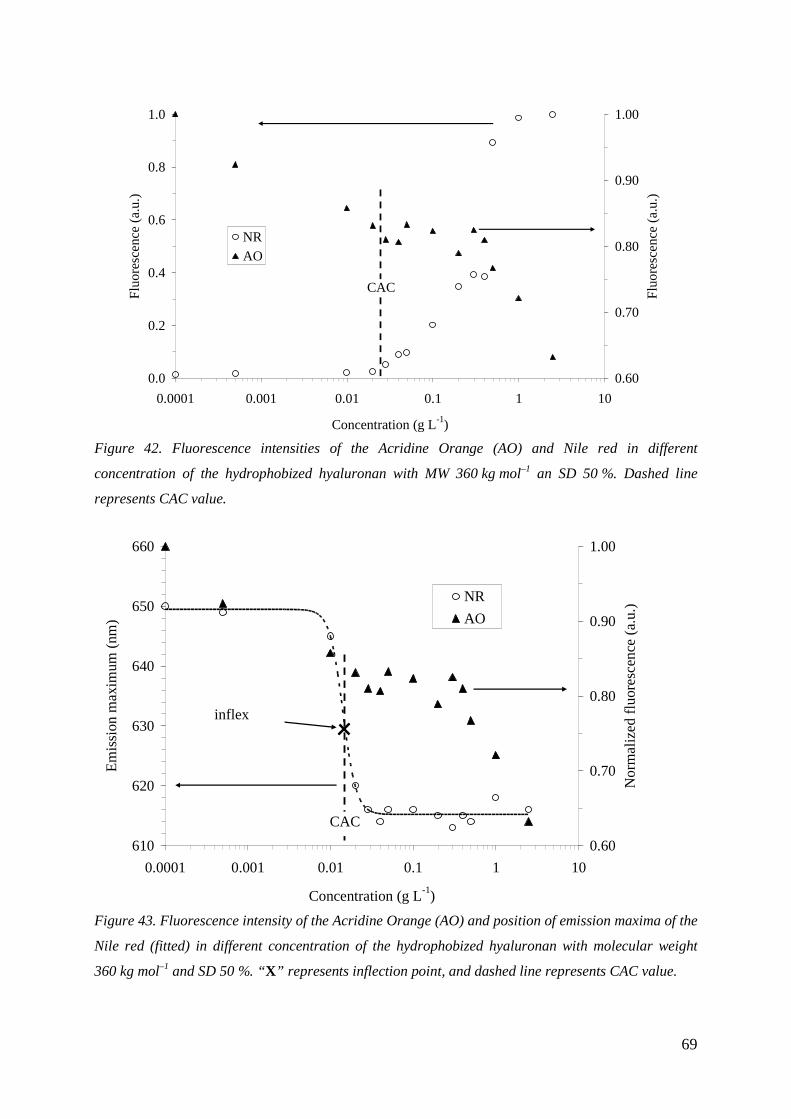
69
Figure 42. Fluorescence intensities of the Acridine Orange (AO) and Nile red in different
concentration of the hydrophobized hyaluronan with MW 360 kg mol–1 an SD 50 %. Dashed line
represents CAC value.
Figure 43. Fluorescence intensity of the Acridine Orange (AO) and position of emission maxima of the
Nile red (fitted) in different concentration of the hydrophobized hyaluronan with molecular weight
360 kg mol–1 and SD 50 %. “X” represents inflection point, and dashed line represents CAC value.
0.0
0.2
0.4
0.6
0.8
1.0
0.0001 0.001 0.01 0.1 1 10
Concentration (g L-1)
Flu
ores
cenc
e (
a.u
.)
0.60
0.70
0.80
0.90
1.00
Flu
ores
cenc
e (
a.u
.)
NRAO
CAC
610
620
630
640
650
660
0.0001 0.001 0.01 0.1 1 10
Concentration (g L-1)
Em
issi
on m
axi
mum
(nm
)
0.60
0.70
0.80
0.90
1.00
No
rma
lize
d fl
uor
esc
ence
(a.
u.)
NR
AO
inflex point
CAC
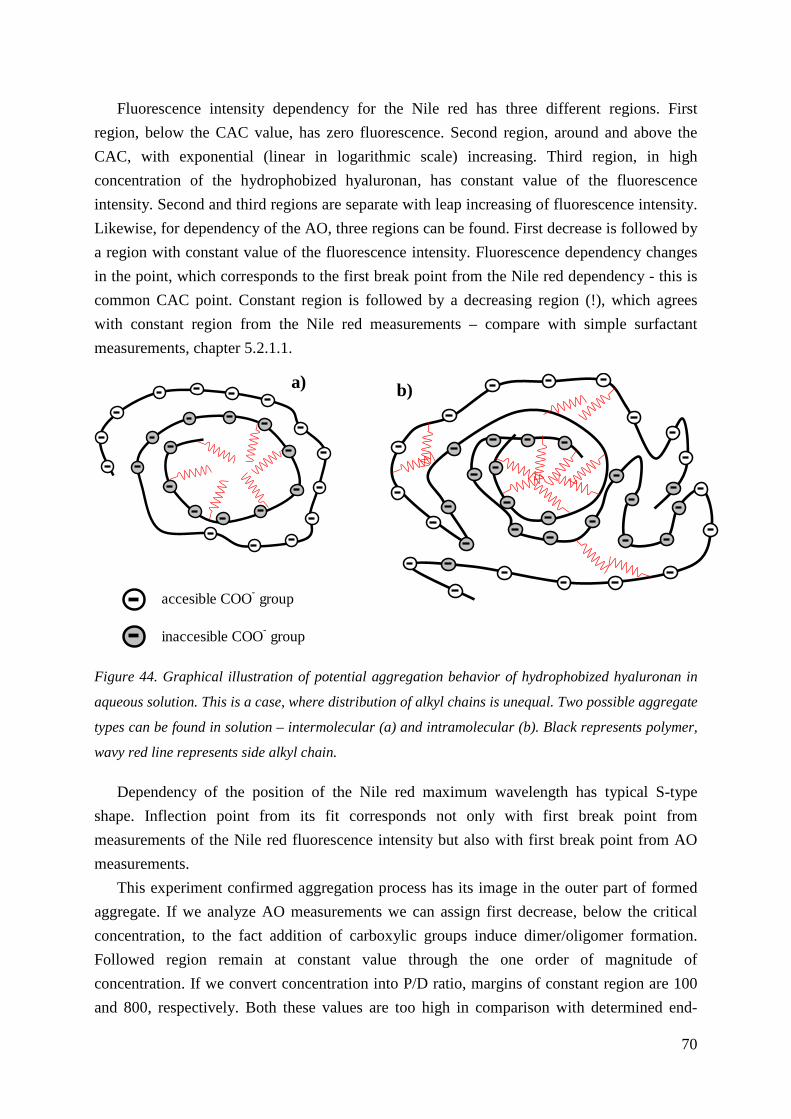
70
Fluorescence intensity dependency for the Nile red has three different regions. First
region, below the CAC value, has zero fluorescence. Second region, around and above the
CAC, with exponential (linear in logarithmic scale) increasing. Third region, in high
concentration of the hydrophobized hyaluronan, has constant value of the fluorescence
intensity. Second and third regions are separate with leap increasing of fluorescence intensity.
Likewise, for dependency of the AO, three regions can be found. First decrease is followed by
a region with constant value of the fluorescence intensity. Fluorescence dependency changes
in the point, which corresponds to the first break point from the Nile red dependency - this is
common CAC point. Constant region is followed by a decreasing region (!), which agrees
with constant region from the Nile red measurements – compare with simple surfactant
measurements, chapter 5.2.1.1.
Figure 44. Graphical illustration of potential aggregation behavior of hydrophobized hyaluronan in
aqueous solution. This is a case, where distribution of alkyl chains is unequal. Two possible aggregate
types can be found in solution – intermolecular (a) and intramolecular (b). Black represents polymer,
wavy red line represents side alkyl chain.
Dependency of the position of the Nile red maximum wavelength has typical S-type
shape. Inflection point from its fit corresponds not only with first break point from
measurements of the Nile red fluorescence intensity but also with first break point from AO
measurements.
This experiment confirmed aggregation process has its image in the outer part of formed
aggregate. If we analyze AO measurements we can assign first decrease, below the critical
concentration, to the fact addition of carboxylic groups induce dimer/oligomer formation.
Followed region remain at constant value through the one order of magnitude of
concentration. If we convert concentration into P/D ratio, margins of constant region are 100
and 800, respectively. Both these values are too high in comparison with determined end-
accesible COO- group
inaccesible COO- group
a) b)
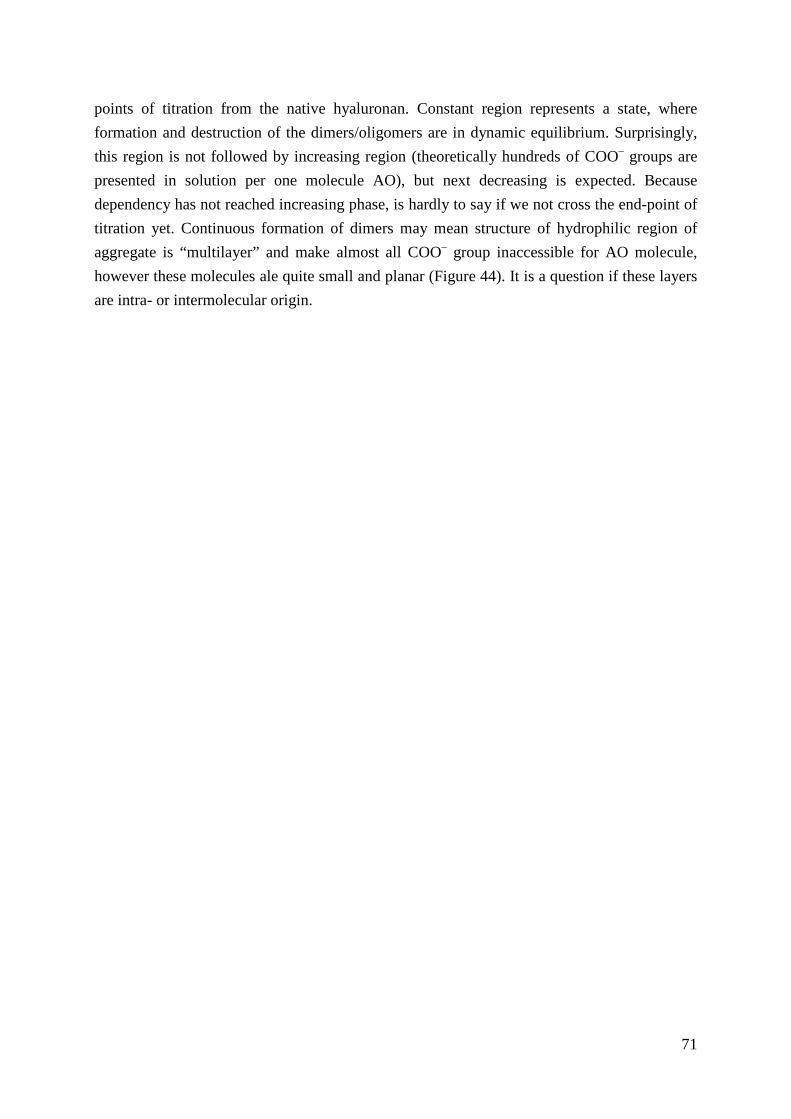
71
points of titration from the native hyaluronan. Constant region represents a state, where
formation and destruction of the dimers/oligomers are in dynamic equilibrium. Surprisingly,
this region is not followed by increasing region (theoretically hundreds of COO– groups are
presented in solution per one molecule AO), but next decreasing is expected. Because
dependency has not reached increasing phase, is hardly to say if we not cross the end-point of
titration yet. Continuous formation of dimers may mean structure of hydrophilic region of
aggregate is “multilayer” and make almost all COO– group inaccessible for AO molecule,
however these molecules ale quite small and planar (Figure 44). It is a question if these layers
are intra- or intermolecular origin.
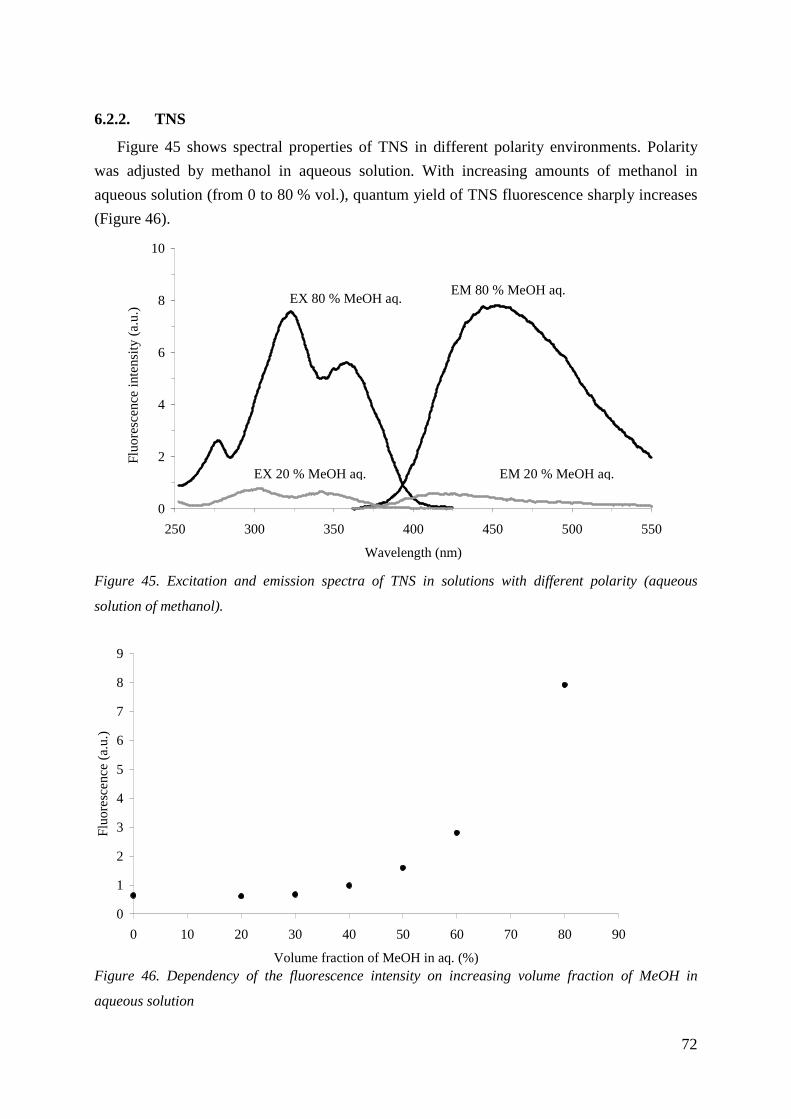
72
6.2.2. TNS
Figure 45 shows spectral properties of TNS in different polarity environments. Polarity
was adjusted by methanol in aqueous solution. With increasing amounts of methanol in
aqueous solution (from 0 to 80 % vol.), quantum yield of TNS fluorescence sharply increases
(Figure 46).
Figure 45. Excitation and emission spectra of TNS in solutions with different polarity (aqueous
solution of methanol).
Figure 46. Dependency of the fluorescence intensity on increasing volume fraction of MeOH in
aqueous solution
0
2
4
6
8
10
250 300 350 400 450 500 550
Wavelength (nm)
Flu
ores
cenc
e in
tens
ity (
a.u.
)
EX 20 % MeOH aq.
EX 80 % MeOH aq.EM 80 % MeOH aq.
EM 20 % MeOH aq.
0
1
2
3
4
5
6
7
8
9
0 10 20 30 40 50 60 70 80 90
Volume fraction of MeOH in aq. (%)
Flu
ore
sce
nce
(a.u
.)
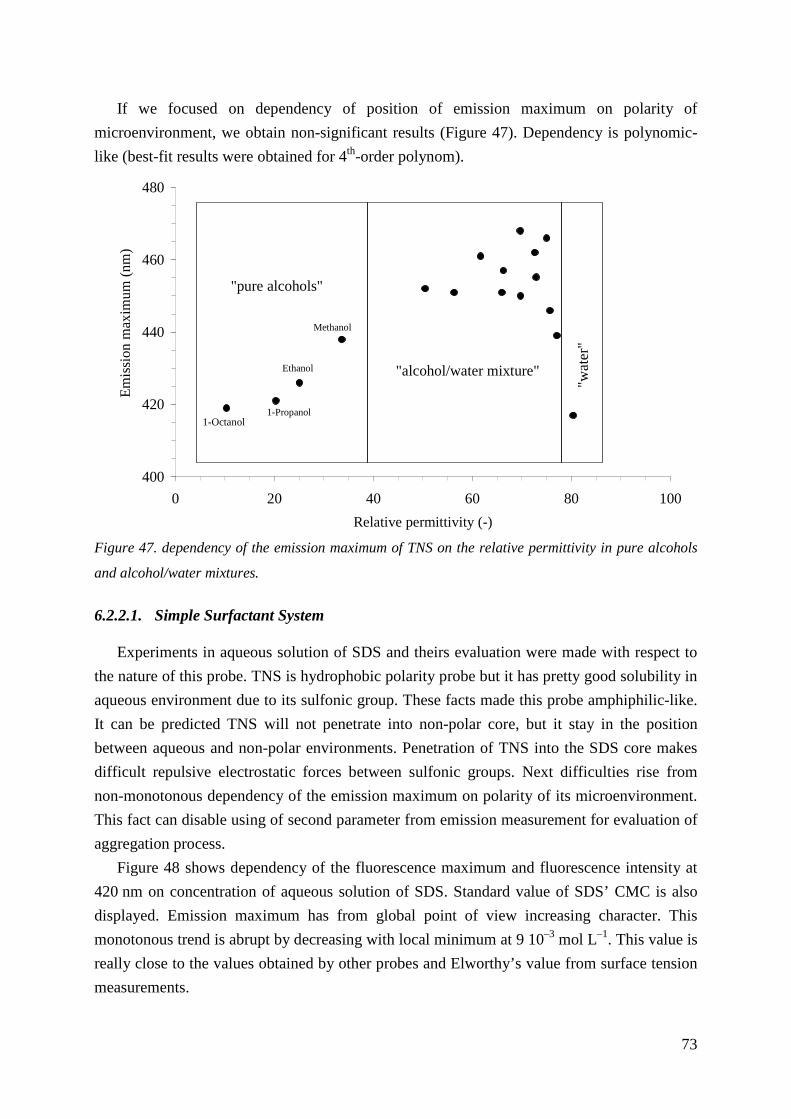
73
If we focused on dependency of position of emission maximum on polarity of
microenvironment, we obtain non-significant results (Figure 47). Dependency is polynomic-
like (best-fit results were obtained for 4th-order polynom).
Figure 47. dependency of the emission maximum of TNS on the relative permittivity in pure alcohols
and alcohol/water mixtures.
6.2.2.1. Simple Surfactant System
Experiments in aqueous solution of SDS and theirs evaluation were made with respect to
the nature of this probe. TNS is hydrophobic polarity probe but it has pretty good solubility in
aqueous environment due to its sulfonic group. These facts made this probe amphiphilic-like.
It can be predicted TNS will not penetrate into non-polar core, but it stay in the position
between aqueous and non-polar environments. Penetration of TNS into the SDS core makes
difficult repulsive electrostatic forces between sulfonic groups. Next difficulties rise from
non-monotonous dependency of the emission maximum on polarity of its microenvironment.
This fact can disable using of second parameter from emission measurement for evaluation of
aggregation process.
Figure 48 shows dependency of the fluorescence maximum and fluorescence intensity at
420 nm on concentration of aqueous solution of SDS. Standard value of SDS’ CMC is also
displayed. Emission maximum has from global point of view increasing character. This
monotonous trend is abrupt by decreasing with local minimum at 9 10–3 mol L–1. This value is
really close to the values obtained by other probes and Elworthy’s value from surface tension
measurements.
Methanol
Ethanol
1-Propanol1-Oktanol
400
420
440
460
480
0 20 40 60 80 100
Relative permittivity (-)
Em
issi
on m
axim
um
(n
m)
"pure alcohols"
"alcohol/water mixture"
"wa
ter"
1-Octanol
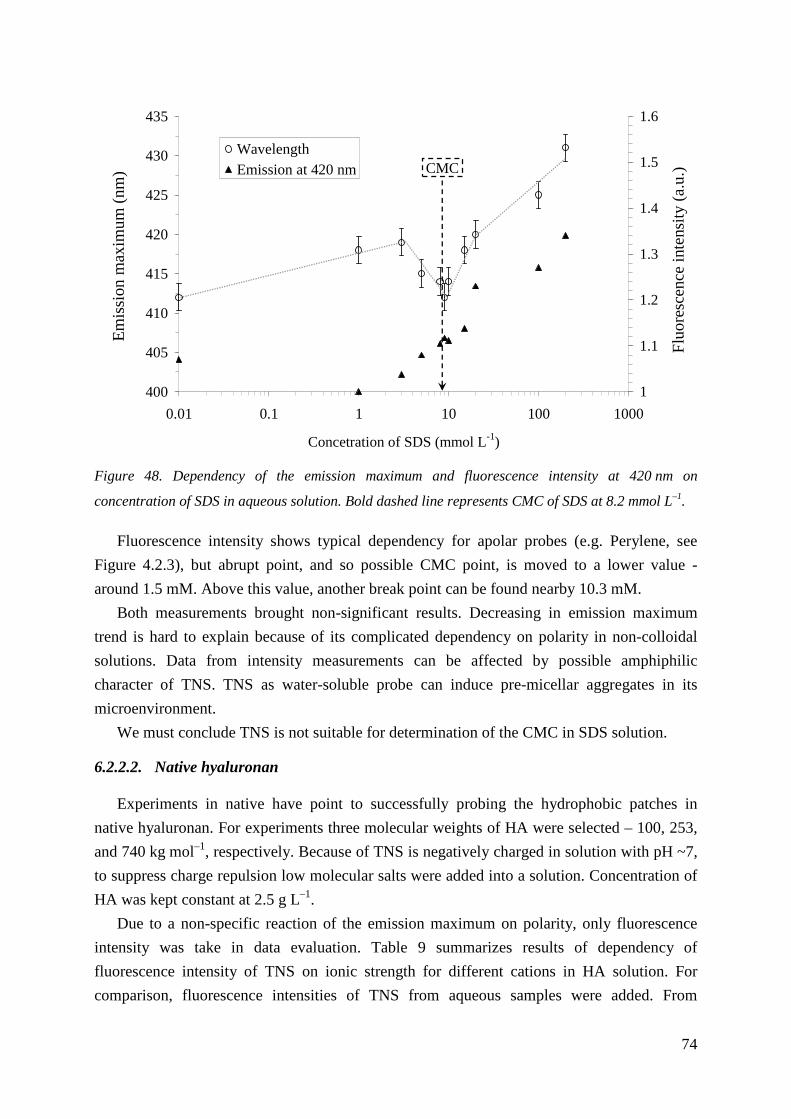
74
Figure 48. Dependency of the emission maximum and fluorescence intensity at 420 nm on
concentration of SDS in aqueous solution. Bold dashed line represents CMC of SDS at 8.2 mmol L–1.
Fluorescence intensity shows typical dependency for apolar probes (e.g. Perylene, see
Figure 4.2.3), but abrupt point, and so possible CMC point, is moved to a lower value -
around 1.5 mM. Above this value, another break point can be found nearby 10.3 mM.
Both measurements brought non-significant results. Decreasing in emission maximum
trend is hard to explain because of its complicated dependency on polarity in non-colloidal
solutions. Data from intensity measurements can be affected by possible amphiphilic
character of TNS. TNS as water-soluble probe can induce pre-micellar aggregates in its
microenvironment.
We must conclude TNS is not suitable for determination of the CMC in SDS solution.
6.2.2.2. Native hyaluronan
Experiments in native have point to successfully probing the hydrophobic patches in
native hyaluronan. For experiments three molecular weights of HA were selected – 100, 253,
and 740 kg mol–1, respectively. Because of TNS is negatively charged in solution with pH ~7,
to suppress charge repulsion low molecular salts were added into a solution. Concentration of
HA was kept constant at 2.5 g L–1.
Due to a non-specific reaction of the emission maximum on polarity, only fluorescence
intensity was take in data evaluation. Table 9 summarizes results of dependency of
fluorescence intensity of TNS on ionic strength for different cations in HA solution. For
comparison, fluorescence intensities of TNS from aqueous samples were added. From
400
405
410
415
420
425
430
435
0.01 0.1 1 10 100 1000
Concetration of SDS (mmol L-1)
Em
issi
on m
axim
um
(nm
)
1
1.1
1.2
1.3
1.4
1.5
1.6
Flu
ore
sce
nce
inte
nsity
(a
.u.)Wavelength
Emission at 420 nm CMC
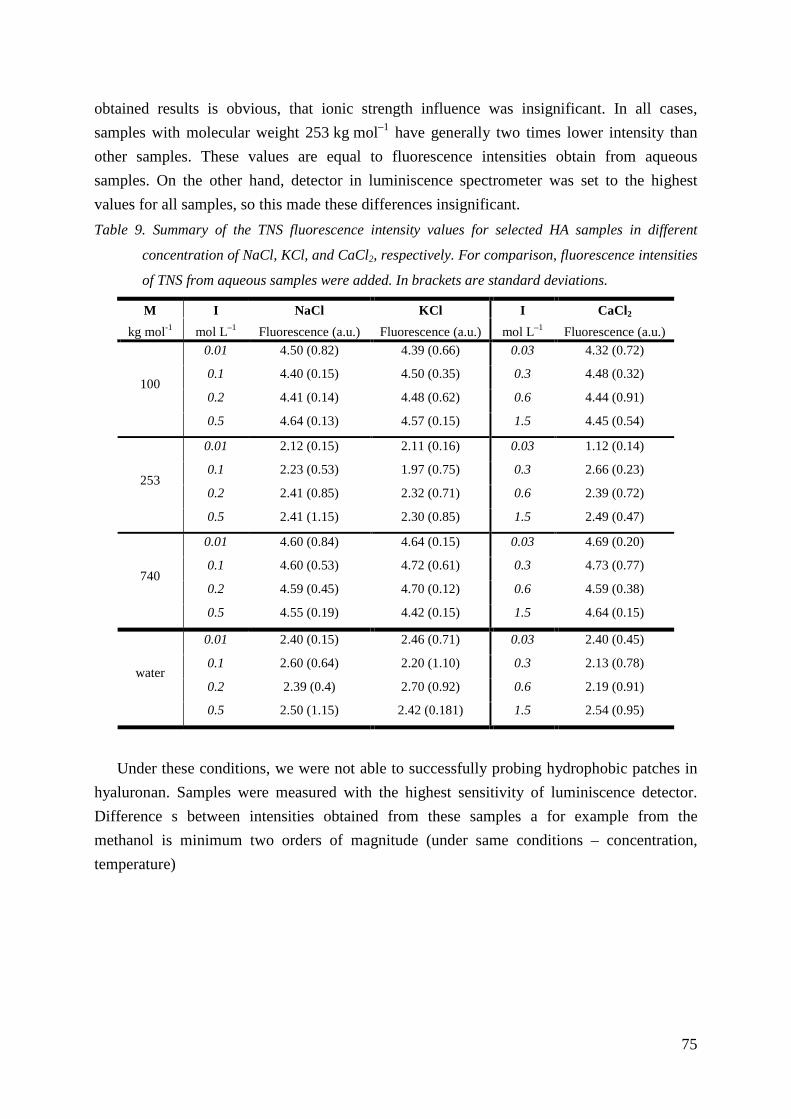
75
obtained results is obvious, that ionic strength influence was insignificant. In all cases,
samples with molecular weight 253 kg mol–1 have generally two times lower intensity than
other samples. These values are equal to fluorescence intensities obtain from aqueous
samples. On the other hand, detector in luminiscence spectrometer was set to the highest
values for all samples, so this made these differences insignificant.
Table 9. Summary of the TNS fluorescence intensity values for selected HA samples in different
concentration of NaCl, KCl, and CaCl2, respectively. For comparison, fluorescence intensities
of TNS from aqueous samples were added. In brackets are standard deviations.
M I NaCl KCl I CaCl 2
kg mol-1 mol L–1 Fluorescence (a.u.) Fluorescence (a.u.) mol L–1 Fluorescence (a.u.) 0.01 4.50 (0.82) 4.39 (0.66) 0.03 4.32 (0.72)
0.1 4.40 (0.15) 4.50 (0.35) 0.3 4.48 (0.32)
0.2 4.41 (0.14) 4.48 (0.62) 0.6 4.44 (0.91) 100
0.5 4.64 (0.13) 4.57 (0.15) 1.5 4.45 (0.54)
0.01 2.12 (0.15) 2.11 (0.16) 0.03 1.12 (0.14)
0.1 2.23 (0.53) 1.97 (0.75) 0.3 2.66 (0.23)
0.2 2.41 (0.85) 2.32 (0.71) 0.6 2.39 (0.72) 253
0.5 2.41 (1.15) 2.30 (0.85) 1.5 2.49 (0.47)
0.01 4.60 (0.84) 4.64 (0.15) 0.03 4.69 (0.20)
0.1 4.60 (0.53) 4.72 (0.61) 0.3 4.73 (0.77)
0.2 4.59 (0.45) 4.70 (0.12) 0.6 4.59 (0.38) 740
0.5 4.55 (0.19) 4.42 (0.15) 1.5 4.64 (0.15)
0.01 2.40 (0.15) 2.46 (0.71) 0.03 2.40 (0.45)
0.1 2.60 (0.64) 2.20 (1.10) 0.3 2.13 (0.78)
0.2 2.39 (0.4) 2.70 (0.92) 0.6 2.19 (0.91) water
0.5 2.50 (1.15) 2.42 (0.181) 1.5 2.54 (0.95)
Under these conditions, we were not able to successfully probing hydrophobic patches in
hyaluronan. Samples were measured with the highest sensitivity of luminiscence detector.
Difference s between intensities obtained from these samples a for example from the
methanol is minimum two orders of magnitude (under same conditions – concentration,
temperature)
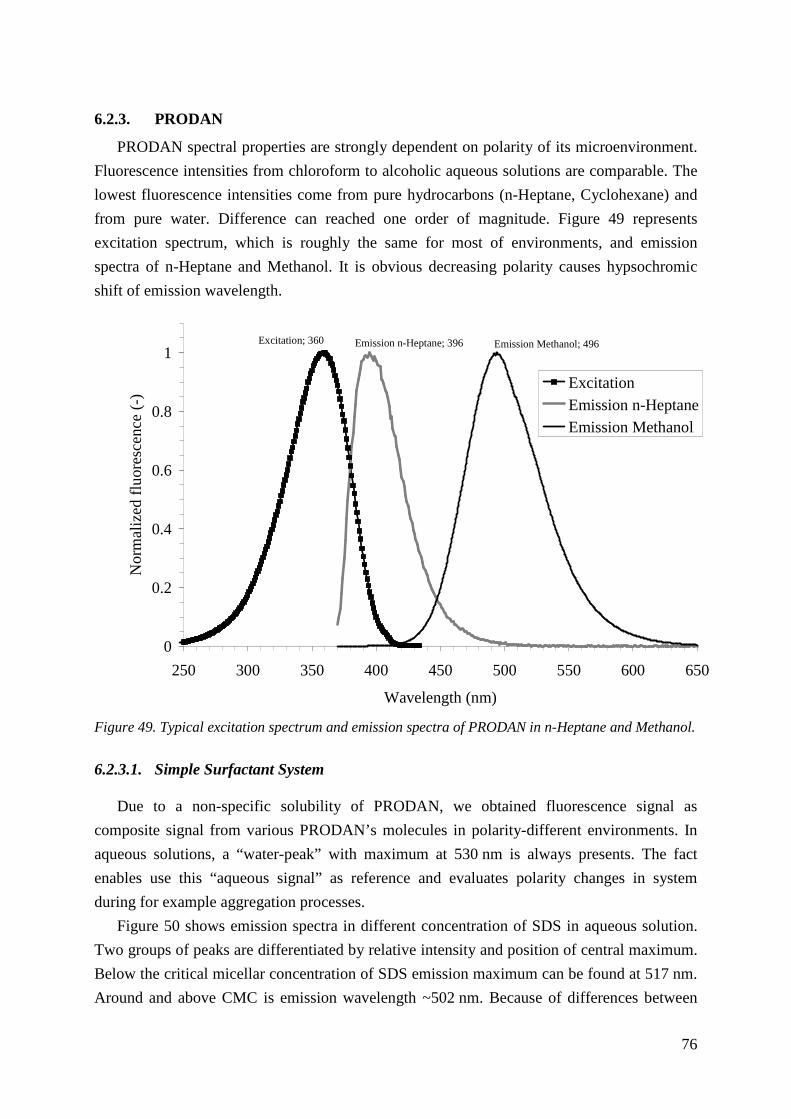
76
6.2.3. PRODAN
PRODAN spectral properties are strongly dependent on polarity of its microenvironment.
Fluorescence intensities from chloroform to alcoholic aqueous solutions are comparable. The
lowest fluorescence intensities come from pure hydrocarbons (n-Heptane, Cyclohexane) and
from pure water. Difference can reached one order of magnitude. Figure 49 represents
excitation spectrum, which is roughly the same for most of environments, and emission
spectra of n-Heptane and Methanol. It is obvious decreasing polarity causes hypsochromic
shift of emission wavelength.
Figure 49. Typical excitation spectrum and emission spectra of PRODAN in n-Heptane and Methanol.
6.2.3.1. Simple Surfactant System
Due to a non-specific solubility of PRODAN, we obtained fluorescence signal as
composite signal from various PRODAN’s molecules in polarity-different environments. In
aqueous solutions, a “water-peak” with maximum at 530 nm is always presents. The fact
enables use this “aqueous signal” as reference and evaluates polarity changes in system
during for example aggregation processes.
Figure 50 shows emission spectra in different concentration of SDS in aqueous solution.
Two groups of peaks are differentiated by relative intensity and position of central maximum.
Below the critical micellar concentration of SDS emission maximum can be found at 517 nm.
Around and above CMC is emission wavelength ~502 nm. Because of differences between
Excitation; 360 Emission n-Heptane; 396 Emission Methanol; 496
0
0.2
0.4
0.6
0.8
1
250 300 350 400 450 500 550 600 650
Wavelength (nm)
Nor
ma
lize
d flu
ore
sce
nce
(-) Excitation
Emission n-HeptaneEmission Methanol
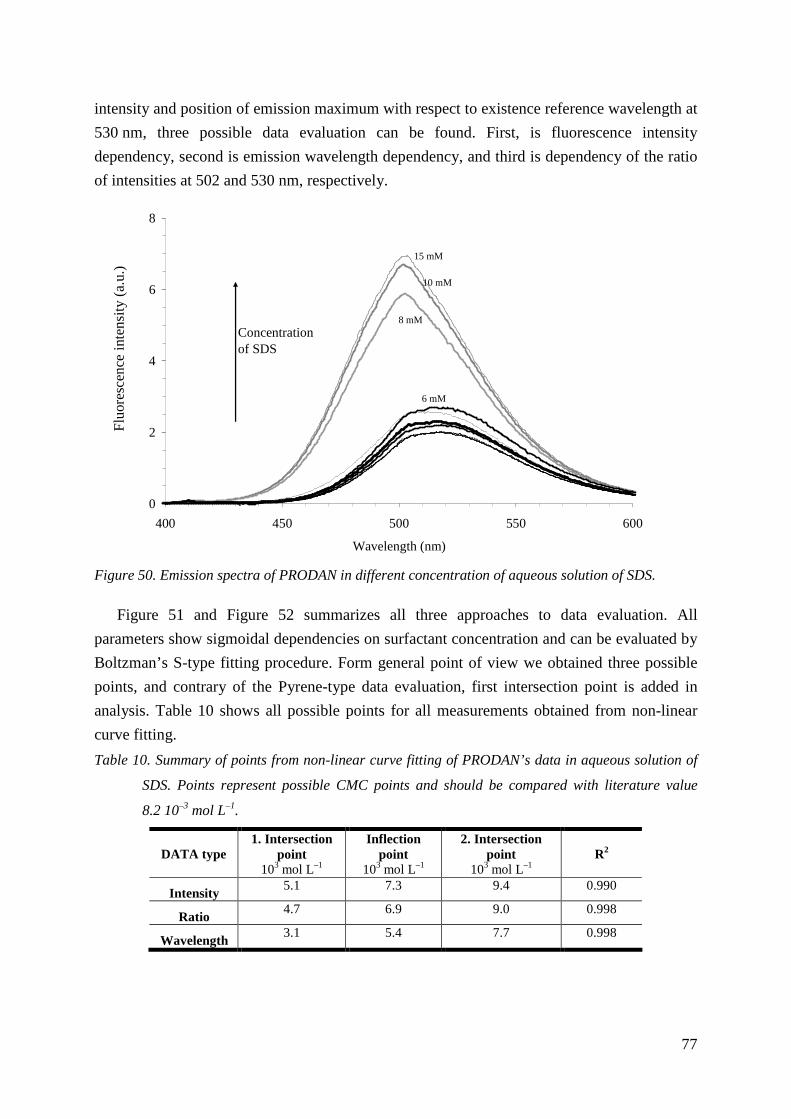
77
intensity and position of emission maximum with respect to existence reference wavelength at
530 nm, three possible data evaluation can be found. First, is fluorescence intensity
dependency, second is emission wavelength dependency, and third is dependency of the ratio
of intensities at 502 and 530 nm, respectively.
Figure 50. Emission spectra of PRODAN in different concentration of aqueous solution of SDS.
Figure 51 and Figure 52 summarizes all three approaches to data evaluation. All
parameters show sigmoidal dependencies on surfactant concentration and can be evaluated by
Boltzman’s S-type fitting procedure. Form general point of view we obtained three possible
points, and contrary of the Pyrene-type data evaluation, first intersection point is added in
analysis. Table 10 shows all possible points for all measurements obtained from non-linear
curve fitting.
Table 10. Summary of points from non-linear curve fitting of PRODAN’s data in aqueous solution of
SDS. Points represent possible CMC points and should be compared with literature value
8.2 10–3 mol L–1.
DATA type 1. Intersection
point 103 mol L–1
Inflection point
103 mol L–1
2. Intersection point
103 mol L–1 R2
Intensity 5.1 7.3 9.4 0.990
Ratio 4.7 6.9 9.0 0.998
Wavelength 3.1 5.4 7.7 0.998
15 mM
10 mM
8 mM
6 mM
0
2
4
6
8
400 450 500 550 600
Wavelength (nm)
Flu
ore
scen
ce in
ten
sity
(a.
u.)
Concentrationof SDS
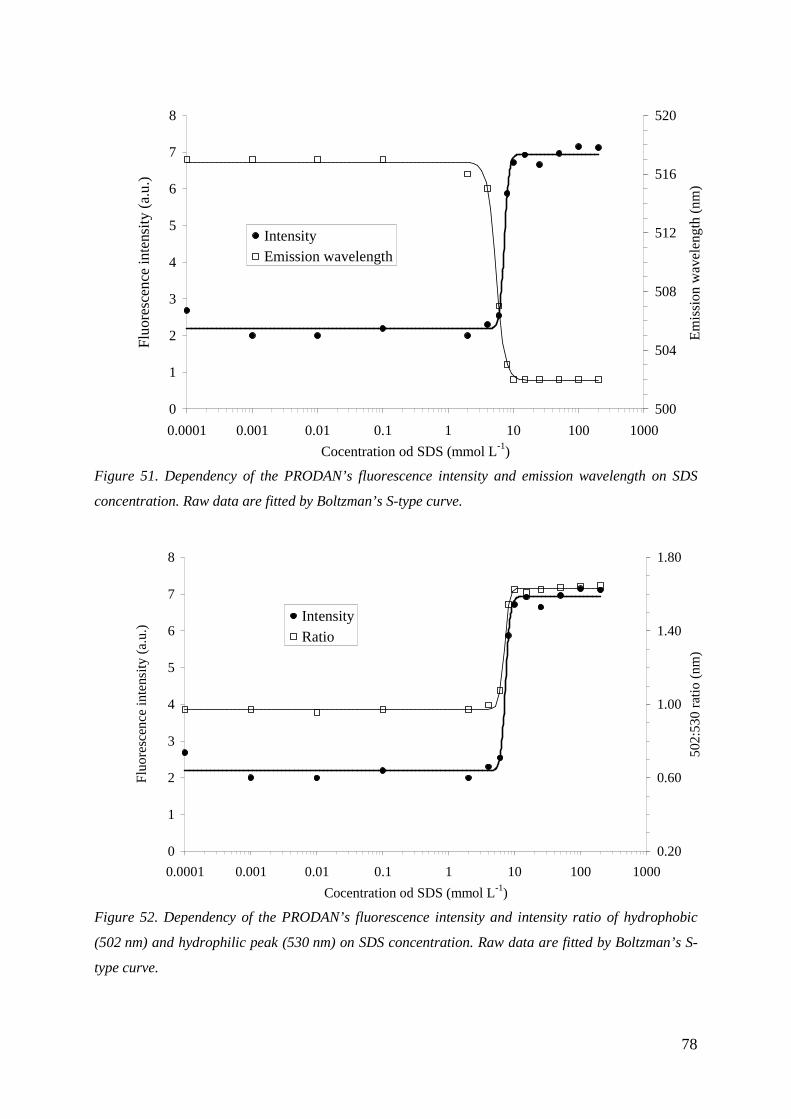
78
Figure 51. Dependency of the PRODAN’s fluorescence intensity and emission wavelength on SDS
concentration. Raw data are fitted by Boltzman’s S-type curve.
Figure 52. Dependency of the PRODAN’s fluorescence intensity and intensity ratio of hydrophobic
(502 nm) and hydrophilic peak (530 nm) on SDS concentration. Raw data are fitted by Boltzman’s S-
type curve.
0
1
2
3
4
5
6
7
8
0.0001 0.001 0.01 0.1 1 10 100 1000
Cocentration od SDS (mmol L-1)
Flu
ores
cen
ce in
tens
ity (
a.u
.)
500
504
508
512
516
520
Em
issi
on w
avel
engt
h (n
m)
IntensityEmission wavelength
0
1
2
3
4
5
6
7
8
0.0001 0.001 0.01 0.1 1 10 100 1000
Cocentration od SDS (mmol L-1)
Flu
ore
scen
ce in
tens
ity (
a.u
.)
0.20
0.60
1.00
1.40
1.80
502
:53
0 r
atio
(n
m)
IntensityRatio
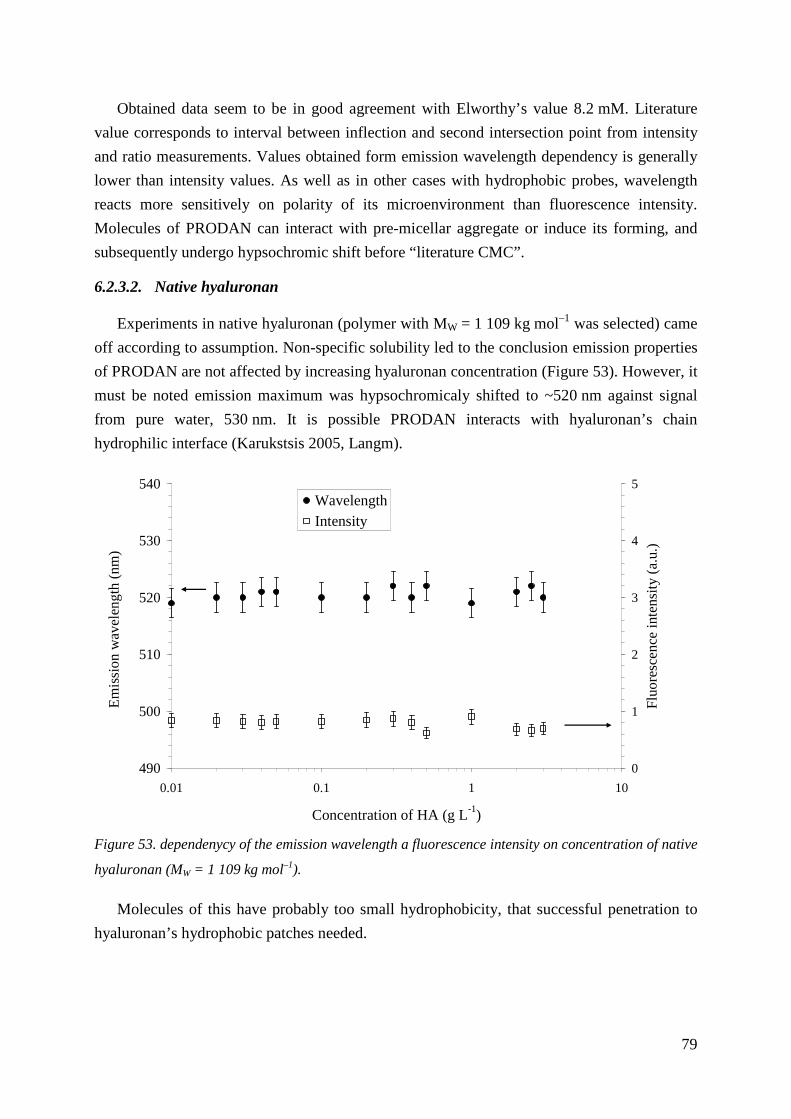
79
Obtained data seem to be in good agreement with Elworthy’s value 8.2 mM. Literature
value corresponds to interval between inflection and second intersection point from intensity
and ratio measurements. Values obtained form emission wavelength dependency is generally
lower than intensity values. As well as in other cases with hydrophobic probes, wavelength
reacts more sensitively on polarity of its microenvironment than fluorescence intensity.
Molecules of PRODAN can interact with pre-micellar aggregate or induce its forming, and
subsequently undergo hypsochromic shift before “literature CMC”.
6.2.3.2. Native hyaluronan
Experiments in native hyaluronan (polymer with MW = 1 109 kg mol–1 was selected) came
off according to assumption. Non-specific solubility led to the conclusion emission properties
of PRODAN are not affected by increasing hyaluronan concentration (Figure 53). However, it
must be noted emission maximum was hypsochromicaly shifted to ~520 nm against signal
from pure water, 530 nm. It is possible PRODAN interacts with hyaluronan’s chain
hydrophilic interface (Karukstsis 2005, Langm).
Figure 53. dependenycy of the emission wavelength a fluorescence intensity on concentration of native
hyaluronan (MW = 1 109 kg mol–1).
Molecules of this have probably too small hydrophobicity, that successful penetration to
hyaluronan’s hydrophobic patches needed.
490
500
510
520
530
540
0.01 0.1 1 10
Concentration of HA (g L-1)
Em
issi
on
wa
vele
ng
th (
nm
)
0
1
2
3
4
5
Flu
ore
sce
nce
inte
nsi
ty (
a.u
.)
WavelengthIntensity
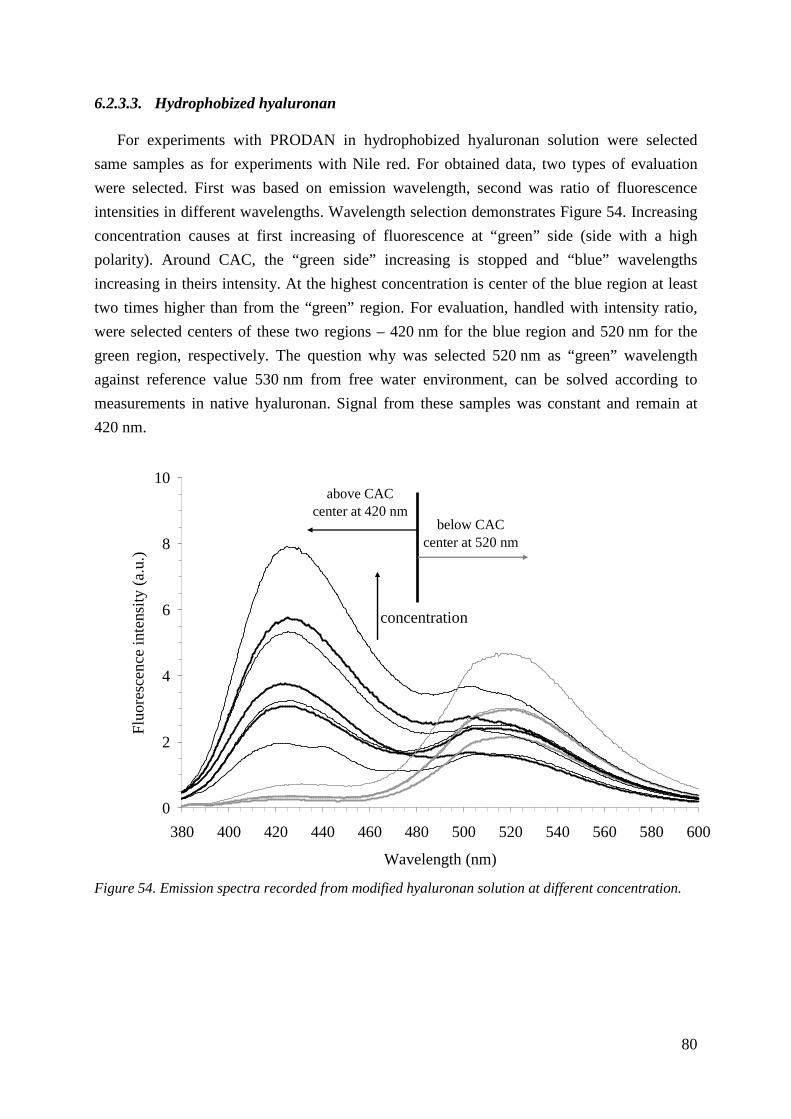
80
6.2.3.3. Hydrophobized hyaluronan
For experiments with PRODAN in hydrophobized hyaluronan solution were selected
same samples as for experiments with Nile red. For obtained data, two types of evaluation
were selected. First was based on emission wavelength, second was ratio of fluorescence
intensities in different wavelengths. Wavelength selection demonstrates Figure 54. Increasing
concentration causes at first increasing of fluorescence at “green” side (side with a high
polarity). Around CAC, the “green side” increasing is stopped and “blue” wavelengths
increasing in theirs intensity. At the highest concentration is center of the blue region at least
two times higher than from the “green” region. For evaluation, handled with intensity ratio,
were selected centers of these two regions – 420 nm for the blue region and 520 nm for the
green region, respectively. The question why was selected 520 nm as “green” wavelength
against reference value 530 nm from free water environment, can be solved according to
measurements in native hyaluronan. Signal from these samples was constant and remain at
420 nm.
Figure 54. Emission spectra recorded from modified hyaluronan solution at different concentration.
0
2
4
6
8
10
380 400 420 440 460 480 500 520 540 560 580 600
Wavelength (nm)
Flu
ore
sce
nce
inte
nsity
(a
.u.)
above CACcenter at 420 nm
concentration
below CACcenter at 520 nm
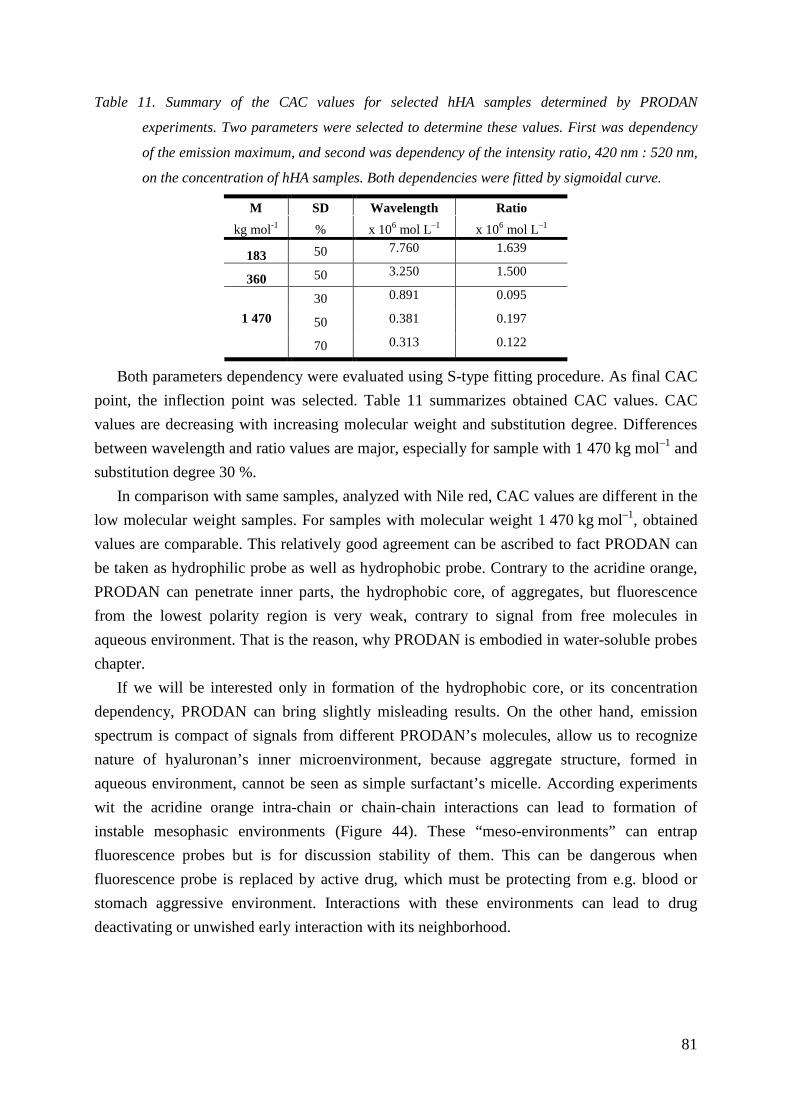
81
Table 11. Summary of the CAC values for selected hHA samples determined by PRODAN
experiments. Two parameters were selected to determine these values. First was dependency
of the emission maximum, and second was dependency of the intensity ratio, 420 nm : 520 nm,
on the concentration of hHA samples. Both dependencies were fitted by sigmoidal curve.
M SD Wavelength Ratio
kg mol-1 % x 106 mol L–1 x 10⁶ mol L–1
183 50 7.760 1.639
360 50 3.250 1.500
30 0.891 0.095
50 0.381 0.197 1 470
70 0.313 0.122
Both parameters dependency were evaluated using S-type fitting procedure. As final CAC
point, the inflection point was selected. Table 11 summarizes obtained CAC values. CAC
values are decreasing with increasing molecular weight and substitution degree. Differences
between wavelength and ratio values are major, especially for sample with 1 470 kg mol–1 and
substitution degree 30 %.
In comparison with same samples, analyzed with Nile red, CAC values are different in the
low molecular weight samples. For samples with molecular weight 1 470 kg mol–1, obtained
values are comparable. This relatively good agreement can be ascribed to fact PRODAN can
be taken as hydrophilic probe as well as hydrophobic probe. Contrary to the acridine orange,
PRODAN can penetrate inner parts, the hydrophobic core, of aggregates, but fluorescence
from the lowest polarity region is very weak, contrary to signal from free molecules in
aqueous environment. That is the reason, why PRODAN is embodied in water-soluble probes
chapter.
If we will be interested only in formation of the hydrophobic core, or its concentration
dependency, PRODAN can bring slightly misleading results. On the other hand, emission
spectrum is compact of signals from different PRODAN’s molecules, allow us to recognize
nature of hyaluronan’s inner microenvironment, because aggregate structure, formed in
aqueous environment, cannot be seen as simple surfactant’s micelle. According experiments
wit the acridine orange intra-chain or chain-chain interactions can lead to formation of
instable mesophasic environments (Figure 44). These “meso-environments” can entrap
fluorescence probes but is for discussion stability of them. This can be dangerous when
fluorescence probe is replaced by active drug, which must be protecting from e.g. blood or
stomach aggressive environment. Interactions with these environments can lead to drug
deactivating or unwished early interaction with its neighborhood.
82
6.3. Fluorescence probes in investigation of core quality
For potential drug delivery systems is basic to know at which concentration or under
which conditions a supramolecular domain is formed. But it is always necessary to know, if
formed domain is able to solubilize a different kind of hydrophobic/amphiphilic species. For
this prediction is useful to know “how much hydrophobic” formed domain is. Because
different probes can react differently in same environment, it is need to estimate polarity
scales for each probe. These polarity scales allow us to compare information form inner core
with pure solvents. For many reasons, as were mentioned above, two probes were selected –
Pyrene and Nile red.
Next information, which can bring using of fluorescence probes, is local viscosity or
microviscosity. Microviscosity contains information if domain is compact or if domain is soft.
It can be measured by anisotropy probes, intra-/intermolecular excimer formation, or via
molecular rotors. Information about viscosity will depends on geometry of a system too. For
small cavities is useful using molecular rotors, because of only small segment of molecule is
moving. Large (long) anisotropy probes like DPH may have long axis equal to cavity
diameter and cannot move freely in inner environment. Then obtained anisotropy is too high
and depolarization is equal to ration of the whole aggregate.
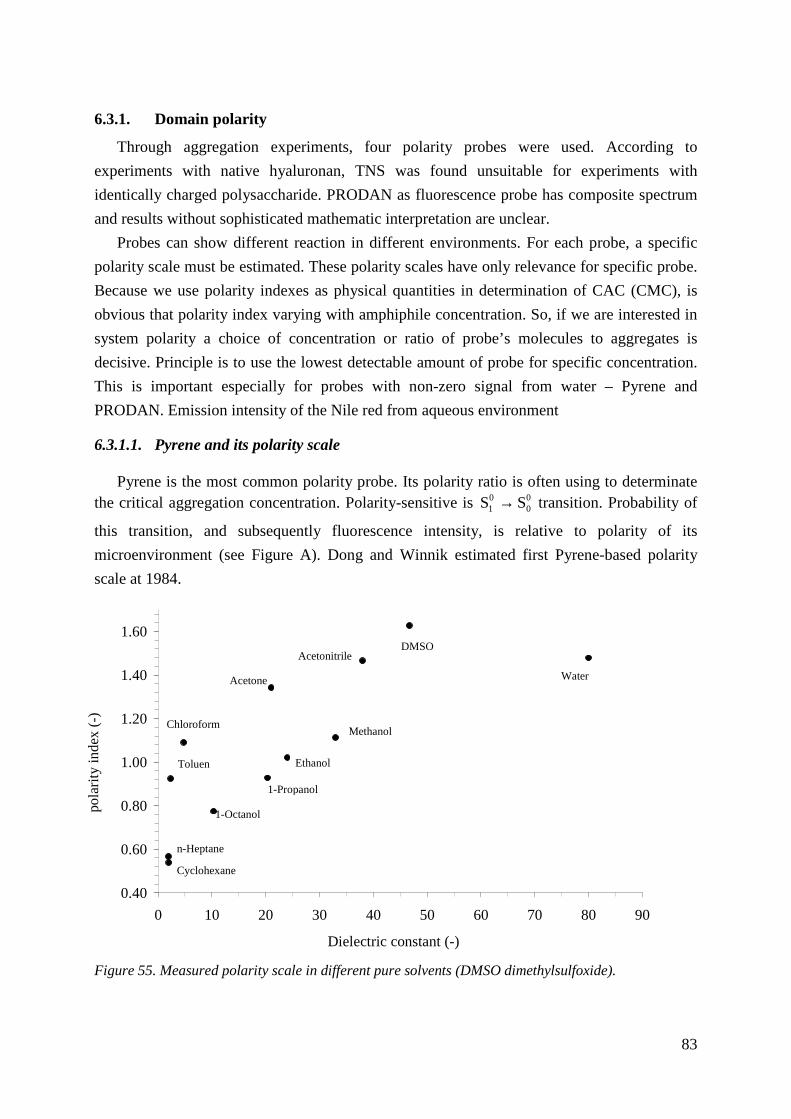
83
6.3.1. Domain polarity
Through aggregation experiments, four polarity probes were used. According to
experiments with native hyaluronan, TNS was found unsuitable for experiments with
identically charged polysaccharide. PRODAN as fluorescence probe has composite spectrum
and results without sophisticated mathematic interpretation are unclear.
Probes can show different reaction in different environments. For each probe, a specific
polarity scale must be estimated. These polarity scales have only relevance for specific probe.
Because we use polarity indexes as physical quantities in determination of CAC (CMC), is
obvious that polarity index varying with amphiphile concentration. So, if we are interested in
system polarity a choice of concentration or ratio of probe’s molecules to aggregates is
decisive. Principle is to use the lowest detectable amount of probe for specific concentration.
This is important especially for probes with non-zero signal from water – Pyrene and
PRODAN. Emission intensity of the Nile red from aqueous environment
6.3.1.1. Pyrene and its polarity scale
Pyrene is the most common polarity probe. Its polarity ratio is often using to determinate the critical aggregation concentration. Polarity-sensitive is 0
001 SS → transition. Probability of
this transition, and subsequently fluorescence intensity, is relative to polarity of its
microenvironment (see Figure A). Dong and Winnik estimated first Pyrene-based polarity
scale at 1984.
Figure 55. Measured polarity scale in different pure solvents (DMSO dimethylsulfoxide).
0.40
0.60
0.80
1.00
1.20
1.40
1.60
0 10 20 30 40 50 60 70 80 90
Dielectric constant (-)
pola
rity
ind
ex (
-)
Cyclohexane
n-Heptane
1-Octanol
1-Propanol
Ethanol
Methanol
Water
DMSOAcetonitrile
Acetone
Chloroform
Toluen
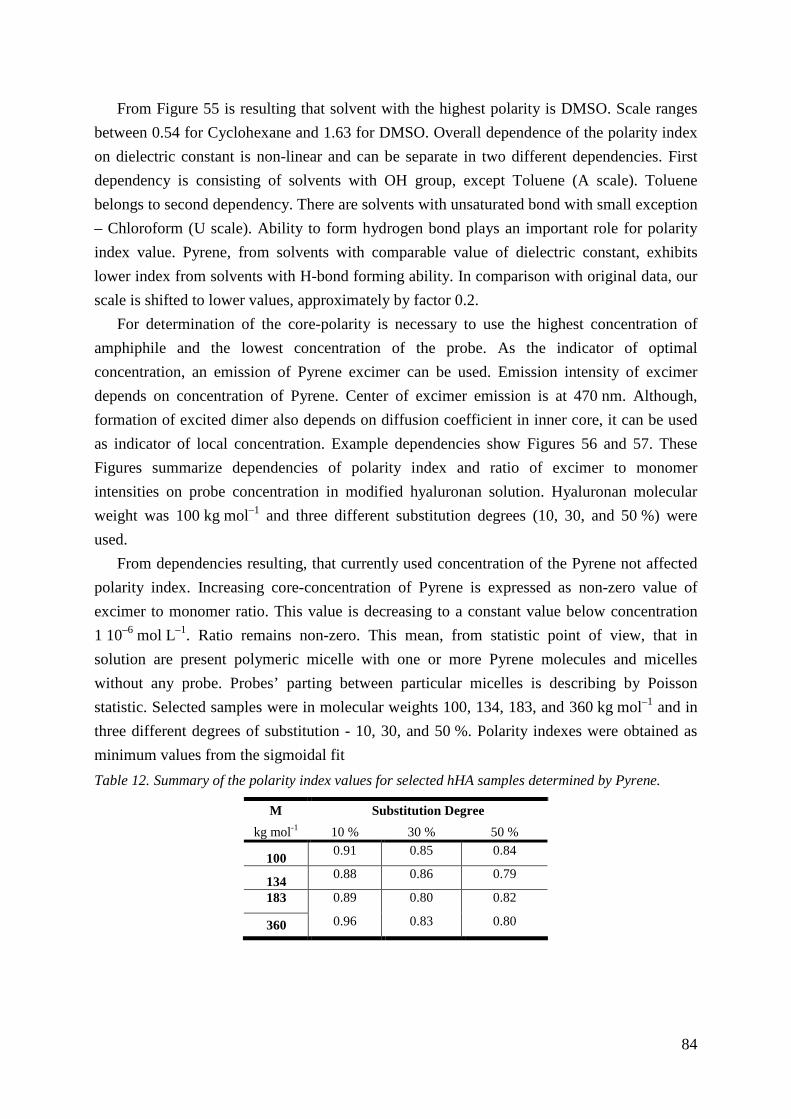
84
From Figure 55 is resulting that solvent with the highest polarity is DMSO. Scale ranges
between 0.54 for Cyclohexane and 1.63 for DMSO. Overall dependence of the polarity index
on dielectric constant is non-linear and can be separate in two different dependencies. First
dependency is consisting of solvents with OH group, except Toluene (A scale). Toluene
belongs to second dependency. There are solvents with unsaturated bond with small exception
– Chloroform (U scale). Ability to form hydrogen bond plays an important role for polarity
index value. Pyrene, from solvents with comparable value of dielectric constant, exhibits
lower index from solvents with H-bond forming ability. In comparison with original data, our
scale is shifted to lower values, approximately by factor 0.2.
For determination of the core-polarity is necessary to use the highest concentration of
amphiphile and the lowest concentration of the probe. As the indicator of optimal
concentration, an emission of Pyrene excimer can be used. Emission intensity of excimer
depends on concentration of Pyrene. Center of excimer emission is at 470 nm. Although,
formation of excited dimer also depends on diffusion coefficient in inner core, it can be used
as indicator of local concentration. Example dependencies show Figures 56 and 57. These
Figures summarize dependencies of polarity index and ratio of excimer to monomer
intensities on probe concentration in modified hyaluronan solution. Hyaluronan molecular
weight was 100 kg mol–1 and three different substitution degrees (10, 30, and 50 %) were
used.
From dependencies resulting, that currently used concentration of the Pyrene not affected
polarity index. Increasing core-concentration of Pyrene is expressed as non-zero value of
excimer to monomer ratio. This value is decreasing to a constant value below concentration
1 10–6 mol L–1. Ratio remains non-zero. This mean, from statistic point of view, that in
solution are present polymeric micelle with one or more Pyrene molecules and micelles
without any probe. Probes’ parting between particular micelles is describing by Poisson
statistic. Selected samples were in molecular weights 100, 134, 183, and 360 kg mol–1 and in
three different degrees of substitution - 10, 30, and 50 %. Polarity indexes were obtained as
minimum values from the sigmoidal fit
Table 12. Summary of the polarity index values for selected hHA samples determined by Pyrene.
M Substitution Degree
kg mol-1 10 % 30 % 50 %
100 0.91 0.85 0.84
134 0.88 0.86 0.79
183 0.89 0.80 0.82
360 0.96 0.83 0.80
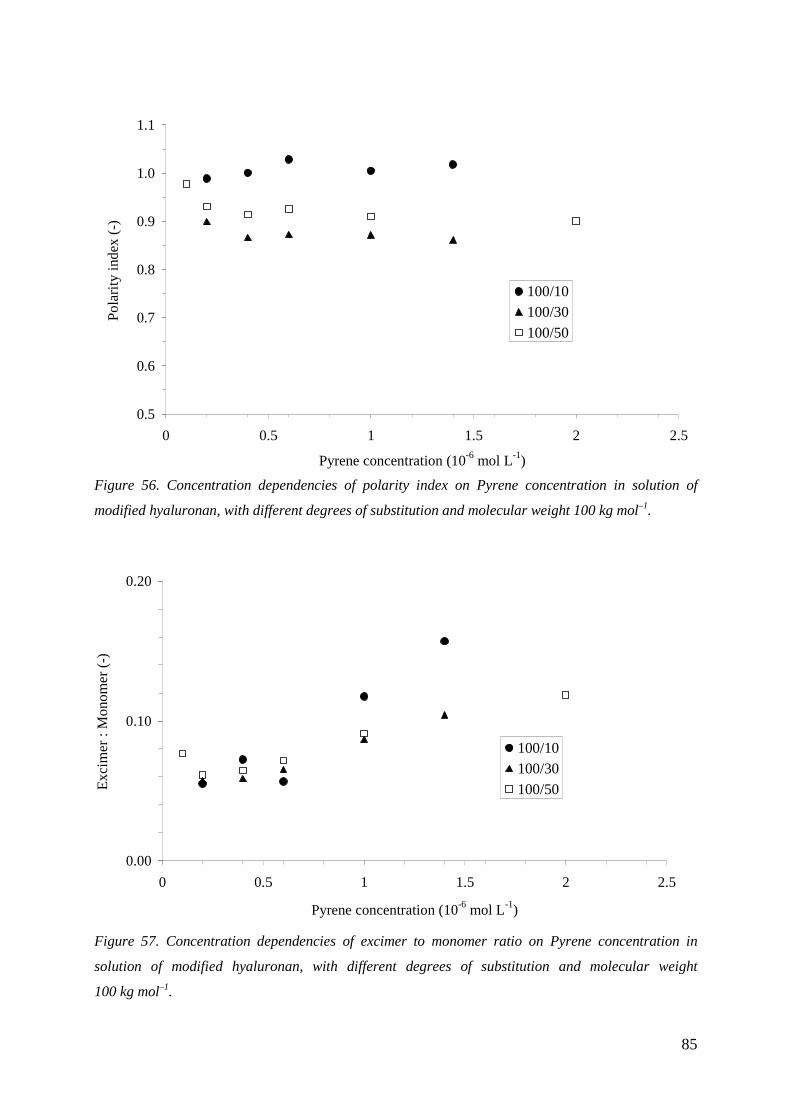
85
Figure 56. Concentration dependencies of polarity index on Pyrene concentration in solution of
modified hyaluronan, with different degrees of substitution and molecular weight 100 kg mol–1.
Figure 57. Concentration dependencies of excimer to monomer ratio on Pyrene concentration in
solution of modified hyaluronan, with different degrees of substitution and molecular weight
100 kg mol–1.
0.5
0.6
0.7
0.8
0.9
1.0
1.1
0 0.5 1 1.5 2 2.5
Pyrene concentration (10-6 mol L-1)
Po
lari
ty in
dex
(-)
100/10100/30100/50
0.00
0.10
0.20
0 0.5 1 1.5 2 2.5
Pyrene concentration (10-6 mol L-1)
Exc
ime
r :
Mo
nom
er
(-)
100/10100/30100/50
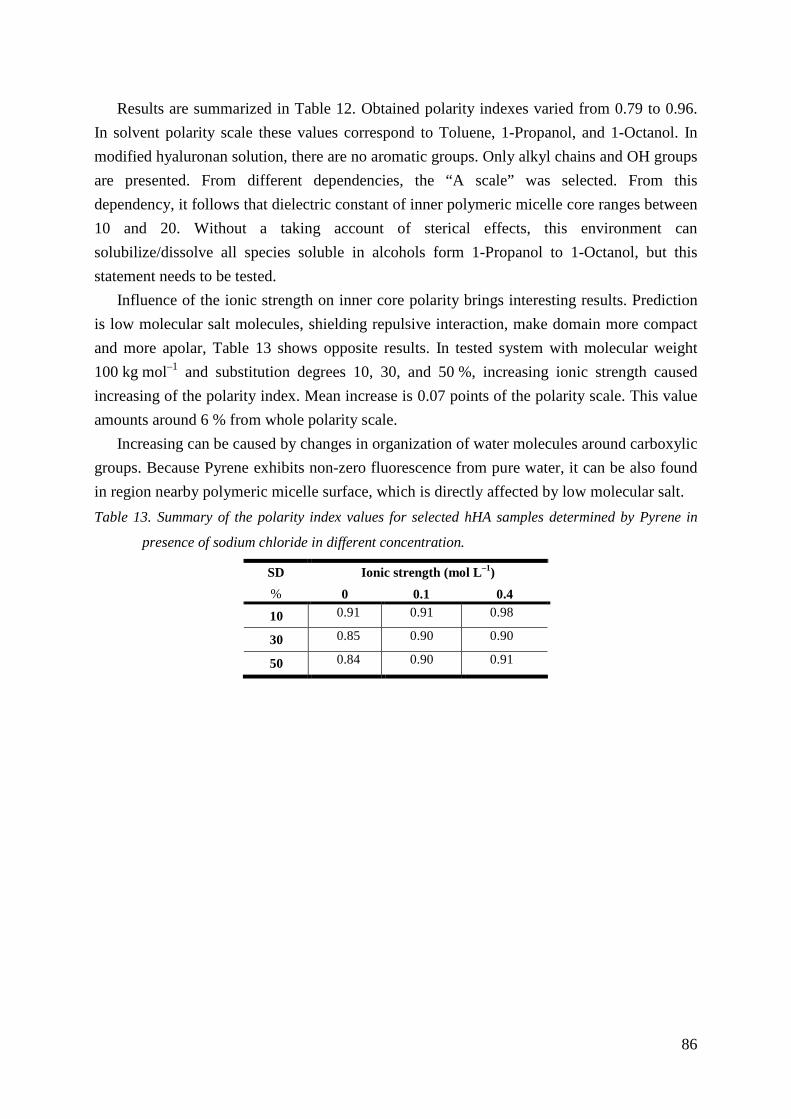
86
Results are summarized in Table 12. Obtained polarity indexes varied from 0.79 to 0.96.
In solvent polarity scale these values correspond to Toluene, 1-Propanol, and 1-Octanol. In
modified hyaluronan solution, there are no aromatic groups. Only alkyl chains and OH groups
are presented. From different dependencies, the “A scale” was selected. From this
dependency, it follows that dielectric constant of inner polymeric micelle core ranges between
10 and 20. Without a taking account of sterical effects, this environment can
solubilize/dissolve all species soluble in alcohols form 1-Propanol to 1-Octanol, but this
statement needs to be tested.
Influence of the ionic strength on inner core polarity brings interesting results. Prediction
is low molecular salt molecules, shielding repulsive interaction, make domain more compact
and more apolar, Table 13 shows opposite results. In tested system with molecular weight
100 kg mol–1 and substitution degrees 10, 30, and 50 %, increasing ionic strength caused
increasing of the polarity index. Mean increase is 0.07 points of the polarity scale. This value
amounts around 6 % from whole polarity scale.
Increasing can be caused by changes in organization of water molecules around carboxylic
groups. Because Pyrene exhibits non-zero fluorescence from pure water, it can be also found
in region nearby polymeric micelle surface, which is directly affected by low molecular salt.
Table 13. Summary of the polarity index values for selected hHA samples determined by Pyrene in
presence of sodium chloride in different concentration.
SD Ionic strength (mol L–1)
% 0 0.1 0.4
10 0.91 0.91 0.98
30 0.85 0.90 0.90
50 0.84 0.90 0.91
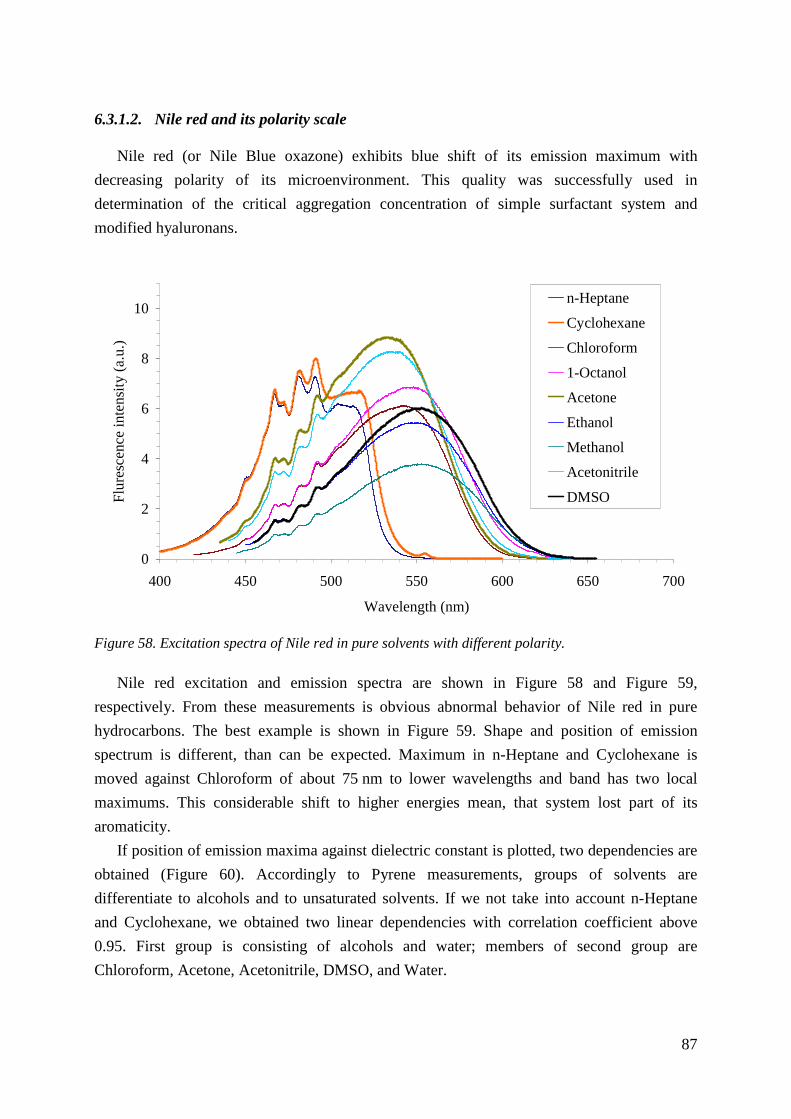
87
6.3.1.2. Nile red and its polarity scale
Nile red (or Nile Blue oxazone) exhibits blue shift of its emission maximum with
decreasing polarity of its microenvironment. This quality was successfully used in
determination of the critical aggregation concentration of simple surfactant system and
modified hyaluronans.
Figure 58. Excitation spectra of Nile red in pure solvents with different polarity.
Nile red excitation and emission spectra are shown in Figure 58 and Figure 59,
respectively. From these measurements is obvious abnormal behavior of Nile red in pure
hydrocarbons. The best example is shown in Figure 59. Shape and position of emission
spectrum is different, than can be expected. Maximum in n-Heptane and Cyclohexane is
moved against Chloroform of about 75 nm to lower wavelengths and band has two local
maximums. This considerable shift to higher energies mean, that system lost part of its
aromaticity.
If position of emission maxima against dielectric constant is plotted, two dependencies are
obtained (Figure 60). Accordingly to Pyrene measurements, groups of solvents are
differentiate to alcohols and to unsaturated solvents. If we not take into account n-Heptane
and Cyclohexane, we obtained two linear dependencies with correlation coefficient above
0.95. First group is consisting of alcohols and water; members of second group are
Chloroform, Acetone, Acetonitrile, DMSO, and Water.
0
2
4
6
8
10
400 450 500 550 600 650 700
Wavelength (nm)
Flu
resc
en
ce in
ten
sity
(a
.u.)
n-Heptane
Cyclohexane
Chloroform
1-Octanol
Acetone
Ethanol
Methanol
Acetonitrile
DMSO
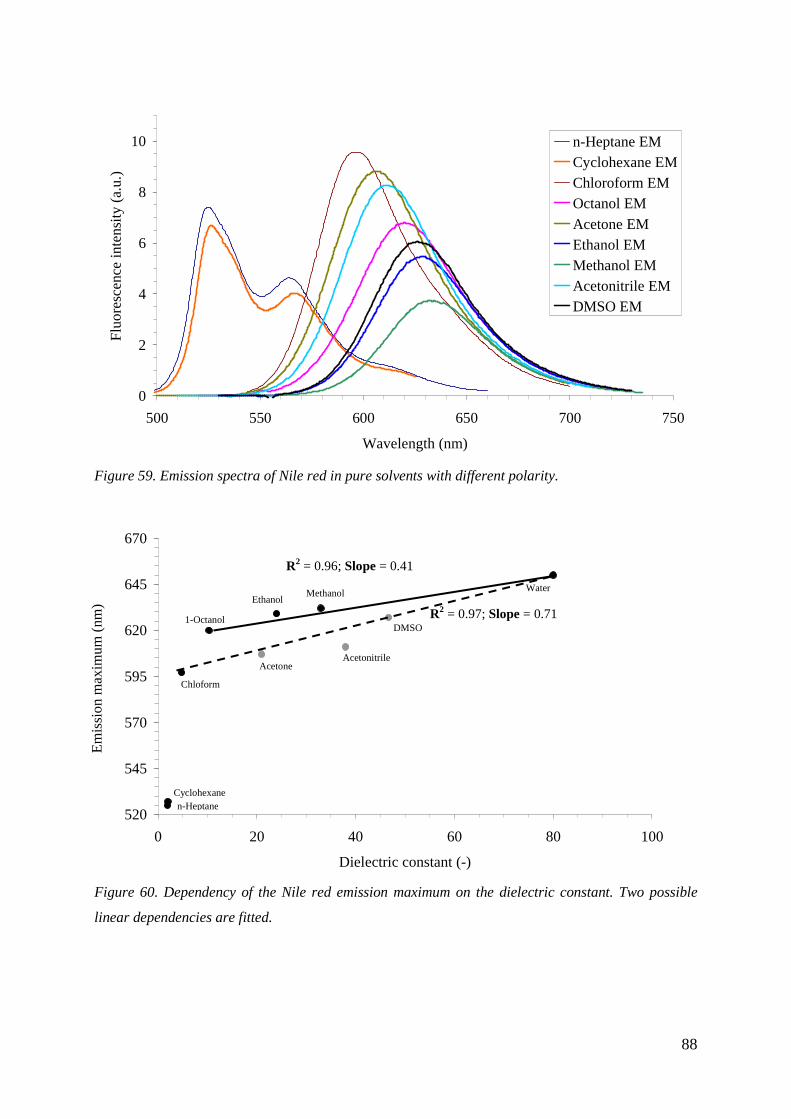
88
Figure 59. Emission spectra of Nile red in pure solvents with different polarity.
Figure 60. Dependency of the Nile red emission maximum on the dielectric constant. Two possible
linear dependencies are fitted.
0
2
4
6
8
10
500 550 600 650 700 750
Wavelength (nm)
Flu
ore
sce
nce
inte
nsi
ty (
a.u
.)
n-Heptane EMCyclohexane EMChloroform EMOctanol EMAcetone EMEthanol EMMethanol EMAcetonitrile EMDMSO EM
520
545
570
595
620
645
670
0 20 40 60 80 100
Dielectric constant (-)
Em
issi
on
ma
xim
um
(nm
)
n-HeptaneCyclohexane
Chloform
1-Octanol
Acetone
EthanolMethanol
Acetonitrile
DMSO
Water
R2 = 0.96; Slope = 0.41
R2 = 0.97; Slope = 0.71
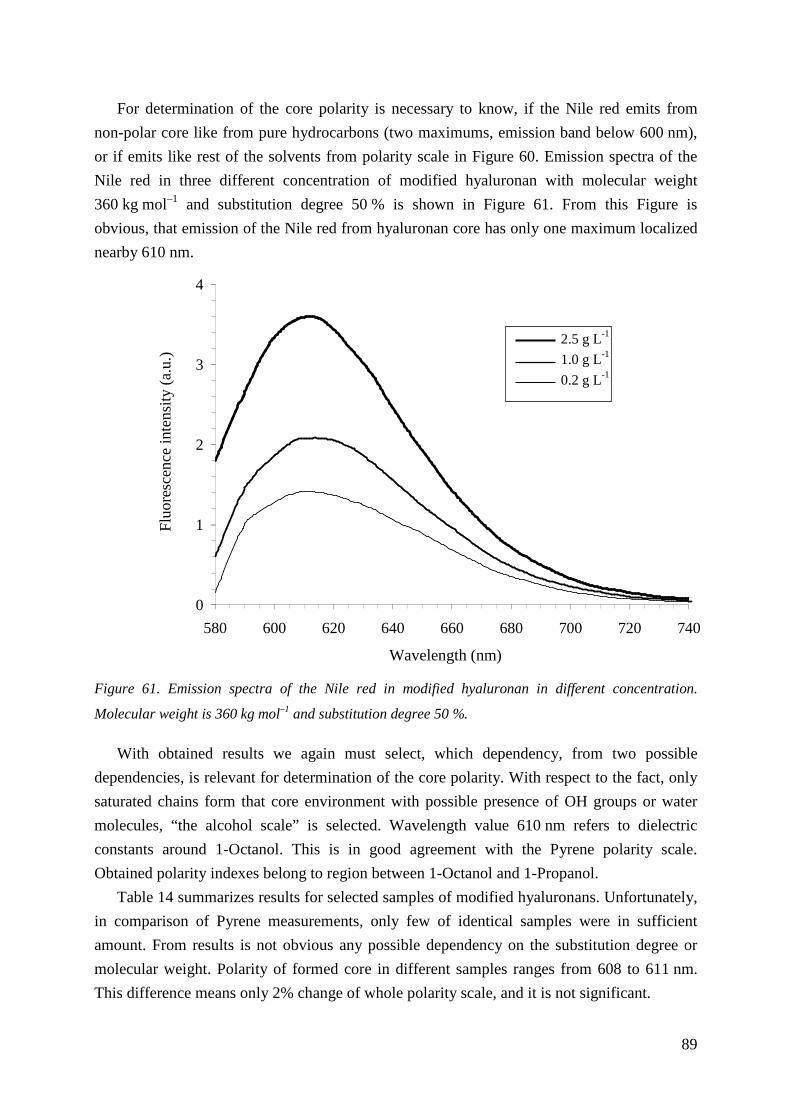
89
For determination of the core polarity is necessary to know, if the Nile red emits from
non-polar core like from pure hydrocarbons (two maximums, emission band below 600 nm),
or if emits like rest of the solvents from polarity scale in Figure 60. Emission spectra of the
Nile red in three different concentration of modified hyaluronan with molecular weight
360 kg mol–1 and substitution degree 50 % is shown in Figure 61. From this Figure is
obvious, that emission of the Nile red from hyaluronan core has only one maximum localized
nearby 610 nm.
Figure 61. Emission spectra of the Nile red in modified hyaluronan in different concentration.
Molecular weight is 360 kg mol–1 and substitution degree 50 %.
With obtained results we again must select, which dependency, from two possible
dependencies, is relevant for determination of the core polarity. With respect to the fact, only
saturated chains form that core environment with possible presence of OH groups or water
molecules, “the alcohol scale” is selected. Wavelength value 610 nm refers to dielectric
constants around 1-Octanol. This is in good agreement with the Pyrene polarity scale.
Obtained polarity indexes belong to region between 1-Octanol and 1-Propanol.
Table 14 summarizes results for selected samples of modified hyaluronans. Unfortunately,
in comparison of Pyrene measurements, only few of identical samples were in sufficient
amount. From results is not obvious any possible dependency on the substitution degree or
molecular weight. Polarity of formed core in different samples ranges from 608 to 611 nm.
This difference means only 2% change of whole polarity scale, and it is not significant.
0
1
2
3
4
580 600 620 640 660 680 700 720 740
Wavelength (nm)
Flu
ore
scen
ce in
ten
sity
(a.
u.) 2.5 g L-1
1.0 g L-1
0.2 g L-1
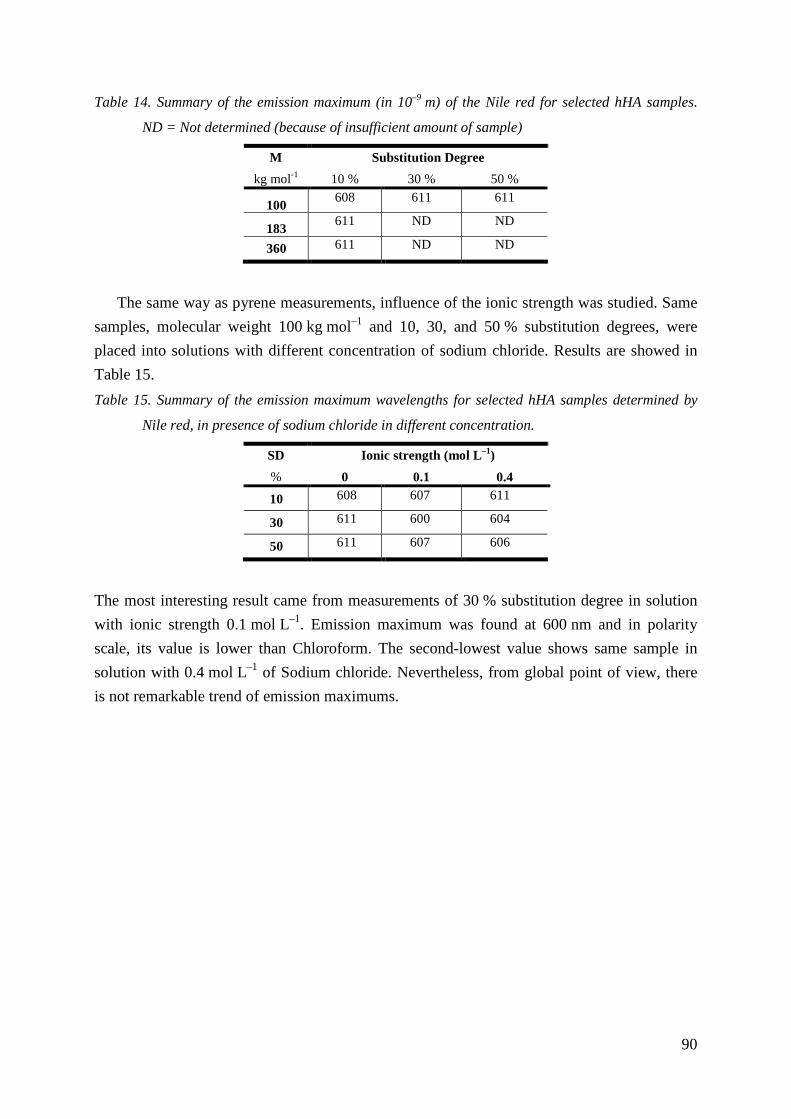
90
Table 14. Summary of the emission maximum (in 10–9 m) of the Nile red for selected hHA samples.
ND = Not determined (because of insufficient amount of sample)
M Substitution Degree
kg mol-1 10 % 30 % 50 %
100 608 611 611
183 611 ND ND
360 611 ND ND
The same way as pyrene measurements, influence of the ionic strength was studied. Same
samples, molecular weight 100 kg mol–1 and 10, 30, and 50 % substitution degrees, were
placed into solutions with different concentration of sodium chloride. Results are showed in
Table 15.
Table 15. Summary of the emission maximum wavelengths for selected hHA samples determined by
Nile red, in presence of sodium chloride in different concentration.
SD Ionic strength (mol L–1)
% 0 0.1 0.4
10 608 607 611
30 611 600 604
50 611 607 606
The most interesting result came from measurements of 30 % substitution degree in solution
with ionic strength 0.1 mol L–1. Emission maximum was found at 600 nm and in polarity
scale, its value is lower than Chloroform. The second-lowest value shows same sample in
solution with 0.4 mol L–1 of Sodium chloride. Nevertheless, from global point of view, there
is not remarkable trend of emission maximums.
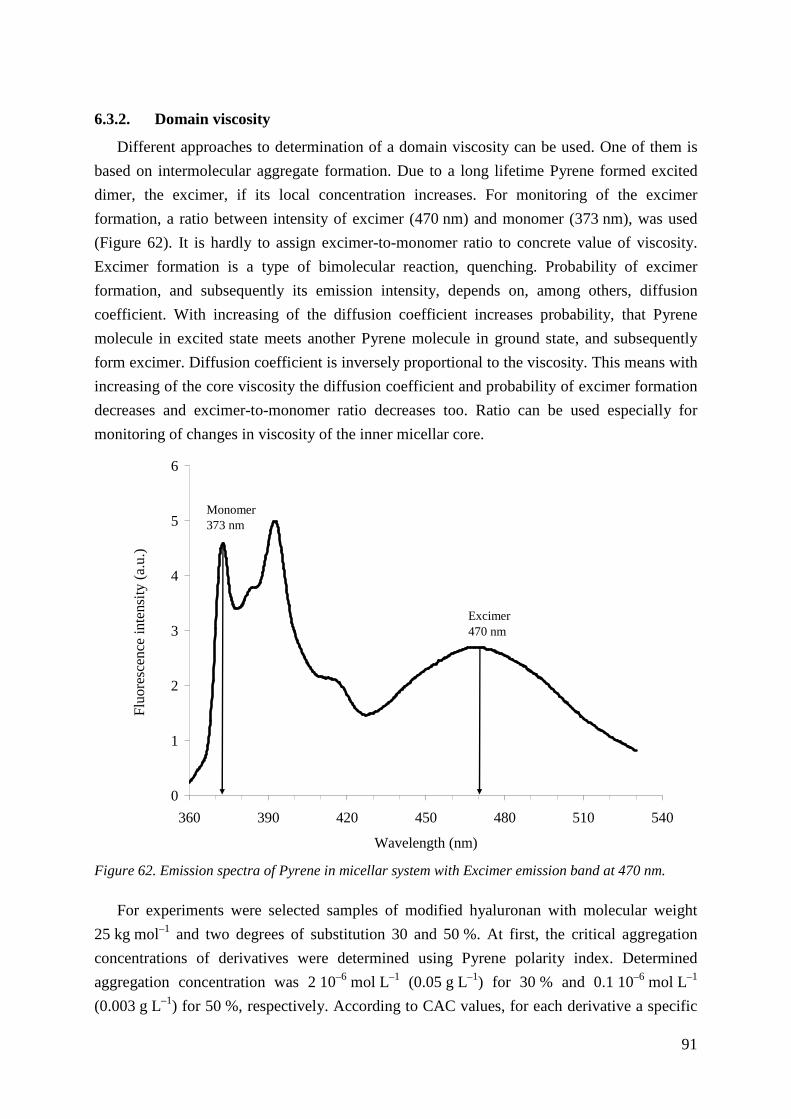
91
6.3.2. Domain viscosity
Different approaches to determination of a domain viscosity can be used. One of them is
based on intermolecular aggregate formation. Due to a long lifetime Pyrene formed excited
dimer, the excimer, if its local concentration increases. For monitoring of the excimer
formation, a ratio between intensity of excimer (470 nm) and monomer (373 nm), was used
(Figure 62). It is hardly to assign excimer-to-monomer ratio to concrete value of viscosity.
Excimer formation is a type of bimolecular reaction, quenching. Probability of excimer
formation, and subsequently its emission intensity, depends on, among others, diffusion
coefficient. With increasing of the diffusion coefficient increases probability, that Pyrene
molecule in excited state meets another Pyrene molecule in ground state, and subsequently
form excimer. Diffusion coefficient is inversely proportional to the viscosity. This means with
increasing of the core viscosity the diffusion coefficient and probability of excimer formation
decreases and excimer-to-monomer ratio decreases too. Ratio can be used especially for
monitoring of changes in viscosity of the inner micellar core.
Figure 62. Emission spectra of Pyrene in micellar system with Excimer emission band at 470 nm.
For experiments were selected samples of modified hyaluronan with molecular weight
25 kg mol–1 and two degrees of substitution 30 and 50 %. At first, the critical aggregation
concentrations of derivatives were determined using Pyrene polarity index. Determined
aggregation concentration was 2 10–6 mol L–1 (0.05 g L–1) for 30 % and 0.1 10–6 mol L–1
(0.003 g L–1) for 50 %, respectively. According to CAC values, for each derivative a specific
0
1
2
3
4
5
6
360 390 420 450 480 510 540
Wavelength (nm)
Flu
ores
cenc
e in
tens
ity (
a.u
.)
Monomer373 nm
Excimer470 nm
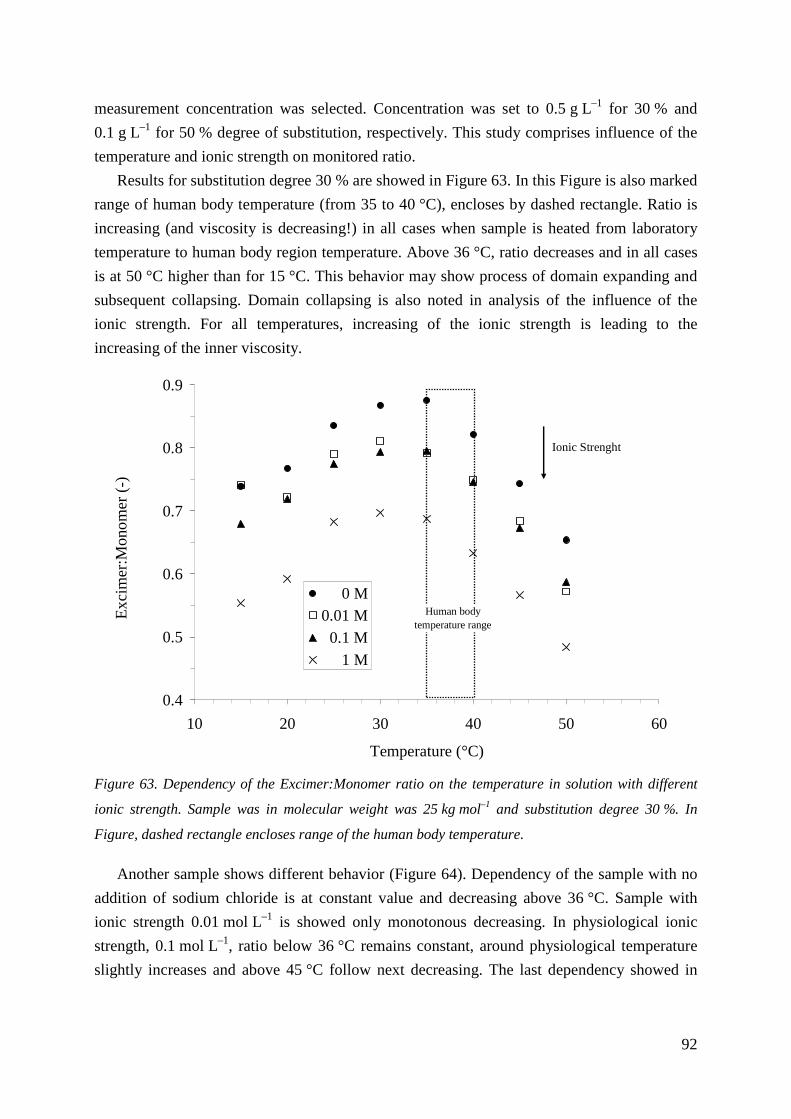
92
measurement concentration was selected. Concentration was set to 0.5 g L–1 for 30 % and
0.1 g L–1 for 50 % degree of substitution, respectively. This study comprises influence of the
temperature and ionic strength on monitored ratio.
Results for substitution degree 30 % are showed in Figure 63. In this Figure is also marked
range of human body temperature (from 35 to 40 °C), encloses by dashed rectangle. Ratio is
increasing (and viscosity is decreasing!) in all cases when sample is heated from laboratory
temperature to human body region temperature. Above 36 °C, ratio decreases and in all cases
is at 50 °C higher than for 15 °C. This behavior may show process of domain expanding and
subsequent collapsing. Domain collapsing is also noted in analysis of the influence of the
ionic strength. For all temperatures, increasing of the ionic strength is leading to the
increasing of the inner viscosity.
Figure 63. Dependency of the Excimer:Monomer ratio on the temperature in solution with different
ionic strength. Sample was in molecular weight was 25 kg mol–1 and substitution degree 30 %. In
Figure, dashed rectangle encloses range of the human body temperature.
Another sample shows different behavior (Figure 64). Dependency of the sample with no
addition of sodium chloride is at constant value and decreasing above 36 °C. Sample with
ionic strength 0.01 mol L–1 is showed only monotonous decreasing. In physiological ionic
strength, 0.1 mol L–1, ratio below 36 °C remains constant, around physiological temperature
slightly increases and above 45 °C follow next decreasing. The last dependency showed in
0.4
0.5
0.6
0.7
0.8
0.9
10 20 30 40 50 60
Temperature (°C)
Exc
ime
r:M
ono
me
r (-
)
0 M0.01 M 0.1 M 1 M
Ionic Strenght
Human body temperature range
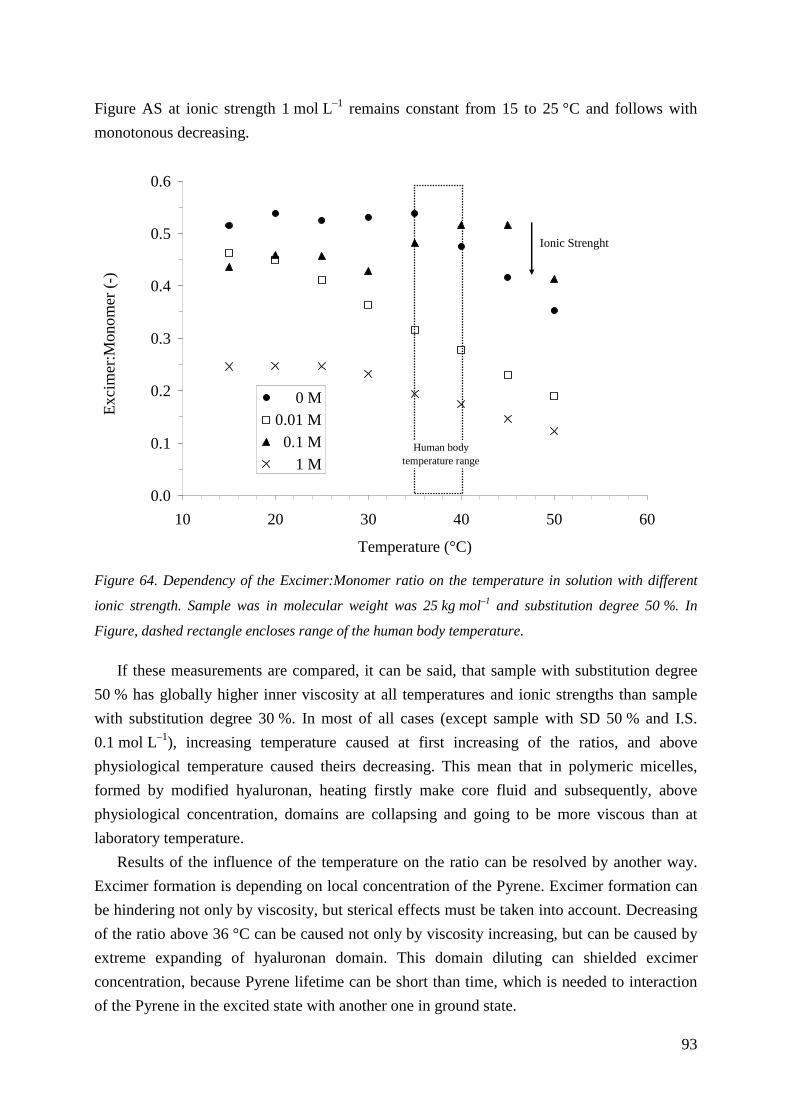
93
Figure AS at ionic strength 1 mol L–1 remains constant from 15 to 25 °C and follows with
monotonous decreasing.
Figure 64. Dependency of the Excimer:Monomer ratio on the temperature in solution with different
ionic strength. Sample was in molecular weight was 25 kg mol–1 and substitution degree 50 %. In
Figure, dashed rectangle encloses range of the human body temperature.
If these measurements are compared, it can be said, that sample with substitution degree
50 % has globally higher inner viscosity at all temperatures and ionic strengths than sample
with substitution degree 30 %. In most of all cases (except sample with SD 50 % and I.S.
0.1 mol L–1), increasing temperature caused at first increasing of the ratios, and above
physiological temperature caused theirs decreasing. This mean that in polymeric micelles,
formed by modified hyaluronan, heating firstly make core fluid and subsequently, above
physiological concentration, domains are collapsing and going to be more viscous than at
laboratory temperature.
Results of the influence of the temperature on the ratio can be resolved by another way.
Excimer formation is depending on local concentration of the Pyrene. Excimer formation can
be hindering not only by viscosity, but sterical effects must be taken into account. Decreasing
of the ratio above 36 °C can be caused not only by viscosity increasing, but can be caused by
extreme expanding of hyaluronan domain. This domain diluting can shielded excimer
concentration, because Pyrene lifetime can be short than time, which is needed to interaction
of the Pyrene in the excited state with another one in ground state.
0.0
0.1
0.2
0.3
0.4
0.5
0.6
10 20 30 40 50 60
Temperature (°C)
Exc
ime
r:M
ono
me
r (-
)
0 M0.01 M 0.1 M 1 M
Ionic Strenght
Human body temperature range
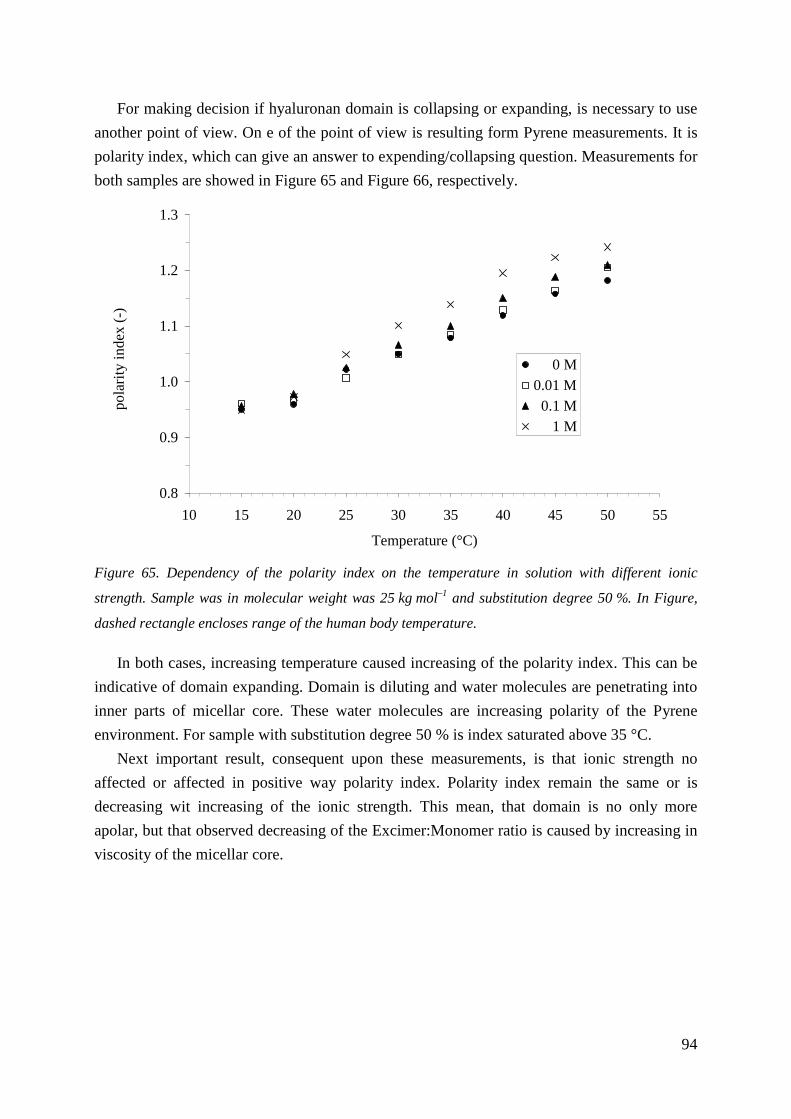
94
For making decision if hyaluronan domain is collapsing or expanding, is necessary to use
another point of view. On e of the point of view is resulting form Pyrene measurements. It is
polarity index, which can give an answer to expending/collapsing question. Measurements for
both samples are showed in Figure 65 and Figure 66, respectively.
Figure 65. Dependency of the polarity index on the temperature in solution with different ionic
strength. Sample was in molecular weight was 25 kg mol–1 and substitution degree 50 %. In Figure,
dashed rectangle encloses range of the human body temperature.
In both cases, increasing temperature caused increasing of the polarity index. This can be
indicative of domain expanding. Domain is diluting and water molecules are penetrating into
inner parts of micellar core. These water molecules are increasing polarity of the Pyrene
environment. For sample with substitution degree 50 % is index saturated above 35 °C.
Next important result, consequent upon these measurements, is that ionic strength no
affected or affected in positive way polarity index. Polarity index remain the same or is
decreasing wit increasing of the ionic strength. This mean, that domain is no only more
apolar, but that observed decreasing of the Excimer:Monomer ratio is caused by increasing in
viscosity of the micellar core.
0.8
0.9
1.0
1.1
1.2
1.3
10 15 20 25 30 35 40 45 50 55
Temperature (°C)
po
lari
ty in
de
x (-
)
0 M0.01 M 0.1 M 1 M
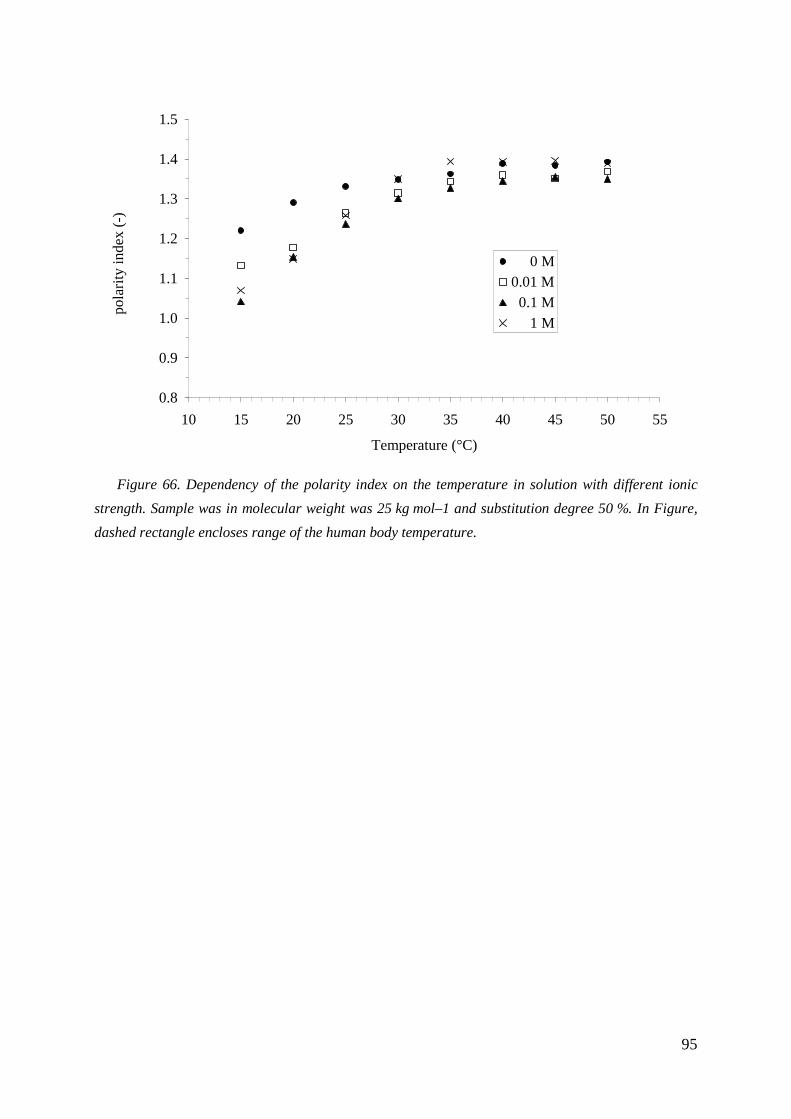
95
Figure 66. Dependency of the polarity index on the temperature in solution with different ionic
strength. Sample was in molecular weight was 25 kg mol–1 and substitution degree 50 %. In Figure,
dashed rectangle encloses range of the human body temperature.
0.8
0.9
1.0
1.1
1.2
1.3
1.4
1.5
10 15 20 25 30 35 40 45 50 55
Temperature (°C)
po
lari
ty in
de
x (-
)
0 M0.01 M 0.1 M 1 M
96
7. CONCLUSION
Aim of this doctoral thesis was to investigate, using of fluorescence probes, colloidal
properties in aqueous solutions of native and modified sodium hyaluronates. From a large
family of fluorescence probes, six of them were selected. These probes have different and
interesting spectral and physiochemical properties which are sensitive to specific parts of
colloidal behaviour.
As a first step, probe spectral properties in various pure solvents were checked or
determined. Obtained values were sometime slightly different in comparison with literature
values, but from the global point of view, no basic differences were found.
Next step focused on the behavior of probes in simple and well-known colloidal media.
From the surfactants family, the sodium dodecylsulfate was selected. This surfactant has well-
known cirtical micellar concetration and aggregation number. All of the probes determined its
CMC. It is hardly to compare CMCs obtained by fluorescence probes with literature value,
which resulted from surface tension measurement. In fluorescence probe case, additional
specie is added into surfactant-solvent system, and this addition can affect the system via
inducing pre-micellar aggregation. This influence is resulting into wide range of determined
CMC: from 2.1 to 10.3×10⁻³ mol L–1. TNS was found to be the least suitable probe for the
SDS-water system.
All probes were used in investigation of aggregation properties of the native hyaluronan.
Unfortunately, probing of the hydrophobic patches was not successful. Only two probes
changed spectral properties in presence of native hyaluronan. Acridine orange interacted by
expected way, and the end-points of titration were determined. Also was determined influence
of the ionic strength on the end-point of titration. Interaction of the native hyaluronan with the
PRODAN was confirmed by hypsochromic shift of its emission band.
All probes, except TNS, were used in study of aggregation properties of C10 derivatives of
hyaluronan. Due to vast amount of measurements and small amounts of experimental
samples, not all experiments could be performed with all probes and with all derivatives. But
from the global point of view it can be said that hyaluronan aggregation concentration is
decreasing with increasing molecular weight and degree of substitution. It depends on probe
selection if differences will be significant or not. Choice of the probe shall take into account
additional information, which probes can afford. If we are interesting in polarity of its
microenvironment, we select the Pyrene or the Nile red, as probes. In case of monitoring
viscosity of inner core, Perylene or Pyrene shall be used.
Properties of domain formed upon hyaluronan aggregation are the last topic of this thesis.
Domains were investigated from polarity and viscosity point of view. As polarity probes,
Pyrene and Nile red were selected. Solvent-based polarity scales were determined with
different results. Both probes showed different results in interaction with alcohols and with
unsaturated solvents. This make harder to assign specific value of dielectric constant or
97
another polarity factor to measured polarity indexes or wavelengths. Likewise in polarity
determination, viscosity measurements, based on intermolecular fluorescence quenching, are
not suitable for determination of the process by itself. These measurements must be compared
with e.g. polarity measurements. This is clearly shown in influence of the temperature on the
Excimer:Monomer ratio. Most of all dependencies of the ratio on the temperature have
inverse quadratic character with maximum nearby human body temperature. Nevertheless,
from Pyrene polarity index point of view, only monotonous increasing was observed. This
increasing mean domain is expanding and excited Pyrene molecules cannot interact with the
other molecule during its lifetime. On the other hand, polarity measurements confirm
influence of the salt as agent for increasing core viscosity. Through the 2 orders of magnitude
of the ionic strength values, index remain same or it was moved to the lower values, which
mean, that domain was more compact.
Results obtained from measurements with native hyaluronan show no interaction between
hydrophobic fluorescence probes and hyaluronan. Alkylation enhanced interaction between
hydrophobic probe and polymer and aggregation behavior of the modified hyaluronan is
monitored. Obtained results are comparable with simple surfactants. It can be said
aggregation in modified hyaluronan solution lead to the formation of hydrophobic cavity.
This cavity can be influenced (and qualities can be modified) by temperature and ionic
strength. Presence of the hydrophobic cavity makes this system suitable for drug delivery
application. Next advantage is hyaluronan is biocompatible and biodegradable polymer and it
can specifically interact with cell receptors (CD44, RHAMM). All of these qualities make
hydrophobized hyaluronan as one of the most promising system in drug carriers.
98
8. REFERENCES 1) Pelletier, S., Hubert, P., Lapicque, F., Payan, E., Dellacherie, E. Amphiphilic derivatives
of sodium alginate and hyaluronate: synthesis and physico-chemical properties of aqueous dilute solutions. Carbohydrate Polymers, 2000, vol. 43, 343-349.
2) Luo, Y. Bernshaw, N.J. Lu, Z.-R. Kopecek, J. Prestwich, G.D. HPMA Copolymer- Hyaluronan-Doxorubicin Bioconjugates: Targeted Delivery of an Anti-cancer Agent, 2002, Pharm. Res., vol. 19, pp. 396-402.
3) Palumbo, F.S., Pitarresi, G., Mandracchia, D., Tripodo, G., Giammona G. New graft copolymers of hyaluronic acid and polylactic acid: Synthesis and characterization. Carbohydrate Polymers, 2006, vol. 66, pp. 379-385.
4) Choi, K.Y., Lee, S., Park, K., Kim, K., Park, J.H., Kwon, I.C., Jeong, S.Y. Preparation and characterization of hyaluronic acid-based hydrogel nanoparticles, J Phys Chem Solids, 2008, vol. 69, pp. 1591-1595.
5) Creuzet, C., Kadi, S., Rinaudo, M., Auzély-Velty, R. New associative systems based on alkylated hyaluronic acid. Synthesis and aqueous solution properties. Polymer, 2006, vol. 47, pp. 2706-2713.
6) Zhang, M., James, S.P. Silylation of hyaluronan to improve hydrophobicity and reactivity for improved processing and derivatization. Polymer, 2005, vol. 46, pp. 3639-3648.
7) Kawaguchi, Y., Matsukawa, K., Ishigami, Y. The relation between the adsorption behavior at the interface and the conformational changes in hyaluronates partially modified with various acyl chains. Carbohydrate Polymers, 1995, vol. 26, pp. 149-154.
8) Kawaguchi, Y., Matsukawa, K., Ishigami, Y. The effects of polysaccharide chain-length in coating liposomes with partial palmitoyl hyaluronates. Carbohydrate Polymers, 1992, vol. 18, pp. 139-142.
9) Kawaguchi, Y., Matsukawa, K., Ishigami, Y. Conformational changes of hyaluronates with partial palmitoylation and the adsorption structures on the surface of oil droplets. Carbohydrate Polymers, 1993, vol. 20, pp. 183-187.
10) Zana, R., Aoudia, M. Aggregation Behavior of Sugar Surfactants in Aqueous Solutions: Effects of Temperature and the Addition of Nonionic Polymers. J Colloid Interface Sci, 1998, vol. 206, pp. 158-167.
11) Nichifor M., Lopes S., Bastos M, Lopes A. Self-Aggregation of Amphiphilic Cationic Polyelectrolytes Based on Polysaccharides. J Phys Chemi B, 2004, vol. 108, pp. 16463-16472.
12) Duval-Terrié, C., Huguet, J., Muller, G. Self-assembly and hydrophobic clusters of amphiphilic polysaccharides. Colloid Surface A, 2003, vol. 220, pp. 105-115.
13) Simon, S., Dugast, J.Y., Le Cerf, D., Picton, L., Muller, G. Amphiphilic polysaccharides. Evidence for a competition between intra and intermolecular associations in dilute system. Polymer, 2003, vol. 44, pp. 7917-7924.
99
14) Fischer, A., Houzelle, M.C., Hubert, P., Axelos, M.A.V.. Geoffroy-Chapotot, C., Carre, M., Viriot, M.L., Dellacherrie, E. Detection of Intramolecular Associations in Hydrophobically Modified Pectin Derivatives Using Fluorescent Probes. Langmuir, 1998, vol. 14, pp. 4482-4488.
15) Liu, W.G., Zhang, X., Sun, S.G., Sun, G.J., Yao, D.K. N-Alkylated chitosan as a potential nonviral vector for gene transfection. Bioconjugate Chemistry, 2003, vol. 14, pp. 782–789.
16) Liu, W.G., Zhang, X., Sun, S.G., Yao, D.K. Self-aggregation behavior of alkylated chitosan and its effect on the release of a hydrophobic drug. J Biomat Sci-Polym E, 2003, vol. 14, pp. 851–859.
17) Chen, X.G., Lee, C:M., Park, H.J. O/w emulsification for the self-aggregation and nanoparticle formation of linolenic acid modified chitosan in the aqueous system. J Agr Food Chem, 2003, vol. 51, pp. 3135–3139.
18) Liu, C.G., Desai, K.G.H., Chen, X.G., Park, H.J. Lionlenic acid-modified chitosan for formation of self-assembled nanoparticles. J Agr Food Chem, 2005, vol. 53, pp. 437–441.
19) Sludden, J., Uchegbu, I.F., Schaetzlein, A.G. The encapsulation of bleomycin within chitosan based polymeric vesicles does not alter its distribution. The Journal of Pharmacy and Parmacology, 2002, vol. 52, pp. 377–382.
20) Tien, C.L., Lacroix, M. N-Acylated chitosan: hydrophobic matrices for controlled drug release. J Control Release, 2003, vol. 93, pp. 1–13.
21) Wang, W., McConaghy, A.M., Tetley, L., Uchegbu, I.F. Controls on polymer molecular weight may be used to control the size of palmitoyl glycol chitosan polymeric vesicles. Langmuir, 2001, vol. 17, pp. 631–636.
22) Lee, K.Y., Jo, W.H., Kwon, I.C., Kim, Y.H., Jeong, S.Y. Structural determination and interior polarity of self-aggregates prepared from deoxycholic acid-modified chitosan in water. Macromolecules, 1998, vol. 31, pp. 378–383.
23) Lee, K.Y., Jo, W.H. Physicochemical characteristics of self-aggregates of hydrophobically modified chitosan. Langmuir, 1998, vol. 14, pp. 2329–2332
24) Lee, K.Y., Kim, J.H., Kwon, I.C. Jeong, S.Y. Self-aggregates of deoxycholic acid-modified chitosan as a novel carrier of adriamycin. Colloid Polymer Science, 2000, vol. 278, pp. 1216–1219.
25) Lee, K.Y., Kwon, I.C., Jo, W.H., Jeong, S.Y. Complex formation between plasmid DNA and self-aggregates of deoxycholic acid-modified chitosan. Polymer, 2005, vol. 46, pp. 8107–8112.
26) Kim, Y.H., Gihm, S.H., Park, C.R. Structural characteristics of size-controlled self-aggregates of deoxycholic acid-modified chitosan and their application as a DNA delivery Carrier. Bioconjugate Chemistry, 2001, vol. 12, pp. 932–938.
27) Ortona, O., D’Errico, G., Mangiapia, G., Ciccarelli, D. The aggregative behavior of hydrophobically modified chitosans with high substitution degree in aqueous solution. Carbohydrate Polymer, 2008, vol. 74., pp. 16-22.
28) Sashiwa, H., Aiba, S.-i. Chemically modified chitin and chitosan as biomaterials. Prog Polym Sci, 2004, vol. 29, pp. 887-908.
100
29) Akiyoshi, K., Sunamoto, J. Supramolecular assembly of hydrophobized polysaccharides. Supramolecular Science, 1996, vol. 3, pp. 157-163.
30) Sinquin, A., Hubert, P., Dellacherie, E. Intermolecular associations in hydrophobically modified derivatives of propyleneglycol alginate. Polymer, 1994, vol. 35, pp. 3557-3560.
31) Benjelloun, A., Brembilla, A., Lochon, P., Abidnejad, M., Viriot, M.-L., Carré, M.-C. Detection of hydrophobic microdomains in aqueous solutions of amphiphilic polymers using fluorescent molecular rotors. Polymer, 1996, vol. 37, pp. 879-883.
32) Nilsson, S., Evertsson, H. Microviscosity in dilute aqueous solutions of SDS and non-ionic cellulose derivatives of different hydrophobicity: fluorescence probe investigations. Carbohydrate Polymers, 1998, vol. 35, pp. 135-144.
33) Santos, S.d.F., Nome, F., Zanette, D., Reed, W. F. Fluorescence Evidence for Formation of a Hyaluronate Ion Dodecyltrimethylammonium Bromide Complex. J Colloid Interface Sci, 1994, vol. 164, pp. 260-262.
34) Winnik, F.M., Regismond, S.T.A., Goddard, E.D. Interactions of cationic surfactants with a hydrophobically modified cationic cellulose polymer: a study by fluorescence spectroscopy. Colloid Surface A, 1996, vol. 106, pp. 243-247.
35) Laurent, T.C., Hascall, V.C. Hyaluronan: Structure and Properties [online]. last revision 15th of December 1997 [cit. 2006-17-1]. Avaible from: <http://www.glycoforum.gr.jp/science/hyaluronan/hyaluronanE.html>.
36) Prehm P., in: Biopolymers (Vandamme E. J., Baets S. De, Steinbüchel A., ed.), Volume 5, chapter XV, Wiley-VCH, Weinheim 2002.
37) Vercruysse, K. P., Prestwich, G.D. Hyaluronate Derivatives in Drug Delivery. Critical Reviews in Therapeutic Drug Carrier Systems, 1998, vol. 15, pp. 513-555.
38) Hinze W. L., in: Solution Chemistry of Surfactant (Mittal K. L., ed.), Volume 1, Plenum Press, Ltd., New York 1979.
39) Evans, F.D.: The colloidal domain. Where Physics, Chemistry, Biology, and Technology meet, Wiley-VCH, New York 1999.
40) Valeur B.: Molecular Fluorescence. Principles and Application. Wiley-VCH Verlag GmbH. Wienheim 2002.
41) Lakowicz J.R.: Principles of Fluorescence Spectroscopy. 2nd edition, Kluwer Academic Publishers. New York 1999.
42) Klán P.: Organická fotochemie. Vydavatelství MU, Brno –Kraví hora. Brno 2001. ISBN 80-120-2526-3.
43) Dos Remeidos, C. G., Moens, P. D. J. Fluorescence Resonance Energy Transfer Spectroscopy Is a Reliable "Ruler" for Measuring Structural Changes in Proteins: Dispelling the Problem of the Unknown Orientation Factor. J Struct Biol, 1995, vol. 115, pp. 175-185.
44) Sánchez, F.G., Ruiz, C.C. Intramicellar energy transfer in aqueous CTAB solutions. J Lumin, 1996, vol. 69, pp. 179-186.
45) Ogama, Y., Shimizu, T., Kobayashi, H., Fujii, T., Hachimori, A., Kondo, Y., Hatano, M. Effects of Ca2+ and Zn2+ on trifluoperazine-S100 proteins interactions: Induced circular dichroism and fluorescence spectra. Biochim Biophys Acta, 1989, vol. 997, pp. 188-192.
101
46) Bogoeva, V.P., Radeva, M.A., Atanasova, L.Y., Stoitsova, S.R., Boteva, R.N. Fluorescence analysis of hormone binding activities of wheat germ agglutinin. Biochim Biophys Acta, 2004, vol. 1698, pp. 213-218.
47) Fitos, I., Visy, J., Zsila, F., Mády, G., Simonyi, M. Selective binding of imatinib to the genetic variants of human α1-acid glycoprotein. Biochim Biophys Acta, 2006, vol. 1760, pp. 1704-1712.
48) Narayanan, S:S., Pa, S.K. Nonspecific Protein-DNA Interactions: Complexation of -Chymotrypsin with a Genomic DNA. Langmuir, 2007, vol. 23, pp. 6712 -6718.
49) Wang, Z.-J., Ren, L.-X., Zhao, Y.-Q., Li, G.-T., Duan, L., Liang, A.H., Yang, B.S. Investigation on the binding of TNS to centrin, an EF-hand protein. Spectrochim Acta A, 2008, vol. 70, pp. 892-897.
50) Uversky, V.N., Winter, S., Löber, G. Use of fluorescence decay times of 8-ANS-protein complexes to study the conformational transitions in proteins which unfold through the molten globule state. Biophysical Chemistry, 1996, vol. 60, pp. 79-88.
51) Ali, V., Prakash, K., Kulkarni, S., Ahmad, A., Madhusudan, K. P., Bhakuni, V. 8-Anilino-1-naphthalene Sulfonic Acid (ANS) Induces Folding of Acid Unfolded Cytochrome c to Molten Globule State as a Result of Electrostatic Interactions. Biochemistry, 1999, vol. 38, pp. 13635-13642.
52) Bonomi, F., Mora, G., Pagani, M.A., Iametti, S. Probing structural features of water-insoluble proteins by front-face fluorescence. Analytical Biochemistry, 2004, vol 329, pp.104-111.
53) Kirk, W., Kurian, E., Wessels, W. Photophysics of ANS V. decay modes of ANS in proteins: The IFABP–ANS complex. Biophysical Chemistry, 2007, vol. 125, pp. 50-58.
54) Gasymov, O.K., Glasgow, B.J. ANS fluorescence: Potential to augment the identification of the external binding sites of proteins. Biochim Biophys Acta, 2007, vol. 1774, pp. 403-411.
55) Fischer, A., Houzelle, M. C., Hubert, P., Axelos, M.A.V., Geoffroy-Chapotot, C., Carre, M.C., Viriot, M.L., Dellacherie, E. Detection of Intramolecular Associations in Hydrophobically Modified Pectin Derivatives Using Fluorescent Probes. Langmuir, 1998, vol. 14, pp. 4482-4488.
56) Damas, C., Frochot, C., Naejus, R., Brembilla, A., Viriot, M.-L., Coudert, R. Thermodynamic Investigation of the Micellization and the Adsorption of Short Perfluoroalkylated Diols via Fluorescence Spectroscopy and Tensiometry. J Colloid Interface Sci, 2001, vol. 241, pp. 188-198.
57) Haidekker, M.A., Ling, T., Anglo, M., Stevens, H.Y., Frangos, J.A., Theodorakis, E.A. New fluorescent probes for the measurement of cell membrane viscosity. Chem Biol, 2001, vol. 8, pp. 123-131.
58) Haidekker, M.A., Brady, T.P., Chalian, S.H., Akers, W., Lichlyter, D., Theodorakis, E.A. Hydrophilic molecular rotor derivatives—synthesis and characterization. Bioorganic Chemistry, 2004, vol. 32, pp. 274-289.
59) Corrales, T., Villavieja, M.M., Peinado, C., Bosch P. β- and γ-relaxations of low density polyethylene: Study by fluorescent probes. J Photoch Photobio A, 2006, vol. 182, pp. 52-59.
102
60) Nipper, M.E., Majd, S., Mayer, M., Lee, J. C.-M., Theodorakis, E.A. Haidekker, M.A. Characterization of changes in the viscosity of lipid membranes with the molecular rotor FCVJ. Biochim Biophys Acta, 2008, vol. 1778,pp. 1148-1153.
61) Kuimova, M.K., Yahioglu, G., Levitt, J. A., Suhling, K. Molecular Rotor Measures Viscosity of Live Cells via Fluorescence Lifetime Imaging. J Am Chem Soc, 2008; vol. 130, pp. 6672-6673.
62) Wen, S., Helmstedt, M., Knoll, H. Microenvironmental differences and changes in bilayers of unilamellar vesicles probed by spectroscopic and kinetic parameters. J Colloid Interface Sci, 2004, vol. 278, pp. 488-496.
63) Anandan, C., Basu, B.J, Rajam, K.S. Investigations of the effect of viscosity of resin on the diffusion of pyrene in silicone polymer coatings using steady state fluorescence technique. Eur Polym J, 2004, vol. 40, pp. 335-342.
64) Bakshi, M.S., Bhandari, P. Fluorescence studies on the non-ideal mixing in triblock copolymer binary mixtures under the effect of temperature: A block hydration effect. J Photochem Photobio A, 2007, vol. 186, pp. 166-172.
65) Rivnay, B., Globerson, A., Shinitzky, M. Viscosity of lymphocyte plasma membrane in aging mice and its possible relation to serum cholesterol. Mech Ageing Dev, 1979, vol. 10, pp. 71-79.
66) Pellegrino, F., Dagen, A., Alfano, R.R. Fluorescence polarization anisotropy and kinetics of malachite green measured as a function of solvent viscosity. Chemical Physics, 1982, vol. 67, pp. 111-117.
67) Lehr, B., Egelhaaf, H.-J., Fritz, H., Rapp, W., Bayer, E., Oelkrug, D. Molecular Solvation and Mobility in Polymer/Liquid Interphases. A Fluorescence Study on Polystyrene-Poly(ethylene glycol) Microbeads. Macromolecules, 1996, vol. 29, pp. 7931-7936.
68) Pistolis, G., Malliaris, A. Simultaneous Double Probing of the Microenvironment in Colloidal Systems and Molecular Assemblies by DPH Derivatives. Langmuir, 1997, vol. 13, pp. 1457-1462.
69) Fofana, M., Veissier, V., Viovy, J.L., Monnerie, L. Investigation of the mobility of polybutadienes: 2. Fluorescence anisotropy decay of rod-like rigid probes. Polymer, 1989, vol. 30, pp. 51-57.
70) Marangoni A. G. Steady-state fluorescence polarization spectroscopy as a tool to determine microviscosity and structural order in food systems. Food Res Int, 1992, vol. 25, pp. 67-80.
71) Gidwani, A., Holowka, D., Baird, B. Fluorescence Anisotropy Measurements of Lipid Order in Plasma Membranes and Lipid Rafts from RBL-2H3 Mast Cells. Biochemistry, 2001, vol. 40, pp. 12422-12429.
72) Ito, N., Kajimoto, O., Hara, K. High-Pressure Studies of Rotational Dynamics for Coumarin 153 in Alcohols and Alkanes. J Phys Chem. A, 2002; vol. 106, pp. 6024-6029.
73) Angelescu, D., Vasilescu, M. Quenching of Pyrene Derivatives' Fluorescence by Nitroxide Radicals in Sodium Dodecyl Sulfate Micellar Solutions. J Colloid Interface Sci, 2001, vol. 244, 139-144.
103
74) Deumié M., El-Baraka M., Quinones E. Fluorescence quenching of pyrene derivatives by iodide compounds in erythrocyte membranes: an approach of the probe location. J Photoch Photobio A, 1995, vol. 87, pp. 105-113.
75) Cser, A., Nagy, K., Bisczók, L. Fluorescence lifetime of Nile red as a probe for the hydrogen bonding strength with its microenvironment. Chem Phys Letters, 2002, vol. 360, pp. 473-478.
76) Ghoneim, N.: Photophysics of Nile red in solution. Steady state spectroscopy. Spectrochim Acta A, 2000, vol. 56, pp. 1003-1010.
77) Kaschny, P., Goñ, F.M. Spectroscopic Properties of Hydrophobic Dyes Incorporated into Phospholipid Bilayers. An Application to the Study of Membrane-Surfactant Interactions. J Colloid Interface Sci, 1993, vol. 161, pp. 24-30.
78) Oliveira, M.E.C.D.R., Hungerford, G., Miguel, M. da G., Burrows, H.D. Solvatochromic fluorescent probes in bicontinuous microemulsions. J Mol Struct, 2001, vol. 563-564, pp. 443-447.
79) Moshe, M.B., Magdassi, S., Cohen, Y., Avram, L. Structure of microemulsions with gemini surfactant studied by solvatochromic probe and diffusion NMR. J Colloid Interface Sci, 2004, vol. 276, pp. 221-226.
80) Miskolczy, Z., Sebık-Nagy, K., Biczók, L., Göktürk, S. Aggregation and micelle formation of ionic liquids in aqueous solution. ChemPhys Letter, 2004, vol. 400, pp. 296-300.
81) Nizri, G., Magdassi, S. Solubilization of hydrophobic molecules in nanoparticles formed by polymer–surfactant interactions. J Colloid Interface Sci, 2005, vol. 291, pp. 169-174.
82) Vanyúr, R., Biczók, L., Miskolczy, Z. Micelle formation of 1-alkyl-3-methylimidazolium bromide ionic liquids in aqueous solution. Colloid Surface A, 2007, vol. 299, pp. 256-261.
83) Alves, F.R., Zaniquelli, M.E.D., Loh, W., Castanheira, E.M.S., Real Oliveira, M.C.D., Feitosa, E. Vesicle–micelle transition in aqueous mixtures of the cationic dioctadecydimethylammonium and octadecyltrimethylammonium bromide surfactants. J Colloid Interface Sci, 2007, vol. 316, pp. 132-139.
84) Brignoli, C. A., DeVoe, H. Least-squares computer analysis of dye absorption spectra. Acridine orange dimerization equilibrium, J Phys Chem, 1978, vol. 82, pp. 2570-2575
85) Costantino, L., Guarino, G., Ortona, O., Vitagliano, V.: Acridine orange association equilibrium in aqueous solution, J Chem Eng Data, 1984, vol. 29, pp. 62-66.
86) De, S., Girigoswami, A. Fluorescence resonance energy transfer—a spectroscopic probe for organized surfactant media. J Colloid Interface Sci, 2004, vol. 271, pp. 485-495.
87) Wang, F., Yang, J., Wu, X., Wang, X., Feng, L., Jia, Z., Guo, Z. Study on the formation and depolymerization of acridine orange dimer in acridine orange–sodium dodecyl benzene sulfonate–protein system. J Colloid Interface Sci, 2006, vol. 298, pp. 757-764
88) Antonov, L., Gergov, G., Petrov, V., Kubista, M., Nygren, J. UV–Vis spectroscopic and chemometric study on the aggregation of ionic dyes in water. Talanta, 1999, vol. 49, pp. 99-106.
89) Luchowski, R., Krawczyk, S. Stark effect spectroscopy of exciton states in the dimer of acridine orange. Chemical Physics, 2003, vol. 293, pp. 155-166.
104
90) Liu, S.P., Chen, S., Liu, Z.F., Hu, X.L., Li, T.S. Resonance Rayleigh scattering spectra of interaction of sodium carboxymethylcellulose with cationic acridine dyes and their analytical applications. Anal Chim Acta, 2005, vol. 535, pp. 169-175.
91) Vitagliano, V., Costantino, L., Zagari, L Interaction between Acridine Orange and poly(styrenesulfonic acid). J Phys Chem, 1973; vol. 77, pp. 204-210.
92) Hayakawa, K., Ohta, J., Maeda, T., Satake, I., Kwak, J.C.T. Spectroscopic studies of dye solubilizates in micellelike complexes of surfactant with polyelectrolyte. Langmuir, 1987, vol. 3, pp. 377-382.
93) Xu, G.-Y., Chen, A.-I., Yang, Y.-L., Yuan, S.-L., Zheng, L. Aggregation behavior of hydrophobically modified polyacrylate in aqueous solution. Colloid Surface A, 2005, vol. 256, pp. 69-75.
94) Peyratout, C., Donath, E., Daehne, L. Electrostatic interactions of cationic dyes with negatively charged polyelectrolytes in aqueous solution. J Photochem Photobiol A, 2001, vol. 142, pp. 51-57.
95) Stone, A.L., Bradley, D.F. Aggregation of cationic dyes on acid polysaccharides I. Spectrophotometric titration with acridine orange and other metachromatic dyes. Biochim Biophys Acta, 1967, vol. 148, pp. 172-192.
96) Elworthy, P.H., Mysels, K. The surface tension of sodium dodecylsulfate solutions and the phase separation model of micelle formation. J Colloid Sci, 1966, vol. 21, pp. 331-347.
97) Mlčochová, P., Bystrický, S., Steiner, B., Machová, E., Koóš, M., Velebný, V., Krčmář, M. Synthesis and characterization of new biodegradable hyaluronan alkyl derivatives. Biopolymers, 2006, vol. 82, pp. 74-79.
98) Bakshi, M.S., Singh, K., Kaur, G., Yoshimura, T., Esumi, K. Spectroscopic investigation on the hydrophobicity in the mixtures of nonionic plus twin tail alkylammonium bromide surfactants. Colloid Surface A, 2006, vol. 278, pp. 129-139.
99) Vautier-Giongo, C., Pastore, H.O. Micellization of CTAB in the presence of silicate anions and the exchange between bromide and silicate at the micelle surface: A step to understand the formation of mesoporous molecular sieves at extremely low surfactant and silicate concentrations. J Colloid Interface Sci, 2006, vol. 299, pp. 874-882.
100) Sharma, K.S., Hassan, P.A., Rakshit, A.K. Self aggregation of binary surfactant mixtures of a cationic dimeric (gemini) surfactant with nonionic surfactants in aqueous medium. Colloid Surface A, 2006, vol. 289, pp. 17-24.
101) Felippe, A.C., Schweitzer, B., Dal Bó, A.G., Eising, R., Minatti, E., Zanette, D. Self-association of sodium cholate with poly(ethylene oxide) cooperatively induced by sodium dodecyl sulfate. Colloid Surface A, 2007, vol. 294, pp. 247-253.
102) Behera, K., Dahiya, P., Pandey, S. Effect of added ionic liquid on aqueous Triton X-100 micelles. J Colloid Interface Sci, 2007, vol. 307, pp. 235-245.
103) Vanyúr, R., Biczók, L., Miskolczy, Z. Micelle formation of 1-alkyl-3-methylimidazolium bromide ionic liquids in aqueous solution. Colloid Surface A, 2007, Volume 299, pp. 256-261.
105
104) Banerjee, P., Chatterjee, S., Pramanik, S., Bhattacharya, S.C. Interaction of Pyrene-1-Carboxaldehyde with micelles and mixed micelles of polyoxyethylene nonyl phenol (Igepal): A spectroscopic study. Colloid Surface A, 2007, vol. 302, pp. 44-50.
105) Molina-Bolívar, J.A., Hierrezuelo, J.M., Ruiz, C.C. Self-assembly, hydration, and structures in N-decanoyl-N-methylglucamide aqueous solutions: Effect of salt addition and temperature. J Colloid Interface Sci, 2007, vol. 313, pp. 656-664.
106) Behera, K., Pandey, S. Modulating properties of aqueous sodium dodecyl sulfate by adding hydrophobic ionic liquid. J Colloid Interface Sci, 2007, vol. 316, pp. 803-814.
107) Kosaka, O., Sehgal, P., Doe, H. Behavior of cationic surfactants micellar solution solubilizing an endocrine disruptor bisphenol A. Food Hydrocolloids, 2008, vol. 22, pp. 144-149.
108) Dong, B., Zhao, X., Zheng, L., Zhang, J., Li, N., Inoue, T. Aggregation behavior of long-chain imidazolium ionic liquids in aqueous solution: Micellization and characterization of micelle microenvironment. Colloid Surface A, 2008, vol. 317, pp. 666-672.
109) Rutkaite, R., Swanson, L.,Li, Z., Armes, S.P. Fluorescence studies of pyrene-labelled, pH-responsive diblock copolymer micelles in aqueous solution. Polymer, 2008, vol. 49, pp. 1800-1811.
110) Aguiar, J., Carpena, P., Molina-Bolívar, J.A., Ruiz, C.C. On the determination of the critical micelle concentration by the pyrene 1:3 ratio method. J Colloid Interface Sci, 2003, vol. 258, pp. 116-122.
106
9. ABBREVIATIONS
Å Ångström [1 10–10 m]
ACN Acetonitrile
ANS 1-anilino-8-naphthalene sulfonate
AO Aridine orange
CAC Critical aggregation concentration
CMC Critical micellar concentration
DMF Dimethylformamide
DMSO Dimethylsulfoxide
DOX Doxorubicin
F Fluorescence intensity
FT-IR Fourier transform infrared spectroscopy
HA Hyaluronic acid, Sodium hyaluronate
hHA hydrophobicaly modified sodium hyaluronate
IC50 Median Inhibition Concentration
I.C. Ionic strength [mol L–1]
I⊥ Intensity, when polarizators are perpendicularly oriented
I || Intensity, when polarizators are in a parallel way
M Molecule
[M] Molecule concentration (ground state)
[M* ] Molecule in excited state concentration
M [mol L–1]
mM [10–3 mol L–1]
µM [10–6 mol L–1]
MW Molecular weight (weight averaged)
N Aggregation number (number of surfactant molecules per micelle)
NMR Nuclear magnetic resonance
p polarization
P/D ration of the mole of polymer binding sites per mole of dye
Q Quencher molecule
r fluorescence anisotropy
S Singlet state
SEC Size exclusion chromatography
SD Substitution degree
SDS Sodium dodecyl sulfate
THF Tetrahydrofuran
TICT Twisted intramolecular charge transfer
κ Orientation factor
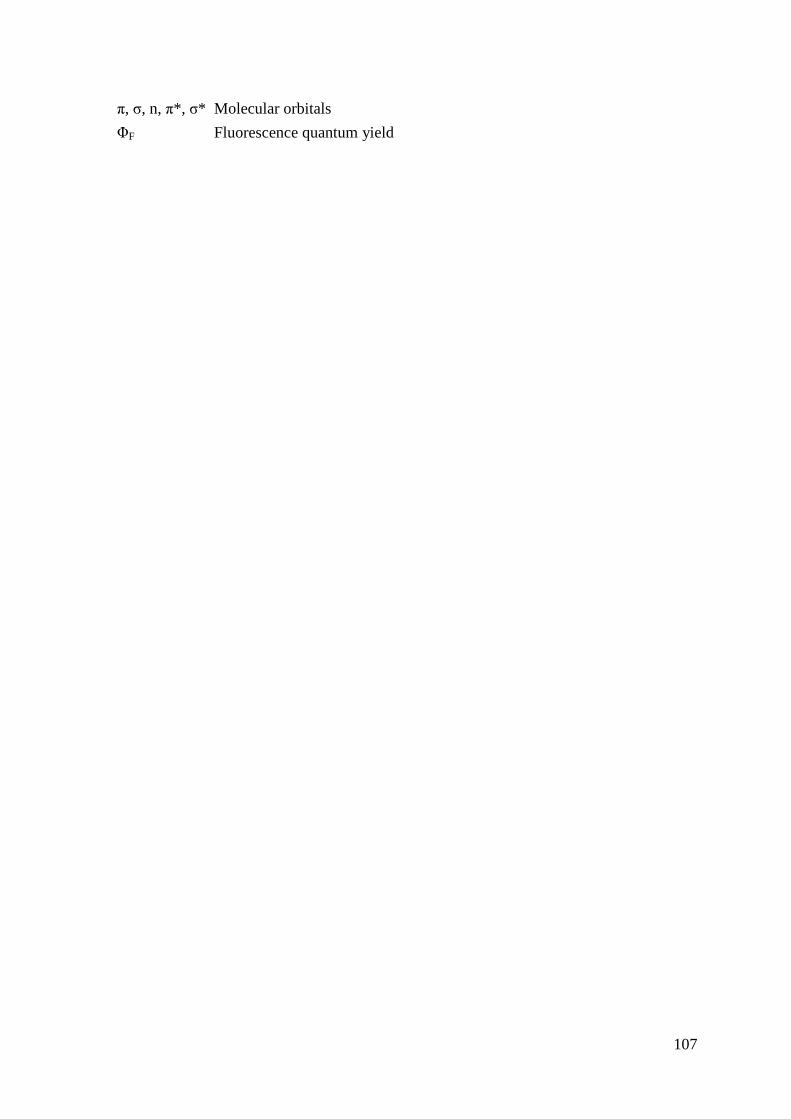
107
π, σ, n, π*, σ* Molecular orbitals
ΦF Fluorescence quantum yield
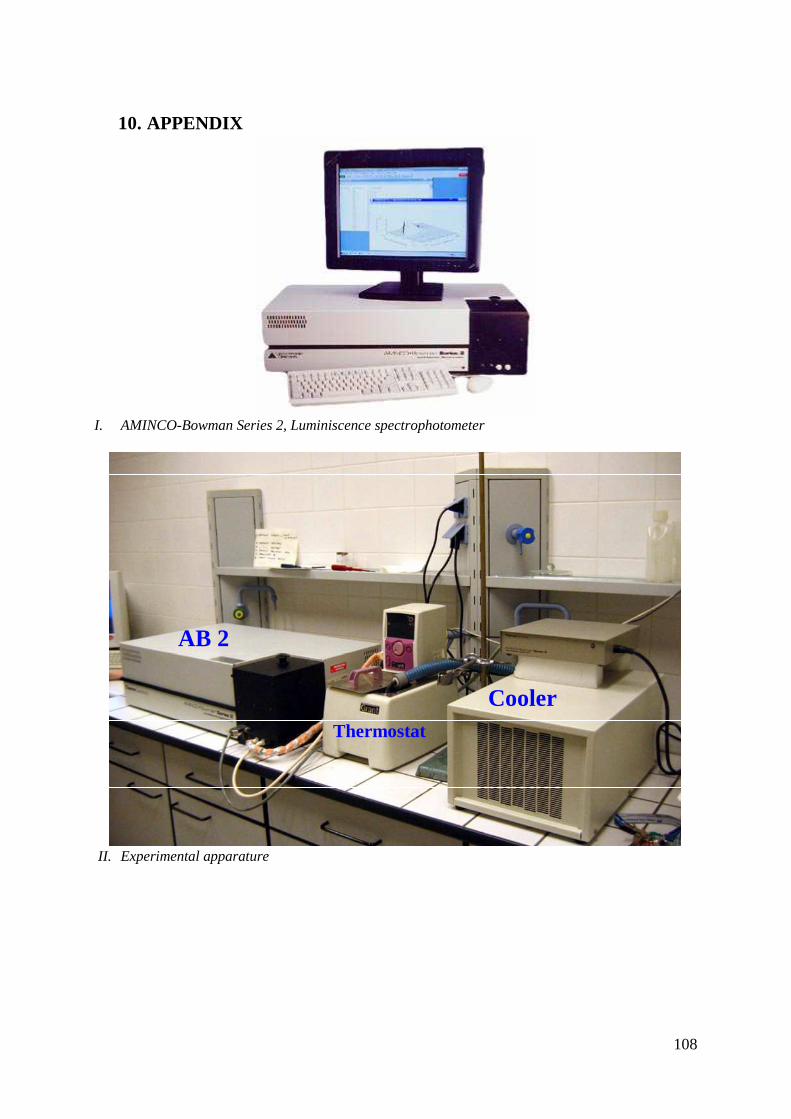
108
10. APPENDIX
I. AMINCO-Bowman Series 2, Luminiscence spectrophotometer
II. Experimental apparature
Cooler
AB 2
Thermostat
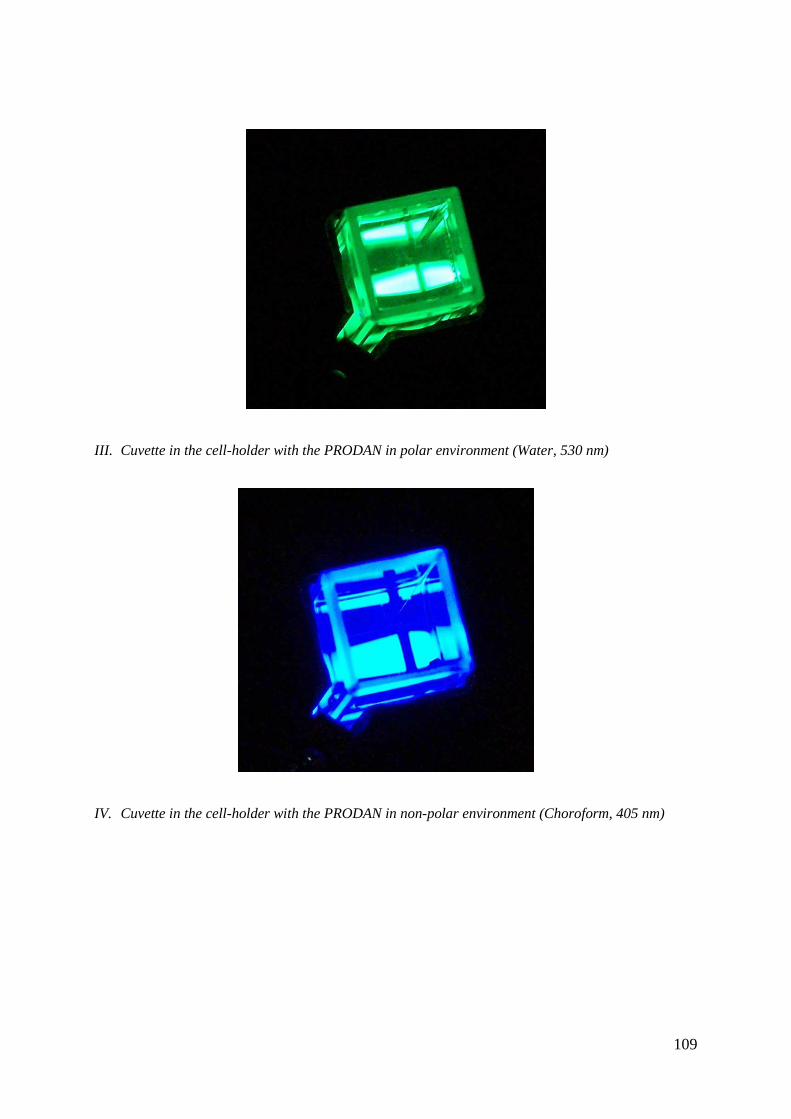
109
III. Cuvette in the cell-holder with the PRODAN in polar environment (Water, 530 nm)
IV. Cuvette in the cell-holder with the PRODAN in non-polar environment (Choroform, 405 nm)
110
V. Mravec, F., Pekař, M., Velebný, V. Aggregation behavior of novel hyaluronan derivatives – a
fluorescence probe study. Colloid and Polymer Science, In Press. DOI: 10.1007/s00396-008-1941-8
(Accepted 30 Sep 2008)
Aggregation behavior of novel hyaluronan
derivatives – a fluorescence probe study
Filip MRAVEC1, 2, Miloslav PEKAŘ1, Vladimír VELEBNÝ2
(1) Institute of Physical and Applied Chemistry, Faculty of Chemistry, Brno University of Technology, Purkyňova 118, 612 00 Brno, CZ
(2) CPN spol. s.r.o., Dolní Dobrouč 401, 561 02 Dolní Dobrouč, CZ
tel.: +420 541 149 483
fax.: +420 541 149 389
www.fch.vutbr.cz/ipac ; www.hyaluronan.cz
Abstract: Aggregation properties of hydrophobized hyaluronan (hHA) with different molecular weights and
degrees of substitution were studied using pyrene and Perylene as fluorescence probes. Both probes in contrast to
native biopolymer confirmed aggregation of modified hyaluronan. The critical aggregation concentration (cac)
was determined by the pyrene I1/I3 and Perylene fluorescence intensity method. The cac value varied both with
the molecular weight and the degree of substitution and was between 0.610-0.003 g⋅L−1. Pyrene Polarity Scale
confirmed formation of hydrophobic domains.
hyaluronate derivatives - fluorescence probes - critical aggregation concentration - core
hydrophobicity
Introduction
Polysaccharides and their derivatives have become major components in the development of biocompatible
and biodegradable materials with many areas of applications (e.g. tissue engineering, drug delivery). Chemical
modification, which does not affect the biodegradability and does not suppress biological activity, can lead to
further expansion of medicine and engineering applications [1, 2].
Hyaluronan (HA) is a major component of pericellular and extracellular matrices [3]. It is a linear polymer
formed by repeating disaccharide units composed of the disaccharide unit formed by D-glucuronic acid-1-β-3-N-
acetylglukosamine. It plays an important role in stabilizing the extracellular matrix in many tissues by binding to
specific proteins called hyaladherines. The main hyaluronan fraction is localized in the skin tissue [4].
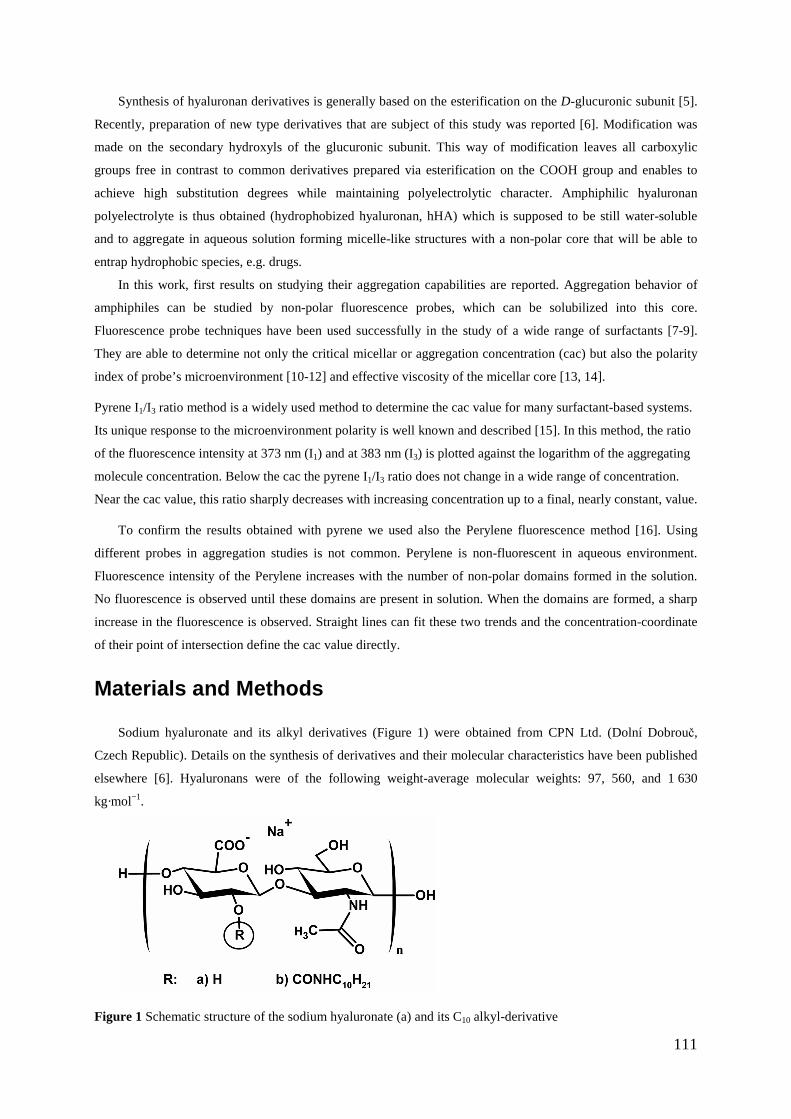
111
Synthesis of hyaluronan derivatives is generally based on the esterification on the D-glucuronic subunit [5].
Recently, preparation of new type derivatives that are subject of this study was reported [6]. Modification was
made on the secondary hydroxyls of the glucuronic subunit. This way of modification leaves all carboxylic
groups free in contrast to common derivatives prepared via esterification on the COOH group and enables to
achieve high substitution degrees while maintaining polyelectrolytic character. Amphiphilic hyaluronan
polyelectrolyte is thus obtained (hydrophobized hyaluronan, hHA) which is supposed to be still water-soluble
and to aggregate in aqueous solution forming micelle-like structures with a non-polar core that will be able to
entrap hydrophobic species, e.g. drugs.
In this work, first results on studying their aggregation capabilities are reported. Aggregation behavior of
amphiphiles can be studied by non-polar fluorescence probes, which can be solubilized into this core.
Fluorescence probe techniques have been used successfully in the study of a wide range of surfactants [7-9].
They are able to determine not only the critical micellar or aggregation concentration (cac) but also the polarity
index of probe’s microenvironment [10-12] and effective viscosity of the micellar core [13, 14].
Pyrene I1/I3 ratio method is a widely used method to determine the cac value for many surfactant-based systems.
Its unique response to the microenvironment polarity is well known and described [15]. In this method, the ratio
of the fluorescence intensity at 373 nm (I1) and at 383 nm (I3) is plotted against the logarithm of the aggregating
molecule concentration. Below the cac the pyrene I1/I3 ratio does not change in a wide range of concentration.
Near the cac value, this ratio sharply decreases with increasing concentration up to a final, nearly constant, value.
To confirm the results obtained with pyrene we used also the Perylene fluorescence method [16]. Using
different probes in aggregation studies is not common. Perylene is non-fluorescent in aqueous environment.
Fluorescence intensity of the Perylene increases with the number of non-polar domains formed in the solution.
No fluorescence is observed until these domains are present in solution. When the domains are formed, a sharp
increase in the fluorescence is observed. Straight lines can fit these two trends and the concentration-coordinate
of their point of intersection define the cac value directly.
Materials and Methods
Sodium hyaluronate and its alkyl derivatives (Figure 1) were obtained from CPN Ltd. (Dolní Dobrouč,
Czech Republic). Details on the synthesis of derivatives and their molecular characteristics have been published
elsewhere [6]. Hyaluronans were of the following weight-average molecular weights: 97, 560, and 1 630
kg·mol−1.
Figure 1 Schematic structure of the sodium hyaluronate (a) and its C10 alkyl-derivative
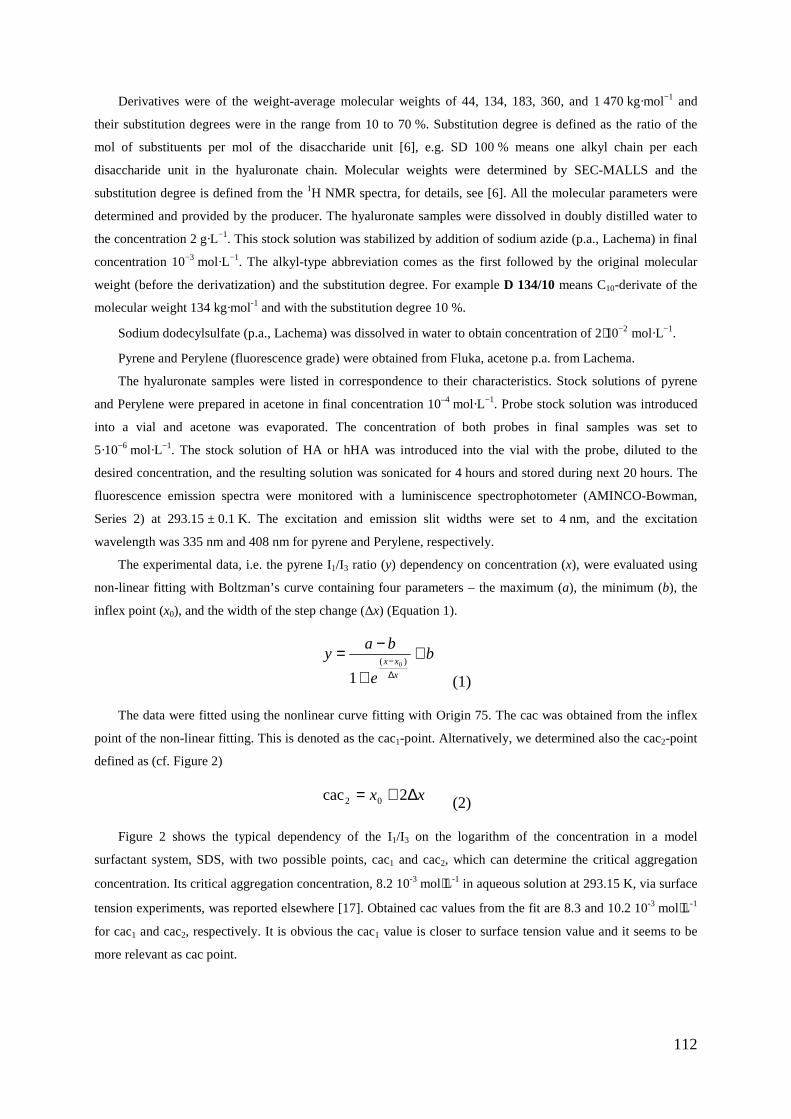
112
Derivatives were of the weight-average molecular weights of 44, 134, 183, 360, and 1 470 kg·mol−1 and
their substitution degrees were in the range from 10 to 70 %. Substitution degree is defined as the ratio of the
mol of substituents per mol of the disaccharide unit [6], e.g. SD 100 % means one alkyl chain per each
disaccharide unit in the hyaluronate chain. Molecular weights were determined by SEC-MALLS and the
substitution degree is defined from the 1H NMR spectra, for details, see [6]. All the molecular parameters were
determined and provided by the producer. The hyaluronate samples were dissolved in doubly distilled water to
the concentration 2 g·L−1. This stock solution was stabilized by addition of sodium azide (p.a., Lachema) in final
concentration 10−3 mol·L−1. The alkyl-type abbreviation comes as the first followed by the original molecular
weight (before the derivatization) and the substitution degree. For example D 134/10 means C10-derivate of the
molecular weight 134 kg·mol-1 and with the substitution degree 10 %.
Sodium dodecylsulfate (p.a., Lachema) was dissolved in water to obtain concentration of 2⋅10−2 mol·L−1.
Pyrene and Perylene (fluorescence grade) were obtained from Fluka, acetone p.a. from Lachema.
The hyaluronate samples were listed in correspondence to their characteristics. Stock solutions of pyrene
and Perylene were prepared in acetone in final concentration 10–4 mol·L−1. Probe stock solution was introduced
into a vial and acetone was evaporated. The concentration of both probes in final samples was set to
5·10−6 mol·L−1. The stock solution of HA or hHA was introduced into the vial with the probe, diluted to the
desired concentration, and the resulting solution was sonicated for 4 hours and stored during next 20 hours. The
fluorescence emission spectra were monitored with a luminiscence spectrophotometer (AMINCO-Bowman,
Series 2) at 293.15 ± 0.1 K. The excitation and emission slit widths were set to 4 nm, and the excitation
wavelength was 335 nm and 408 nm for pyrene and Perylene, respectively.
The experimental data, i.e. the pyrene I1/I3 ratio (y) dependency on concentration (x), were evaluated using
non-linear fitting with Boltzman’s curve containing four parameters – the maximum (a), the minimum (b), the
inflex point (x0), and the width of the step change (∆x) (Equation 1).
b
e
bay
x
xx+
+
−=∆− )( 0
1 (1)
The data were fitted using the nonlinear curve fitting with Origin 75. The cac was obtained from the inflex
point of the non-linear fitting. This is denoted as the cac1-point. Alternatively, we determined also the cac2-point
defined as (cf. Figure 2)
xx ∆+= 2cac 02 (2)
Figure 2 shows the typical dependency of the I1/I3 on the logarithm of the concentration in a model
surfactant system, SDS, with two possible points, cac1 and cac2, which can determine the critical aggregation
concentration. Its critical aggregation concentration, 8.2 10-3 mol⋅L-1 in aqueous solution at 293.15 K, via surface
tension experiments, was reported elsewhere [17]. Obtained cac values from the fit are 8.3 and 10.2 10-3 mol⋅L-1
for cac1 and cac2, respectively. It is obvious the cac1 value is closer to surface tension value and it seems to be
more relevant as cac point.
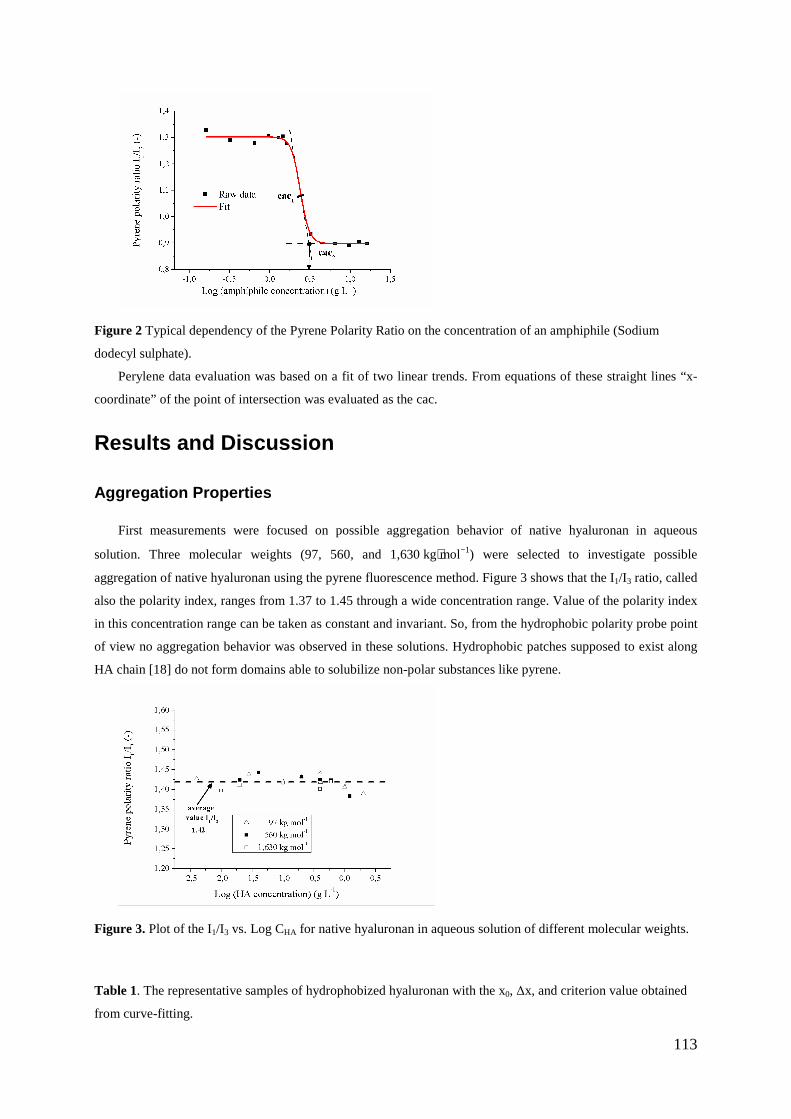
113
Figure 2 Typical dependency of the Pyrene Polarity Ratio on the concentration of an amphiphile (Sodium
dodecyl sulphate).
Perylene data evaluation was based on a fit of two linear trends. From equations of these straight lines “x-
coordinate” of the point of intersection was evaluated as the cac.
Results and Discussion
Aggregation Properties
First measurements were focused on possible aggregation behavior of native hyaluronan in aqueous
solution. Three molecular weights (97, 560, and 1,630 kg⋅mol−1) were selected to investigate possible
aggregation of native hyaluronan using the pyrene fluorescence method. Figure 3 shows that the I1/I3 ratio, called
also the polarity index, ranges from 1.37 to 1.45 through a wide concentration range. Value of the polarity index
in this concentration range can be taken as constant and invariant. So, from the hydrophobic polarity probe point
of view no aggregation behavior was observed in these solutions. Hydrophobic patches supposed to exist along
HA chain [18] do not form domains able to solubilize non-polar substances like pyrene.
Figure 3. Plot of the I1/I3 vs. Log CHA for native hyaluronan in aqueous solution of different molecular weights.
Table 1. The representative samples of hydrophobized hyaluronan with the x0, ∆x, and criterion value obtained
from curve-fitting.
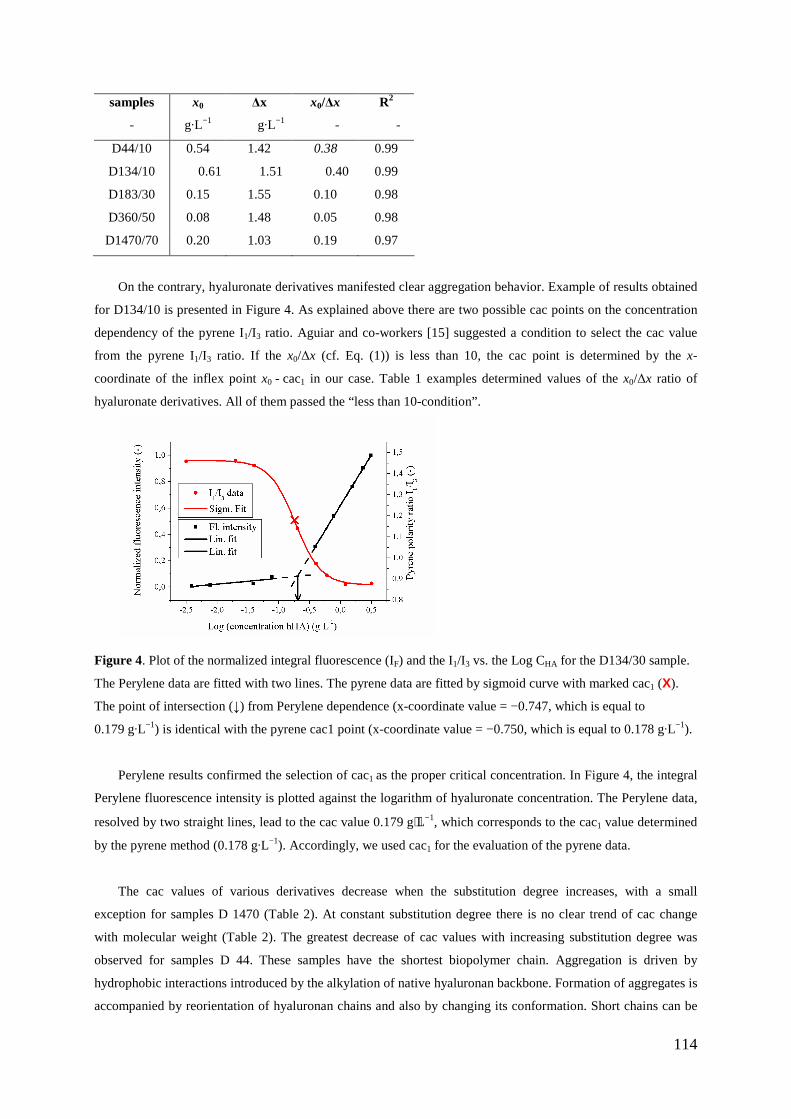
114
samples x0 ∆x x0/∆x R2
- g·L−1 g·L−1 - -
D44/10 0.54 1.42 0.38 0.99
D134/10 0.61 1.51 0.40 0.99
D183/30 0.15 1.55 0.10 0.98
D360/50 0.08 1.48 0.05 0.98
D1470/70 0.20 1.03 0.19 0.97
On the contrary, hyaluronate derivatives manifested clear aggregation behavior. Example of results obtained
for D134/10 is presented in Figure 4. As explained above there are two possible cac points on the concentration
dependency of the pyrene I1/I3 ratio. Aguiar and co-workers [15] suggested a condition to select the cac value
from the pyrene I1/I3 ratio. If the x0/∆x (cf. Eq. (1)) is less than 10, the cac point is determined by the x-
coordinate of the inflex point x0 - cac1 in our case. Table 1 examples determined values of the x0/∆x ratio of
hyaluronate derivatives. All of them passed the “less than 10-condition”.
Figure 4. Plot of the normalized integral fluorescence (IF) and the I1/I3 vs. the Log CHA for the D134/30 sample.
The Perylene data are fitted with two lines. The pyrene data are fitted by sigmoid curve with marked cac1 (X).
The point of intersection (↓) from Perylene dependence (x-coordinate value = −0.747, which is equal to
0.179 g·L−1) is identical with the pyrene cac1 point (x-coordinate value = −0.750, which is equal to 0.178 g·L−1).
Perylene results confirmed the selection of cac1 as the proper critical concentration. In Figure 4, the integral
Perylene fluorescence intensity is plotted against the logarithm of hyaluronate concentration. The Perylene data,
resolved by two straight lines, lead to the cac value 0.179 g⋅L−1, which corresponds to the cac1 value determined
by the pyrene method (0.178 g·L−1). Accordingly, we used cac1 for the evaluation of the pyrene data.
The cac values of various derivatives decrease when the substitution degree increases, with a small
exception for samples D 1470 (Table 2). At constant substitution degree there is no clear trend of cac change
with molecular weight (Table 2). The greatest decrease of cac values with increasing substitution degree was
observed for samples D 44. These samples have the shortest biopolymer chain. Aggregation is driven by
hydrophobic interactions introduced by the alkylation of native hyaluronan backbone. Formation of aggregates is
accompanied by reorientation of hyaluronan chains and also by changing its conformation. Short chains can be
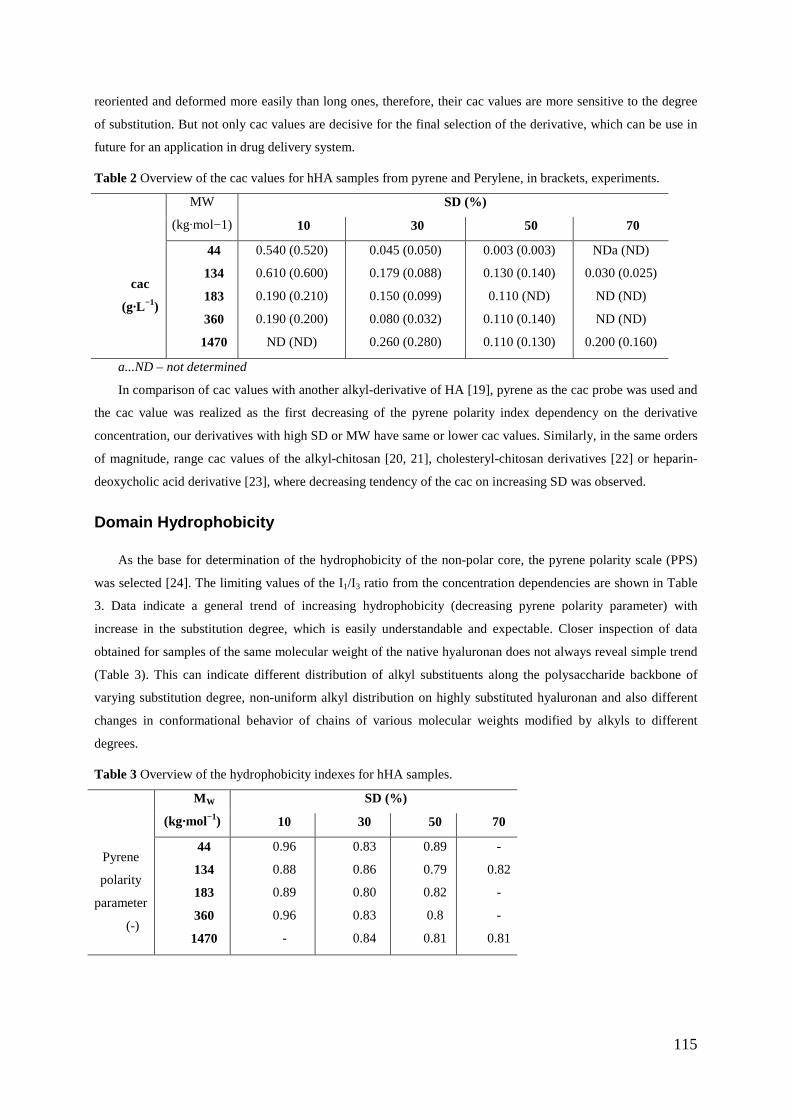
115
reoriented and deformed more easily than long ones, therefore, their cac values are more sensitive to the degree
of substitution. But not only cac values are decisive for the final selection of the derivative, which can be use in
future for an application in drug delivery system.
Table 2 Overview of the cac values for hHA samples from pyrene and Perylene, in brackets, experiments.
SD (%) MW
(kg·mol−1) 10 30 50 70
cac
(g·L−1)
44
134
183
360
1470
0.540 (0.520)
0.610 (0.600)
0.190 (0.210)
0.190 (0.200)
ND (ND)
0.045 (0.050)
0.179 (0.088)
0.150 (0.099)
0.080 (0.032)
0.260 (0.280)
0.003 (0.003)
0.130 (0.140)
0.110 (ND)
0.110 (0.140)
0.110 (0.130)
NDa (ND)
0.030 (0.025)
ND (ND)
ND (ND)
0.200 (0.160)
a...ND – not determined
In comparison of cac values with another alkyl-derivative of HA [19], pyrene as the cac probe was used and
the cac value was realized as the first decreasing of the pyrene polarity index dependency on the derivative
concentration, our derivatives with high SD or MW have same or lower cac values. Similarly, in the same orders
of magnitude, range cac values of the alkyl-chitosan [20, 21], cholesteryl-chitosan derivatives [22] or heparin-
deoxycholic acid derivative [23], where decreasing tendency of the cac on increasing SD was observed.
Domain Hydrophobicity
As the base for determination of the hydrophobicity of the non-polar core, the pyrene polarity scale (PPS)
was selected [24]. The limiting values of the I1/I3 ratio from the concentration dependencies are shown in Table
3. Data indicate a general trend of increasing hydrophobicity (decreasing pyrene polarity parameter) with
increase in the substitution degree, which is easily understandable and expectable. Closer inspection of data
obtained for samples of the same molecular weight of the native hyaluronan does not always reveal simple trend
(Table 3). This can indicate different distribution of alkyl substituents along the polysaccharide backbone of
varying substitution degree, non-uniform alkyl distribution on highly substituted hyaluronan and also different
changes in conformational behavior of chains of various molecular weights modified by alkyls to different
degrees.
Table 3 Overview of the hydrophobicity indexes for hHA samples.
SD (%) M W
(kg·mol−1) 10 30 50 70
Pyrene
polarity
parameter
(-)
44
134
183
360
1470
0.96
0.88
0.89
0.96
-
0.83
0.86
0.80
0.83
0.84
0.89
0.79
0.82
0.8
0.81
-
0.82
-
-
0.81

116
Conclusion
The novel hyaluronan derivatives show surfactant-like aggregation behavior in aqueous solutions. Their
critical aggregation concentrations can be modified by the molecular weight and substitution degree and ranges
between 0.610-0.003 g⋅L−1. Hydrophobic domains are formed with the relative hydrophobic index (PPS) nearby
0.85. This value is comparable to that of simple surfactants. Novel hyaluronate hydrophobized derivatives with
preserved free carboxyl groups are thus potential candidates for preparing systems for targeted delivery of
hydrophobic active substances.
Acknowledgement.
We thank CPN Ltd Dolní Dobrouč (Czech Republic) for material and financial support. The research was
supported also by the Ministry of Education of the Czech Republic, project. No. MSM 00216305001.
References
1. Luo Y, Prestwich G D (2001) Hyaluronic Acid-N-Hydroxysuccinimide: A Useful Intermediate for
Bioconjugation. Bioconjugate Chem 12:1085-1088
2. Ghosh K, Shu X Z, Mou R, Lombardi J et al (2005) Rheological Characterization of in Situ Cross-Linkable
Hyaluronan Hydrogels. Biomacromolecules 6:2857-2865
3. Lapčík L. Jr, Lapčík L, De Smedt S, Demeester K (1998) Hyaluronan: Preparation, Structure, Properties, and
Applications. Chem Rev 98:2663-2684
4. Tammi R, Tammi M (1998) Hyaluronan in the Epidermis. Available via DIALOG.
http://glycoforum.gr.jp/science/hyaluronan/HA04/HA04E.html. Accessed 10 Apr 2008.
5. Bulpitt P, Aeschlimann D J (1999) New strategy for chemical modification of hyaluronic acid: preparation of
functionalized derivatives and their use in the formation of novel biocompatible hydrogels. Biomed Mater Res
47:152-169
6. Mlčochová P, Bystrický S, Steiner B et al (2006) Synthesis and Characterization of New Biodegradable
Hyaluronan Alkyl Derivatives. Biopolymers 82:74-79
7. Kalyanasundaram K, Thomas J K (1977) Environmental effects on vibronic band intensities in pyrene
monomer fluorescence and their application in studies of micellar systems. J Am Chem Soc 99:2039-2044
8. Glushko V, Thaler M S R, Karp D C (1981) Pyrene fluorescence fine structure as a polarity probe of
hydrophobic regions: Behavior in model solvents. Arch Biochem Biophys 210:33-42
9. Lianos P, Zana R J (1981) Fluorescence probe studies of the effect of concentration on the state of aggregation
of surfactants in aqueous solution. Colloid Interface Sci 84:100-107
10. Offen H W, Turley W D (1982) Pyrene fluorescence spectra in micelles at high pressures. J Phys Chem
86:3501-3503
11. Ruiz C C, Sánchez F G (1994) Effect of Urea on Aggregation Behavior of Triton X-100 Micellar Solutions:
A Photophysical Study. J Colloid Interface Sci 165:110-115
117
12. Molina-Bolívar J A, Aguiar J, Peula-García J M, Ruiz C C (2004) Surface Activity, Micelle Formation, and
Growth of n-Octyl-β-D-Thioglucopyranoside in Aqueous Solutions at Different Temperatures. J Phys Chem B
108:12813-12820
13. Ruiz C C (2000) Fluorescence Anisotropy of Probes Solubilized in Micelles of
Tetradecyltrymethylammonium Bromide: Effect of Ethylene Glycol Added. J Colloid Interface Sci 221:262-267
14. Crosas E, Egea M A, Reig F J(2006) Spectroscopic techniques applied to the study of laminin fragments
inserted into model membranes. Colloid Interface Sci 295:264-269
15. Aguiar J, Carpena P, Molina-Bolívar J A, Ruiz C C (2003) On the determination of the critical micelle
concentration by the pyrene 1:3 ratio method. J Colloid Interface Sci 258:116-122
16. Mast R C, Haynes L V (1975) The use of the fluorescent probes Perylene and magnesium 8-
anilinonaphthalene-1-sulfonate to determine the critical micelle concentration of surfactants in aqueous solution.
J Colloid Interface Sci 53:35-41
17. Elworthy P H, Mysels K J (1966) The surface tension of sodium dodecylsulfate solutions and the phase
separation model of micelle formation. J Colloid Sci 21:331-347
18. Scott J E, Heatley F (2002) Biological Properties of Hyaluronan in Aqueous Solution Are Controlled and
Sequestered by Reversible Tertiary Structures, Defined by NMR Spectroscopy. Biomacromolecules 3:547-553
19. Creuzet C, Kadi S, Rinaudo M, Auzély-Velty R (2006) New associative systems based on alkylated
hyaluronic acid. Synthesis and aqueous solution properties. Polymer 47:2706-2713.
20. Liu W, Sun S J, Zhang X, De Yao K (2003) Self-aggregation bahavior of alkylated chitosans and its efect on
the release of a hydrophobic drug. J Biomater Sci Polymer Edn 14:851-859
21. Philippova O E, Volkov E V, Sitnikova N L, Khokhlov A R, Desbrieres J, Rinaudo M (2001) Two types of
hydrophobic aggregates in aqueous solution of chitosan and its hydrophobic derivative. Biomacromolecules
2:483-490
22. Yingsong W, Lingrong L, Jian W, Zhang Q (2007) Preparation and characterization of self-aggregated
nanoparticles of cholesterol-modified O-carboxylmethyl chitosan conjugates. Carbohydr Polym 69:597-606
23. Park K, Kim K, Kwon I C, Kim S K, Lee S, Lee D Y, Byun Y (2004) Preparation and characterization of
self-assembled nanoparticles of heparin-deoxycholic acid conjugates. Langmuir 20: 11726-11731
24. Dong D C, Winnik F (1985) The Py Scale of Solvent Polarities. Can J Chem 62:2560-2566
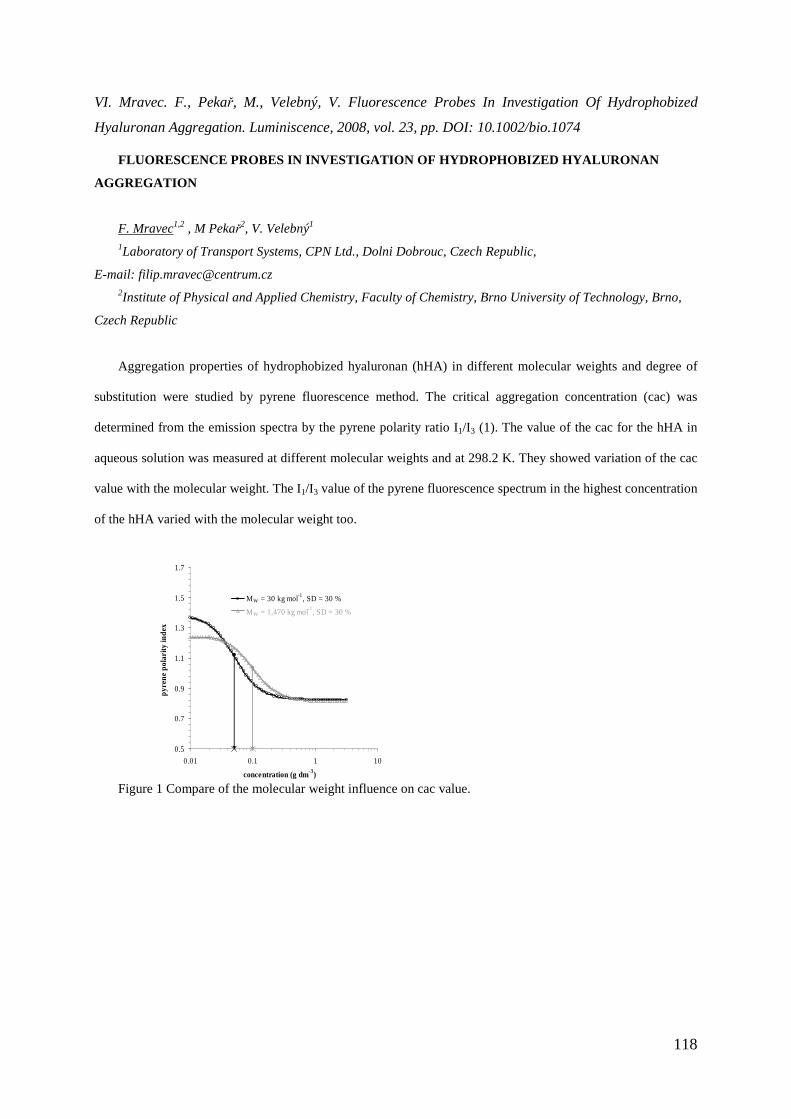
118
VI. Mravec. F., Pekař, M., Velebný, V. Fluorescence Probes In Investigation Of Hydrophobized
Hyaluronan Aggregation. Luminiscence, 2008, vol. 23, pp. DOI: 10.1002/bio.1074
FLUORESCENCE PROBES IN INVESTIGATION OF HYDROPHOBIZ ED HYALURONAN
AGGREGATION
F. Mravec1,2 , M Pekař2, V. Velebný1 1Laboratory of Transport Systems, CPN Ltd., Dolni Dobrouc, Czech Republic,
E-mail: [email protected] 2Institute of Physical and Applied Chemistry, Faculty of Chemistry, Brno University of Technology, Brno,
Czech Republic
Aggregation properties of hydrophobized hyaluronan (hHA) in different molecular weights and degree of
substitution were studied by pyrene fluorescence method. The critical aggregation concentration (cac) was
determined from the emission spectra by the pyrene polarity ratio I1/I3 (1). The value of the cac for the hHA in
aqueous solution was measured at different molecular weights and at 298.2 K. They showed variation of the cac
value with the molecular weight. The I1/I3 value of the pyrene fluorescence spectrum in the highest concentration
of the hHA varied with the molecular weight too.
Figure 1 Compare of the molecular weight influence on cac value.
0.5
0.7
0.9
1.1
1.3
1.5
1.7
0.01 0.1 1 10
concentration (g dm-3)
pyre
ne p
olar
ity in
dex
30/30
1,470/30
MW = 30 kg mol-1, SD = 30 %
MW = 1,470 kg mol-1, SD = 30 %
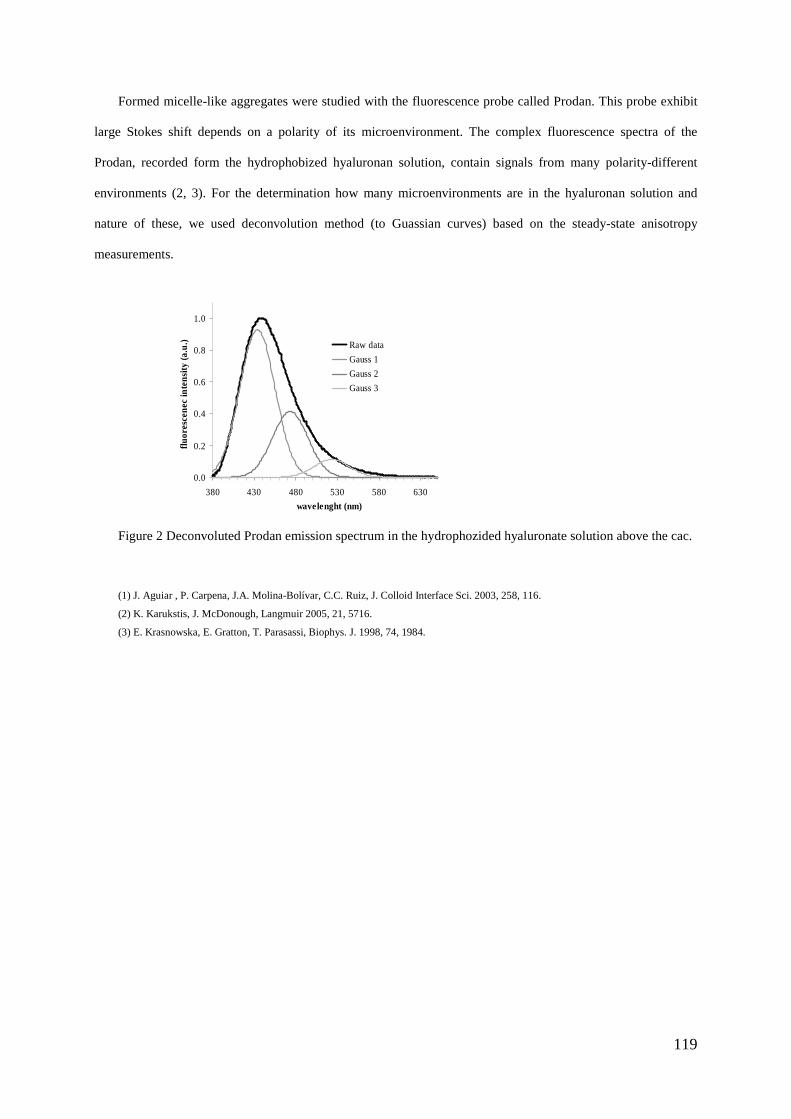
119
Formed micelle-like aggregates were studied with the fluorescence probe called Prodan. This probe exhibit
large Stokes shift depends on a polarity of its microenvironment. The complex fluorescence spectra of the
Prodan, recorded form the hydrophobized hyaluronan solution, contain signals from many polarity-different
environments (2, 3). For the determination how many microenvironments are in the hyaluronan solution and
nature of these, we used deconvolution method (to Guassian curves) based on the steady-state anisotropy
measurements.
Figure 2 Deconvoluted Prodan emission spectrum in the hydrophozided hyaluronate solution above the cac.
(1) J. Aguiar , P. Carpena, J.A. Molina-Bolívar, C.C. Ruiz, J. Colloid Interface Sci. 2003, 258, 116.
(2) K. Karukstis, J. McDonough, Langmuir 2005, 21, 5716.
(3) E. Krasnowska, E. Gratton, T. Parasassi, Biophys. J. 1998, 74, 1984.
0.0
0.2
0.4
0.6
0.8
1.0
380 430 480 530 580 630
wavelenght (nm)
fluor
esce
nec
inte
nsity
(a.u
.)
Raw data
Gauss 1
Gauss 2
Gauss 3