Embed Size (px)
Citation preview

AGMA Webinar SeriesAnalytical Gear Chart Interpretation:
Reading Between the LinesPART ONE
Dwight SmithPresident, Cole Mfg. Systems, Inc.
May 10, 2012
Dwight Smith, President of Cole Mfg. Systems, Inc., has a wide range of experience in gear manufacturing, workholding, metrology, analysis, and project management. He has been developing and presenting the Gear Basic training sessions throughout North America since 1989. Smith serves as chairman of the AGMA Nomenclature Committee and is an instructor for the Basic Gear School for AGMA. His company, Cole Mfg. Systems, Inc., represents complementary gear‐related equipment manufacturers.
American Gear Manufacturers Association
Dwight Smith

Gear – Primary Elements
• Definition of primary gear tooth elements– Profile (Involute)
• Deviation from the involute curve– Helix (Lead)
• Deviation from true helix angle– Pitch (Index)
• Distance along a curve from one tooth to next at same diameter
– Runout • Radial deviation over a ball occurring
once per revolution
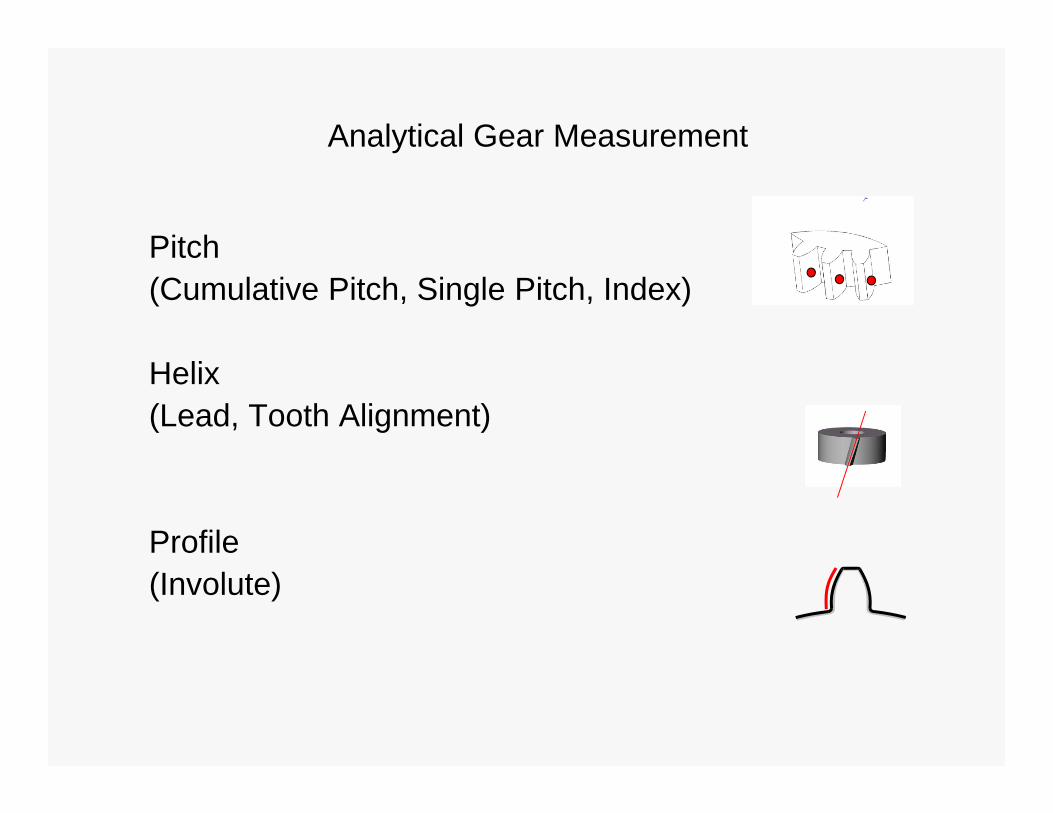
Pitch (Cumulative Pitch, Single Pitch, Index)
Helix (Lead, Tooth Alignment)
Profile(Involute)
Analytical Gear Measurement

Pitch Inspection

Index Tangent to Base Circle Diameter
Base Tangent Line
Rotary MotionBase Circle
Diameter
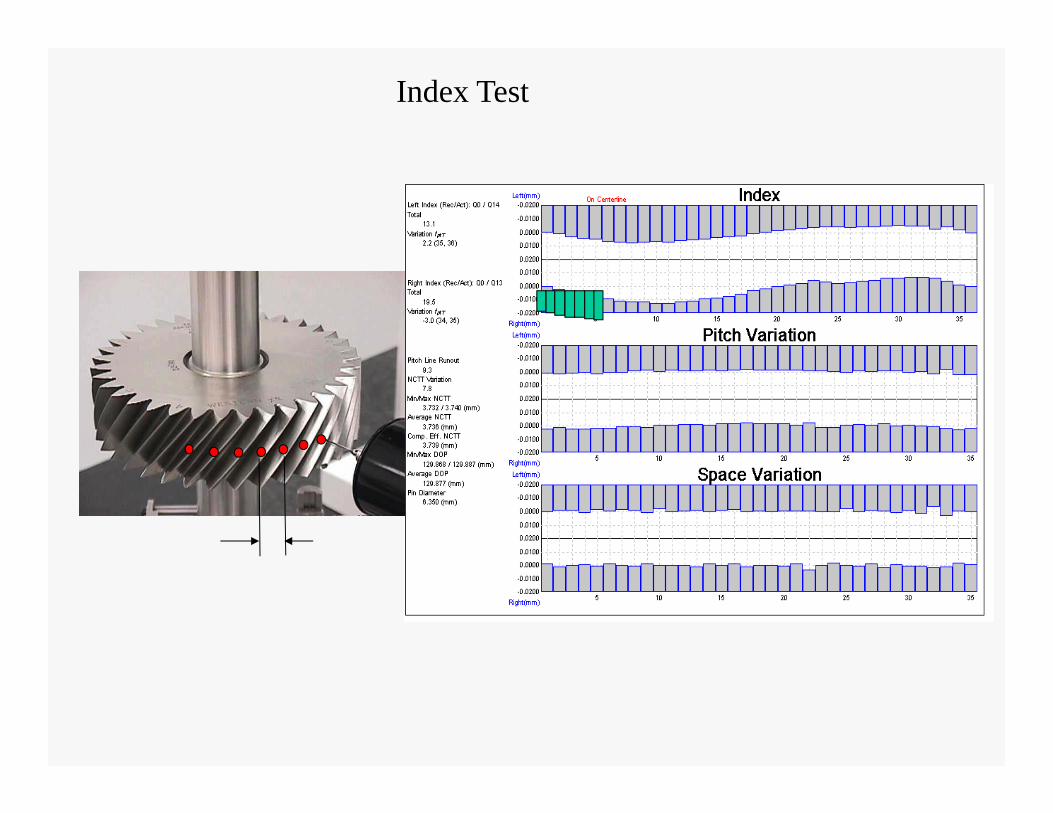
Index Test

Index Test- Total Error

Index Test – Single Pitch Error
Single Pitch Error

Gear Index and Pitch Terms
1 1910
fp
Fp
4
5
actual
expected
probe
Index and pitch

Index Test Calculations
(Pitch)
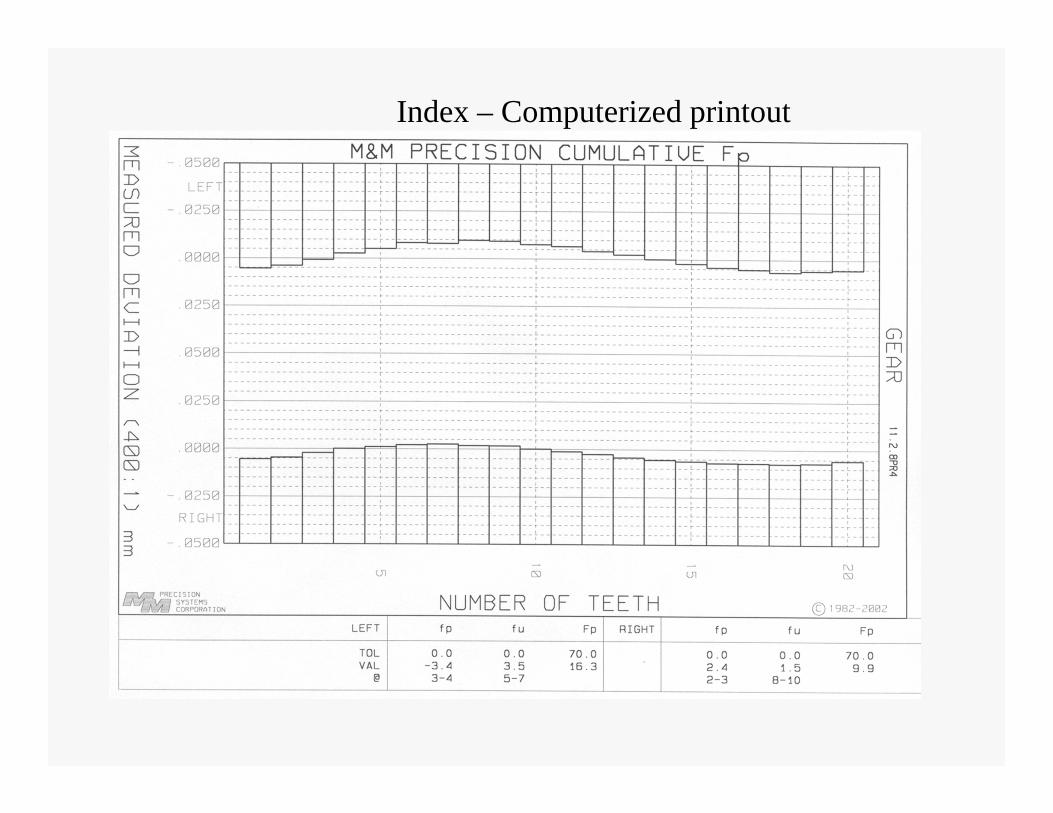
Index – Computerized printout

Pitch vs. RunoutCumulative Pitch Single Pitch

ATTENTION: Runout determined by analytical inspection is NOT a direct substitute for “Runout by Composite Test”.

Helix Inspection

Lead (Helix) Test
Helix (Lead) Test
Test Results

Gear Tooth Helix Chart
topbottom
Tooth #1
bottom
top
Helix
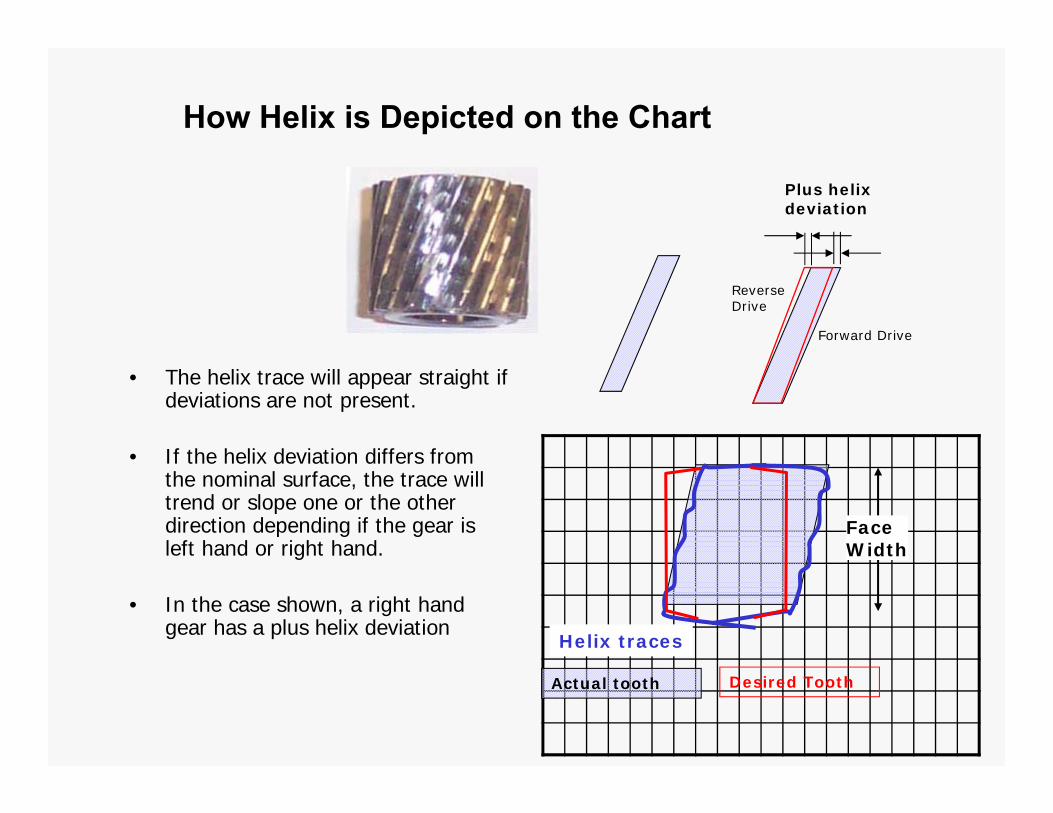
• The helix trace will appear straight if deviations are not present.
• If the helix deviation differs from the nominal surface, the trace will trend or slope one or the other direction depending if the gear is left hand or right hand.
• In the case shown, a right hand gear has a plus helix deviation
How Helix is Depicted on the Chart
Desired ToothActual tooth
Face Width
Helix traces
Plus helix deviation
Reverse Drive
Forward Drive


Gear Helix Chart Creation
•
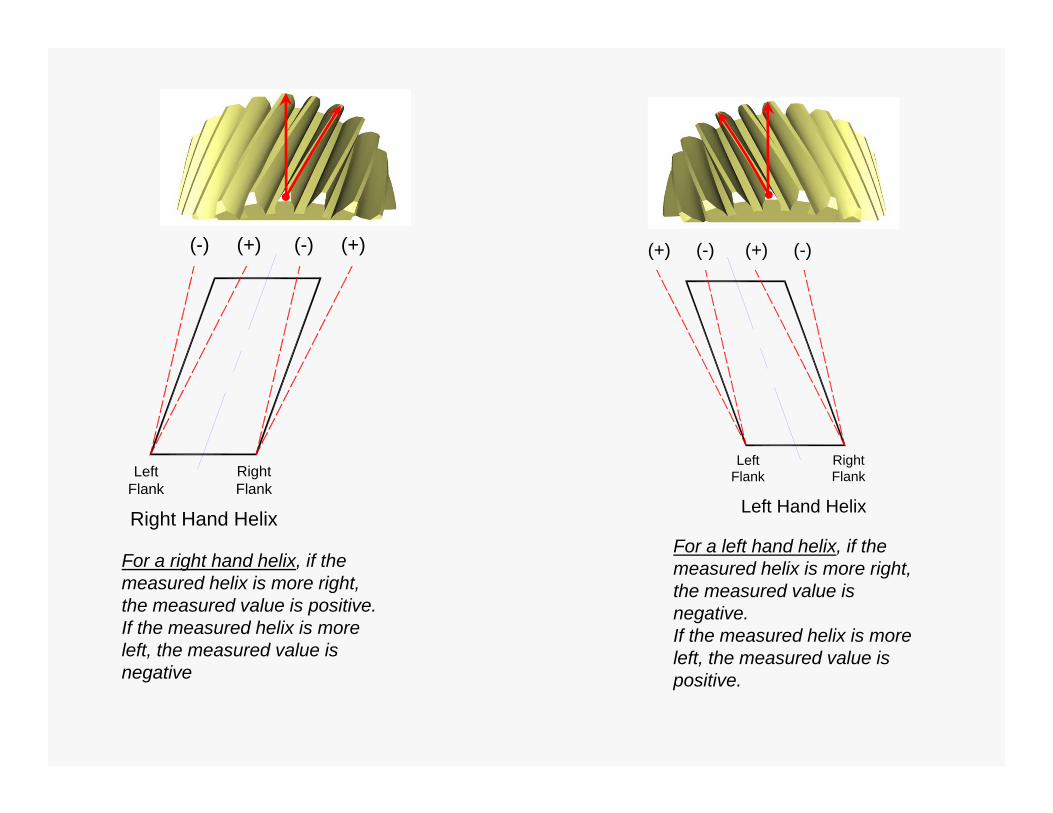
LeftFlank
RightFlank
(-) (+) (-) (+)
Right Hand Helix
LeftFlank
RightFlank
(+) (-) (+) (-)
Left Hand Helix
For a right hand helix, if the measured helix is more right, the measured value is positive.If the measured helix is more left, the measured value is negative
For a left hand helix, if the measured helix is more right, the measured value is negative.If the measured helix is more left, the measured value is positive.

Helix Variation

Helix Traces with Variation

Trouble Guide-Hobbing
VARIATION• Individual
tooth traces are not parallel to each other
• Axial runout of clamping fixture
• Damage to locating face
• Chip buildup
NOT Good
Good Lead
CausesWhy
• OFF HELIX• Individual
tooth traces parallel but leaning
• Slippage of part• Fixture alignment• Dull hob cutter

Profile Inspection

Profile Test
Involute Profile Test
Test Results

Involute Inspection with Error -Tangent to Base Circle
Rotary Motion
Base Circle Diameter
Perfect Trace
Error

Tooth #1

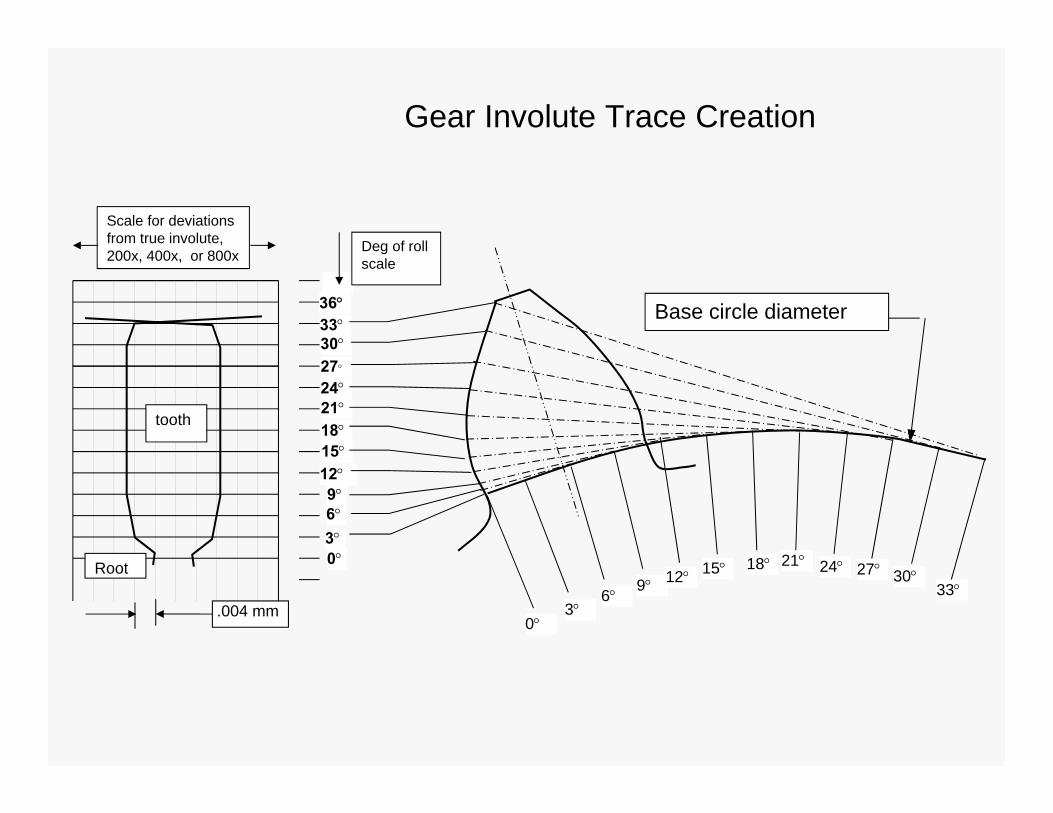
Gear Involute Trace Creation
0
69
1215
3
242118
3027
3633
36
0
918 21 24 27 3012 15
33
Scale for deviations from true involute, 200x, 400x, or 800x Deg of roll
scale
.004 mm
Base circle diameter
tooth
Root
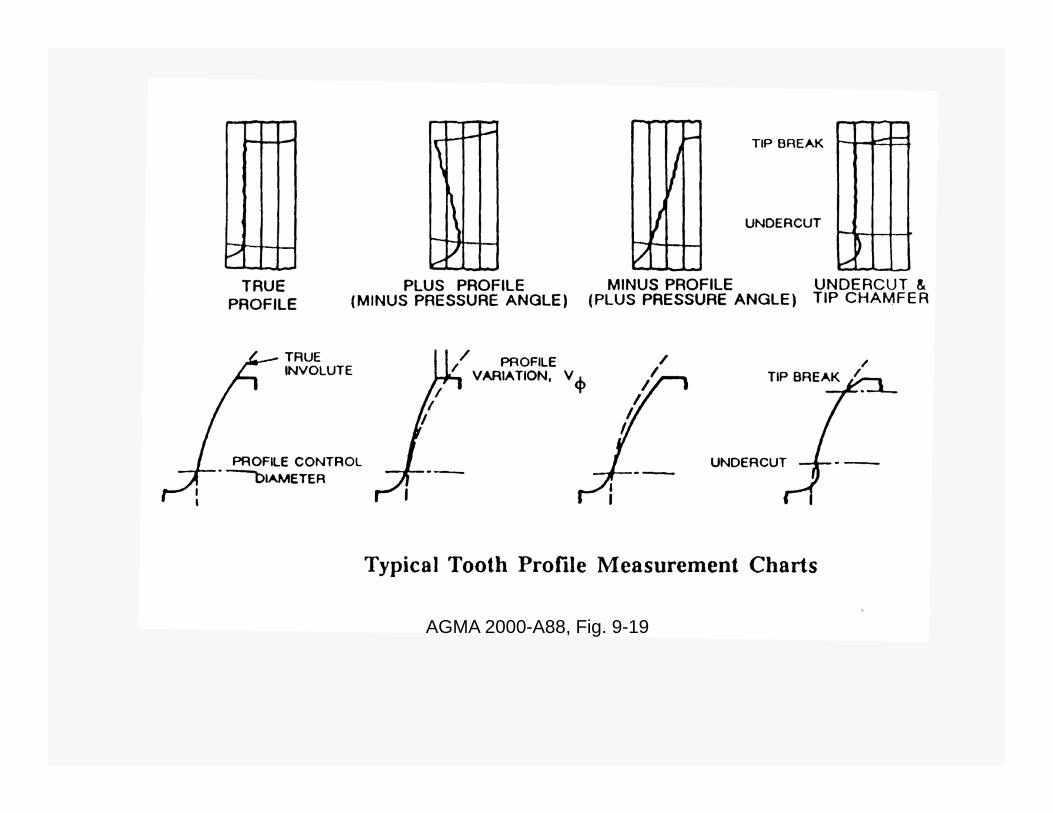
AGMA 2000-A88, Fig. 9-19

Profile
F = Total deviation
fH = Slope deviation
ff = Form deviation
Helix
Fß = Total deviation
fHß = Slope deviation
ffß = Form deviation
Trace Characteristics Evaluated

Helix Slope Deviation (fHβ)Helix slope deviation is the amount of deviation from a nominal helix over the evaluation range.
(From AGMA + ANSI 2015-1-A01)

Helix Form Deviation (ffβ)Helix form deviation is the divergence from a best fit curve along the helix.
(From AGMA + ANSI 2015-1-A01)
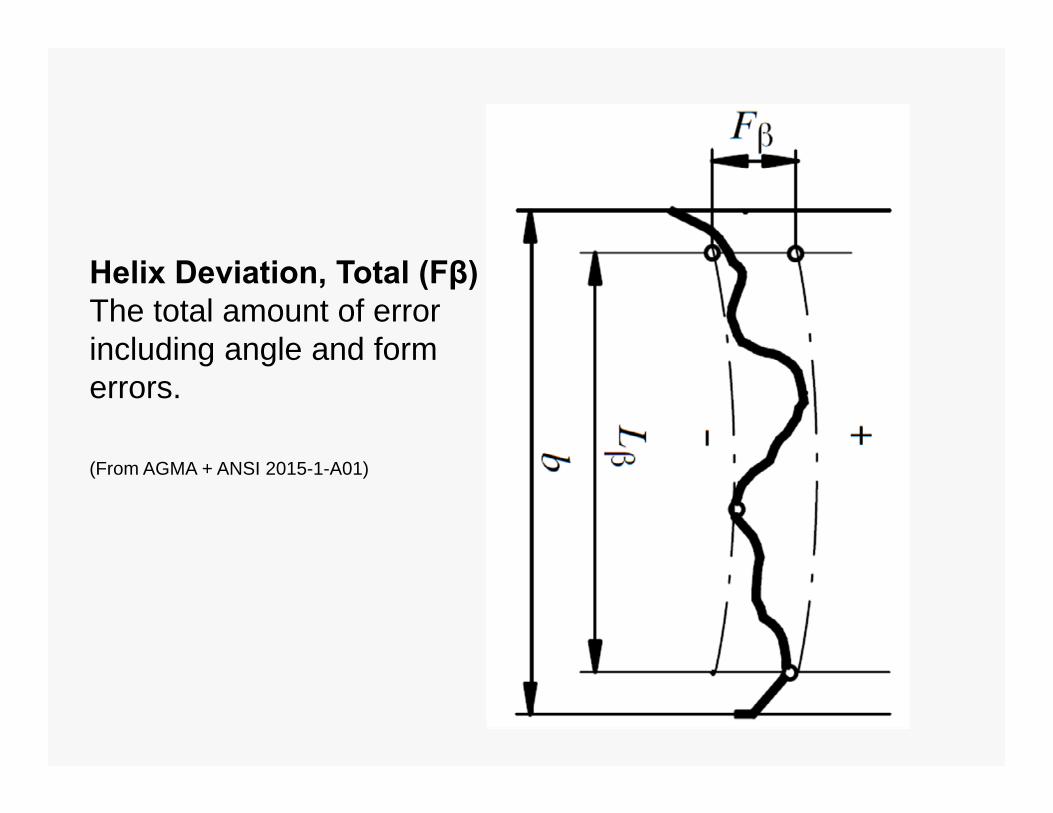
Helix Deviation, Total (Fβ)The total amount of error including angle and form errors.
(From AGMA + ANSI 2015-1-A01)

Helix Crown (Cβ)The amount of material above the fitted angle error line to the highest point of the fitted curve.
(Not part of AGMA 2015)
C
eval
uatio
n ra
nge
+
Helix Crowning
End ofevaluation
SAP
β

Profile Slope Deviation (fH)Profile slope deviation is the amount of deviation from a nominal involute profile over the evaluation range.
(From AGMA + ANSI 2015-1-A01)
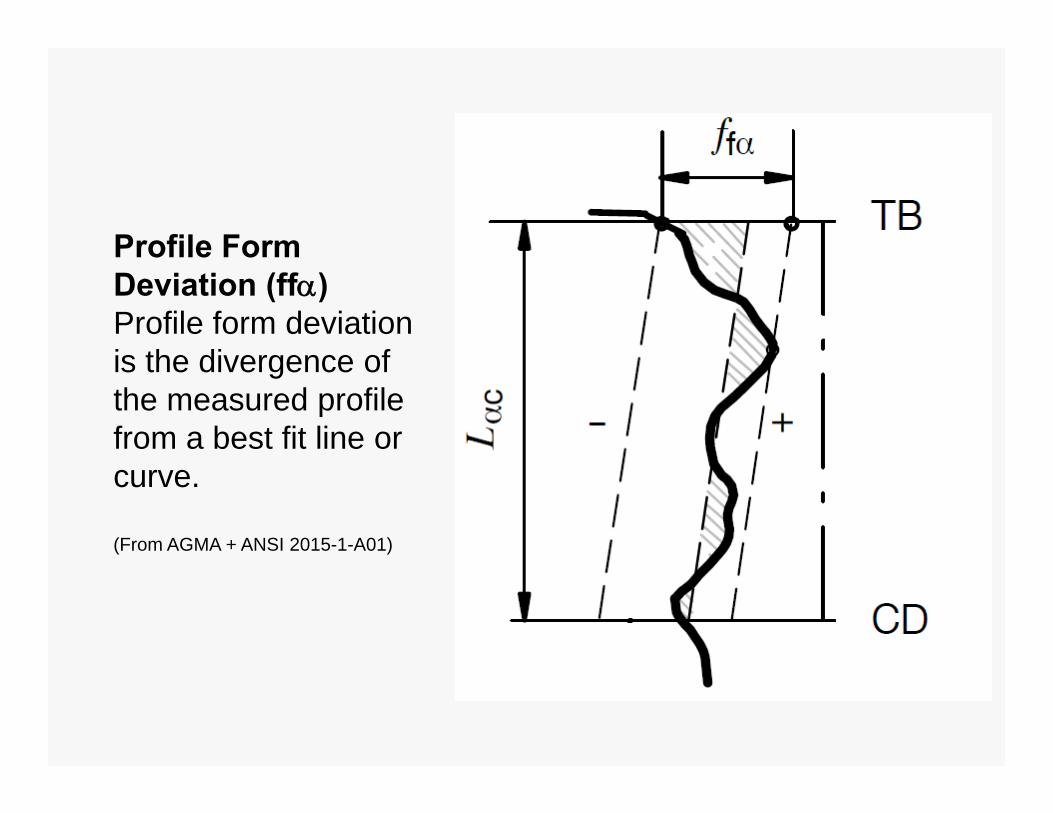
Profile Form Deviation (ff)Profile form deviation is the divergence of the measured profile from a best fit line or curve.
(From AGMA + ANSI 2015-1-A01)

Profile Deviation, Total (F)The total amount of error including slope and form errors.
(From AGMA + ANSI 2015-1-A01)

Profile Barreling (C)Profile barreling is the distance from the best fit curve to the slope deviation line. This is sometimes called involute crown.
(Not part of AGMA 2015)
C
eval
uatio
n ra
nge
(L )
+
Profile barreling
End ofevaluation
SAP

OD Variation
from Runout

Relocate part on inspection arbor
American Gear Manufacturers Association
Don’t Miss the Next AGMA Webinar
June 7, 20121:00‐2:30 PM Eastern
Analytical Gear Chart Interpretation: Solving Manufacturing ProblemsDwight SmithPresident, Cole Mfg. Systems, Inc.
Picking up from Part One, this webinar reviews chart interpretation and applies inspection data to understand the causes and cures of manufacturing errors. Many chart examples are used to understand cause and effect.

American Gear Manufacturers Association
AGMA 2012 ‐ Education Calendar
January 24-26 Gearbox CSI: Forensic Analysis of Gear & Bearing Failures, Concordville, PA
April 16-20 Basic Training for Gear Manufacturing, Chicago, IL
May 15-17 Gear Materials - Selection, Metallurgy, Heat Treatment, and Quality Control, Milwaukee, WI
June 11-13 Gear Failure Analysis, Big Sky, MT
June 19-21 Gearbox System Design: The Rest of The Story…Everything But The Gears and Bearings,Clearwater Beach, FL
Sept 17-19 Gear Failure Analysis, Big Sky, MT
Oct 1-5 Basic Training for Gear Manufacturing, Chicago, IL
Nov 13-15 Gear Manufacturing & Inspection ― Methods, Practices, Application & Interpretation for the Design Engineer, Las Vegas, NV - MM
Dec 4-6 Detailed Gear Design – Beyond Simple Service Factors (Not for the Faint-Hearted! Alexandria, VA
Visit www.agma.org for full details and registration.

Certifi cate of Participation
Th e American Gear Manufacturers Association
certifi es that
has attended the AGMA Webinar
Analytical Gear Chart Interpretation: Reading Between the Lines
Presented by: Dwight Smith, President of Cole Manufacturing Systems, Inc.
May 10, 2012 1.5 hours
A M E R I C A N G E A R M A N U F A C T U R E R S A S S O C I A T I O N