Embed Size (px)
Citation preview
7/23/2019 Al Azraq Ingegneria Chimica Dei Materiali e Della Produzione
http://slidepdf.com/reader/full/al-azraq-ingegneria-chimica-dei-materiali-e-della-produzione 1/419
U NIVERSITY OF NAPLES FEDERICO II
DEPARTMENT OF MATERIALS AND PRODUCTION E NGINEERING
DOCTORATE PROGRAMMES IN CHEMICAL, MATERIALS AND
PRODUCTION E NGINEERING
PhD Projects on
Intelligent Technologies and Systems for Production Automation
XIX CYCLE
PhD THESIS
Numerical Simulation of Metal Sheet Plastic Deformation
Processes through Finite Element Method
SUPERVISOR PHD CANDIDATE
PROF. R OBERTO TETI ARCH. AL AZRAQ SOLIMAN
MOHAMMED SULIMAN
CO-SUPERVISOR
PROF. ULF E NGEL
PHD PROGRAMME COORDINATOR
PROF. NINO GRIZZUTI
ACADEMIC YEAR 2005-2006
7/23/2019 Al Azraq Ingegneria Chimica Dei Materiali e Della Produzione
http://slidepdf.com/reader/full/al-azraq-ingegneria-chimica-dei-materiali-e-della-produzione 2/419
U NIVERSITÀ DEGLI STUDI DI NAPOLI FEDERICO IIDIPARTIMENTO I NGEGNERIA DEI MATERIALI E DELLA PRODUZIONE
DOTTORATO DI RICERCA IN I NGEGNERIA CHIMICA, DEI MATERIALI E DELLA PRODUZIONE
Indirizzo in
Tecnologie e Sistemi Intelligenti per l’Automazione della Produzione
XIX CICLO
TESI DI DOTTORATO
Simulazione Numerica dei Processi di Deformazione Plasticadelle Lamiere Attraverso il Metodo degli Elementi Finiti
TUTOR DOTTORANDO
PROF. R OBERTO TETI ARCH. AL AZRAQ SOLIMAN
MOHAMMED SULIMAN
CO-TUTOR
PROF. ULF E NGEL
COORDINATORE
PROF. NINO GRIZZUTI
Anno Accademico 2005-2006

7/23/2019 Al Azraq Ingegneria Chimica Dei Materiali e Della Produzione
http://slidepdf.com/reader/full/al-azraq-ingegneria-chimica-dei-materiali-e-della-produzione 3/419
NUMERICAL SIMULATION OF
METAL SHEET PLASTIC DEFORMATION PROCESSES THROUGH FINITE ELEMENT METHODS
7/23/2019 Al Azraq Ingegneria Chimica Dei Materiali e Della Produzione
http://slidepdf.com/reader/full/al-azraq-ingegneria-chimica-dei-materiali-e-della-produzione 4/419
Intoduction Al Azraq Soliman M.S
Numerical Simulation of Metal Sheet Plastic Deformation Page 1through Finite Element Method
INTRUDUCTION
Preface
One of the important tasks for the 21st century is the maintaining of soundecology. The reduction of the burden on the environment is an inevitabletask assigned to industry. In recent years, it has become one of the mostimportant objective for automobiles to make the reduction in weight of autobodies compatible with the improvement of crashworthiness, particularly withthe aim of reducing CO2 gas emissions by improving fuel consumption. Tosatisfy these demands, a new grade of steel, the Advanced High StrengthSteel (AHSS), has been developed, pushing the boundaries of what waspreviously possible with conventional steel grades.
Several new commercialized and near-commercialized advanced high-strength steels (AHSS) that exhibit high strength and enhanced formabilityare being offered around the world. These steels have the potential to affectcost and weight savings while improving performance.
A major negative consequence of using these new materials is the lowformability and the elevated springback proportion due to their high strengthvalues. Springback phenomenon has capital importance in situations wheredimensional precision is a vital requirement, as the final measures of thecomponent are altered due to changes in the strains, produced by elasticrecovery of the material. Engineers turned to forming simulation in order to
closely investigate and try to minimize this problem.The aim of industrial application of the simulation for drawing processes
is to replace the physical tryout by the computer tryout, with the intention oftime/cost reduction and quality improvement in the die design/manufacturingcycle.
In the past, a number of analyzing methods have been developed andapplied to various forming processes. Some of these methods are the slabmethod, the slip-line field method, the viscoplasticity method, upper andlower bound techniques and Hills general method. These methods have beenuseful in qualitatively predicting forming loads, overall geometry changes of
the deformed blank and material flow and in determining approximateoptimum process conditions.However, a more accurate determination of the effects of various
process parameters in the drawing process has become possible onlyrecently, when the finite element method (FEM) was developed for theseanalyses.
The FEM codes for sheet metal forming may be classified accordingly totheir type of integration: implicit or explicit. Their main solution proceduresare the dynamic explicit and the static implicit ones. The principal analysismethods used in sheet metal forming simulation are based on shell,membrane and continuum elements.
7/23/2019 Al Azraq Ingegneria Chimica Dei Materiali e Della Produzione
http://slidepdf.com/reader/full/al-azraq-ingegneria-chimica-dei-materiali-e-della-produzione 5/419
Intoduction Al Azraq Soliman M.S
Numerical Simulation of Metal Sheet Plastic Deformation Page 2through Finite Element Method
In the sheet metal forming process a major factor preventing accuratefinal part dimensions is springback in the material. Springback is thegeometric difference between the part in its fully loaded condition, i.e.conforming to the tooling geometry, and when the part is in its unloaded,free state.
In the automotive sector FEM methods for the metal forming analysisare already used, particularly explicit codes like LS-DYNA (LSTC) andPAMSTAMP (EASY) and implicit codes like AUTOFORM. Explicit solvers can beused to simulate dynamic analysis and allow to evaluate wide deformations(like in the drawing process); implicit solvers are suitable to perform a staticanalysis (like springback). So, in the metal forming process simulation of carbody components, a final implicit static step may be used to obtain a staticspringback solution, after the tool is removed from the die. In this way
springback solution begins from stress and strain state of the formingsimulation without numerical dynamic oscillations.
In this project, the new class of steels rapresented by the AHSS grade isdescribed in detail. Its forming methods are also mentioned and explained.Special attention is given to the springback phenomenon, characterizing itand explaining the several variables that influence its proportion.In the industrial environment, in order to save time, money and resources,physical tryouts have been replaced by virtual tryouts. The codes andelements normally used in these types of simulation programs, as well astheir common approaches, are presented and analysed.
7/23/2019 Al Azraq Ingegneria Chimica Dei Materiali e Della Produzione
http://slidepdf.com/reader/full/al-azraq-ingegneria-chimica-dei-materiali-e-della-produzione 6/419
Intoduction Al Azraq Soliman M.S
Numerical Simulation of Metal Sheet Plastic Deformation Page 3through Finite Element Method
Organisation of the Thesis.
This thesis is organized in Four principal sections as it follows :
Section I
The first section contains the introduction, the analysis and study the type ofwork materials, the plastic deformation process, the springbackphenomenon, the Finite element method, and numerical simulation of plasticdeformation process.
Section II
In this section the numerical simulations of two applications using the ANSYS-LS DYNA Software have been performed.
The first application consists of an impact test by steel sphare on analluminium sheet with the objective of determining the influence of thesheet thickness sheet on the constraints and the displacements, when theplasticization of the sheet happens, when the failure of the sheet happens.
The main objective of the Second application is to achieve a
sufficiently good simulation of GLARE behaviour when it suffers an impactusing the ANSYS LS DYNA Software. The main application of GLARE is in theaerospace industry where it is used in some parts of the aircraft fuselage.Hence, GLARE needs to be resistant to low velocity impacts: bird strike,baggage and ground handling equipment, runway debris, etc. These testsare time consuming, expensive and difficult to perform, so the ability tosimulate these tests is of high importance.
Section III
In this third section the numerical simulations of three applicationsusing the AUTOFORM Software have been performed.
The First application regards the forming simulation of two automobilecomponents (a lateral longeron and a deck lid inner body panel) and wasperformed using the incremental approach of the AutoForm finite elementmethod code. The results obtained were then analysed under several processparameters.
The Second application regardes a test case realized in AutoForm 4.04
Incremental code for a simple profile stamping simulation with angle
7/23/2019 Al Azraq Ingegneria Chimica Dei Materiali e Della Produzione
http://slidepdf.com/reader/full/al-azraq-ingegneria-chimica-dei-materiali-e-della-produzione 7/419
Intoduction Al Azraq Soliman M.S
Numerical Simulation of Metal Sheet Plastic Deformation Page 4through Finite Element Method
variations in the component vertical side walls using two different AdvancedHigh Strength Steel (AHSS) materials. An incremental simulation wasperformed for a stamping process consisting of three stages: forming,trimming and springback. The most important criteria to evaluate the
stamping process success are the following result variables: formability,thinning and springback (material displacement and angular displacement).
The Third application regards a test case of stamping simulation of alateral longeron of a Fiat car. Eleven different profiles with differing angularvariations realized with DP600 material were considered.
The study was carried out by taking to account the limits proposed byELASIS, Fiat research centre, with the objective to improve the accuracy ofthe springback calculations through the use of the numerical simulation of
the complete stamping cycle as well as to develop and verify methods toeliminate the effects of sprigback with particular attention to the applicationof the new AHSS steel.
Section IV
Finally, many details of the research methods and research results andthe corresponding discussions are described in the three publicationsenclosed.
In the First publication the FEM analysis of AHSS car body drawingprocess and springback has been analyzed.
In the Second publication the calcolation of the springback in aprofile realized with different material, first in Dp600 after in Trip800.
The determination of the springback difference in the profile, realized withdifferent material, is the principal objective.
In the Third publication, the springback phenomenon in eleven
different profiles with differing angular variations, realized with DP600material. The principal objective is the search for the best inclination of theprofile for the best forming with the least springback.
7/23/2019 Al Azraq Ingegneria Chimica Dei Materiali e Della Produzione
http://slidepdf.com/reader/full/al-azraq-ingegneria-chimica-dei-materiali-e-della-produzione 8/419
Acknowledgements
The present PhD thesis work was carried out with support by the following projects:
• EC FP6 Network of Excellence on Innovative Production Machines and
Systems (I*PROMS)
• EC FP6 Network of Excellence on Multi-Material micro Manufacture (4M)
•
Campania Region, Centre of Competence on Transportation (CRdC Trasporti)
• ELASIS Project on Numerical Simulation of Sheet Metal Stamping in the
Automotive Sector

7/23/2019 Al Azraq Ingegneria Chimica Dei Materiali e Della Produzione
http://slidepdf.com/reader/full/al-azraq-ingegneria-chimica-dei-materiali-e-della-produzione 9/419
Section I.A
Materials: Automotive Steels
7/23/2019 Al Azraq Ingegneria Chimica Dei Materiali e Della Produzione
http://slidepdf.com/reader/full/al-azraq-ingegneria-chimica-dei-materiali-e-della-produzione 10/419
Section I
I.A . Materials: Automotive Steels Al Azraq Soliman M.S
Numerical Simulation of Metal Sheet Plastic Deformation Page 5through Finite Element Method
Section I.A
Materials: Automotive Steels
I.A.1 - Introduction
What is steel?
Steel is an alloy of iron and carbon containing less than 2% carbon and
1% manganese and small amounts of silicon, phosphorus, sulphur andoxygen. Steel is the most important engineering and construction material inthe world. It is used in every aspect of our lives, from automotivemanufacture to construction products, from steel toecaps for protectivefootwear to refrigerators and washing machines and from cargo ships to thefinest scalpel for hospital surgery.
History
Steel was invented by a British inventor called Henry Bessemer in 1856.
He founded the Bessemer Steel Company in Sheffield, England, but up to1859 the company made a loss. By the time the patent ran out in 1870 hehad made more than 1 million pounds sterling. Steel is still produced usingtechnology based upon the Bessemer Process of blowing air through moltenpig iron to oxidise the material and separate impurities.
I.A .1.1 - Characteristics
Flat rolled steels are versatile materials. They provide strength andstiffness with favourable mass to cost ratios, and they allow high speed
fabrication. In addition, they exhibit excellent corrosion resistance whencoated, high energy absorption capacity, good fatigue properties, high workhardening rates, aging capability, and excellent paintability, which arerequired by automotive applications. These characteristics, plus theavailability of high strength low alloy (HSLA) and alloy steels in a wide varietyof sizes, strength levels, chemical compositions, surface finishes, with andwithout various organic and inorganic coatings, have made sheet steel thematerial of choice for the automotive industry.
7/23/2019 Al Azraq Ingegneria Chimica Dei Materiali e Della Produzione
http://slidepdf.com/reader/full/al-azraq-ingegneria-chimica-dei-materiali-e-della-produzione 11/419
Section I
I.A . Materials: Automotive Steels Al Azraq Soliman M.S
Numerical Simulation of Metal Sheet Plastic Deformation Page 6through Finite Element Method
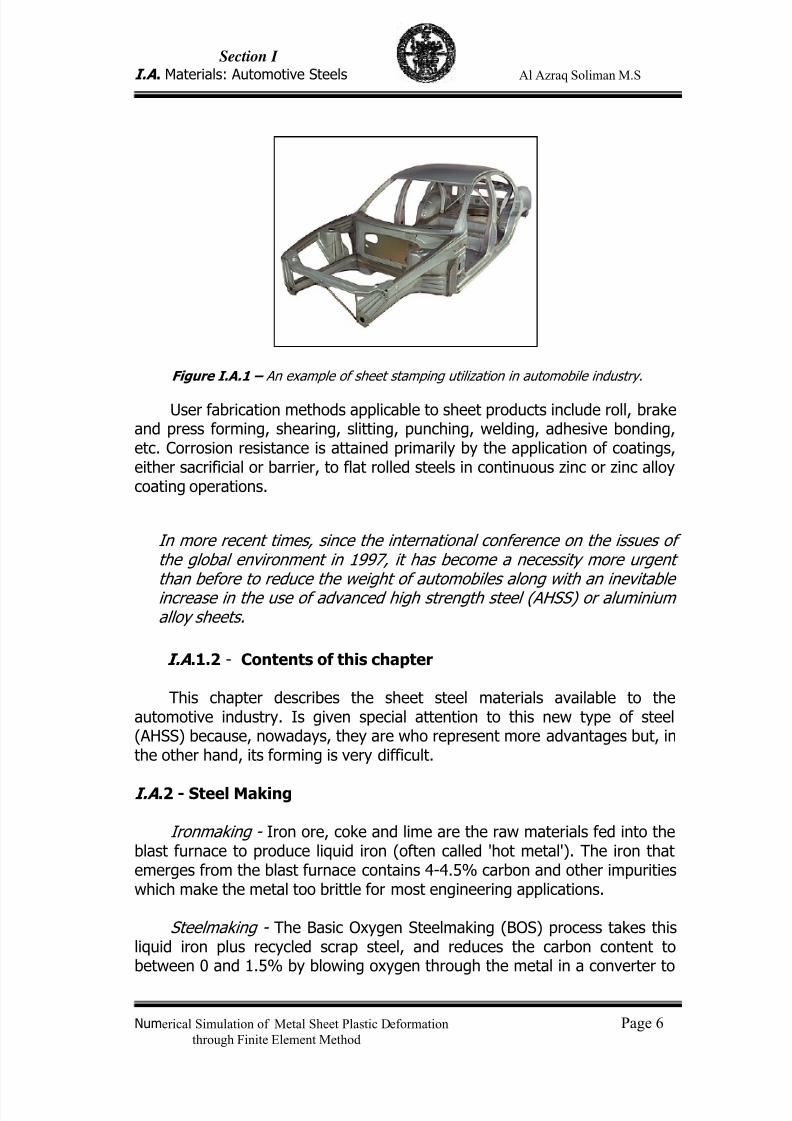
Figure I.A.1 – An example of sheet stamping utilization in automobile industry.
User fabrication methods applicable to sheet products include roll, brakeand press forming, shearing, slitting, punching, welding, adhesive bonding,etc. Corrosion resistance is attained primarily by the application of coatings,either sacrificial or barrier, to flat rolled steels in continuous zinc or zinc alloycoating operations.
In more recent times, since the international conference on the issues ofthe global environment in 1997, it has become a necessity more urgentthan before to reduce the weight of automobiles along with an inevitableincrease in the use of advanced high strength steel (AHSS) or aluminiumalloy sheets.
I.A .1.2 - Contents of this chapter
This chapter describes the sheet steel materials available to theautomotive industry. Is given special attention to this new type of steel(AHSS) because, nowadays, they are who represent more advantages but, inthe other hand, its forming is very difficult.
I.A .2 - Steel Making
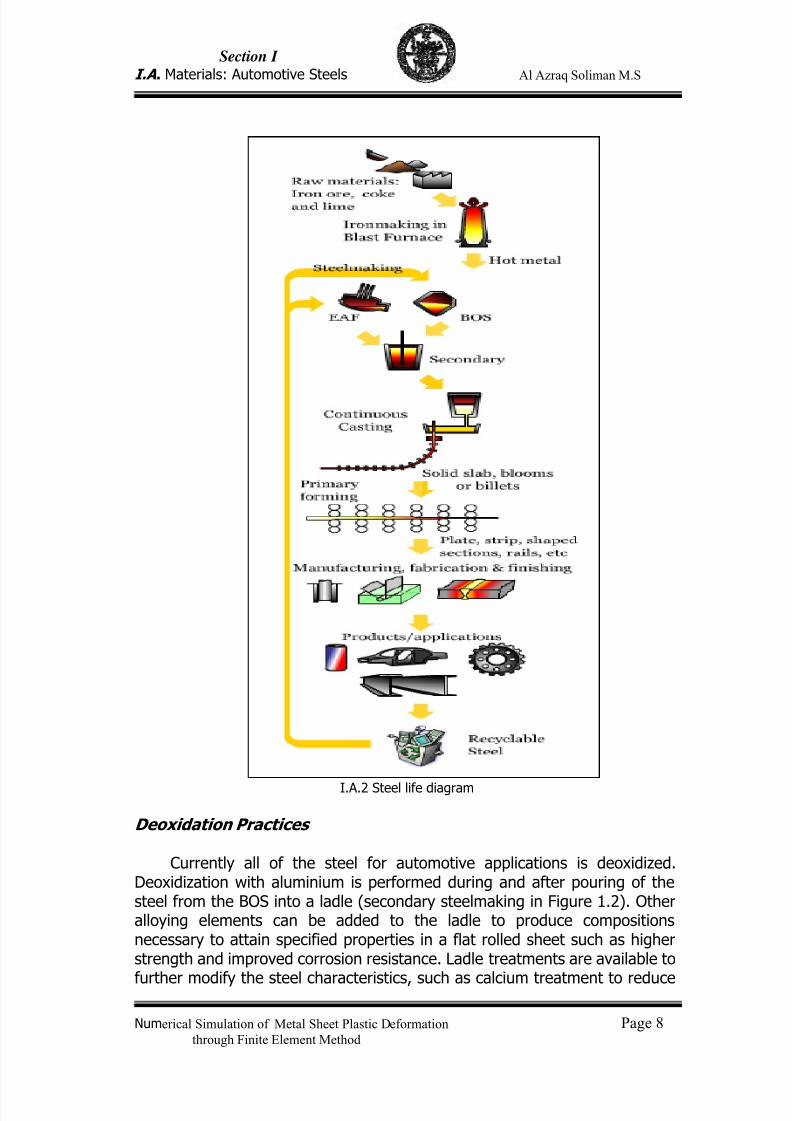
Ironmaking - Iron ore, coke and lime are the raw materials fed into theblast furnace to produce liquid iron (often called 'hot metal'). The iron thatemerges from the blast furnace contains 4-4.5% carbon and other impuritieswhich make the metal too brittle for most engineering applications.
Steelmaking - The Basic Oxygen Steelmaking (BOS) process takes thisliquid iron plus recycled scrap steel, and reduces the carbon content tobetween 0 and 1.5% by blowing oxygen through the metal in a converter to

7/23/2019 Al Azraq Ingegneria Chimica Dei Materiali e Della Produzione
http://slidepdf.com/reader/full/al-azraq-ingegneria-chimica-dei-materiali-e-della-produzione 12/419
Section I
I.A . Materials: Automotive Steels Al Azraq Soliman M.S
Numerical Simulation of Metal Sheet Plastic Deformation Page 7through Finite Element Method
produce molten steel. Alternatively, the Electric Arc Furnace (EAF) is used toremelt scrap iron and steel.
Secondary steelmaking - processes are then applied to make fineadjustments to the steel composition, temperature and cleanness.
Casting - The steel is then continuously cast into solid slabs, blooms orbillets. Continuous casting has largely replaced traditiona lingot casting.
Primary Forming - Primary forming operations, such as hot rolling arethose which are applied to continuous cast slabs, blooms and billets. Themain purpose is continuous cast slabs, blooms and billets .
7/23/2019 Al Azraq Ingegneria Chimica Dei Materiali e Della Produzione
http://slidepdf.com/reader/full/al-azraq-ingegneria-chimica-dei-materiali-e-della-produzione 13/419
Section I
I.A . Materials: Automotive Steels Al Azraq Soliman M.S
Numerical Simulation of Metal Sheet Plastic Deformation Page 8through Finite Element Method
I.A.2 Steel life diagram
Deoxidation Practices
Currently all of the steel for automotive applications is deoxidized.Deoxidization with aluminium is performed during and after pouring of thesteel from the BOS into a ladle (secondary steelmaking in Figure 1.2). Otheralloying elements can be added to the ladle to produce compositionsnecessary to attain specified properties in a flat rolled sheet such as higherstrength and improved corrosion resistance. Ladle treatments are available to
further modify the steel characteristics, such as calcium treatment to reduce
7/23/2019 Al Azraq Ingegneria Chimica Dei Materiali e Della Produzione
http://slidepdf.com/reader/full/al-azraq-ingegneria-chimica-dei-materiali-e-della-produzione 14/419
Section I
I.A . Materials: Automotive Steels Al Azraq Soliman M.S
Numerical Simulation of Metal Sheet Plastic Deformation Page 9through Finite Element Method
sulphur and modify sulphides, gas stirring to improve uniformity of the alloyadditions, or vacuum degassing to lower carbon levels (<0.01%). Additionsof titanium and/or columbium in a vacuum degassed heat are used toproduce interstitial free (IF) stabilized steels.
Main shape defects after Primary forming operations
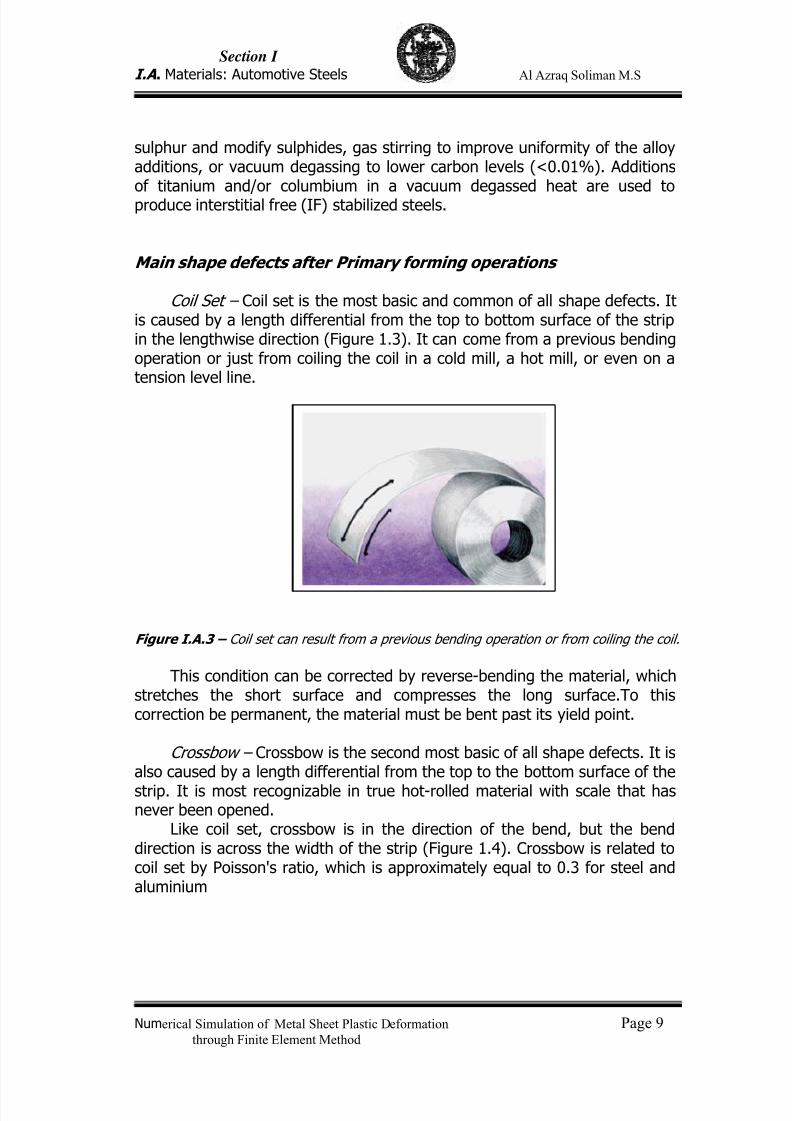
Coil Set – Coil set is the most basic and common of all shape defects. Itis caused by a length differential from the top to bottom surface of the stripin the lengthwise direction (Figure 1.3). It can come from a previous bendingoperation or just from coiling the coil in a cold mill, a hot mill, or even on atension level line.
Figure I.A.3 – Coil set can result from a previous bending operation or from coiling the coil.
This condition can be corrected by reverse-bending the material, whichstretches the short surface and compresses the long surface.To thiscorrection be permanent, the material must be bent past its yield point.
Crossbow – Crossbow is the second most basic of all shape defects. It isalso caused by a length differential from the top to the bottom surface of the
strip. It is most recognizable in true hot-rolled material with scale that hasnever been opened.
Like coil set, crossbow is in the direction of the bend, but the benddirection is across the width of the strip (Figure 1.4). Crossbow is related tocoil set by Poisson's ratio, which is approximately equal to 0.3 for steel andaluminium
7/23/2019 Al Azraq Ingegneria Chimica Dei Materiali e Della Produzione
http://slidepdf.com/reader/full/al-azraq-ingegneria-chimica-dei-materiali-e-della-produzione 15/419
Section I
I.A . Materials: Automotive Steels Al Azraq Soliman M.S
Numerical Simulation of Metal Sheet Plastic Deformation Page 10through Finite Element Method
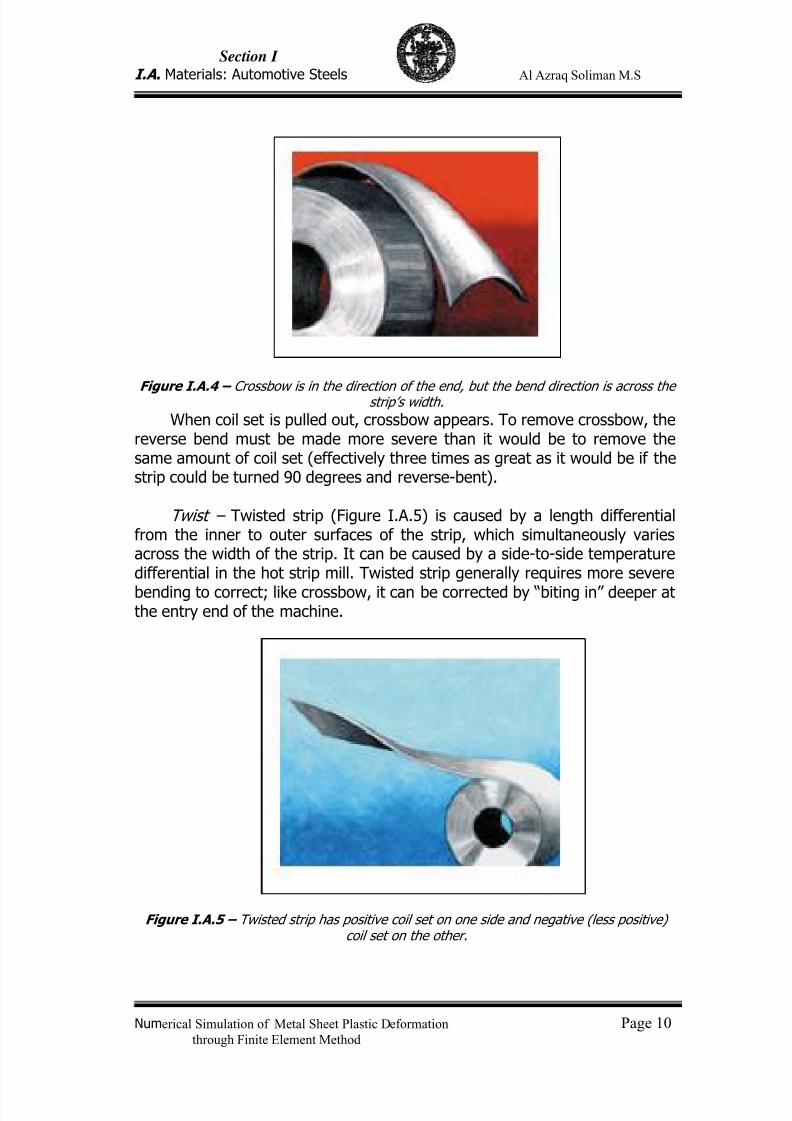
Figure I.A.4 – Crossbow is in the direction of the end, but the bend direction is across thestrip’s width.
When coil set is pulled out, crossbow appears. To remove crossbow, thereverse bend must be made more severe than it would be to remove thesame amount of coil set (effectively three times as great as it would be if thestrip could be turned 90 degrees and reverse-bent).
Twist – Twisted strip (Figure I.A.5) is caused by a length differentialfrom the inner to outer surfaces of the strip, which simultaneously variesacross the width of the strip. It can be caused by a side-to-side temperaturedifferential in the hot strip mill. Twisted strip generally requires more severe
bending to correct; like crossbow, it can be corrected by “biting in” deeper atthe entry end of the machine.
Figure I.A.5 – Twisted strip has positive coil set on one side and negative (less positive)coil set on the other.
7/23/2019 Al Azraq Ingegneria Chimica Dei Materiali e Della Produzione
http://slidepdf.com/reader/full/al-azraq-ingegneria-chimica-dei-materiali-e-della-produzione 16/419
Section I
I.A . Materials: Automotive Steels Al Azraq Soliman M.S
Numerical Simulation of Metal Sheet Plastic Deformation Page 11through Finite Element Method
Twisted strip has positive coil set on one side and negative (lesspositive) coil set on the other. This type of defect is readily corrected by thedeep mesh of the machine's entry end. This deep mesh turns both edges ofthe coil to either positive or negative coil set and then gradually reduces thecoil to flat as it proceeds out through the tapered mesh of the machine.
I.A .3 – Types and Chemistry of Steel
Sheet steels used in the automotive industry are available in thefollowing types:
• Commercial Quality• Low Carbon – Drawing quality
• IF stabilized – Deep drawing quality• Dent Resistant• Bake Hardenable• Non-Bake Hardenable• High Strength Low Alloy• High Strength Solution Strengthened• Ultra High Strength
- TRIP- Dual Phase- Complex Phase
- Martensitic• Laminated Steels• Stainless Steels
The low carbon steels are generally less than 0.13% carbon, 0.60%manganese, 0.030% phosphorus, 0.030% sulphur, and greater than 0.02%aluminium. The drawing quality steels have carbon level in the 0.02 to0.04% range. The Interstitial free (IF) steels are stabilized with Ti, Cb, or Cb+ Ti, and are normally ultra low carbon (0.005% max). While most IF steelsare produced as drawing quality, solid solution strengthening with P, Mn, and
Si can be utilized to produce a higher strength formable steel (with higher n values and r values). (Point I.A.5.3)
Bake hardenable steels utilize carbon in solution to provide an increasein strength during the paint bake cycle due to carbon strain aging. Thereforethese steels can be produced in a relatively low strength condition and easilyformed into parts. However, after forming and paint baking, a significantlystronger part is produced.
The dent resistant steels contain increased levels of phosphorus (up to0.10%), and possibly manganese and silicon to low carbon steels and IFsteels. The high strength solution strengthened steels contain increased
7/23/2019 Al Azraq Ingegneria Chimica Dei Materiali e Della Produzione
http://slidepdf.com/reader/full/al-azraq-ingegneria-chimica-dei-materiali-e-della-produzione 17/419
Section I
I.A . Materials: Automotive Steels Al Azraq Soliman M.S
Numerical Simulation of Metal Sheet Plastic Deformation Page 12through Finite Element Method
levels of carbon and manganese with the addition of phosphorous and/orsilicon.
The high strength low alloy steels (HSLA) contain the addition of thecarbide forming elements Cb, V, or Ti singularly or in combination to a lowcarbon steel, providing strength through precipitation of fine carbides orcarbonitrides of Cb, Ti, and/or V. Microalloying to these grades does reducethe ductility.
Stainless steels are classified into austenitic, martensitic or ferritic steels.The major divisions are the 300 series steels, with nickel stabilized austenite,and the 400 series, which are nickel free but contain 10% or morechromium. Some of these are hardenable by quenching and tempering. The200 series are special austenitic steels where portions of the nickel arereplaced with manganese and nitrogen. The 500 series are low chromium
steels (4-6%) but with small additions of molybdenum. About AHSS chemistry and other properties we will refer with more
precision in the next points.
I.A .4 – Different Types of Classification
Automotive steels can be defined in several different ways. The first isby metallurgical designation. Common descriptions include low strengthsteels (interstitial free and mild steels), conventional high strength steels(carbon manganese, bake hardenable, isotropic, high strength IF, and high
transformation induced plasticity, complex phase, and martensitic steels).The second classification method is based on one of the mechanical
properties – strength. High Strength Steels (HSS) are defined as those steelswith tensile strengths from 270-700 MPa. Ultra High Strength Steels (UHSS)are defined as steels with tensile strengths greater than 700 MPa.
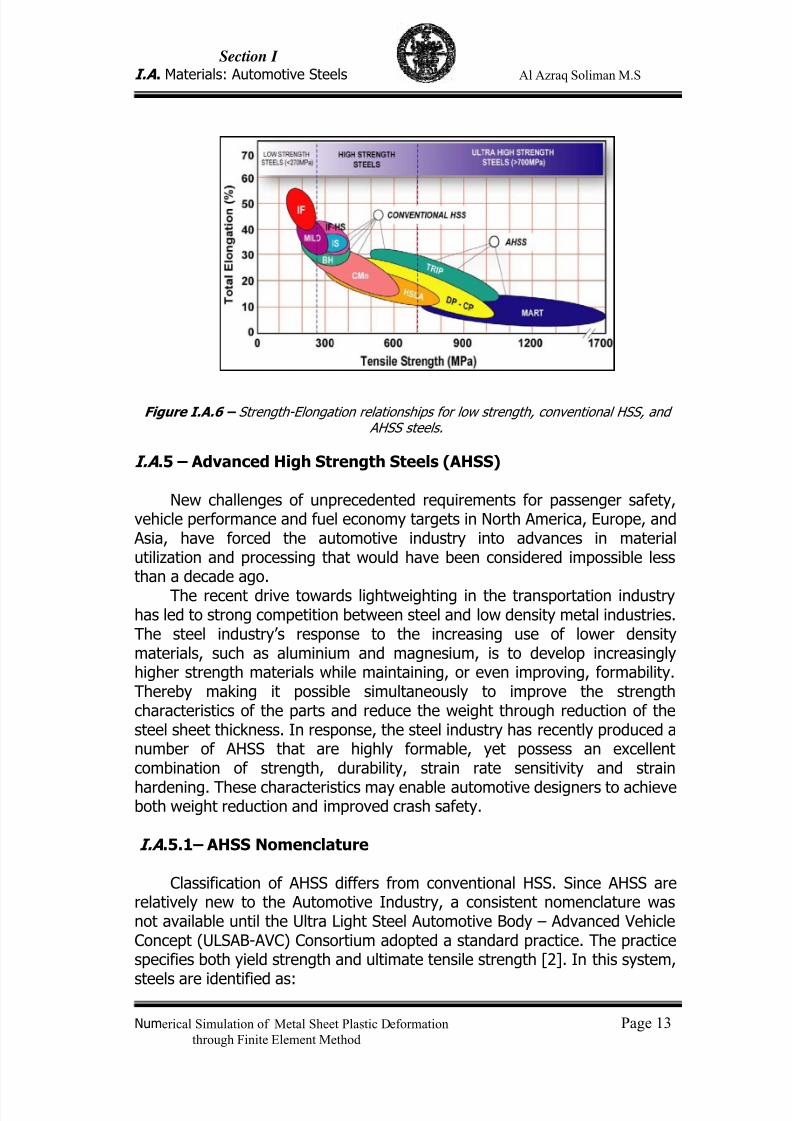
A third classification method uses another of the mechanical properties – total elongation. As an example, Figure 1.6 compares total elongations (asteel property related to formability) for the different steel types [1]. Notethat the tensile strengths of AHSS overlap both the HSS and UHSS range ofstrengths.
7/23/2019 Al Azraq Ingegneria Chimica Dei Materiali e Della Produzione
http://slidepdf.com/reader/full/al-azraq-ingegneria-chimica-dei-materiali-e-della-produzione 18/419
Section I
I.A . Materials: Automotive Steels Al Azraq Soliman M.S
Numerical Simulation of Metal Sheet Plastic Deformation Page 13through Finite Element Method
Figure I.A.6 – Strength-Elongation relationships for low strength, conventional HSS, and AHSS steels.
I.A .5 – Advanced High Strength Steels (AHSS)
New challenges of unprecedented requirements for passenger safety,vehicle performance and fuel economy targets in North America, Europe, and
Asia, have forced the automotive industry into advances in materialutilization and processing that would have been considered impossible lessthan a decade ago.
The recent drive towards lightweighting in the transportation industryhas led to strong competition between steel and low density metal industries.The steel industry’s response to the increasing use of lower densitymaterials, such as aluminium and magnesium, is to develop increasinglyhigher strength materials while maintaining, or even improving, formability.Thereby making it possible simultaneously to improve the strengthcharacteristics of the parts and reduce the weight through reduction of thesteel sheet thickness. In response, the steel industry has recently produced anumber of AHSS that are highly formable, yet possess an excellentcombination of strength, durability, strain rate sensitivity and strain
hardening. These characteristics may enable automotive designers to achieveboth weight reduction and improved crash safety.
I.A .5.1– AHSS Nomenclature
Classification of AHSS differs from conventional HSS. Since AHSS arerelatively new to the Automotive Industry, a consistent nomenclature wasnot available until the Ultra Light Steel Automotive Body – Advanced VehicleConcept (ULSAB-AVC) Consortium adopted a standard practice. The practicespecifies both yield strength and ultimate tensile strength [2]. In this system,
steels are identified as:
7/23/2019 Al Azraq Ingegneria Chimica Dei Materiali e Della Produzione
http://slidepdf.com/reader/full/al-azraq-ingegneria-chimica-dei-materiali-e-della-produzione 19/419
Section I
I.A . Materials: Automotive Steels Al Azraq Soliman M.S
Numerical Simulation of Metal Sheet Plastic Deformation Page 14through Finite Element Method
XX aaa/bbb where, XX = Type of Steelaaa = minimum YS in MPabbb = minimum UTS in MPa.
The types of steels are defined as:DP = Dual PhaseCP = Complex PhaseTRIP = Transformation-Induced PlasticityMart = Martensitic
For example, DP 500/800 designates dual phase steel with 500 MPa
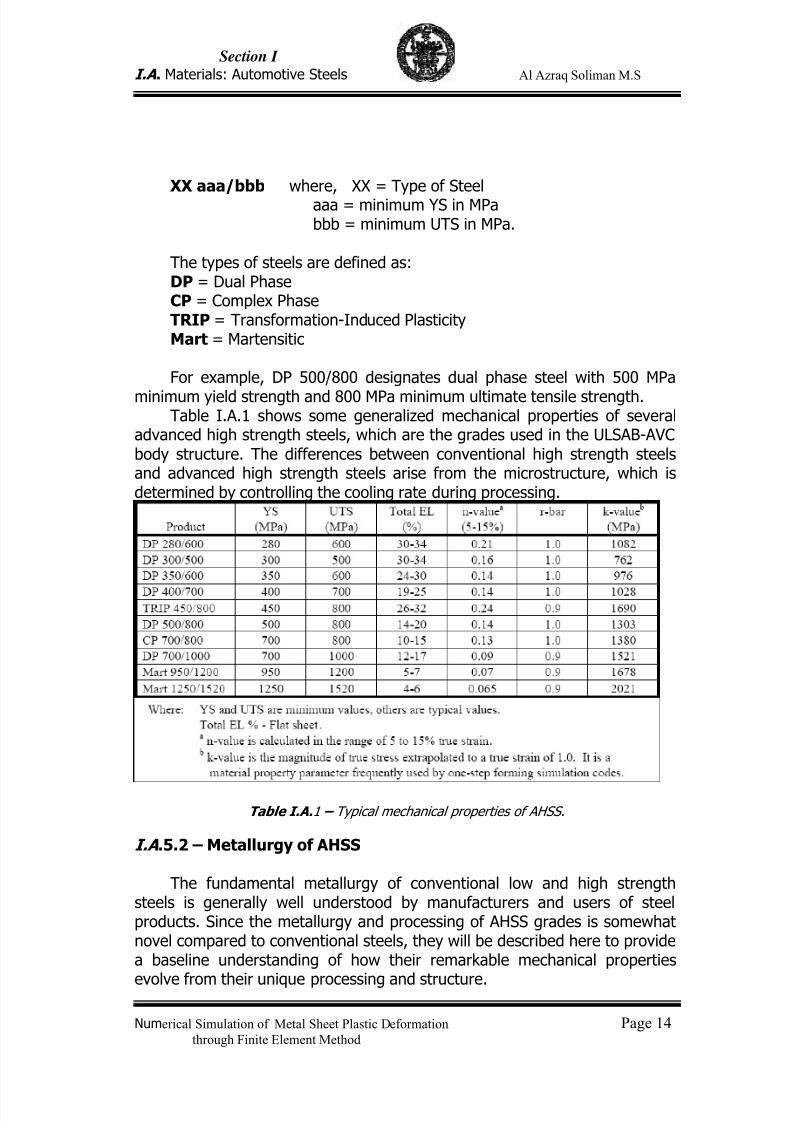
minimum yield strength and 800 MPa minimum ultimate tensile strength.Table I.A.1 shows some generalized mechanical properties of several
advanced high strength steels, which are the grades used in the ULSAB-AVCbody structure. The differences between conventional high strength steelsand advanced high strength steels arise from the microstructure, which isdetermined by controlling the cooling rate during processing.
Table I.A.1 – Typical mechanical properties of AHSS.
I.A .5.2 – Metallurgy of AHSS
The fundamental metallurgy of conventional low and high strengthsteels is generally well understood by manufacturers and users of steelproducts. Since the metallurgy and processing of AHSS grades is somewhatnovel compared to conventional steels, they will be described here to providea baseline understanding of how their remarkable mechanical properties
evolve from their unique processing and structure.
7/23/2019 Al Azraq Ingegneria Chimica Dei Materiali e Della Produzione
http://slidepdf.com/reader/full/al-azraq-ingegneria-chimica-dei-materiali-e-della-produzione 20/419
Section I
I.A . Materials: Automotive Steels Al Azraq Soliman M.S
Numerical Simulation of Metal Sheet Plastic Deformation Page 15through Finite Element Method
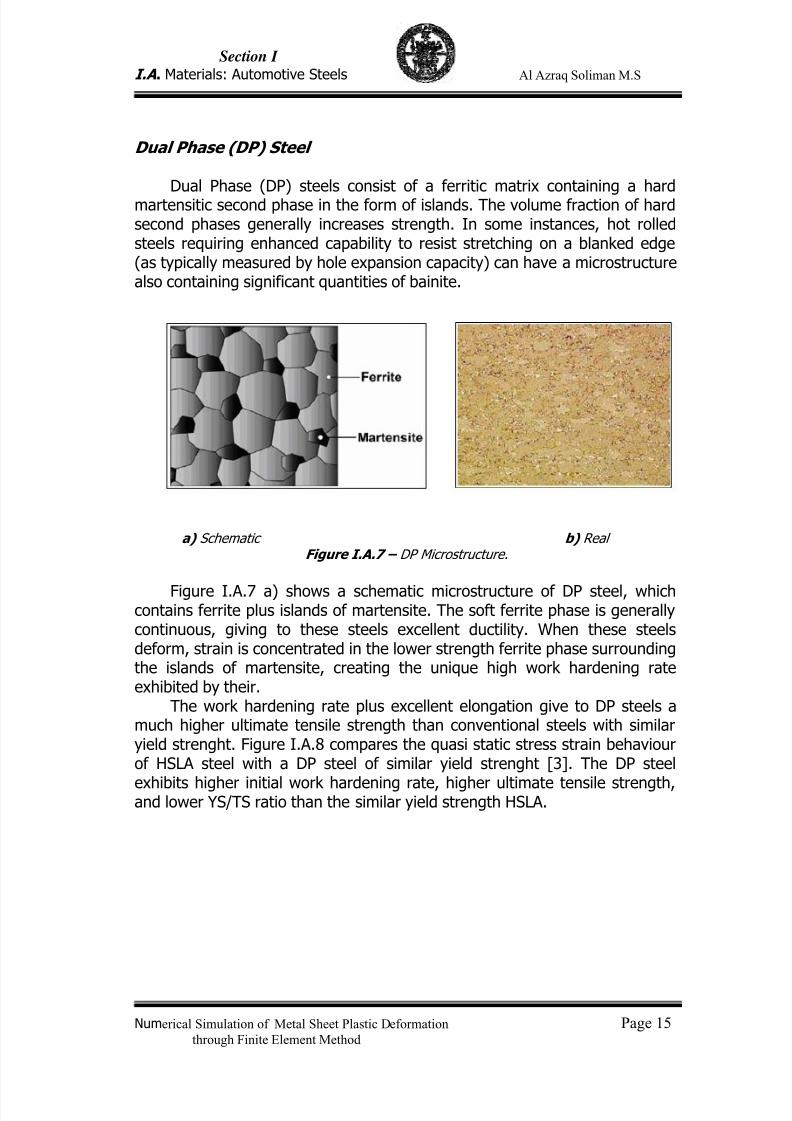
Dual Phase (DP) Steel
Dual Phase (DP) steels consist of a ferritic matrix containing a hardmartensitic second phase in the form of islands. The volume fraction of hardsecond phases generally increases strength. In some instances, hot rolledsteels requiring enhanced capability to resist stretching on a blanked edge(as typically measured by hole expansion capacity) can have a microstructurealso containing significant quantities of bainite.
a) Schematic b) RealFigure I.A.7 – DP Microstructure.
Figure I.A.7 a) shows a schematic microstructure of DP steel, whichcontains ferrite plus islands of martensite. The soft ferrite phase is generallycontinuous, giving to these steels excellent ductility. When these steelsdeform, strain is concentrated in the lower strength ferrite phase surroundingthe islands of martensite, creating the unique high work hardening rateexhibited by their.
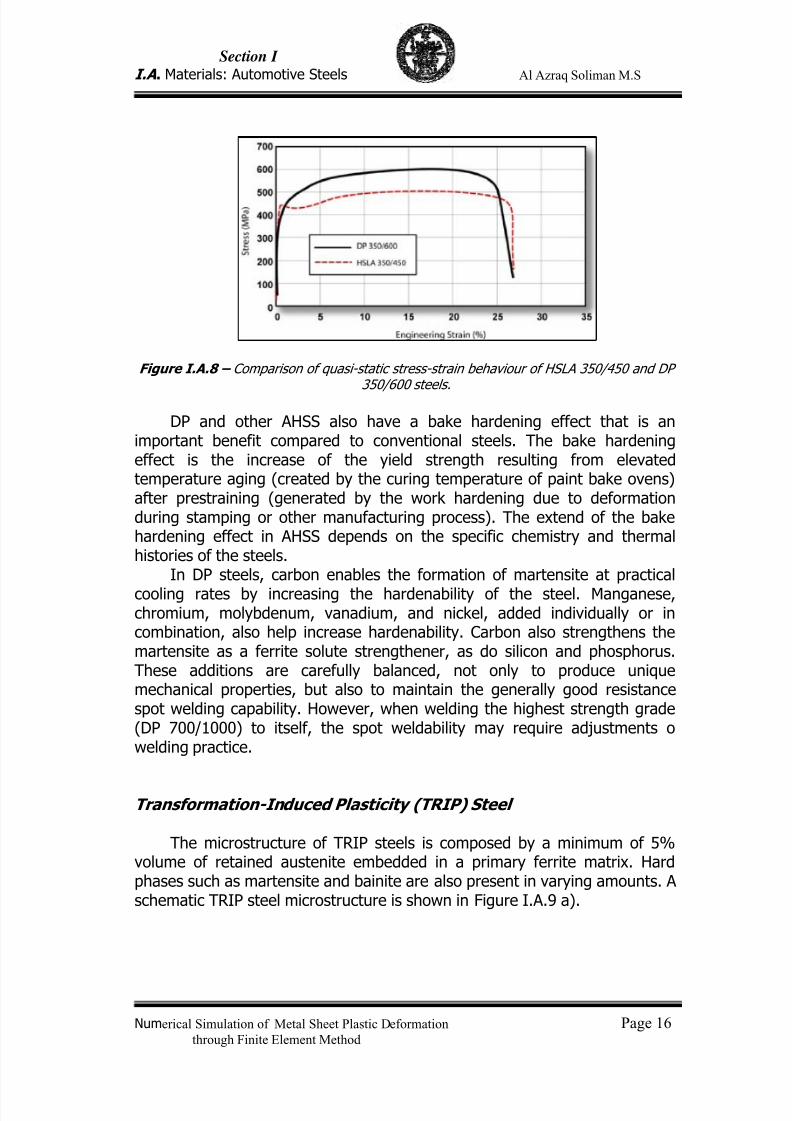
The work hardening rate plus excellent elongation give to DP steels amuch higher ultimate tensile strength than conventional steels with similaryield strenght. Figure I.A.8 compares the quasi static stress strain behaviourof HSLA steel with a DP steel of similar yield strenght [3]. The DP steel
exhibits higher initial work hardening rate, higher ultimate tensile strength,and lower YS/TS ratio than the similar yield strength HSLA.
7/23/2019 Al Azraq Ingegneria Chimica Dei Materiali e Della Produzione
http://slidepdf.com/reader/full/al-azraq-ingegneria-chimica-dei-materiali-e-della-produzione 21/419
Section I
I.A . Materials: Automotive Steels Al Azraq Soliman M.S
Numerical Simulation of Metal Sheet Plastic Deformation Page 16through Finite Element Method
Figure I.A.8 – Comparison of quasi-static stress-strain behaviour of HSLA 350/450 and DP350/600 steels.
DP and other AHSS also have a bake hardening effect that is animportant benefit compared to conventional steels. The bake hardeningeffect is the increase of the yield strength resulting from elevatedtemperature aging (created by the curing temperature of paint bake ovens)after prestraining (generated by the work hardening due to deformationduring stamping or other manufacturing process). The extend of the bakehardening effect in AHSS depends on the specific chemistry and thermalhistories of the steels.
In DP steels, carbon enables the formation of martensite at practical
cooling rates by increasing the hardenability of the steel. Manganese,chromium, molybdenum, vanadium, and nickel, added individually or incombination, also help increase hardenability. Carbon also strengthens themartensite as a ferrite solute strengthener, as do silicon and phosphorus.These additions are carefully balanced, not only to produce uniquemechanical properties, but also to maintain the generally good resistancespot welding capability. However, when welding the highest strength grade(DP 700/1000) to itself, the spot weldability may require adjustments owelding practice.
Transformation-Induced Plasticity (TRIP) Steel
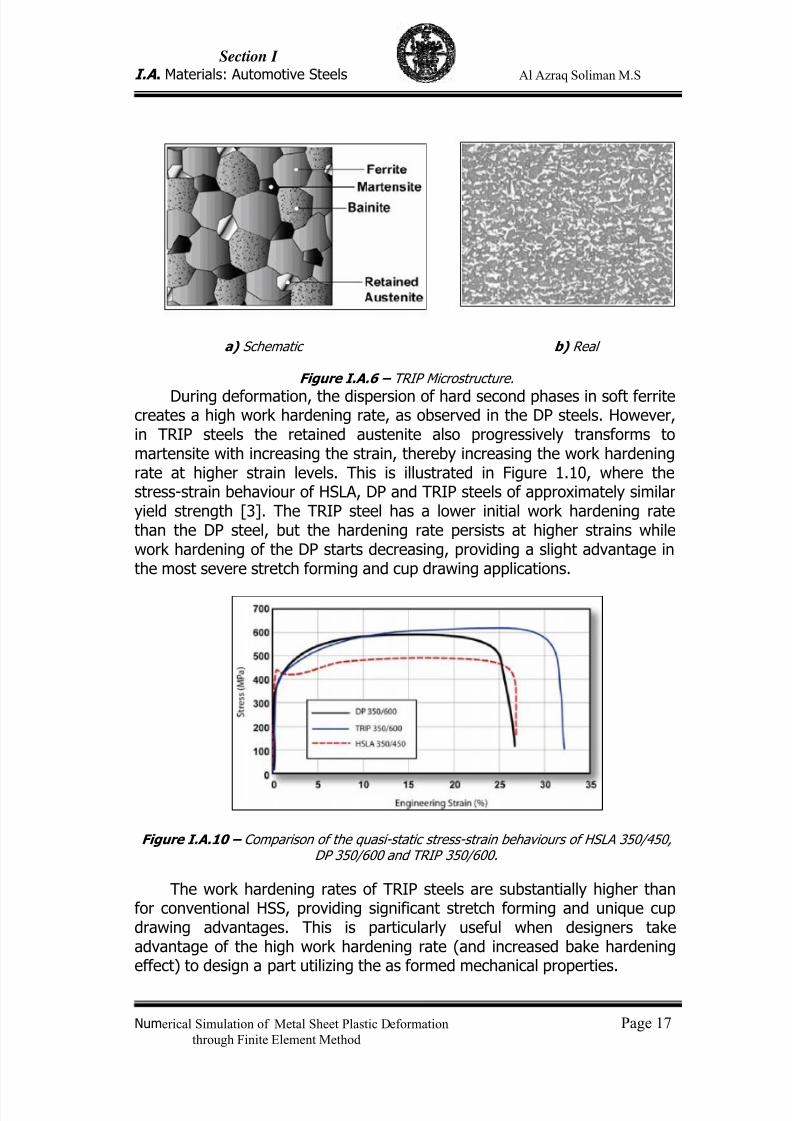
The microstructure of TRIP steels is composed by a minimum of 5%volume of retained austenite embedded in a primary ferrite matrix. Hardphases such as martensite and bainite are also present in varying amounts. Aschematic TRIP steel microstructure is shown in Figure I.A.9 a).
7/23/2019 Al Azraq Ingegneria Chimica Dei Materiali e Della Produzione
http://slidepdf.com/reader/full/al-azraq-ingegneria-chimica-dei-materiali-e-della-produzione 22/419
Section I
I.A . Materials: Automotive Steels Al Azraq Soliman M.S
Numerical Simulation of Metal Sheet Plastic Deformation Page 17through Finite Element Method
a) Schematic b) Real
Figure I.A.6 – TRIP Microstructure.
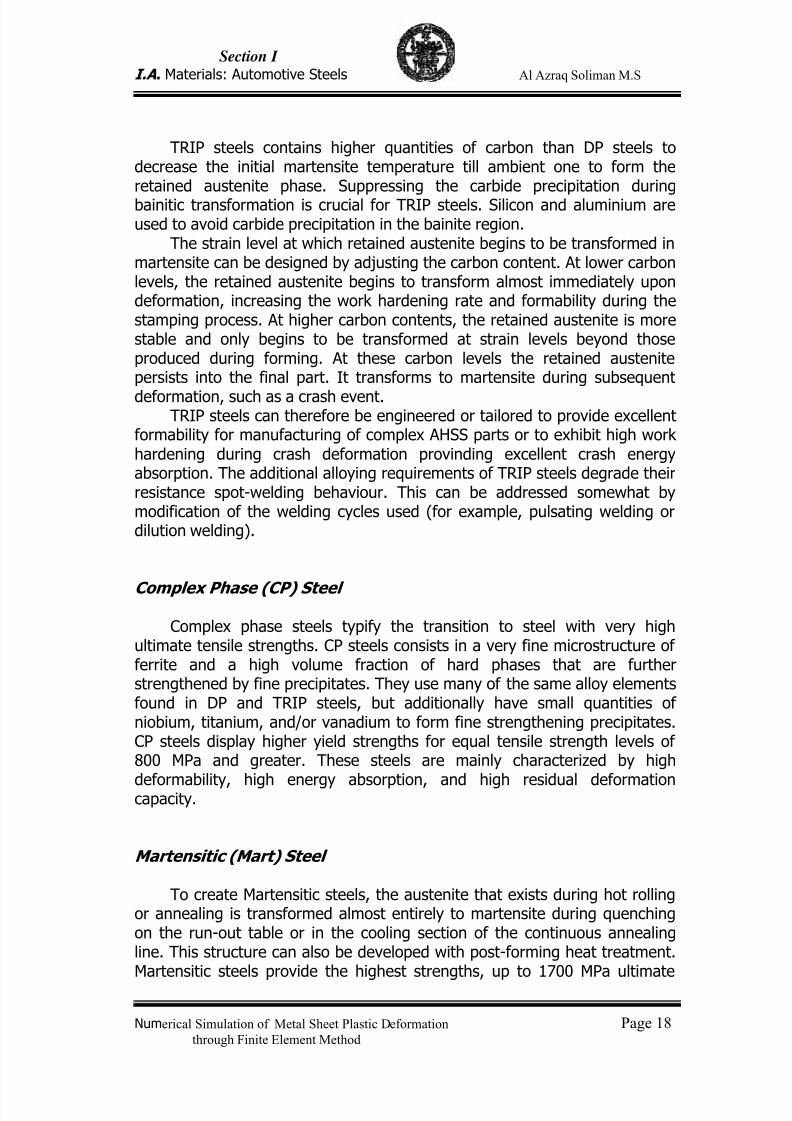
During deformation, the dispersion of hard second phases in soft ferritecreates a high work hardening rate, as observed in the DP steels. However,in TRIP steels the retained austenite also progressively transforms tomartensite with increasing the strain, thereby increasing the work hardeningrate at higher strain levels. This is illustrated in Figure 1.10, where thestress-strain behaviour of HSLA, DP and TRIP steels of approximately similaryield strength [3]. The TRIP steel has a lower initial work hardening ratethan the DP steel, but the hardening rate persists at higher strains whilework hardening of the DP starts decreasing, providing a slight advantage inthe most severe stretch forming and cup drawing applications.
Figure I.A.10 – Comparison of the quasi-static stress-strain behaviours of HSLA 350/450,DP 350/600 and TRIP 350/600.
The work hardening rates of TRIP steels are substantially higher thanfor conventional HSS, providing significant stretch forming and unique cupdrawing advantages. This is particularly useful when designers takeadvantage of the high work hardening rate (and increased bake hardeningeffect) to design a part utilizing the as formed mechanical properties.
7/23/2019 Al Azraq Ingegneria Chimica Dei Materiali e Della Produzione
http://slidepdf.com/reader/full/al-azraq-ingegneria-chimica-dei-materiali-e-della-produzione 23/419
Section I
I.A . Materials: Automotive Steels Al Azraq Soliman M.S
Numerical Simulation of Metal Sheet Plastic Deformation Page 18through Finite Element Method
TRIP steels contains higher quantities of carbon than DP steels todecrease the initial martensite temperature till ambient one to form theretained austenite phase. Suppressing the carbide precipitation duringbainitic transformation is crucial for TRIP steels. Silicon and aluminium areused to avoid carbide precipitation in the bainite region.
The strain level at which retained austenite begins to be transformed inmartensite can be designed by adjusting the carbon content. At lower carbonlevels, the retained austenite begins to transform almost immediately upondeformation, increasing the work hardening rate and formability during thestamping process. At higher carbon contents, the retained austenite is morestable and only begins to be transformed at strain levels beyond thoseproduced during forming. At these carbon levels the retained austenitepersists into the final part. It transforms to martensite during subsequent
deformation, such as a crash event.TRIP steels can therefore be engineered or tailored to provide excellent
formability for manufacturing of complex AHSS parts or to exhibit high workhardening during crash deformation provinding excellent crash energyabsorption. The additional alloying requirements of TRIP steels degrade theirresistance spot-welding behaviour. This can be addressed somewhat bymodification of the welding cycles used (for example, pulsating welding ordilution welding).
Complex Phase (CP) Steel
Complex phase steels typify the transition to steel with very highultimate tensile strengths. CP steels consists in a very fine microstructure offerrite and a high volume fraction of hard phases that are furtherstrengthened by fine precipitates. They use many of the same alloy elementsfound in DP and TRIP steels, but additionally have small quantities ofniobium, titanium, and/or vanadium to form fine strengthening precipitates.CP steels display higher yield strengths for equal tensile strength levels of800 MPa and greater. These steels are mainly characterized by high
deformability, high energy absorption, and high residual deformationcapacity.
Martensitic (Mart) Steel
To create Martensitic steels, the austenite that exists during hot rollingor annealing is transformed almost entirely to martensite during quenchingon the run-out table or in the cooling section of the continuous annealingline. This structure can also be developed with post-forming heat treatment.Martensitic steels provide the highest strengths, up to 1700 MPa ultimate
7/23/2019 Al Azraq Ingegneria Chimica Dei Materiali e Della Produzione
http://slidepdf.com/reader/full/al-azraq-ingegneria-chimica-dei-materiali-e-della-produzione 24/419
Section I
I.A . Materials: Automotive Steels Al Azraq Soliman M.S
Numerical Simulation of Metal Sheet Plastic Deformation Page 19through Finite Element Method
tensile strength. These steels are often subjected to post quench temperingto improve ductility, and can provide substantial formability even atextremely high strengths.
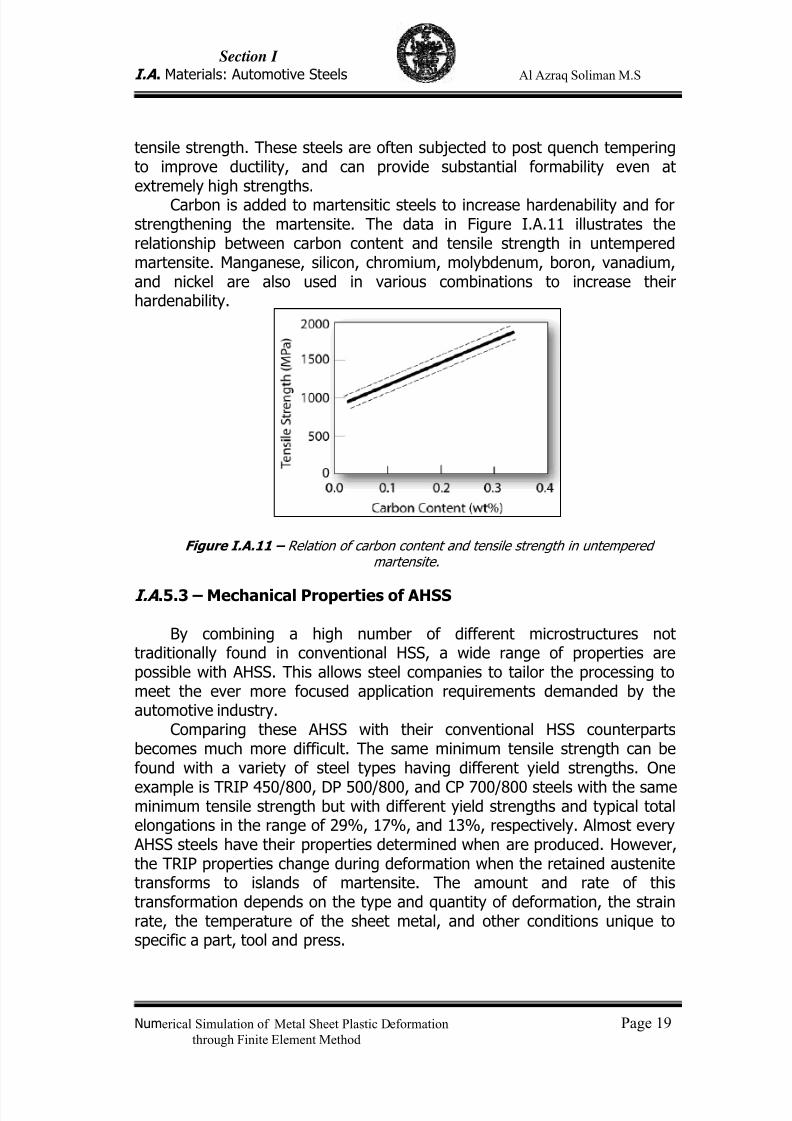
Carbon is added to martensitic steels to increase hardenability and forstrengthening the martensite. The data in Figure I.A.11 illustrates therelationship between carbon content and tensile strength in untemperedmartensite. Manganese, silicon, chromium, molybdenum, boron, vanadium,and nickel are also used in various combinations to increase theirhardenability.
Figure I.A.11 – Relation of carbon content and tensile strength in untemperedmartensite.
I.A .5.3 – Mechanical Properties of AHSS
By combining a high number of different microstructures nottraditionally found in conventional HSS, a wide range of properties arepossible with AHSS. This allows steel companies to tailor the processing tomeet the ever more focused application requirements demanded by theautomotive industry.
Comparing these AHSS with their conventional HSS counterpartsbecomes much more difficult. The same minimum tensile strength can befound with a variety of steel types having different yield strengths. One
example is TRIP 450/800, DP 500/800, and CP 700/800 steels with the sameminimum tensile strength but with different yield strengths and typical totalelongations in the range of 29%, 17%, and 13%, respectively. Almost every
AHSS steels have their properties determined when are produced. However,the TRIP properties change during deformation when the retained austenitetransforms to islands of martensite. The amount and rate of thistransformation depends on the type and quantity of deformation, the strainrate, the temperature of the sheet metal, and other conditions unique tospecific a part, tool and press.
7/23/2019 Al Azraq Ingegneria Chimica Dei Materiali e Della Produzione
http://slidepdf.com/reader/full/al-azraq-ingegneria-chimica-dei-materiali-e-della-produzione 25/419
Section I
I.A . Materials: Automotive Steels Al Azraq Soliman M.S
Numerical Simulation of Metal Sheet Plastic Deformation Page 20through Finite Element Method
Yield Strength vs. Total Elongation
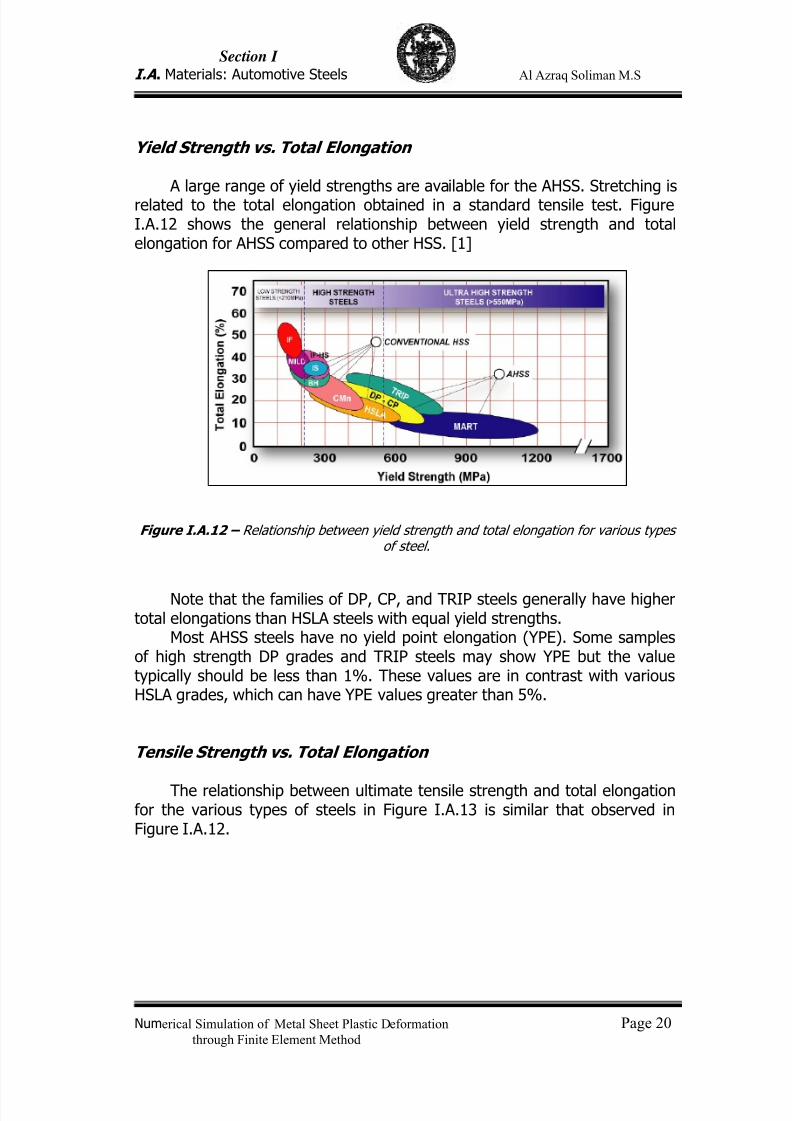
A large range of yield strengths are available for the AHSS. Stretching isrelated to the total elongation obtained in a standard tensile test. FigureI.A.12 shows the general relationship between yield strength and totalelongation for AHSS compared to other HSS. [1]
Figure I.A.12 – Relationship between yield strength and total elongation for various typesof steel.
Note that the families of DP, CP, and TRIP steels generally have highertotal elongations than HSLA steels with equal yield strengths.
Most AHSS steels have no yield point elongation (YPE). Some samplesof high strength DP grades and TRIP steels may show YPE but the valuetypically should be less than 1%. These values are in contrast with variousHSLA grades, which can have YPE values greater than 5%.
Tensile Strength vs. Total Elongation
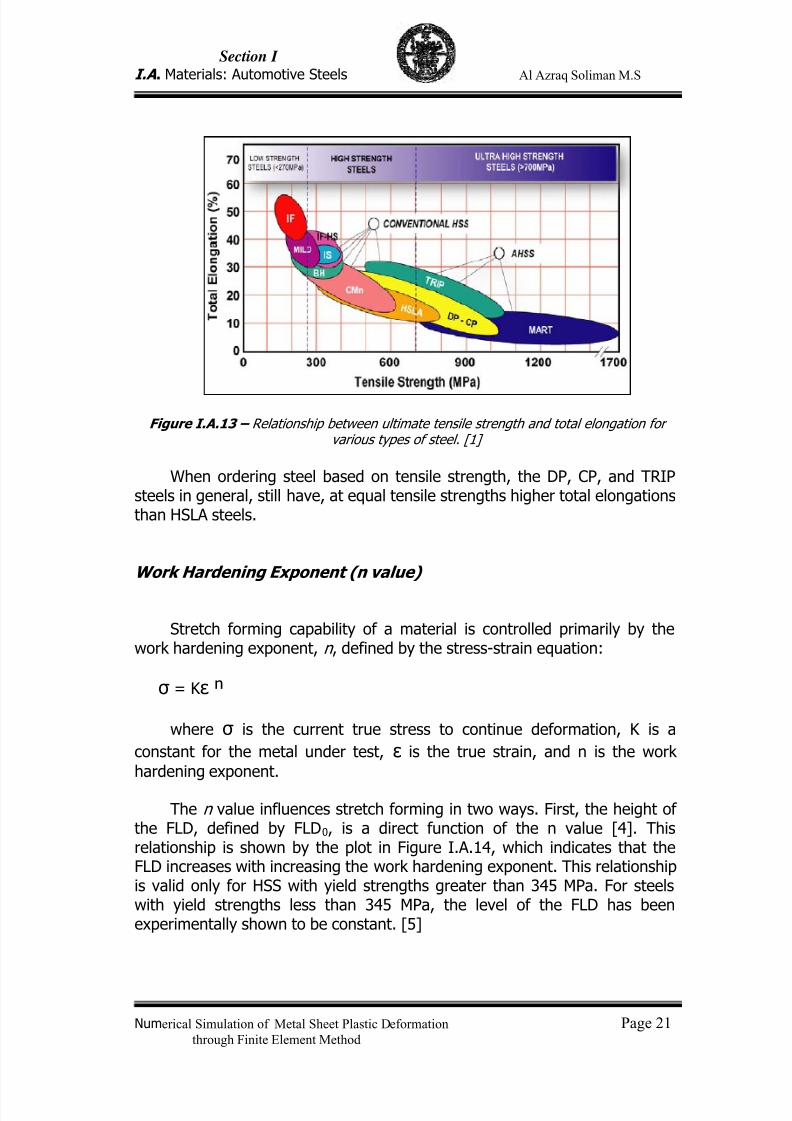
The relationship between ultimate tensile strength and total elongationfor the various types of steels in Figure I.A.13 is similar that observed inFigure I.A.12.
7/23/2019 Al Azraq Ingegneria Chimica Dei Materiali e Della Produzione
http://slidepdf.com/reader/full/al-azraq-ingegneria-chimica-dei-materiali-e-della-produzione 26/419
Section I
I.A . Materials: Automotive Steels Al Azraq Soliman M.S
Numerical Simulation of Metal Sheet Plastic Deformation Page 21through Finite Element Method
Figure I.A.13 – Relationship between ultimate tensile strength and total elongation forvarious types of steel. [1]
When ordering steel based on tensile strength, the DP, CP, and TRIPsteels in general, still have, at equal tensile strengths higher total elongationsthan HSLA steels.
Work Hardening Exponent (n value)
Stretch forming capability of a material is controlled primarily by thework hardening exponent, n , defined by the stress-strain equation:
σ = K ε ⁿ
where σ is the current true stress to continue deformation, K is a
constant for the metal under test, ε is the true strain, and n is the work
hardening exponent.
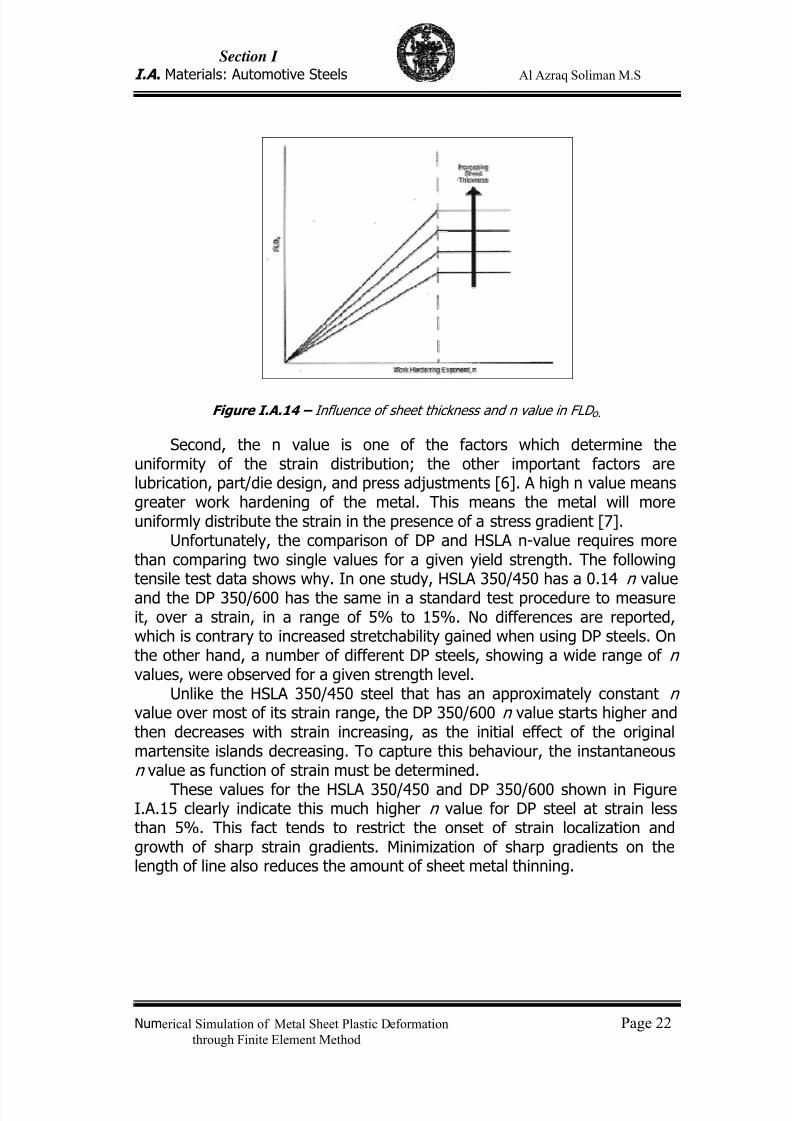
The n value influences stretch forming in two ways. First, the height ofthe FLD, defined by FLD0, is a direct function of the n value [4]. Thisrelationship is shown by the plot in Figure I.A.14, which indicates that theFLD increases with increasing the work hardening exponent. This relationshipis valid only for HSS with yield strengths greater than 345 MPa. For steelswith yield strengths less than 345 MPa, the level of the FLD has beenexperimentally shown to be constant. [5]
7/23/2019 Al Azraq Ingegneria Chimica Dei Materiali e Della Produzione
http://slidepdf.com/reader/full/al-azraq-ingegneria-chimica-dei-materiali-e-della-produzione 27/419
Section I
I.A . Materials: Automotive Steels Al Azraq Soliman M.S
Numerical Simulation of Metal Sheet Plastic Deformation Page 22through Finite Element Method
Figure I.A.14 – Influence of sheet thickness and n value in FLD o.
Second, the n value is one of the factors which determine theuniformity of the strain distribution; the other important factors arelubrication, part/die design, and press adjustments [6]. A high n value meansgreater work hardening of the metal. This means the metal will moreuniformly distribute the strain in the presence of a stress gradient [7].
Unfortunately, the comparison of DP and HSLA n-value requires morethan comparing two single values for a given yield strength. The followingtensile test data shows why. In one study, HSLA 350/450 has a 0.14 n valueand the DP 350/600 has the same in a standard test procedure to measureit, over a strain, in a range of 5% to 15%. No differences are reported,which is contrary to increased stretchability gained when using DP steels. Onthe other hand, a number of different DP steels, showing a wide range of nvalues, were observed for a given strength level.
Unlike the HSLA 350/450 steel that has an approximately constant n value over most of its strain range, the DP 350/600 n value starts higher andthen decreases with strain increasing, as the initial effect of the originalmartensite islands decreasing. To capture this behaviour, the instantaneous n value as function of strain must be determined.
These values for the HSLA 350/450 and DP 350/600 shown in FigureI.A.15 clearly indicate this much higher n value for DP steel at strain lessthan 5%. This fact tends to restrict the onset of strain localization andgrowth of sharp strain gradients. Minimization of sharp gradients on thelength of line also reduces the amount of sheet metal thinning.
7/23/2019 Al Azraq Ingegneria Chimica Dei Materiali e Della Produzione
http://slidepdf.com/reader/full/al-azraq-ingegneria-chimica-dei-materiali-e-della-produzione 28/419
Section I
I.A . Materials: Automotive Steels Al Azraq Soliman M.S
Numerical Simulation of Metal Sheet Plastic Deformation Page 23through Finite Element Method
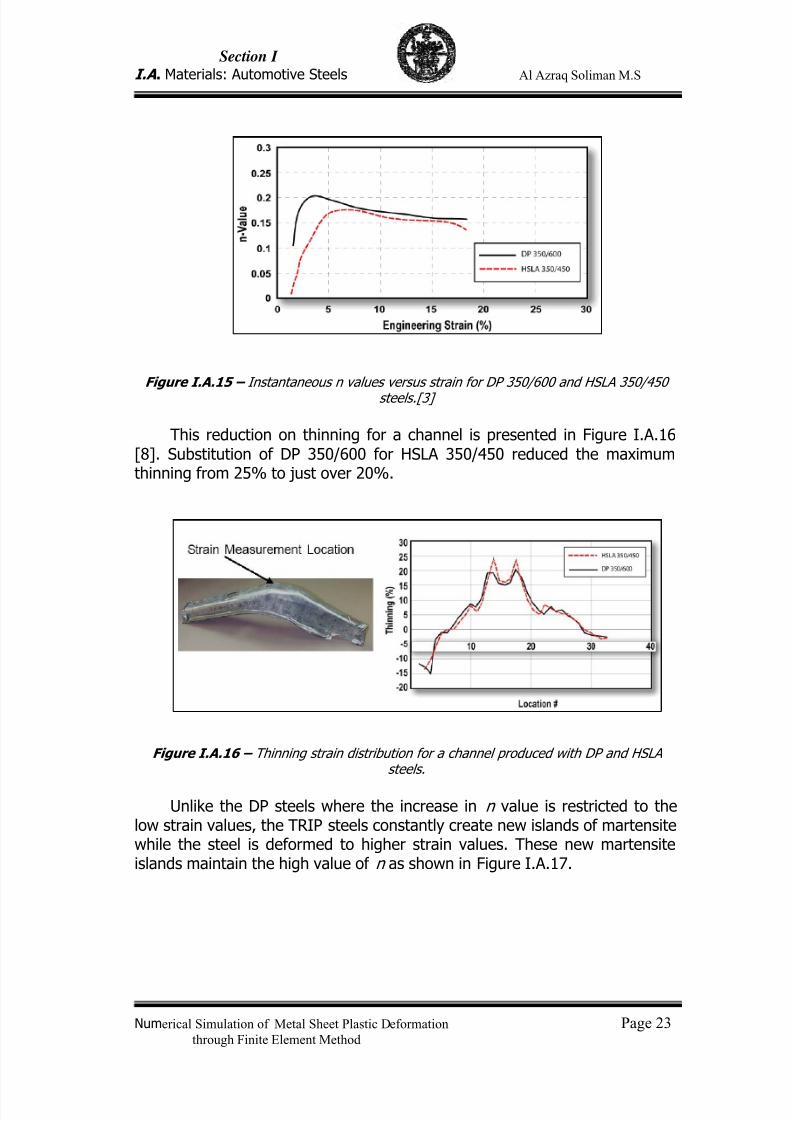
Figure I.A.15 – Instantaneous n values versus strain for DP 350/600 and HSLA 350/450
steels.[3]
This reduction on thinning for a channel is presented in Figure I.A.16[8]. Substitution of DP 350/600 for HSLA 350/450 reduced the maximumthinning from 25% to just over 20%.
Figure I.A.16 – Thinning strain distribution for a channel produced with DP and HSLAsteels.
Unlike the DP steels where the increase in n value is restricted to thelow strain values, the TRIP steels constantly create new islands of martensitewhile the steel is deformed to higher strain values. These new martensiteislands maintain the high value of n as shown in Figure I.A.17.
7/23/2019 Al Azraq Ingegneria Chimica Dei Materiali e Della Produzione
http://slidepdf.com/reader/full/al-azraq-ingegneria-chimica-dei-materiali-e-della-produzione 29/419
Section I
I.A . Materials: Automotive Steels Al Azraq Soliman M.S
Numerical Simulation of Metal Sheet Plastic Deformation Page 24through Finite Element Method
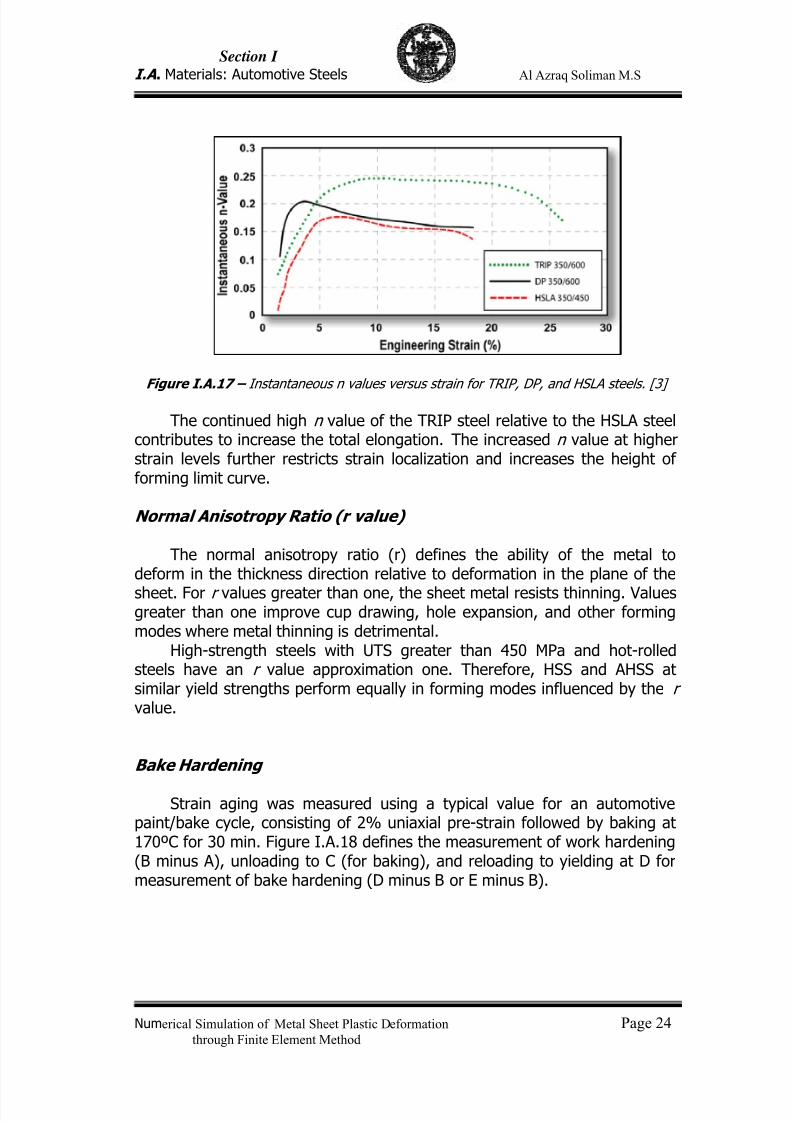
Figure I.A.17 – Instantaneous n values versus strain for TRIP, DP, and HSLA steels. [3]
The continued high n value of the TRIP steel relative to the HSLA steelcontributes to increase the total elongation. The increased n value at higherstrain levels further restricts strain localization and increases the height offorming limit curve.
Normal Anisotropy Ratio (r value)
The normal anisotropy ratio (r) defines the ability of the metal todeform in the thickness direction relative to deformation in the plane of the
sheet. For r values greater than one, the sheet metal resists thinning. Valuesgreater than one improve cup drawing, hole expansion, and other formingmodes where metal thinning is detrimental.
High-strength steels with UTS greater than 450 MPa and hot-rolledsteels have an r value approximation one. Therefore, HSS and AHSS atsimilar yield strengths perform equally in forming modes influenced by the r value.
Bake Hardening
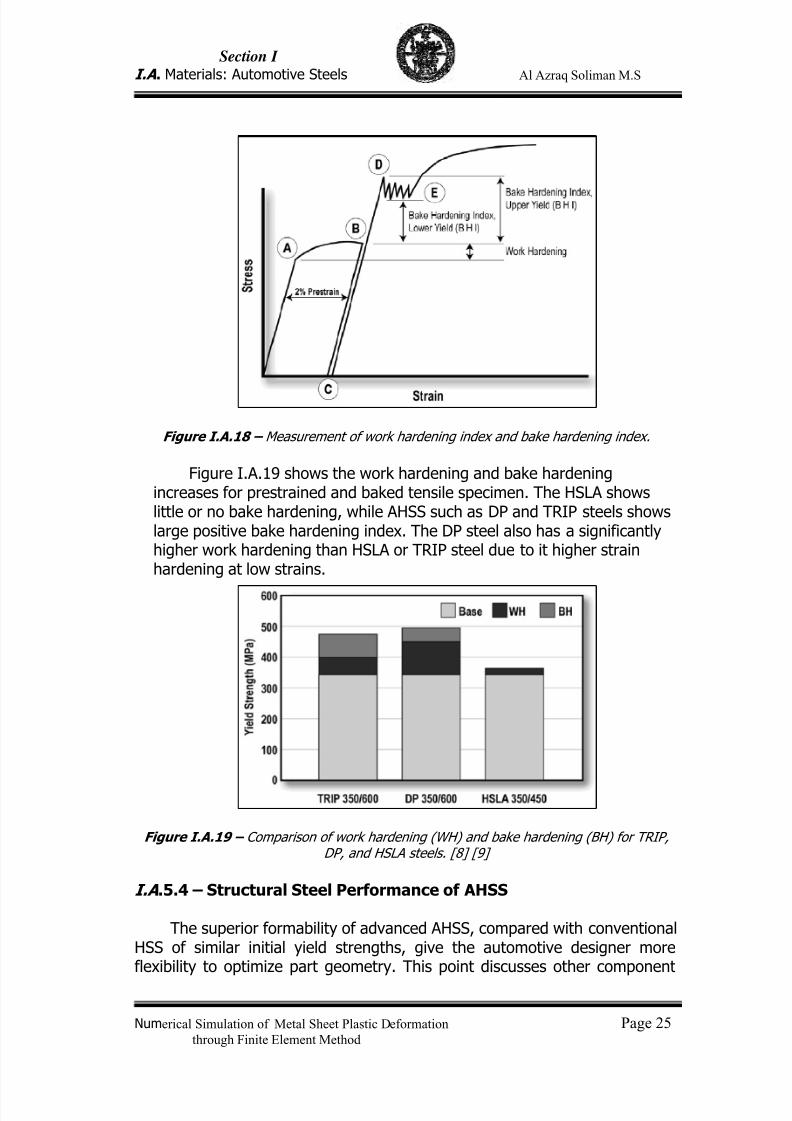
Strain aging was measured using a typical value for an automotivepaint/bake cycle, consisting of 2% uniaxial pre-strain followed by baking at170ºC for 30 min. Figure I.A.18 defines the measurement of work hardening(B minus A), unloading to C (for baking), and reloading to yielding at D formeasurement of bake hardening (D minus B or E minus B).
7/23/2019 Al Azraq Ingegneria Chimica Dei Materiali e Della Produzione
http://slidepdf.com/reader/full/al-azraq-ingegneria-chimica-dei-materiali-e-della-produzione 30/419
Section I
I.A . Materials: Automotive Steels Al Azraq Soliman M.S
Numerical Simulation of Metal Sheet Plastic Deformation Page 25through Finite Element Method
Figure I.A.18 – Measurement of work hardening index and bake hardening index.
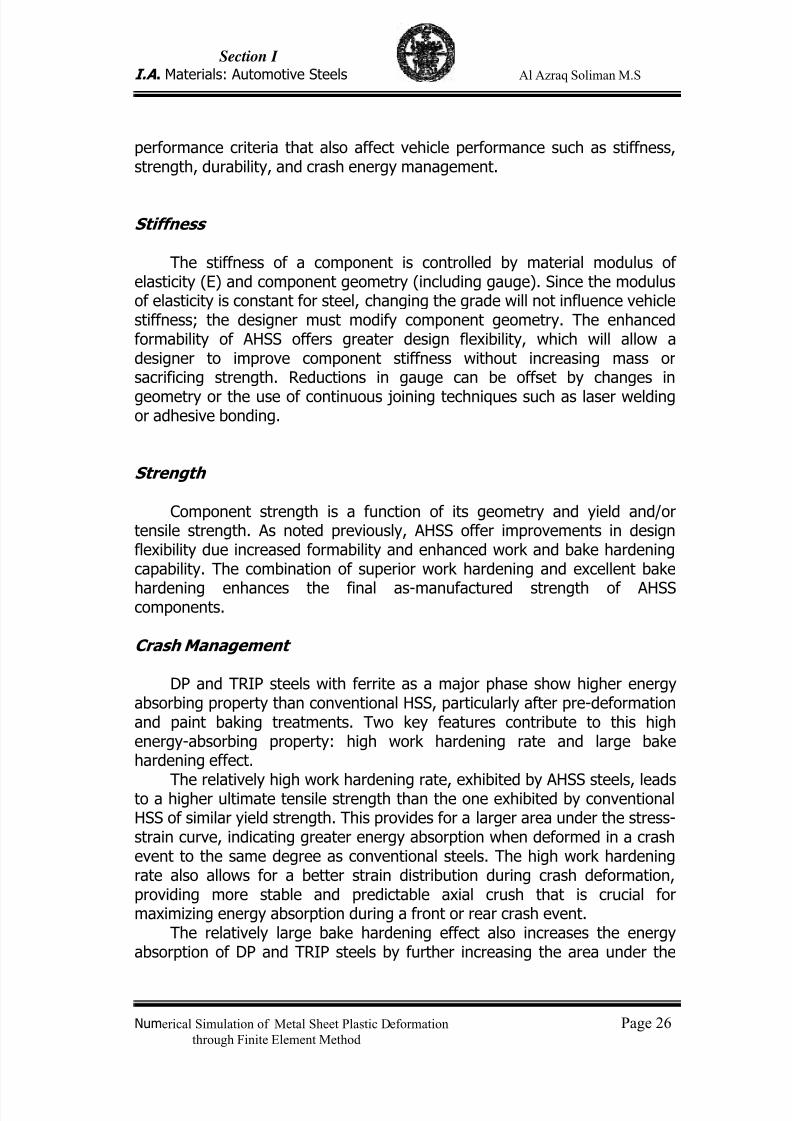
Figure I.A.19 shows the work hardening and bake hardeningincreases for prestrained and baked tensile specimen. The HSLA showslittle or no bake hardening, while AHSS such as DP and TRIP steels showslarge positive bake hardening index. The DP steel also has a significantlyhigher work hardening than HSLA or TRIP steel due to it higher strainhardening at low strains.
Figure I.A.19 – Comparison of work hardening (WH) and bake hardening (BH) for TRIP,DP, and HSLA steels. [8] [9]
I.A .5.4 – Structural Steel Performance of AHSS
The superior formability of advanced AHSS, compared with conventionalHSS of similar initial yield strengths, give the automotive designer moreflexibility to optimize part geometry. This point discusses other component
7/23/2019 Al Azraq Ingegneria Chimica Dei Materiali e Della Produzione
http://slidepdf.com/reader/full/al-azraq-ingegneria-chimica-dei-materiali-e-della-produzione 31/419
Section I
I.A . Materials: Automotive Steels Al Azraq Soliman M.S
Numerical Simulation of Metal Sheet Plastic Deformation Page 26through Finite Element Method
performance criteria that also affect vehicle performance such as stiffness,strength, durability, and crash energy management.
Stiffness
The stiffness of a component is controlled by material modulus ofelasticity (E) and component geometry (including gauge). Since the modulusof elasticity is constant for steel, changing the grade will not influence vehiclestiffness; the designer must modify component geometry. The enhancedformability of AHSS offers greater design flexibility, which will allow adesigner to improve component stiffness without increasing mass orsacrificing strength. Reductions in gauge can be offset by changes in
geometry or the use of continuous joining techniques such as laser weldingor adhesive bonding.
Strength
Component strength is a function of its geometry and yield and/ortensile strength. As noted previously, AHSS offer improvements in designflexibility due increased formability and enhanced work and bake hardeningcapability. The combination of superior work hardening and excellent bake
hardening enhances the final as-manufactured strength of AHSScomponents.
Crash Management
DP and TRIP steels with ferrite as a major phase show higher energyabsorbing property than conventional HSS, particularly after pre-deformationand paint baking treatments. Two key features contribute to this highenergy-absorbing property: high work hardening rate and large bakehardening effect.
The relatively high work hardening rate, exhibited by AHSS steels, leadsto a higher ultimate tensile strength than the one exhibited by conventionalHSS of similar yield strength. This provides for a larger area under the stress-strain curve, indicating greater energy absorption when deformed in a crashevent to the same degree as conventional steels. The high work hardeningrate also allows for a better strain distribution during crash deformation,providing more stable and predictable axial crush that is crucial formaximizing energy absorption during a front or rear crash event.
The relatively large bake hardening effect also increases the energyabsorption of DP and TRIP steels by further increasing the area under the
7/23/2019 Al Azraq Ingegneria Chimica Dei Materiali e Della Produzione
http://slidepdf.com/reader/full/al-azraq-ingegneria-chimica-dei-materiali-e-della-produzione 32/419
Section I
I.A . Materials: Automotive Steels Al Azraq Soliman M.S
Numerical Simulation of Metal Sheet Plastic Deformation Page 27through Finite Element Method
stress-strain curve. Conventional HSS do not exhibit a strong bake hardeningeffect and do not benefit from this strengthening mechanism.
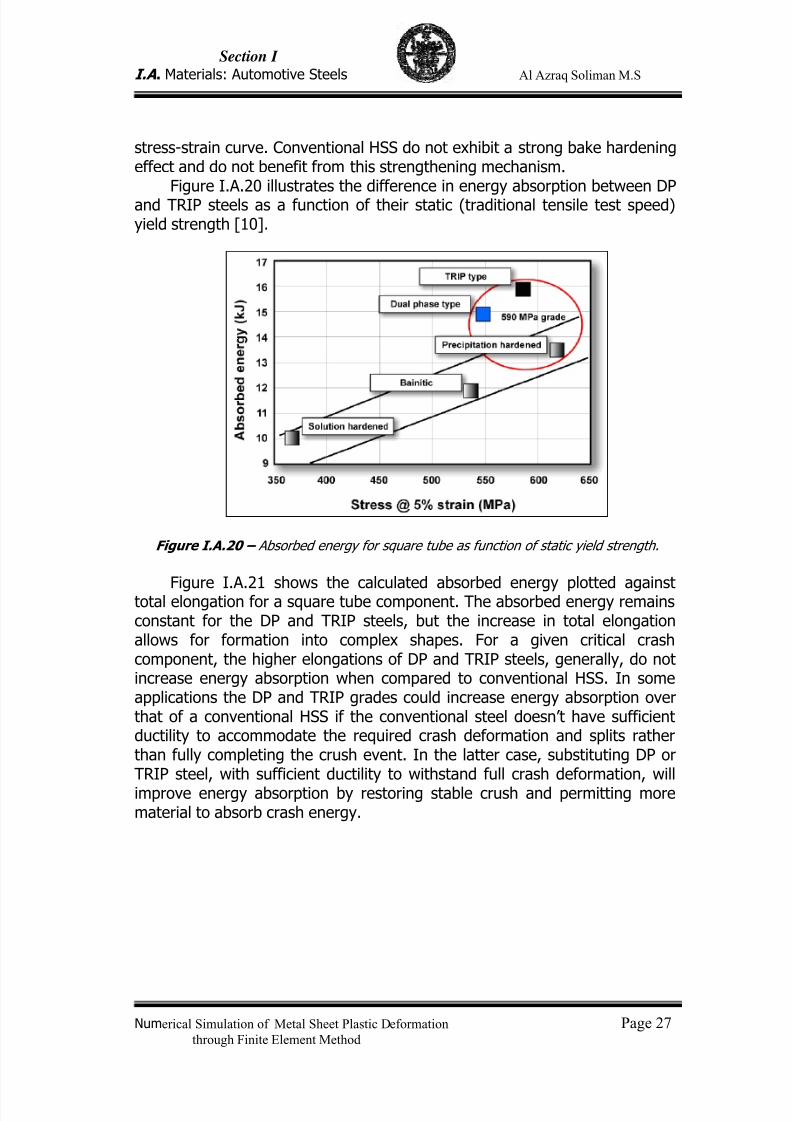
Figure I.A.20 illustrates the difference in energy absorption between DPand TRIP steels as a function of their static (traditional tensile test speed)yield strength [10].
Figure I.A.20 – Absorbed energy for square tube as function of static yield strength.
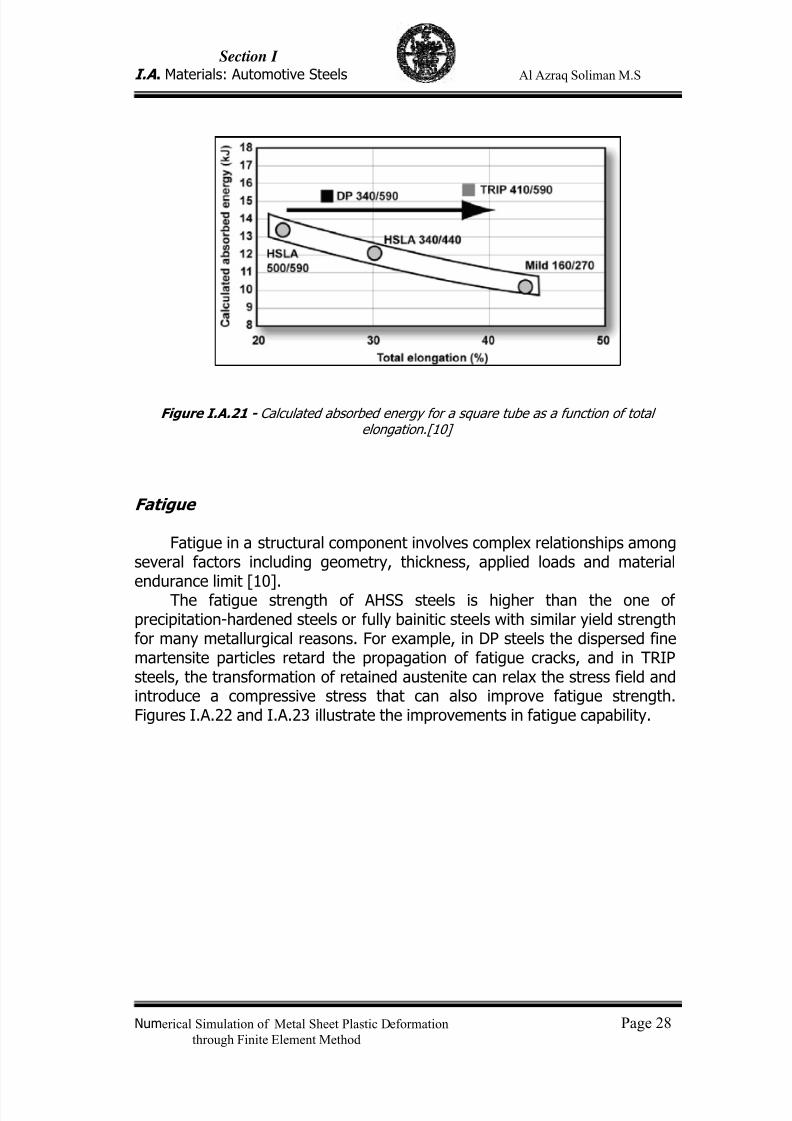
Figure I.A.21 shows the calculated absorbed energy plotted againsttotal elongation for a square tube component. The absorbed energy remainsconstant for the DP and TRIP steels, but the increase in total elongationallows for formation into complex shapes. For a given critical crashcomponent, the higher elongations of DP and TRIP steels, generally, do notincrease energy absorption when compared to conventional HSS. In someapplications the DP and TRIP grades could increase energy absorption overthat of a conventional HSS if the conventional steel doesn’t have sufficientductility to accommodate the required crash deformation and splits ratherthan fully completing the crush event. In the latter case, substituting DP orTRIP steel, with sufficient ductility to withstand full crash deformation, willimprove energy absorption by restoring stable crush and permitting morematerial to absorb crash energy.
7/23/2019 Al Azraq Ingegneria Chimica Dei Materiali e Della Produzione
http://slidepdf.com/reader/full/al-azraq-ingegneria-chimica-dei-materiali-e-della-produzione 33/419
Section I
I.A . Materials: Automotive Steels Al Azraq Soliman M.S
Numerical Simulation of Metal Sheet Plastic Deformation Page 28through Finite Element Method
Figure I.A.21 - Calculated absorbed energy for a square tube as a function of totalelongation.[10]
Fatigue
Fatigue in a structural component involves complex relationships amongseveral factors including geometry, thickness, applied loads and material
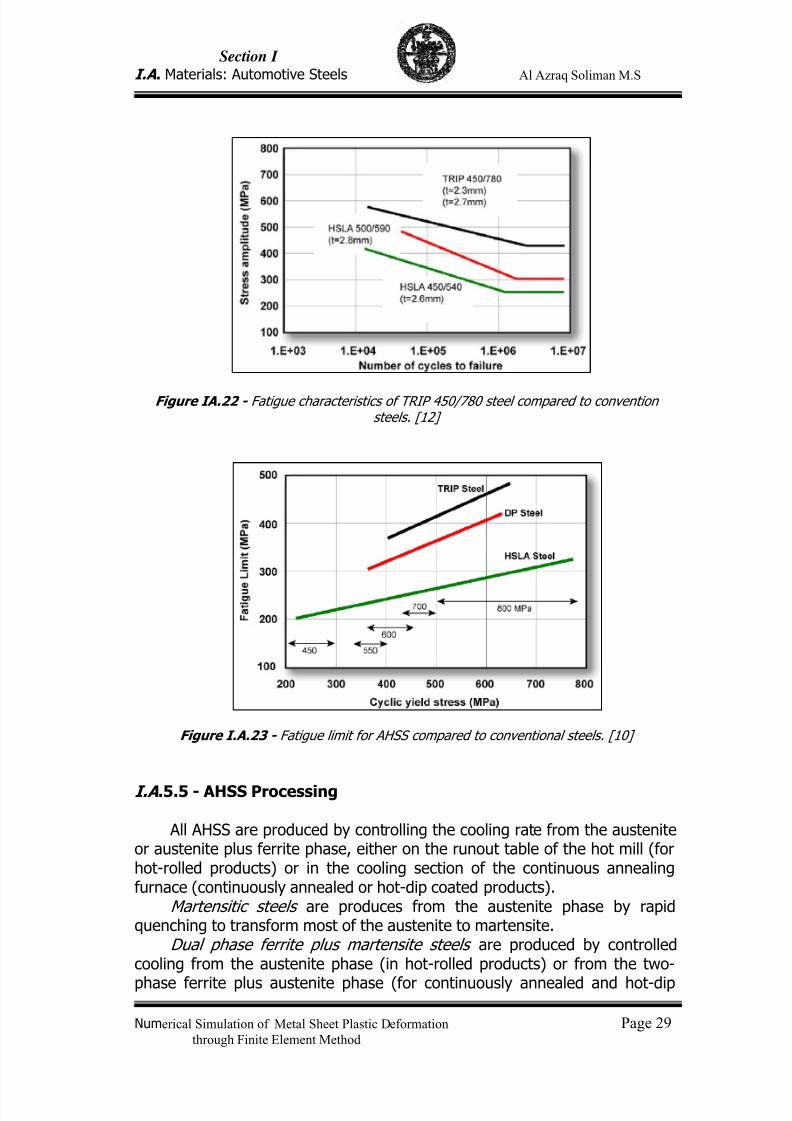
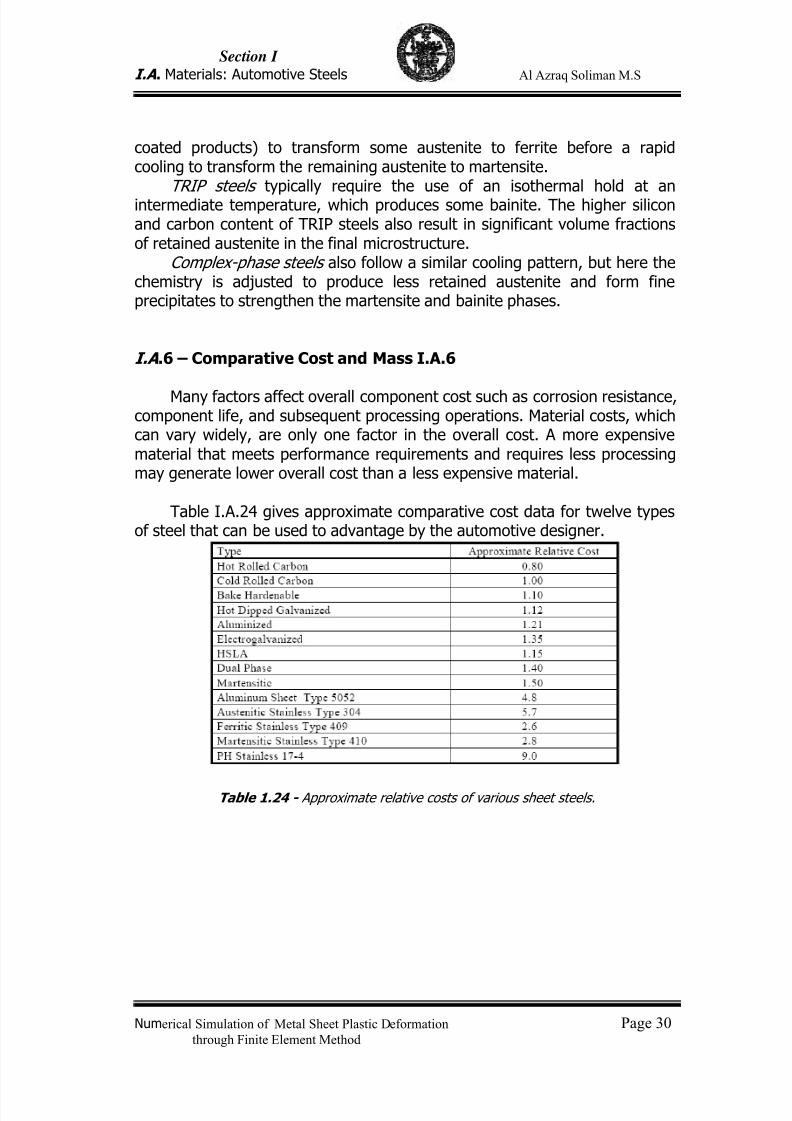
endurance limit [10].The fatigue strength of AHSS steels is higher than the one ofprecipitation-hardened steels or fully bainitic steels with similar yield strengthfor many metallurgical reasons. For example, in DP steels the dispersed finemartensite particles retard the propagation of fatigue cracks, and in TRIPsteels, the transformation of retained austenite can relax the stress field andintroduce a compressive stress that can also improve fatigue strength.Figures I.A.22 and I.A.23 illustrate the improvements in fatigue capability.
7/23/2019 Al Azraq Ingegneria Chimica Dei Materiali e Della Produzione
http://slidepdf.com/reader/full/al-azraq-ingegneria-chimica-dei-materiali-e-della-produzione 34/419
Section I
I.A . Materials: Automotive Steels Al Azraq Soliman M.S
Numerical Simulation of Metal Sheet Plastic Deformation Page 29through Finite Element Method
Figure IA.22 - Fatigue characteristics of TRIP 450/780 steel compared to conventionsteels. [12]
Figure I.A.23 - Fatigue limit for AHSS compared to conventional steels. [10]
I.A .5.5 - AHSS Processing
All AHSS are produced by controlling the cooling rate from the austeniteor austenite plus ferrite phase, either on the runout table of the hot mill (forhot-rolled products) or in the cooling section of the continuous annealingfurnace (continuously annealed or hot-dip coated products).
Martensitic steels are produces from the austenite phase by rapidquenching to transform most of the austenite to martensite.
Dual phase ferrite plus martensite steels are produced by controlledcooling from the austenite phase (in hot-rolled products) or from the two-
phase ferrite plus austenite phase (for continuously annealed and hot-dip
7/23/2019 Al Azraq Ingegneria Chimica Dei Materiali e Della Produzione
http://slidepdf.com/reader/full/al-azraq-ingegneria-chimica-dei-materiali-e-della-produzione 35/419
Section I
I.A . Materials: Automotive Steels Al Azraq Soliman M.S
Numerical Simulation of Metal Sheet Plastic Deformation Page 30through Finite Element Method
coated products) to transform some austenite to ferrite before a rapidcooling to transform the remaining austenite to martensite.
TRIP steels typically require the use of an isothermal hold at anintermediate temperature, which produces some bainite. The higher siliconand carbon content of TRIP steels also result in significant volume fractionsof retained austenite in the final microstructure.
Complex-phase steels also follow a similar cooling pattern, but here thechemistry is adjusted to produce less retained austenite and form fineprecipitates to strengthen the martensite and bainite phases.
I.A .6 – Comparative Cost and Mass I.A.6
Many factors affect overall component cost such as corrosion resistance,component life, and subsequent processing operations. Material costs, whichcan vary widely, are only one factor in the overall cost. A more expensivematerial that meets performance requirements and requires less processingmay generate lower overall cost than a less expensive material.
Table I.A.24 gives approximate comparative cost data for twelve typesof steel that can be used to advantage by the automotive designer.
Table 1.24 - Approximate relative costs of various sheet steels.
7/23/2019 Al Azraq Ingegneria Chimica Dei Materiali e Della Produzione
http://slidepdf.com/reader/full/al-azraq-ingegneria-chimica-dei-materiali-e-della-produzione 36/419
Section I
I.A . Materials: Automotive Steels Al Azraq Soliman M.S
Numerical Simulation of Metal Sheet Plastic Deformation Page 31through Finite Element Method
I.A .7 Bibligraphy:
[1] International Iron and Steel Institute, UltraLight Steel Auto Body - Advanced Vehicle Concepts (ULSAB – AVC) Report / AISI TrainingSession Document (2002).
[2] ULSAB-AVC Consortium, Technical Transfer Dispatch #6, “ULSAB-AVCBody Structure Materials,” May, 2001.
[3] A. Konieczny, “Advanced High Strength Steels – Formability,” 2003Great Designs in Steel, American Iron and Steel Institute (February 19,2003).
[4]
American Iron and Steel Institute, Sheet Steel Formability, AISI,Washington, D.C., (1984).
[5] Keeler, S. P. and Brazier, W. G., “Relationship Between LaboratoryMaterial Characterization and Press-Shop Formability,” Microalloying 74
– New York, N.Y., (1977), pp. 517-530.
[6] Keeler, S. P., “Sheet Metal Stamping Technology – Need for
Fundamental Understanding,” Mechanics of Sheet Metal Forming –Material Behaviour And Deformation Analysis, General Motors ResearchSymposium, Plenum Press, New York, (1978), pp. 3-17.
[7] Heyer, R. H. and Newby, J. R., “Effects of Mechanical Properties onBiaxial Stretchability of Low Carbon Steels,” Trans. S'E, 77, (1969), AlsoS'E Paper No. 680094.
[8] M. Shi, G. Thomas, X. Chen and J. Fekete, “Formability PerformanceComparison between Dual Phase and HSLA Steels”, Proceedings of 43rdMechanical Working and Steel Processing, Iron & Steel Society, 39,p.165 (2001).
[9] A. Konieczny, “On the Formability of Automotive TRIP Steels”, SAETechnical Paper No. 2003-01-0521 (2003).
[10] M. Takahashi, “Development of High Strength Steels for Automobiles,”Nippon Steel Technical Report No. 88 (July 2003).
[11]
R. Shaw, B. K. Zuidema, “New High Strength Steels Help Automakers

7/23/2019 Al Azraq Ingegneria Chimica Dei Materiali e Della Produzione
http://slidepdf.com/reader/full/al-azraq-ingegneria-chimica-dei-materiali-e-della-produzione 37/419
Section I
I.A . Materials: Automotive Steels Al Azraq Soliman M.S
Numerical Simulation of Metal Sheet Plastic Deformation Page 32through Finite Element Method
Reach Future Goals for Safety, Affordability, Fuel Efficiency, andEnvironmental Responsibility” SAE Paper 2001-01-3041.
[12]
M. Takahashi et al, “High Strength Hot-Rolled Steel Sheets for Automobiles”, Nippon Steel Technical Report No. 88 (July 2003).

7/23/2019 Al Azraq Ingegneria Chimica Dei Materiali e Della Produzione
http://slidepdf.com/reader/full/al-azraq-ingegneria-chimica-dei-materiali-e-della-produzione 38/419
Section I.B
Plastic deformation process
7/23/2019 Al Azraq Ingegneria Chimica Dei Materiali e Della Produzione
http://slidepdf.com/reader/full/al-azraq-ingegneria-chimica-dei-materiali-e-della-produzione 39/419
Section I
I.B . Plastic Deformation Process Al Azraq Soliman M.S
Numerical Simulation of Metal Sheet Plastic Deformation Page 33through Finite Element Method
I.B .1 – Introduction
Definition
In metal forming, a piece of material is plastically deformed betweentools to obtain the desired product applicable in automobiles, domesticappliances, building products, aircraft, food and drink cans and a host ofother familiar products. There are two main classes of metal forming, thebulk and the sheet metal forming (the thickness of the piece of material issmall compared to the other dimensions). Sheet metal forming (SMF) is awidely used production process: in 2004, 310 million tons of steel sheet and12 million tons of aluminium sheet was produced worldwide which wasapproximately 40% of the total steel and aluminium production. Then
principal characteristics of sheet metal forming processes are:(1) The workpiece is a sheet or a part fabricated from a sheet;(2) The surfaces of the deforming material and of the tools are in
contact;(3) The deformation usually causes significant changes in shape, but not
in cross-section (sheet thickness and surface characteristics), of the sheet;(4) The component of stress state normal to the sheet plane is generally
much smaller than the stresses in the sheet plane;(5) In some cases, the magnitude of permanent plastic and recoverable
elastic deformation is comparable, therefore elastic recovery or springback
may be significant.The technical-economic advantages of SMF are that it is a highly
efficient process that can be used to produce complex parts. It can produceparts with high degree of dimensional accuracy and increased mechanicalproperties along with a good surface finish. But the limitation is that thedeformation imposed in SMF process is complicated.
History
Forming is an old art, examples of formed jewellery made of gold date
back to 3000 BC. The primary objective of metal forming is to produce adesired shape change and therefore in this process, it must be recognisedthat material properties affect the process, and processing alters the materialproperties.
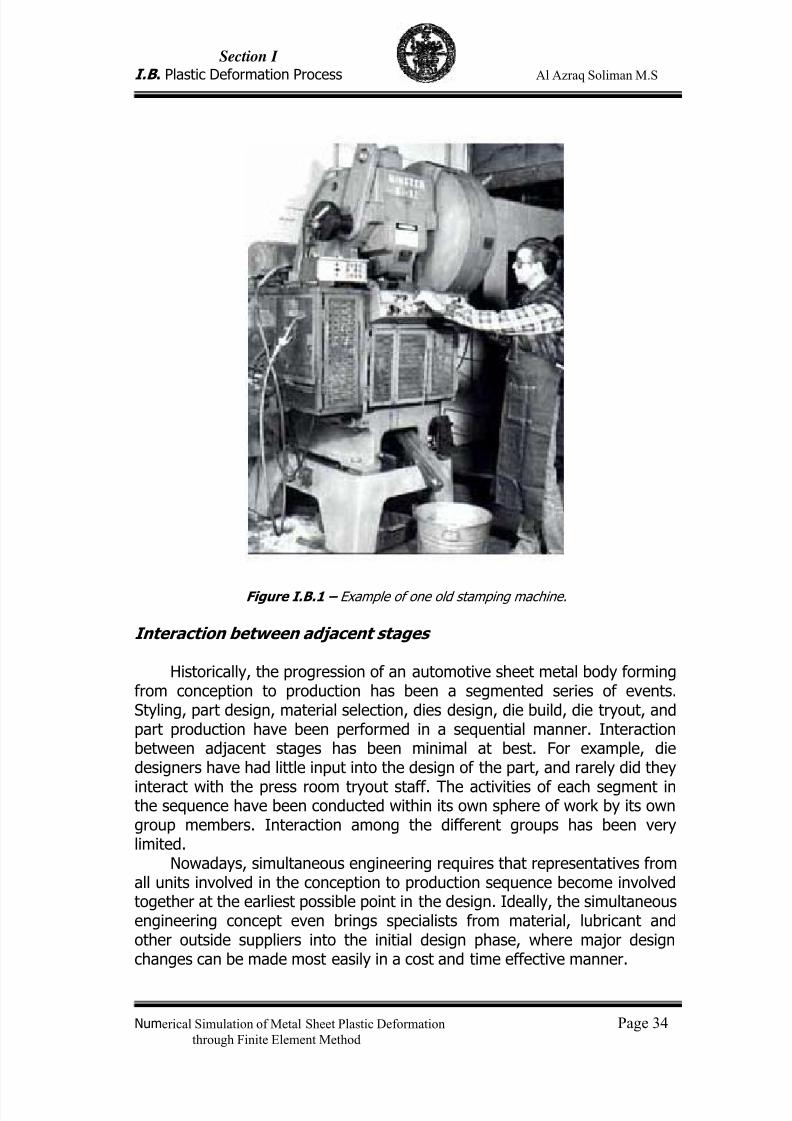
The primary stamping press was invented in 1769 by John Pickering (aLondon toymaker), Richard Ford and John Smith, both of Birmingham(Figure I.B.1). In such time, this invention was extremely importancebecause increase the speed production of many brass articles and therebyincreased this demand.
7/23/2019 Al Azraq Ingegneria Chimica Dei Materiali e Della Produzione
http://slidepdf.com/reader/full/al-azraq-ingegneria-chimica-dei-materiali-e-della-produzione 40/419
Section I
I.B . Plastic Deformation Process Al Azraq Soliman M.S
Numerical Simulation of Metal Sheet Plastic Deformation Page 34through Finite Element Method
Figure I.B.1 – Example of one old stamping machine.
Interaction between adjacent stages
Historically, the progression of an automotive sheet metal body formingfrom conception to production has been a segmented series of events.Styling, part design, material selection, dies design, die build, die tryout, andpart production have been performed in a sequential manner. Interactionbetween adjacent stages has been minimal at best. For example, diedesigners have had little input into the design of the part, and rarely did they
interact with the press room tryout staff. The activities of each segment inthe sequence have been conducted within its own sphere of work by its owngroup members. Interaction among the different groups has been verylimited.
Nowadays, simultaneous engineering requires that representatives fromall units involved in the conception to production sequence become involvedtogether at the earliest possible point in the design. Ideally, the simultaneousengineering concept even brings specialists from material, lubricant andother outside suppliers into the initial design phase, where major designchanges can be made most easily in a cost and time effective manner.
7/23/2019 Al Azraq Ingegneria Chimica Dei Materiali e Della Produzione
http://slidepdf.com/reader/full/al-azraq-ingegneria-chimica-dei-materiali-e-della-produzione 41/419
Section I
I.B . Plastic Deformation Process Al Azraq Soliman M.S
Numerical Simulation of Metal Sheet Plastic Deformation Page 35through Finite Element Method
Interaction of various functions requires a number of common crossoverpoints for all participants: identical language, understanding of basic sheetmetal formability, formability limits, press shop terminology, and aframework for analysis. Only then can diverse participants communicate andunderstand each other to accomplish the best, low cost design that will haveoptimum manufacturing feasibility.
Contents of this chapter
This chapter describes some of the most important methods of metalforming (Point I.B .2). Since this project deals with the stamping process, this
study will be focused on it, describing every stamping processes (PointI.B .3.2) with reference to some of main forming defects (Point I.B .6.1) andto the principal presses used to transform a simple sheet in a complex part(Point I.B .5.1).
I.B .2 - Manufacturing Processes
I.B .2.1 – Stamping
Stamping is one type of sheet metal forming process, which is widelyused in automotive industries. The popularity of stamping is mainly due to itshigh productivity, relatively low assembly costs and the ability to offer highstrength and lightweight products [1].
These process is applied with the intention of manufacturing a productwith a desired shape and no failures. The final product shape after stampingis defined by the tools, the blank and the process parameters.
Metal stamping involves forming a piece of metal with a dedicatedpiece of tooling and stamping the piece through a mechanical press. Duringthe metal stamping operation, the upper die is attached to the ram and the
lower die is attached to the stationary bolster. As the press is activated, theram moves vertically towards the bolster to form the piece of metal over thelower die. Metal stamping presses can perform a diverse range of operationssuch as blanking, piercing, forming and drawing as well as combinations ofthese processes.
These operations are done with dedicated tooling also known as hardtooling. This type of tooling is used to make high volume parts of oneconfiguration of part design. (By contrast, soft tooling is used in processessuch as CNC turret presses, laser profilers and press brakes). All theseoperations can be done either at a single die station or multiple die stations
— performing a progression of operations, known as a progressive die.
7/23/2019 Al Azraq Ingegneria Chimica Dei Materiali e Della Produzione
http://slidepdf.com/reader/full/al-azraq-ingegneria-chimica-dei-materiali-e-della-produzione 42/419
Section I
I.B . Plastic Deformation Process Al Azraq Soliman M.S
Numerical Simulation of Metal Sheet Plastic Deformation Page 36through Finite Element Method
The deformation patterns of the sheet material are influenced by thematerial properties and the friction conditions. Generally, sheet materialbehaves anisotropically which means that the material shows a differentdeformation behaviour in different directions because of the rolling process.
An example of anisotropy is the development of ears in cylindrical cupdrawing. The friction conditions during forming depend on the lubricant, thepresence of coatings on the blank, surface roughness of the tools and theblank, blankholder pressure and process velocity.
Without extensive knowledge of the influences of all these variables onthe deep stamping process, it is hardly possible to design the toolsadequately and make a proper choice of blank material and lubricant tomanufacture a product with the desired shape and performance.
In general, the deformation of sheet materials in the stamping process
is classified by four principal types of deformation modes; bending, deepdrawing, stretching and flanging.
I.B .2.2 – Roll Forming
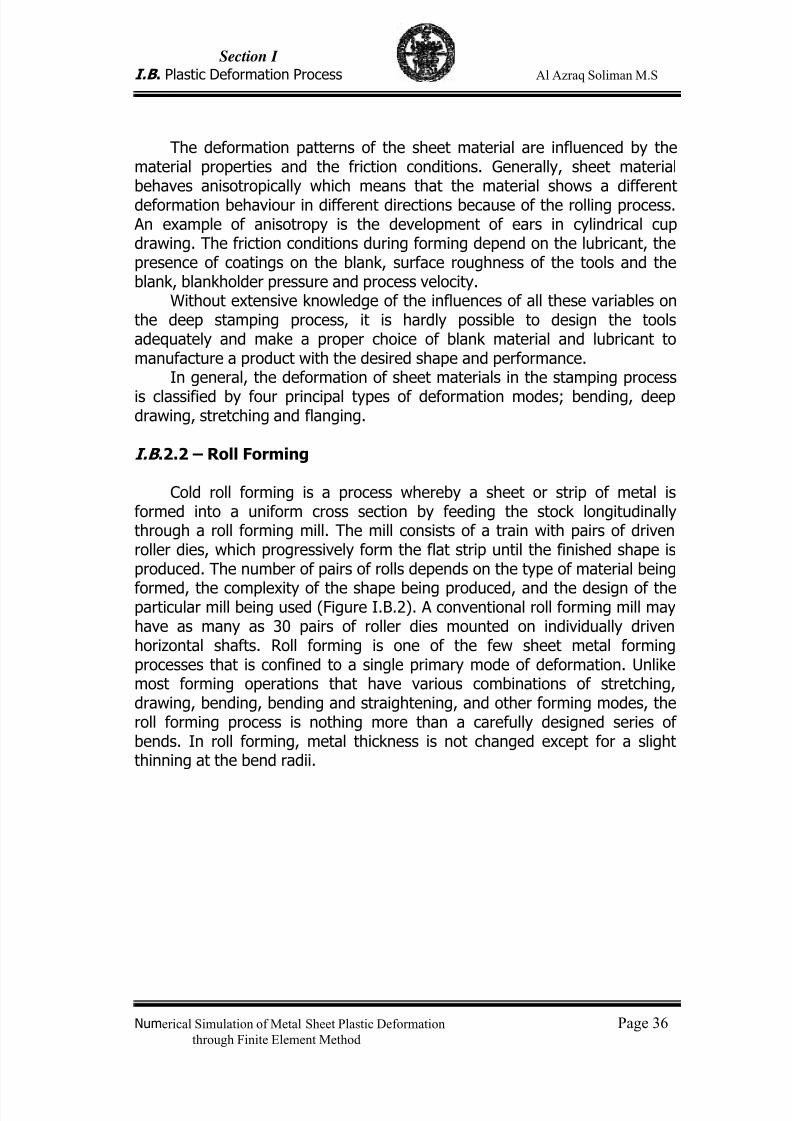
Cold roll forming is a process whereby a sheet or strip of metal isformed into a uniform cross section by feeding the stock longitudinallythrough a roll forming mill. The mill consists of a train with pairs of drivenroller dies, which progressively form the flat strip until the finished shape isproduced. The number of pairs of rolls depends on the type of material being
formed, the complexity of the shape being produced, and the design of theparticular mill being used (Figure I.B.2). A conventional roll forming mill mayhave as many as 30 pairs of roller dies mounted on individually drivenhorizontal shafts. Roll forming is one of the few sheet metal formingprocesses that is confined to a single primary mode of deformation. Unlikemost forming operations that have various combinations of stretching,drawing, bending, bending and straightening, and other forming modes, theroll forming process is nothing more than a carefully designed series ofbends. In roll forming, metal thickness is not changed except for a slightthinning at the bend radii.
7/23/2019 Al Azraq Ingegneria Chimica Dei Materiali e Della Produzione
http://slidepdf.com/reader/full/al-azraq-ingegneria-chimica-dei-materiali-e-della-produzione 43/419
Section I
I.B . Plastic Deformation Process Al Azraq Soliman M.S
Numerical Simulation of Metal Sheet Plastic Deformation Page 37through Finite Element Method
Figure I.B.2 – Roll Forming process.
The roll forming process is particularly suited to the production of longlengths of complex shapes held to close tolerances. Large quantities of theseparts can be formed with a minimum of handling and manpower. Theprocess can be continuous by coil feeding and exit cutting to length. Entrymaterial can be pre-painted or otherwise coated. Operations such asnotching, slotting, punching, embossing and curving can easily be combinedwith contour roll forming to produce finished parts off the exit end of the rollforming mill. In fact, ultra high-strength steel reinforcing beams, with sweepsup to 50, only need to have the mounting brackets welded to them beforeshipment to the assembly line.
I.B .2.3 - Hydroforming
There are two types of hydroforming, sheet and tubular. Sheethydroforming is typically a process where only a female die is constructedand a bladder membrane performs as the punch. High pressure fluid (usuallywater) forces the bladder against the steel sheet until it takes the shape ofthe female die. Sheet hydroforming has not been developed to the point it
can be effectively utilized by the automotive industry. It remains a processused for low volume, large parts such as those encountered in aircraft andbus sheet metal forming.
In tubular hydroforming, a straight or pre-bent tube is laid into a lowerdie. The upper and lower dies are then clamped together. Next, conicalnozzles are inserted and clamped into each end of the tube. Finally, a fluid(usually water) is forced at a high pressure into the tube until it takes theshape of the die. While tube hydroforming technology has been around fordecades, the mass production of automotive parts only became cost effectiveabout 1984.
7/23/2019 Al Azraq Ingegneria Chimica Dei Materiali e Della Produzione
http://slidepdf.com/reader/full/al-azraq-ingegneria-chimica-dei-materiali-e-della-produzione 44/419
Section I
I.B . Plastic Deformation Process Al Azraq Soliman M.S
Numerical Simulation of Metal Sheet Plastic Deformation Page 38through Finite Element Method
The benefits of hydroforming are usually found via part consolidationand the elimination of engineered scrap. Box sections, consisting of two hatsections welded together, lend themselves to cost-effective replacement by asingle hydroformed part. Punches, mounted in the forming dies, are used topierce holes during forming, eliminating subsequent machine operations.
The structural integrity of a hydroformed part, made from a singlecontinuous tube, is superior to that of a part made from two or morecomponents. Weight savings of 10 to 20% can be achieved via both reducinggauge and eliminating weld flanges. If flanges are necessary for attachment,they can be created by pinching the tube during the hydroforming process.
High volume tubular hydroformed parts are currently incorporated intoautomotive components such as axles, exhaust manifolds, suspensions,frames, drive shafts and shock absorbers. While hydroforming technology
has not been used to date for bumper systems, it does have potential overthe longer term due to the many advantages it offers
I.B .2.4 – Hot Forming (Plannja)
The Plannja hot forming process was developed by Plannja Hard Tech,a division of Plannja Steel, which in turn is a subsidiary of Swedish Steel AB.Plannja Hard Tech uses this process to produce a wide variety of productsfrom automotive door impact beams to lawn mower blades, to bumperreinforcing beams [2].
Developed blanks made from full hard, cold rolled, sheet steel arecontinuously fed into a gas fired furnace. The blanks are heated toaustenitizing temperatures, approximately 900° C, in about 3 to 5 minutes. Aset of two or four blanks, depending on their size, is then fed into a hydraulicpress. The press cycles down, remaining in that position while the diesquickly cool the formed blanks until the temperature is approximately 38° C,well below the martensite finish temperature. The time required to cool theparts in the dies is approximately 10 seconds per mm of thickness (ex. a setof parts 2 mm thick will take 20 seconds to cool).
The light scale that forms during the hot forming process is removed by
shot blasting with chromium shot. This leaves a thin film of chromium andiron on the surface of the part, thus eliminating the need for re-oiling toprevent oxidation and corrosion. If a very high degree of tolerance isrequired, holes can be machined into the finished part, but due to the ultrahigh-strength of the material in the finished part, it is best to incorporate theholes into the developed blank. The chemistry of the incoming steel and thecooling rate of the hot forming process are designed to achieve the finalmechanical properties of the finished part.
Yield strengths up to 1200 MPa result in high part strength and reducedpart weight. The combination of high hardness (up to 48 Rockwell C) andgood toughness gives improved wear resistance. The repeatability of
7/23/2019 Al Azraq Ingegneria Chimica Dei Materiali e Della Produzione
http://slidepdf.com/reader/full/al-azraq-ingegneria-chimica-dei-materiali-e-della-produzione 45/419
Section I
I.B . Plastic Deformation Process Al Azraq Soliman M.S
Numerical Simulation of Metal Sheet Plastic Deformation Page 39through Finite Element Method
dimensions is very good, even in long production runs. There is nospringback, a phenomenon which is common with cold forming processes.Weldability is excellent due to the low carbon content. Formability is alsoexcellent at the 900° C forming temperature. Highly complicated componentscan be produced in one piece. One disadvantage of the Plannja process isthe relatively slow production rate due to the length of time a part mustremain in the dies to ensure proper cooling
I.B .2.5 - Incremental Forming
This process is used to form sheet metal into complicated shapeswithout the use of either a male or female die. The process uses a singlepoint tool which plastically deforms sheet metal to give a local micro-
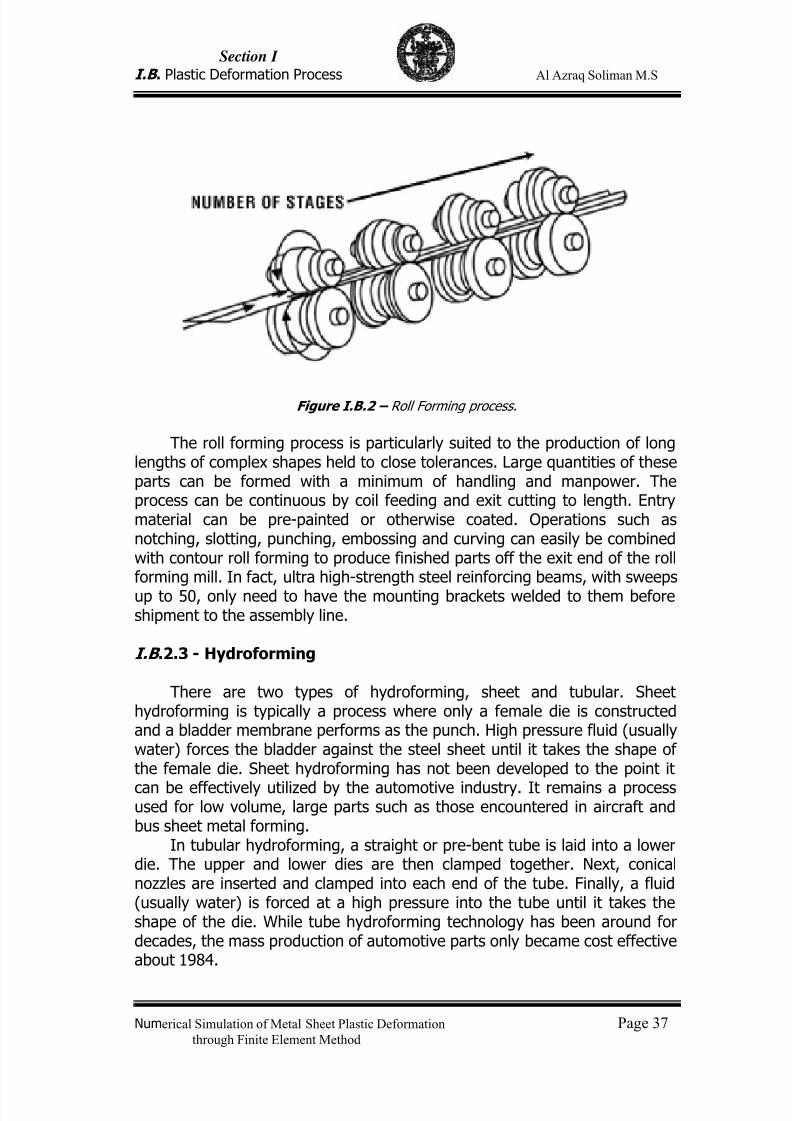
deformation. By doing this incrementally, and controlling the tool path with aCNC mill, the plastically deformed points are, in effect, added as the toolmoves to give a final shape (Figure I.B.3). The sheet metal is held in placeby a blankholder which moves in a vertical plane on four posts. Deformationof the strip can be achieved in one of two ways: either with a supporting,fixed tool about which the single point forming tool moves or by inversion ofthe process in which the supporting, fixed tool is not used.
Figure I.B.3 – Some stages of an Incremental forming process.
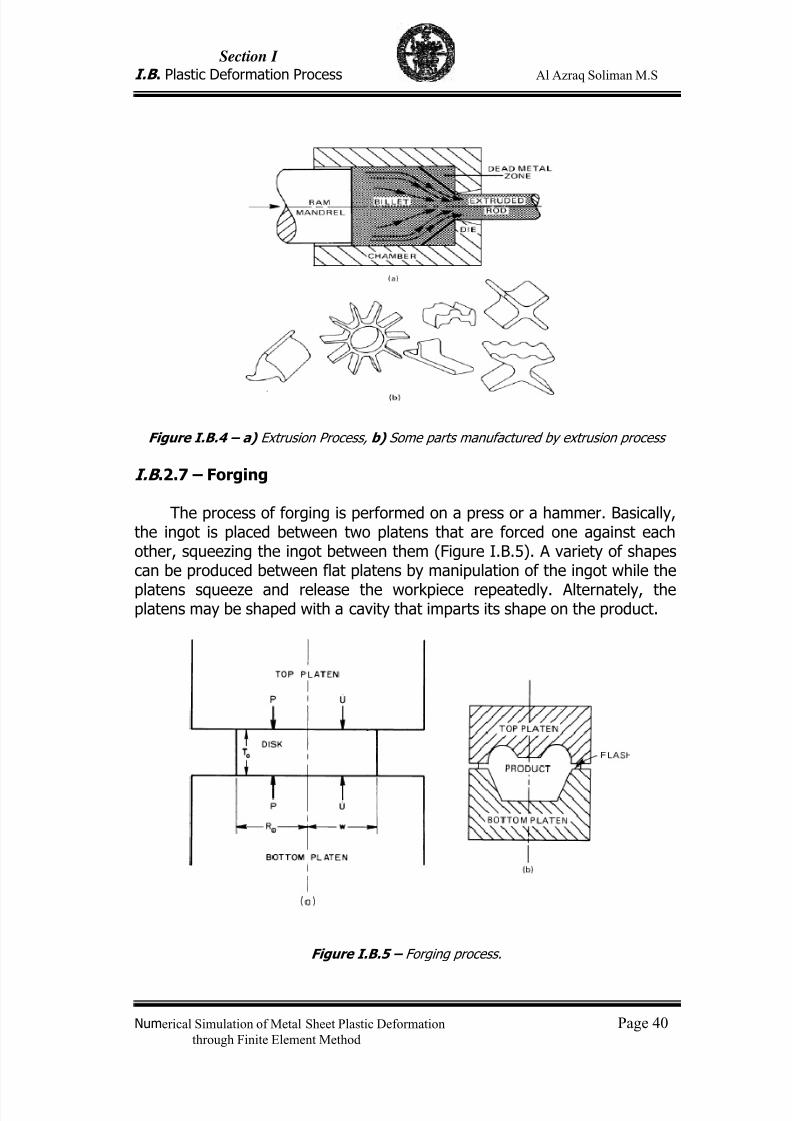
I.B .2.6 – Extrusion
In the process of extrusion (Figure I.B.4), a billet is placed into achamber with a shaped opening (called a die) on one end and a ram on theother. As the ram is forced into the chamber, the workpiece is forced outthrough the die. The extrudate, a long product (ex. a rod), emerges throughthe die duplicating its cross sectional shape. The flow lines indicate that adead metal zone forms in the corner on the exit side of the chamber wherethe separated ring of a triangular cross section remains stagnant.
7/23/2019 Al Azraq Ingegneria Chimica Dei Materiali e Della Produzione
http://slidepdf.com/reader/full/al-azraq-ingegneria-chimica-dei-materiali-e-della-produzione 46/419
Section I
I.B . Plastic Deformation Process Al Azraq Soliman M.S
Numerical Simulation of Metal Sheet Plastic Deformation Page 40through Finite Element Method
Figure I.B.4 – a) Extrusion Process, b) Some parts manufactured by extrusion process
I.B .2.7 – Forging
The process of forging is performed on a press or a hammer. Basically,the ingot is placed between two platens that are forced one against eachother, squeezing the ingot between them (Figure I.B.5). A variety of shapescan be produced between flat platens by manipulation of the ingot while the
platens squeeze and release the workpiece repeatedly. Alternately, theplatens may be shaped with a cavity that imparts its shape on the product.
Figure I.B.5 – Forging process.
7/23/2019 Al Azraq Ingegneria Chimica Dei Materiali e Della Produzione
http://slidepdf.com/reader/full/al-azraq-ingegneria-chimica-dei-materiali-e-della-produzione 47/419
Section I
I.B . Plastic Deformation Process Al Azraq Soliman M.S
Numerical Simulation of Metal Sheet Plastic Deformation Page 41through Finite Element Method
I.B .3 – Stamping Process
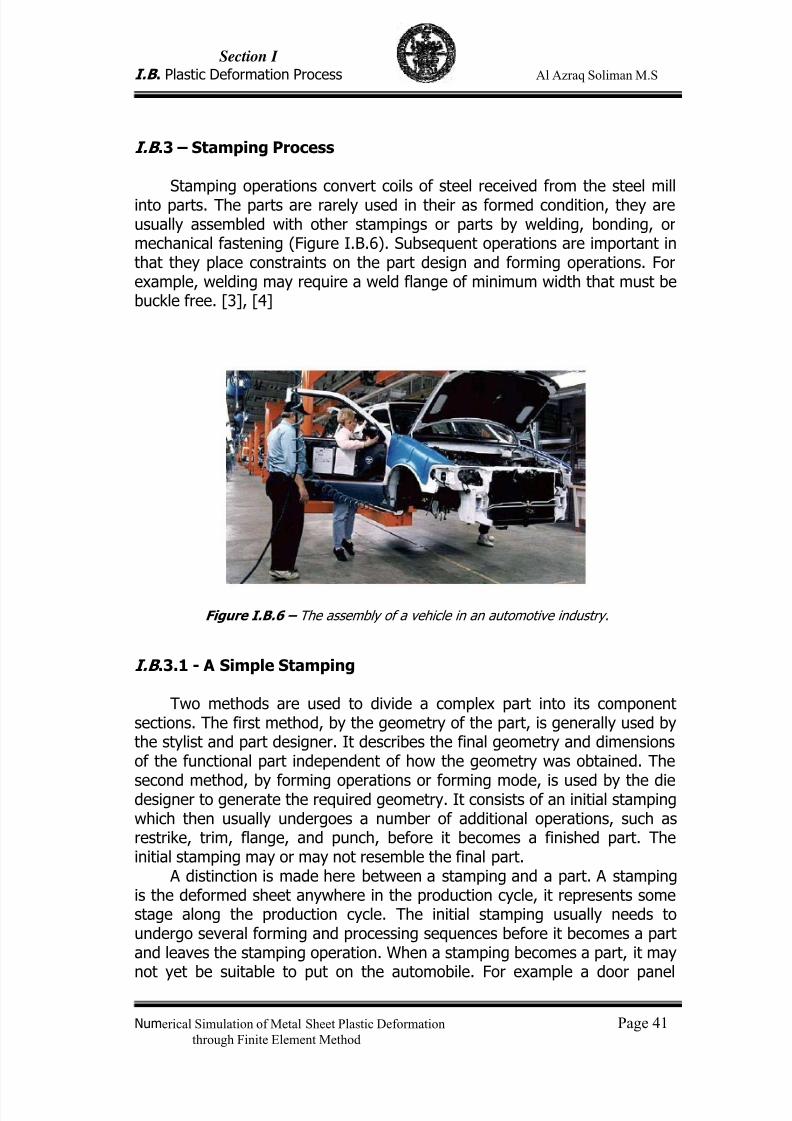
Stamping operations convert coils of steel received from the steel millinto parts. The parts are rarely used in their as formed condition, they areusually assembled with other stampings or parts by welding, bonding, ormechanical fastening (Figure I.B.6). Subsequent operations are important inthat they place constraints on the part design and forming operations. Forexample, welding may require a weld flange of minimum width that must bebuckle free. [3], [4]
Figure I.B.6 – The assembly of a vehicle in an automotive industry.
I.B .3.1 - A Simple Stamping
Two methods are used to divide a complex part into its componentsections. The first method, by the geometry of the part, is generally used bythe stylist and part designer. It describes the final geometry and dimensionsof the functional part independent of how the geometry was obtained. The
second method, by forming operations or forming mode, is used by the diedesigner to generate the required geometry. It consists of an initial stampingwhich then usually undergoes a number of additional operations, such asrestrike, trim, flange, and punch, before it becomes a finished part. Theinitial stamping may or may not resemble the final part.
A distinction is made here between a stamping and a part. A stampingis the deformed sheet anywhere in the production cycle, it represents somestage along the production cycle. The initial stamping usually needs toundergo several forming and processing sequences before it becomes a partand leaves the stamping operation. When a stamping becomes a part, it maynot yet be suitable to put on the automobile. For example a door panel
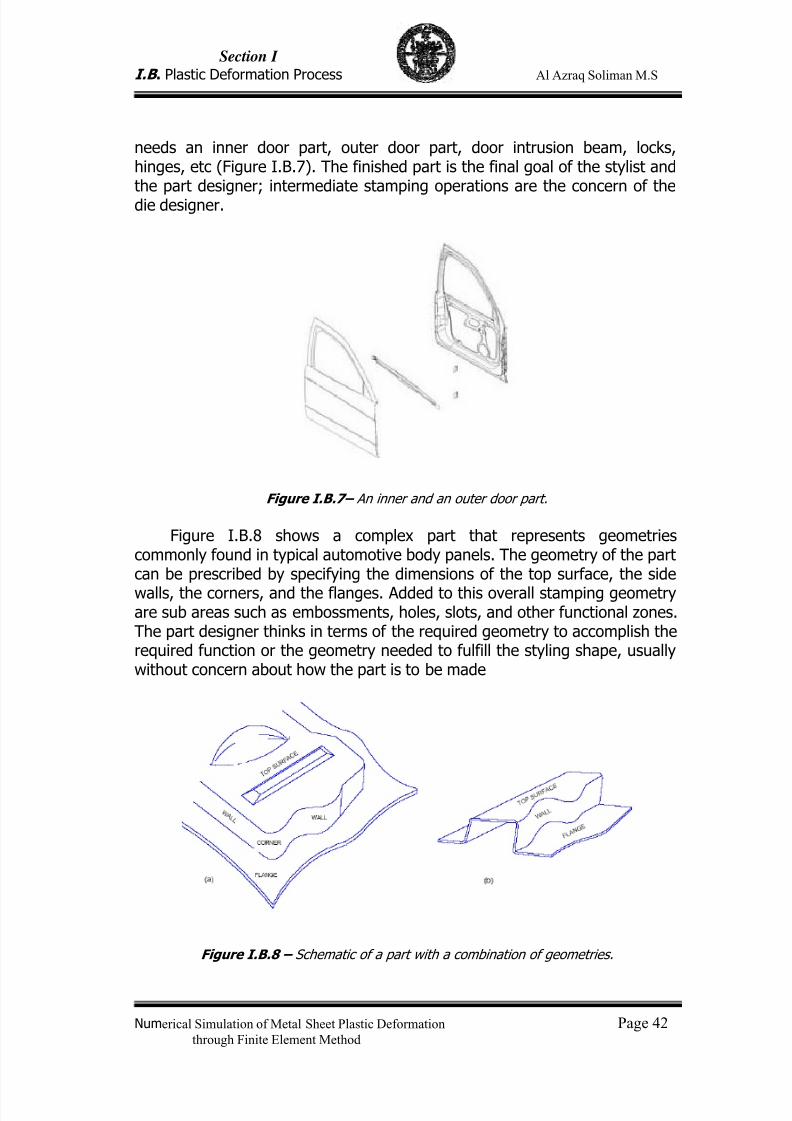
7/23/2019 Al Azraq Ingegneria Chimica Dei Materiali e Della Produzione
http://slidepdf.com/reader/full/al-azraq-ingegneria-chimica-dei-materiali-e-della-produzione 48/419
Section I
I.B . Plastic Deformation Process Al Azraq Soliman M.S
Numerical Simulation of Metal Sheet Plastic Deformation Page 42through Finite Element Method
needs an inner door part, outer door part, door intrusion beam, locks,hinges, etc (Figure I.B.7). The finished part is the final goal of the stylist andthe part designer; intermediate stamping operations are the concern of thedie designer.
Figure I.B.7– An inner and an outer door part.
Figure I.B.8 shows a complex part that represents geometriescommonly found in typical automotive body panels. The geometry of the partcan be prescribed by specifying the dimensions of the top surface, the side
walls, the corners, and the flanges. Added to this overall stamping geometryare sub areas such as embossments, holes, slots, and other functional zones.The part designer thinks in terms of the required geometry to accomplish therequired function or the geometry needed to fulfill the styling shape, usuallywithout concern about how the part is to be made
Figure I.B.8 – Schematic of a part with a combination of geometries.
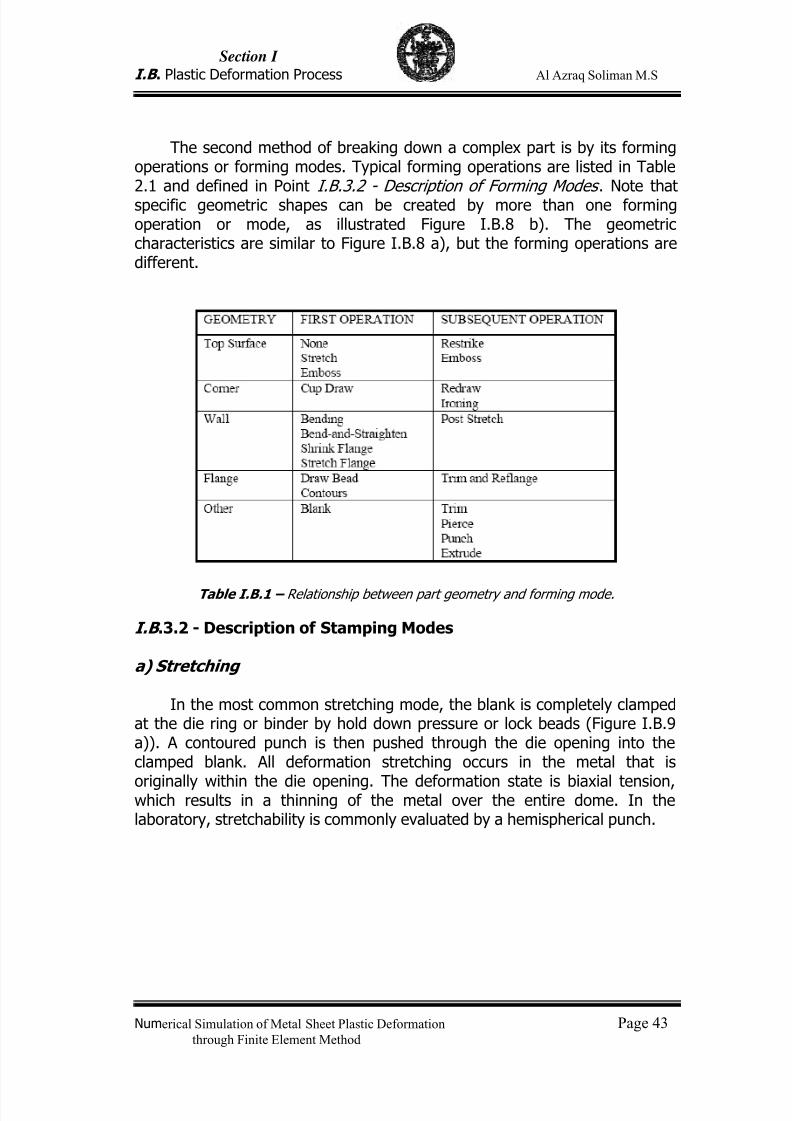
7/23/2019 Al Azraq Ingegneria Chimica Dei Materiali e Della Produzione
http://slidepdf.com/reader/full/al-azraq-ingegneria-chimica-dei-materiali-e-della-produzione 49/419
Section I
I.B . Plastic Deformation Process Al Azraq Soliman M.S
Numerical Simulation of Metal Sheet Plastic Deformation Page 43through Finite Element Method
The second method of breaking down a complex part is by its formingoperations or forming modes. Typical forming operations are listed in Table2.1 and defined in Point I.B.3.2 - Description of Forming Modes . Note thatspecific geometric shapes can be created by more than one formingoperation or mode, as illustrated Figure I.B.8 b). The geometriccharacteristics are similar to Figure I.B.8 a), but the forming operations aredifferent.
Table I.B.1 – Relationship between part geometry and forming mode.
I.B .3.2 - Description of Stamping Modes
a) Stretching
In the most common stretching mode, the blank is completely clampedat the die ring or binder by hold down pressure or lock beads (Figure I.B.9a)). A contoured punch is then pushed through the die opening into theclamped blank. All deformation stretching occurs in the metal that is
originally within the die opening. The deformation state is biaxial tension,which results in a thinning of the metal over the entire dome. In thelaboratory, stretchability is commonly evaluated by a hemispherical punch.
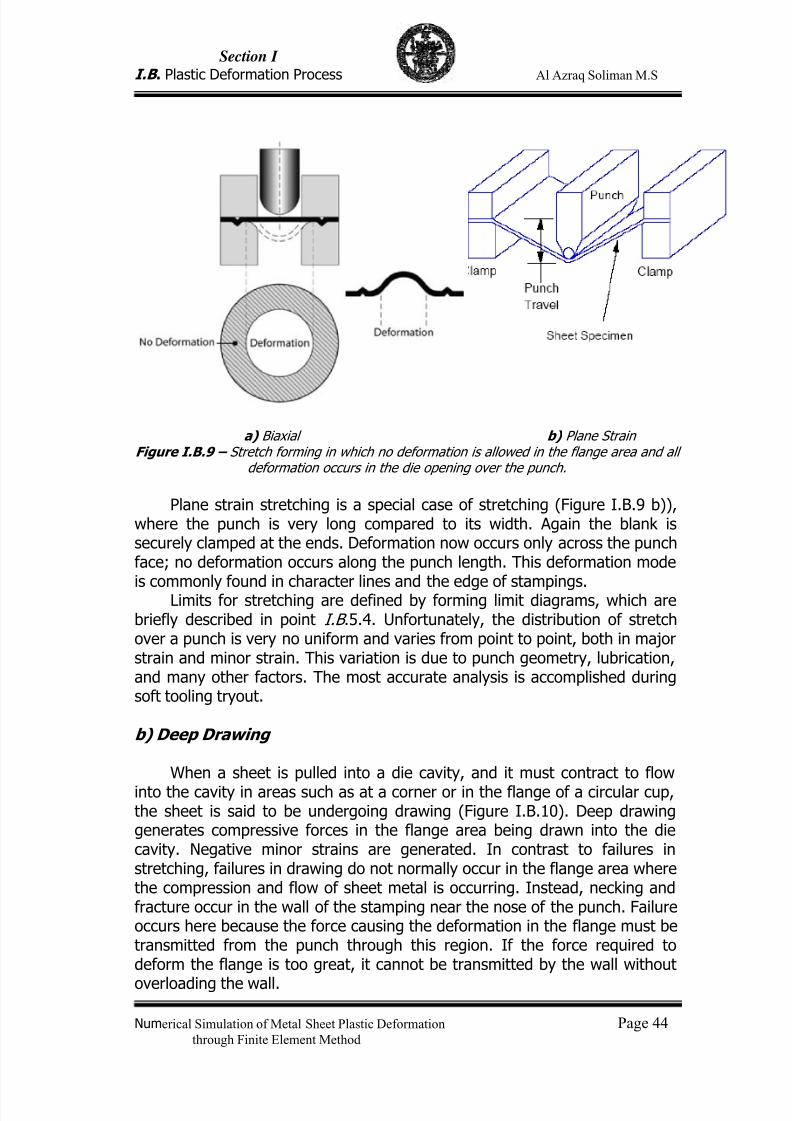
7/23/2019 Al Azraq Ingegneria Chimica Dei Materiali e Della Produzione
http://slidepdf.com/reader/full/al-azraq-ingegneria-chimica-dei-materiali-e-della-produzione 50/419
Section I
I.B . Plastic Deformation Process Al Azraq Soliman M.S
Numerical Simulation of Metal Sheet Plastic Deformation Page 44through Finite Element Method
a) Biaxial b) Plane StrainFigure I.B.9 – Stretch forming in which no deformation is allowed in the flange area and all
deformation occurs in the die opening over the punch.
Plane strain stretching is a special case of stretching (Figure I.B.9 b)),where the punch is very long compared to its width. Again the blank issecurely clamped at the ends. Deformation now occurs only across the punchface; no deformation occurs along the punch length. This deformation mode
is commonly found in character lines and the edge of stampings.Limits for stretching are defined by forming limit diagrams, which arebriefly described in point I.B .5.4. Unfortunately, the distribution of stretchover a punch is very no uniform and varies from point to point, both in majorstrain and minor strain. This variation is due to punch geometry, lubrication,and many other factors. The most accurate analysis is accomplished duringsoft tooling tryout.
b) Deep Drawing
When a sheet is pulled into a die cavity, and it must contract to flow
into the cavity in areas such as at a corner or in the flange of a circular cup,the sheet is said to be undergoing drawing (Figure I.B.10). Deep drawinggenerates compressive forces in the flange area being drawn into the diecavity. Negative minor strains are generated. In contrast to failures instretching, failures in drawing do not normally occur in the flange area wherethe compression and flow of sheet metal is occurring. Instead, necking andfracture occur in the wall of the stamping near the nose of the punch. Failureoccurs here because the force causing the deformation in the flange must betransmitted from the punch through this region. If the force required todeform the flange is too great, it cannot be transmitted by the wall without
overloading the wall.
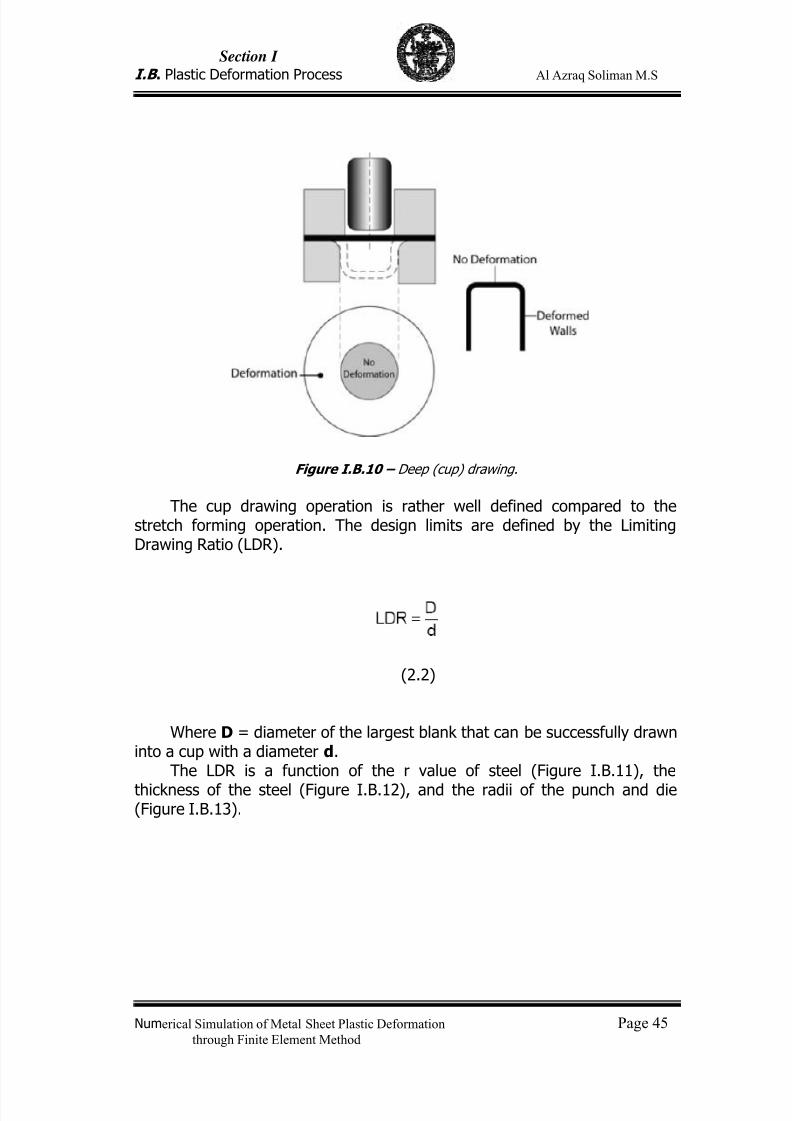
7/23/2019 Al Azraq Ingegneria Chimica Dei Materiali e Della Produzione
http://slidepdf.com/reader/full/al-azraq-ingegneria-chimica-dei-materiali-e-della-produzione 51/419
Section I
I.B . Plastic Deformation Process Al Azraq Soliman M.S
Numerical Simulation of Metal Sheet Plastic Deformation Page 45through Finite Element Method
Figure I.B.10 – Deep (cup) drawing.
The cup drawing operation is rather well defined compared to thestretch forming operation. The design limits are defined by the LimitingDrawing Ratio (LDR).
(2.2)
Where D = diameter of the largest blank that can be successfully drawninto a cup with a diameter d.
The LDR is a function of the r value of steel (Figure I.B.11), the
thickness of the steel (Figure I.B.12), and the radii of the punch and die(Figure I.B.13).
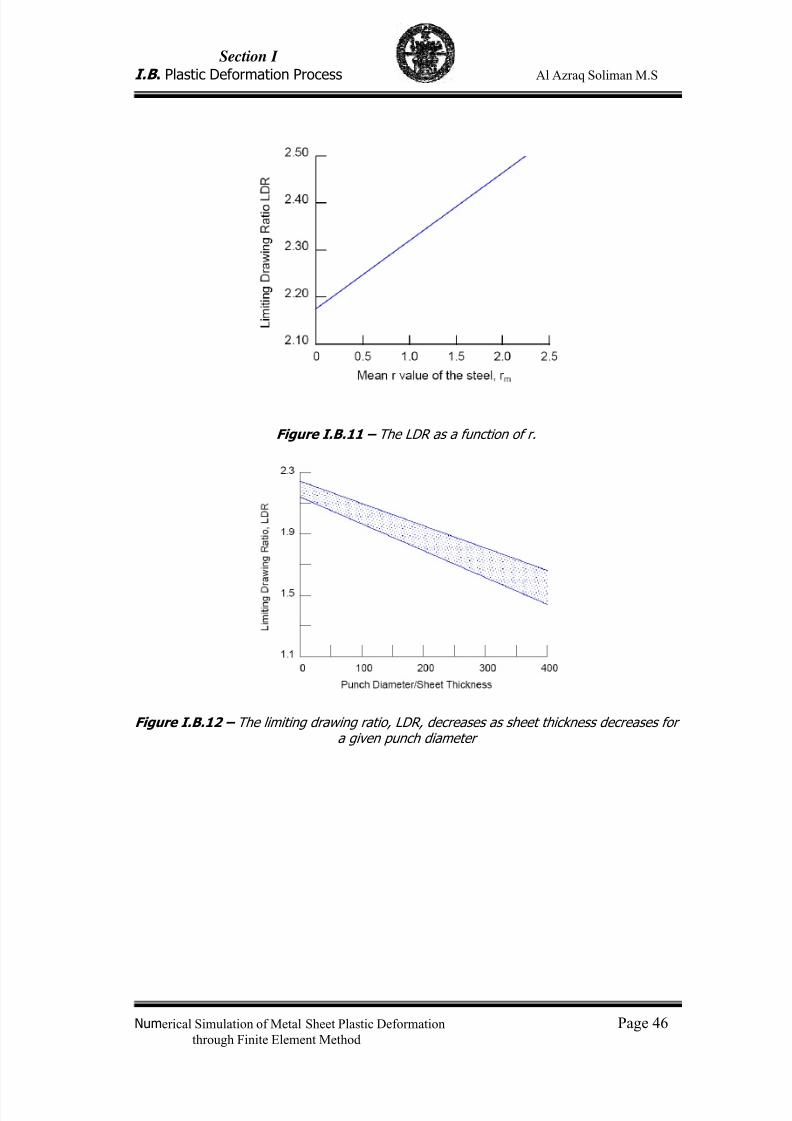
7/23/2019 Al Azraq Ingegneria Chimica Dei Materiali e Della Produzione
http://slidepdf.com/reader/full/al-azraq-ingegneria-chimica-dei-materiali-e-della-produzione 52/419
Section I
I.B . Plastic Deformation Process Al Azraq Soliman M.S
Numerical Simulation of Metal Sheet Plastic Deformation Page 46through Finite Element Method
Figure I.B.11 – The LDR as a function of r.
Figure I.B.12 – The limiting drawing ratio, LDR, decreases as sheet thickness decreases fora given punch diameter
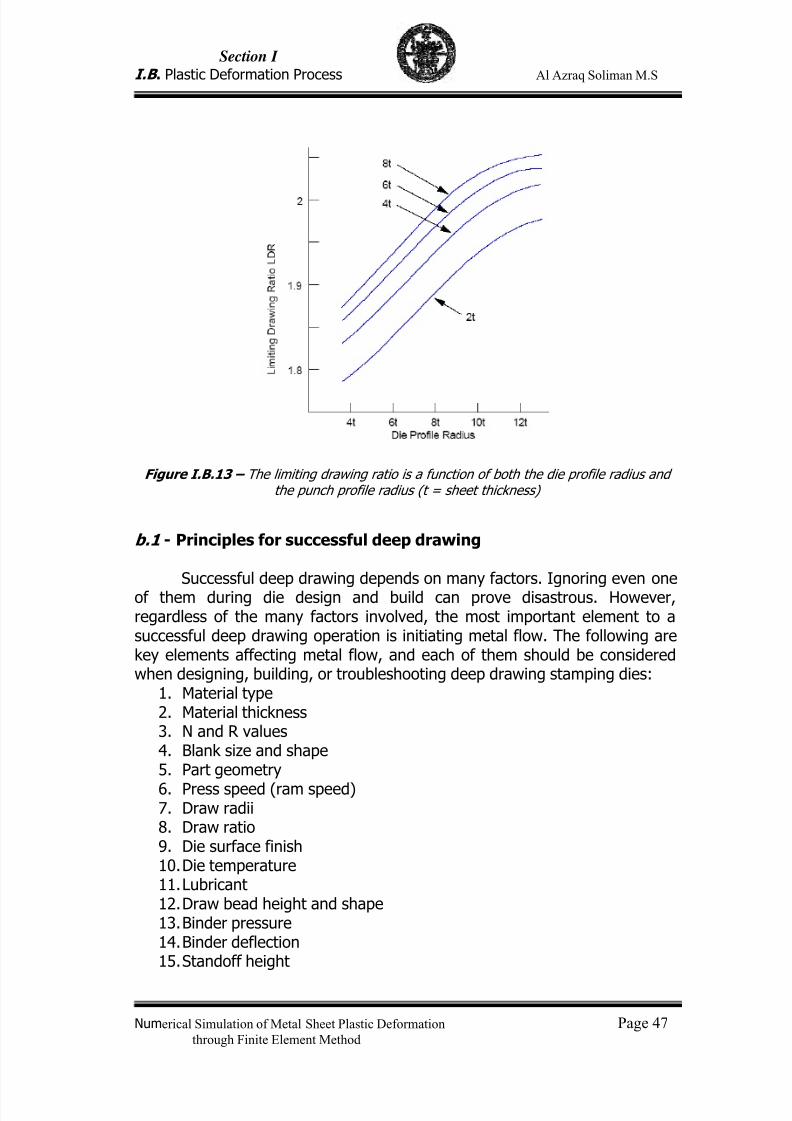
7/23/2019 Al Azraq Ingegneria Chimica Dei Materiali e Della Produzione
http://slidepdf.com/reader/full/al-azraq-ingegneria-chimica-dei-materiali-e-della-produzione 53/419
Section I
I.B . Plastic Deformation Process Al Azraq Soliman M.S
Numerical Simulation of Metal Sheet Plastic Deformation Page 47through Finite Element Method
Figure I.B.13 – The limiting drawing ratio is a function of both the die profile radius andthe punch profile radius (t = sheet thickness)
b.1 - Principles for successful deep drawing
Successful deep drawing depends on many factors. Ignoring even oneof them during die design and build can prove disastrous. However,regardless of the many factors involved, the most important element to asuccessful deep drawing operation is initiating metal flow. The following arekey elements affecting metal flow, and each of them should be consideredwhen designing, building, or troubleshooting deep drawing stamping dies:
1. Material type2. Material thickness3. N and R values4. Blank size and shape5. Part geometry
6.
Press speed (ram speed)7. Draw radii8. Draw ratio9. Die surface finish10. Die temperature11. Lubricant12. Draw bead height and shape13. Binder pressure14. Binder deflection15. Standoff height
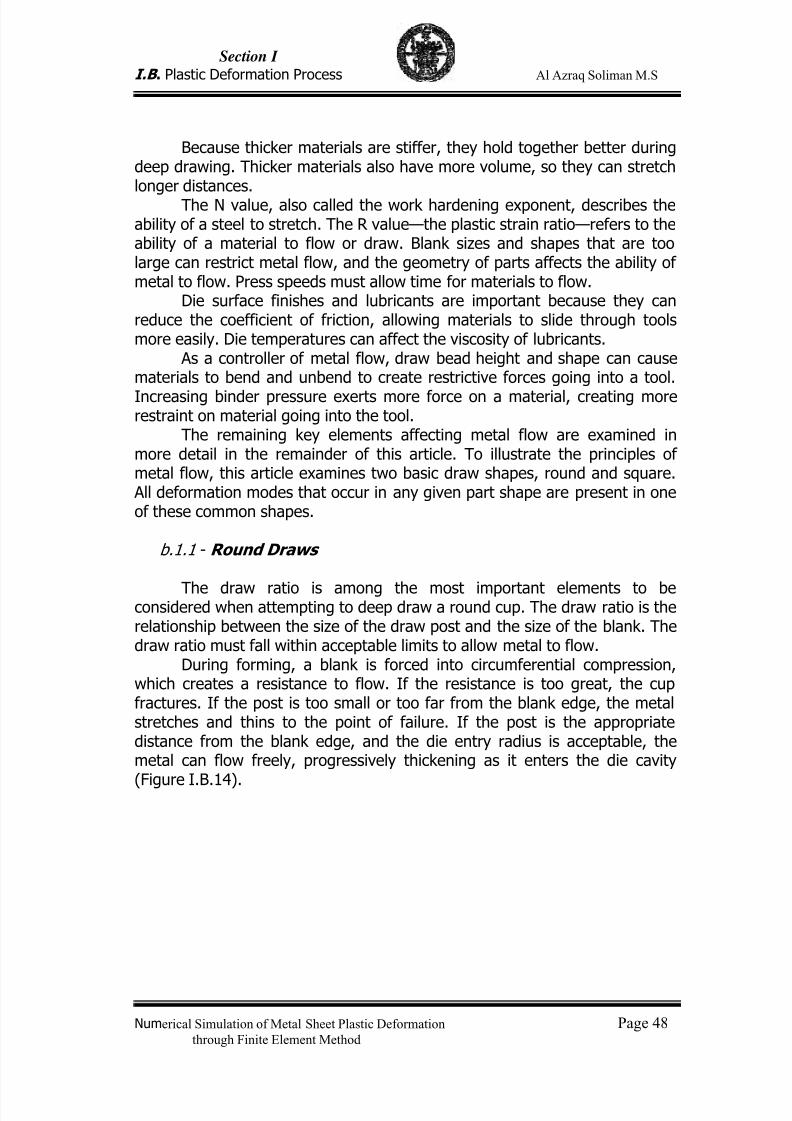
7/23/2019 Al Azraq Ingegneria Chimica Dei Materiali e Della Produzione
http://slidepdf.com/reader/full/al-azraq-ingegneria-chimica-dei-materiali-e-della-produzione 54/419
Section I
I.B . Plastic Deformation Process Al Azraq Soliman M.S
Numerical Simulation of Metal Sheet Plastic Deformation Page 48through Finite Element Method
Because thicker materials are stiffer, they hold together better duringdeep drawing. Thicker materials also have more volume, so they can stretchlonger distances.
The N value, also called the work hardening exponent, describes theability of a steel to stretch. The R value—the plastic strain ratio—refers to theability of a material to flow or draw. Blank sizes and shapes that are toolarge can restrict metal flow, and the geometry of parts affects the ability ofmetal to flow. Press speeds must allow time for materials to flow.
Die surface finishes and lubricants are important because they canreduce the coefficient of friction, allowing materials to slide through toolsmore easily. Die temperatures can affect the viscosity of lubricants.
As a controller of metal flow, draw bead height and shape can causematerials to bend and unbend to create restrictive forces going into a tool.
Increasing binder pressure exerts more force on a material, creating morerestraint on material going into the tool.
The remaining key elements affecting metal flow are examined inmore detail in the remainder of this article. To illustrate the principles ofmetal flow, this article examines two basic draw shapes, round and square.
All deformation modes that occur in any given part shape are present in oneof these common shapes.
b.1.1 - Round Draws
The draw ratio is among the most important elements to beconsidered when attempting to deep draw a round cup. The draw ratio is therelationship between the size of the draw post and the size of the blank. Thedraw ratio must fall within acceptable limits to allow metal to flow.
During forming, a blank is forced into circumferential compression,which creates a resistance to flow. If the resistance is too great, the cupfractures. If the post is too small or too far from the blank edge, the metalstretches and thins to the point of failure. If the post is the appropriatedistance from the blank edge, and the die entry radius is acceptable, themetal can flow freely, progressively thickening as it enters the die cavity
(Figure I.B.14).
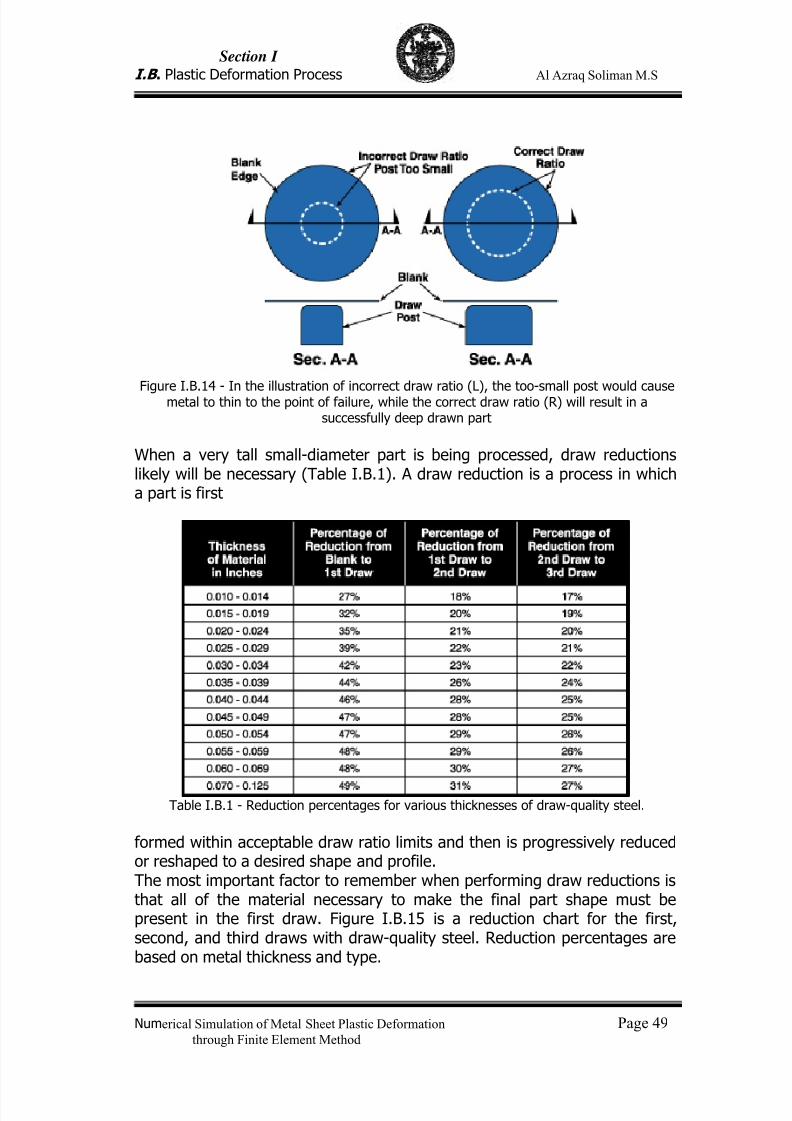
7/23/2019 Al Azraq Ingegneria Chimica Dei Materiali e Della Produzione
http://slidepdf.com/reader/full/al-azraq-ingegneria-chimica-dei-materiali-e-della-produzione 55/419
Section I
I.B . Plastic Deformation Process Al Azraq Soliman M.S
Numerical Simulation of Metal Sheet Plastic Deformation Page 49through Finite Element Method
Figure I.B.14 - In the illustration of incorrect draw ratio (L), the too-small post would causemetal to thin to the point of failure, while the correct draw ratio (R) will result in asuccessfully deep drawn part
When a very tall small-diameter part is being processed, draw reductionslikely will be necessary (Table I.B.1). A draw reduction is a process in whicha part is first
Table I.B.1 - Reduction percentages for various thicknesses of draw-quality steel.
formed within acceptable draw ratio limits and then is progressively reducedor reshaped to a desired shape and profile.The most important factor to remember when performing draw reductions isthat all of the material necessary to make the final part shape must bepresent in the first draw. Figure I.B.15 is a reduction chart for the first,second, and third draws with draw-quality steel. Reduction percentages arebased on metal thickness and type.
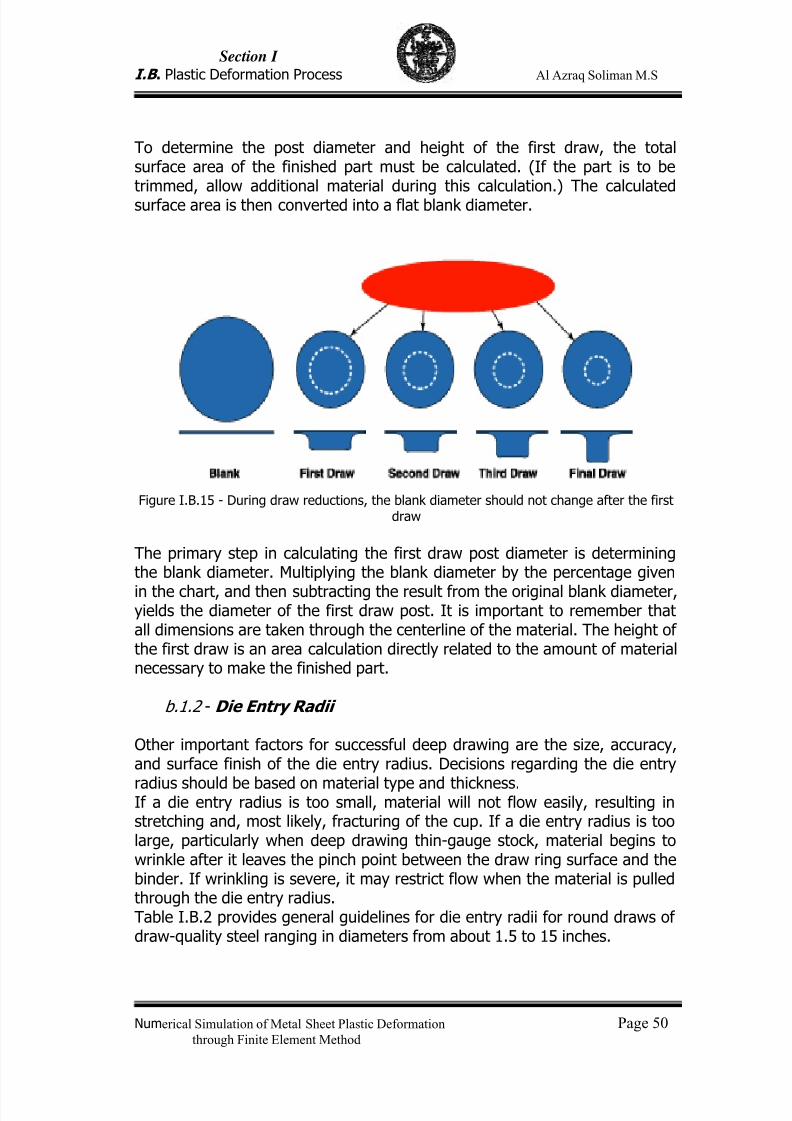
7/23/2019 Al Azraq Ingegneria Chimica Dei Materiali e Della Produzione
http://slidepdf.com/reader/full/al-azraq-ingegneria-chimica-dei-materiali-e-della-produzione 56/419
Section I
I.B . Plastic Deformation Process Al Azraq Soliman M.S
Numerical Simulation of Metal Sheet Plastic Deformation Page 50through Finite Element Method
To determine the post diameter and height of the first draw, the totalsurface area of the finished part must be calculated. (If the part is to betrimmed, allow additional material during this calculation.) The calculatedsurface area is then converted into a flat blank diameter.
Figure I.B.15 - During draw reductions, the blank diameter should not change after the firstdraw
The primary step in calculating the first draw post diameter is determiningthe blank diameter. Multiplying the blank diameter by the percentage given
in the chart, and then subtracting the result from the original blank diameter,yields the diameter of the first draw post. It is important to remember thatall dimensions are taken through the centerline of the material. The height ofthe first draw is an area calculation directly related to the amount of materialnecessary to make the finished part.
b.1.2 - Die Entry Radii
Other important factors for successful deep drawing are the size, accuracy,and surface finish of the die entry radius. Decisions regarding the die entry
radius should be based on material type and thickness.If a die entry radius is too small, material will not flow easily, resulting instretching and, most likely, fracturing of the cup. If a die entry radius is toolarge, particularly when deep drawing thin-gauge stock, material begins towrinkle after it leaves the pinch point between the draw ring surface and thebinder. If wrinkling is severe, it may restrict flow when the material is pulledthrough the die entry radius.Table I.B.2 provides general guidelines for die entry radii for round draws ofdraw-quality steel ranging in diameters from about 1.5 to 15 inches.
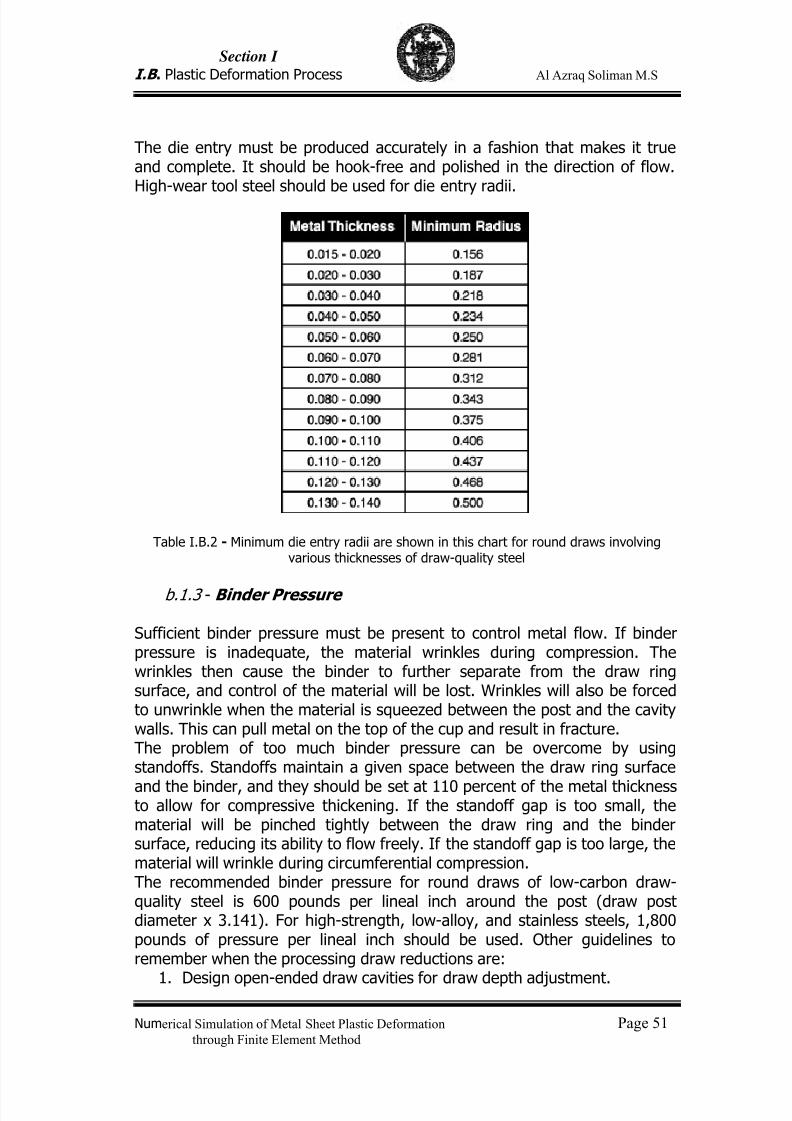
7/23/2019 Al Azraq Ingegneria Chimica Dei Materiali e Della Produzione
http://slidepdf.com/reader/full/al-azraq-ingegneria-chimica-dei-materiali-e-della-produzione 57/419
Section I
I.B . Plastic Deformation Process Al Azraq Soliman M.S
Numerical Simulation of Metal Sheet Plastic Deformation Page 51through Finite Element Method
The die entry must be produced accurately in a fashion that makes it trueand complete. It should be hook-free and polished in the direction of flow.High-wear tool steel should be used for die entry radii.
Table I.B.2 - Minimum die entry radii are shown in this chart for round draws involvingvarious thicknesses of draw-quality steel
b.1.3 - Binder Pressure
Sufficient binder pressure must be present to control metal flow. If binderpressure is inadequate, the material wrinkles during compression. Thewrinkles then cause the binder to further separate from the draw ringsurface, and control of the material will be lost. Wrinkles will also be forcedto unwrinkle when the material is squeezed between the post and the cavitywalls. This can pull metal on the top of the cup and result in fracture.The problem of too much binder pressure can be overcome by usingstandoffs. Standoffs maintain a given space between the draw ring surface
and the binder, and they should be set at 110 percent of the metal thicknessto allow for compressive thickening. If the standoff gap is too small, thematerial will be pinched tightly between the draw ring and the bindersurface, reducing its ability to flow freely. If the standoff gap is too large, thematerial will wrinkle during circumferential compression.The recommended binder pressure for round draws of low-carbon draw-quality steel is 600 pounds per lineal inch around the post (draw postdiameter x 3.141). For high-strength, low-alloy, and stainless steels, 1,800pounds of pressure per lineal inch should be used. Other guidelines toremember when the processing draw reductions are:
1.
Design open-ended draw cavities for draw depth adjustment.
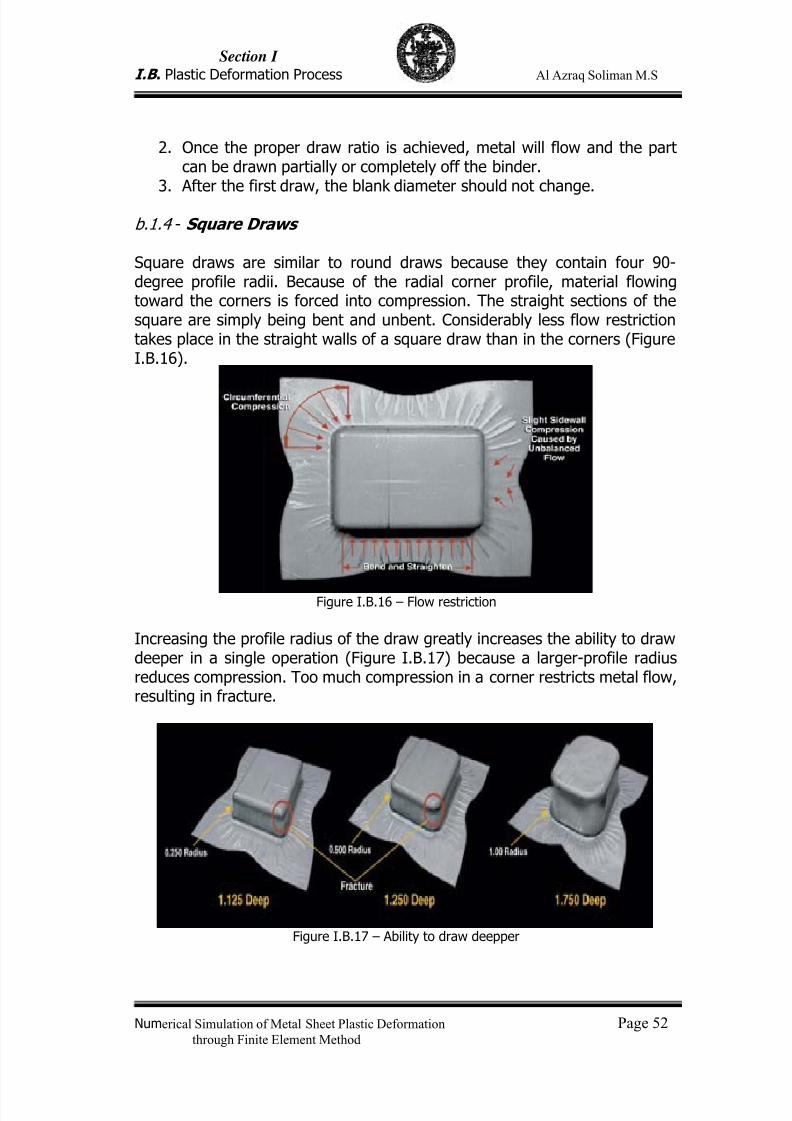
7/23/2019 Al Azraq Ingegneria Chimica Dei Materiali e Della Produzione
http://slidepdf.com/reader/full/al-azraq-ingegneria-chimica-dei-materiali-e-della-produzione 58/419
Section I
I.B . Plastic Deformation Process Al Azraq Soliman M.S
Numerical Simulation of Metal Sheet Plastic Deformation Page 52through Finite Element Method
2. Once the proper draw ratio is achieved, metal will flow and the partcan be drawn partially or completely off the binder.
3. After the first draw, the blank diameter should not change.
b.1.4 - Square Draws
Square draws are similar to round draws because they contain four 90-degree profile radii. Because of the radial corner profile, material flowingtoward the corners is forced into compression. The straight sections of thesquare are simply being bent and unbent. Considerably less flow restrictiontakes place in the straight walls of a square draw than in the corners (FigureI.B.16).
Figure I.B.16 – Flow restriction
Increasing the profile radius of the draw greatly increases the ability to drawdeeper in a single operation (Figure I.B.17) because a larger-profile radiusreduces compression. Too much compression in a corner restricts metal flow,resulting in fracture.
Figure I.B.17 – Ability to draw deepper
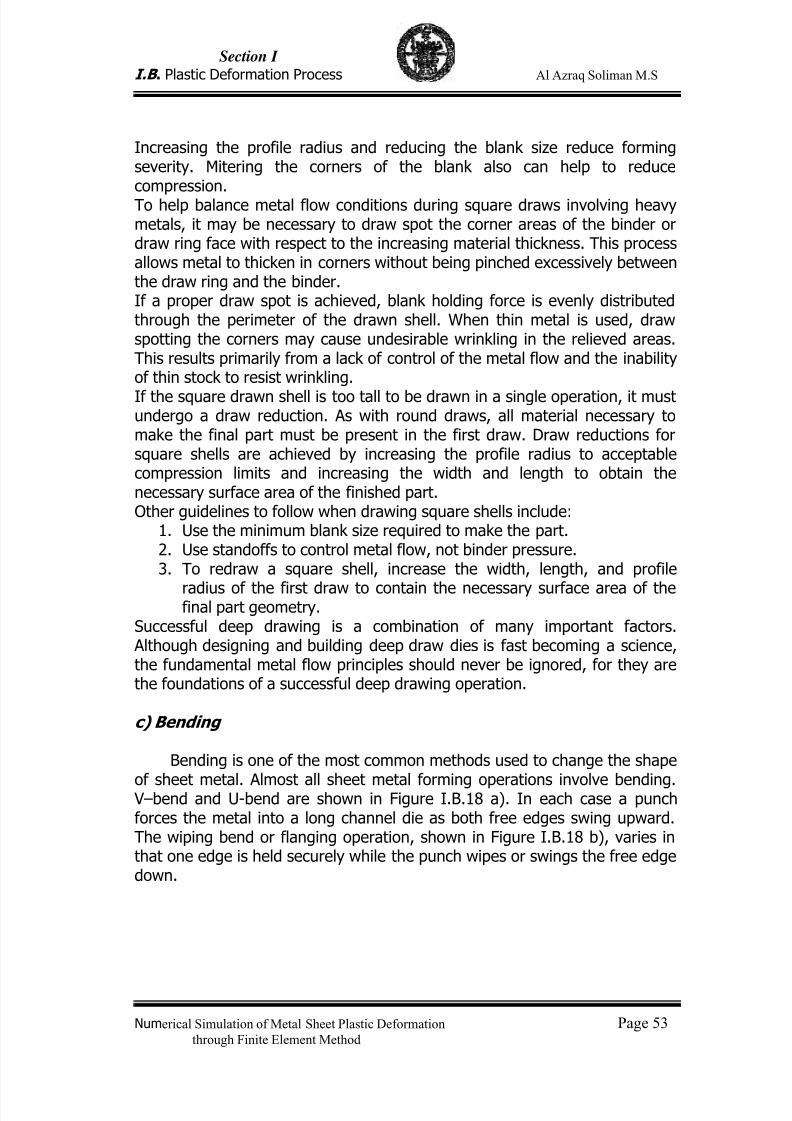
7/23/2019 Al Azraq Ingegneria Chimica Dei Materiali e Della Produzione
http://slidepdf.com/reader/full/al-azraq-ingegneria-chimica-dei-materiali-e-della-produzione 59/419
Section I
I.B . Plastic Deformation Process Al Azraq Soliman M.S
Numerical Simulation of Metal Sheet Plastic Deformation Page 53through Finite Element Method
Increasing the profile radius and reducing the blank size reduce formingseverity. Mitering the corners of the blank also can help to reducecompression.To help balance metal flow conditions during square draws involving heavymetals, it may be necessary to draw spot the corner areas of the binder ordraw ring face with respect to the increasing material thickness. This processallows metal to thicken in corners without being pinched excessively betweenthe draw ring and the binder.If a proper draw spot is achieved, blank holding force is evenly distributedthrough the perimeter of the drawn shell. When thin metal is used, drawspotting the corners may cause undesirable wrinkling in the relieved areas.This results primarily from a lack of control of the metal flow and the inabilityof thin stock to resist wrinkling.
If the square drawn shell is too tall to be drawn in a single operation, it mustundergo a draw reduction. As with round draws, all material necessary tomake the final part must be present in the first draw. Draw reductions forsquare shells are achieved by increasing the profile radius to acceptablecompression limits and increasing the width and length to obtain thenecessary surface area of the finished part.Other guidelines to follow when drawing square shells include:
1. Use the minimum blank size required to make the part.2. Use standoffs to control metal flow, not binder pressure.3. To redraw a square shell, increase the width, length, and profile
radius of the first draw to contain the necessary surface area of thefinal part geometry.
Successful deep drawing is a combination of many important factors. Although designing and building deep draw dies is fast becoming a science,the fundamental metal flow principles should never be ignored, for they arethe foundations of a successful deep drawing operation.
c) Bending
Bending is one of the most common methods used to change the shape
of sheet metal. Almost all sheet metal forming operations involve bending. V–bend and U-bend are shown in Figure I.B.18 a). In each case a punchforces the metal into a long channel die as both free edges swing upward.The wiping bend or flanging operation, shown in Figure I.B.18 b), varies inthat one edge is held securely while the punch wipes or swings the free edgedown.
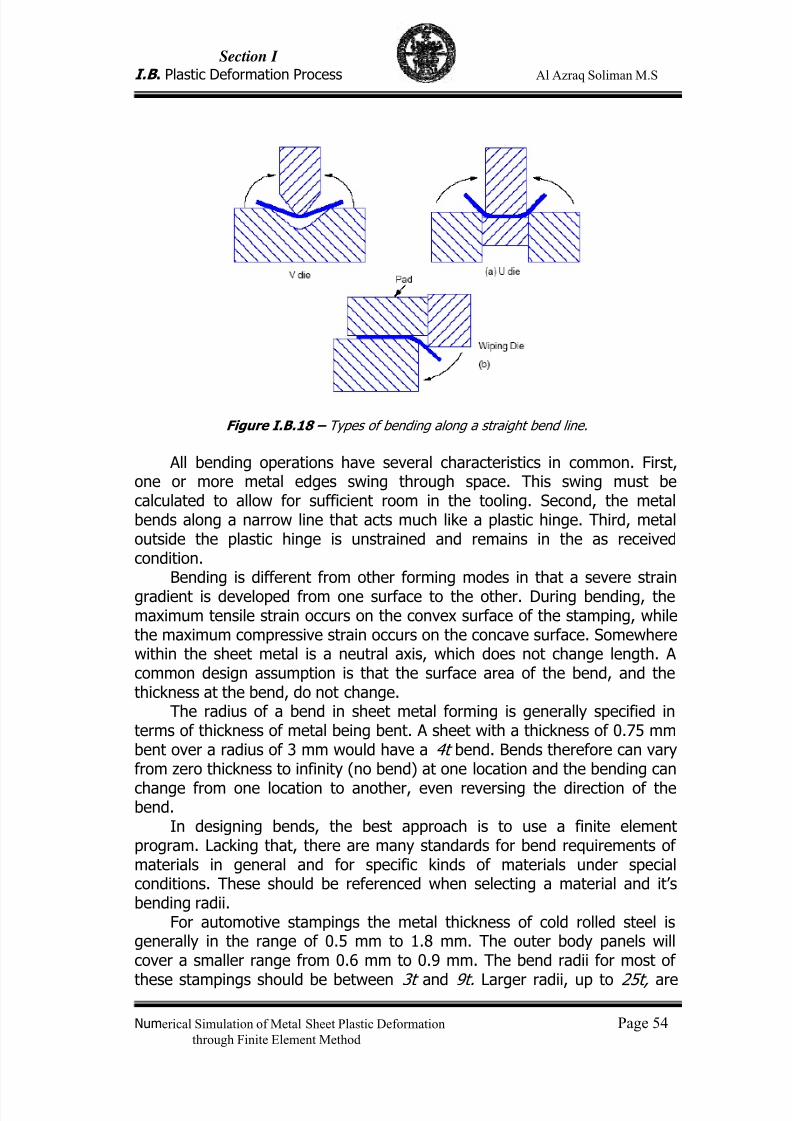
7/23/2019 Al Azraq Ingegneria Chimica Dei Materiali e Della Produzione
http://slidepdf.com/reader/full/al-azraq-ingegneria-chimica-dei-materiali-e-della-produzione 60/419
Section I
I.B . Plastic Deformation Process Al Azraq Soliman M.S
Numerical Simulation of Metal Sheet Plastic Deformation Page 54through Finite Element Method
Figure I.B.18 – Types of bending along a straight bend line.
All bending operations have several characteristics in common. First,one or more metal edges swing through space. This swing must becalculated to allow for sufficient room in the tooling. Second, the metalbends along a narrow line that acts much like a plastic hinge. Third, metaloutside the plastic hinge is unstrained and remains in the as receivedcondition.
Bending is different from other forming modes in that a severe straingradient is developed from one surface to the other. During bending, themaximum tensile strain occurs on the convex surface of the stamping, whilethe maximum compressive strain occurs on the concave surface. Somewherewithin the sheet metal is a neutral axis, which does not change length. Acommon design assumption is that the surface area of the bend, and thethickness at the bend, do not change.
The radius of a bend in sheet metal forming is generally specified interms of thickness of metal being bent. A sheet with a thickness of 0.75 mmbent over a radius of 3 mm would have a 4t bend. Bends therefore can varyfrom zero thickness to infinity (no bend) at one location and the bending can
change from one location to another, even reversing the direction of thebend.
In designing bends, the best approach is to use a finite elementprogram. Lacking that, there are many standards for bend requirements ofmaterials in general and for specific kinds of materials under specialconditions. These should be referenced when selecting a material and it’sbending radii.
For automotive stampings the metal thickness of cold rolled steel isgenerally in the range of 0.5 mm to 1.8 mm. The outer body panels willcover a smaller range from 0.6 mm to 0.9 mm. The bend radii for most of
these stampings should be between 3t and 9t. Larger radii, up to 25t, are
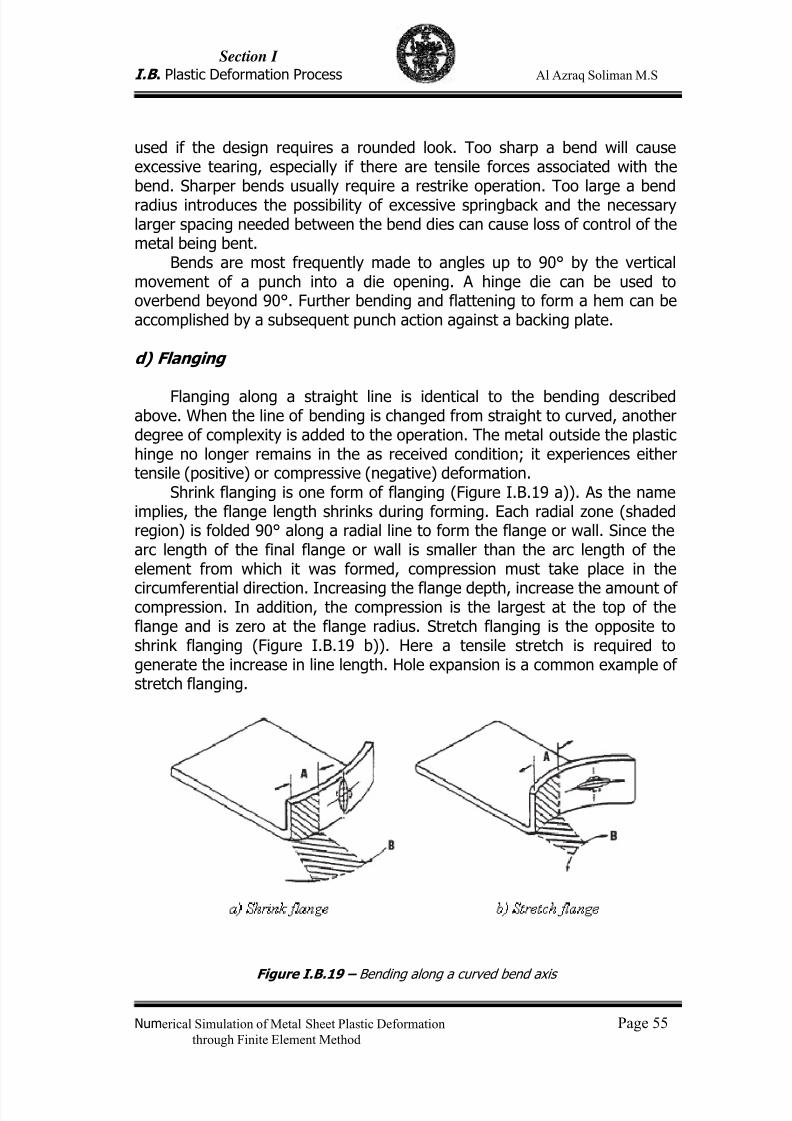
7/23/2019 Al Azraq Ingegneria Chimica Dei Materiali e Della Produzione
http://slidepdf.com/reader/full/al-azraq-ingegneria-chimica-dei-materiali-e-della-produzione 61/419
Section I
I.B . Plastic Deformation Process Al Azraq Soliman M.S
Numerical Simulation of Metal Sheet Plastic Deformation Page 55through Finite Element Method
used if the design requires a rounded look. Too sharp a bend will causeexcessive tearing, especially if there are tensile forces associated with thebend. Sharper bends usually require a restrike operation. Too large a bendradius introduces the possibility of excessive springback and the necessarylarger spacing needed between the bend dies can cause loss of control of themetal being bent.
Bends are most frequently made to angles up to 90° by the verticalmovement of a punch into a die opening. A hinge die can be used tooverbend beyond 90°. Further bending and flattening to form a hem can beaccomplished by a subsequent punch action against a backing plate.
d) Flanging
Flanging along a straight line is identical to the bending describedabove. When the line of bending is changed from straight to curved, anotherdegree of complexity is added to the operation. The metal outside the plastichinge no longer remains in the as received condition; it experiences eithertensile (positive) or compressive (negative) deformation.
Shrink flanging is one form of flanging (Figure I.B.19 a)). As the nameimplies, the flange length shrinks during forming. Each radial zone (shadedregion) is folded 90° along a radial line to form the flange or wall. Since thearc length of the final flange or wall is smaller than the arc length of theelement from which it was formed, compression must take place in the
circumferential direction. Increasing the flange depth, increase the amount ofcompression. In addition, the compression is the largest at the top of theflange and is zero at the flange radius. Stretch flanging is the opposite toshrink flanging (Figure I.B.19 b)). Here a tensile stretch is required togenerate the increase in line length. Hole expansion is a common example ofstretch flanging.
Figure I.B.19 – Bending along a curved bend axis
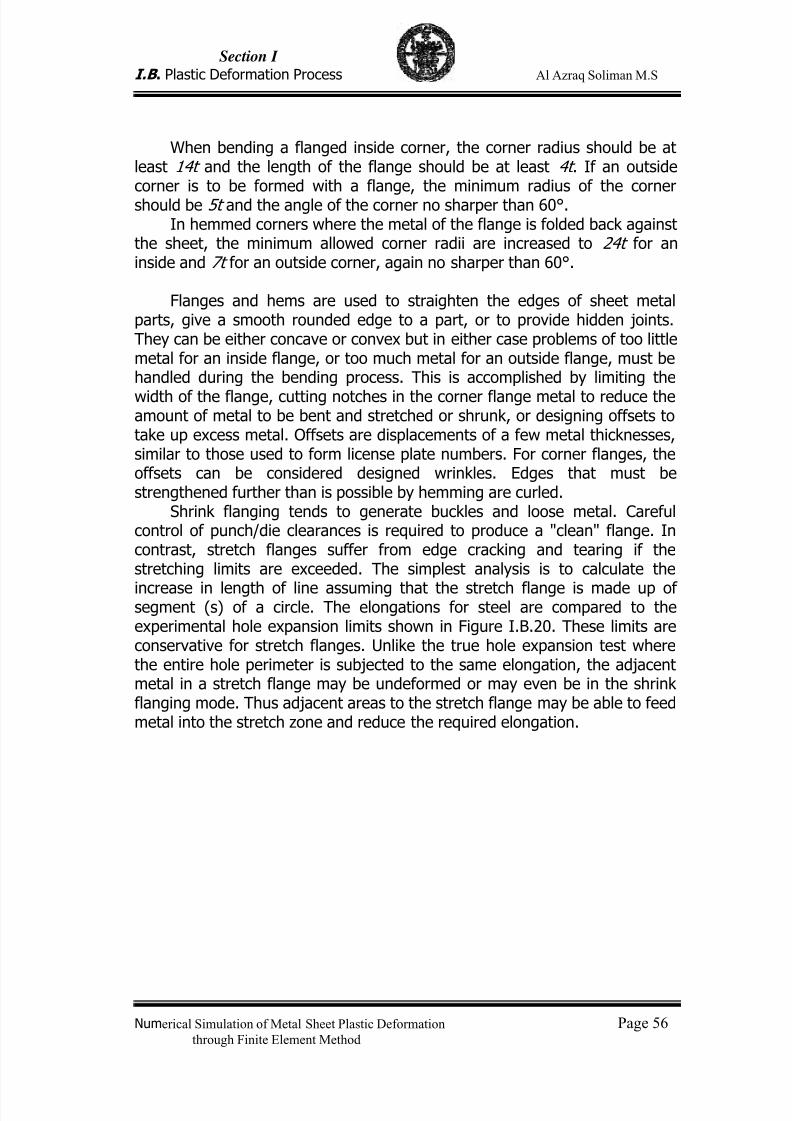
7/23/2019 Al Azraq Ingegneria Chimica Dei Materiali e Della Produzione
http://slidepdf.com/reader/full/al-azraq-ingegneria-chimica-dei-materiali-e-della-produzione 62/419
Section I
I.B . Plastic Deformation Process Al Azraq Soliman M.S
Numerical Simulation of Metal Sheet Plastic Deformation Page 56through Finite Element Method
When bending a flanged inside corner, the corner radius should be atleast 14t and the length of the flange should be at least 4t . If an outsidecorner is to be formed with a flange, the minimum radius of the cornershould be 5t and the angle of the corner no sharper than 60°.
In hemmed corners where the metal of the flange is folded back againstthe sheet, the minimum allowed corner radii are increased to 24t for aninside and 7t for an outside corner, again no sharper than 60°.
Flanges and hems are used to straighten the edges of sheet metalparts, give a smooth rounded edge to a part, or to provide hidden joints.They can be either concave or convex but in either case problems of too littlemetal for an inside flange, or too much metal for an outside flange, must behandled during the bending process. This is accomplished by limiting the
width of the flange, cutting notches in the corner flange metal to reduce theamount of metal to be bent and stretched or shrunk, or designing offsets totake up excess metal. Offsets are displacements of a few metal thicknesses,similar to those used to form license plate numbers. For corner flanges, theoffsets can be considered designed wrinkles. Edges that must bestrengthened further than is possible by hemming are curled.
Shrink flanging tends to generate buckles and loose metal. Carefulcontrol of punch/die clearances is required to produce a "clean" flange. Incontrast, stretch flanges suffer from edge cracking and tearing if thestretching limits are exceeded. The simplest analysis is to calculate the
increase in length of line assuming that the stretch flange is made up ofsegment (s) of a circle. The elongations for steel are compared to theexperimental hole expansion limits shown in Figure I.B.20. These limits areconservative for stretch flanges. Unlike the true hole expansion test wherethe entire hole perimeter is subjected to the same elongation, the adjacentmetal in a stretch flange may be undeformed or may even be in the shrinkflanging mode. Thus adjacent areas to the stretch flange may be able to feedmetal into the stretch zone and reduce the required elongation.
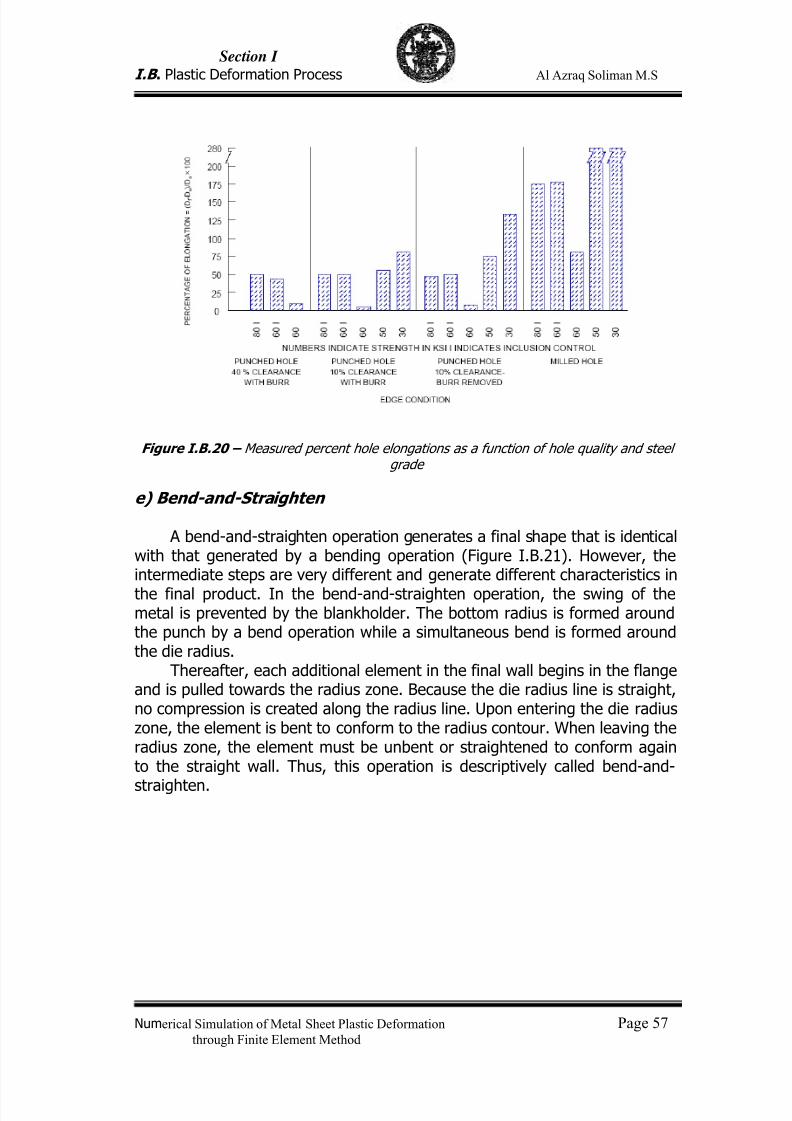
7/23/2019 Al Azraq Ingegneria Chimica Dei Materiali e Della Produzione
http://slidepdf.com/reader/full/al-azraq-ingegneria-chimica-dei-materiali-e-della-produzione 63/419
Section I
I.B . Plastic Deformation Process Al Azraq Soliman M.S
Numerical Simulation of Metal Sheet Plastic Deformation Page 57through Finite Element Method
Figure I.B.20 – Measured percent hole elongations as a function of hole quality and steelgrade
e) Bend-and-Straighten
A bend-and-straighten operation generates a final shape that is identicalwith that generated by a bending operation (Figure I.B.21). However, theintermediate steps are very different and generate different characteristics in
the final product. In the bend-and-straighten operation, the swing of themetal is prevented by the blankholder. The bottom radius is formed aroundthe punch by a bend operation while a simultaneous bend is formed aroundthe die radius.
Thereafter, each additional element in the final wall begins in the flangeand is pulled towards the radius zone. Because the die radius line is straight,no compression is created along the radius line. Upon entering the die radiuszone, the element is bent to conform to the radius contour. When leaving theradius zone, the element must be unbent or straightened to conform againto the straight wall. Thus, this operation is descriptively called bend-and-
straighten.
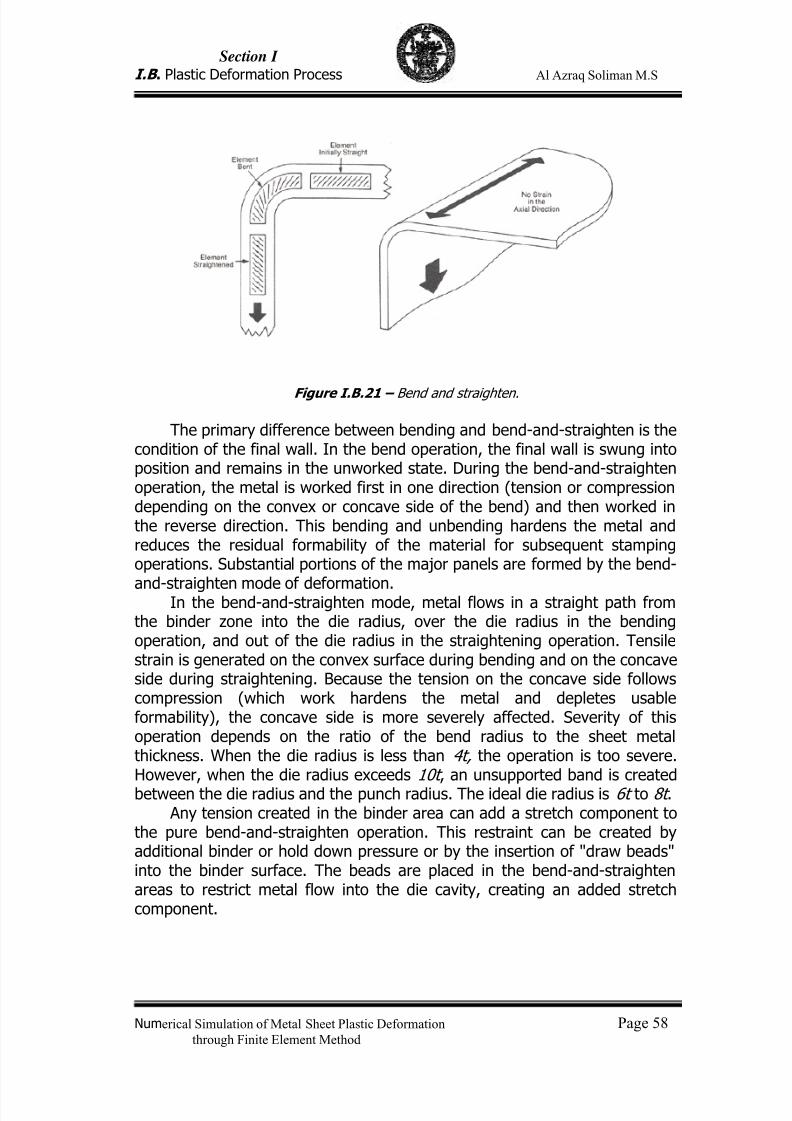
7/23/2019 Al Azraq Ingegneria Chimica Dei Materiali e Della Produzione
http://slidepdf.com/reader/full/al-azraq-ingegneria-chimica-dei-materiali-e-della-produzione 64/419
Section I
I.B . Plastic Deformation Process Al Azraq Soliman M.S
Numerical Simulation of Metal Sheet Plastic Deformation Page 58through Finite Element Method
Figure I.B.21 – Bend and straighten.
The primary difference between bending and bend-and-straighten is thecondition of the final wall. In the bend operation, the final wall is swung intoposition and remains in the unworked state. During the bend-and-straightenoperation, the metal is worked first in one direction (tension or compressiondepending on the convex or concave side of the bend) and then worked inthe reverse direction. This bending and unbending hardens the metal andreduces the residual formability of the material for subsequent stampingoperations. Substantial portions of the major panels are formed by the bend-
and-straighten mode of deformation.In the bend-and-straighten mode, metal flows in a straight path fromthe binder zone into the die radius, over the die radius in the bendingoperation, and out of the die radius in the straightening operation. Tensilestrain is generated on the convex surface during bending and on the concaveside during straightening. Because the tension on the concave side followscompression (which work hardens the metal and depletes usableformability), the concave side is more severely affected. Severity of thisoperation depends on the ratio of the bend radius to the sheet metalthickness. When the die radius is less than 4t, the operation is too severe.However, when the die radius exceeds 10t , an unsupported band is createdbetween the die radius and the punch radius. The ideal die radius is 6t to 8t .
Any tension created in the binder area can add a stretch component tothe pure bend-and-straighten operation. This restraint can be created byadditional binder or hold down pressure or by the insertion of "draw beads"into the binder surface. The beads are placed in the bend-and-straightenareas to restrict metal flow into the die cavity, creating an added stretchcomponent.
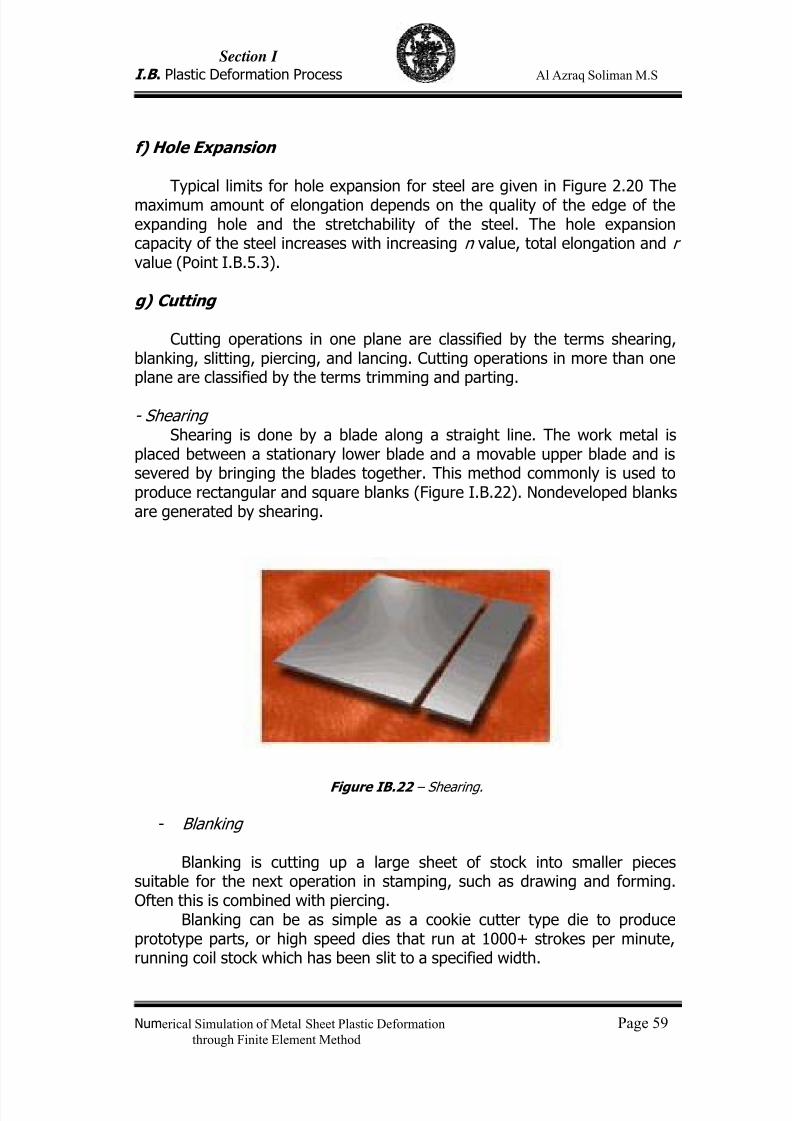
7/23/2019 Al Azraq Ingegneria Chimica Dei Materiali e Della Produzione
http://slidepdf.com/reader/full/al-azraq-ingegneria-chimica-dei-materiali-e-della-produzione 65/419
Section I
I.B . Plastic Deformation Process Al Azraq Soliman M.S
Numerical Simulation of Metal Sheet Plastic Deformation Page 59through Finite Element Method
f) Hole Expansion
Typical limits for hole expansion for steel are given in Figure 2.20 Themaximum amount of elongation depends on the quality of the edge of theexpanding hole and the stretchability of the steel. The hole expansioncapacity of the steel increases with increasing n value, total elongation and r value (Point I.B.5.3).
g) Cutting
Cutting operations in one plane are classified by the terms shearing,blanking, slitting, piercing, and lancing. Cutting operations in more than oneplane are classified by the terms trimming and parting.
- ShearingShearing is done by a blade along a straight line. The work metal is
placed between a stationary lower blade and a movable upper blade and issevered by bringing the blades together. This method commonly is used toproduce rectangular and square blanks (Figure I.B.22). Nondeveloped blanksare generated by shearing.
Figure IB.22 – Shearing.
- Blanking
Blanking is cutting up a large sheet of stock into smaller piecessuitable for the next operation in stamping, such as drawing and forming.Often this is combined with piercing.
Blanking can be as simple as a cookie cutter type die to produceprototype parts, or high speed dies that run at 1000+ strokes per minute,running coil stock which has been slit to a specified width.
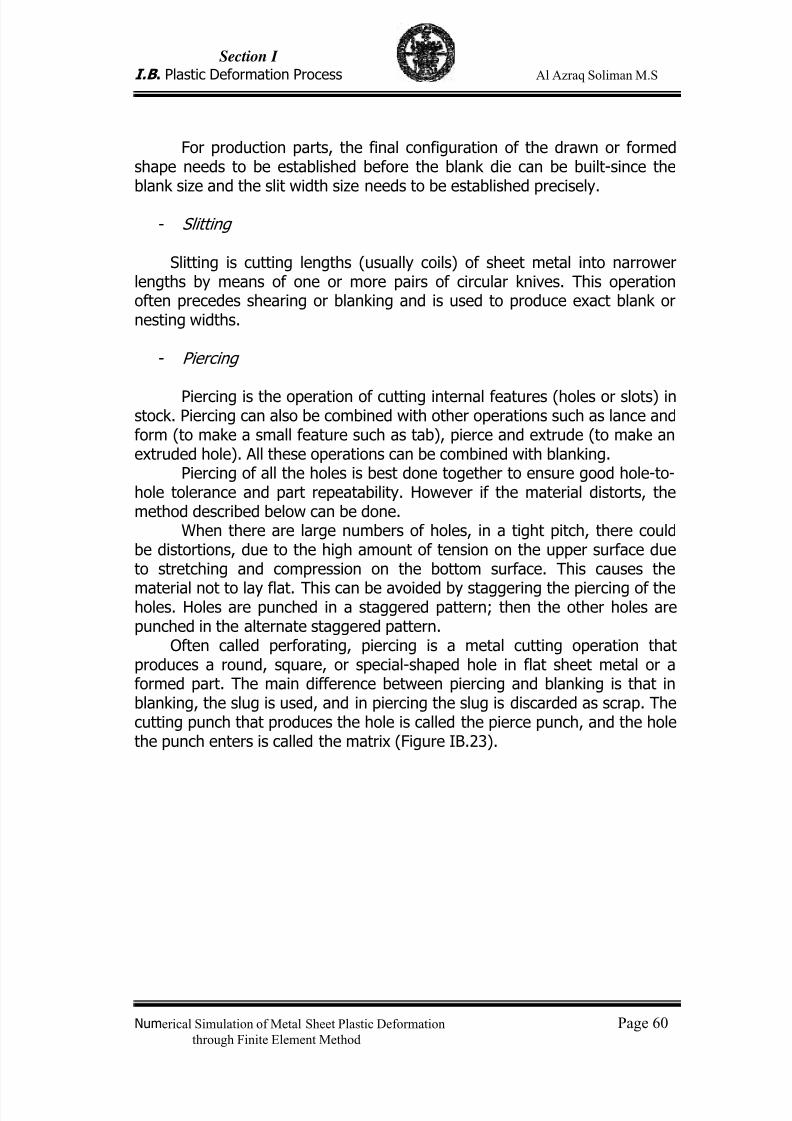
7/23/2019 Al Azraq Ingegneria Chimica Dei Materiali e Della Produzione
http://slidepdf.com/reader/full/al-azraq-ingegneria-chimica-dei-materiali-e-della-produzione 66/419
Section I
I.B . Plastic Deformation Process Al Azraq Soliman M.S
Numerical Simulation of Metal Sheet Plastic Deformation Page 60through Finite Element Method
For production parts, the final configuration of the drawn or formedshape needs to be established before the blank die can be built-since theblank size and the slit width size needs to be established precisely.
- Slitting
Slitting is cutting lengths (usually coils) of sheet metal into narrowerlengths by means of one or more pairs of circular knives. This operationoften precedes shearing or blanking and is used to produce exact blank ornesting widths.
- Piercing
Piercing is the operation of cutting internal features (holes or slots) instock. Piercing can also be combined with other operations such as lance andform (to make a small feature such as tab), pierce and extrude (to make anextruded hole). All these operations can be combined with blanking.
Piercing of all the holes is best done together to ensure good hole-to-hole tolerance and part repeatability. However if the material distorts, themethod described below can be done.
When there are large numbers of holes, in a tight pitch, there couldbe distortions, due to the high amount of tension on the upper surface dueto stretching and compression on the bottom surface. This causes the
material not to lay flat. This can be avoided by staggering the piercing of theholes. Holes are punched in a staggered pattern; then the other holes arepunched in the alternate staggered pattern.
Often called perforating, piercing is a metal cutting operation thatproduces a round, square, or special-shaped hole in flat sheet metal or aformed part. The main difference between piercing and blanking is that inblanking, the slug is used, and in piercing the slug is discarded as scrap. Thecutting punch that produces the hole is called the pierce punch, and the holethe punch enters is called the matrix (Figure IB.23).
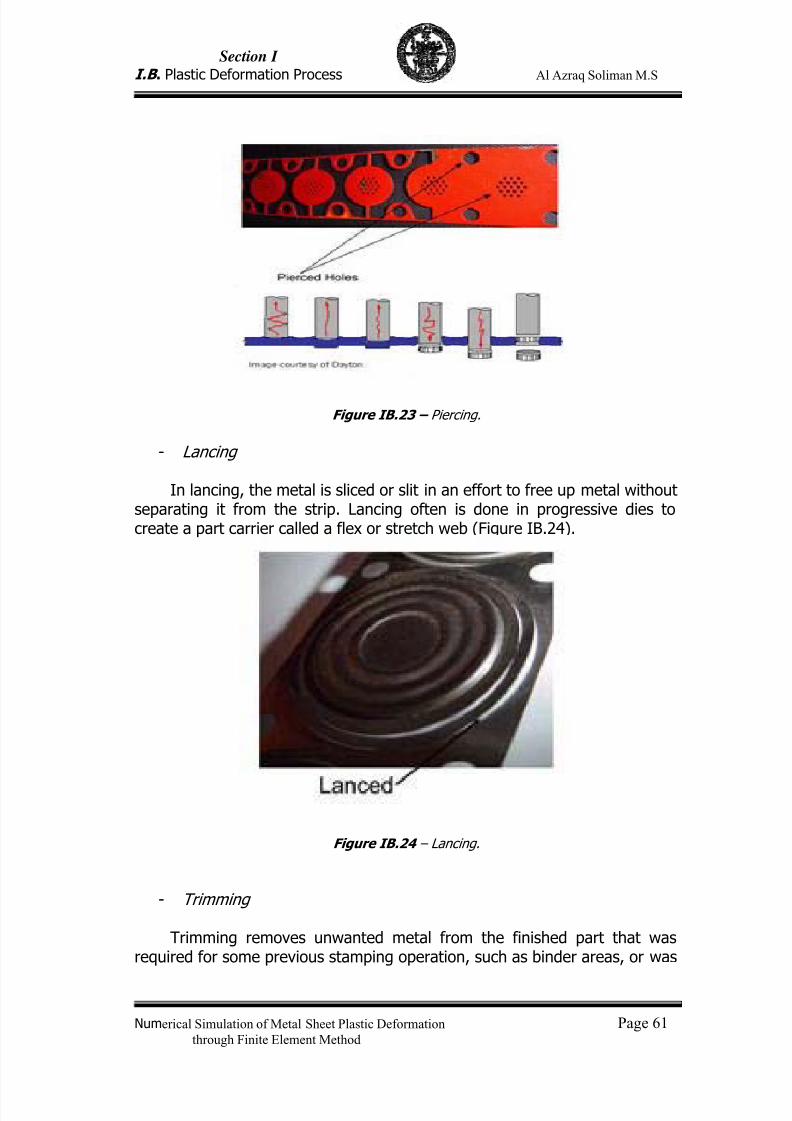
7/23/2019 Al Azraq Ingegneria Chimica Dei Materiali e Della Produzione
http://slidepdf.com/reader/full/al-azraq-ingegneria-chimica-dei-materiali-e-della-produzione 67/419
Section I
I.B . Plastic Deformation Process Al Azraq Soliman M.S
Numerical Simulation of Metal Sheet Plastic Deformation Page 61through Finite Element Method
Figure IB.23 – Piercing.
- Lancing
In lancing, the metal is sliced or slit in an effort to free up metal withoutseparating it from the strip. Lancing often is done in progressive dies tocreate a part carrier called a flex or stretch web (Figure IB.24).
Figure IB.24 – Lancing.
- Trimming
Trimming removes unwanted metal from the finished part that wasrequired for some previous stamping operation, such as binder areas, or was
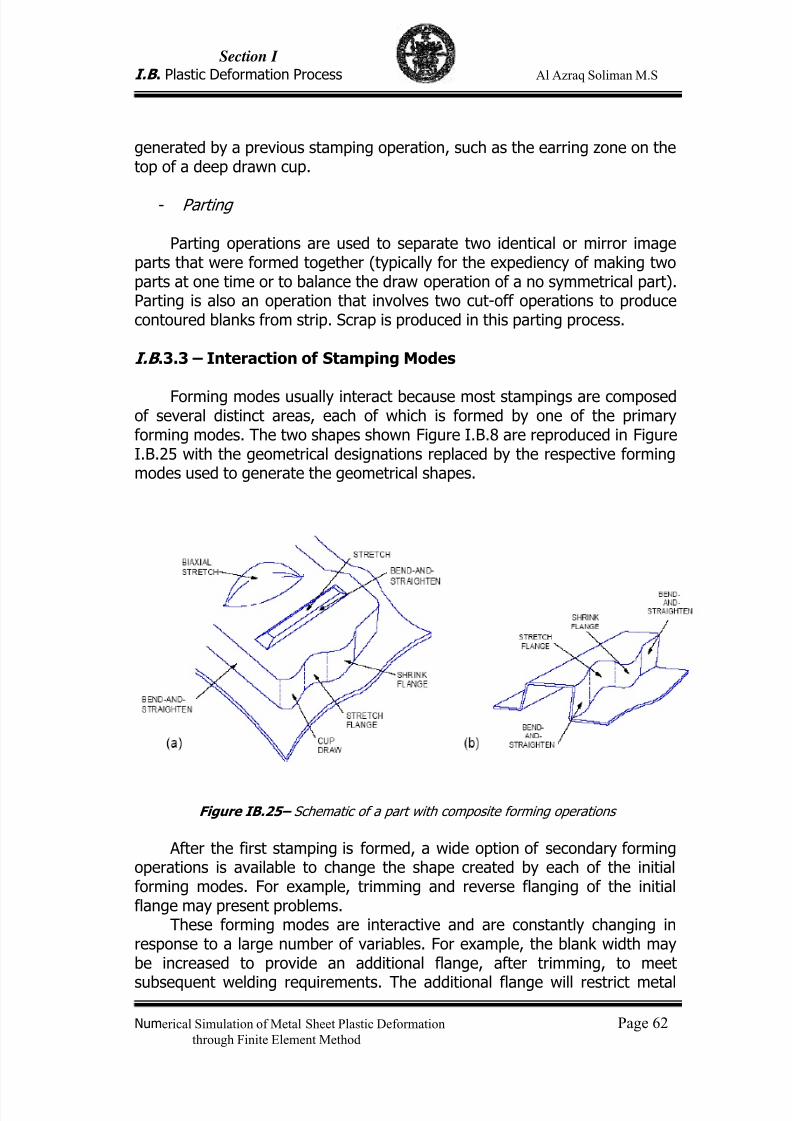
7/23/2019 Al Azraq Ingegneria Chimica Dei Materiali e Della Produzione
http://slidepdf.com/reader/full/al-azraq-ingegneria-chimica-dei-materiali-e-della-produzione 68/419
Section I
I.B . Plastic Deformation Process Al Azraq Soliman M.S
Numerical Simulation of Metal Sheet Plastic Deformation Page 62through Finite Element Method
generated by a previous stamping operation, such as the earring zone on thetop of a deep drawn cup.
-
Parting
Parting operations are used to separate two identical or mirror imageparts that were formed together (typically for the expediency of making twoparts at one time or to balance the draw operation of a no symmetrical part).Parting is also an operation that involves two cut-off operations to producecontoured blanks from strip. Scrap is produced in this parting process.
I.B .3.3 – Interaction of Stamping Modes
Forming modes usually interact because most stampings are composedof several distinct areas, each of which is formed by one of the primaryforming modes. The two shapes shown Figure I.B.8 are reproduced in FigureI.B.25 with the geometrical designations replaced by the respective formingmodes used to generate the geometrical shapes.
Figure IB.25– Schematic of a part with composite forming operations
After the first stamping is formed, a wide option of secondary formingoperations is available to change the shape created by each of the initialforming modes. For example, trimming and reverse flanging of the initialflange may present problems.
These forming modes are interactive and are constantly changing inresponse to a large number of variables. For example, the blank width maybe increased to provide an additional flange, after trimming, to meet
subsequent welding requirements. The additional flange will restrict metal
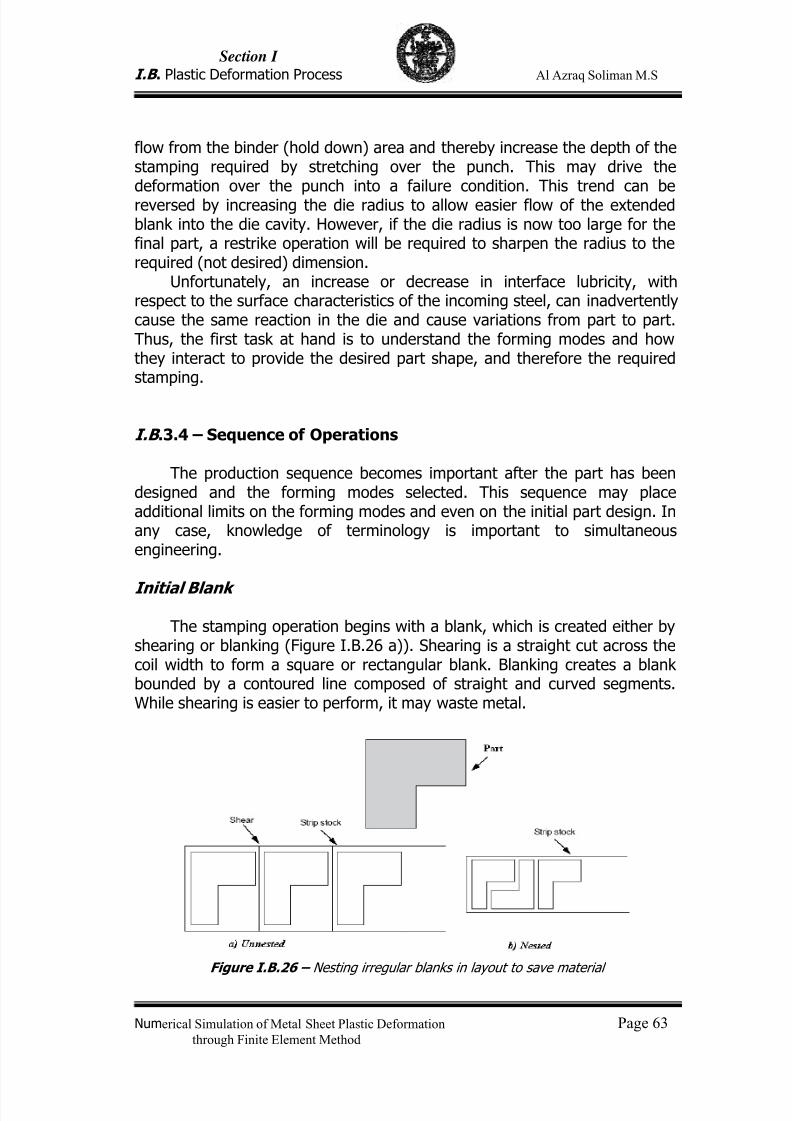
7/23/2019 Al Azraq Ingegneria Chimica Dei Materiali e Della Produzione
http://slidepdf.com/reader/full/al-azraq-ingegneria-chimica-dei-materiali-e-della-produzione 69/419
Section I
I.B . Plastic Deformation Process Al Azraq Soliman M.S
Numerical Simulation of Metal Sheet Plastic Deformation Page 63through Finite Element Method
flow from the binder (hold down) area and thereby increase the depth of thestamping required by stretching over the punch. This may drive thedeformation over the punch into a failure condition. This trend can bereversed by increasing the die radius to allow easier flow of the extendedblank into the die cavity. However, if the die radius is now too large for thefinal part, a restrike operation will be required to sharpen the radius to therequired (not desired) dimension.
Unfortunately, an increase or decrease in interface lubricity, withrespect to the surface characteristics of the incoming steel, can inadvertentlycause the same reaction in the die and cause variations from part to part.Thus, the first task at hand is to understand the forming modes and howthey interact to provide the desired part shape, and therefore the requiredstamping.
I.B .3.4 – Sequence of Operations
The production sequence becomes important after the part has beendesigned and the forming modes selected. This sequence may placeadditional limits on the forming modes and even on the initial part design. Inany case, knowledge of terminology is important to simultaneousengineering.
Initial Blank
The stamping operation begins with a blank, which is created either byshearing or blanking (Figure I.B.26 a)). Shearing is a straight cut across thecoil width to form a square or rectangular blank. Blanking creates a blankbounded by a contoured line composed of straight and curved segments.While shearing is easier to perform, it may waste metal.
Figure I.B.26 – Nesting irregular blanks in layout to save material
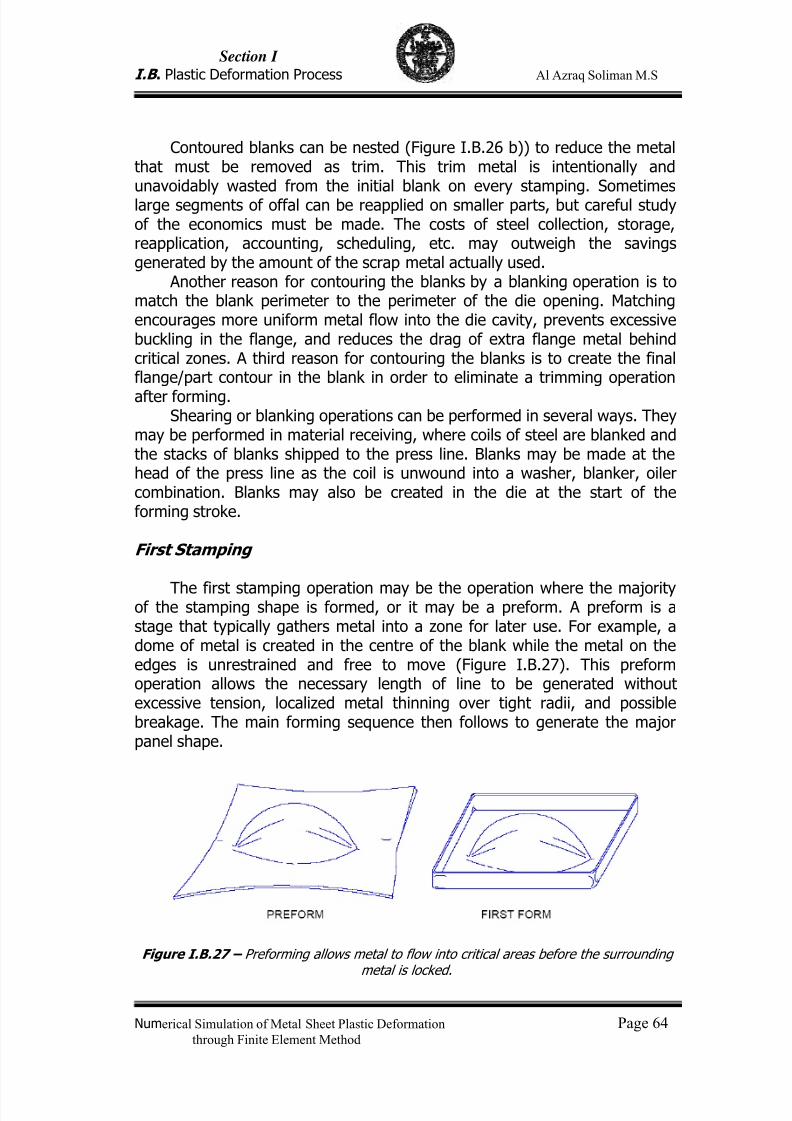
7/23/2019 Al Azraq Ingegneria Chimica Dei Materiali e Della Produzione
http://slidepdf.com/reader/full/al-azraq-ingegneria-chimica-dei-materiali-e-della-produzione 70/419
Section I
I.B . Plastic Deformation Process Al Azraq Soliman M.S
Numerical Simulation of Metal Sheet Plastic Deformation Page 64through Finite Element Method
Contoured blanks can be nested (Figure I.B.26 b)) to reduce the metalthat must be removed as trim. This trim metal is intentionally andunavoidably wasted from the initial blank on every stamping. Sometimeslarge segments of offal can be reapplied on smaller parts, but careful studyof the economics must be made. The costs of steel collection, storage,reapplication, accounting, scheduling, etc. may outweigh the savingsgenerated by the amount of the scrap metal actually used.
Another reason for contouring the blanks by a blanking operation is tomatch the blank perimeter to the perimeter of the die opening. Matchingencourages more uniform metal flow into the die cavity, prevents excessivebuckling in the flange, and reduces the drag of extra flange metal behindcritical zones. A third reason for contouring the blanks is to create the finalflange/part contour in the blank in order to eliminate a trimming operation
after forming.Shearing or blanking operations can be performed in several ways. They
may be performed in material receiving, where coils of steel are blanked andthe stacks of blanks shipped to the press line. Blanks may be made at thehead of the press line as the coil is unwound into a washer, blanker, oilercombination. Blanks may also be created in the die at the start of theforming stroke.
First Stamping
The first stamping operation may be the operation where the majorityof the stamping shape is formed, or it may be a preform. A preform is astage that typically gathers metal into a zone for later use. For example, adome of metal is created in the centre of the blank while the metal on theedges is unrestrained and free to move (Figure I.B.27). This preformoperation allows the necessary length of line to be generated withoutexcessive tension, localized metal thinning over tight radii, and possiblebreakage. The main forming sequence then follows to generate the majorpanel shape.
Figure I.B.27 – Preforming allows metal to flow into critical areas before the surroundingmetal is locked.

7/23/2019 Al Azraq Ingegneria Chimica Dei Materiali e Della Produzione
http://slidepdf.com/reader/full/al-azraq-ingegneria-chimica-dei-materiali-e-della-produzione 71/419
Section I
I.B . Plastic Deformation Process Al Azraq Soliman M.S
Numerical Simulation of Metal Sheet Plastic Deformation Page 65through Finite Element Method
If the sequence were reversed, the edges of the stamping would berestrained or even locked. Instead of metal flowing from the binder, theentire length of line would be generated by stretching the limited length ofmetal. Any number of preform stages may precede the major formingoperations; the number is a function of the part requirements and eachrequires a separate die.
A typical first stamping operation would be:
1. Blank insertionThe blank may be inserted by hand, automatic feed equipment, gravity
slide, or many other methods.
2. Blank positioningThis is accomplished by hand, stops, guide pins, index fingers, or other
methods.
3. Closing the binder (blankholder)This action places restraint on the blank to control metal flow into the
die cavity and reduce buckling within the flange material. The binder ringmay be in a single plane or may be developed in the third dimension. Thedeveloped binder preforms the blank closer to the contours of the punch.
This helps to eliminate metal being trapped under the punch, avoids pullingmetal into the die on sharp radii, encourages uniform metal flow, andbalances forces on the punch to avoid skidding of the character line.
4. Punch ActionThe punch now moves towards the blank, contacts the blank, and
moves the specified distance into the die cavity. The main portion of theforming is accomplished during this segment.5. Retraction
The punch and blankholder ring retract to create a die opening. The
height of the die opening depends on the stroke of the press and thedimensions of the die set; it must be greater than the height of the stampingbeing withdrawn.
6. Ejection Various levers, air, spring, arm, and other systems are used to remove
the stamping from the die.
7. TransferManual, semi-automatic, or automatic systems are used to transfer the
stamping from one die to the next. The next die may be in the same press in
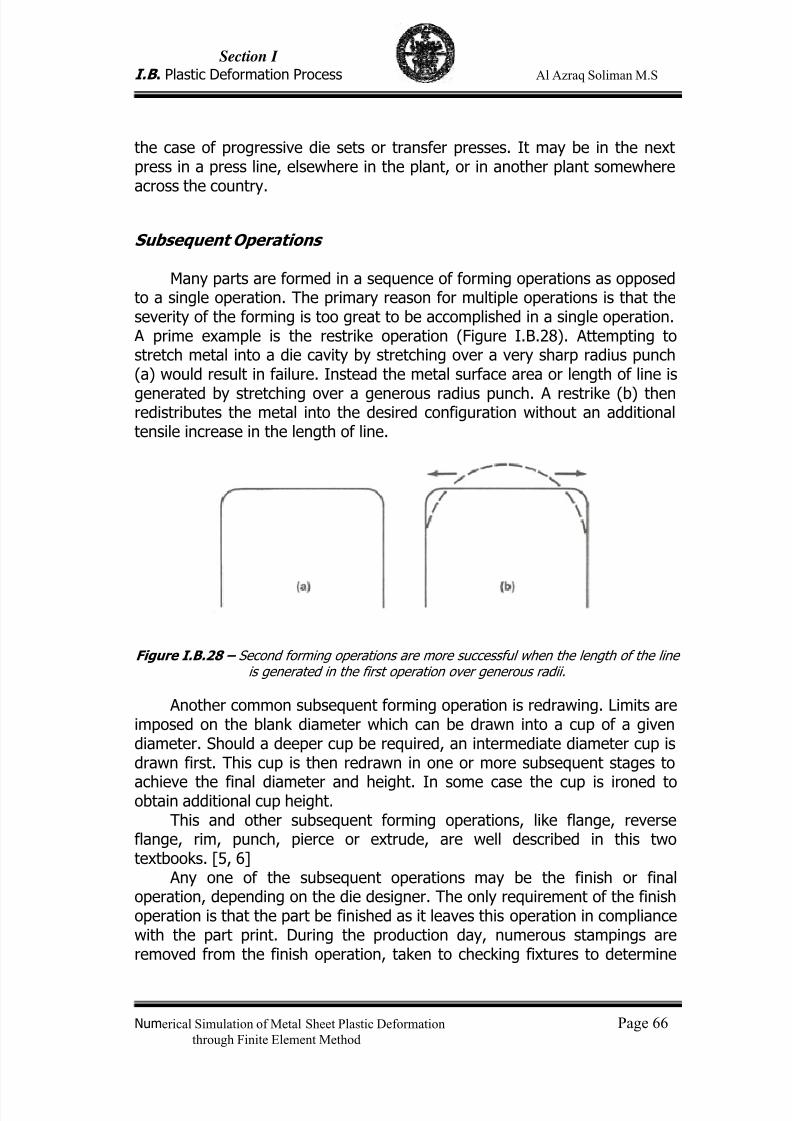
7/23/2019 Al Azraq Ingegneria Chimica Dei Materiali e Della Produzione
http://slidepdf.com/reader/full/al-azraq-ingegneria-chimica-dei-materiali-e-della-produzione 72/419
Section I
I.B . Plastic Deformation Process Al Azraq Soliman M.S
Numerical Simulation of Metal Sheet Plastic Deformation Page 66through Finite Element Method
the case of progressive die sets or transfer presses. It may be in the nextpress in a press line, elsewhere in the plant, or in another plant somewhereacross the country.
Subsequent Operations
Many parts are formed in a sequence of forming operations as opposedto a single operation. The primary reason for multiple operations is that theseverity of the forming is too great to be accomplished in a single operation.
A prime example is the restrike operation (Figure I.B.28). Attempting tostretch metal into a die cavity by stretching over a very sharp radius punch(a) would result in failure. Instead the metal surface area or length of line is
generated by stretching over a generous radius punch. A restrike (b) thenredistributes the metal into the desired configuration without an additionaltensile increase in the length of line.
Figure I.B.28 – Second forming operations are more successful when the length of the lineis generated in the first operation over generous radii.
Another common subsequent forming operation is redrawing. Limits areimposed on the blank diameter which can be drawn into a cup of a givendiameter. Should a deeper cup be required, an intermediate diameter cup isdrawn first. This cup is then redrawn in one or more subsequent stages to
achieve the final diameter and height. In some case the cup is ironed toobtain additional cup height.This and other subsequent forming operations, like flange, reverse
flange, rim, punch, pierce or extrude, are well described in this twotextbooks. [5, 6]
Any one of the subsequent operations may be the finish or finaloperation, depending on the die designer. The only requirement of the finishoperation is that the part be finished as it leaves this operation in compliancewith the part print. During the production day, numerous stampings areremoved from the finish operation, taken to checking fixtures to determine
7/23/2019 Al Azraq Ingegneria Chimica Dei Materiali e Della Produzione
http://slidepdf.com/reader/full/al-azraq-ingegneria-chimica-dei-materiali-e-della-produzione 73/419
Section I
I.B . Plastic Deformation Process Al Azraq Soliman M.S
Numerical Simulation of Metal Sheet Plastic Deformation Page 67through Finite Element Method
accuracy to part print, to "green rooms" for visual evaluation of surfacequality, and to other part quality audits.
I.B .3.5 – Press and Tooling Descriptions
Presses
The press is one of the major components of the forming system. Forexample, a specific material/lubricant/die combination can producesatisfactory stampings in one press line and be incapable of producingsatisfactory stampings in another press line. This is especially true forstampings which lack sufficient “safety margin” and are balanced at theonset of failure. Likewise, the ability to produce quality stampings without
loose metal, buckles, waves, low spots, and other surface defects dependson the characteristics of the press in which the stamping is produced. Somepresses have very accurate alignment and tight guidance systems. Otherpresses have loose guidance systems and the punch to die alignment, as wellas blankholder reproducibility, changes from one stamping to the next.
Presses are identified by different methods. Some of the more commonmethods are:
1. Tonnage
Typical identifications are 300 ton, 600 ton, 200 ton outer slide/400 tonmain ram.
2. Source of Power
Occasionally the source of power is manual, either hand or footpowered. Mechanical powered presses, sometimes called toggle presses,store energy in a flywheel, and transfer it to the workpiece by gears, cranks,eccentrics, or levers. Hydraulic cylinders apply the load in hydraulic presses.
There are three main differences between these two types of presses.
One of them is the load/stroke characteristics. The hydraulic press has aconstant load capacity throughout the entire stroke, whereas the mechanicaldrive reaches maximum load capacity only at the bottom of the stroke. Thisbecomes more important for pure stretch forming operations which requiremaximum blank clamping loads to be exerted at ram positions far removedfrom the bottom dead center and high up on the stroke curve where loadcapacity is low for mechanical presses.
Another difference is the length of the stroke. A hydraulic press can beset easily at any stroke within the limits of the hydraulic cylinder travel. Theram stroke on the mechanical press is fixed.
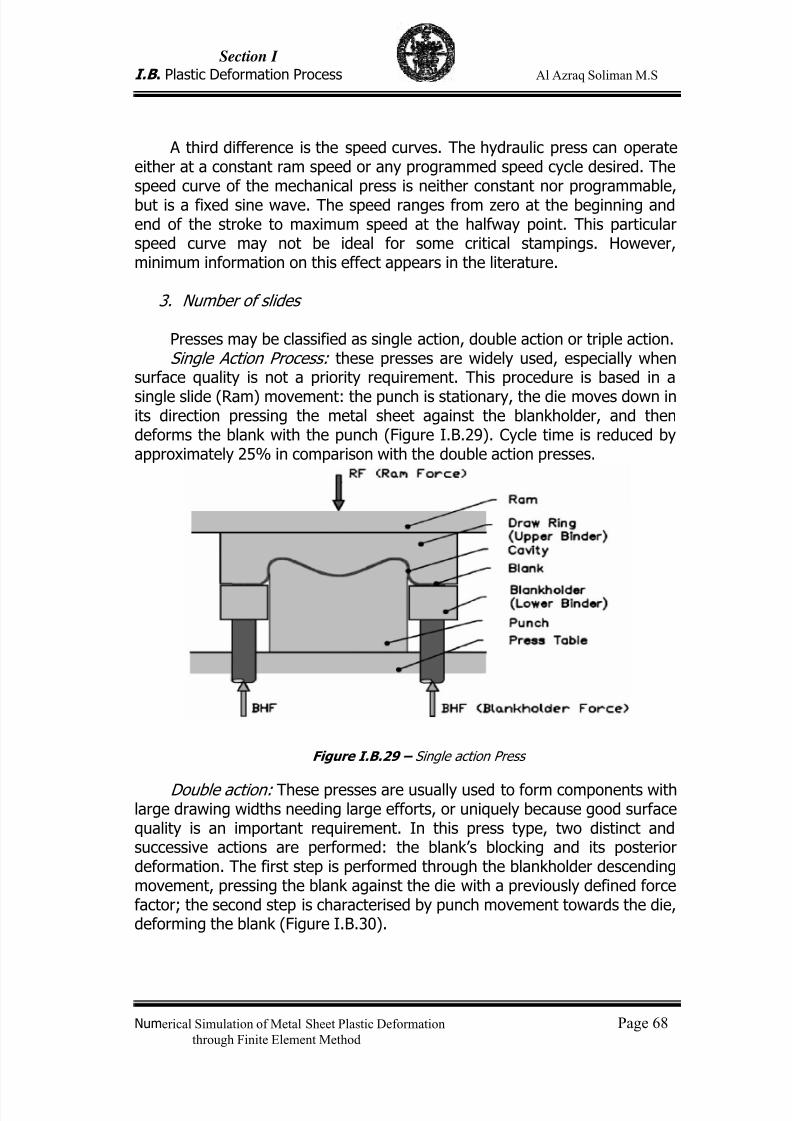
7/23/2019 Al Azraq Ingegneria Chimica Dei Materiali e Della Produzione
http://slidepdf.com/reader/full/al-azraq-ingegneria-chimica-dei-materiali-e-della-produzione 74/419
Section I
I.B . Plastic Deformation Process Al Azraq Soliman M.S
Numerical Simulation of Metal Sheet Plastic Deformation Page 68through Finite Element Method
A third difference is the speed curves. The hydraulic press can operateeither at a constant ram speed or any programmed speed cycle desired. Thespeed curve of the mechanical press is neither constant nor programmable,but is a fixed sine wave. The speed ranges from zero at the beginning andend of the stroke to maximum speed at the halfway point. This particularspeed curve may not be ideal for some critical stampings. However,minimum information on this effect appears in the literature.
3. Number of slides
Presses may be classified as single action, double action or triple action.Single Action Process: these presses are widely used, especially when
surface quality is not a priority requirement. This procedure is based in a
single slide (Ram) movement: the punch is stationary, the die moves down inits direction pressing the metal sheet against the blankholder, and thendeforms the blank with the punch (Figure I.B.29). Cycle time is reduced byapproximately 25% in comparison with the double action presses.
Figure I.B.29 – Single action Press
Double action: These presses are usually used to form components withlarge drawing widths needing large efforts, or uniquely because good surfacequality is an important requirement. In this press type, two distinct andsuccessive actions are performed: the blank’s blocking and its posteriordeformation. The first step is performed through the blankholder descendingmovement, pressing the blank against the die with a previously defined forcefactor; the second step is characterised by punch movement towards the die,deforming the blank (Figure I.B.30).
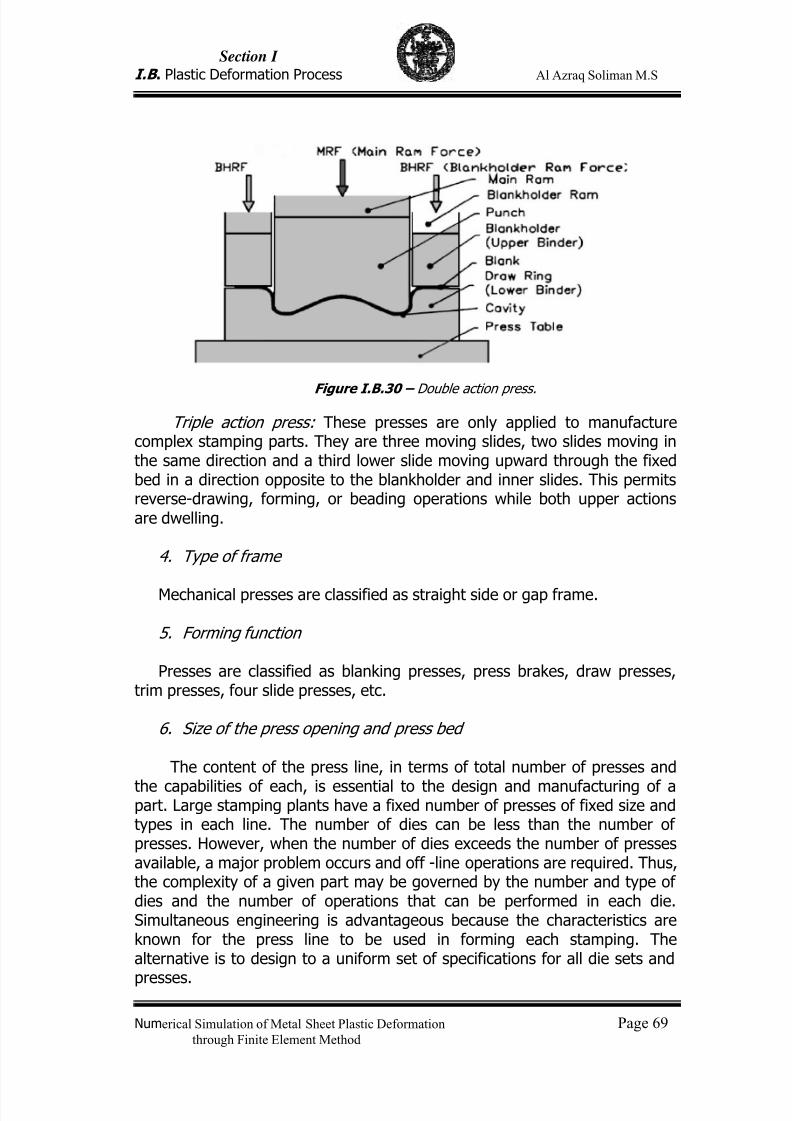
7/23/2019 Al Azraq Ingegneria Chimica Dei Materiali e Della Produzione
http://slidepdf.com/reader/full/al-azraq-ingegneria-chimica-dei-materiali-e-della-produzione 75/419
Section I
I.B . Plastic Deformation Process Al Azraq Soliman M.S
Numerical Simulation of Metal Sheet Plastic Deformation Page 69through Finite Element Method
Figure I.B.30 – Double action press.
Triple action press: These presses are only applied to manufacturecomplex stamping parts. They are three moving slides, two slides moving inthe same direction and a third lower slide moving upward through the fixedbed in a direction opposite to the blankholder and inner slides. This permitsreverse-drawing, forming, or beading operations while both upper actionsare dwelling.
4. Type of frame
Mechanical presses are classified as straight side or gap frame.
5. Forming function
Presses are classified as blanking presses, press brakes, draw presses,trim presses, four slide presses, etc.
6. Size of the press opening and press bed
The content of the press line, in terms of total number of presses and
the capabilities of each, is essential to the design and manufacturing of apart. Large stamping plants have a fixed number of presses of fixed size andtypes in each line. The number of dies can be less than the number ofpresses. However, when the number of dies exceeds the number of pressesavailable, a major problem occurs and off -line operations are required. Thus,the complexity of a given part may be governed by the number and type ofdies and the number of operations that can be performed in each die.Simultaneous engineering is advantageous because the characteristics areknown for the press line to be used in forming each stamping. Thealternative is to design to a uniform set of specifications for all die sets and
presses.
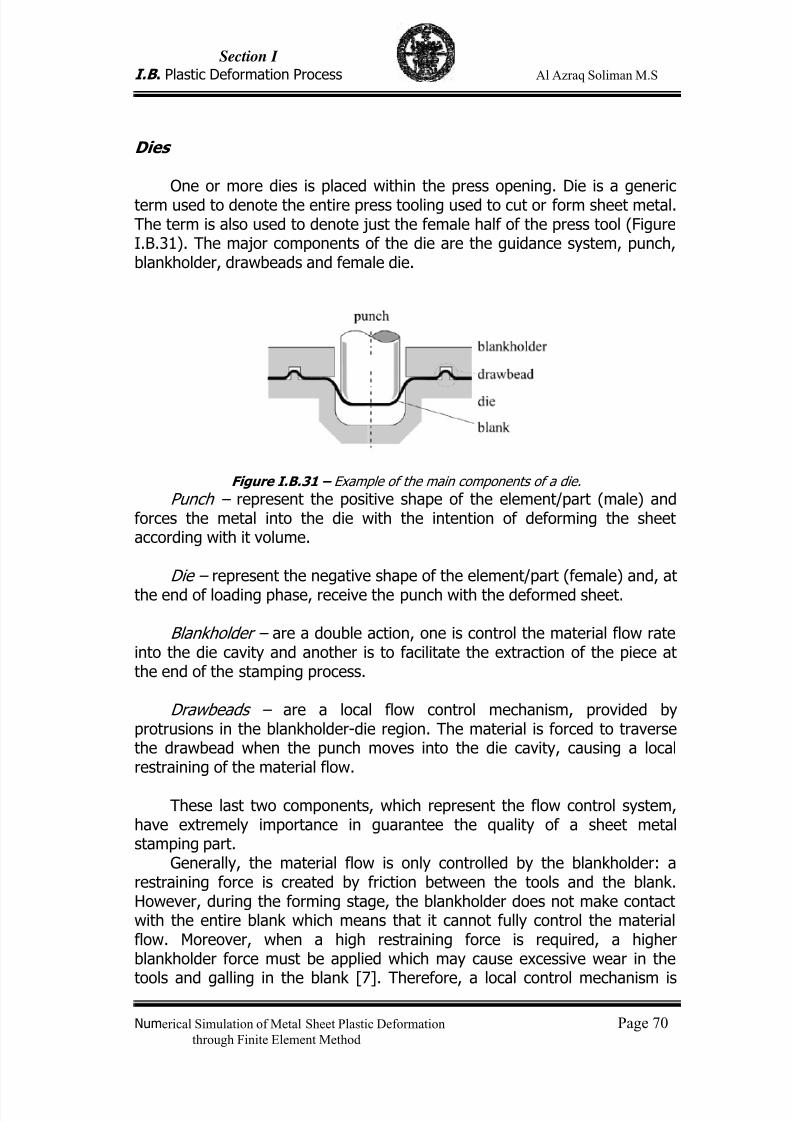
7/23/2019 Al Azraq Ingegneria Chimica Dei Materiali e Della Produzione
http://slidepdf.com/reader/full/al-azraq-ingegneria-chimica-dei-materiali-e-della-produzione 76/419
Section I
I.B . Plastic Deformation Process Al Azraq Soliman M.S
Numerical Simulation of Metal Sheet Plastic Deformation Page 70through Finite Element Method
Dies
One or more dies is placed within the press opening. Die is a genericterm used to denote the entire press tooling used to cut or form sheet metal.The term is also used to denote just the female half of the press tool (FigureI.B.31). The major components of the die are the guidance system, punch,blankholder, drawbeads and female die.
Figure I.B.31 – Example of the main components of a die.
Punch – represent the positive shape of the element/part (male) andforces the metal into the die with the intention of deforming the sheetaccording with it volume.
Die – represent the negative shape of the element/part (female) and, at
the end of loading phase, receive the punch with the deformed sheet.
Blankholder – are a double action, one is control the material flow rateinto the die cavity and another is to facilitate the extraction of the piece atthe end of the stamping process.
Drawbeads – are a local flow control mechanism, provided byprotrusions in the blankholder-die region. The material is forced to traversethe drawbead when the punch moves into the die cavity, causing a localrestraining of the material flow.
These last two components, which represent the flow control system,have extremely importance in guarantee the quality of a sheet metalstamping part.
Generally, the material flow is only controlled by the blankholder: arestraining force is created by friction between the tools and the blank.However, during the forming stage, the blankholder does not make contactwith the entire blank which means that it cannot fully control the materialflow. Moreover, when a high restraining force is required, a higherblankholder force must be applied which may cause excessive wear in the
tools and galling in the blank [7]. Therefore, a local control mechanism is
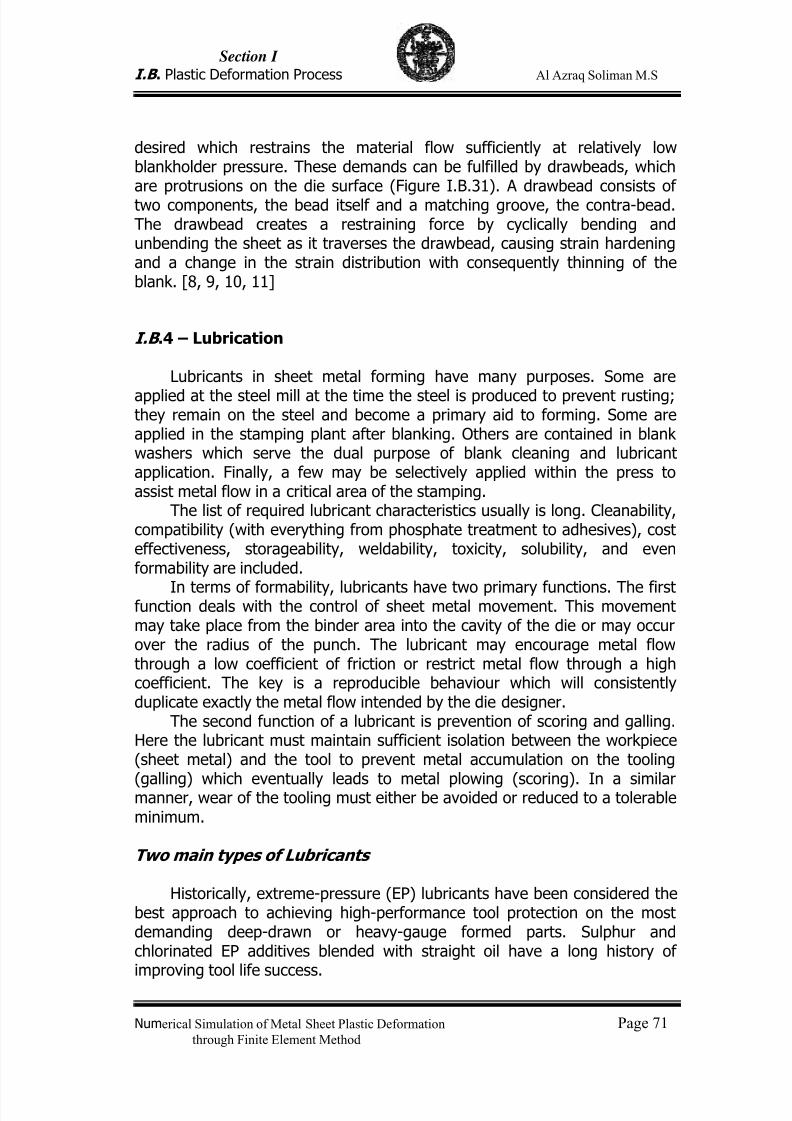
7/23/2019 Al Azraq Ingegneria Chimica Dei Materiali e Della Produzione
http://slidepdf.com/reader/full/al-azraq-ingegneria-chimica-dei-materiali-e-della-produzione 77/419
Section I
I.B . Plastic Deformation Process Al Azraq Soliman M.S
Numerical Simulation of Metal Sheet Plastic Deformation Page 71through Finite Element Method
desired which restrains the material flow sufficiently at relatively lowblankholder pressure. These demands can be fulfilled by drawbeads, whichare protrusions on the die surface (Figure I.B.31). A drawbead consists oftwo components, the bead itself and a matching groove, the contra-bead.The drawbead creates a restraining force by cyclically bending andunbending the sheet as it traverses the drawbead, causing strain hardeningand a change in the strain distribution with consequently thinning of theblank. [8, 9, 10, 11]
I.B .4 – Lubrication
Lubricants in sheet metal forming have many purposes. Some are
applied at the steel mill at the time the steel is produced to prevent rusting;they remain on the steel and become a primary aid to forming. Some areapplied in the stamping plant after blanking. Others are contained in blankwashers which serve the dual purpose of blank cleaning and lubricantapplication. Finally, a few may be selectively applied within the press toassist metal flow in a critical area of the stamping.
The list of required lubricant characteristics usually is long. Cleanability,compatibility (with everything from phosphate treatment to adhesives), costeffectiveness, storageability, weldability, toxicity, solubility, and evenformability are included.
In terms of formability, lubricants have two primary functions. The firstfunction deals with the control of sheet metal movement. This movementmay take place from the binder area into the cavity of the die or may occurover the radius of the punch. The lubricant may encourage metal flowthrough a low coefficient of friction or restrict metal flow through a highcoefficient. The key is a reproducible behaviour which will consistentlyduplicate exactly the metal flow intended by the die designer.
The second function of a lubricant is prevention of scoring and galling.Here the lubricant must maintain sufficient isolation between the workpiece(sheet metal) and the tool to prevent metal accumulation on the tooling
(galling) which eventually leads to metal plowing (scoring). In a similarmanner, wear of the tooling must either be avoided or reduced to a tolerableminimum.
Two main types of Lubricants
Historically, extreme-pressure (EP) lubricants have been considered thebest approach to achieving high-performance tool protection on the mostdemanding deep-drawn or heavy-gauge formed parts. Sulphur andchlorinated EP additives blended with straight oil have a long history ofimproving tool life success.
7/23/2019 Al Azraq Ingegneria Chimica Dei Materiali e Della Produzione
http://slidepdf.com/reader/full/al-azraq-ingegneria-chimica-dei-materiali-e-della-produzione 78/419
Section I
I.B . Plastic Deformation Process Al Azraq Soliman M.S
Numerical Simulation of Metal Sheet Plastic Deformation Page 72through Finite Element Method
With the introduction of new-generation metals such as HSS, andstringent environmental and disposal requirements, EP oil’s value hasdiminished. Under the high heat required to form HSS, EP oils lose theirperformance. They can’t provide the physical tool-protecting barrier requiredfor extreme-temperature (ET) applications. ET versions of high-solidspolymers (HSP) lubricants do provide the necessary protection.
As metal deformation in the stamping press raises tool and metaltemperature, EP oils become thinner, and in some cases flash or burn (FigureI.B.32). The average HSP lubricant has a thin viscosity when applied.However, as the temperature rises, the viscosity becomes thicker and moretenacious. In fact, ET fluids are heat-seeking and will attach to hot metal,creating a friction-reducing film barrier. This protective barrier allows the toolto stretch and form metal without splitting or metal pickup during the most
demanding operations, thus controlling friction and metal flow.
Figure I.B.32 – Comparison between ET Fluids and EP Oils.
I.B .5 – General Metal Deformation
I.B .5.1 – Failure Modes
Sheet metal forming operations are typical mechanical problemscharacterized by a product with a deviating shape or with failures, usuallycaused by an incorrect design of the tools and the blank shape or anincorrect choice of material and process parameters. Once such problems arestarted, they tend to persist and the stiffness of the specific area decreases.Therefore, deformation begins to be localized and eventually proceeds tofinal collapse or rupture.
A deviating shape is caused by elastic recovery and can be easily
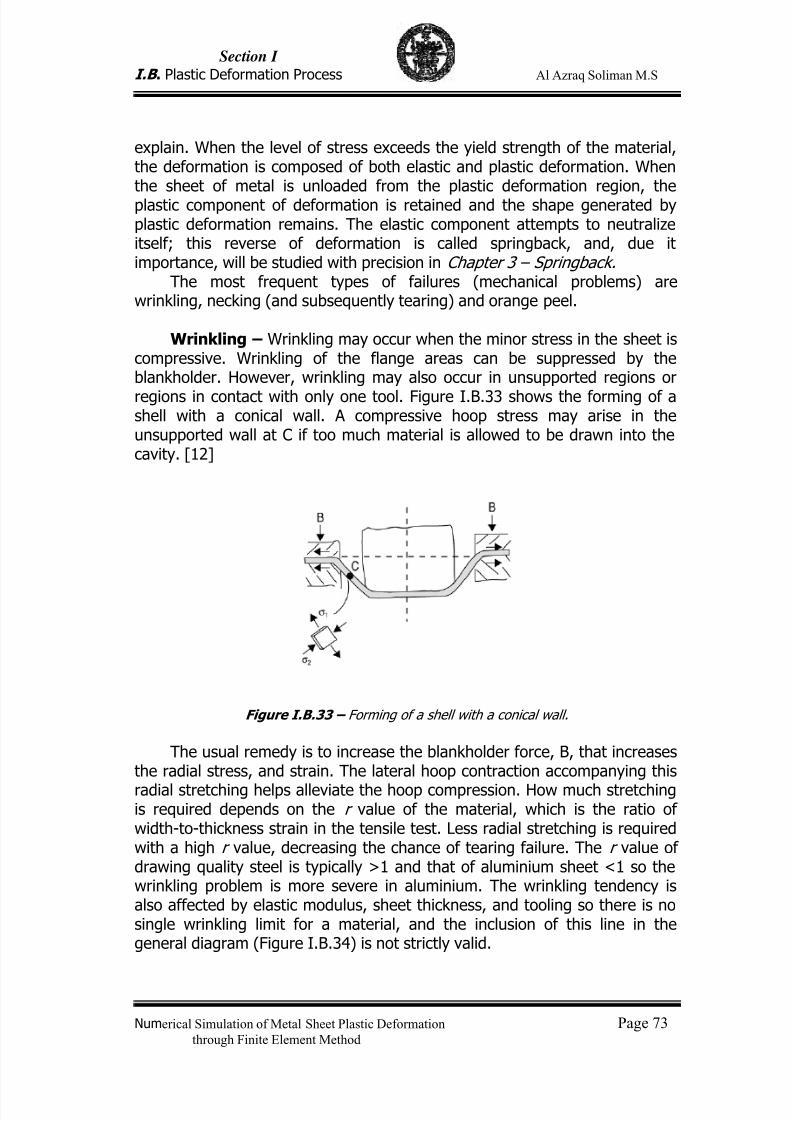
7/23/2019 Al Azraq Ingegneria Chimica Dei Materiali e Della Produzione
http://slidepdf.com/reader/full/al-azraq-ingegneria-chimica-dei-materiali-e-della-produzione 79/419
Section I
I.B . Plastic Deformation Process Al Azraq Soliman M.S
Numerical Simulation of Metal Sheet Plastic Deformation Page 73through Finite Element Method
explain. When the level of stress exceeds the yield strength of the material,the deformation is composed of both elastic and plastic deformation. Whenthe sheet of metal is unloaded from the plastic deformation region, theplastic component of deformation is retained and the shape generated byplastic deformation remains. The elastic component attempts to neutralizeitself; this reverse of deformation is called springback, and, due itimportance, will be studied with precision in Chapter 3 – Springback.
The most frequent types of failures (mechanical problems) arewrinkling, necking (and subsequently tearing) and orange peel.
Wrinkling – Wrinkling may occur when the minor stress in the sheet iscompressive. Wrinkling of the flange areas can be suppressed by theblankholder. However, wrinkling may also occur in unsupported regions or
regions in contact with only one tool. Figure I.B.33 shows the forming of ashell with a conical wall. A compressive hoop stress may arise in theunsupported wall at C if too much material is allowed to be drawn into thecavity. [12]
Figure I.B.33 – Forming of a shell with a conical wall.
The usual remedy is to increase the blankholder force, B, that increasesthe radial stress, and strain. The lateral hoop contraction accompanying this
radial stretching helps alleviate the hoop compression. How much stretchingis required depends on the r value of the material, which is the ratio ofwidth-to-thickness strain in the tensile test. Less radial stretching is requiredwith a high r value, decreasing the chance of tearing failure. The r value ofdrawing quality steel is typically >1 and that of aluminium sheet <1 so thewrinkling problem is more severe in aluminium. The wrinkling tendency isalso affected by elastic modulus, sheet thickness, and tooling so there is nosingle wrinkling limit for a material, and the inclusion of this line in thegeneral diagram (Figure I.B.34) is not strictly valid.
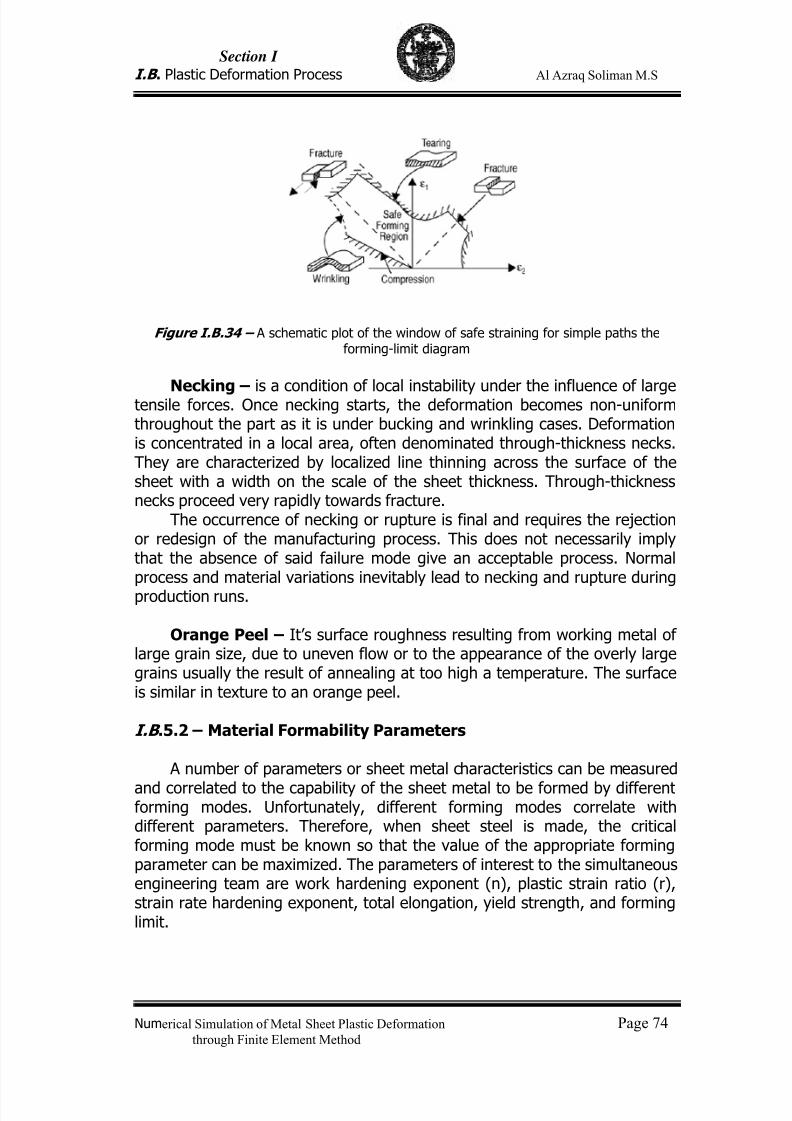
7/23/2019 Al Azraq Ingegneria Chimica Dei Materiali e Della Produzione
http://slidepdf.com/reader/full/al-azraq-ingegneria-chimica-dei-materiali-e-della-produzione 80/419
Section I
I.B . Plastic Deformation Process Al Azraq Soliman M.S
Numerical Simulation of Metal Sheet Plastic Deformation Page 74through Finite Element Method
Figure I.B.34 – A schematic plot of the window of safe straining for simple paths theforming-limit diagram
Necking – is a condition of local instability under the influence of largetensile forces. Once necking starts, the deformation becomes non-uniformthroughout the part as it is under bucking and wrinkling cases. Deformationis concentrated in a local area, often denominated through-thickness necks.They are characterized by localized line thinning across the surface of thesheet with a width on the scale of the sheet thickness. Through-thicknessnecks proceed very rapidly towards fracture.
The occurrence of necking or rupture is final and requires the rejectionor redesign of the manufacturing process. This does not necessarily implythat the absence of said failure mode give an acceptable process. Normalprocess and material variations inevitably lead to necking and rupture duringproduction runs.
Orange Peel – It’s surface roughness resulting from working metal oflarge grain size, due to uneven flow or to the appearance of the overly largegrains usually the result of annealing at too high a temperature. The surfaceis similar in texture to an orange peel.
I.B .5.2 – Material Formability Parameters
A number of parameters or sheet metal characteristics can be measured
and correlated to the capability of the sheet metal to be formed by differentforming modes. Unfortunately, different forming modes correlate withdifferent parameters. Therefore, when sheet steel is made, the criticalforming mode must be known so that the value of the appropriate formingparameter can be maximized. The parameters of interest to the simultaneousengineering team are work hardening exponent (n), plastic strain ratio (r),strain rate hardening exponent, total elongation, yield strength, and forminglimit.
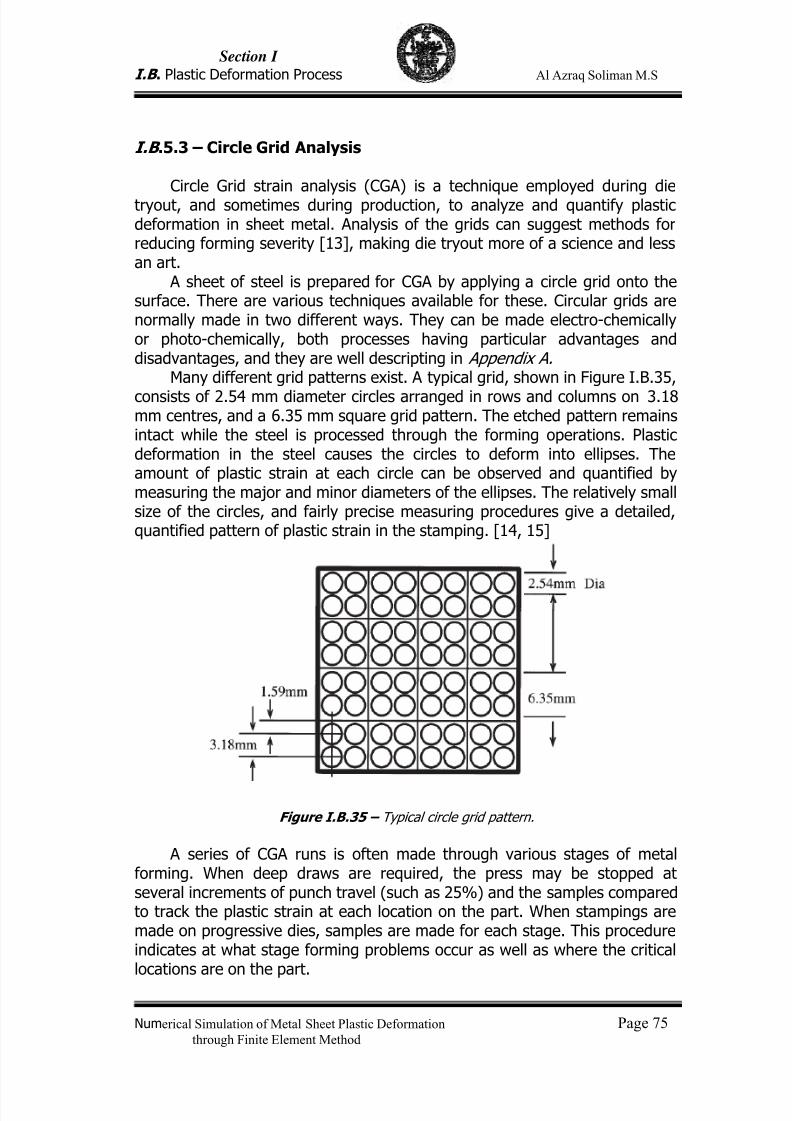
7/23/2019 Al Azraq Ingegneria Chimica Dei Materiali e Della Produzione
http://slidepdf.com/reader/full/al-azraq-ingegneria-chimica-dei-materiali-e-della-produzione 81/419
Section I
I.B . Plastic Deformation Process Al Azraq Soliman M.S
Numerical Simulation of Metal Sheet Plastic Deformation Page 75through Finite Element Method
I.B .5.3 – Circle Grid Analysis
Circle Grid strain analysis (CGA) is a technique employed during dietryout, and sometimes during production, to analyze and quantify plasticdeformation in sheet metal. Analysis of the grids can suggest methods forreducing forming severity [13], making die tryout more of a science and lessan art.
A sheet of steel is prepared for CGA by applying a circle grid onto thesurface. There are various techniques available for these. Circular grids arenormally made in two different ways. They can be made electro-chemicallyor photo-chemically, both processes having particular advantages anddisadvantages, and they are well descripting in Appendix A.
Many different grid patterns exist. A typical grid, shown in Figure I.B.35,
consists of 2.54 mm diameter circles arranged in rows and columns on 3.18mm centres, and a 6.35 mm square grid pattern. The etched pattern remainsintact while the steel is processed through the forming operations. Plasticdeformation in the steel causes the circles to deform into ellipses. Theamount of plastic strain at each circle can be observed and quantified bymeasuring the major and minor diameters of the ellipses. The relatively smallsize of the circles, and fairly precise measuring procedures give a detailed,quantified pattern of plastic strain in the stamping. [14, 15]
Figure I.B.35 – Typical circle grid pattern.
A series of CGA runs is often made through various stages of metalforming. When deep draws are required, the press may be stopped atseveral increments of punch travel (such as 25%) and the samples comparedto track the plastic strain at each location on the part. When stampings aremade on progressive dies, samples are made for each stage. This procedureindicates at what stage forming problems occur as well as where the criticallocations are on the part.
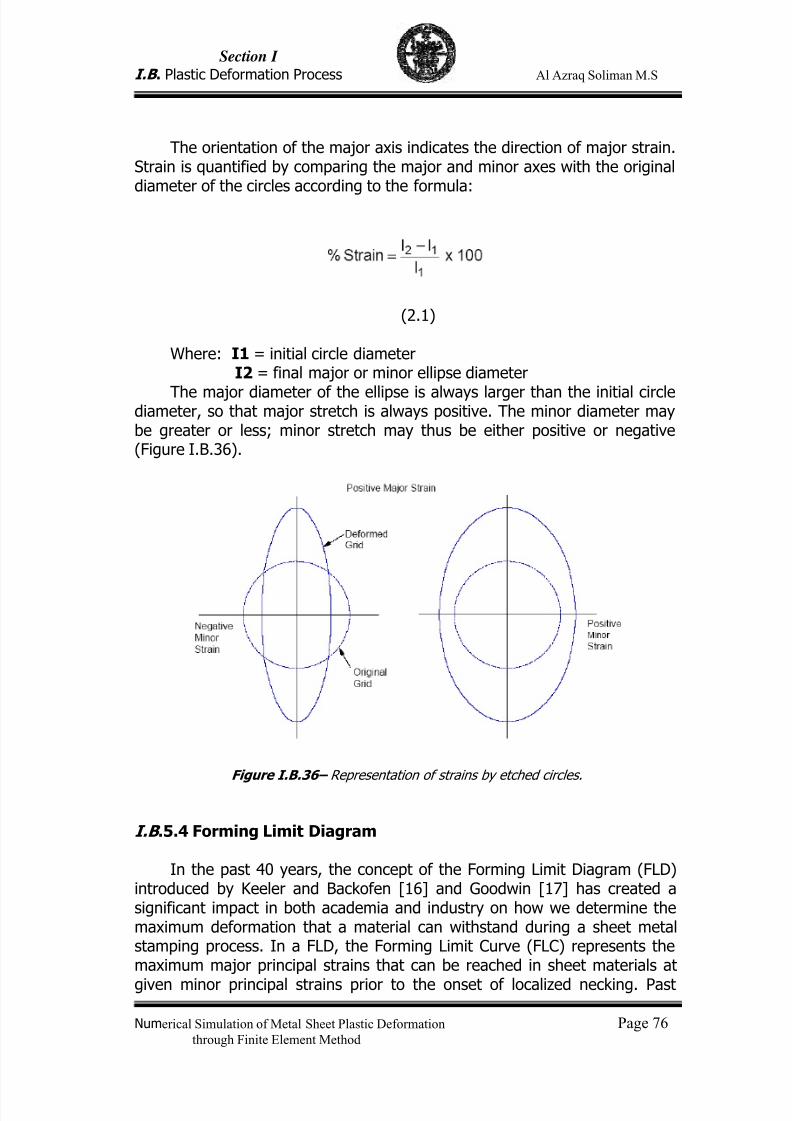
7/23/2019 Al Azraq Ingegneria Chimica Dei Materiali e Della Produzione
http://slidepdf.com/reader/full/al-azraq-ingegneria-chimica-dei-materiali-e-della-produzione 82/419
Section I
I.B . Plastic Deformation Process Al Azraq Soliman M.S
Numerical Simulation of Metal Sheet Plastic Deformation Page 76through Finite Element Method
The orientation of the major axis indicates the direction of major strain.Strain is quantified by comparing the major and minor axes with the originaldiameter of the circles according to the formula:
(2.1)
Where: I1 = initial circle diameterI2 = final major or minor ellipse diameter
The major diameter of the ellipse is always larger than the initial circlediameter, so that major stretch is always positive. The minor diameter maybe greater or less; minor stretch may thus be either positive or negative(Figure I.B.36).
Figure I.B.36– Representation of strains by etched circles.
I.B .5.4 Forming Limit Diagram
In the past 40 years, the concept of the Forming Limit Diagram (FLD)introduced by Keeler and Backofen [16] and Goodwin [17] has created asignificant impact in both academia and industry on how we determine themaximum deformation that a material can withstand during a sheet metalstamping process. In a FLD, the Forming Limit Curve (FLC) represents themaximum major principal strains that can be reached in sheet materials at
given minor principal strains prior to the onset of localized necking. Past
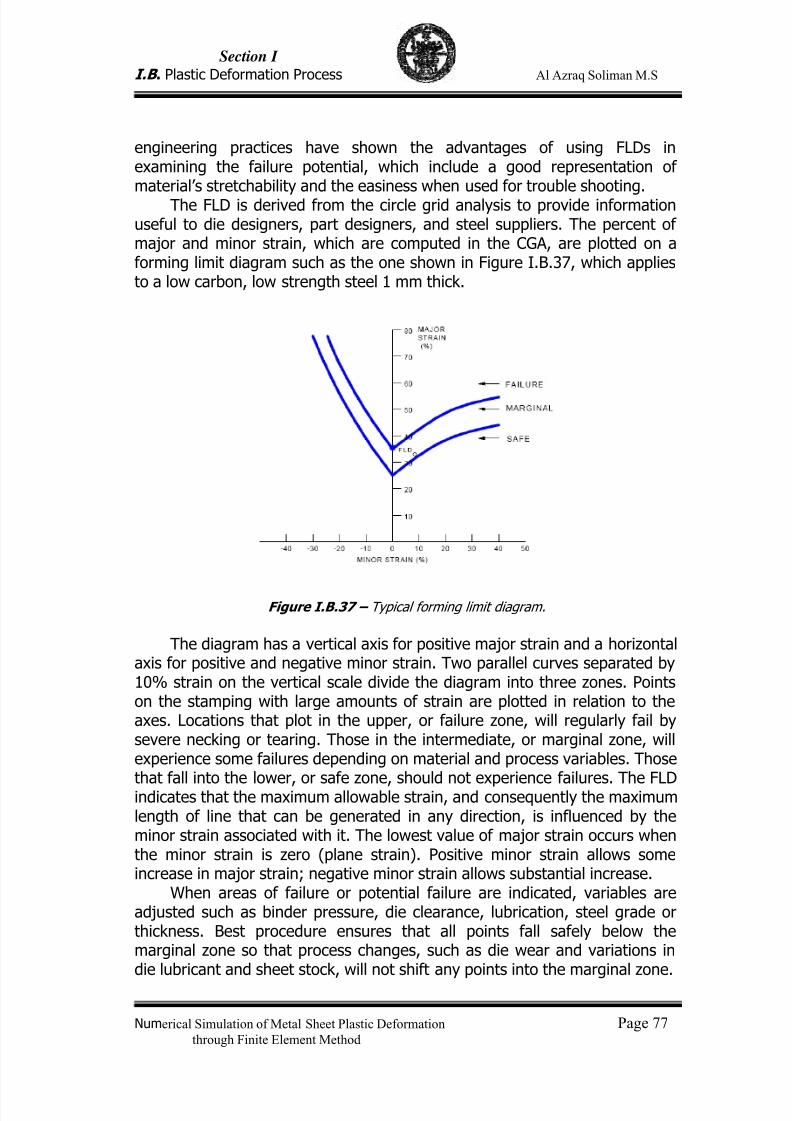
7/23/2019 Al Azraq Ingegneria Chimica Dei Materiali e Della Produzione
http://slidepdf.com/reader/full/al-azraq-ingegneria-chimica-dei-materiali-e-della-produzione 83/419
Section I
I.B . Plastic Deformation Process Al Azraq Soliman M.S
Numerical Simulation of Metal Sheet Plastic Deformation Page 77through Finite Element Method
engineering practices have shown the advantages of using FLDs inexamining the failure potential, which include a good representation ofmaterial’s stretchability and the easiness when used for trouble shooting.
The FLD is derived from the circle grid analysis to provide informationuseful to die designers, part designers, and steel suppliers. The percent ofmajor and minor strain, which are computed in the CGA, are plotted on aforming limit diagram such as the one shown in Figure I.B.37, which appliesto a low carbon, low strength steel 1 mm thick.
Figure I.B.37 – Typical forming limit diagram.
The diagram has a vertical axis for positive major strain and a horizontalaxis for positive and negative minor strain. Two parallel curves separated by10% strain on the vertical scale divide the diagram into three zones. Pointson the stamping with large amounts of strain are plotted in relation to theaxes. Locations that plot in the upper, or failure zone, will regularly fail bysevere necking or tearing. Those in the intermediate, or marginal zone, willexperience some failures depending on material and process variables. Those
that fall into the lower, or safe zone, should not experience failures. The FLDindicates that the maximum allowable strain, and consequently the maximumlength of line that can be generated in any direction, is influenced by theminor strain associated with it. The lowest value of major strain occurs whenthe minor strain is zero (plane strain). Positive minor strain allows someincrease in major strain; negative minor strain allows substantial increase.
When areas of failure or potential failure are indicated, variables areadjusted such as binder pressure, die clearance, lubrication, steel grade orthickness. Best procedure ensures that all points fall safely below themarginal zone so that process changes, such as die wear and variations indie lubricant and sheet stock, will not shift any points into the marginal zone.
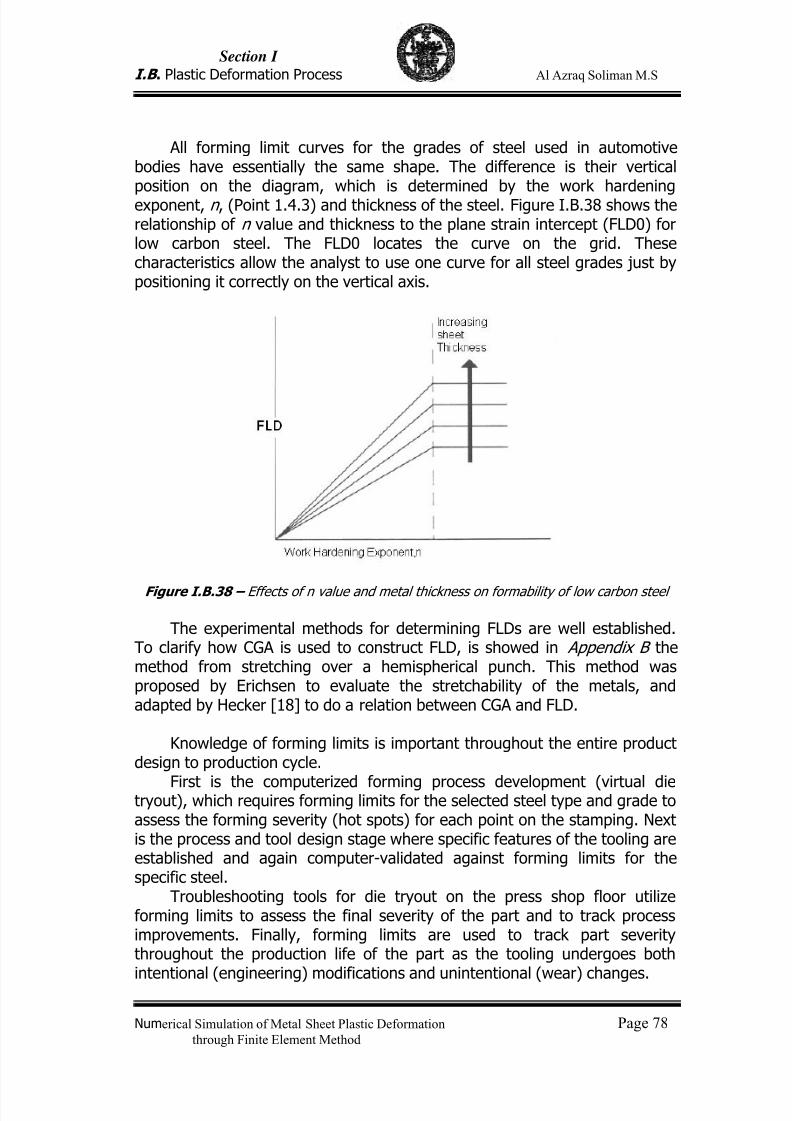
7/23/2019 Al Azraq Ingegneria Chimica Dei Materiali e Della Produzione
http://slidepdf.com/reader/full/al-azraq-ingegneria-chimica-dei-materiali-e-della-produzione 84/419
Section I
I.B . Plastic Deformation Process Al Azraq Soliman M.S
Numerical Simulation of Metal Sheet Plastic Deformation Page 78through Finite Element Method
All forming limit curves for the grades of steel used in automotivebodies have essentially the same shape. The difference is their verticalposition on the diagram, which is determined by the work hardeningexponent, n , (Point 1.4.3) and thickness of the steel. Figure I.B.38 shows therelationship of n value and thickness to the plane strain intercept (FLD0) forlow carbon steel. The FLD0 locates the curve on the grid. Thesecharacteristics allow the analyst to use one curve for all steel grades just bypositioning it correctly on the vertical axis.
Figure I.B.38 – Effects of n value and metal thickness on formability of low carbon steel
The experimental methods for determining FLDs are well established.To clarify how CGA is used to construct FLD, is showed in Appendix B themethod from stretching over a hemispherical punch. This method wasproposed by Erichsen to evaluate the stretchability of the metals, andadapted by Hecker [18] to do a relation between CGA and FLD.
Knowledge of forming limits is important throughout the entire productdesign to production cycle.
First is the computerized forming process development (virtual dietryout), which requires forming limits for the selected steel type and grade toassess the forming severity (hot spots) for each point on the stamping. Nextis the process and tool design stage where specific features of the tooling areestablished and again computer-validated against forming limits for thespecific steel.
Troubleshooting tools for die tryout on the press shop floor utilizeforming limits to assess the final severity of the part and to track processimprovements. Finally, forming limits are used to track part severity throughout the production life of the part as the tooling undergoes bothintentional (engineering) modifications and unintentional (wear) changes.
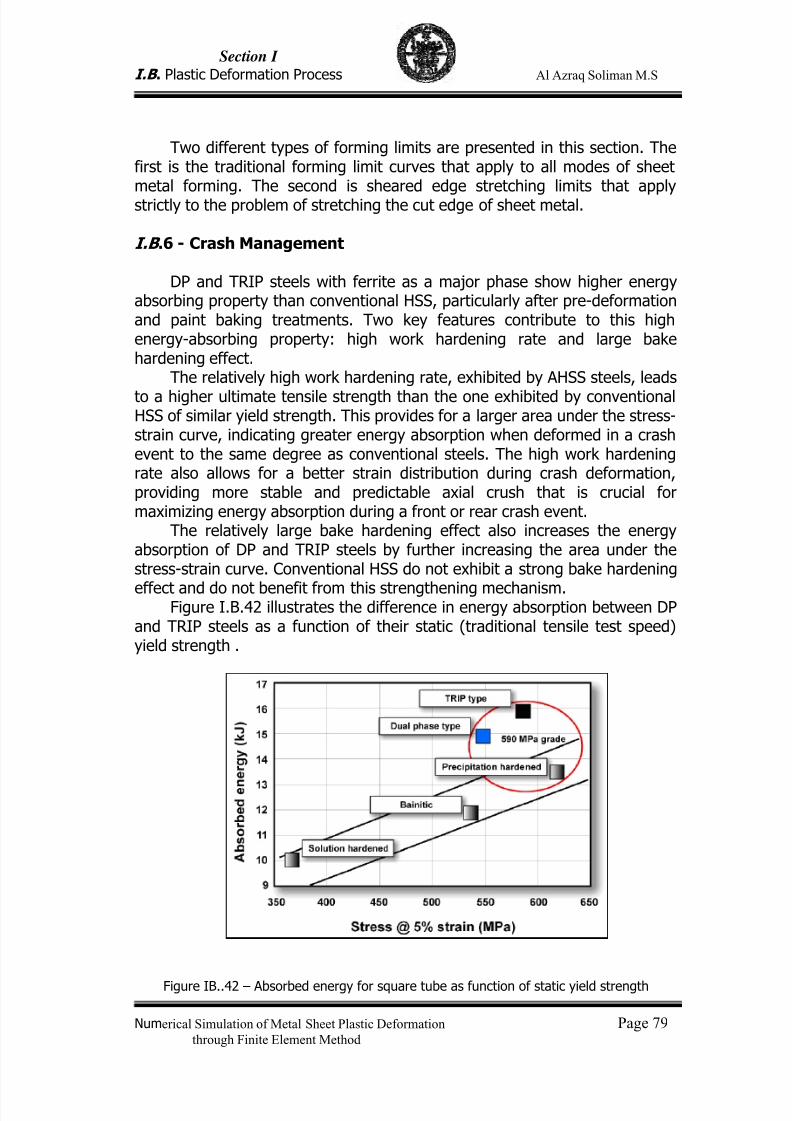
7/23/2019 Al Azraq Ingegneria Chimica Dei Materiali e Della Produzione
http://slidepdf.com/reader/full/al-azraq-ingegneria-chimica-dei-materiali-e-della-produzione 85/419
Section I
I.B . Plastic Deformation Process Al Azraq Soliman M.S
Numerical Simulation of Metal Sheet Plastic Deformation Page 79through Finite Element Method
Two different types of forming limits are presented in this section. Thefirst is the traditional forming limit curves that apply to all modes of sheetmetal forming. The second is sheared edge stretching limits that applystrictly to the problem of stretching the cut edge of sheet metal.
I.B .6 - Crash Management
DP and TRIP steels with ferrite as a major phase show higher energyabsorbing property than conventional HSS, particularly after pre-deformationand paint baking treatments. Two key features contribute to this highenergy-absorbing property: high work hardening rate and large bakehardening effect.
The relatively high work hardening rate, exhibited by AHSS steels, leads
to a higher ultimate tensile strength than the one exhibited by conventionalHSS of similar yield strength. This provides for a larger area under the stress-strain curve, indicating greater energy absorption when deformed in a crashevent to the same degree as conventional steels. The high work hardeningrate also allows for a better strain distribution during crash deformation, providing more stable and predictable axial crush that is crucial formaximizing energy absorption during a front or rear crash event.
The relatively large bake hardening effect also increases the energyabsorption of DP and TRIP steels by further increasing the area under thestress-strain curve. Conventional HSS do not exhibit a strong bake hardening
effect and do not benefit from this strengthening mechanism.Figure I.B.42 illustrates the difference in energy absorption between DP
and TRIP steels as a function of their static (traditional tensile test speed)yield strength .
Figure IB..42 – Absorbed energy for square tube as function of static yield strength
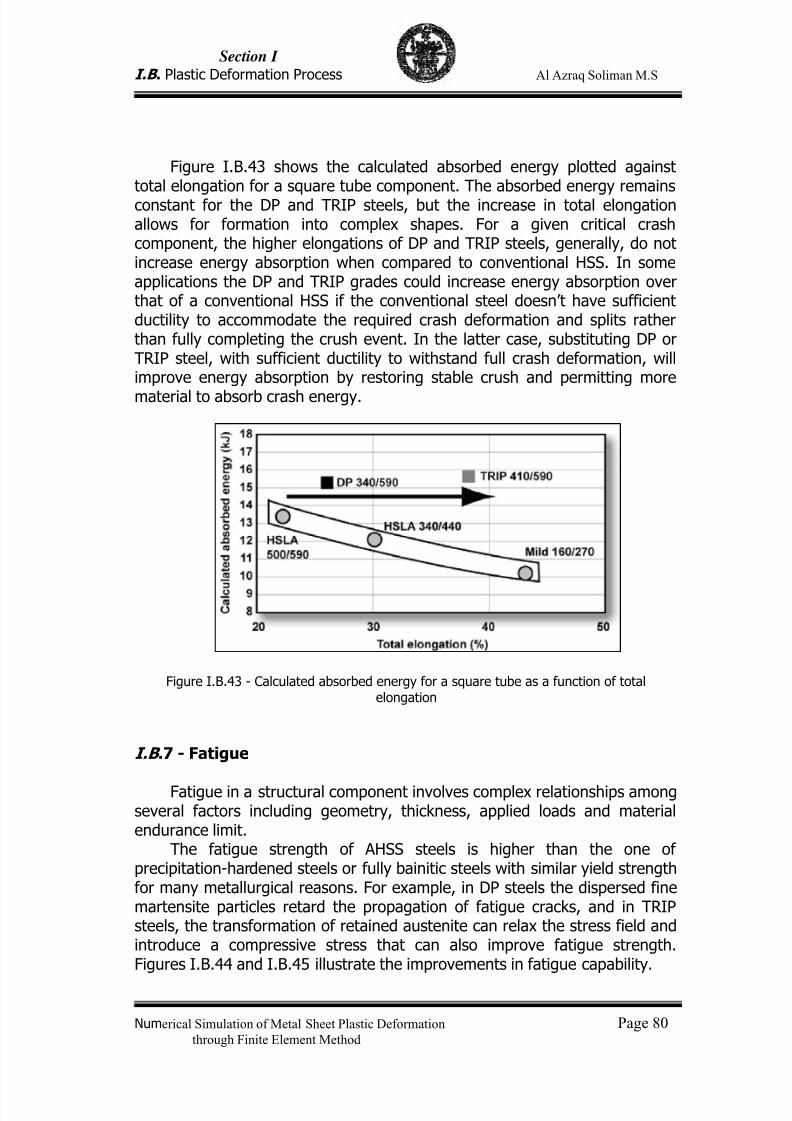
7/23/2019 Al Azraq Ingegneria Chimica Dei Materiali e Della Produzione
http://slidepdf.com/reader/full/al-azraq-ingegneria-chimica-dei-materiali-e-della-produzione 86/419
Section I
I.B . Plastic Deformation Process Al Azraq Soliman M.S
Numerical Simulation of Metal Sheet Plastic Deformation Page 80through Finite Element Method
Figure I.B.43 shows the calculated absorbed energy plotted againsttotal elongation for a square tube component. The absorbed energy remainsconstant for the DP and TRIP steels, but the increase in total elongationallows for formation into complex shapes. For a given critical crashcomponent, the higher elongations of DP and TRIP steels, generally, do notincrease energy absorption when compared to conventional HSS. In someapplications the DP and TRIP grades could increase energy absorption overthat of a conventional HSS if the conventional steel doesn’t have sufficientductility to accommodate the required crash deformation and splits ratherthan fully completing the crush event. In the latter case, substituting DP orTRIP steel, with sufficient ductility to withstand full crash deformation, willimprove energy absorption by restoring stable crush and permitting more
material to absorb crash energy.
Figure I.B.43 - Calculated absorbed energy for a square tube as a function of totalelongation
I.B .7 - Fatigue
Fatigue in a structural component involves complex relationships amongseveral factors including geometry, thickness, applied loads and materialendurance limit.
The fatigue strength of AHSS steels is higher than the one ofprecipitation-hardened steels or fully bainitic steels with similar yield strengthfor many metallurgical reasons. For example, in DP steels the dispersed finemartensite particles retard the propagation of fatigue cracks, and in TRIPsteels, the transformation of retained austenite can relax the stress field andintroduce a compressive stress that can also improve fatigue strength.Figures I.B.44 and I.B.45 illustrate the improvements in fatigue capability.
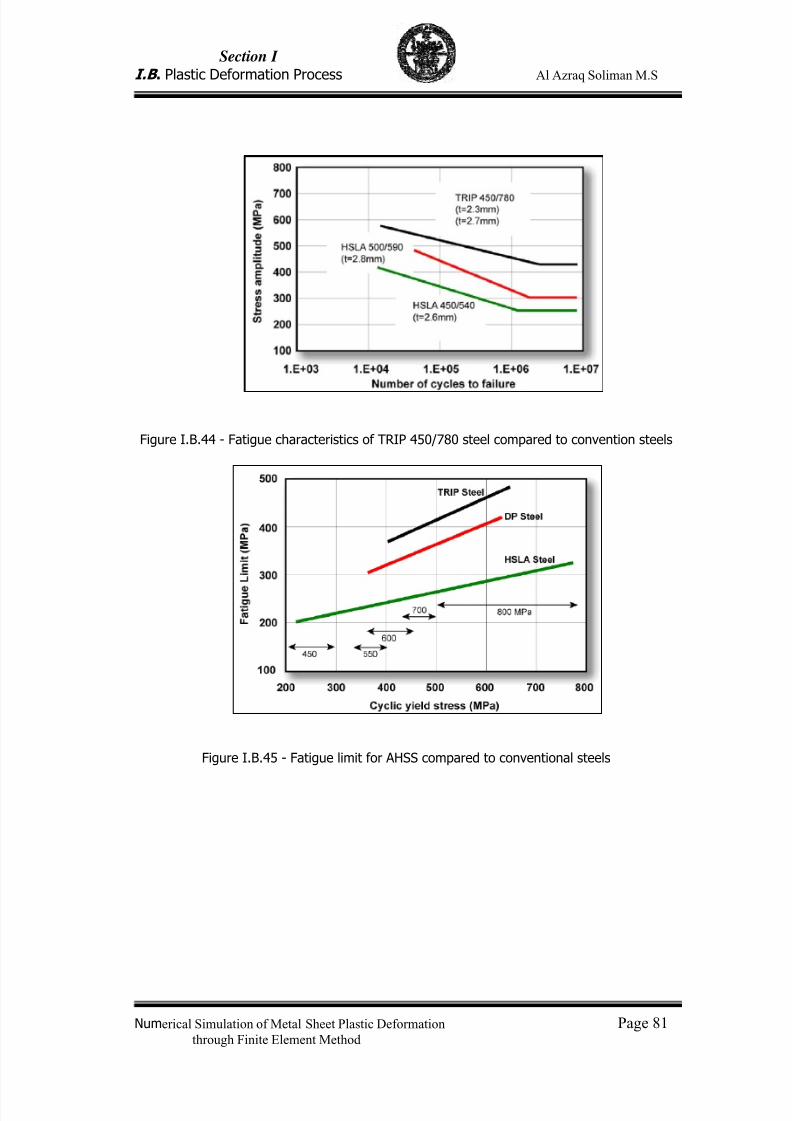
7/23/2019 Al Azraq Ingegneria Chimica Dei Materiali e Della Produzione
http://slidepdf.com/reader/full/al-azraq-ingegneria-chimica-dei-materiali-e-della-produzione 87/419
Section I
I.B . Plastic Deformation Process Al Azraq Soliman M.S
Numerical Simulation of Metal Sheet Plastic Deformation Page 81through Finite Element Method
Figure I.B.44 - Fatigue characteristics of TRIP 450/780 steel compared to convention steels
Figure I.B.45 - Fatigue limit for AHSS compared to conventional steels
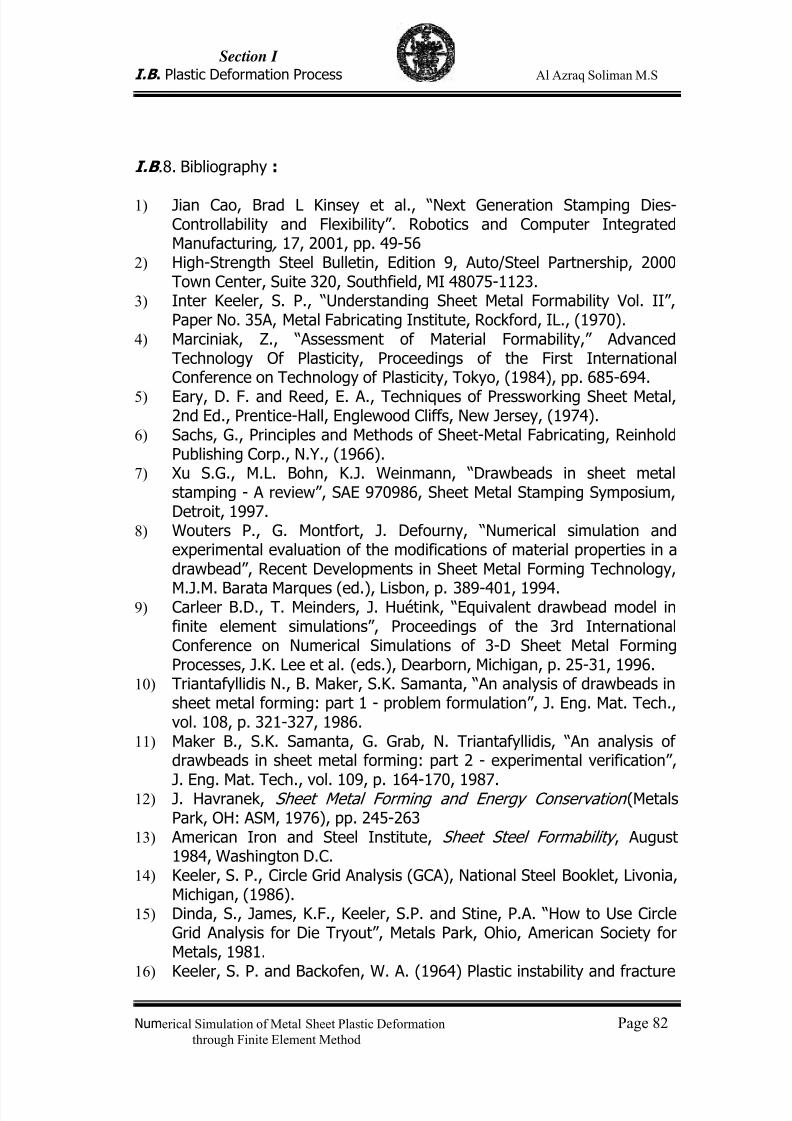
7/23/2019 Al Azraq Ingegneria Chimica Dei Materiali e Della Produzione
http://slidepdf.com/reader/full/al-azraq-ingegneria-chimica-dei-materiali-e-della-produzione 88/419
Section I
I.B . Plastic Deformation Process Al Azraq Soliman M.S
Numerical Simulation of Metal Sheet Plastic Deformation Page 82through Finite Element Method
I.B .8. Bibliography :
1)
Jian Cao, Brad L Kinsey et al., “Next Generation Stamping Dies-Controllability and Flexibility”. Robotics and Computer IntegratedManufacturing , 17, 2001, pp. 49-56
2) High-Strength Steel Bulletin, Edition 9, Auto/Steel Partnership, 2000Town Center, Suite 320, Southfield, MI 48075-1123.
3) Inter Keeler, S. P., “Understanding Sheet Metal Formability Vol. II”,Paper No. 35A, Metal Fabricating Institute, Rockford, IL., (1970).
4) Marciniak, Z., “Assessment of Material Formability,” AdvancedTechnology Of Plasticity, Proceedings of the First InternationalConference on Technology of Plasticity, Tokyo, (1984), pp. 685-694.
5)
Eary, D. F. and Reed, E. A., Techniques of Pressworking Sheet Metal,2nd Ed., Prentice-Hall, Englewood Cliffs, New Jersey, (1974).
6) Sachs, G., Principles and Methods of Sheet-Metal Fabricating, ReinholdPublishing Corp., N.Y., (1966).
7) Xu S.G., M.L. Bohn, K.J. Weinmann, “Drawbeads in sheet metal
stamping - A review”, SAE 970986, Sheet Metal Stamping Symposium,Detroit, 1997.
8) Wouters P., G. Montfort, J. Defourny, “Numerical simulation andexperimental evaluation of the modifications of material properties in adrawbead”, Recent Developments in Sheet Metal Forming Technology,
M.J.M. Barata Marques (ed.), Lisbon, p. 389-401, 1994.9) Carleer B.D., T. Meinders, J. Huétink, “Equivalent drawbead model in
finite element simulations”, Proceedings of the 3rd InternationalConference on Numerical Simulations of 3-D Sheet Metal FormingProcesses, J.K. Lee et al. (eds.), Dearborn, Michigan, p. 25-31, 1996.
10) Triantafyllidis N., B. Maker, S.K. Samanta, “An analysis of drawbeads insheet metal forming: part 1 - problem formulation”, J. Eng. Mat. Tech.,vol. 108, p. 321-327, 1986.
11) Maker B., S.K. Samanta, G. Grab, N. Triantafyllidis, “An analysis ofdrawbeads in sheet metal forming: part 2 - experimental verification”,
J. Eng. Mat. Tech., vol. 109, p. 164-170, 1987.12) J. Havranek, Sheet Metal Forming and Energy Conservation (MetalsPark, OH: ASM, 1976), pp. 245-263
13) American Iron and Steel Institute, Sheet Steel Formability , August1984, Washington D.C.
14) Keeler, S. P., Circle Grid Analysis (GCA), National Steel Booklet, Livonia,Michigan, (1986).
15) Dinda, S., James, K.F., Keeler, S.P. and Stine, P.A. “How to Use CircleGrid Analysis for Die Tryout”, Metals Park, Ohio, American Society forMetals, 1981.
16) Keeler, S. P. and Backofen, W. A. (1964) Plastic instability and fracture

7/23/2019 Al Azraq Ingegneria Chimica Dei Materiali e Della Produzione
http://slidepdf.com/reader/full/al-azraq-ingegneria-chimica-dei-materiali-e-della-produzione 89/419
Section I
I.B . Plastic Deformation Process Al Azraq Soliman M.S
Numerical Simulation of Metal Sheet Plastic Deformation Page 83through Finite Element Method
in sheets stretched over rigid punches, ASM Trans. Quart. 56, 25.17) Goodwin, G. M. (1968) Application of strain analysis to sheet metal
forming problems in the press shop. SAE paper No. 680093.18)
Hecker, S. S. " A Simple Forming Limit Curve Technique and Results on Aluminum Alloys," Sheet Metal Forming and Formability, Proceedings ofthe 7th Biennial Congress of the International Deep Drawing ResearchGroup, Amsterdam (1972) 5.1-5.8.

7/23/2019 Al Azraq Ingegneria Chimica Dei Materiali e Della Produzione
http://slidepdf.com/reader/full/al-azraq-ingegneria-chimica-dei-materiali-e-della-produzione 90/419
Section I.C
Springback
7/23/2019 Al Azraq Ingegneria Chimica Dei Materiali e Della Produzione
http://slidepdf.com/reader/full/al-azraq-ingegneria-chimica-dei-materiali-e-della-produzione 91/419
Section I
I.C . Springback Al Azraq Soliman M.S
Numerical Simulation of Metal Sheet Plastic Deformation Page 84through Finite Element Method
Springback
I.C .1 – Introduction
Sheet metal forming involves the transformation of a flat sheet of metalinto a useful shape. A common problem in this transformation is thedistortion in the shape of the stamping that occurs when the deforming loadis removed or when the stamping is removed from the tooling. Thisdimensional change is called springback and results from changes in strainproduced by elastic recovery.
Springback is inherent in all sheet metal forming processes. Manyfactors could affect springback in the process, such as material variations in
mechanical properties, sheet thickness, tooling geometry (including the dieradius and the gap between the die and the punch), lubricant condition,geometry of the part, etc. In summa, springback results from the interactionof all components of the Forming System. The importance of springbackdepends on the end application, quality requirements, subsequent processingsteps, etc. For example, excessive or variable springback in a channel whichis subsequently welded with critical dimensional control is an importantprocessing parameter. On the other hand, springback in the back corner of afloor pan may be relatively unimportant and corrective action may beunnecessary.
Three basic approaches are used to correct for springback. The first,design of the forming process to eliminate the springback through control ofthe stress-strain patterns generated in the stamping during the formingoperation. The second isn’t to control the springback but to compensate forthe springback in the original design of the tooling – for exampleoverbending – such that the final part will be dimensionally correct. The thirdis changing a little bit the part design without forget his functionality.
Each of these approaches requires an understanding of the causes ofspringback and the factors which affect its magnitude. With this knowledge,trial and error attempts at springback correction become more effective.
Ideally, a method is required for quantitatively predicting the magnitude anddirection of the springback and/or the residual stress distribution after theforming operation is completed.
Springback is one of the most difficult problems in applying highstrength steel (HSS) to automotive body parts. Because all of that, the AHSSmanufacturing is nowadays a big challenge to the biggest companies(principally in the automotive field), therefore an exhaustive studied isapplied to understand the all problematic in stamping this new type of steel.
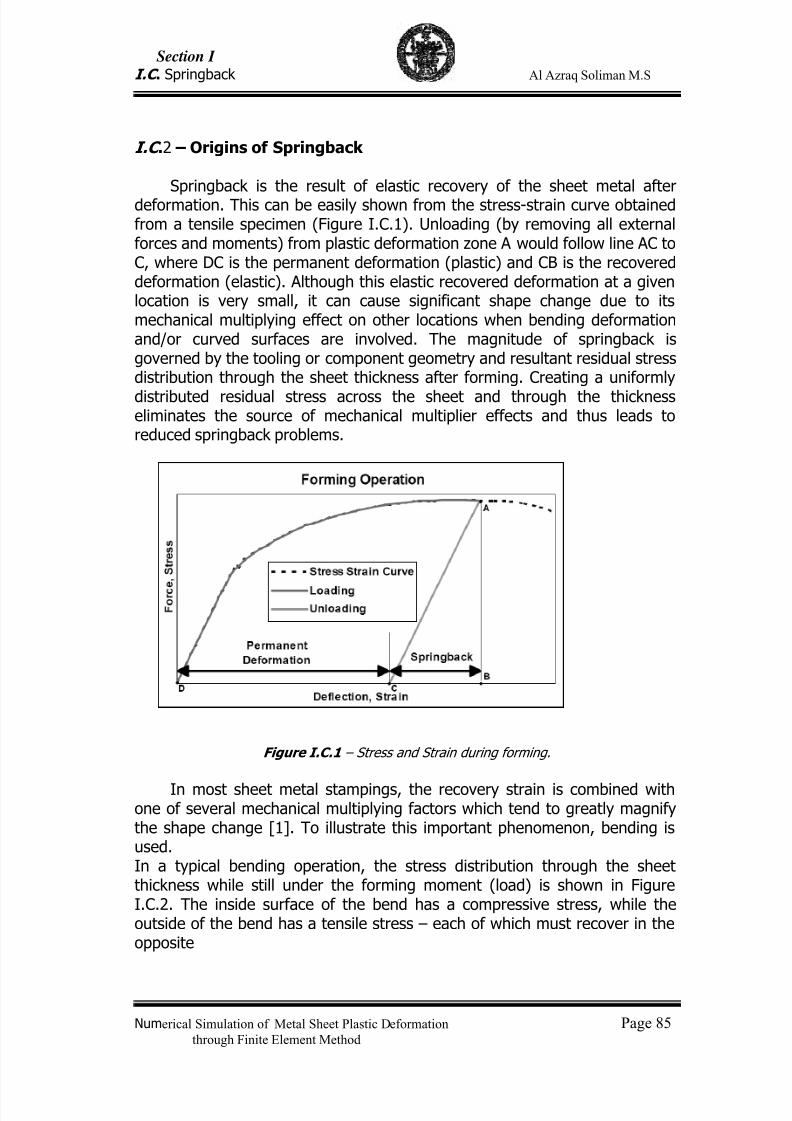
7/23/2019 Al Azraq Ingegneria Chimica Dei Materiali e Della Produzione
http://slidepdf.com/reader/full/al-azraq-ingegneria-chimica-dei-materiali-e-della-produzione 92/419
Section I
I.C . Springback Al Azraq Soliman M.S
Numerical Simulation of Metal Sheet Plastic Deformation Page 85through Finite Element Method
I.C .2 – Origins of Springback
Springback is the result of elastic recovery of the sheet metal afterdeformation. This can be easily shown from the stress-strain curve obtainedfrom a tensile specimen (Figure I.C.1). Unloading (by removing all externalforces and moments) from plastic deformation zone A would follow line AC toC, where DC is the permanent deformation (plastic) and CB is the recovereddeformation (elastic). Although this elastic recovered deformation at a givenlocation is very small, it can cause significant shape change due to itsmechanical multiplying effect on other locations when bending deformationand/or curved surfaces are involved. The magnitude of springback isgoverned by the tooling or component geometry and resultant residual stressdistribution through the sheet thickness after forming. Creating a uniformly
distributed residual stress across the sheet and through the thicknesseliminates the source of mechanical multiplier effects and thus leads toreduced springback problems.
Figure I.C.1 – Stress and Strain during forming.
In most sheet metal stampings, the recovery strain is combined withone of several mechanical multiplying factors which tend to greatly magnifythe shape change [1]. To illustrate this important phenomenon, bending isused.In a typical bending operation, the stress distribution through the sheetthickness while still under the forming moment (load) is shown in FigureI.C.2. The inside surface of the bend has a compressive stress, while theoutside of the bend has a tensile stress – each of which must recover in theopposite
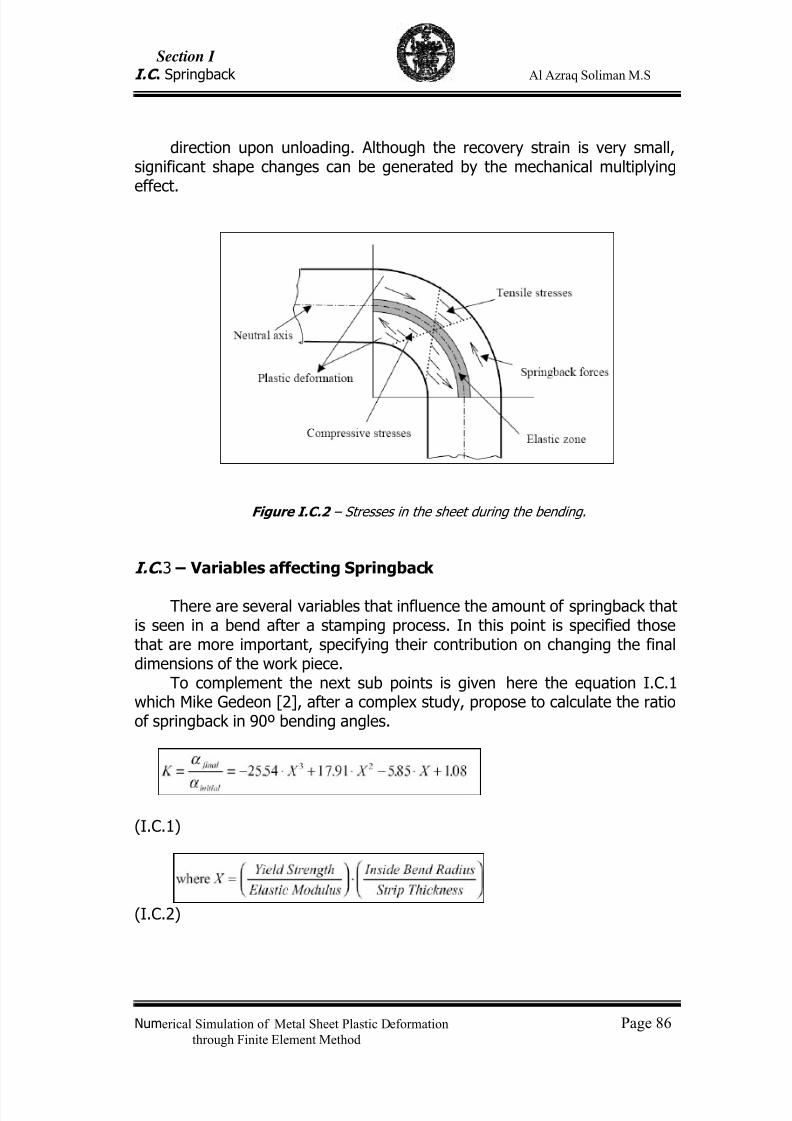
7/23/2019 Al Azraq Ingegneria Chimica Dei Materiali e Della Produzione
http://slidepdf.com/reader/full/al-azraq-ingegneria-chimica-dei-materiali-e-della-produzione 93/419
Section I
I.C . Springback Al Azraq Soliman M.S
Numerical Simulation of Metal Sheet Plastic Deformation Page 86through Finite Element Method
direction upon unloading. Although the recovery strain is very small,significant shape changes can be generated by the mechanical multiplyingeffect.
Figure I.C.2 – Stresses in the sheet during the bending.
I.C .3 – Variables affecting Springback
There are several variables that influence the amount of springback thatis seen in a bend after a stamping process. In this point is specified thosethat are more important, specifying their contribution on changing the finaldimensions of the work piece.
To complement the next sub points is given here the equation I.C.1which Mike Gedeon [2], after a complex study, propose to calculate the ratioof springback in 90º bending angles.
(I.C.1)
(I.C.2)
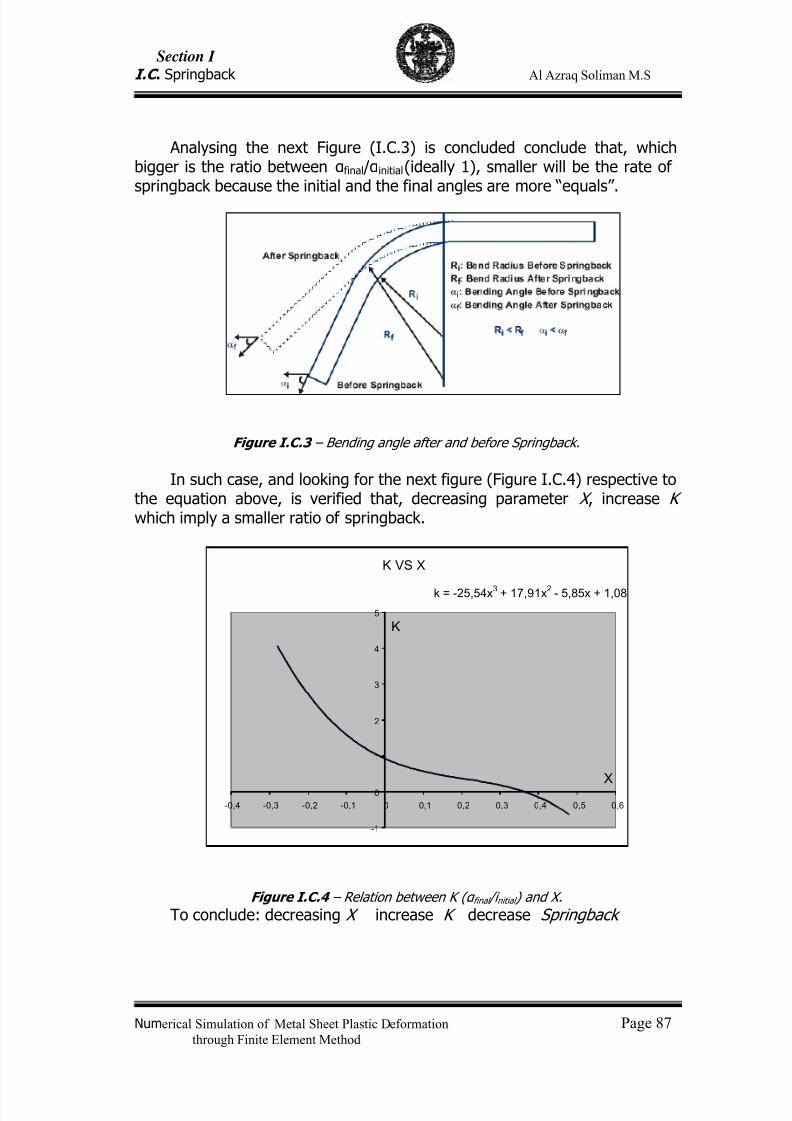
7/23/2019 Al Azraq Ingegneria Chimica Dei Materiali e Della Produzione
http://slidepdf.com/reader/full/al-azraq-ingegneria-chimica-dei-materiali-e-della-produzione 94/419
Section I
I.C . Springback Al Azraq Soliman M.S
Numerical Simulation of Metal Sheet Plastic Deformation Page 87through Finite Element Method
Analysing the next Figure (I.C.3) is concluded conclude that, whichbigger is the ratio between αfinal /αinitial (ideally 1), smaller will be the rate ofspringback because the initial and the final angles are more “equals”.
Figure I.C.3 – Bending angle after and before Springback.
In such case, and looking for the next figure (Figure I.C.4) respective tothe equation above, is verified that, decreasing parameter X , increase K which imply a smaller ratio of springback.
K VS X
k = -25,54x3 + 17,91x2 - 5,85x + 1,08
-1
0
1
2
3
4
5
-0,4 -0,3 -0,2 -0,1 0 0,1 0,2 0,3 0,4 0,5 0,6
X
K
Figure I.C.4 – Relation between K ( α final /i nitial ) and X.
To conclude: decreasing X increase K decrease Springback
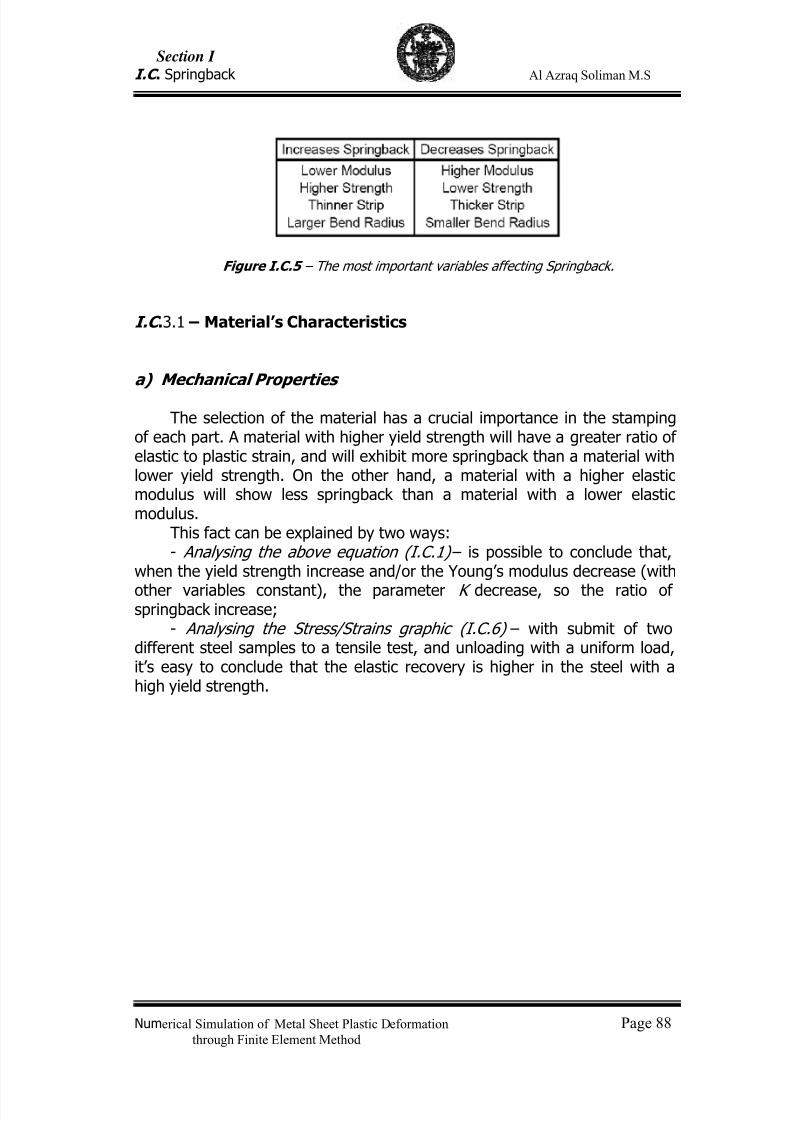
7/23/2019 Al Azraq Ingegneria Chimica Dei Materiali e Della Produzione
http://slidepdf.com/reader/full/al-azraq-ingegneria-chimica-dei-materiali-e-della-produzione 95/419
Section I
I.C . Springback Al Azraq Soliman M.S
Numerical Simulation of Metal Sheet Plastic Deformation Page 88through Finite Element Method
Figure I.C.5 – The most important variables affecting Springback.
I.C .3.1 – Material’s Characteristics
a) Mechanical Properties
The selection of the material has a crucial importance in the stampingof each part. A material with higher yield strength will have a greater ratio ofelastic to plastic strain, and will exhibit more springback than a material withlower yield strength. On the other hand, a material with a higher elasticmodulus will show less springback than a material with a lower elasticmodulus.
This fact can be explained by two ways:- Analysing the above equation (I.C.1) – is possible to conclude that,
when the yield strength increase and/or the Young’s modulus decrease (with
other variables constant), the parameter K decrease, so the ratio ofspringback increase;
- Analysing the Stress/Strains graphic (I.C.6) – with submit of twodifferent steel samples to a tensile test, and unloading with a uniform load,it’s easy to conclude that the elastic recovery is higher in the steel with ahigh yield strength.
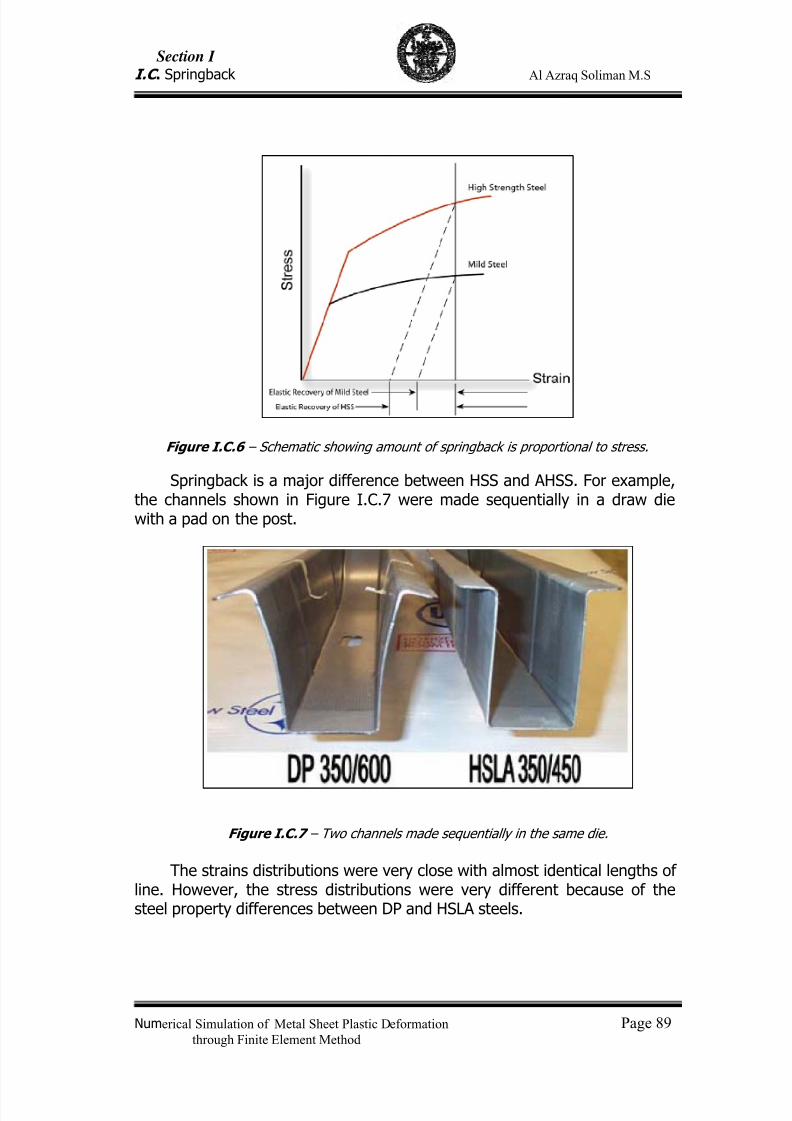
7/23/2019 Al Azraq Ingegneria Chimica Dei Materiali e Della Produzione
http://slidepdf.com/reader/full/al-azraq-ingegneria-chimica-dei-materiali-e-della-produzione 96/419
Section I
I.C . Springback Al Azraq Soliman M.S
Numerical Simulation of Metal Sheet Plastic Deformation Page 89through Finite Element Method
Figure I.C.6 – Schematic showing amount of springback is proportional to stress.
Springback is a major difference between HSS and AHSS. For example,the channels shown in Figure I.C.7 were made sequentially in a draw diewith a pad on the post.
Figure I.C.7 – Two channels made sequentially in the same die.
The strains distributions were very close with almost identical lengths ofline. However, the stress distributions were very different because of thesteel property differences between DP and HSLA steels.
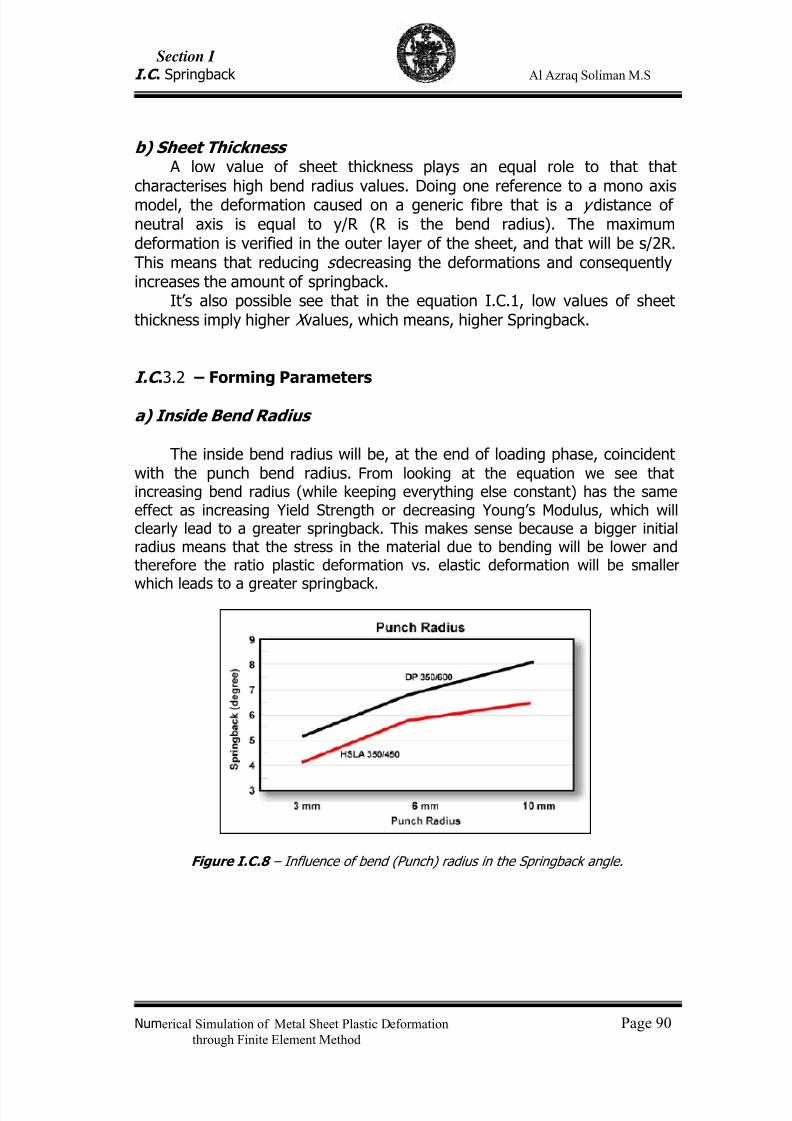
7/23/2019 Al Azraq Ingegneria Chimica Dei Materiali e Della Produzione
http://slidepdf.com/reader/full/al-azraq-ingegneria-chimica-dei-materiali-e-della-produzione 97/419
Section I
I.C . Springback Al Azraq Soliman M.S
Numerical Simulation of Metal Sheet Plastic Deformation Page 90through Finite Element Method
b) Sheet Thickness A low value of sheet thickness plays an equal role to that that
characterises high bend radius values. Doing one reference to a mono axismodel, the deformation caused on a generic fibre that is a y distance ofneutral axis is equal to y/R (R is the bend radius). The maximumdeformation is verified in the outer layer of the sheet, and that will be s/2R.This means that reducing s decreasing the deformations and consequentlyincreases the amount of springback.
It’s also possible see that in the equation I.C.1, low values of sheetthickness imply higher X values, which means, higher Springback.
I.C .3.2 – Forming Parameters
a) Inside Bend Radius
The inside bend radius will be, at the end of loading phase, coincidentwith the punch bend radius. From looking at the equation we see thatincreasing bend radius (while keeping everything else constant) has the sameeffect as increasing Yield Strength or decreasing Young’s Modulus, which willclearly lead to a greater springback. This makes sense because a bigger initialradius means that the stress in the material due to bending will be lower andtherefore the ratio plastic deformation vs. elastic deformation will be smaller
which leads to a greater springback.
Figure I.C.8 – Influence of bend (Punch) radius in the Springback angle.
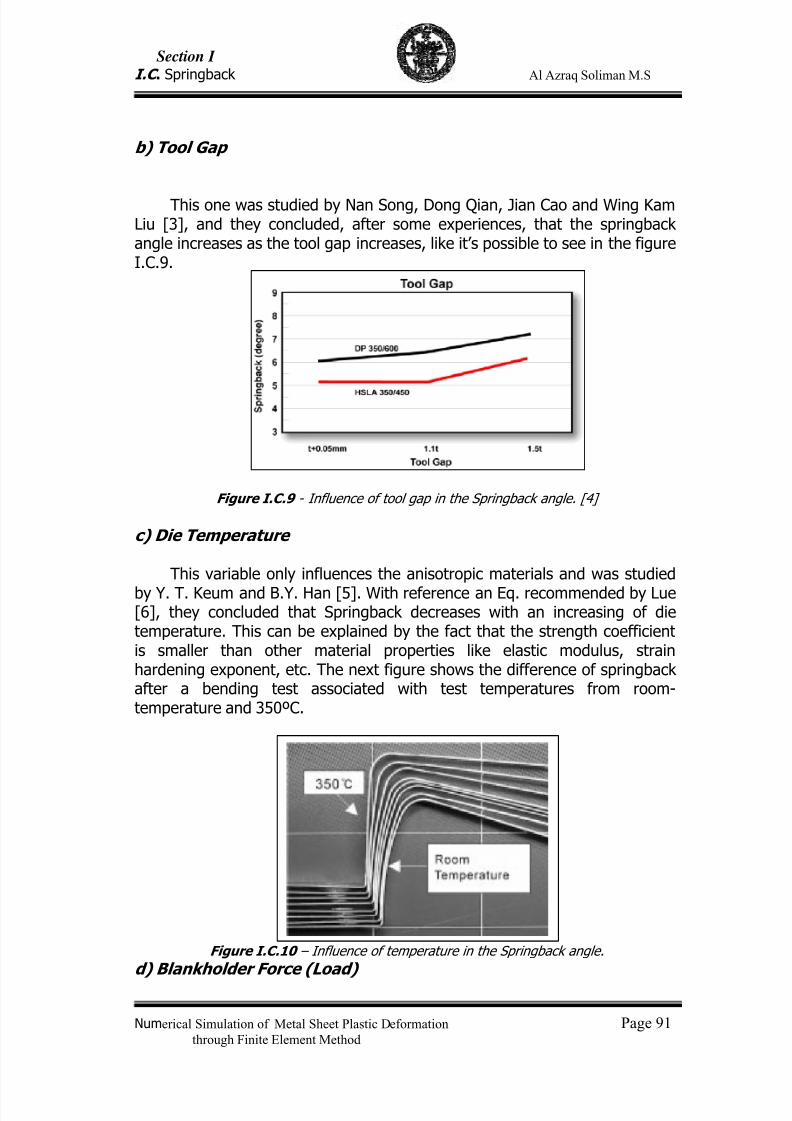
7/23/2019 Al Azraq Ingegneria Chimica Dei Materiali e Della Produzione
http://slidepdf.com/reader/full/al-azraq-ingegneria-chimica-dei-materiali-e-della-produzione 98/419
Section I
I.C . Springback Al Azraq Soliman M.S
Numerical Simulation of Metal Sheet Plastic Deformation Page 91through Finite Element Method
b) Tool Gap
This one was studied by Nan Song, Dong Qian, Jian Cao and Wing KamLiu [3], and they concluded, after some experiences, that the springbackangle increases as the tool gap increases, like it’s possible to see in the figureI.C.9.
Figure I.C.9 - Influence of tool gap in the Springback angle. [4]
c) Die Temperature
This variable only influences the anisotropic materials and was studied
by Y. T. Keum and B.Y. Han [5]. With reference an Eq. recommended by Lue[6], they concluded that Springback decreases with an increasing of dietemperature. This can be explained by the fact that the strength coefficientis smaller than other material properties like elastic modulus, strainhardening exponent, etc. The next figure shows the difference of springbackafter a bending test associated with test temperatures from room-temperature and 350ºC.
Figure I.C.10 – Influence of temperature in the Springback angle.
d) Blankholder Force (Load)
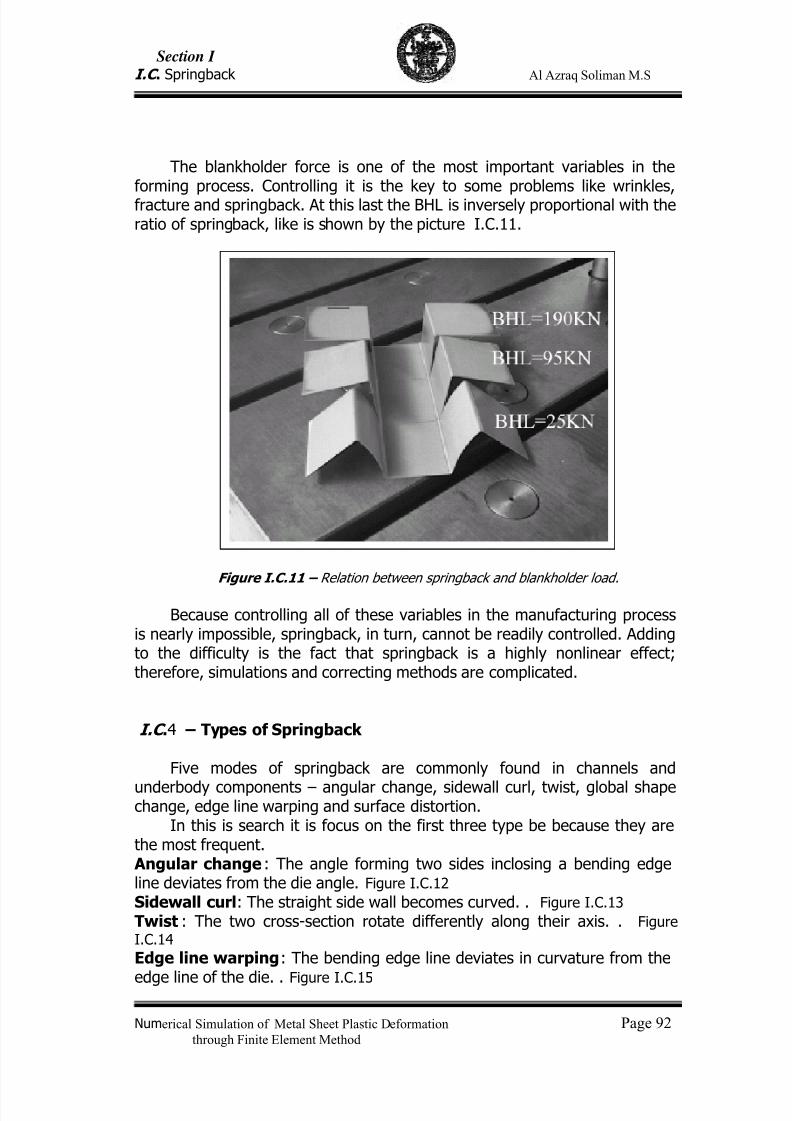
7/23/2019 Al Azraq Ingegneria Chimica Dei Materiali e Della Produzione
http://slidepdf.com/reader/full/al-azraq-ingegneria-chimica-dei-materiali-e-della-produzione 99/419
Section I
I.C . Springback Al Azraq Soliman M.S
Numerical Simulation of Metal Sheet Plastic Deformation Page 92through Finite Element Method
The blankholder force is one of the most important variables in theforming process. Controlling it is the key to some problems like wrinkles,fracture and springback. At this last the BHL is inversely proportional with theratio of springback, like is shown by the picture I.C.11.
Figure I.C.11 – Relation between springback and blankholder load.
Because controlling all of these variables in the manufacturing processis nearly impossible, springback, in turn, cannot be readily controlled. Addingto the difficulty is the fact that springback is a highly nonlinear effect;therefore, simulations and correcting methods are complicated.
I.C .4 – Types of Springback
Five modes of springback are commonly found in channels and
underbody components – angular change, sidewall curl, twist, global shapechange, edge line warping and surface distortion.
In this is search it is focus on the first three type be because they arethe most frequent.
Angular change : The angle forming two sides inclosing a bending edgeline deviates from the die angle. Figure I.C.12 Sidewall curl : The straight side wall becomes curved. . Figure I.C.13 Twist : The two cross-section rotate differently along their axis. . Figure
I.C.14 Edge line warping : The bending edge line deviates in curvature from the
edge line of the die. . Figure I.C.15
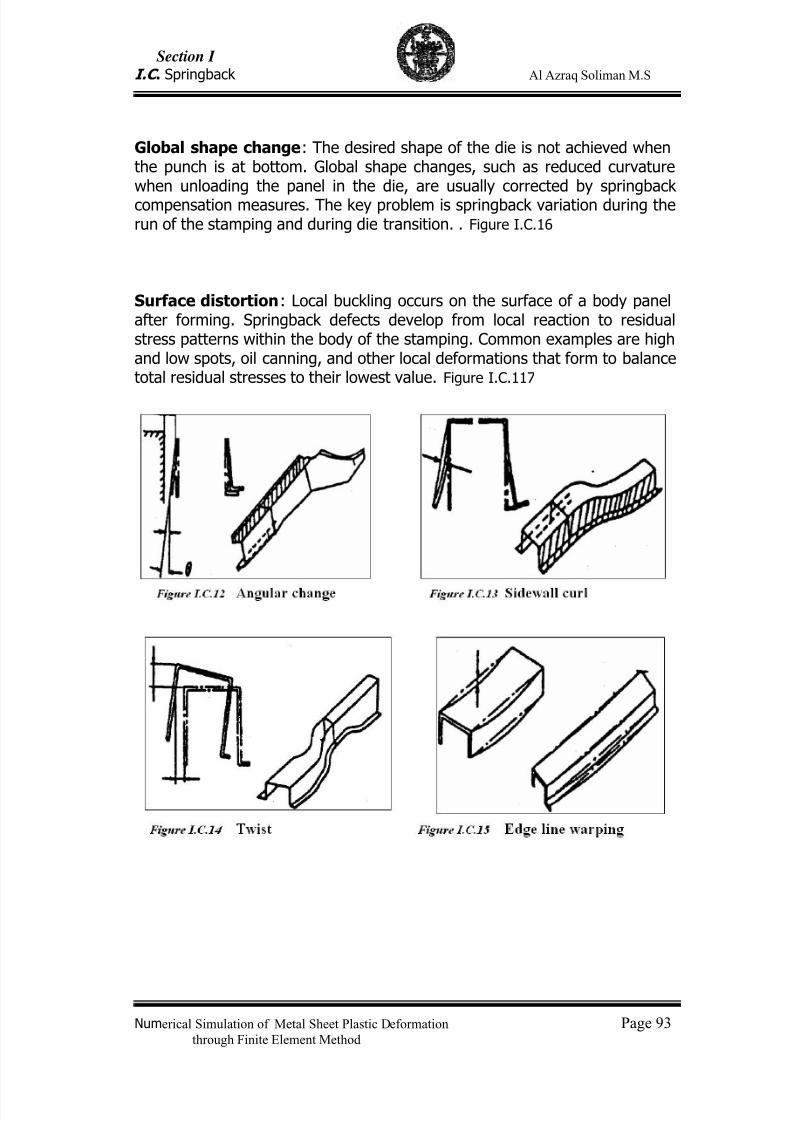
7/23/2019 Al Azraq Ingegneria Chimica Dei Materiali e Della Produzione
http://slidepdf.com/reader/full/al-azraq-ingegneria-chimica-dei-materiali-e-della-produzione 100/419
Section I
I.C . Springback Al Azraq Soliman M.S
Numerical Simulation of Metal Sheet Plastic Deformation Page 93through Finite Element Method
Global shape change : The desired shape of the die is not achieved whenthe punch is at bottom. Global shape changes, such as reduced curvaturewhen unloading the panel in the die, are usually corrected by springbackcompensation measures. The key problem is springback variation during therun of the stamping and during die transition. . Figure I.C.16
Surface distortion : Local buckling occurs on the surface of a body panelafter forming. Springback defects develop from local reaction to residualstress patterns within the body of the stamping. Common examples are highand low spots, oil canning, and other local deformations that form to balancetotal residual stresses to their lowest value. Figure I.C.117
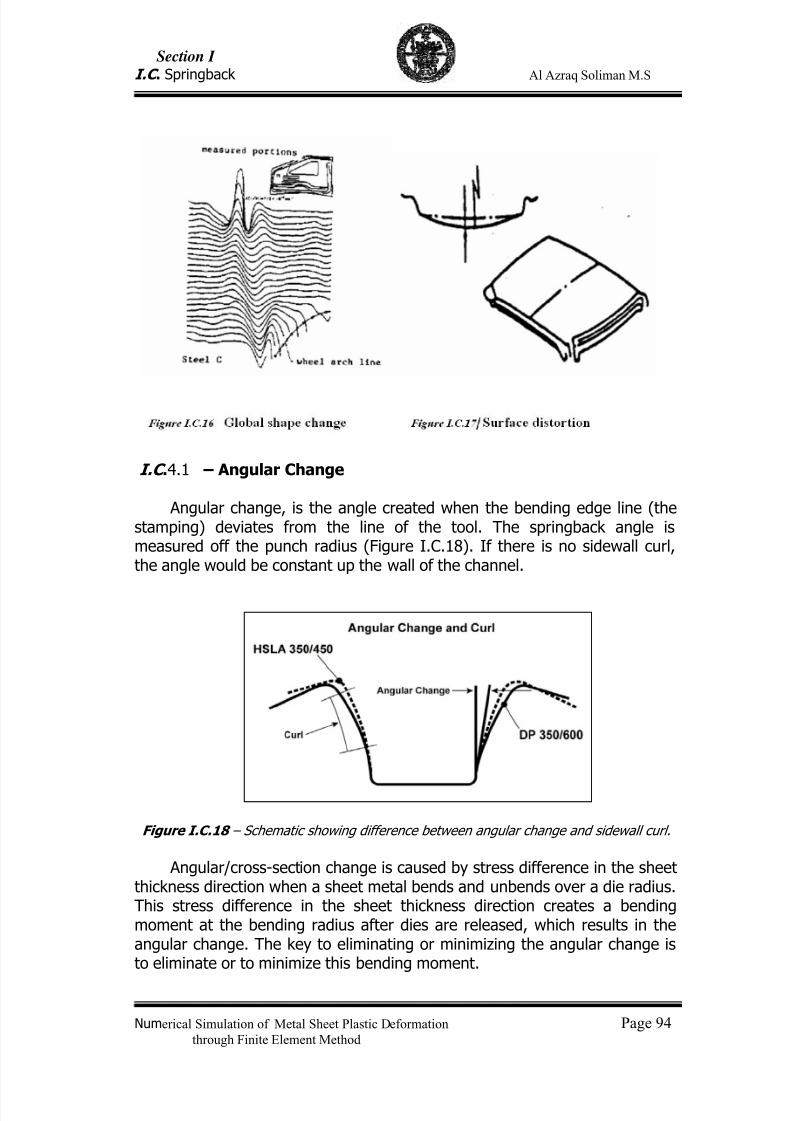
7/23/2019 Al Azraq Ingegneria Chimica Dei Materiali e Della Produzione
http://slidepdf.com/reader/full/al-azraq-ingegneria-chimica-dei-materiali-e-della-produzione 101/419
Section I
I.C . Springback Al Azraq Soliman M.S
Numerical Simulation of Metal Sheet Plastic Deformation Page 94through Finite Element Method
I.C .4.1 – Angular Change
Angular change, is the angle created when the bending edge line (thestamping) deviates from the line of the tool. The springback angle ismeasured off the punch radius (Figure I.C.18). If there is no sidewall curl,the angle would be constant up the wall of the channel.
Figure I.C.18 – Schematic showing difference between angular change and sidewall curl.
Angular/cross-section change is caused by stress difference in the sheetthickness direction when a sheet metal bends and unbends over a die radius.This stress difference in the sheet thickness direction creates a bendingmoment at the bending radius after dies are released, which results in theangular change. The key to eliminating or minimizing the angular change isto eliminate or to minimize this bending moment.
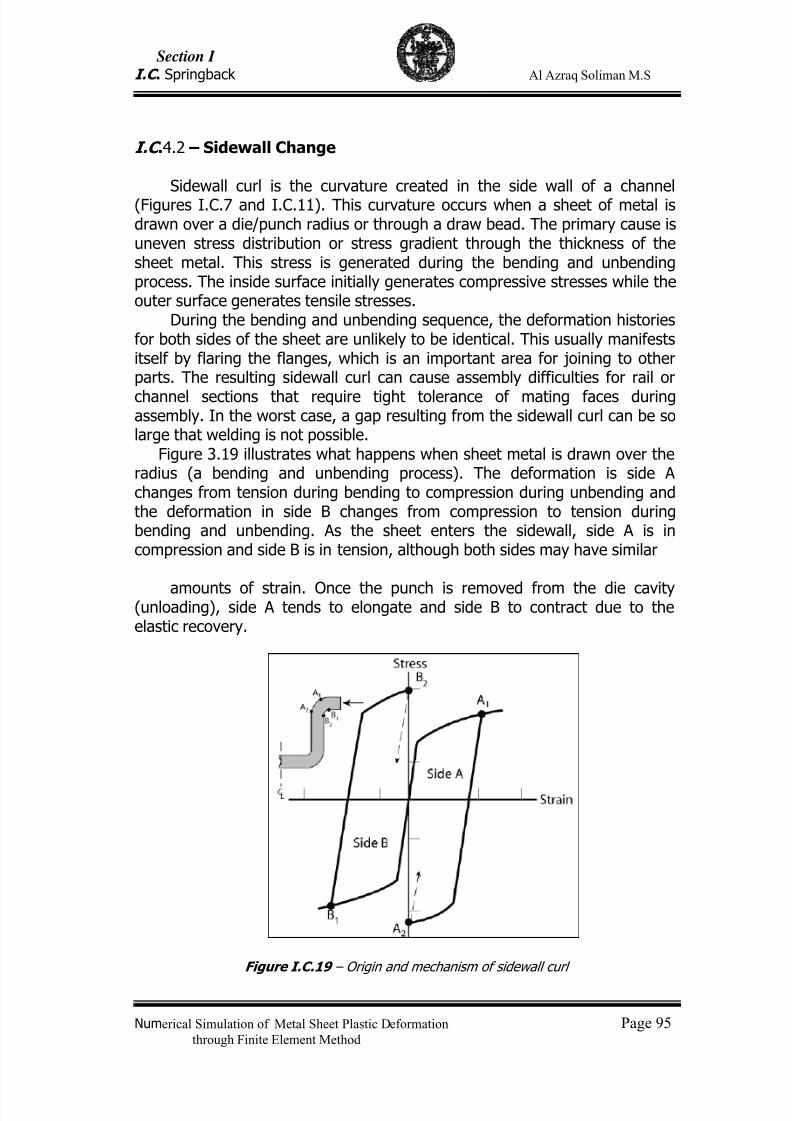
7/23/2019 Al Azraq Ingegneria Chimica Dei Materiali e Della Produzione
http://slidepdf.com/reader/full/al-azraq-ingegneria-chimica-dei-materiali-e-della-produzione 102/419
Section I
I.C . Springback Al Azraq Soliman M.S
Numerical Simulation of Metal Sheet Plastic Deformation Page 95through Finite Element Method
I.C .4.2 – Sidewall Change
Sidewall curl is the curvature created in the side wall of a channel(Figures I.C.7 and I.C.11). This curvature occurs when a sheet of metal isdrawn over a die/punch radius or through a draw bead. The primary cause isuneven stress distribution or stress gradient through the thickness of thesheet metal. This stress is generated during the bending and unbendingprocess. The inside surface initially generates compressive stresses while theouter surface generates tensile stresses.
During the bending and unbending sequence, the deformation historiesfor both sides of the sheet are unlikely to be identical. This usually manifestsitself by flaring the flanges, which is an important area for joining to otherparts. The resulting sidewall curl can cause assembly difficulties for rail or
channel sections that require tight tolerance of mating faces duringassembly. In the worst case, a gap resulting from the sidewall curl can be solarge that welding is not possible.
Figure 3.19 illustrates what happens when sheet metal is drawn over theradius (a bending and unbending process). The deformation is side Achanges from tension during bending to compression during unbending andthe deformation in side B changes from compression to tension duringbending and unbending. As the sheet enters the sidewall, side A is incompression and side B is in tension, although both sides may have similar
amounts of strain. Once the punch is removed from the die cavity(unloading), side A tends to elongate and side B to contract due to theelastic recovery.
Figure I.C.19 – Origin and mechanism of sidewall curl
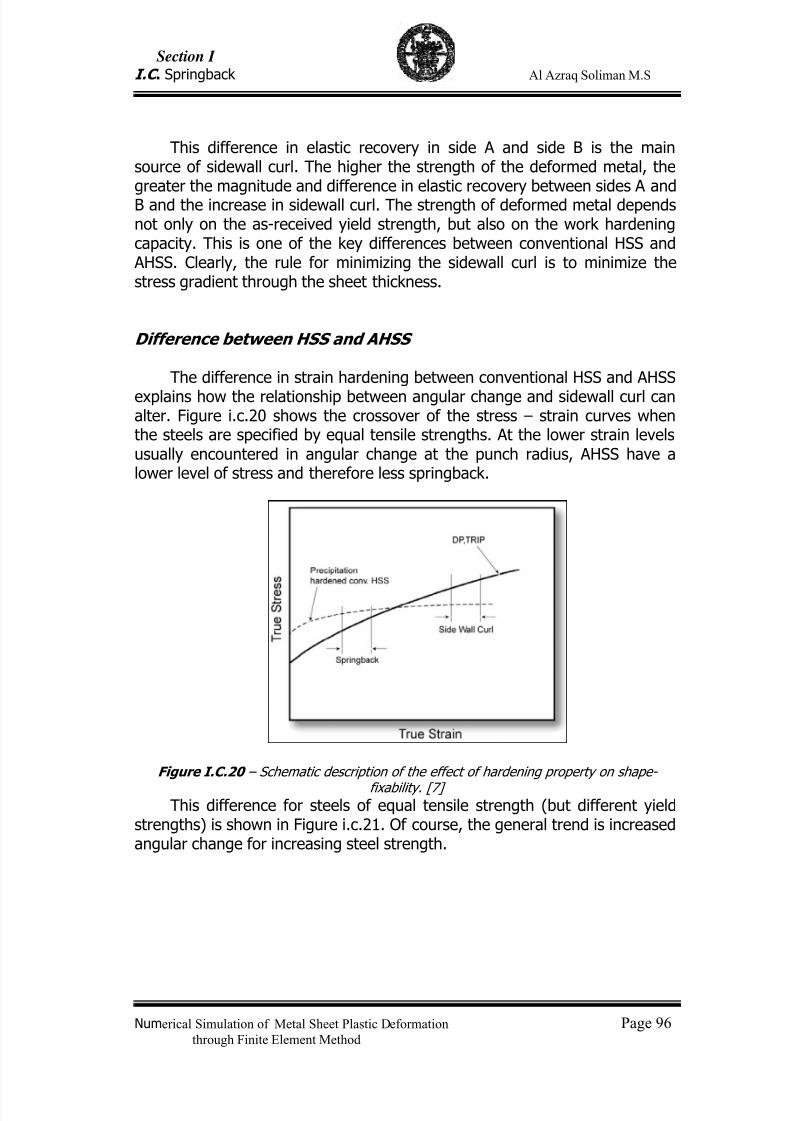
7/23/2019 Al Azraq Ingegneria Chimica Dei Materiali e Della Produzione
http://slidepdf.com/reader/full/al-azraq-ingegneria-chimica-dei-materiali-e-della-produzione 103/419
Section I
I.C . Springback Al Azraq Soliman M.S
Numerical Simulation of Metal Sheet Plastic Deformation Page 96through Finite Element Method
This difference in elastic recovery in side A and side B is the mainsource of sidewall curl. The higher the strength of the deformed metal, thegreater the magnitude and difference in elastic recovery between sides A andB and the increase in sidewall curl. The strength of deformed metal dependsnot only on the as-received yield strength, but also on the work hardeningcapacity. This is one of the key differences between conventional HSS and AHSS. Clearly, the rule for minimizing the sidewall curl is to minimize thestress gradient through the sheet thickness.
Difference between HSS and AHSS
The difference in strain hardening between conventional HSS and AHSS
explains how the relationship between angular change and sidewall curl canalter. Figure i.c.20 shows the crossover of the stress – strain curves whenthe steels are specified by equal tensile strengths. At the lower strain levelsusually encountered in angular change at the punch radius, AHSS have alower level of stress and therefore less springback.
Figure I.C.20 – Schematic description of the effect of hardening property on shape-
fixability. [7]This difference for steels of equal tensile strength (but different yield
strengths) is shown in Figure i.c.21. Of course, the general trend is increasedangular change for increasing steel strength.
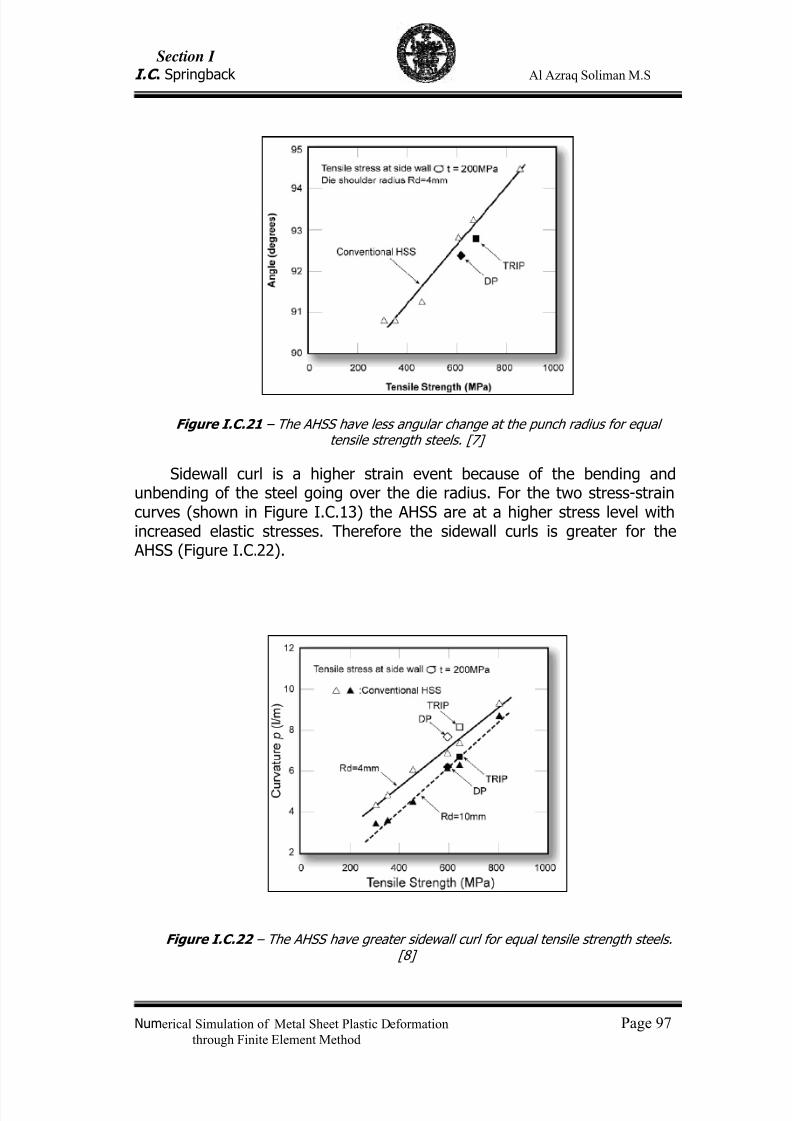
7/23/2019 Al Azraq Ingegneria Chimica Dei Materiali e Della Produzione
http://slidepdf.com/reader/full/al-azraq-ingegneria-chimica-dei-materiali-e-della-produzione 104/419
Section I
I.C . Springback Al Azraq Soliman M.S
Numerical Simulation of Metal Sheet Plastic Deformation Page 97through Finite Element Method
Figure I.C.21 – The AHSS have less angular change at the punch radius for equaltensile strength steels. [7]
Sidewall curl is a higher strain event because of the bending andunbending of the steel going over the die radius. For the two stress-straincurves (shown in Figure I.C.13) the AHSS are at a higher stress level withincreased elastic stresses. Therefore the sidewall curls is greater for the AHSS (Figure I.C.22).
Figure I.C.22 – The AHSS have greater sidewall curl for equal tensile strength steels.[8]
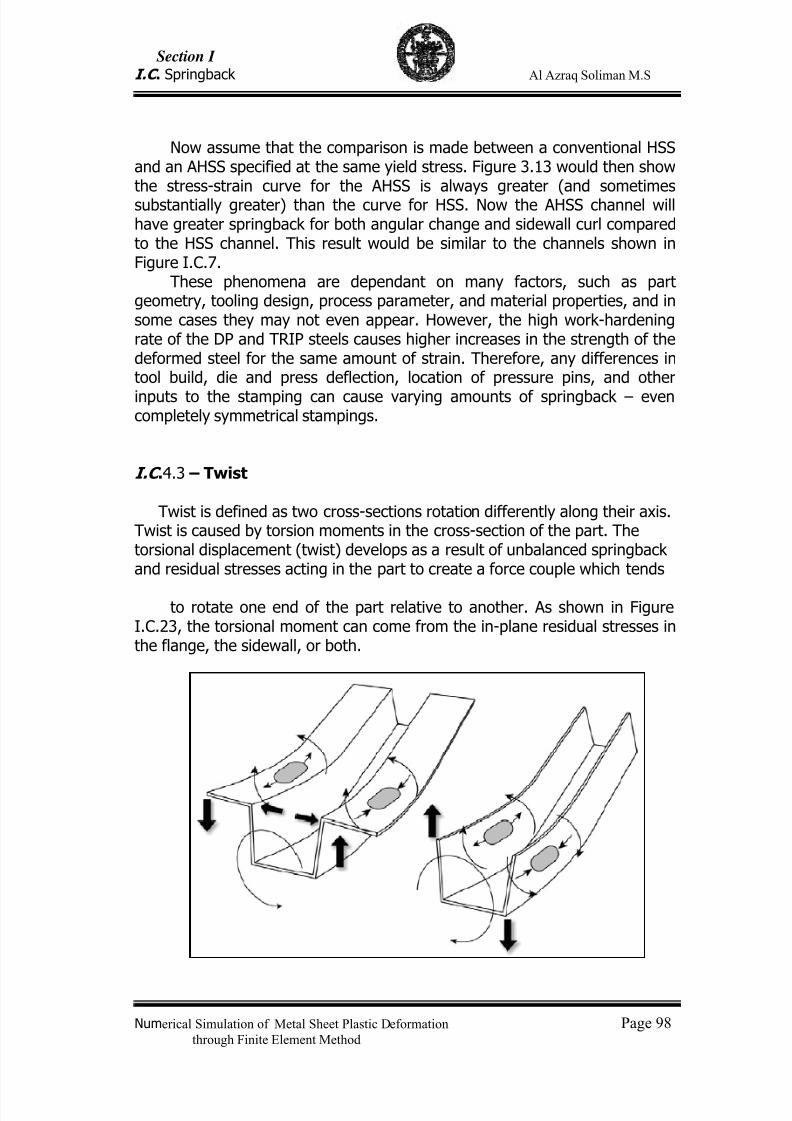
7/23/2019 Al Azraq Ingegneria Chimica Dei Materiali e Della Produzione
http://slidepdf.com/reader/full/al-azraq-ingegneria-chimica-dei-materiali-e-della-produzione 105/419
Section I
I.C . Springback Al Azraq Soliman M.S
Numerical Simulation of Metal Sheet Plastic Deformation Page 98through Finite Element Method
Now assume that the comparison is made between a conventional HSSand an AHSS specified at the same yield stress. Figure 3.13 would then showthe stress-strain curve for the AHSS is always greater (and sometimessubstantially greater) than the curve for HSS. Now the AHSS channel willhave greater springback for both angular change and sidewall curl comparedto the HSS channel. This result would be similar to the channels shown inFigure I.C.7.
These phenomena are dependant on many factors, such as partgeometry, tooling design, process parameter, and material properties, and insome cases they may not even appear. However, the high work-hardeningrate of the DP and TRIP steels causes higher increases in the strength of thedeformed steel for the same amount of strain. Therefore, any differences intool build, die and press deflection, location of pressure pins, and other
inputs to the stamping can cause varying amounts of springback – evencompletely symmetrical stampings.
I.C .4.3 – Twist
Twist is defined as two cross-sections rotation differently along their axis.Twist is caused by torsion moments in the cross-section of the part. Thetorsional displacement (twist) develops as a result of unbalanced springbackand residual stresses acting in the part to create a force couple which tends
to rotate one end of the part relative to another. As shown in FigureI.C.23, the torsional moment can come from the in-plane residual stresses inthe flange, the sidewall, or both.
7/23/2019 Al Azraq Ingegneria Chimica Dei Materiali e Della Produzione
http://slidepdf.com/reader/full/al-azraq-ingegneria-chimica-dei-materiali-e-della-produzione 106/419
Section I
I.C . Springback Al Azraq Soliman M.S
Numerical Simulation of Metal Sheet Plastic Deformation Page 99through Finite Element Method
Figure I.C.23 – Torsion Moment from flange or sidewall residual stress. [9]
The actual magnitude of twist in a part will be determined by therelationship between unbalanced stresses on the part and stiffness of thepart in the direction of the twist. Low torsional stiffness values in long, thinparts are reason high aspect ratio parts have significantly higher tendenciesto twist. There is also a lever effect, whereby the same amount of twist willresult in a larger displacement in a long part than would be the case in ashorter part with a similar twist angle.
The tendency for parts to twist can be overcome by reducing theimbalance in the residual stresses forming the force couple that creates thetorsional movement. Unbalanced forces are more likely in unsymmetrical
parts, parts with wide flanges or high sidewalls, and in parts with suddenchanges in cross section. Parts with unequal flange lengths or non-symmetriccutouts will be susceptible to twist due to unbalanced springback forcesgenerated by theses non-symmetrical features.
Even in geometrically symmetrical parts, unbalanced forces can begenerated if the strain gradients in the parts are non-symmetrical. Somecommon causes of non-symmetrical strains in symmetrical parts areimproper blank placement, uneven lubrication, uneven die polishing, unevenblankholder pressure, misaligned presser, or broken/worn draw beads. Theseproblems will result in uneven material draw in with higher strains and higher
elastic recoveries on one side of the part compared to the other,thereby generating a force couple and inducing twist.
Twist can also be controlled by maximizing the torsional stiffness of thepart – by adding ribs or other geometrical stiffeners or by redesigning orcombining parts to avoid long, thin sections which will have limited torsionalstiffness.
I.C .5 – Springback Correction for AHSS
I.C .5.1 – Part Design
- Successful application of any material requires close coordination ofpart design and the manufacturing process.
- Design structural frames (such as rails and crossbars) as open-endchannels to permit forming operations rather than draw die processes. AHSSstampings requiring draw operations (closed ends) are limited to a reduceddepth of a draw. Less complex, open-ended stamped channels are lesslimited in depth.
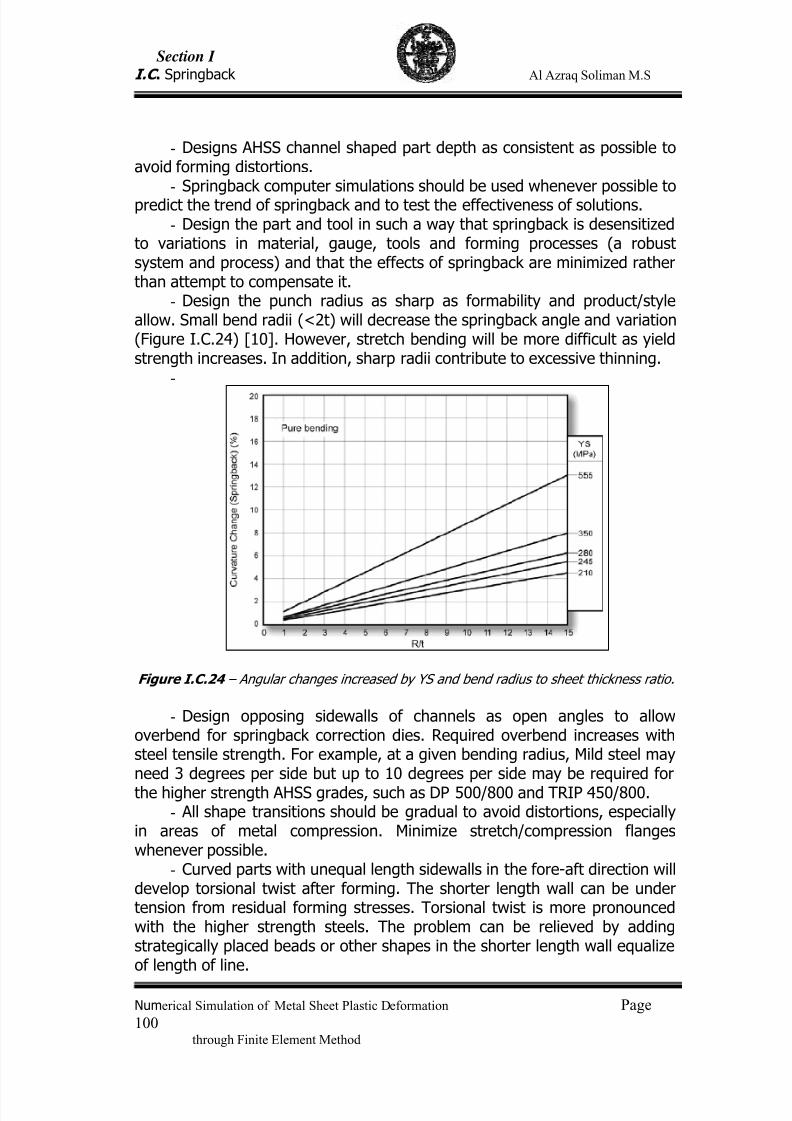
7/23/2019 Al Azraq Ingegneria Chimica Dei Materiali e Della Produzione
http://slidepdf.com/reader/full/al-azraq-ingegneria-chimica-dei-materiali-e-della-produzione 107/419
Section I
I.C . Springback Al Azraq Soliman M.S
Numerical Simulation of Metal Sheet Plastic Deformation Page
100through Finite Element Method
- Designs AHSS channel shaped part depth as consistent as possible toavoid forming distortions.
- Springback computer simulations should be used whenever possible topredict the trend of springback and to test the effectiveness of solutions.
- Design the part and tool in such a way that springback is desensitizedto variations in material, gauge, tools and forming processes (a robustsystem and process) and that the effects of springback are minimized ratherthan attempt to compensate it.
- Design the punch radius as sharp as formability and product/styleallow. Small bend radii (<2t) will decrease the springback angle and variation(Figure I.C.24) [10]. However, stretch bending will be more difficult as yieldstrength increases. In addition, sharp radii contribute to excessive thinning.
-
Figure I.C.24 – Angular changes increased by YS and bend radius to sheet thickness ratio.
- Design opposing sidewalls of channels as open angles to allowoverbend for springback correction dies. Required overbend increases withsteel tensile strength. For example, at a given bending radius, Mild steel mayneed 3 degrees per side but up to 10 degrees per side may be required forthe higher strength AHSS grades, such as DP 500/800 and TRIP 450/800.
- All shape transitions should be gradual to avoid distortions, especiallyin areas of metal compression. Minimize stretch/compression flangeswhenever possible.
- Curved parts with unequal length sidewalls in the fore-aft direction will
develop torsional twist after forming. The shorter length wall can be undertension from residual forming stresses. Torsional twist is more pronouncedwith the higher strength steels. The problem can be relieved by addingstrategically placed beads or other shapes in the shorter length wall equalizeof length of line.
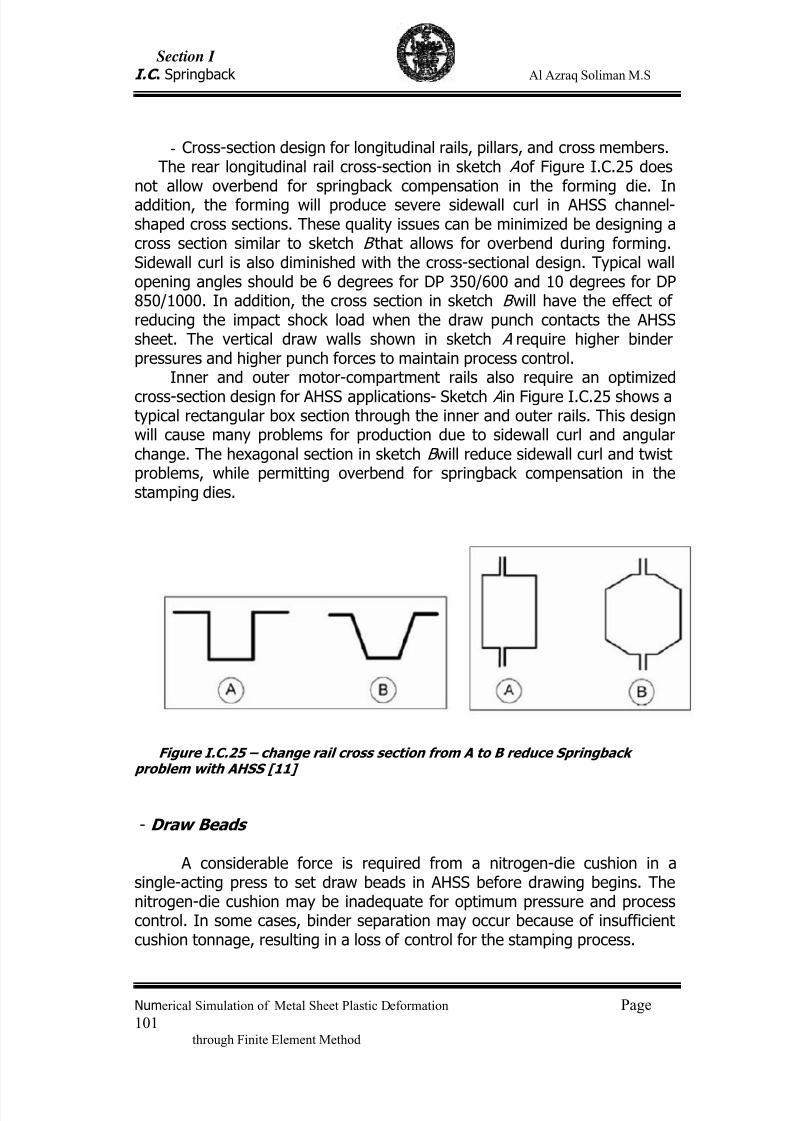
7/23/2019 Al Azraq Ingegneria Chimica Dei Materiali e Della Produzione
http://slidepdf.com/reader/full/al-azraq-ingegneria-chimica-dei-materiali-e-della-produzione 108/419
Section I
I.C . Springback Al Azraq Soliman M.S
Numerical Simulation of Metal Sheet Plastic Deformation Page
101through Finite Element Method
- Cross-section design for longitudinal rails, pillars, and cross members.The rear longitudinal rail cross-section in sketch A of Figure I.C.25 does
not allow overbend for springback compensation in the forming die. Inaddition, the forming will produce severe sidewall curl in AHSS channel-shaped cross sections. These quality issues can be minimized be designing across section similar to sketch B that allows for overbend during forming.Sidewall curl is also diminished with the cross-sectional design. Typical wallopening angles should be 6 degrees for DP 350/600 and 10 degrees for DP850/1000. In addition, the cross section in sketch B will have the effect ofreducing the impact shock load when the draw punch contacts the AHSSsheet. The vertical draw walls shown in sketch A require higher binderpressures and higher punch forces to maintain process control.
Inner and outer motor-compartment rails also require an optimized
cross-section design for AHSS applications- Sketch A in Figure I.C.25 shows atypical rectangular box section through the inner and outer rails. This designwill cause many problems for production due to sidewall curl and angularchange. The hexagonal section in sketch B will reduce sidewall curl and twistproblems, while permitting overbend for springback compensation in thestamping dies.
Figure I.C.25 – change rail cross section from A to B reduce Springback problem with AHSS [11]
- Draw Beads
A considerable force is required from a nitrogen-die cushion in asingle-acting press to set draw beads in AHSS before drawing begins. Thenitrogen-die cushion may be inadequate for optimum pressure and processcontrol. In some cases, binder separation may occur because of insufficientcushion tonnage, resulting in a loss of control for the stamping process.
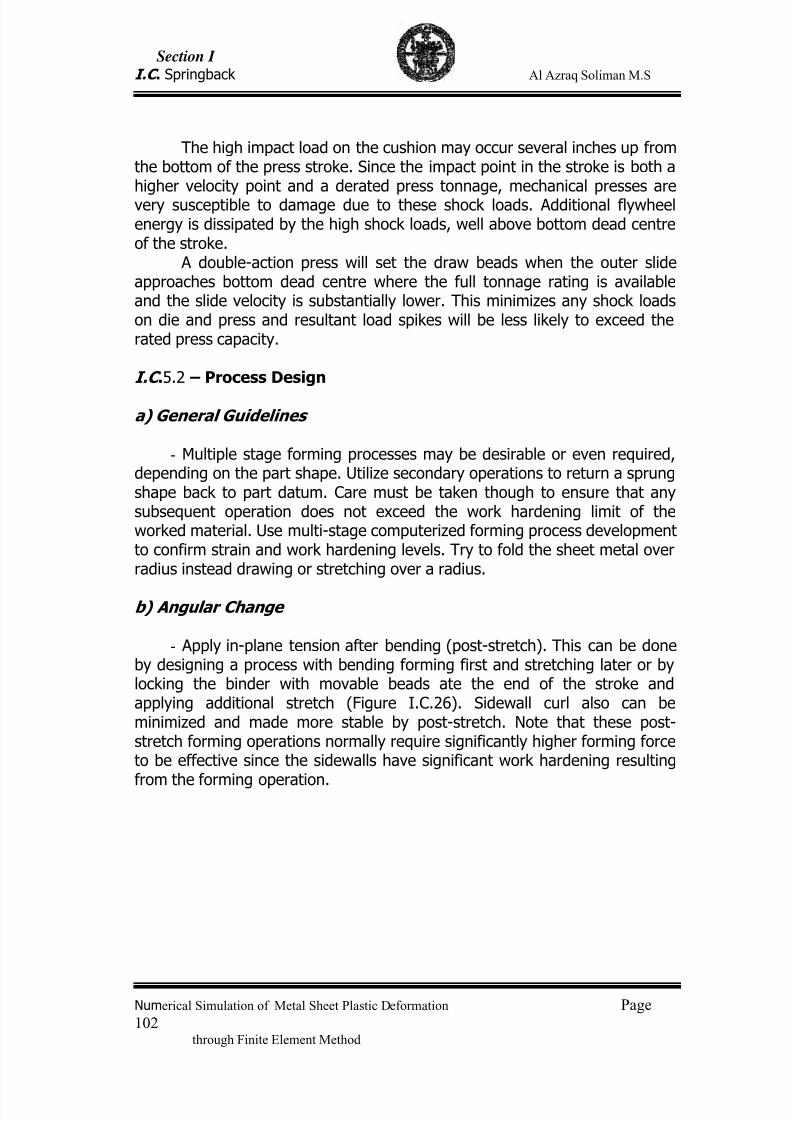
7/23/2019 Al Azraq Ingegneria Chimica Dei Materiali e Della Produzione
http://slidepdf.com/reader/full/al-azraq-ingegneria-chimica-dei-materiali-e-della-produzione 109/419
Section I
I.C . Springback Al Azraq Soliman M.S
Numerical Simulation of Metal Sheet Plastic Deformation Page
102through Finite Element Method
The high impact load on the cushion may occur several inches up fromthe bottom of the press stroke. Since the impact point in the stroke is both ahigher velocity point and a derated press tonnage, mechanical presses arevery susceptible to damage due to these shock loads. Additional flywheelenergy is dissipated by the high shock loads, well above bottom dead centreof the stroke.
A double-action press will set the draw beads when the outer slideapproaches bottom dead centre where the full tonnage rating is availableand the slide velocity is substantially lower. This minimizes any shock loadson die and press and resultant load spikes will be less likely to exceed therated press capacity.
I.C .5.2 – Process Design
a) General Guidelines
- Multiple stage forming processes may be desirable or even required,depending on the part shape. Utilize secondary operations to return a sprungshape back to part datum. Care must be taken though to ensure that anysubsequent operation does not exceed the work hardening limit of theworked material. Use multi-stage computerized forming process developmentto confirm strain and work hardening levels. Try to fold the sheet metal overradius instead drawing or stretching over a radius.
b) Angular Change
- Apply in-plane tension after bending (post-stretch). This can be done
by designing a process with bending forming first and stretching later or bylocking the binder with movable beads ate the end of the stroke andapplying additional stretch (Figure I.C.26). Sidewall curl also can beminimized and made more stable by post-stretch. Note that these post-stretch forming operations normally require significantly higher forming forceto be effective since the sidewalls have significant work hardening resulting
from the forming operation.
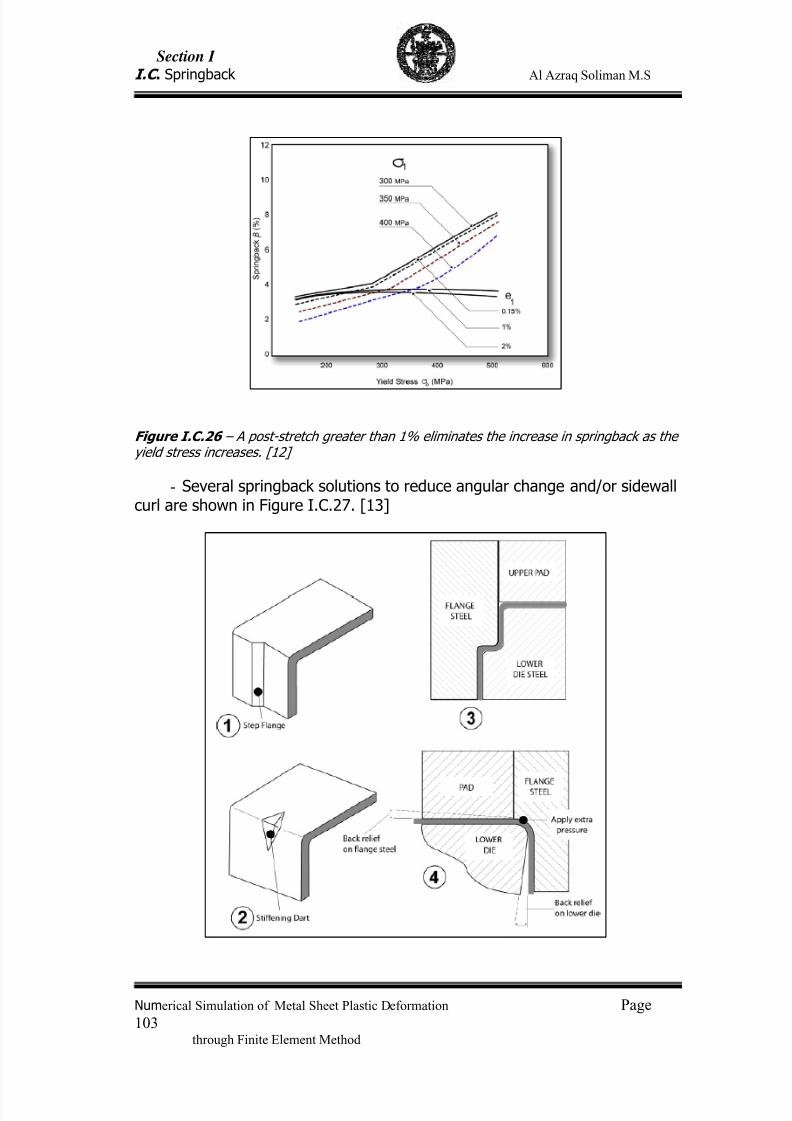
7/23/2019 Al Azraq Ingegneria Chimica Dei Materiali e Della Produzione
http://slidepdf.com/reader/full/al-azraq-ingegneria-chimica-dei-materiali-e-della-produzione 110/419
Section I
I.C . Springback Al Azraq Soliman M.S
Numerical Simulation of Metal Sheet Plastic Deformation Page
103through Finite Element Method
Figure I.C.26 – A post-stretch greater than 1% eliminates the increase in springback as theyield stress increases. [12]
- Several springback solutions to reduce angular change and/or sidewallcurl are shown in Figure I.C.27. [13]
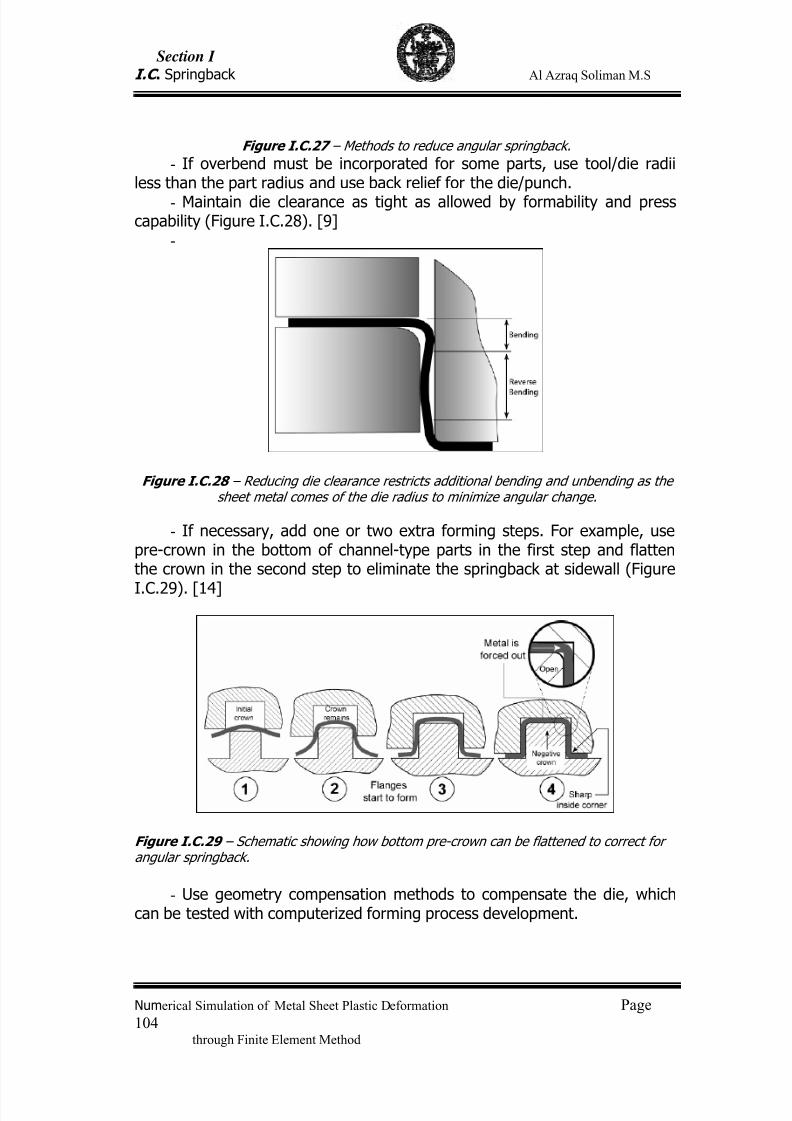
7/23/2019 Al Azraq Ingegneria Chimica Dei Materiali e Della Produzione
http://slidepdf.com/reader/full/al-azraq-ingegneria-chimica-dei-materiali-e-della-produzione 111/419
Section I
I.C . Springback Al Azraq Soliman M.S
Numerical Simulation of Metal Sheet Plastic Deformation Page
104through Finite Element Method
Figure I.C.27 – Methods to reduce angular springback.
- If overbend must be incorporated for some parts, use tool/die radiiless than the part radius and use back relief for the die/punch.
-
Maintain die clearance as tight as allowed by formability and presscapability (Figure I.C.28). [9]
-
Figure I.C.28 – Reducing die clearance restricts additional bending and unbending as thesheet metal comes of the die radius to minimize angular change.
- If necessary, add one or two extra forming steps. For example, usepre-crown in the bottom of channel-type parts in the first step and flattenthe crown in the second step to eliminate the springback at sidewall (Figure
I.C.29). [14]
Figure I.C.29 – Schematic showing how bottom pre-crown can be flattened to correct forangular springback.
- Use geometry compensation methods to compensate the die, whichcan be tested with computerized forming process development.
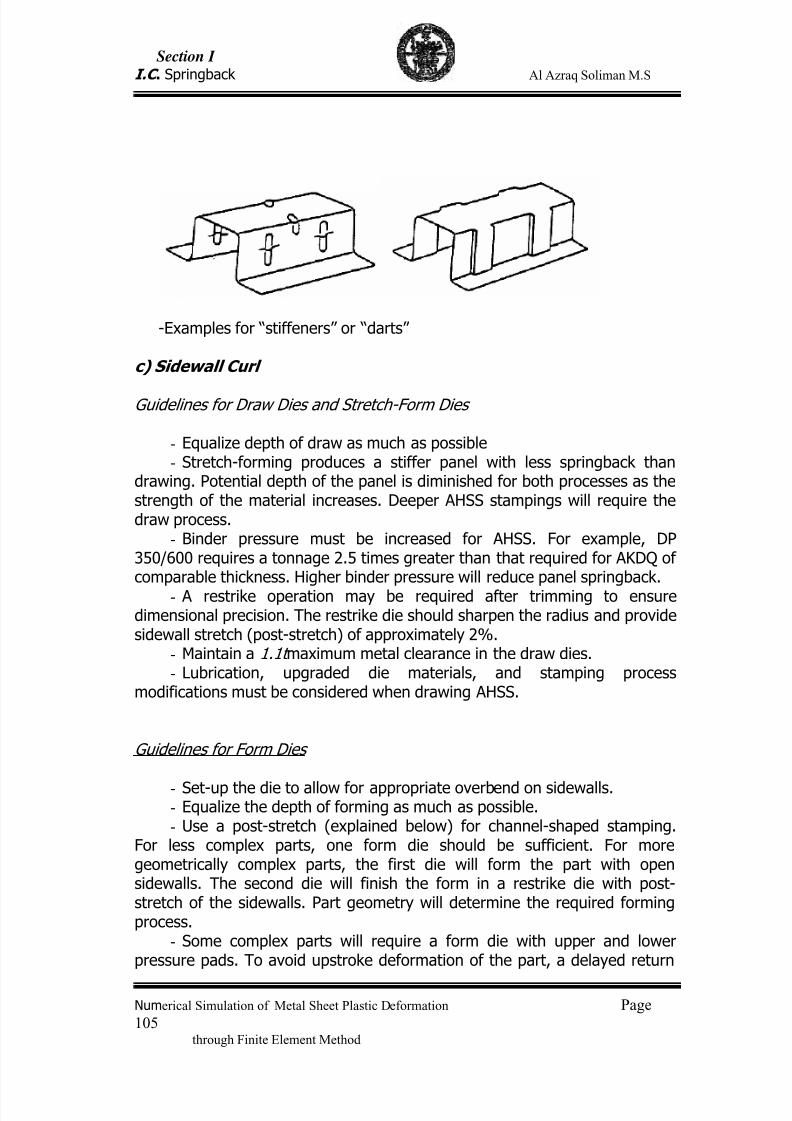
7/23/2019 Al Azraq Ingegneria Chimica Dei Materiali e Della Produzione
http://slidepdf.com/reader/full/al-azraq-ingegneria-chimica-dei-materiali-e-della-produzione 112/419
Section I
I.C . Springback Al Azraq Soliman M.S
Numerical Simulation of Metal Sheet Plastic Deformation Page
105through Finite Element Method
-Examples for “stiffeners” or “darts”
c) Sidewall Curl
Guidelines for Draw Dies and Stretch-Form Dies
- Equalize depth of draw as much as possible- Stretch-forming produces a stiffer panel with less springback than
drawing. Potential depth of the panel is diminished for both processes as thestrength of the material increases. Deeper AHSS stampings will require thedraw process.
- Binder pressure must be increased for AHSS. For example, DP
350/600 requires a tonnage 2.5 times greater than that required for AKDQ ofcomparable thickness. Higher binder pressure will reduce panel springback.
-
A restrike operation may be required after trimming to ensuredimensional precision. The restrike die should sharpen the radius and providesidewall stretch (post-stretch) of approximately 2%.
- Maintain a 1.1t maximum metal clearance in the draw dies.- Lubrication, upgraded die materials, and stamping process
modifications must be considered when drawing AHSS.
Guidelines for Form Dies
-
Set-up the die to allow for appropriate overbend on sidewalls.- Equalize the depth of forming as much as possible.- Use a post-stretch (explained below) for channel-shaped stamping.
For less complex parts, one form die should be sufficient. For moregeometrically complex parts, the first die will form the part with opensidewalls. The second die will finish the form in a restrike die with post-stretch of the sidewalls. Part geometry will determine the required formingprocess.
- Some complex parts will require a form die with upper and lowerpressure pads. To avoid upstroke deformation of the part, a delayed return
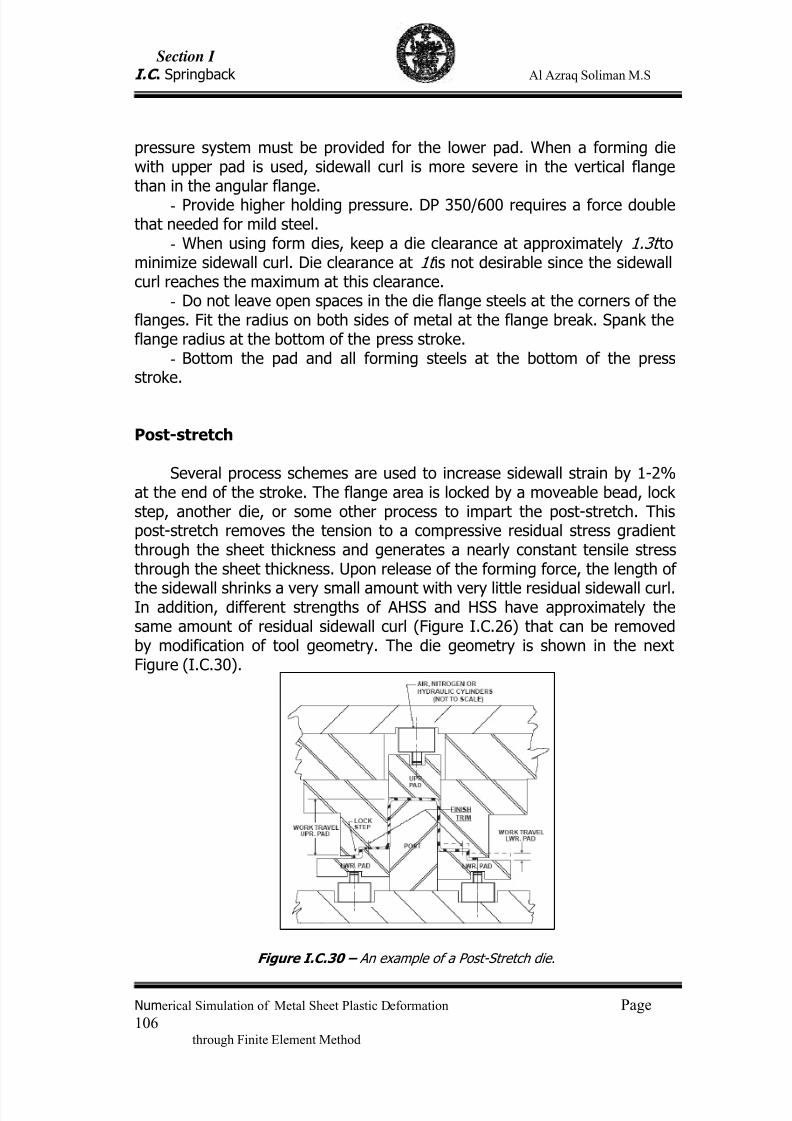
7/23/2019 Al Azraq Ingegneria Chimica Dei Materiali e Della Produzione
http://slidepdf.com/reader/full/al-azraq-ingegneria-chimica-dei-materiali-e-della-produzione 113/419
Section I
I.C . Springback Al Azraq Soliman M.S
Numerical Simulation of Metal Sheet Plastic Deformation Page
106through Finite Element Method
pressure system must be provided for the lower pad. When a forming diewith upper pad is used, sidewall curl is more severe in the vertical flangethan in the angular flange.
-
Provide higher holding pressure. DP 350/600 requires a force doublethat needed for mild steel.
- When using form dies, keep a die clearance at approximately 1.3t to
minimize sidewall curl. Die clearance at 1t is not desirable since the sidewallcurl reaches the maximum at this clearance.
- Do not leave open spaces in the die flange steels at the corners of theflanges. Fit the radius on both sides of metal at the flange break. Spank theflange radius at the bottom of the press stroke.
- Bottom the pad and all forming steels at the bottom of the pressstroke.
Post-stretch
Several process schemes are used to increase sidewall strain by 1-2%at the end of the stroke. The flange area is locked by a moveable bead, lockstep, another die, or some other process to impart the post-stretch. Thispost-stretch removes the tension to a compressive residual stress gradientthrough the sheet thickness and generates a nearly constant tensile stressthrough the sheet thickness. Upon release of the forming force, the length of
the sidewall shrinks a very small amount with very little residual sidewall curl.In addition, different strengths of AHSS and HSS have approximately thesame amount of residual sidewall curl (Figure I.C.26) that can be removedby modification of tool geometry. The die geometry is shown in the nextFigure (I.C.30).
Figure I.C.30 – An example of a Post-Stretch die.
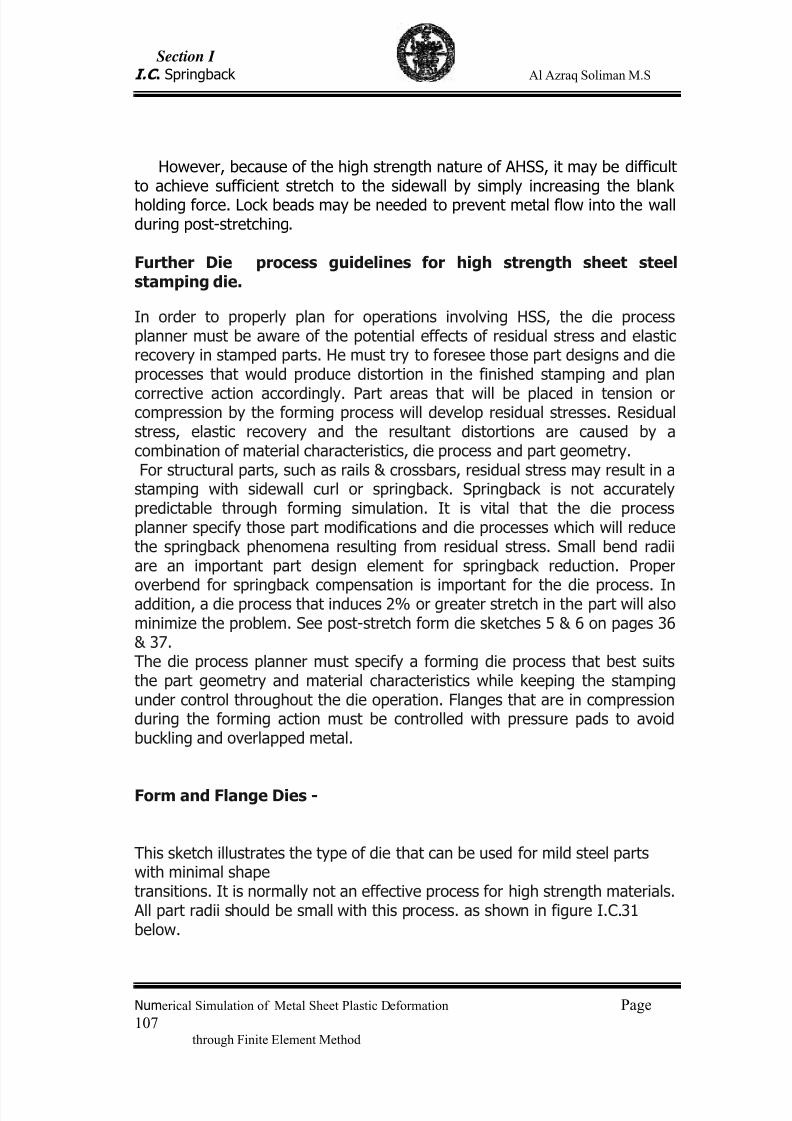
7/23/2019 Al Azraq Ingegneria Chimica Dei Materiali e Della Produzione
http://slidepdf.com/reader/full/al-azraq-ingegneria-chimica-dei-materiali-e-della-produzione 114/419
Section I
I.C . Springback Al Azraq Soliman M.S
Numerical Simulation of Metal Sheet Plastic Deformation Page
107through Finite Element Method
However, because of the high strength nature of AHSS, it may be difficultto achieve sufficient stretch to the sidewall by simply increasing the blankholding force. Lock beads may be needed to prevent metal flow into the wallduring post-stretching.
Further Die process guidelines for high strength sheet steelstamping die.
In order to properly plan for operations involving HSS, the die processplanner must be aware of the potential effects of residual stress and elasticrecovery in stamped parts. He must try to foresee those part designs and dieprocesses that would produce distortion in the finished stamping and plan
corrective action accordingly. Part areas that will be placed in tension orcompression by the forming process will develop residual stresses. Residualstress, elastic recovery and the resultant distortions are caused by acombination of material characteristics, die process and part geometry.For structural parts, such as rails & crossbars, residual stress may result in a
stamping with sidewall curl or springback. Springback is not accuratelypredictable through forming simulation. It is vital that the die processplanner specify those part modifications and die processes which will reducethe springback phenomena resulting from residual stress. Small bend radiiare an important part design element for springback reduction. Proper
overbend for springback compensation is important for the die process. Inaddition, a die process that induces 2% or greater stretch in the part will alsominimize the problem. See post-stretch form die sketches 5 & 6 on pages 36& 37.The die process planner must specify a forming die process that best suitsthe part geometry and material characteristics while keeping the stampingunder control throughout the die operation. Flanges that are in compressionduring the forming action must be controlled with pressure pads to avoidbuckling and overlapped metal.
Form and Flange Dies -
This sketch illustrates the type of die that can be used for mild steel partswith minimal shapetransitions. It is normally not an effective process for high strength materials. All part radii should be small with this process. as shown in figure I.C.31below.
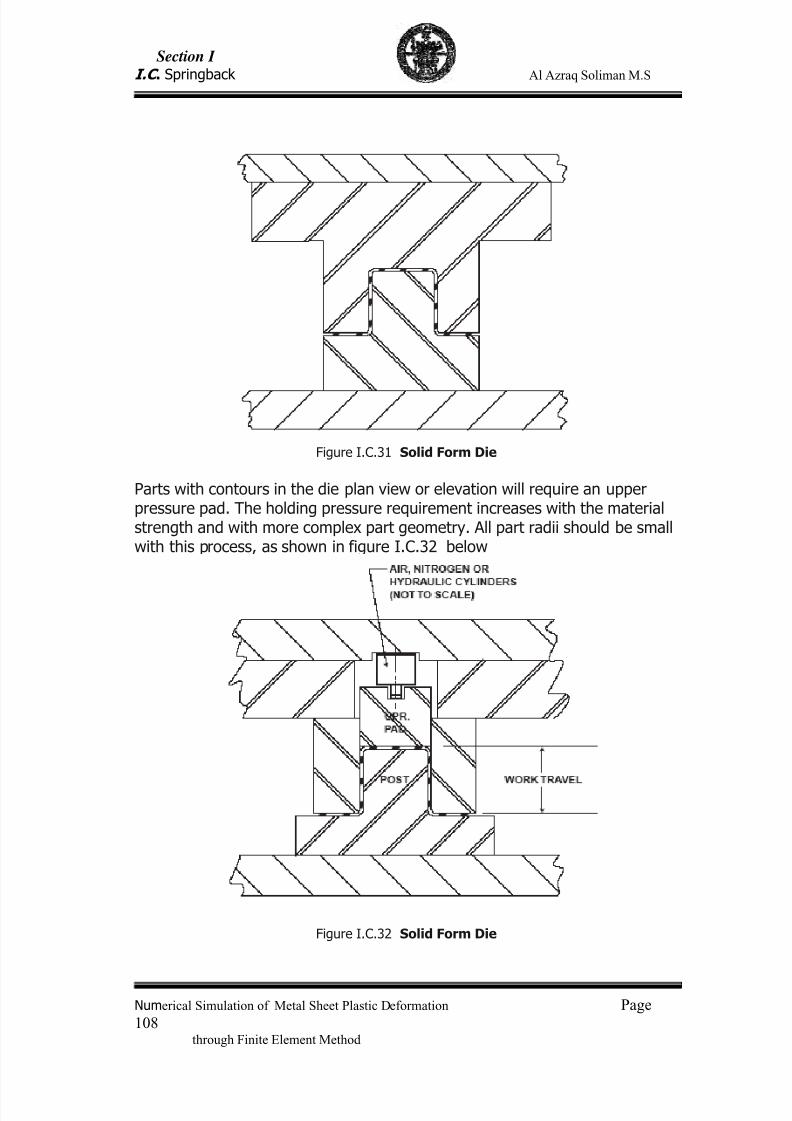
7/23/2019 Al Azraq Ingegneria Chimica Dei Materiali e Della Produzione
http://slidepdf.com/reader/full/al-azraq-ingegneria-chimica-dei-materiali-e-della-produzione 115/419
Section I
I.C . Springback Al Azraq Soliman M.S
Numerical Simulation of Metal Sheet Plastic Deformation Page
108through Finite Element Method
Figure I.C.31 Solid Form Die
Parts with contours in the die plan view or elevation will require an upperpressure pad. The holding pressure requirement increases with the materialstrength and with more complex part geometry. All part radii should be smallwith this process, as shown in figure I.C.32 below
Figure I.C.32 Solid Form Die
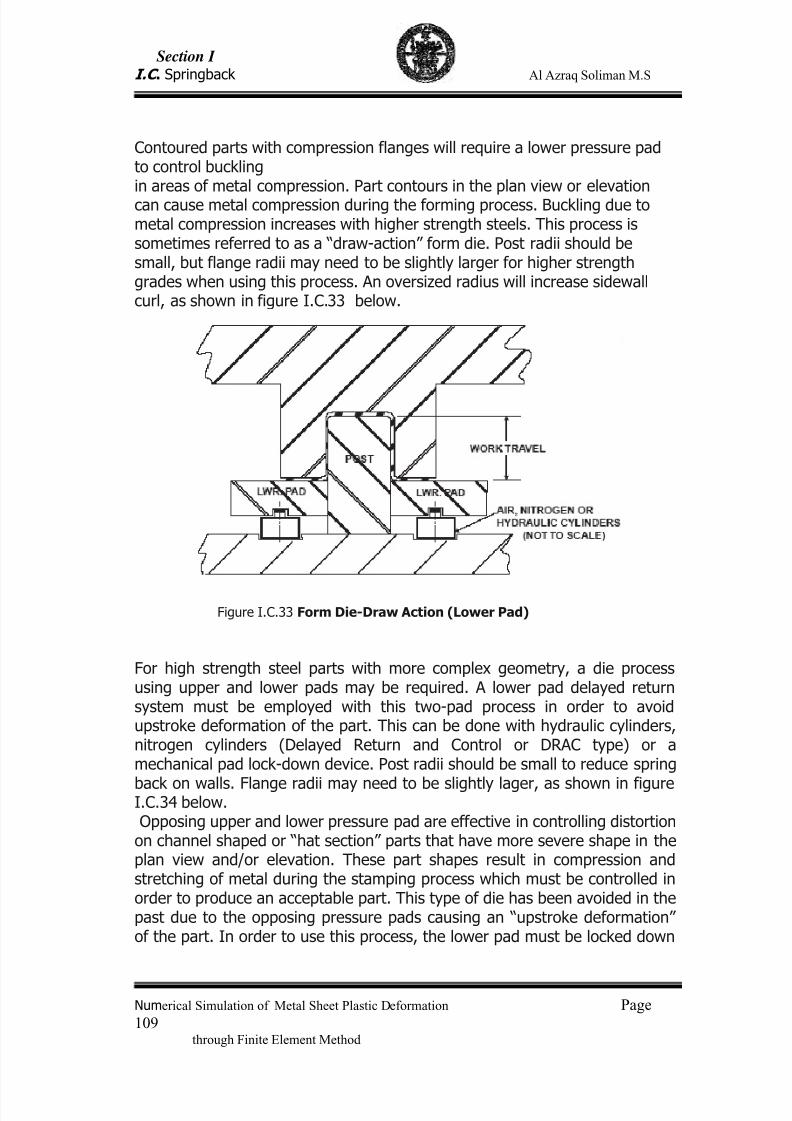
7/23/2019 Al Azraq Ingegneria Chimica Dei Materiali e Della Produzione
http://slidepdf.com/reader/full/al-azraq-ingegneria-chimica-dei-materiali-e-della-produzione 116/419
Section I
I.C . Springback Al Azraq Soliman M.S
Numerical Simulation of Metal Sheet Plastic Deformation Page
109through Finite Element Method
Contoured parts with compression flanges will require a lower pressure padto control bucklingin areas of metal compression. Part contours in the plan view or elevationcan cause metal compression during the forming process. Buckling due tometal compression increases with higher strength steels. This process issometimes referred to as a “draw-action” form die. Post radii should besmall, but flange radii may need to be slightly larger for higher strengthgrades when using this process. An oversized radius will increase sidewallcurl, as shown in figure I.C.33 below.
Figure I.C.33 Form Die-Draw Action (Lower Pad)
For high strength steel parts with more complex geometry, a die processusing upper and lower pads may be required. A lower pad delayed returnsystem must be employed with this two-pad process in order to avoidupstroke deformation of the part. This can be done with hydraulic cylinders,nitrogen cylinders (Delayed Return and Control or DRAC type) or amechanical pad lock-down device. Post radii should be small to reduce spring
back on walls. Flange radii may need to be slightly lager, as shown in figureI.C.34 below.Opposing upper and lower pressure pad are effective in controlling distortion
on channel shaped or “hat section” parts that have more severe shape in theplan view and/or elevation. These part shapes result in compression andstretching of metal during the stamping process which must be controlled inorder to produce an acceptable part. This type of die has been avoided in thepast due to the opposing pressure pads causing an “upstroke deformation”of the part. In order to use this process, the lower pad must be locked down
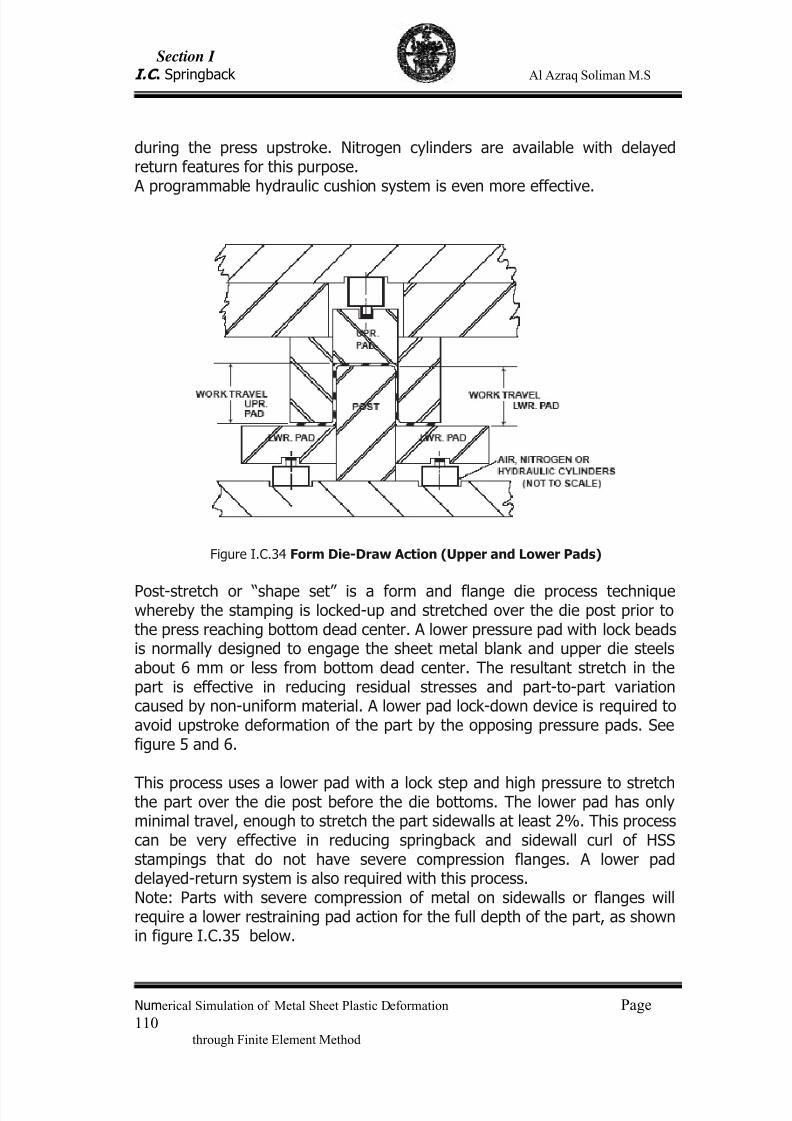
7/23/2019 Al Azraq Ingegneria Chimica Dei Materiali e Della Produzione
http://slidepdf.com/reader/full/al-azraq-ingegneria-chimica-dei-materiali-e-della-produzione 117/419
Section I
I.C . Springback Al Azraq Soliman M.S
Numerical Simulation of Metal Sheet Plastic Deformation Page
110through Finite Element Method
during the press upstroke. Nitrogen cylinders are available with delayedreturn features for this purpose. A programmable hydraulic cushion system is even more effective.
Figure I.C.34 Form Die-Draw Action (Upper and Lower Pads)
Post-stretch or “shape set” is a form and flange die process techniquewhereby the stamping is locked-up and stretched over the die post prior tothe press reaching bottom dead center. A lower pressure pad with lock beadsis normally designed to engage the sheet metal blank and upper die steelsabout 6 mm or less from bottom dead center. The resultant stretch in thepart is effective in reducing residual stresses and part-to-part variationcaused by non-uniform material. A lower pad lock-down device is required toavoid upstroke deformation of the part by the opposing pressure pads. Seefigure 5 and 6.
This process uses a lower pad with a lock step and high pressure to stretchthe part over the die post before the die bottoms. The lower pad has onlyminimal travel, enough to stretch the part sidewalls at least 2%. This processcan be very effective in reducing springback and sidewall curl of HSSstampings that do not have severe compression flanges. A lower paddelayed-return system is also required with this process.Note: Parts with severe compression of metal on sidewalls or flanges willrequire a lower restraining pad action for the full depth of the part, as shownin figure I.C.35 below.
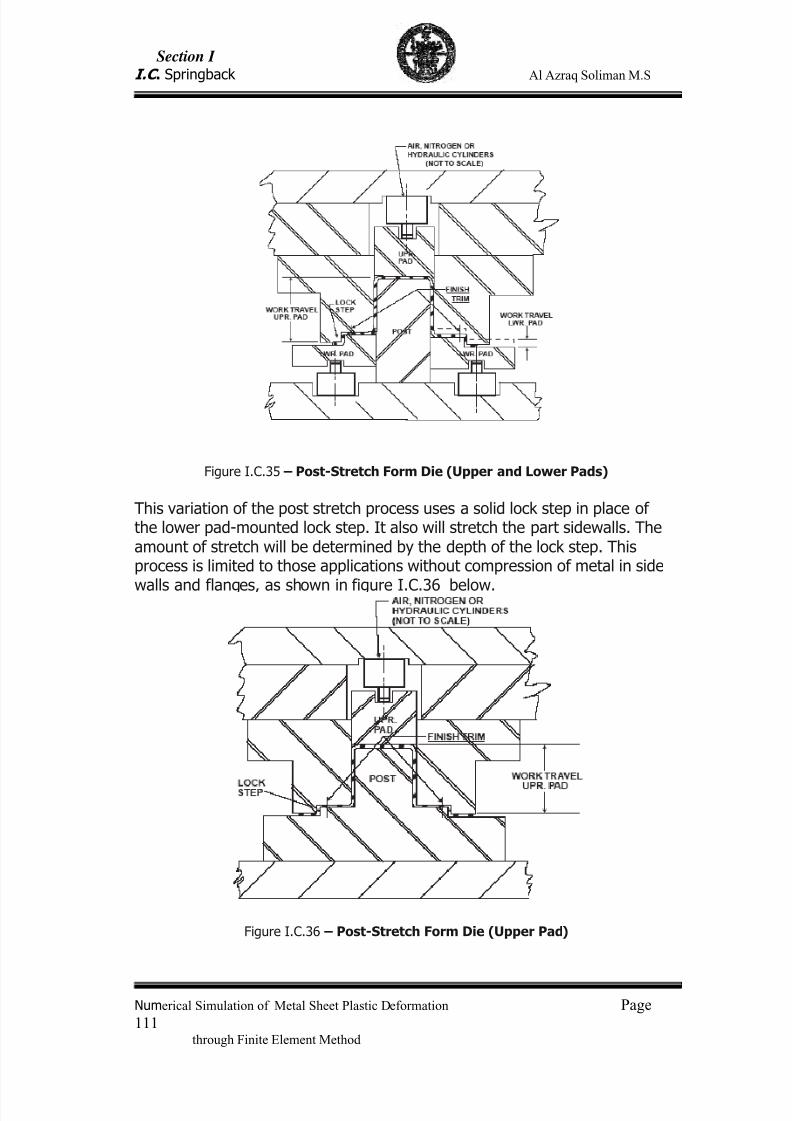
7/23/2019 Al Azraq Ingegneria Chimica Dei Materiali e Della Produzione
http://slidepdf.com/reader/full/al-azraq-ingegneria-chimica-dei-materiali-e-della-produzione 118/419
Section I
I.C . Springback Al Azraq Soliman M.S
Numerical Simulation of Metal Sheet Plastic Deformation Page
111through Finite Element Method
Figure I.C.35 – Post-Stretch Form Die (Upper and Lower Pads)
This variation of the post stretch process uses a solid lock step in place ofthe lower pad-mounted lock step. It also will stretch the part sidewalls. Theamount of stretch will be determined by the depth of the lock step. Thisprocess is limited to those applications without compression of metal in side
walls and flanges, as shown in figure I.C.36 below.
Figure I.C.36 – Post-Stretch Form Die (Upper Pad)
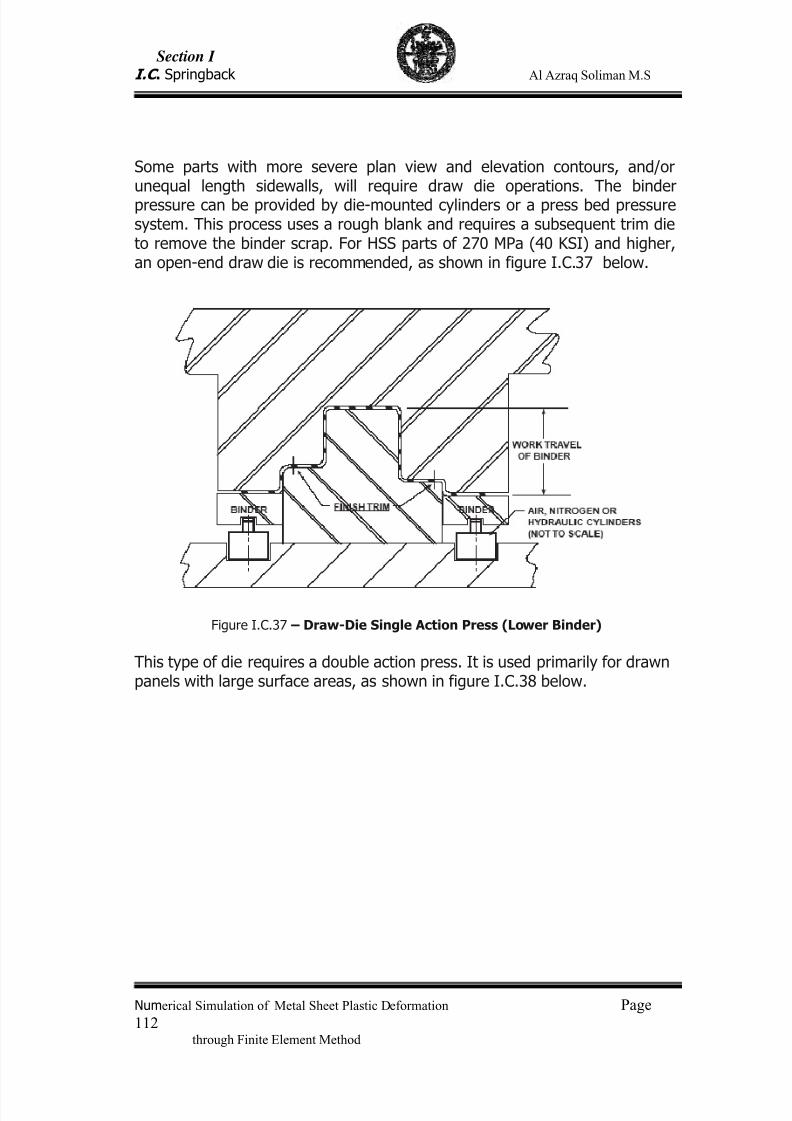
7/23/2019 Al Azraq Ingegneria Chimica Dei Materiali e Della Produzione
http://slidepdf.com/reader/full/al-azraq-ingegneria-chimica-dei-materiali-e-della-produzione 119/419
Section I
I.C . Springback Al Azraq Soliman M.S
Numerical Simulation of Metal Sheet Plastic Deformation Page
112through Finite Element Method
Some parts with more severe plan view and elevation contours, and/orunequal length sidewalls, will require draw die operations. The binderpressure can be provided by die-mounted cylinders or a press bed pressuresystem. This process uses a rough blank and requires a subsequent trim dieto remove the binder scrap. For HSS parts of 270 MPa (40 KSI) and higher,an open-end draw die is recommended, as shown in figure I.C.37 below.
Figure I.C.37 – Draw-Die Single Action Press (Lower Binder)
This type of die requires a double action press. It is used primarily for drawnpanels with large surface areas, as shown in figure I.C.38 below.
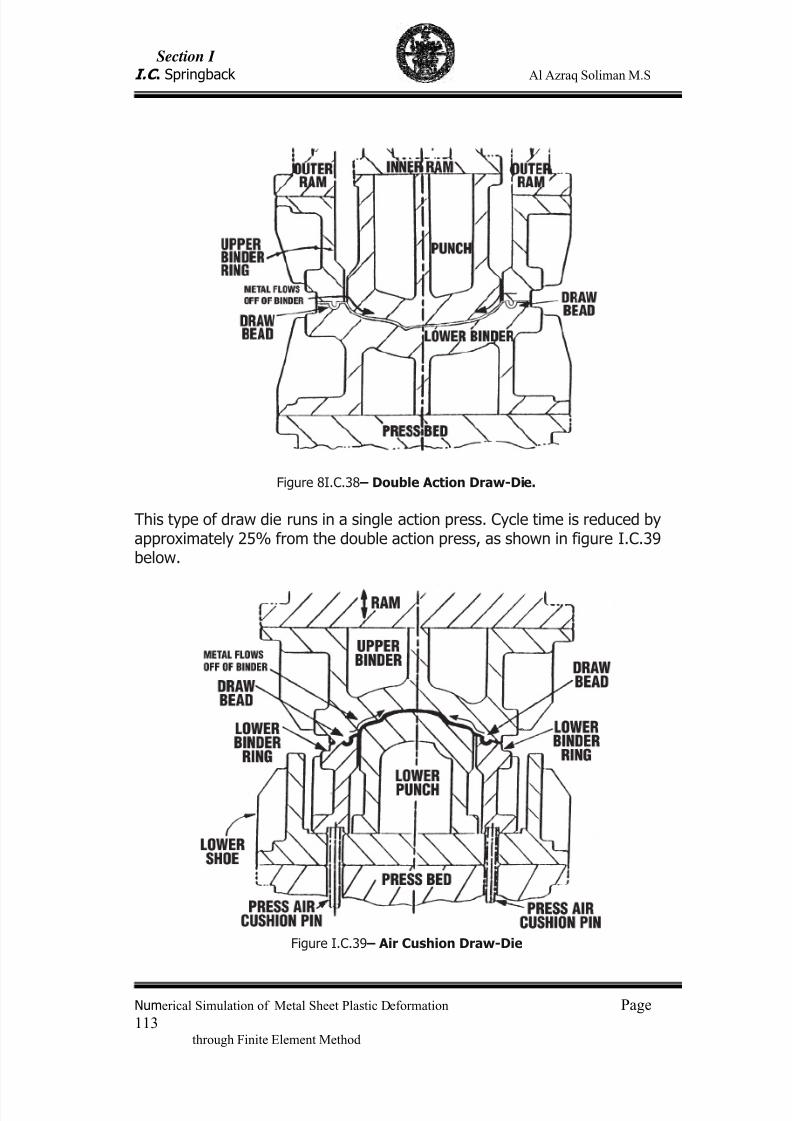
7/23/2019 Al Azraq Ingegneria Chimica Dei Materiali e Della Produzione
http://slidepdf.com/reader/full/al-azraq-ingegneria-chimica-dei-materiali-e-della-produzione 120/419
Section I
I.C . Springback Al Azraq Soliman M.S
Numerical Simulation of Metal Sheet Plastic Deformation Page
113through Finite Element Method
Figure 8I.C.38 – Double Action Draw-Die.
This type of draw die runs in a single action press. Cycle time is reduced byapproximately 25% from the double action press, as shown in figure I.C.39below.
Figure I.C.39 – Air Cushion Draw-Die
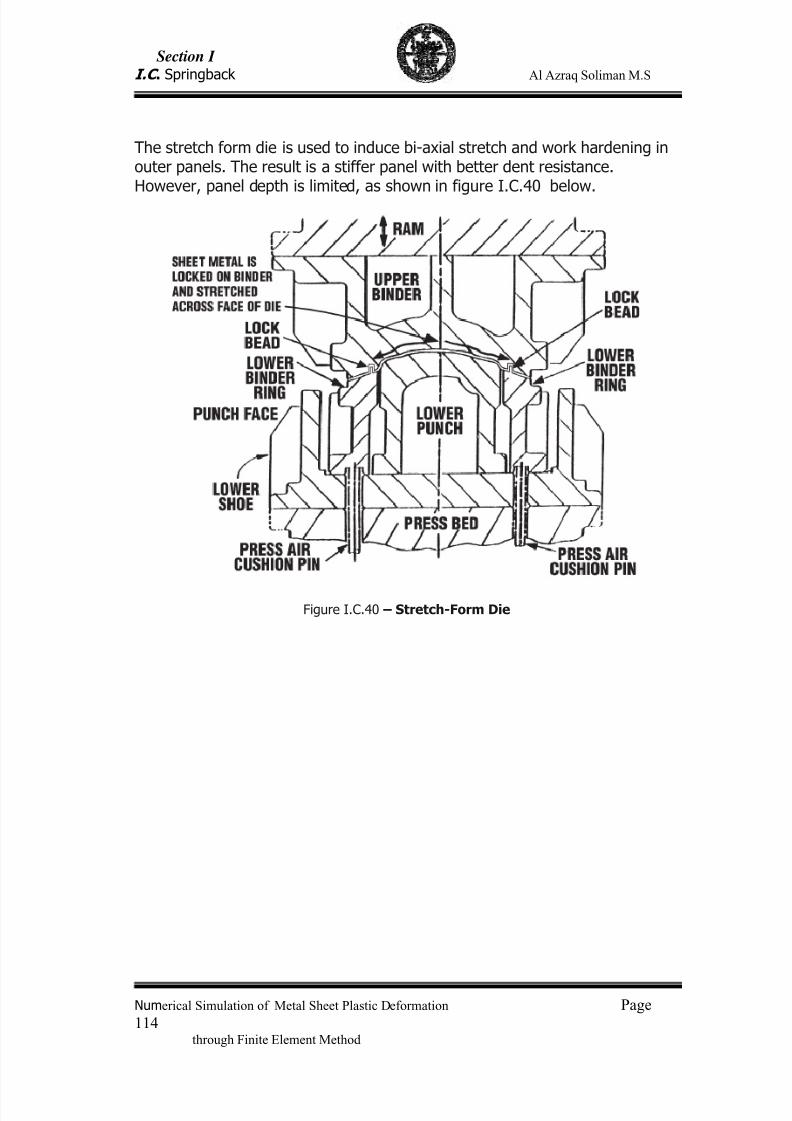
7/23/2019 Al Azraq Ingegneria Chimica Dei Materiali e Della Produzione
http://slidepdf.com/reader/full/al-azraq-ingegneria-chimica-dei-materiali-e-della-produzione 121/419
Section I
I.C . Springback Al Azraq Soliman M.S
Numerical Simulation of Metal Sheet Plastic Deformation Page
114through Finite Element Method
The stretch form die is used to induce bi-axial stretch and work hardening inouter panels. The result is a stiffer panel with better dent resistance.However, panel depth is limited, as shown in figure I.C.40 below.
Figure I.C.40 – Stretch-Form Die
7/23/2019 Al Azraq Ingegneria Chimica Dei Materiali e Della Produzione
http://slidepdf.com/reader/full/al-azraq-ingegneria-chimica-dei-materiali-e-della-produzione 122/419
Section I
I.C . Springback Al Azraq Soliman M.S
Numerical Simulation of Metal Sheet Plastic Deformation Page
115through Finite Element Method
I.C .6. Bibliography:
[1] Gerdeen J. C. and Duncan, J. L., “Springback in Sheet Metal Forming,”Report on AISI Project 1201-456, (1986).
[2] Mike Gedeon, Elastic Springback , Brush Wellman Engineered Materials.
[3] N. Song, D. Quian, J. Cao and W. K. Liu, “Effective Prediction ofSpringback in Flanging”, Journal of Engineering Materials andTechnology, October 2001.
[4] S. Sadagopan and D. Urban, “Formability Characterization of a NewGeneration of High Strength Steels,” American Iron and Steel Institute(March 2003).
[5] Y. T. Keum and B.Y. Han, “Springback of FCC sheet in warm forming”,Journal of Ceramic Processing Research. Vol. 3, No. 3, pp. 159-165(2002).
[6] Daw-Kwei Leu, “A simplified approach for evaluating bendability and
springback in plastic bending of anisotropic sheet metals”, Journal ofMaterials Processing Technology (1997) 9-17.
[7] T. Katayama et al, “Effects of Material Properties on Shape-Fixabilityand Shape Control Techniques in Hat-shaped Forming,” Proceedings ofthe 22nd IDDRG Congress, p.97 (2002).
[8] M. F. Shi, Internal National Steel Corporation report.
[9]
K. Yoshida, “Handbook of Ease or Difficulty in Press Forming,”Translated by J. Bukacek and edited by S-D Liu (1987).
[10] M. Shi, “Springback and Springback Variation Design Guidelines andLiterature Review,” National Steel Corporation Internal Report (1994).
[11] J. Noel, HSS Stamping Task Force, Auto/Steel Partnership.
[12] M. Ueda and K. Ueno, “A Study of Springback in the Stretch Bending of

7/23/2019 Al Azraq Ingegneria Chimica Dei Materiali e Della Produzione
http://slidepdf.com/reader/full/al-azraq-ingegneria-chimica-dei-materiali-e-della-produzione 123/419
Section I
I.C . Springback Al Azraq Soliman M.S
Numerical Simulation of Metal Sheet Plastic Deformation Page
116through Finite Element Method
Channels,” Journal of Mechanical Working Technology, 5, p.163 (1981).
[13]
High Strength Steel (HSS) Stamping Design Manual, Auto/SteelPartnership (2000).
[14] High Strength Steel (HSS) Stamping Design Manual, Auto/SteelPartnership (1997).
7/23/2019 Al Azraq Ingegneria Chimica Dei Materiali e Della Produzione
http://slidepdf.com/reader/full/al-azraq-ingegneria-chimica-dei-materiali-e-della-produzione 124/419
Section I.D
Finite element method
7/23/2019 Al Azraq Ingegneria Chimica Dei Materiali e Della Produzione
http://slidepdf.com/reader/full/al-azraq-ingegneria-chimica-dei-materiali-e-della-produzione 125/419
Section I
I.D . Finite Element methods Al Azraq Soliman M.S
Numerical Simulation of Metal Sheet Plastic Deformation Page 117through Finite Element Method
Finite Element Analysis
I.D .1 –
General application of Finite element method
Because of higher requirements on the quality of products and narrowtolerances of measures, optimising, planning and simulating of formingprocesses becomes more and more important. As the computational powerhas increased during the last years, numerical methods play an outstandingroll. The most important numerical method is the method of finite elements(FEM). Numerous finite element programmes have been developed which areable to solve linear, non linear, static, dynamic, elastic, plastic, elastic –plastic, steady state, transient, isotherm as well as non isotherm problems,during the last years. In this case we have to differ between “generalpurpose” and “special purpose” programs.Today many forming processes are carried out without a previous oraccompanied finite element analysis of course. However, if the material flowor the loads of the rolling devices have to be investigated exactly, thenumerical simulation is a must, if one does not want to invest too muchmoney and time in practical experiments. Furthermore practical experimentscause a loss of production of a rolling plant, for example. If the material flowand the stresses in the rolling pieces as well as the forming tools are wellknown, critical forming steps and deformations can be corrected andavoided. [1]
Finite element analysis software enables engineers to perform the followingtasks:
• Build computer models or transfer CAD models of structures,products, components, or systems.
• Apply operating loads or other design performance conditions.• Study physical responses, such as stress levels, temperature
distributions, or electromagnetic fields.• Optimize a design early in the development process to reduce
production costs.• Do prototype testing in environments where it otherwise would be
undesirable or impossible (for example, biomedical applications).The principal applications of the Finite element methodo it consists in:- Structural Analysis- Analyzing Thermal Phenomena- Fluids Analysis- Electromagnetic Field Analysis.
7/23/2019 Al Azraq Ingegneria Chimica Dei Materiali e Della Produzione
http://slidepdf.com/reader/full/al-azraq-ingegneria-chimica-dei-materiali-e-della-produzione 126/419
Section I
I.D . Finite Element methods Al Azraq Soliman M.S
Numerical Simulation of Metal Sheet Plastic Deformation Page 118through Finite Element Method
I.D .2 - many analyses can be performed With Finite ElementMethod:
I.D .2.1 - Structural analysis
Structural analysis is probably the most common application of the finiteelement method. The term structural (or structure ) implies not only civilengineering structures such as bridges and buildings, but also naval,aeronautical, and mechanical structures such as ship hulls, aircraft bodies,and machine housings, as well as mechanical components such as pistons,machine parts, and tools.The seven types of structural analyses are explained below. The primaryunknowns (nodal degrees of freedom) calculated in a structural analysis aredisplacements . Other quantities, such as strains, stresses, and reactionforces, are then derived from the nodal displacements.Structural analyses are available in Program as the ANSYS Multiphysics, ANSYS Mechanical, ANSYS Structural, and ANSYS Professional programs.We can perform the following types of structural analyses:- Static Analysis --Used to determine displacements, stresses, etc. understatic loading conditions. Both linear and nonlinear static analyses.Nonlinearities can include plasticity, stress stiffening, large deflection, largestrain, hyperelasticity, contact surfaces, and creep.- Modal Analysis --Used to calculate the natural frequencies and mode shapes
of a structure. Different mode extraction methods are available.- Harmonic Analysis --Used to determine the response of a structure toharmonically time-varying loads.- Transient Dynamic Analysis --Used to determine the response of a structureto arbitrarily time-varying loads. All nonlinearities mentioned under Static Analysis above are allowed.- Spectrum Analysis --An extension of the modal analysis, used to calculatestresses and strains due to a response spectrum.- Buckling Analysis --Used to calculate the buckling loads and determine thebuckling mode shape. Both linear buckling and nonlinear buckling analyses
are possible.- Explicit Dynamic Analysis --This type of structural analysis is available inprogram as the ANSYS LS-DYNA.. Explicit dynamic analysis is used tocalculate fast solutions for large deformation dynamics and complex contactproblems.- Implicit static analysis.With the static implicit method that equilibrium is checked after each timestep and thus will lead to more accurate results. The main drawback of thismethod however, is that the computation time depends quadratically on thenumber of d.o.f. if a direct solver is used. Another drawback is that the
7/23/2019 Al Azraq Ingegneria Chimica Dei Materiali e Della Produzione
http://slidepdf.com/reader/full/al-azraq-ingegneria-chimica-dei-materiali-e-della-produzione 127/419
Section I
I.D . Finite Element methods Al Azraq Soliman M.S
Numerical Simulation of Metal Sheet Plastic Deformation Page 119through Finite Element Method
stiffness matrix is often ill conditioned which can make the method unstableand detoriates the performance of iterative solvers. [2].
- Structural Static Analysis
A static analysis calculates the effects of steady loading conditions on astructure, while ignoring inertia and damping effects, such as those causedby time-varying loads. A static analysis can, however, include steady inertialoads (such as gravity and rotational velocity), and time-varying loads thatcan be approximated as static equivalent loads (such as the static equivalentwind and seismic loads commonly defined in many building codes).Static analysis is used to determine the displacements, stresses, strains, andforces in structures or components caused by loads that do not induce
significant inertia and damping effects. Steady loading and responseconditions are assumed; that is, the loads and the structure's response areassumed to vary slowly with respect to time. The kinds of loading that canbe applied in a static analysis include:
• Externally applied forces and pressures• Steady-state inertial forces (such as gravity or rotational velocity)• Imposed (nonzero) displacements• Temperatures (for thermal strain)• Fluences (for nuclear swelling)
- Modal Analysis.
Definition of Modal Analysis You use modal analysis to determine the vibration characteristics (naturalfrequencies and mode shapes) of a structure or a machine component whileit is being designed. It also can be a starting point for another, moredetailed, dynamic analysis, such as a transient dynamic analysis, a harmonicresponse analysis, or a spectrum analysis.
Uses for Modal Analysis You use modal analysis to determine the natural frequencies and mode
shapes of a structure. The natural frequencies and mode shapes areimportant parameters in the design of a structure for dynamic loadingconditions. They are also required if you want to do a spectrum analysis or amode superposition harmonic or transient analysis. You can do modal analysis on a prestressed structure, such as a spinningturbine blade. Another useful feature is modal cyclic symmetry, which allowsyou to review the mode shapes of a cyclically symmetric structure bymodeling just a sector of it.
7/23/2019 Al Azraq Ingegneria Chimica Dei Materiali e Della Produzione
http://slidepdf.com/reader/full/al-azraq-ingegneria-chimica-dei-materiali-e-della-produzione 128/419
Section I
I.D . Finite Element methods Al Azraq Soliman M.S
Numerical Simulation of Metal Sheet Plastic Deformation Page 120through Finite Element Method
- Harmonic Response Analysis.
Uses for Harmonic Response Analysis.Harmonic response analysis is a technique used to determine the steady-state response of a linear structure to loads that vary sinusoidally(harmonically ) with time. The idea is to calculate the structure's response atseveral frequencies and obtain a graph of some response quantity (usuallydisplacements) versus frequency. "Peak" responses are then identified on thegraph and stresses reviewed at those peak frequencies.This analysis technique calculates only the steady-state, forced vibrations ofa structure. The transient vibrations, which occur at the beginning of theexcitation, are not accounted for in a harmonic response analysis.Harmonicanalysis can also be performed on a prestressed structure, such as a violin
string (assuming the harmonic stresses are much smaller than the pretensionstress). Any sustained cyclic load will produce a sustained cyclic response (aharmonic response) in a structural system. Harmonic response analysis givesyou the ability to predict the sustained dynamic behavior of your structures,thus enabling you to verify whether or not your designs will successfullyovercome resonance, fatigue, and other harmful effects of forced vibrations.
- Transient Dynamic Analysis.
Definition of Transient Dynamic Analysis.Transient dynamic analysis (sometimes called time-history analysis) is atechnique used to determine the dynamic response of a structure under theaction of any general time-dependent loads. You can use this type of analysisto determine the time-varying displacements, strains, stresses, and forces ina structure as it responds to any combination of static, transient, andharmonic loads. The time scale of the loading is such that the inertia ordamping effects are considered to be important. If the inertia and dampingeffects are not important, you might be able to use a static analysis insteadThe basic equation of motion solved by a transient dynamic analysis is
(M){ u’’} + (C){u’ } + (K){u} = {F(t)}where:(M) = mass matrix
(C) = damping matrix
(K) = stiffness matrix
{u’’} = nodal acceleration vector
{u’} = nodal velocity vector
{u} = nodal displacement vector
{F(t)} = load vector
7/23/2019 Al Azraq Ingegneria Chimica Dei Materiali e Della Produzione
http://slidepdf.com/reader/full/al-azraq-ingegneria-chimica-dei-materiali-e-della-produzione 129/419
Section I
I.D . Finite Element methods Al Azraq Soliman M.S
Numerical Simulation of Metal Sheet Plastic Deformation Page 121through Finite Element Method
At any given time, t , these equations can be thought of as a set of "static"equilibrium equations that also take into account inertia forces ((M){u’’ })and damping forces ((C){u’ }). The ANSYS program uses the Newmark timeintegration method to solve these equations at discrete time points. The timeincrement between successive time points is called the integration time step .
- Spectrum Analysis
Definition of Spectrum Analysis A spectrum analysis is one in which the results of a modal analysis are usedwith a known spectrum to calculate displacements and stresses in the model.It is mainly used in place of a time-history analysis to determine theresponse of structures to random or time-dependent loading conditions such
as earthquakes, wind loads, ocean wave loads, jet engine thrust, rocketmotor vibrations, and so on.
What is a Spectrum• The spectrum is a graph of spectral value versus frequency that
captures the intensity and frequency content of time-history loads.Response Spectrum
A response spectrum represents the response of single-DOF systems to atime-history loading function. It is a graph of response versus frequency,where the response might be displacement, velocity, acceleration, or force.
- Buckling Analysis
Definition of Buckling AnalysisBuckling analysis is a technique used to determine buckling loads - criticalloads at which a structure becomes unstable - and buckled mode shapes -the characteristic shape associated with a structure's buckled response.
Types of Buckling AnalysesTwo techniques are available in the FEM, for predicting the buckling load andbuckling mode shape of a structure: nonlinear buckling analysis, andeigenvalue (or linear) buckling analysis. Since these two methods frequentlyyield quite different results, let's examine the differences between thembefore discussing the details of their implementation.
Nonlinear Buckling AnalysisNonlinear buckling analysis is usually the more accurate approach and istherefore recommended for design or evaluation of actual structures. Thistechnique employs a nonlinear static analysis with gradually increasing loadsto seek the load level at which your structure becomes unstable. Using thenonlinear technique, your model can include features such as initialimperfections, plastic behavior, gaps, and large-deflection response.
7/23/2019 Al Azraq Ingegneria Chimica Dei Materiali e Della Produzione
http://slidepdf.com/reader/full/al-azraq-ingegneria-chimica-dei-materiali-e-della-produzione 130/419
Section I
I.D . Finite Element methods Al Azraq Soliman M.S
Numerical Simulation of Metal Sheet Plastic Deformation Page 122through Finite Element Method
Eigenvalue Buckling AnalysisEigenvalue buckling analysis predicts the theoretical buckling strength (thebifurcation point) of an ideal linear elastic structure. This methodcorresponds to the textbook approach to elastic buckling analysis: forinstance, an eigenvalue buckling analysis of a column will match the classicalEuler solution. However, imperfections and nonlinearities prevent most real-world structures from achieving their theoretical elastic buckling strength.Thus, eigenvalue buckling analysis often yields unconservative results, andshould generally not be used in actual day-to-day engineering analyses.
- Gasket Joints Simulation.
Gasket joints are essential components in most structural assemblies.
Gaskets as sealing components between structural components are usuallyvery thin and made of many materials, such as steel, rubber and composites.From a mechanics point of view, gaskets act to transfer force betweencomponents. The primary deformation of a gasket is usually confined to onedirection, namely, through thickness. The stiffness contributions frommembrane (in plane) and transverse shear are much smaller in generalcompared to the through thickness. The stiffness contribution therefore isassumed to be negligible. A typical example of a gasket joint is in engine assemblies. A thoroughunderstanding of the gasket joint is critical in engine design and operation.
This includes an understanding of the behavior of gasket joint componentsthemselves in an engine operation, and the interaction of the gasket jointwith other components.
- Contact.
Contact problems are highly nonlinear and require significant computerresources to solve. It is important that you understand the physics of theproblem and take the time to set up your model to run as efficiently aspossible.
Contact problems present two significant difficulties. First, you generally donot know the regions of contact until you've run the problem. Depending onthe loads, material, boundary conditions, and other factors, surfaces cancome into and go out of contact with each other in a largely unpredictableand abrupt manner. Second, most contact problems need to account forfriction. There are several friction laws and models to choose from, and allare nonlinear. Frictional response can be chaotic, making solutionconvergence difficult.In addition to these two difficulties, many contact problems must alsoaddress multi-field effects.
7/23/2019 Al Azraq Ingegneria Chimica Dei Materiali e Della Produzione
http://slidepdf.com/reader/full/al-azraq-ingegneria-chimica-dei-materiali-e-della-produzione 131/419
Section I
I.D . Finite Element methods Al Azraq Soliman M.S
Numerical Simulation of Metal Sheet Plastic Deformation Page 123through Finite Element Method
- Fracture Mechanics.
Cracks and flaws occur in many structures and components, sometimesleading to disastrous results. The engineering field of fracture mechanics wasestablished to develop a basic understanding of such crack propagationproblems.Fracture mechanics deals with the study of how a crack or flaw in a structurepropagates under applied loads. It involves correlating analytical predictionsof crack propagation and failure with experimental results. The analyticalpredictions are made by calculating fracture parameters such as stressintensity factors in the crack region, which you can use to estimate crackgrowth rate. Typically, the crack length increases with each application ofsome cyclic load, such as cabin pressurization-depressurization in an
airplane. Further, environmental conditions such as temperature or extensiveexposure to irradiation can affect the fracture propensity of a given material.
- Composites.
Composite materials have been used in structures for a long time. In recenttimes composite parts have been used extensively in aircraft structures,automobiles, sporting goods, and many consumer products.Composite materials are those containing more than one bonded material,each with different structural properties. The main advantage of composite
materials is the potential for a high ratio of stiffness to weight. Compositesused for typical engineering applications are advanced fiber or laminatedcomposites, such as fiberglass, glass epoxy, graphite epoxy, boron epoxyand Glare.The finite element method allows you to model composite materials withspecialized elements called layered elements . Once you build your modelusing these elements, you can do any structural analysis (includingnonlinearities such as large deflection and stress stiffening).
- Fatigue.
Definition of FatigueFatigue is the phenomenon in which a repetitively loaded structure fracturesat a load level less than its ultimate static strength. For instance, a steel barmight successfully resist a single static application of a 300 kN tensile load,but might fail after 1,000,000 repetitions of a 200 kN load.The main factors that contribute to fatigue failures include:
• Number of load cycles experienced• Range of stress experienced in each load cycle• Mean stress experienced in each load cycle• Presence of local stress concentrations
7/23/2019 Al Azraq Ingegneria Chimica Dei Materiali e Della Produzione
http://slidepdf.com/reader/full/al-azraq-ingegneria-chimica-dei-materiali-e-della-produzione 132/419
Section I
I.D . Finite Element methods Al Azraq Soliman M.S
Numerical Simulation of Metal Sheet Plastic Deformation Page 124through Finite Element Method
A formal fatigue evaluation accounts for each of these factors as it calculateshow "used up" a certain component will become during its anticipated lifecycle.
- p-Method Analysis.
The p-method obtains results such as displacements, stresses, or strains to auser-specified degree of accuracy. To calculate these results, the p-methodmanipulates the polynomial level (p-level) of the finite element shapefunctions which are used to approximate the real solution.This feature works by taking a finite element mesh, solving it at a given p-level, increasing the p-level selectively, and then solving the mesh again. After each iteration the results are compared for convergence against a set
of convergence criteria. You can specify the convergence criteria to includedisplacement, rotation, stress or strain at a point (or points) in the model,and global strain energy. The higher the p-level, the better the finite elementapproximation to the real solution.In order to capitalize on the p-method functionality, you don't have to workonly within the confines of p-generated meshes. The p-method is mostefficient when meshes are generated considering that p-elements will beused, but this is not a requirement. Of course, you might want to create andmesh your model using p-elements, but you can also perform a p-methodsolution using meshes that have been generated with h-elements (generated
by ANSYS or your CAD package), if the elements are at least mid-noded.This provides you with the flexibility of taking advantage of the p-methodsolution option independently of how the mesh was created. The p-methodcan improve the results for any mesh automatically.
- Beam Analysis and Cross Sections.
Beam elements are used to create a mathematical one-dimensionalidealization of a 3-D structure. They offer computationally efficient solutionswhen compared to solid and shell elements.
What Are Cross Sections? A cross section defines the geometry of the beam in a plane perpendicular tothe beam axial direction. some methods of analysis supplies a library of verycommonly-used beam cross section shapes, and permits user-defined crosssection shapes.
- Shell Analysis.
Shell elements are used to create a mathematical 2-D idealization of a 3-Dstructure. They offer computationally efficient solutions for modelling shellstructures when compared to solid elements.
7/23/2019 Al Azraq Ingegneria Chimica Dei Materiali e Della Produzione
http://slidepdf.com/reader/full/al-azraq-ingegneria-chimica-dei-materiali-e-della-produzione 133/419
Section I
I.D . Finite Element methods Al Azraq Soliman M.S
Numerical Simulation of Metal Sheet Plastic Deformation Page 125through Finite Element Method
I.D .2.2 - Analyzing Thermal Phenomena
A thermal analysis calculates the temperature distribution and relatedthermal quantities in a system or component. Typical thermal quantities ofinterest are:
• The temperature distributions• The amount of heat lost or gained• Thermal gradients• Thermal fluxes.
Thermal simulations play an important role in the design of manyengineering applications, including internal combustion engines, turbines,heat exchangers, piping systems, and electronic components. In many cases,engineers follow a thermal analysis with a stress analysis to calculate thermal
stresses (that is, stresses caused by thermal expansions or contractions).
I.D .2.3 - Fluids Analysis
Some type of Fluids Analysis they are listed under:
- Flotran CFD (Computational Fluid Dynamics ).
The Flotran analysis CFD (Computational Fluid Dynamics) option to theother software offer you comprehensive tools for analyzing 2-D and 3-Dfluid flow fields. Using the Flotran CFD elements, you can achieve solutionsfor the following:
• Lift and drag on an airfoil• The flow in supersonic nozzles• Complex, 3-D flow patterns in a pipe bend
In addition, you can use many features to perform tasks including:• Calculating the gas pressure and temperature distributions in an
engine exhaust manifold• Studying the thermal stratification and breakup in piping systems• Using flow mixing studies to evaluate potential for thermal shock• Doing natural convection analyses to evaluate the thermal
performance of chips in electronic enclosures• Conducting heat exchanger studies involving different fluids separated
by solid regions
- Acoustics.
Acoustics is the study of the generation, propagation, absorption, andreflection of sound pressure waves in a fluid medium. Applications foracoustics include the following:
•
Sonar - the acoustic counterpart of radar
7/23/2019 Al Azraq Ingegneria Chimica Dei Materiali e Della Produzione
http://slidepdf.com/reader/full/al-azraq-ingegneria-chimica-dei-materiali-e-della-produzione 134/419
Section I
I.D . Finite Element methods Al Azraq Soliman M.S
Numerical Simulation of Metal Sheet Plastic Deformation Page 126through Finite Element Method
• Design of concert halls, where an even distribution of sound pressureis desired
• Noise minimization in machine shops• Noise cancellation in automobiles• Underwater acoustics• Design of speakers, speaker housings, acoustic filters, mufflers, and
many other similar devices.• Geophysical explorationTypes of Acoustic Analysis
An acoustic analysis, programs, usually involves modeling the fluid mediumand the surrounding structure. Typical quantities of interest are the pressuredistribution in the fluid at different frequencies, pressure gradient, particlevelocity, the sound pressure level, as well as, scattering, diffraction,
transmission, radiation, attenuation, and dispersion of acoustic waves. Acoupled acoustic analysis takes the fluid-structure interaction into account.
An uncoupled acoustic analysis models only the fluid and ignores any fluid- structure interaction .
- Thin Film Analysis.
Thin film is a small gap of fluid between moving surfaces. This thin layer offluid can alter the structural response of the structure by adding stiffnessand/or damping to the system. Movement normal to the gap produces a
squeeze film effect. Movement tangential to the gap produces a slide film effect.Thin film effects are important in macrostructures, but they are particularlycritical in microstructures where the damping and stiffening effects of thinlayers of air can significantly affect the behavior of devices used in micro-electromechanical systems (MEMS). Squeeze film effects are important indevices such as accelerometers and micromirrors. Slide film effects areimportant in devices such as comb drives.One method for assessing the effect of thin films is to use thin film fluidelements based on the Reynolds number (which is known from lubrication
technology and rarified gas physics) to calculate the stiffening and dampingeffects. These effects can then be added to the overall system model.Separate element types are used to assess squeeze and slide film effects.
I.D .2.4 - Electromagnetic Field Analysis
Magnetic analyses, available in the Finite element method programs,calculate the magnetic field in devices such as:Power generators Magnetic tape/disk drives
Transformers Waveguides
Solenoid actuators Resonant cavities
7/23/2019 Al Azraq Ingegneria Chimica Dei Materiali e Della Produzione
http://slidepdf.com/reader/full/al-azraq-ingegneria-chimica-dei-materiali-e-della-produzione 135/419
Section I
I.D . Finite Element methods Al Azraq Soliman M.S
Numerical Simulation of Metal Sheet Plastic Deformation Page 127through Finite Element Method
Electric motors Connectors
Magnetic imaging systems Antenna radiation
Video display device sensors FiltersCyclotronsTypical quantities of interest in a magnetic analysis are:
Magnetic flux density Power loss
Magnetic field intensity Flux leakage
Magnetic forces and torques S-parameters
Impedance Quality factor
Inductance Return lossEddy currents Eigenfrequencies
Magnetic fields may exist as a result of an electric current, a permanentmagnet, or an applied external field. [3]
what’s the Finite Element Method
Most analysis software employs the finite element method (FEM), wherethe geometry of the component to be deformed is divided or “discretised”
into simplified regular shapes called “elements”. There is a large range ofelements available of varying complexity (or degrees of freedom) that canmodel different modes of deformation (and temperature fields,electromagnetic fields, etc.) [4].
The aim of industrial application of the FE simulation of stampingprocesses is to replace the physical tryout by the computer tryout, with theintention of time/cost reduction and quality improvement in the diedesign/manufacturing cycle [5].
Literature Review
Rapid developments in computer hardware make the finite elementanalysis of complex deformation responses increasingly applicable. The finiteelement method is used worldwide to simulate the deep drawing process andhas become a reliable numerical simulation technology.
The finite element method is a powerful numerical technique that hasbeen applied in the past years to a wide range of engineering problems. Although much finite element (FE) analysis is used to verify the structuralintegrity of designs, more recently FEM has been used to model fabrication
processes.
7/23/2019 Al Azraq Ingegneria Chimica Dei Materiali e Della Produzione
http://slidepdf.com/reader/full/al-azraq-ingegneria-chimica-dei-materiali-e-della-produzione 136/419
Section I
I.D . Finite Element methods Al Azraq Soliman M.S
Numerical Simulation of Metal Sheet Plastic Deformation Page 128through Finite Element Method
When modelling fabrication processes that involve deformation, such assheet metal forming (SMF), the deformation process must be evaluated interms of stresses and strain states in the body under deformation includingcontact issues. The major advantage of this method is its applicability to awide class of boundary value problems with little restriction on work piecegeometry.
For an accurate simulation of a real-life deep drawing process anaccurate numerical description of the tools is necessary, as well as anaccurate description of material behaviour, contact behaviour and otherprocess variables.
The numerical description of the tools is provided by CAD packageswhich are generally used by tool designers. The description of materialbehaviour, contact behaviour and other process variables evolved from
rather simple models in the earlier days to more and more sophisticatedmodels nowadays. This evolution is due to the elaborate work of researchersworking in the field of metal forming and is shown in authoritativeconferences concerning sheet metal forming. Developments have beenmade in the field of finite element types, mesh adaptivity, material laws,failure criteria, wrinkling and surface defects, springback, contact algorithms,friction, simulation of new processes (for example hydroforming),optimization and process design.
The three basic requirements for the successful commercial application
of numerical simulation are [6]: (1) simplicity of application;(2) accuracy; and(3) computing efficiency.
The characteristic features of the finite element method are [7]: Thedomain of the problem is represented by a collection of simple sub domains,called finite elements. The collection of finite elements is called the finiteelement mesh . Over each finite element, the physical process isapproximated by functions of desired type (polynomials or otherwise), andalgebraic equations relating physical quantities at selective points, called
nodes , of the element are developed. The use of finite element analysis is beneficial in the design of tooling insheet metal forming operations because it is more cost effective than trialand error.
The prime objective of an analysis is to assist in the design of theproduct by:
(1) Predicting the material deformation and(2) Predicting the forces and stresses necessary to execute the forming
operation.
7/23/2019 Al Azraq Ingegneria Chimica Dei Materiali e Della Produzione
http://slidepdf.com/reader/full/al-azraq-ingegneria-chimica-dei-materiali-e-della-produzione 137/419
Section I
I.D . Finite Element methods Al Azraq Soliman M.S
Numerical Simulation of Metal Sheet Plastic Deformation Page 129through Finite Element Method
I.D .3 Finite Element Codes
Implicit vs. Explicit Codes
The FEM codes for sheet metal drawing may be classified accordingly totheir type of integration (explicit or implicit).
Explicit method solves for equilibrium at time t by direct timeintegration. This explicit procedure is conditionally stable since iterativeprocedure is not implemented to reach equilibrium and also ∆ t is limited bynatural time.
Implicit code solves for equilibrium at the every time step (t+ ∆ t) .Depending upon the procedure chosen, each iteration requires the formationand solution of the linear system of equations.
The two main solution procedures for the simulation of deep drawingprocesses are the dynamic explicit and the static implicit procedure.
The dynamic explicit method is frequently used in simulations of thedeep drawing process, since it reduces the computational time drastically,using a diagonal mass matrix system to solve the equations of motion. Forthis method, the computational time depends linearly on the number ofdegrees of freedom (d.o.f.). However, the drawbacks of the explicit methodare that small time steps are needed and that equilibrium after each timestep cannot be checked, which can result in wrong stress distributions and
unrealistic product shapes. Another drawback is that springback calculationsare very time consuming.
The advantage of a static implicit method is that equilibrium ischecked after each time step and thus will lead to more accurate results. Themain drawback of this method however, is that the computation timedepends quadratically on the number of d.o.f. if a direct solver is used. Another drawback is that the stiffness matrix is often ill conditioned whichcan make the method unstable and detoriates the performance of iterativesolvers. [8].
In sum, explicit codes are favoured for solving large problems althoughimplicit codes yield more accurate results. To intensify the use of implicitcodes for solving large problems, the computation time of these codes has tobe decreased drastically.
The following table summarizes the differences between implicit andexplicit codes.
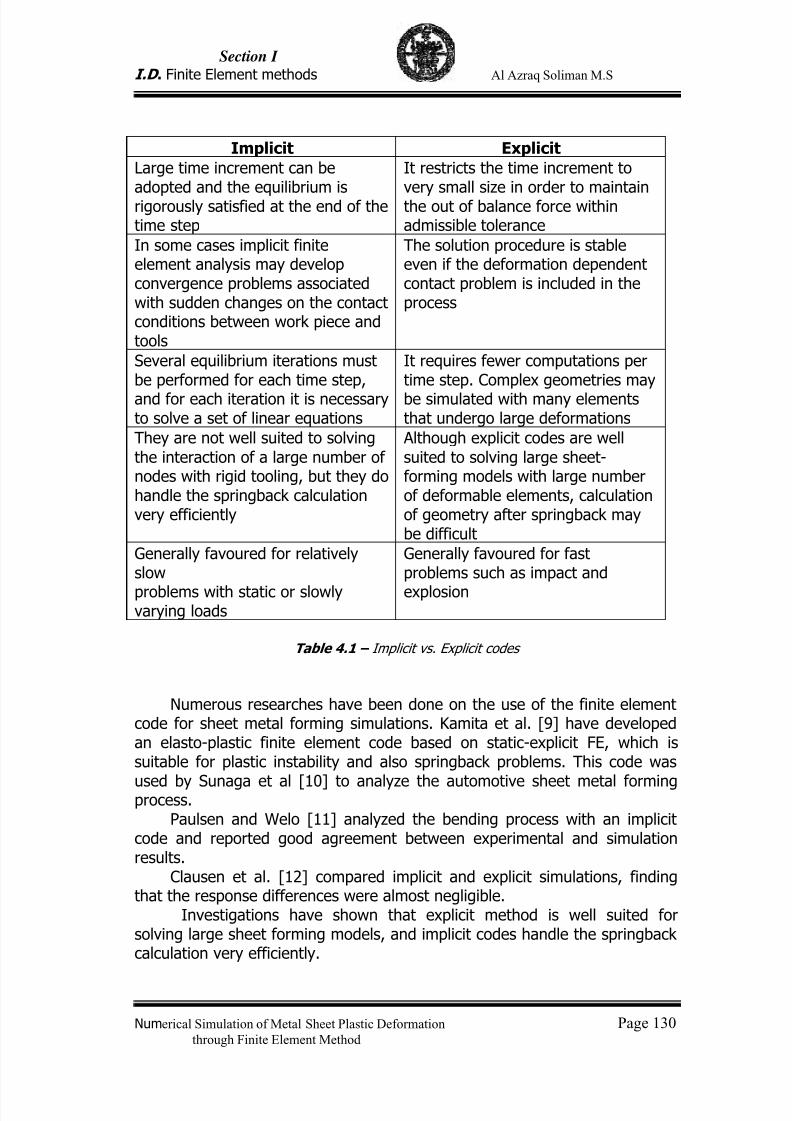
7/23/2019 Al Azraq Ingegneria Chimica Dei Materiali e Della Produzione
http://slidepdf.com/reader/full/al-azraq-ingegneria-chimica-dei-materiali-e-della-produzione 138/419
Section I
I.D . Finite Element methods Al Azraq Soliman M.S
Numerical Simulation of Metal Sheet Plastic Deformation Page 130through Finite Element Method
Implicit Explicit
Large time increment can beadopted and the equilibrium isrigorously satisfied at the end of thetime step
It restricts the time increment tovery small size in order to maintainthe out of balance force withinadmissible tolerance
In some cases implicit finiteelement analysis may developconvergence problems associatedwith sudden changes on the contactconditions between work piece andtools
The solution procedure is stableeven if the deformation dependentcontact problem is included in theprocess
Several equilibrium iterations mustbe performed for each time step,and for each iteration it is necessaryto solve a set of linear equations
It requires fewer computations pertime step. Complex geometries maybe simulated with many elementsthat undergo large deformations
They are not well suited to solvingthe interaction of a large number ofnodes with rigid tooling, but they dohandle the springback calculationvery efficiently
Although explicit codes are wellsuited to solving large sheet-forming models with large numberof deformable elements, calculationof geometry after springback maybe difficult
Generally favoured for relativelyslow
problems with static or slowlyvarying loads
Generally favoured for fastproblems such as impact and
explosion
Table 4.1 – Implicit vs. Explicit codes
Numerous researches have been done on the use of the finite elementcode for sheet metal forming simulations. Kamita et al. [9] have developedan elasto-plastic finite element code based on static-explicit FE, which issuitable for plastic instability and also springback problems. This code was
used by Sunaga et al [10] to analyze the automotive sheet metal formingprocess.Paulsen and Welo [11] analyzed the bending process with an implicit
code and reported good agreement between experimental and simulationresults.
Clausen et al. [12] compared implicit and explicit simulations, findingthat the response differences were almost negligible.
Investigations have shown that explicit method is well suited forsolving large sheet forming models, and implicit codes handle the springbackcalculation very efficiently.
7/23/2019 Al Azraq Ingegneria Chimica Dei Materiali e Della Produzione
http://slidepdf.com/reader/full/al-azraq-ingegneria-chimica-dei-materiali-e-della-produzione 139/419
Section I
I.D . Finite Element methods Al Azraq Soliman M.S
Numerical Simulation of Metal Sheet Plastic Deformation Page 131through Finite Element Method
Hence, recently researchers have adopted a new method of couplingthe implicit and explicit methods to solve complex sheet metal formingprocesses would save design effort and production time.
Narasimhan et al. [13] have used ANSYS/LS-DYNA explicit coupled with ANSYS implicit for springback simulation.
Finn et al. [14] combined the commercial codes LS-DYNA3D andNIKE3D for prediction of springback in automotive body panels.
Taylor et al. [15] discussed the numerical solution of sheet-metalforming applications using the ABAQUS general purpose implicit and explicitfinite-element modules.
Recently, a method was developed which decreases the computationaltime of implicit codes by factors, which makes the implicit finite element codecompetitive with explicit finite element code for large scale problems. This
method is based on introducing dynamics contributions into the implicit finiteelement code.
As a result, a mass matrix is introduced. When this mass matrix isdiagonalized and added to the stiffness matrix, the diagonal terms of thesystem matrix will increase and the matrix will be better conditioned, whichmakes an effective use of iterative solvers possible. Another advantage ofintroducing dynamics contributions into an implicit finite element code is thatit stabilizes the computation, especially when the problem is under-constrained. For example, when closing a doubly curved blankholder, thesheet only makes contact at two or three points which give rise to stability
problems when the simulation is started and no inertia effects are present inthe simulation.
The dynamics contributions are successfully implemented for both theplane strain element (only displacement d.o.f.) and shell element(displacement and rotational d.o.f.). Mass is added to the displacementd.o.f.'s via a lumped or consistent mass matrix approach. Besides, mass isadded to the rotational d.o.f. via a mass moment of inertia approach. Deepdrawing simulations are performed to investigate the performance of thedynamics contributions in combination with iterative solvers. It is concludedthat the computation time can be decreased by a factor 5-10.
Summary of Elements Used in Sheet Metal Forming Simulation
FEA of the sheet metal forming problem usually adopts one of threeanalysis methods based on the membrane, shell and continuum element[16].
The Table 4.2 summarizes the elements used in finite element methodfor sheet metal forming simulation.
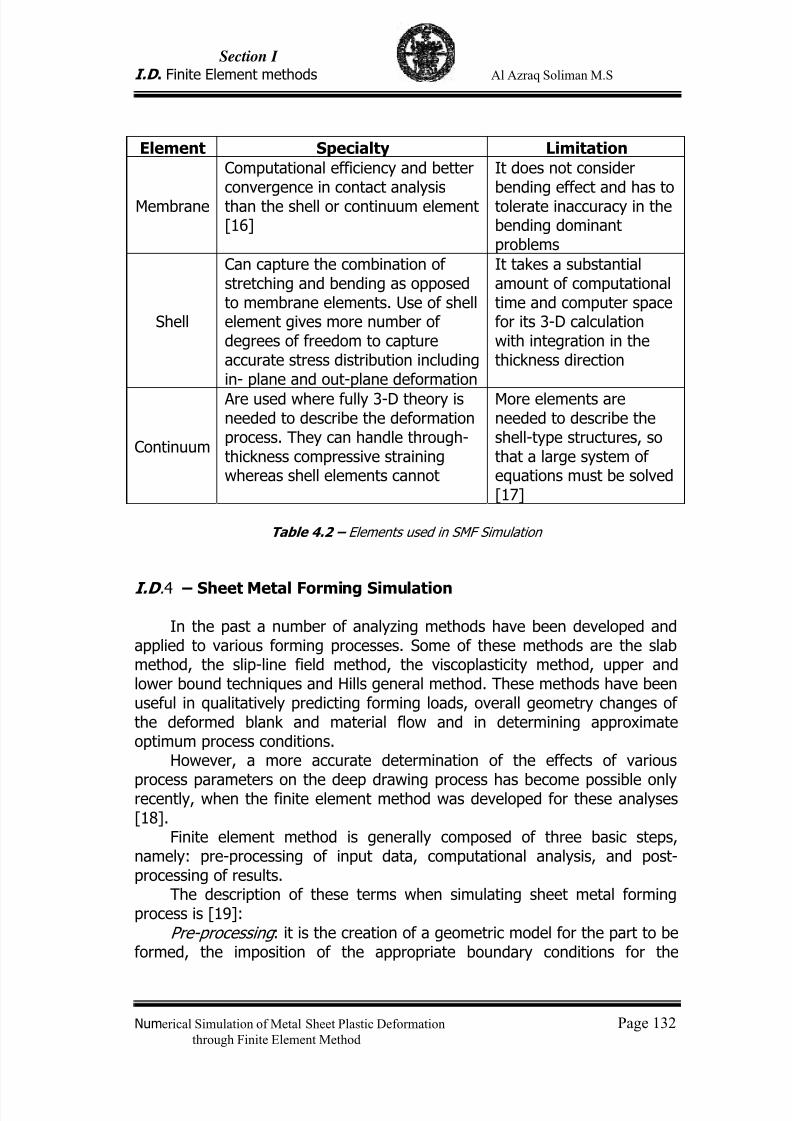
7/23/2019 Al Azraq Ingegneria Chimica Dei Materiali e Della Produzione
http://slidepdf.com/reader/full/al-azraq-ingegneria-chimica-dei-materiali-e-della-produzione 140/419
Section I
I.D . Finite Element methods Al Azraq Soliman M.S
Numerical Simulation of Metal Sheet Plastic Deformation Page 132through Finite Element Method
Element Specialty Limitation
Membrane
Computational efficiency and betterconvergence in contact analysisthan the shell or continuum element[16]
It does not considerbending effect and has totolerate inaccuracy in thebending dominantproblems
Shell
Can capture the combination ofstretching and bending as opposedto membrane elements. Use of shellelement gives more number ofdegrees of freedom to captureaccurate stress distribution includingin- plane and out-plane deformation
It takes a substantialamount of computationaltime and computer spacefor its 3-D calculationwith integration in thethickness direction
Continuum
Are used where fully 3-D theory isneeded to describe the deformationprocess. They can handle through-thickness compressive strainingwhereas shell elements cannot
More elements areneeded to describe theshell-type structures, sothat a large system ofequations must be solved[17]
Table 4.2 – Elements used in SMF Simulation
I.D .4 – Sheet Metal Forming Simulation
In the past a number of analyzing methods have been developed andapplied to various forming processes. Some of these methods are the slabmethod, the slip-line field method, the viscoplasticity method, upper andlower bound techniques and Hills general method. These methods have beenuseful in qualitatively predicting forming loads, overall geometry changes ofthe deformed blank and material flow and in determining approximateoptimum process conditions.
However, a more accurate determination of the effects of various
process parameters on the deep drawing process has become possible onlyrecently, when the finite element method was developed for these analyses
[18].Finite element method is generally composed of three basic steps,
namely: pre-processing of input data, computational analysis, and post-processing of results.
The description of these terms when simulating sheet metal formingprocess is [19]:
Pre-processing : it is the creation of a geometric model for the part to beformed, the imposition of the appropriate boundary conditions for the
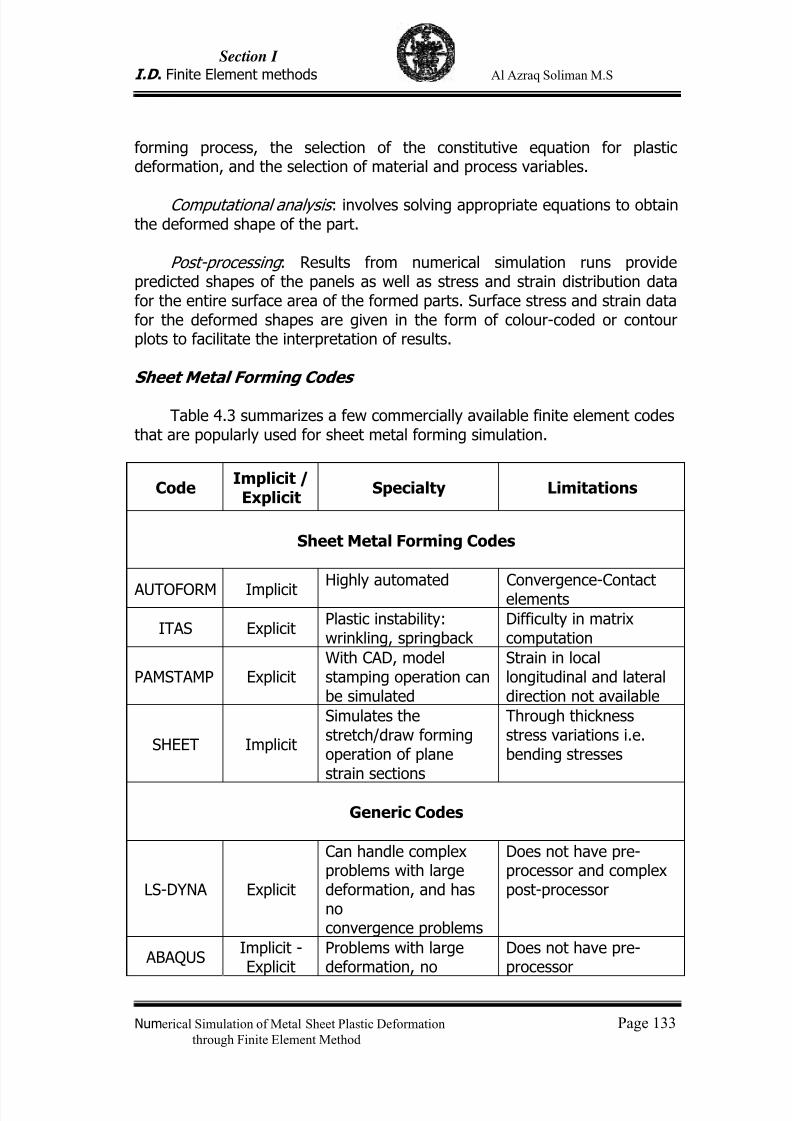
7/23/2019 Al Azraq Ingegneria Chimica Dei Materiali e Della Produzione
http://slidepdf.com/reader/full/al-azraq-ingegneria-chimica-dei-materiali-e-della-produzione 141/419
Section I
I.D . Finite Element methods Al Azraq Soliman M.S
Numerical Simulation of Metal Sheet Plastic Deformation Page 133through Finite Element Method
forming process, the selection of the constitutive equation for plasticdeformation, and the selection of material and process variables.
Computational analysis : involves solving appropriate equations to obtainthe deformed shape of the part.
Post-processing : Results from numerical simulation runs providepredicted shapes of the panels as well as stress and strain distribution datafor the entire surface area of the formed parts. Surface stress and strain datafor the deformed shapes are given in the form of colour-coded or contourplots to facilitate the interpretation of results.
Sheet Metal Forming Codes
Table 4.3 summarizes a few commercially available finite element codesthat are popularly used for sheet metal forming simulation.
Code Implicit /Explicit
Specialty Limitations
Sheet Metal Forming Codes
AUTOFORM ImplicitHighly automated Convergence-Contact
elements
ITAS ExplicitPlastic instability:wrinkling, springback
Difficulty in matrixcomputation
PAMSTAMP ExplicitWith CAD, modelstamping operation canbe simulated
Strain in locallongitudinal and lateraldirection not available
SHEET Implicit
Simulates thestretch/draw formingoperation of planestrain sections
Through thicknessstress variations i.e.bending stresses
Generic Codes
LS-DYNA Explicit
Can handle complexproblems with largedeformation, and hasnoconvergence problems
Does not have pre-processor and complexpost-processor
ABAQUSImplicit -Explicit
Problems with largedeformation, no
Does not have pre-processor

7/23/2019 Al Azraq Ingegneria Chimica Dei Materiali e Della Produzione
http://slidepdf.com/reader/full/al-azraq-ingegneria-chimica-dei-materiali-e-della-produzione 142/419
Section I
I.D . Finite Element methods Al Azraq Soliman M.S
Numerical Simulation of Metal Sheet Plastic Deformation Page 134through Finite Element Method
convergence problems
ANSYS Implicit
Availability to use usermaterial model
There is convergenceproblem duringnonlinearanalysis and contactconditions
Table 4.3 – Commercially Available Finite Element Codes for SMF Simulation
General purpose finite element codes are not generally suitable formetal forming simulation because they are not optimised for theseapplications, and often do not include features such as automatic remeshing,robust evolving contact algorithms and a tailored, easy-to-use interface
which are essential for practical implementation.
7/23/2019 Al Azraq Ingegneria Chimica Dei Materiali e Della Produzione
http://slidepdf.com/reader/full/al-azraq-ingegneria-chimica-dei-materiali-e-della-produzione 143/419
Section I
I.D . Finite Element methods Al Azraq Soliman M.S
Numerical Simulation of Metal Sheet Plastic Deformation Page 135through Finite Element Method
I.D .5. Bibliography :
[1] PHILIPP, M., HARRER, O., SCHWENZFEIER, W., WÖDLINGER, R. andFISCHER, CH.: Turn-up and turn-down phenomena in plate rolling. 5th International ESAFORMConference, Krakow, 2002.
[2] M. Kawka, A. Makinouchi; “Shell-Element Formulation in the StaticExplicit FEM Code for the Simulation of Sheet Stamping”. Journal ofMaterials Processing Technology, 50, 1995, pp. 105-115.
[3] Guide of Ansys
[4] Dr Miller B and Bond R. The practical use of simulation in the sheetmetal forming industry, 2001.
[5] M. Kawka, A. Makinouchi; “Shell-Element Formulation in the StaticExplicit FEM Code for the Simulation of Sheet Stamping”. Journal ofMaterials Processing Technology, 50, 1995, pp. 105-115.
[6] W. Kubli, J. Reissner, “Optimization of Sheet-Metal Forming Process
Using the Special-Purpose Program AUTOFORM”. Journal of MaterialsProcessing Technology, 50, 1995, pp. 292-305.
[7] J.N. Reddy, An Introduction to Finite Element Method, Mc Graw Hill,Inc., 2nd ed., 1993.
[8] M. Kawka, A. Makinouchi; “Shell-Element Formulation in the StaticExplicit FEM Code for the Simulation of Sheet Stamping”. Journal ofMaterials Processing Technology, 50, 1995, pp. 105-115.
[9] Kiyoshi Kamita, Takamichi Arakawa, Hiroshi Fukiharu and AkitakeMakinouchi, “Evaluation of Geometrical Defects by Finite ElementSimulation in the Sheet Metal Forming Processes,” European Congresson Computational Methods in Applied Sciences and Engineering,ECCOMAS, 2000.
[10] Hideyuki Sunaga and Akitake Makinouchi, “Sheet Metal FormingSimulation System for Predicting Failures in Stamping Products,”RIKEN review No.14 December 1996, pp. 47-48.
[11] Paulsen F, Welo T., “Applications of Numerical Simulation in the
7/23/2019 Al Azraq Ingegneria Chimica Dei Materiali e Della Produzione
http://slidepdf.com/reader/full/al-azraq-ingegneria-chimica-dei-materiali-e-della-produzione 144/419
Section I
I.D . Finite Element methods Al Azraq Soliman M.S
Numerical Simulation of Metal Sheet Plastic Deformation Page 136through Finite Element Method
Bending of Aluminum-Alloy Profiles,” Journal of Materials ProcessingTechnology, 58, 1996, pp. 274-85.
[12] Clausen A H, Hopperstad O S, Langseth M., “Stretch Bending AnalysesUsing Implicit and Explicit FE Codes,” Proceedings of the 10th NordicSeminar on Computational Mechanics, Tallinn, Estonia, 1997.
[13] Narkeeran Narasimhan, Michael Lovell, “Predicting Springback in SheetMetal Forming: An Explicit to Implicit Sequential Solution Procedure,”Finite Elements in Analysis and Design, 33, 1999, pp. 29-42.
[14] M J Finn, P C Galbraith, L Wu, J O Hallquist, L Lum, T L Lin, “Use of aCoupled Explicit-Implict Solver for Calculating Spring-Back in
Automotive Body Panels,” Journal of Materials Processing Technology,50, 1995, pp. 395-409.
[15] L. Taylor, J Cao, A P Karafillis and M C Boyce, “Numerical Simulationsof Sheet-Metal Forming,” Journal of Materials Processing Technology,50, 1995, pp. 168-179.
[16] Hoon Huh, Tae Hoon Choi; “Modified Membrane Finite ElementFormulation for Sheet Metal Forming Analysis of Planar AnisotropicMaterials,” International Journal of Mechanical Sciences, 42, 1999, pp.
1623-1643.
[17] M. Kawka, A. Makinouchi; “Shell-Element Formulation in the StaticExplicit FEM Code for the Simulation of Sheet Stamping”. Journal ofMaterials Processing Technology, 50, 1995, pp. 105-115.
[18] Schenk O and Hillmann M. Optimal design of metal forming diesurfaces with evolution strategies. Journal Computers&Structures, Volume 82, Issues 20-21 , August 2004, Pages 1695-1705.
[19] M Y Demeri and S. C Tang, “Post Processing Analysis in Sheet Metal
Forming Simulation,” JOM, June 1992, pp. 14-16.

7/23/2019 Al Azraq Ingegneria Chimica Dei Materiali e Della Produzione
http://slidepdf.com/reader/full/al-azraq-ingegneria-chimica-dei-materiali-e-della-produzione 145/419
Section I
I.D . Finite Element methods Al Azraq Soliman M.S
Numerical Simulation of Metal Sheet Plastic Deformation Page 137through Finite Element Method
7/23/2019 Al Azraq Ingegneria Chimica Dei Materiali e Della Produzione
http://slidepdf.com/reader/full/al-azraq-ingegneria-chimica-dei-materiali-e-della-produzione 146/419
Section I.E
Simulation Process of Plastic Deformationw through the FEM
7/23/2019 Al Azraq Ingegneria Chimica Dei Materiali e Della Produzione
http://slidepdf.com/reader/full/al-azraq-ingegneria-chimica-dei-materiali-e-della-produzione 147/419
Section I
I.E . Simulation of PlasticDeformation Processes Al Azraq Soliman M.S
Numerical Simulation of Metal Sheet Plastic Deformation Page 138through Finite Element Method
I.E .1 – Introduction
The simulation of the forming process offers substantial rationalizationreserves, for example optimizing of component and tool thus also theenhancement of process reliability. The program systems currently in usemust be extended in various directions in order to accommodate the growingpractical needs. For further improved accuracy, along with the focuses ofdevelopment discussed here it will be necessary in future also to makeallowance for better representation for the elastic properties of the tool. Theultimate consequence of this is that, for complete simulation, the elasticproperties of the press or hammer also will be taken into account. Theresults of this simulation will be constitute the basis for optimizing the
stiffness and weight of tools.In metal forming, process simulation is used to predict metal flow,
strain, temperature distribution, stresses, tool forces and potential sources ofdefects and failures. In some cases, it is even possible to predict productmicrostructure and properties as well as elastic recovery and residualstresses.
In massive forming, simulation of 2D problems, e.g. axisymmetric andplane or near-plane strain, is truly state of the art. The application for 3Dproblems is still not widely used in industry because it is not always costeffective and requires considerable engineering and computation time. In
sheet forming, however, 3D simulations are extensively used in stampingindustry.The main reasons of process simulation are:
a) reduce time to marketb) reduce cost of tool developmentc) predict influence of process parametersd) reduce productions cost product qualitye) improve product qualityf) better understanding of material behaviourg) reduce material waste
while the goals of manufacturing using these techniques are.a)
accurately predict the material flowb) determine the filling of the swage or diec) accurate assessment of net shaped) predict if laps or other defects existse) determine the stresses, temperatures, and residual stresses in the
work piecef) determine optimal shape or perform
Moreover, using simulation it is possible to:a) determine material properties such as grain sizeb) determine local hardness
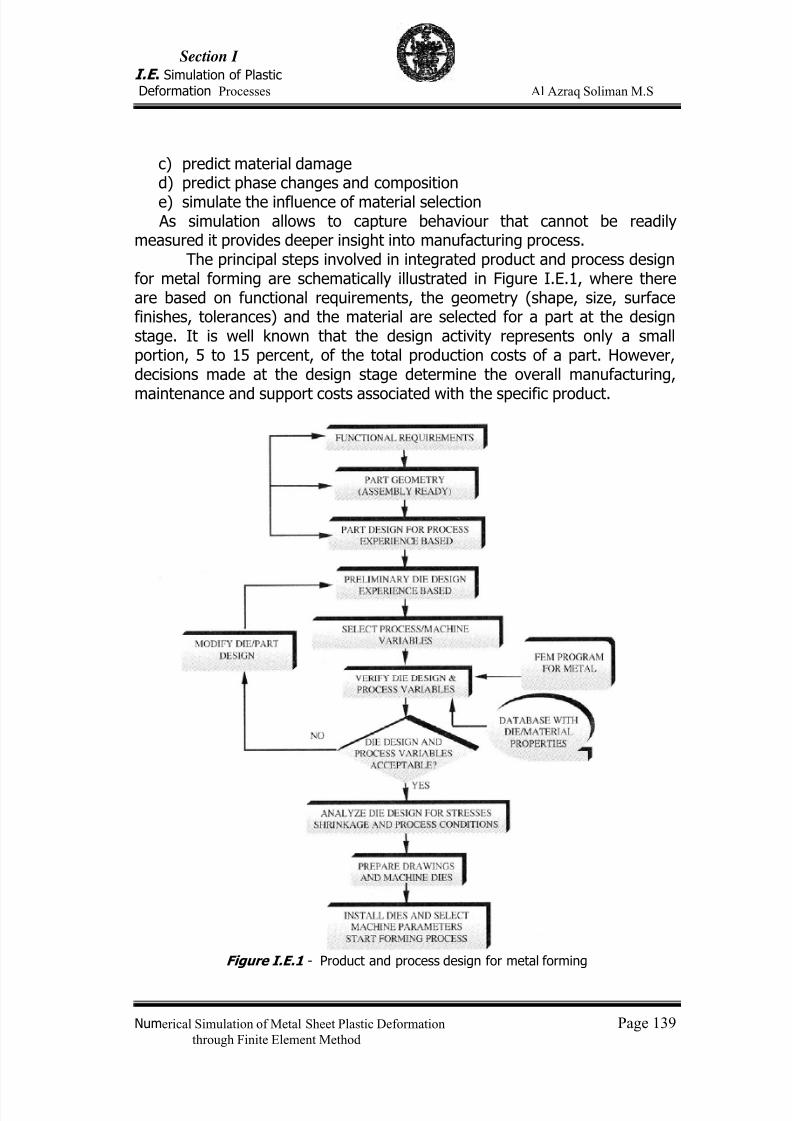
7/23/2019 Al Azraq Ingegneria Chimica Dei Materiali e Della Produzione
http://slidepdf.com/reader/full/al-azraq-ingegneria-chimica-dei-materiali-e-della-produzione 148/419
Section I
I.E . Simulation of PlasticDeformation Processes Al Azraq Soliman M.S
Numerical Simulation of Metal Sheet Plastic Deformation Page 139through Finite Element Method
c) predict material damaged) predict phase changes and composition
e)
simulate the influence of material selection As simulation allows to capture behaviour that cannot be readily
measured it provides deeper insight into manufacturing process.The principal steps involved in integrated product and process design
for metal forming are schematically illustrated in Figure I.E.1, where thereare based on functional requirements, the geometry (shape, size, surfacefinishes, tolerances) and the material are selected for a part at the designstage. It is well known that the design activity represents only a smallportion, 5 to 15 percent, of the total production costs of a part. However,decisions made at the design stage determine the overall manufacturing,
maintenance and support costs associated with the specific product.
Figure I.E.1 - Product and process design for metal forming
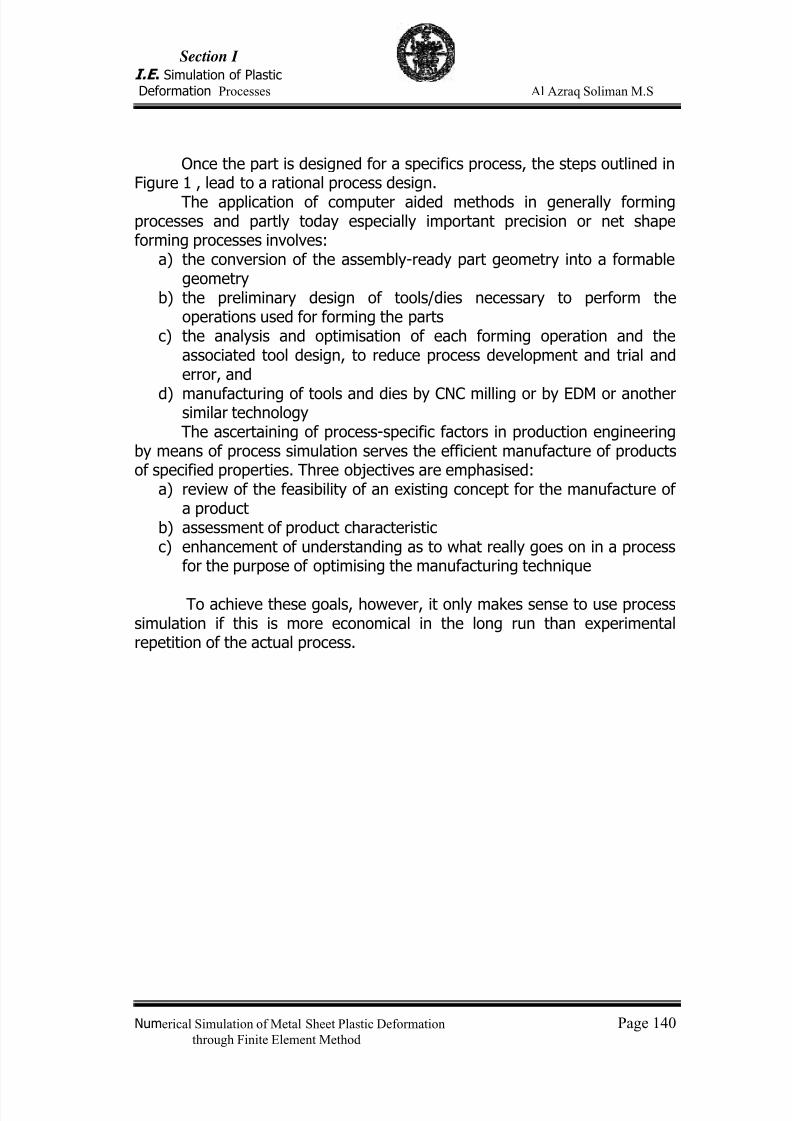
7/23/2019 Al Azraq Ingegneria Chimica Dei Materiali e Della Produzione
http://slidepdf.com/reader/full/al-azraq-ingegneria-chimica-dei-materiali-e-della-produzione 149/419
Section I
I.E . Simulation of PlasticDeformation Processes Al Azraq Soliman M.S
Numerical Simulation of Metal Sheet Plastic Deformation Page 140through Finite Element Method
Once the part is designed for a specifics process, the steps outlined inFigure 1 , lead to a rational process design.
The application of computer aided methods in generally formingprocesses and partly today especially important precision or net shapeforming processes involves:
a) the conversion of the assembly-ready part geometry into a formablegeometry
b) the preliminary design of tools/dies necessary to perform theoperations used for forming the parts
c) the analysis and optimisation of each forming operation and theassociated tool design, to reduce process development and trial anderror, and
d)
manufacturing of tools and dies by CNC milling or by EDM or anothersimilar technologyThe ascertaining of process-specific factors in production engineering
by means of process simulation serves the efficient manufacture of productsof specified properties. Three objectives are emphasised:
a) review of the feasibility of an existing concept for the manufacture ofa product
b) assessment of product characteristicc) enhancement of understanding as to what really goes on in a process
for the purpose of optimising the manufacturing technique
To achieve these goals, however, it only makes sense to use processsimulation if this is more economical in the long run than experimentalrepetition of the actual process.
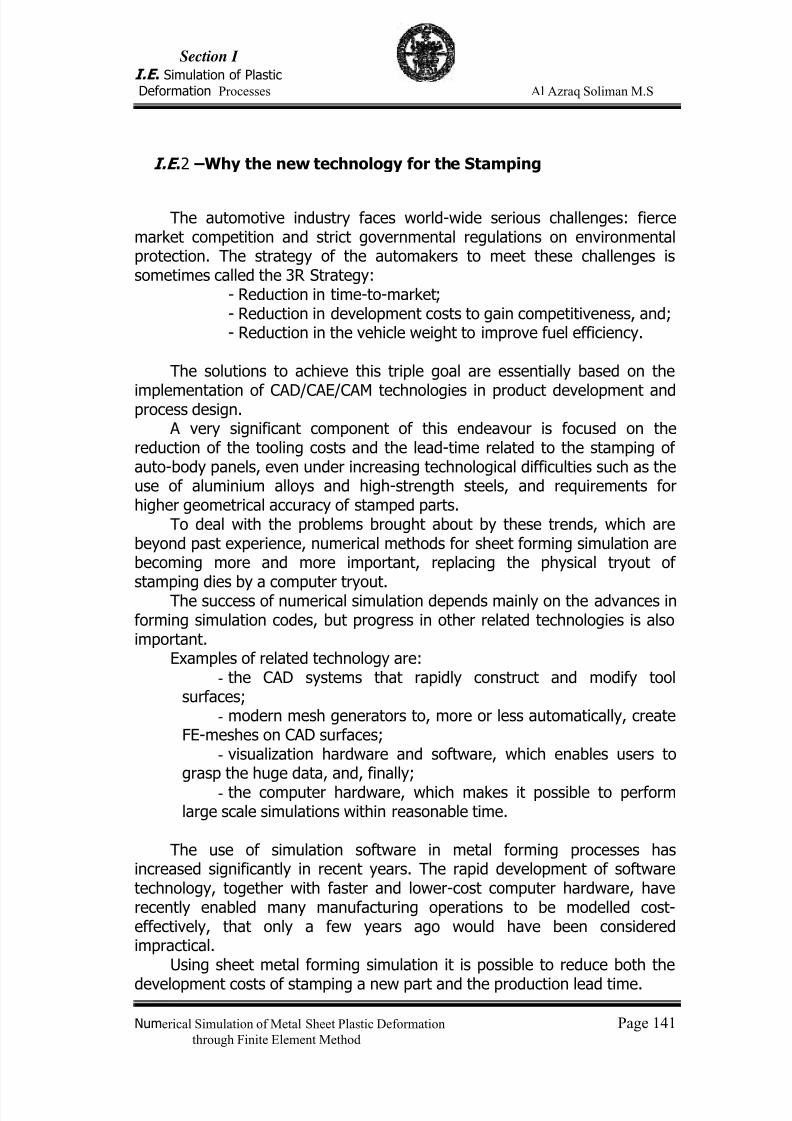
7/23/2019 Al Azraq Ingegneria Chimica Dei Materiali e Della Produzione
http://slidepdf.com/reader/full/al-azraq-ingegneria-chimica-dei-materiali-e-della-produzione 150/419
Section I
I.E . Simulation of PlasticDeformation Processes Al Azraq Soliman M.S
Numerical Simulation of Metal Sheet Plastic Deformation Page 141through Finite Element Method
I.E .2 –Why the new technology for the Stamping
The automotive industry faces world-wide serious challenges: fiercemarket competition and strict governmental regulations on environmentalprotection. The strategy of the automakers to meet these challenges issometimes called the 3R Strategy:
- Reduction in time-to-market;- Reduction in development costs to gain competitiveness, and;- Reduction in the vehicle weight to improve fuel efficiency.
The solutions to achieve this triple goal are essentially based on the
implementation of CAD/CAE/CAM technologies in product development andprocess design.
A very significant component of this endeavour is focused on thereduction of the tooling costs and the lead-time related to the stamping ofauto-body panels, even under increasing technological difficulties such as theuse of aluminium alloys and high-strength steels, and requirements forhigher geometrical accuracy of stamped parts.
To deal with the problems brought about by these trends, which arebeyond past experience, numerical methods for sheet forming simulation arebecoming more and more important, replacing the physical tryout of
stamping dies by a computer tryout.The success of numerical simulation depends mainly on the advances informing simulation codes, but progress in other related technologies is alsoimportant.
Examples of related technology are:- the CAD systems that rapidly construct and modify tool
surfaces;- modern mesh generators to, more or less automatically, create
FE-meshes on CAD surfaces;- visualization hardware and software, which enables users to
grasp the huge data, and, finally;-
the computer hardware, which makes it possible to performlarge scale simulations within reasonable time.
The use of simulation software in metal forming processes hasincreased significantly in recent years. The rapid development of softwaretechnology, together with faster and lower-cost computer hardware, haverecently enabled many manufacturing operations to be modelled cost-effectively, that only a few years ago would have been consideredimpractical.
Using sheet metal forming simulation it is possible to reduce both the
development costs of stamping a new part and the production lead time.
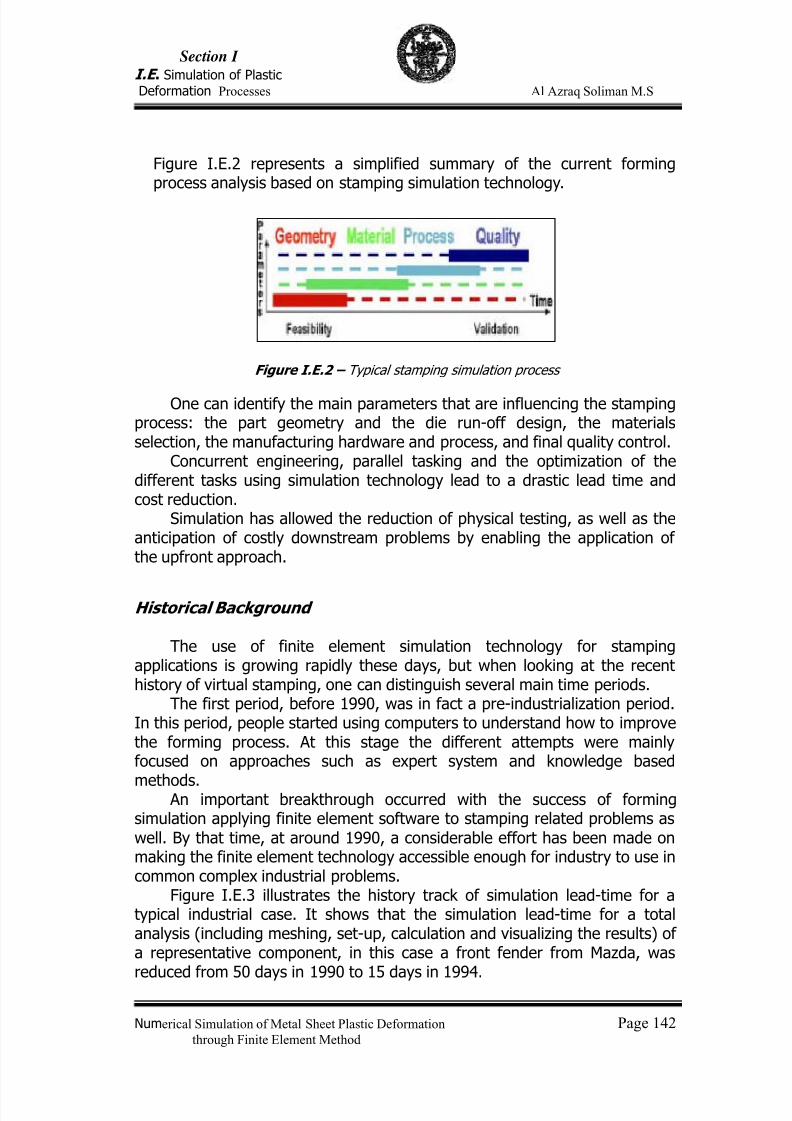
7/23/2019 Al Azraq Ingegneria Chimica Dei Materiali e Della Produzione
http://slidepdf.com/reader/full/al-azraq-ingegneria-chimica-dei-materiali-e-della-produzione 151/419
Section I
I.E . Simulation of PlasticDeformation Processes Al Azraq Soliman M.S
Numerical Simulation of Metal Sheet Plastic Deformation Page 142through Finite Element Method
Figure I.E.2 represents a simplified summary of the current formingprocess analysis based on stamping simulation technology.
Figure I.E.2 – Typical stamping simulation process
One can identify the main parameters that are influencing the stampingprocess: the part geometry and the die run-off design, the materialsselection, the manufacturing hardware and process, and final quality control.
Concurrent engineering, parallel tasking and the optimization of thedifferent tasks using simulation technology lead to a drastic lead time andcost reduction.
Simulation has allowed the reduction of physical testing, as well as theanticipation of costly downstream problems by enabling the application ofthe upfront approach.
Historical Background
The use of finite element simulation technology for stampingapplications is growing rapidly these days, but when looking at the recenthistory of virtual stamping, one can distinguish several main time periods.
The first period, before 1990, was in fact a pre-industrialization period.In this period, people started using computers to understand how to improvethe forming process. At this stage the different attempts were mainlyfocused on approaches such as expert system and knowledge based
methods. An important breakthrough occurred with the success of formingsimulation applying finite element software to stamping related problems aswell. By that time, at around 1990, a considerable effort has been made onmaking the finite element technology accessible enough for industry to use incommon complex industrial problems.
Figure I.E.3 illustrates the history track of simulation lead-time for atypical industrial case. It shows that the simulation lead-time for a totalanalysis (including meshing, set-up, calculation and visualizing the results) ofa representative component, in this case a front fender from Mazda, wasreduced from 50 days in 1990 to 15 days in 1994.
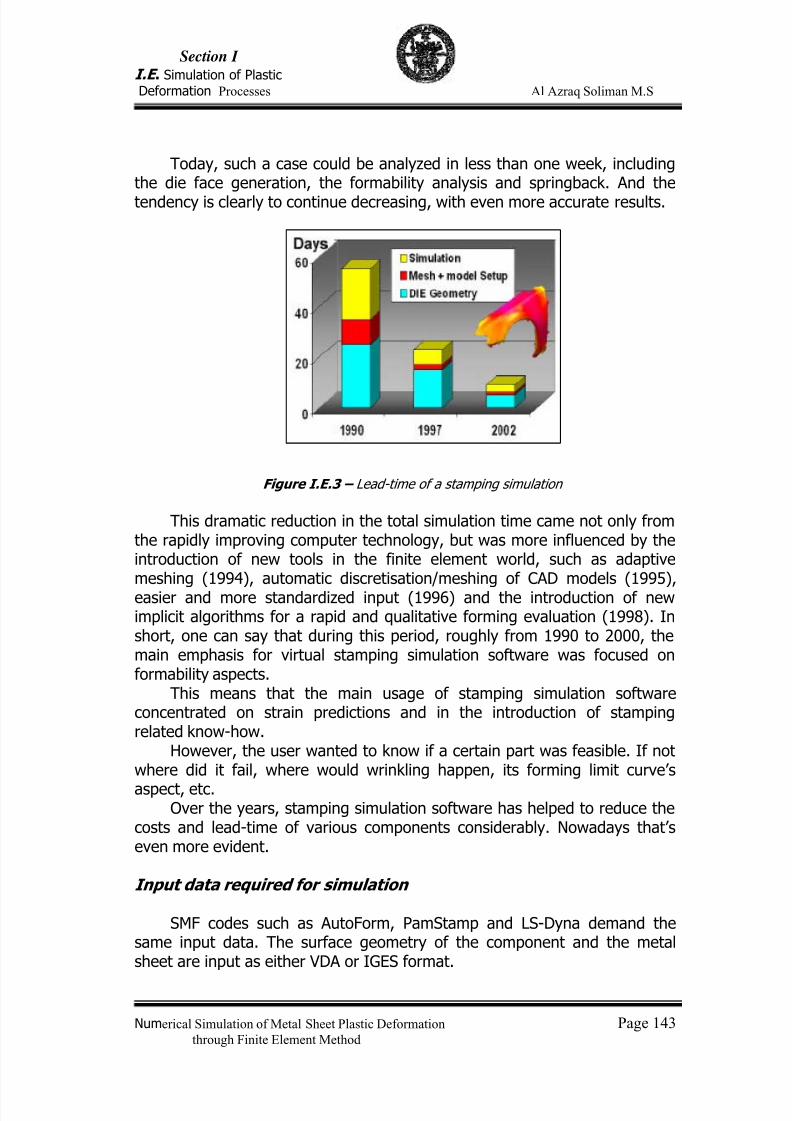
7/23/2019 Al Azraq Ingegneria Chimica Dei Materiali e Della Produzione
http://slidepdf.com/reader/full/al-azraq-ingegneria-chimica-dei-materiali-e-della-produzione 152/419
Section I
I.E . Simulation of PlasticDeformation Processes Al Azraq Soliman M.S
Numerical Simulation of Metal Sheet Plastic Deformation Page 143through Finite Element Method
Today, such a case could be analyzed in less than one week, includingthe die face generation, the formability analysis and springback. And the
tendency is clearly to continue decreasing, with even more accurate results.
Figure I.E.3 – Lead-time of a stamping simulation
This dramatic reduction in the total simulation time came not only fromthe rapidly improving computer technology, but was more influenced by theintroduction of new tools in the finite element world, such as adaptivemeshing (1994), automatic discretisation/meshing of CAD models (1995),easier and more standardized input (1996) and the introduction of newimplicit algorithms for a rapid and qualitative forming evaluation (1998). Inshort, one can say that during this period, roughly from 1990 to 2000, themain emphasis for virtual stamping simulation software was focused onformability aspects.
This means that the main usage of stamping simulation softwareconcentrated on strain predictions and in the introduction of stampingrelated know-how.
However, the user wanted to know if a certain part was feasible. If notwhere did it fail, where would wrinkling happen, its forming limit curve’s
aspect, etc. Over the years, stamping simulation software has helped to reduce the
costs and lead-time of various components considerably. Nowadays that’seven more evident.
Input data required for simulation
SMF codes such as AutoForm, PamStamp and LS-Dyna demand thesame input data. The surface geometry of the component and the metalsheet are input as either VDA or IGES format.
7/23/2019 Al Azraq Ingegneria Chimica Dei Materiali e Della Produzione
http://slidepdf.com/reader/full/al-azraq-ingegneria-chimica-dei-materiali-e-della-produzione 153/419
Section I
I.E . Simulation of PlasticDeformation Processes Al Azraq Soliman M.S
Numerical Simulation of Metal Sheet Plastic Deformation Page 144through Finite Element Method
From this part geometry the tool surfaces can be built using specialfunctions in the programs.
Another method is to import complete tool surfaces created in some3D-CAD program.
In the forming simulation the tools are assumed to be completely rigidcompared to the sheet metal. In this case only the surfaces of the toolsinteracting in the forming process need to be imported.
Required material data are:-Coefficient of friction. Varies depending on the material or different
lubricants.-Poisson’s number-Specific mass density
-Young’s modulus-Parameters for the strain-hardening curve depending on the material-Parameters for the material law depending on the material type-Parameters for the forming limit curve depending on the material
The simulation process
After the simulation model is created (including the different toolcomponents, data for the material and process parameters as binder force,punch velocity, etc.) the forming simulation can be conducted.
The simulation usually contains the following steps:-Only gravity applied to get the shape or deformation of the metal sheet
when it is placed on the binder; very important if a thin sheet is used-Closing of the binder is the first step of the forming process. The
binder is moved towards the die and forces the sheet against the die.-Drawing, when the punch is moved down in the die and the forming
process is simulated.-Trimming, when scrap is removed from the component.-Springback, when the tool surfaces are removed and the elastic part of
the strains in the component can relax.
Convergence Criteria
The modelling of sheet metal forming processes is one example ofhighly nonlinear problems where the iterative solution procedure can becomevery slow or diverge [17].
The non-linearities observed can be categorized as geometrical non-linearities, material non-linearities (due to plastic deformation), friction forcereversals and contact mode changes.
In a static finite element code, high mesh resolution can causeconvergence problems, especially for large deformable elements . But a
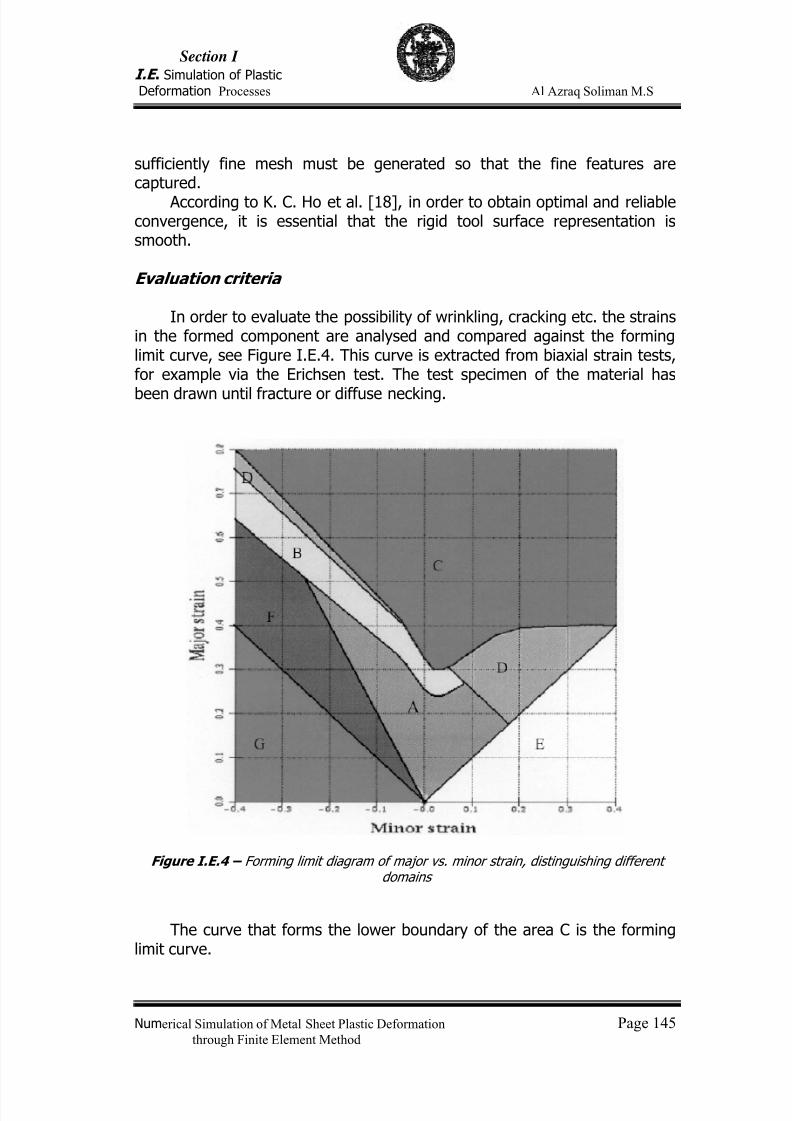
7/23/2019 Al Azraq Ingegneria Chimica Dei Materiali e Della Produzione
http://slidepdf.com/reader/full/al-azraq-ingegneria-chimica-dei-materiali-e-della-produzione 154/419
Section I
I.E . Simulation of PlasticDeformation Processes Al Azraq Soliman M.S
Numerical Simulation of Metal Sheet Plastic Deformation Page 145through Finite Element Method
sufficiently fine mesh must be generated so that the fine features arecaptured.
According to K. C. Ho et al. [18], in order to obtain optimal and reliableconvergence, it is essential that the rigid tool surface representation issmooth.
Evaluation criteria
In order to evaluate the possibility of wrinkling, cracking etc. the strainsin the formed component are analysed and compared against the forminglimit curve, see Figure I.E.4. This curve is extracted from biaxial strain tests,for example via the Erichsen test. The test specimen of the material has
been drawn until fracture or diffuse necking.
Figure I.E.4 – Forming limit diagram of major vs. minor strain, distinguishing differentdomains
The curve that forms the lower boundary of the area C is the forminglimit curve.
7/23/2019 Al Azraq Ingegneria Chimica Dei Materiali e Della Produzione
http://slidepdf.com/reader/full/al-azraq-ingegneria-chimica-dei-materiali-e-della-produzione 155/419
Section I
I.E . Simulation of PlasticDeformation Processes Al Azraq Soliman M.S
Numerical Simulation of Metal Sheet Plastic Deformation Page 146through Finite Element Method
The curve describes the level of strain that the actual material canwithstand until failure, cracking or wrinkling occurs. Following a rule of
thumb experience to assure that the component not will break the strainlevel should not exceed 80% of the level of the forming limit curve.
The different areas in the diagram are:
A. Recommended! Appropriate use of the forming abilities of thematerial
B. Danger of rupture or cracking.C. The material has cracked.D. Severe thinning.E. Insufficient plastic strain, risk of springback
F. Tendency to wrinkling.G. Fully developed wrinkles.
Adaptive Remeshing
Today, industries such as the automotive and aerospace industryrequire the solution of highly complex problems concerning three-dimensional geometries, non-linear material behaviour, contact conditionsand large deformations. Consequently, the numerical simulation of these
types of problems is potentially very expensive, even when simplifyingassumptions such as membrane kinematics are made.
Despite the high computer power available, it is desired that acomputation can be performed overnight. Hence, the computational costs(computation time, time to prepare the initial element mesh and the amountof data to store) must be minimized while still maintaining the desiredaccuracy.
This goal can be achieved by adaptive remeshing: the initial finiteelement mesh can be changed in a specific way during the simulation.
Adaptive remeshing has two major advantages. First, the computationalcosts can be reduced by starting the simulation with a relatively coarsemesh. Remeshing at specific parts in the mesh can take place when thesecoarse elements are no longer able to accurately describe the geometry orthe steep gradients in state variables, and this is usually the case in the finalstage of the forming process.
Second, when large deformations develop, the initial mesh can behighly distorted, so that the numerical simulation becomes unstable orcrashes. To prevent a high mesh distortion, adaptive remeshing can beapplied to enhance the element mesh during simulation.
Globally, the adaptive remeshing procedure can be divided into threephases. First, some measure of the accuracy of the solution is required. This
7/23/2019 Al Azraq Ingegneria Chimica Dei Materiali e Della Produzione
http://slidepdf.com/reader/full/al-azraq-ingegneria-chimica-dei-materiali-e-della-produzione 156/419
Section I
I.E . Simulation of PlasticDeformation Processes Al Azraq Soliman M.S
Numerical Simulation of Metal Sheet Plastic Deformation Page 147through Finite Element Method
so-called error estimator will be used to define a remeshing criterion (e.g. anerror indicator based on thickness error, an indicator based on a geometric
error and a wrinkling risk indicator).Next a new mesh must be generated which must satisfy specific
requirements. The elements to be refined are equally divided into 4 newelements (triangular). No use is made of constraints; the elements at theboundary of the refined area are splitted into two elements.
Finally, a procedure for the transfer of state variables and boundaryconditions from the old mesh to the new mesh is programmed.
As a result, the refinement procedure can successfully be applied insimulations of the deep drawing process, significantly decreasing therequired CPU-time for an accurate simulation.
Besides, the coupling between a wrinkling risk indicator and theadaptive remeshing procedure can be a powerful tool to simulate wrinklingbehaviour during the forming process without an excessive increase incomputational time.
I.E .3 – New Requirements in Metal Forming Analysis
Part Geometry
It’s obvious that the esthetics of automobile design have evolved
dramatically; more classic shapes have given way to futuristic designs thatmix sweeping curves and sharp angles. In addition, the unveiling of thesenew designs has accelerated; what were once just futuristic prototypes mustnow quickly become production automobiles. Next to that, customers’expectations have reduced the economic life cycle of a car and as such newmodels have to be introduced more frequently with wider varieties andextended customization.
Materials
With an increased market demand for “green” automobiles (i.e. fuelefficient) and improved safety, manufacturers have had to evaluate and usenew materials for structural components, body and trim as well.
Because of these requirements, new aluminium alloys and new grade ofsteel such as ultra high strength steel have been developed, pushing theboundaries of what was previously possible with conventional steel grades.
A very recent trend in the automotive industry is the use of dual phaseand TRIP steels.
In order to closely investigate materials’ behaviour, they turn to formingsimulations to study its behaviour during the forming process.
7/23/2019 Al Azraq Ingegneria Chimica Dei Materiali e Della Produzione
http://slidepdf.com/reader/full/al-azraq-ingegneria-chimica-dei-materiali-e-della-produzione 157/419
Section I
I.E . Simulation of PlasticDeformation Processes Al Azraq Soliman M.S
Numerical Simulation of Metal Sheet Plastic Deformation Page 148through Finite Element Method
The main advantage of using these new materials is that it helps reduce(or control) weight, while increasing safety.
For a component to be manufactured effectively, these new materialsrequire a much greater degree of precision and parameterization to answerthe needs of forming simulation. A customizable model that keeps track ofpart material history and parameters such as strain rate, kinematichardening, etc, has become a requirement in order to attain the last 10% ofaccuracy at the stresses level.
A major negative consequence of using these new materials is theabsence of knowledge about its behaviour during crash testing.
Recent studies illustrate the impact of the manufacturing process on thecomponents’ performance. Since traditional crash simulation did not take
part material history into account, simulation has not proved to be goodenough to predict accurately the performance in physical testing of criticalparts and subassemblies.
However, with a simulation that kept track of part material history (i.e.stress and strain undergone during forming) simulation proved to be muchmore accurate. Thus, the use of new materials has made it a requirement forstamping simulation today to be able to maintain a part’s full history throughseamless data transfer.
Manufacturing Process
New hardware, such as the crossbar transfer press, has been created toaccelerate production. This new hardware has modified the productionprocess itself, which creates secondary problems such as transferring ofblanks, positioning and trimming of blanks and the disposal of scrap material.
Also, in the last decade we observed the successful introduction ofseveral new innovative forming technologies such as hydro-forming, tailoredblanks, etc. The aim of these new developments was always to reduce thenumber of components, while at the same time optimizing the number offorming steps. This was a very good example on how collaborative work ledto real success with relatively short lead-time.
Another example of a new requirement for simulation can be seen fromthe evolution in welding technology, where the increased use of laserwelding requires a more sophisticated clamping system and a very low flangetolerance. This technology has a large impact indeed on tolerance control,which translates to springback problems on the part at the forming stage. This evolution in process again illustrates the need for increased precisionand tighter control during stamp simulation.
Industrial stamping simulation evolution
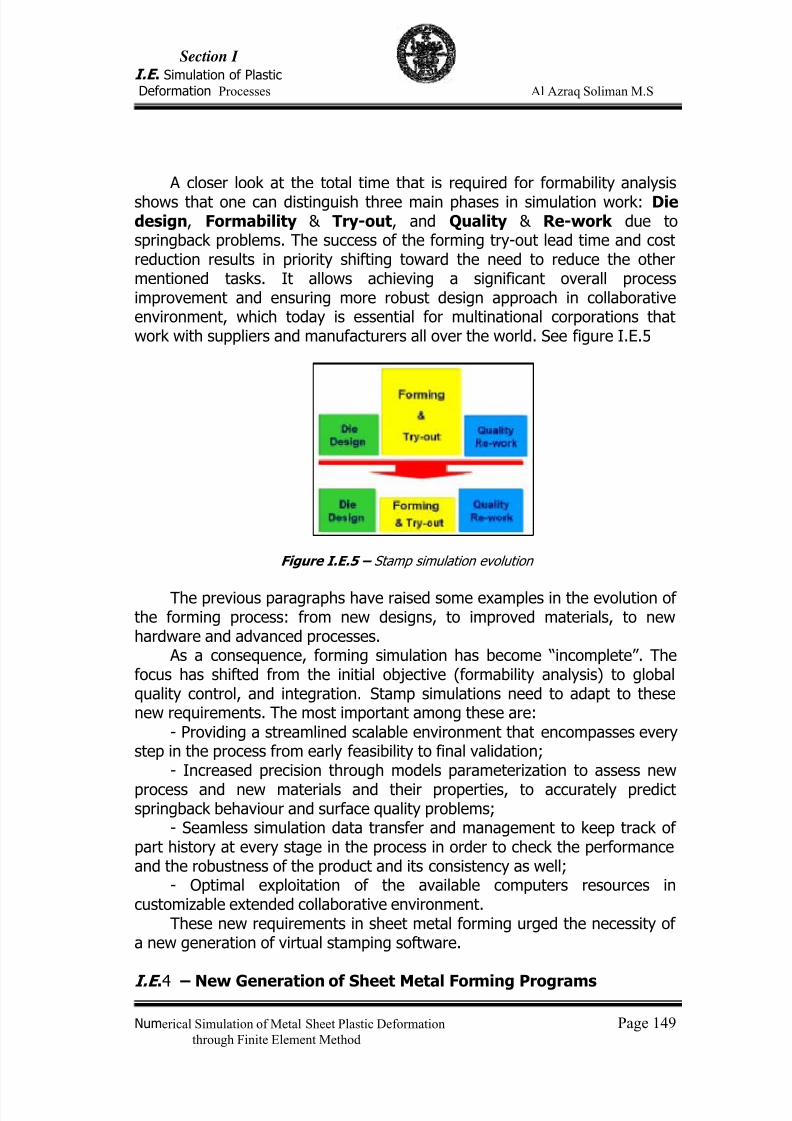
7/23/2019 Al Azraq Ingegneria Chimica Dei Materiali e Della Produzione
http://slidepdf.com/reader/full/al-azraq-ingegneria-chimica-dei-materiali-e-della-produzione 158/419
Section I
I.E . Simulation of PlasticDeformation Processes Al Azraq Soliman M.S
Numerical Simulation of Metal Sheet Plastic Deformation Page 149through Finite Element Method
A closer look at the total time that is required for formability analysis
shows that one can distinguish three main phases in simulation work: Diedesign, Formability & Try-out, and Quality & Re-work due tospringback problems. The success of the forming try-out lead time and costreduction results in priority shifting toward the need to reduce the othermentioned tasks. It allows achieving a significant overall processimprovement and ensuring more robust design approach in collaborativeenvironment, which today is essential for multinational corporations thatwork with suppliers and manufacturers all over the world. See figure I.E.5
Figure I.E.5 – Stamp simulation evolution
The previous paragraphs have raised some examples in the evolution ofthe forming process: from new designs, to improved materials, to newhardware and advanced processes.
As a consequence, forming simulation has become “incomplete”. Thefocus has shifted from the initial objective (formability analysis) to globalquality control, and integration. Stamp simulations need to adapt to thesenew requirements. The most important among these are:
- Providing a streamlined scalable environment that encompasses everystep in the process from early feasibility to final validation;
- Increased precision through models parameterization to assess new
process and new materials and their properties, to accurately predictspringback behaviour and surface quality problems;
- Seamless simulation data transfer and management to keep track ofpart history at every stage in the process in order to check the performanceand the robustness of the product and its consistency as well;
- Optimal exploitation of the available computers resources incustomizable extended collaborative environment.
These new requirements in sheet metal forming urged the necessity ofa new generation of virtual stamping software.
I.E .4 – New Generation of Sheet Metal Forming Programs
7/23/2019 Al Azraq Ingegneria Chimica Dei Materiali e Della Produzione
http://slidepdf.com/reader/full/al-azraq-ingegneria-chimica-dei-materiali-e-della-produzione 159/419
Section I
I.E . Simulation of PlasticDeformation Processes Al Azraq Soliman M.S
Numerical Simulation of Metal Sheet Plastic Deformation Page 150through Finite Element Method
The previous point clearly indicated that there is a need for a completeintegrated scalable streamlined stamping solution, covering the entire design
process from part design through die design and die evaluation, tuning andvalidation of the process.
Actually, the new solution is the result of years of innovative approachwhere several industry leaders are involved not only in the validation phase,but already from the early specification phase. An example of this is theStamping Simulation Development Group, which was initiated in 2000, andrepresents leaders from the European automotive industry.
First, each company developed their own systems in order to meet theirspecific needs. However, such original systems have become obsolete. Thereason is that the commercial systems have become strong, integrating
many functions and achieving user friendliness, while in-house systems havefound it difficult to maintain their quality without making further investments,which each individual company could not afford.
Depending on the objective of the simulation work, sheet-formingprograms can be subdivided into the following 3 main areas: One Step,Incremental and Die Design programs.
The first two types of forming simulation are used to assess partsmanufacturing feasibility, while the third is focused on the design of thetools.
One Step “Inverse” Programs
One-step forming simulation provides designers with an indication ofmanufacturing feasibility. Here, the analysis does not simulate the completeforming process because it is performed without any tooling boundarycondition input. One-step simulation uses only material data and thegeometry of a designed part to calculate material strains by mapping back tothe flat sheet. Feasibility is determined by comparison with the forming limitof the material.
These programs work in reverse to what is normally expected from asimulation program. The part geometry with or without addendum is
‘unfolded’ back to the flat blank shape or to a curved blankholder profile. AOne Step simulation can be used to assess very quickly whether the part isfeasible by predicting material thickness distribution, cracks, wrinkles, plasticstrain and minimum blank outline.
Quicker than an Incremental simulation, an entire OneStep analysis willtypically take a few minutes even for complex parts, including the import ofpart geometry from CAD, the automatic filling of holes and the specificationof process parameters. Refinements to a basic OneStep simulation can bemade by including the restraining effect of the addendum/flange area and
7/23/2019 Al Azraq Ingegneria Chimica Dei Materiali e Della Produzione
http://slidepdf.com/reader/full/al-azraq-ingegneria-chimica-dei-materiali-e-della-produzione 160/419
Section I
I.E . Simulation of PlasticDeformation Processes Al Azraq Soliman M.S
Numerical Simulation of Metal Sheet Plastic Deformation Page 151through Finite Element Method
the application of binder force and friction. The addendum can be generatedautomatically from part and binder surface geometry by specifying punch
opening and flange boundary lines. A full tool analysis can also be performedif the CAD geometry is available or has been created in a ‘Die Designer’system.
In a typical One Step application, the engineer will begin with only thepart geometry and perhaps some idea of the likely punch opening line of thetools and the final outline of the drawn sheet (‘the flange boundary’).
After inputting this information, to perform the simulation, the programcreates a mesh of the entire drawn sheet, including the addendum andflange areas, and fills holes and missing zones in the CAD geometry wherenecessary. During this stage, the mesh is automatically refined with smaller
elements in areas of higher curvature and strain gradients to maximiseaccuracy. Then, a OneStep program such as AutoForm-OneStep ‘unfolds’ thesheet to predict the minimum blank outline and make a formabilityassessment of the final part (wrinkles, cracks, thinning etc). Then it ispossible to analyse, for example, the final thickness distribution.
Incremental Programs
Incremental forming simulations model the entire forming process.
Here, the analysis inputs include the part and the tool geometry, the materialproperties of the part, the blank size and shape, frictional coefficient, pressconditions and the drawbead effects. The outputs show levels anddistribution of material strain, failure prediction, thickness profiles andwrinkling tendency.
These programs offer a full process model that simulates the formingstages as accurately as possible in the logical order, from blankholder closingto final flanging. Consequently, incremental simulations are computationallymore intensive than the equivalent One-step analysis, and require toolinginformation to be input.
There are two types of incremental code based on either ‘implicit’ or ‘explicit’ mathematical formulations.
As a ‘virtual tryout’ of the production method, an incremental simulationwill often be used to simulate the entire stamping process, with capabilitiesto model the initial deflection of the sheet due to gravity, blankholderclosing, first draws and restrikes, sheet repositioning, cutting operations,flanging and springback. Some codes can also simulate hydro-mechanical(fluid forming) processes for sheets and tubes.
Some advantages of simulation for die manufacturing are theminimisation of blank utilisation, allowing binder and die surface sizes to bekept to a minimum, for tool weight reductions; and the determination of
7/23/2019 Al Azraq Ingegneria Chimica Dei Materiali e Della Produzione
http://slidepdf.com/reader/full/al-azraq-ingegneria-chimica-dei-materiali-e-della-produzione 161/419
Section I
I.E . Simulation of PlasticDeformation Processes Al Azraq Soliman M.S
Numerical Simulation of Metal Sheet Plastic Deformation Page 152through Finite Element Method
kinematic and force requirements for production planning and pressselection.
Development trends in incremental forming simulation
The state-of-the-art in incremental FE-simulation of sheet metal formingincorporates a combined implicit and explicit integration of time. In general,tooling is described as rigid. Material can be described using shell elements,membrane elements or volume elements. With this type of simulation, it ispossible to generate first process parameters, which offers the possibility topredict problems prior to parts manufacturing.
Development trends in forming simulation consider new concepts suchas elastic die components, segmented blankholder, and springback behaviourof formed parts.
Die Design Tools
When tooling information is required in a OneStep or Incrementalanalysis, the creation of the tooling geometry using a traditional CAD systemis often very time-consuming, and can form a ‘bottleneck’ when trying to runseveral simulations quickly to optimise a die design. Consequently, simulation
programs now include integrated rapid die geometry creation tools thatenable tooling concepts to be designed and evaluated by simulation morequickly.
Developed specifically for automotive die designers, toolmakers andsheet metal stampers, additional surfaces are created for the addendum andblankholder areas of the tools. Moreover, if the die geometry isparametrically linked to the simulation, optimisation programs canautomatically modify the tools until the desired process is achieved.
I.E .5 – Springback Simulation
The automotive industry places rigid constraints on final shape anddimensional tolerances. Hence springback prediction and compensation iscritical in this highly automated environment.
In the past two decades, finite element method has proven to be apowerful tool in simulating sheet metal forming processes. With theincreasing demand from the industries to shorten the lead times and withincreased usage of lightweight, higher strength materials in manufacturingauto-body panels, the simulation of springback has become essential forproper design of the forming tools.
7/23/2019 Al Azraq Ingegneria Chimica Dei Materiali e Della Produzione
http://slidepdf.com/reader/full/al-azraq-ingegneria-chimica-dei-materiali-e-della-produzione 162/419
Section I
I.E . Simulation of PlasticDeformation Processes Al Azraq Soliman M.S
Numerical Simulation of Metal Sheet Plastic Deformation Page 153through Finite Element Method
Springback simulation is difficult and complicated; to obtain usefulresults requires accurate material and geometric description of the process in
the formulation.The interaction of the workpiece with the tooling needs to be described
precisely. Various approaches were adopted and formulated by researchers in the
past years to accurately simulate springback in sheet metal formingprocesses. Advances in springback simulation to reduce computational timeand increase overall efficiency of the process have been tremendous. Studiesinvolving the use of different types of materials models, finite element codes,elements, hardening rules, frictional constraints, etc., are reported inliterature [19,20,18,21-25].
Nilsson et al [26] simulated springback in V-die bending for severalmaterials neglecting friction. The true stress-strain curve from a tensile testwas used as the material description. They noted a good correlation betweensimulation and experimental results.
Huang and Leu [27] have used elasto-plastic incremental finite-elementcomputer code based on an updated Lagrangian formulation to simulate the
V-die bending process of sheet metal under the plane-strain condition.Isotropic and normal anisotropic material behaviour was considered includingnonlinear work hardening.
Huang et al [28] studied springback and springforward phenomena in V-bending process using an elasto-plastic incremental finite elementcalculation.
Ogawa et al. [29] did a somewhat similar study but used differentelement mesh sizes and compared their results with experimentalpredictions.
Lee and Yang [30] evaluated the numerical parameters that influencethe springback prediction by using FE analysis of a stamping process.
Song et al [31] have showed that a material property described by thekinematic hardening law provides a better prediction of springback than theisotropic hardening law. Analytical model and FEA results were comparedwith the experimental results.
Li et al. [32] used a linear hardening model and an elasto-plastic power-exponent hardening model to study the springback in V-free bending.
According to their results, the material-hardening mode directly affects thespringback simulation accuracy.
Geng et al [33] have also showed that the simulated springback angledepends intimately on both hardening law after the strain reversal and onthe plastic anisotropy. They have analyzed a series of draw bend-tests usinga new anisotropic hardening model that extends existing mixedkinematic/isotropic and non-linear kinematic formulations.
7/23/2019 Al Azraq Ingegneria Chimica Dei Materiali e Della Produzione
http://slidepdf.com/reader/full/al-azraq-ingegneria-chimica-dei-materiali-e-della-produzione 163/419
Section I
I.E . Simulation of PlasticDeformation Processes Al Azraq Soliman M.S
Numerical Simulation of Metal Sheet Plastic Deformation Page 154through Finite Element Method
Li et al. [34] compared the use of solid and shell elements in theirspringback simulation with 2D and 3D finite element modelling.
I.E .6. Bibliography :
16 Y Demeri and S. C Tang, “Post Processing Analysis in SheetMetal Forming Simulation,” JOM, June 1992, pp. 14-16.
17 ven K. Esche, Gary L Kinzel, and Taylan Altan, “Issues inConvergence Improvement for Non-Linear Finite ElementPrograms,” International Journal for Numerical Methods inEngineering, 40, 1997, pp. 4577-4594.
18 C Ho, J Lin, and T A Dean, “Integrated Numerical Procedures
for Simulating Springback in Creep Forming Using ABAQUS,” ABAQUS UK Users Group Conference, 2001.
19 . Tan, B. Persson and C. Magnusson, “An Empiric Model forControlling Springback in V-die Bending of Sheet Metals,”Journal of Materials Processing Technology, 34, 1992, pp. 449-455.
20 .C. Chu, “Elastic-Plastic Springback of Sheet Metals Subjectedto Complex Plane Strain Bending Histories,” International
Journal of Solids and Structures , 22, no. 10, 1986, pp.1071-1081.
21 orestin, F. Boivin, M. and Silva, C., “Elasto Plastic FormulationUsing a Kinematic Hardening Model for Springback Analysis inSheet Metal Forming,” Journal of Materials ProcessingTechnology, 56, 1996, pp. 619-630.
22 hang, L C and Lin, Z., “An Analytical Solution to Springback ofSheet Metals Stamped by Rigid Punch and an Elastic Die,”Journal of Materials Processing Technology, 63, 1997, pp. 49-
7/23/2019 Al Azraq Ingegneria Chimica Dei Materiali e Della Produzione
http://slidepdf.com/reader/full/al-azraq-ingegneria-chimica-dei-materiali-e-della-produzione 164/419
Section I
I.E . Simulation of PlasticDeformation Processes Al Azraq Soliman M.S
Numerical Simulation of Metal Sheet Plastic Deformation Page 155through Finite Element Method
54.
23
radley N. Maker, “Implicit Springback Calculation Using LS-DYNA,” 5th International LS-DYNA Users Conference, 21-22,Sept. Southfield, MI, USA, 1998.
24 embit M. Kutt, Jerrell A. Nardiello, Patricia L. Ogilvie et al, “Non-Linear Finit Element Analysis of Springback,”Communications in Numerical Methods in Engineering, 15,1999, pp. 33-42.
25 . Micari, A. Forcellese, L. Fratini, F. Gabrielli and N. Alberti,
“Springback Evaluation in Fully 3-D Sheet Metal FormingProcesses”.
26 nnika Nilsson, Lars Melin, Claes Magnusson, “Finite-ElementSimulation of VDie Bending: a Comparison with ExperimentalResults,” Journal of Materials Processing Technology, 65, 1997,pp. 52-58.
27 ou-Min Huang and Daw-Kwei Leu, “Effects of Process Variableson V-Die Bending Process of Steel Sheet,” International Journal
of Mechanical Sciences, 40, no. 7, 1998, pp. 631-650.
28 uang, Y. M., Lu, Y. H and Makinouchi, A., “Elasto-Plastic Finite-Element Analysis of V-Shape Sheet Bending,” Journal ofMaterials Processing Technology, 35, 1992, pp. 129-150.
29 gawa, H., Makinouchi, A., Takizawa, H., and Mori, N., “Development of an Elasto-Plastic FE Code for AccuratePrediction of Springback in Sheet Bending Processes and its
Validation by Experiments,” Advanced Technology of Plasticity1993 Proceedings of Fourth International Conference onTechnology of Plasticity, pp. 1641-1646.
30 ee, S W and Yang, D Y., “An Assessment of NumericalParameters Influencing Springback in Explicit Finite Element
Analysis of Sheet Metal Forming Process,” Journal of MaterialsProcessing Technology, 80-81, 1998, pp. 60-67.
31 an Song, Dong Qian, Jian Cao, et al., “Effective Models forPrediction of Springback in Flanging,” Transactions of the
ASME, 123, October 2001, pp. 456- 461.
7/23/2019 Al Azraq Ingegneria Chimica Dei Materiali e Della Produzione
http://slidepdf.com/reader/full/al-azraq-ingegneria-chimica-dei-materiali-e-della-produzione 165/419
Section I
I.E . Simulation of PlasticDeformation Processes Al Azraq Soliman M.S
Numerical Simulation of Metal Sheet Plastic Deformation Page 156through Finite Element Method
32 uechun Li, Yuying Yang, Yongzhi Wang Jun Bao and Shunping
Li, “Effect of the Material-Hardening Mode on the SpringbackSimulation Accuracy of V-Free Bending,” Journal of MaterialsProcessing Technology, 123, 2002, pp. 209-211.
33 .T. Keum, K.B Lee, “Sectional Finite Element Analysis ofForming Processes for Aluminum Alloy Sheet Metals,”International Journal of Mechanical Sciences, 42, 2000, pp.1911-1933.
34 . P. Li, W.P. Carden and R. H. Wagoner, “Simulation of
Springback”. International Journal of Mechanical Sciences, 44,2002, pp.103-122.
7/23/2019 Al Azraq Ingegneria Chimica Dei Materiali e Della Produzione
http://slidepdf.com/reader/full/al-azraq-ingegneria-chimica-dei-materiali-e-della-produzione 166/419
Section II.A
The First Test case is the impact of sphere in steel into sheetmetal
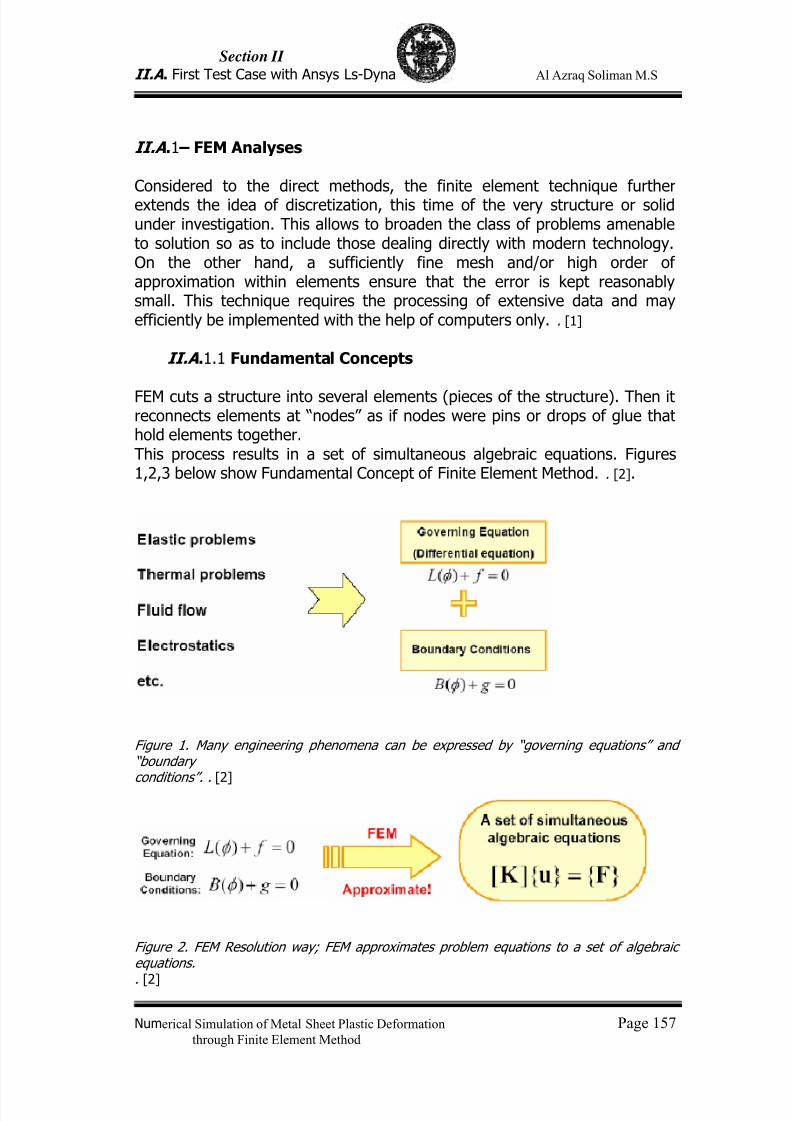
7/23/2019 Al Azraq Ingegneria Chimica Dei Materiali e Della Produzione
http://slidepdf.com/reader/full/al-azraq-ingegneria-chimica-dei-materiali-e-della-produzione 167/419
Section II
II.A . First Test Case with Ansys Ls-Dyna Al Azraq Soliman M.S
Numerical Simulation of Metal Sheet Plastic Deformation Page 157through Finite Element Method
II.A .1 – FEM Analyses
Considered to the direct methods, the finite element technique furtherextends the idea of discretization, this time of the very structure or solidunder investigation. This allows to broaden the class of problems amenableto solution so as to include those dealing directly with modern technology.On the other hand, a sufficiently fine mesh and/or high order ofapproximation within elements ensure that the error is kept reasonablysmall. This technique requires the processing of extensive data and mayefficiently be implemented with the help of computers only. . [1]
II.A .1.1 Fundamental Concepts
FEM cuts a structure into several elements (pieces of the structure). Then itreconnects elements at “nodes” as if nodes were pins or drops of glue thathold elements together.This process results in a set of simultaneous algebraic equations. Figures1,2,3 below show Fundamental Concept of Finite Element Method. . [2].
Figure 1. Many engineering phenomena can be expressed by “governing equations” and“boundaryconditions”. . [2]
Figure 2. FEM Resolution way; FEM approximates problem equations to a set of algebraicequations.
. [2]
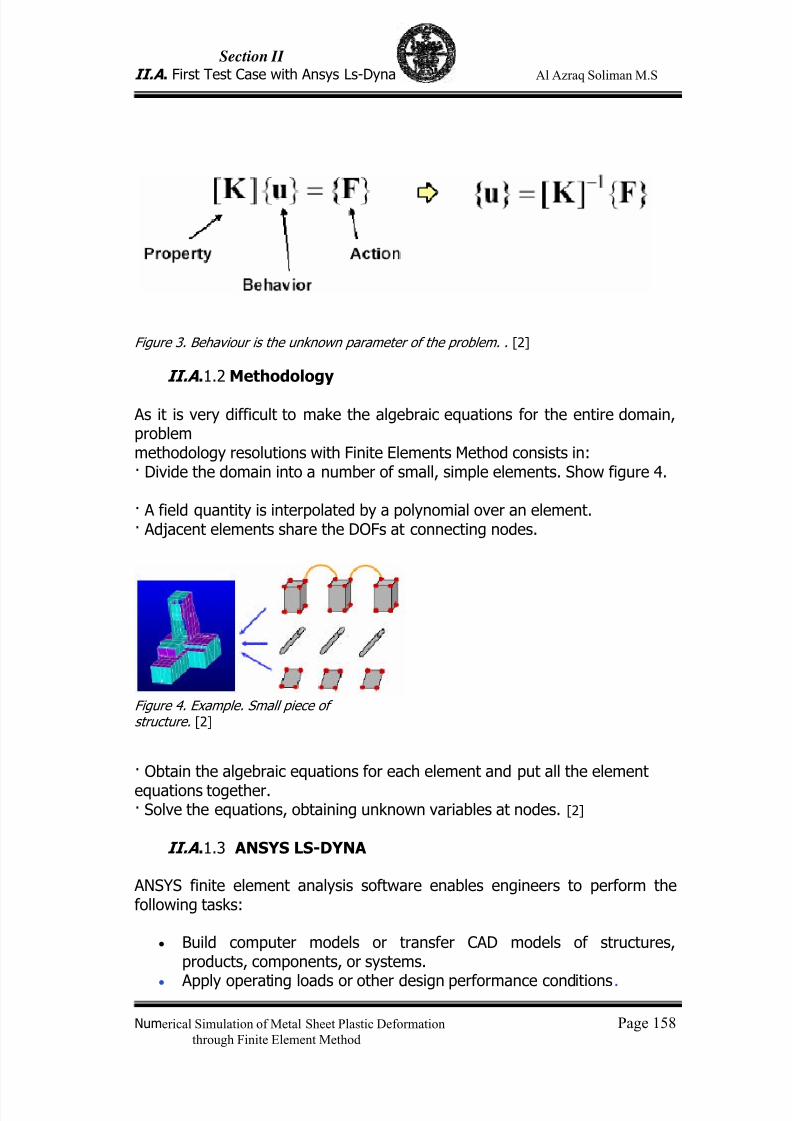
7/23/2019 Al Azraq Ingegneria Chimica Dei Materiali e Della Produzione
http://slidepdf.com/reader/full/al-azraq-ingegneria-chimica-dei-materiali-e-della-produzione 168/419
Section II
II.A . First Test Case with Ansys Ls-Dyna Al Azraq Soliman M.S
Numerical Simulation of Metal Sheet Plastic Deformation Page 158through Finite Element Method
Figure 3. Behaviour is the unknown parameter of the problem. . [2]
II.A .1.2 Methodology
As it is very difficult to make the algebraic equations for the entire domain,problemmethodology resolutions with Finite Elements Method consists in:· Divide the domain into a number of small, simple elements. Show figure 4.
· A field quantity is interpolated by a polynomial over an element.· Adjacent elements share the DOFs at connecting nodes.
Figure 4. Example. Small piece ofstructure. [2]
· Obtain the algebraic equations for each element and put all the element
equations together.· Solve the equations, obtaining unknown variables at nodes. [2]
II.A .1.3 ANSYS LS-DYNA
ANSYS finite element analysis software enables engineers to perform thefollowing tasks:
• Build computer models or transfer CAD models of structures,products, components, or systems.
• Apply operating loads or other design performance conditions.
7/23/2019 Al Azraq Ingegneria Chimica Dei Materiali e Della Produzione
http://slidepdf.com/reader/full/al-azraq-ingegneria-chimica-dei-materiali-e-della-produzione 169/419
Section II
II.A . First Test Case with Ansys Ls-Dyna Al Azraq Soliman M.S
Numerical Simulation of Metal Sheet Plastic Deformation Page 159through Finite Element Method
• Study physical responses, such as stress levels, temperaturedistributions, or electromagnetic fields.
• Optimize a design early in the development process to reduceproduction costs.
• Do prototype testing in environments where it otherwise would beundesirable or impossible (for example, biomedical applications).
The ANSYS program has a comprehensive graphical user interface (GUI) thatgives users easy, interactive access to program functions, commands,documentation, and reference material. An intuitive menu system helps usersnavigate through the ANSYS program. Users can input data using a mouse, akeyboard, or a combination of both. [3]
II.A .1.4 LS-DYNA
LS-DYNA is a general-purpose, explicit and implicit finite element programused toanalyze the nonlinear dynamic response of three-dimensional inelasticstructures. Its fully automated contact analysis capability and error-checkingfeatures have enabled users worldwide to solve successfully many complexcrash and forming problems.
ANSYS LS-DYNA supports both 2-D and 3-D explicit elements, and features
anextensive set of single-surface, surface-to-surface and node-to-surfacecontact as well asa contact analysis option that automatically creates the contact surfaces. ANSYS LSDYNA also gives optional methods for fast solution processing.LS-DYNA is used to solve multi-physics problems including solid mechanics,heattransfer, and fluid dynamics either as separate phenomena or as coupledphysics, e.g., thermal stress or fluid structure interaction. [4].
II.A .1.5 Material Models and Contacts
LS-DYNA has over one hundred metallic and non-metallic material models:Elastic,Nonlinear Elastic, Elastoplastic, Foam, Damage, Equations of State,Others.[5].Over 25 different contact options are available. These options primarily treatcontact of:deformable to deformable bodies, single surface contact in deformablebodies, and
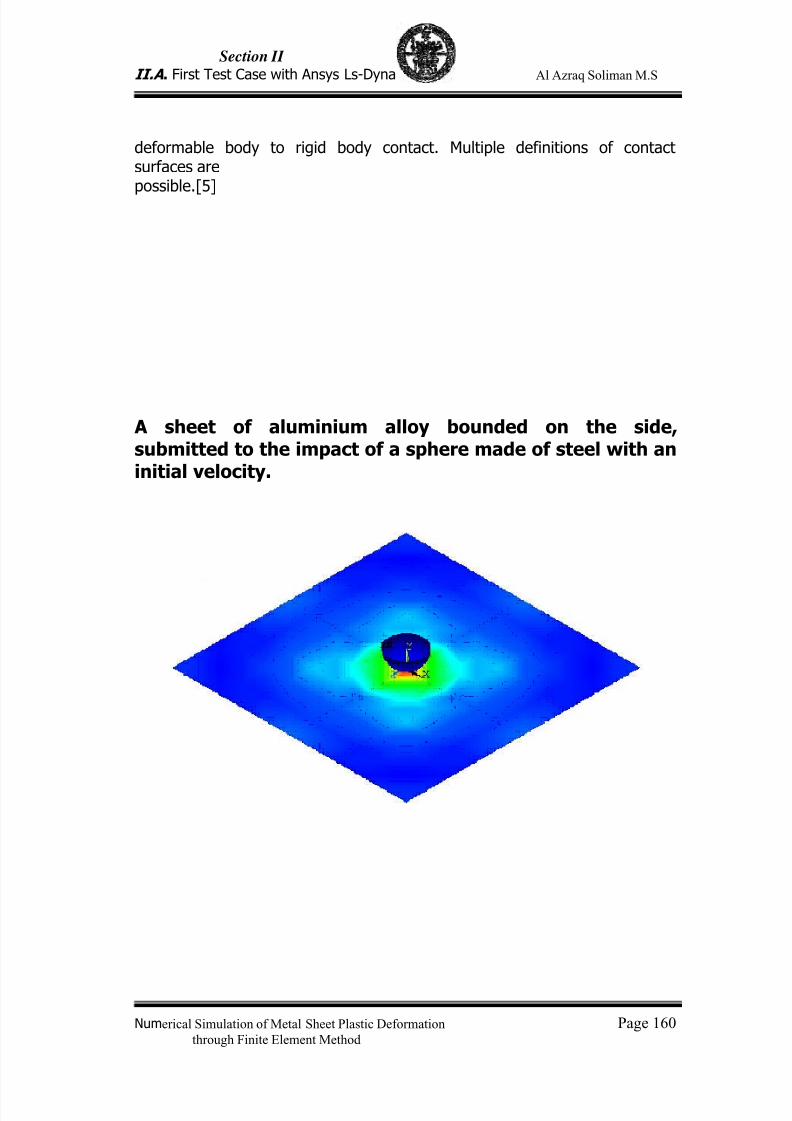
7/23/2019 Al Azraq Ingegneria Chimica Dei Materiali e Della Produzione
http://slidepdf.com/reader/full/al-azraq-ingegneria-chimica-dei-materiali-e-della-produzione 170/419
Section II
II.A . First Test Case with Ansys Ls-Dyna Al Azraq Soliman M.S
Numerical Simulation of Metal Sheet Plastic Deformation Page 160through Finite Element Method
deformable body to rigid body contact. Multiple definitions of contactsurfaces arepossible.[5]
A sheet of aluminium alloy bounded on the side,submitted to the impact of a sphere made of steel with aninitial velocity.
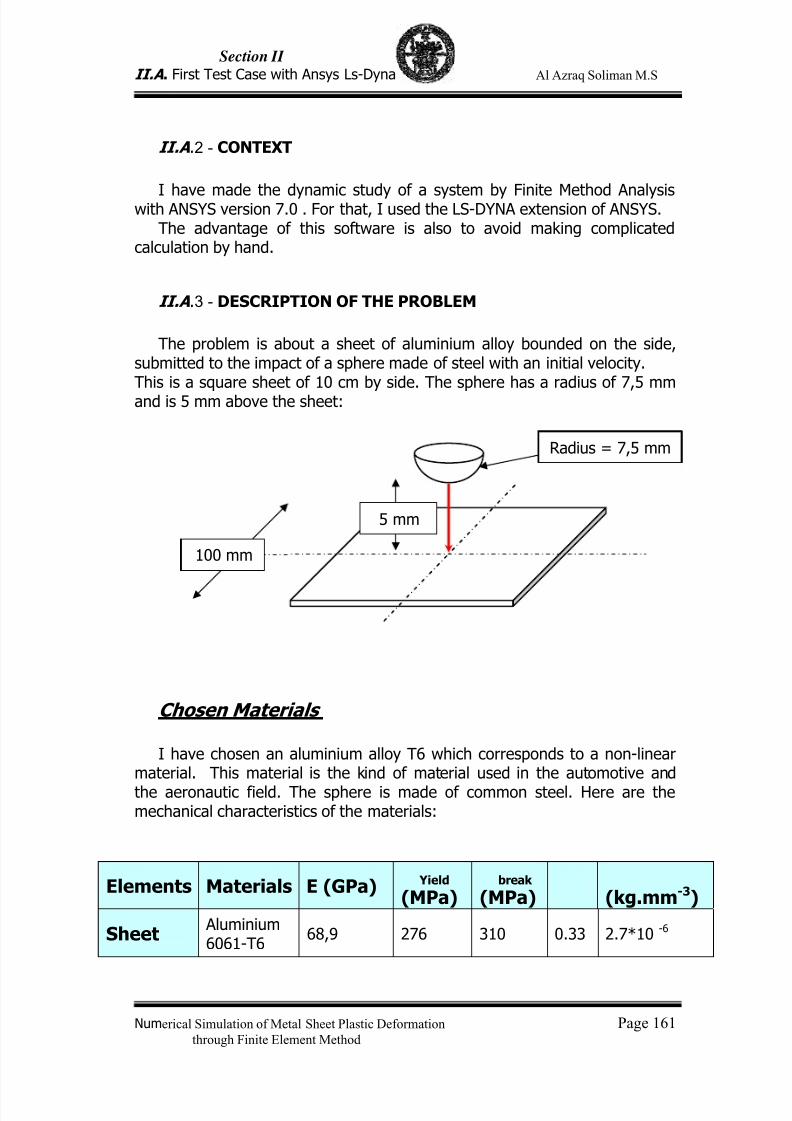
7/23/2019 Al Azraq Ingegneria Chimica Dei Materiali e Della Produzione
http://slidepdf.com/reader/full/al-azraq-ingegneria-chimica-dei-materiali-e-della-produzione 171/419
Section II
II.A . First Test Case with Ansys Ls-Dyna Al Azraq Soliman M.S
Numerical Simulation of Metal Sheet Plastic Deformation Page 161through Finite Element Method
II.A .2 - CONTEXT
I have made the dynamic study of a system by Finite Method Analysiswith ANSYS version 7.0 . For that, I used the LS-DYNA extension of ANSYS.The advantage of this software is also to avoid making complicated
calculation by hand.
II.A .3 - DESCRIPTION OF THE PROBLEM
The problem is about a sheet of aluminium alloy bounded on the side,submitted to the impact of a sphere made of steel with an initial velocity.This is a square sheet of 10 cm by side. The sphere has a radius of 7,5 mmand is 5 mm above the sheet:
Chosen Materials
I have chosen an aluminium alloy T6 which corresponds to a non-linearmaterial. This material is the kind of material used in the automotive and
the aeronautic field. The sphere is made of common steel. Here are themechanical characteristics of the materials:
Elements Materials E (GPa) Yield
(MPa)break
(MPa)
(kg.mm-3)
Sheet Aluminium6061-T6
68,9 276 310 0.33 2.7*10 -6
100 mm
Radius = 7,5 mm
5 mm
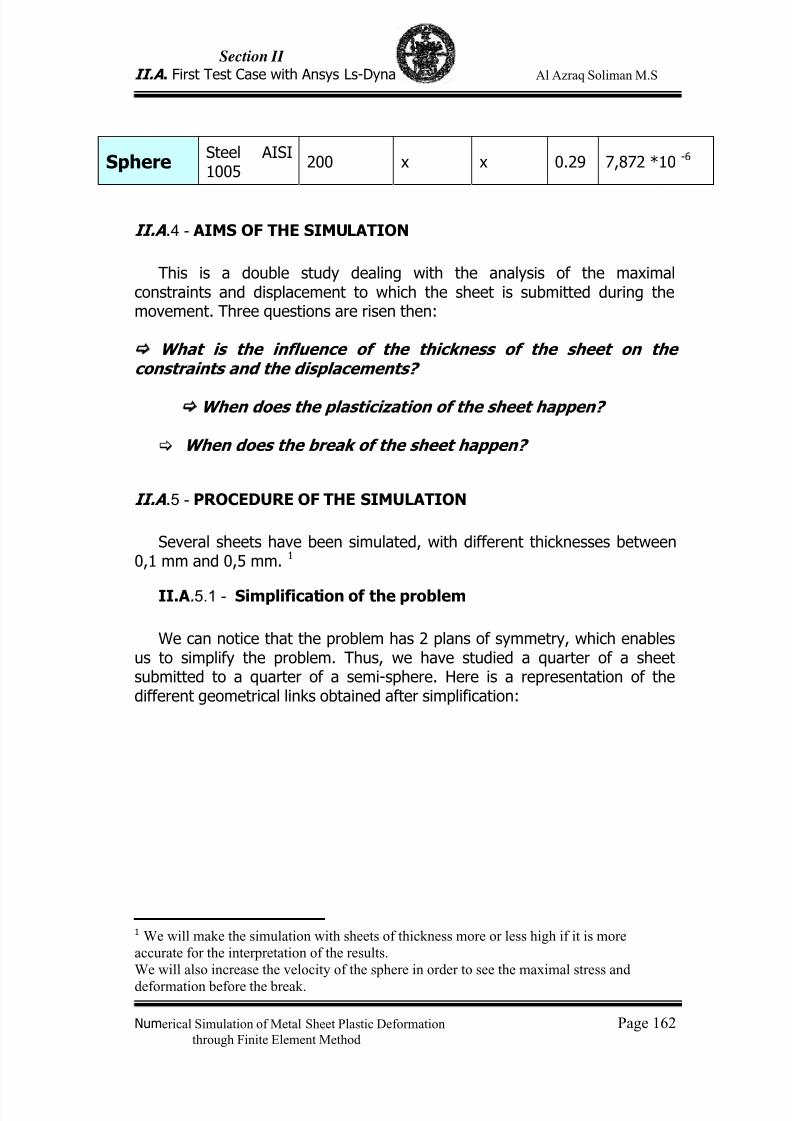
7/23/2019 Al Azraq Ingegneria Chimica Dei Materiali e Della Produzione
http://slidepdf.com/reader/full/al-azraq-ingegneria-chimica-dei-materiali-e-della-produzione 172/419
Section II
II.A . First Test Case with Ansys Ls-Dyna Al Azraq Soliman M.S
Numerical Simulation of Metal Sheet Plastic Deformation Page 162through Finite Element Method
SphereSteel AISI1005
200 x x 0.29 7,872 *10 -6
II.A .4 - AIMS OF THE SIMULATION
This is a double study dealing with the analysis of the maximalconstraints and displacement to which the sheet is submitted during themovement. Three questions are risen then:
What is the influence of the thickness of the sheet on the
constraints and the displacements?
When does the plasticization of the sheet happen?
When does the break of the sheet happen?
II.A .5 - PROCEDURE OF THE SIMULATION
Several sheets have been simulated, with different thicknesses between0,1 mm and 0,5 mm. 1
II.A.5.1 - Simplification of the problem
We can notice that the problem has 2 plans of symmetry, which enablesus to simplify the problem. Thus, we have studied a quarter of a sheetsubmitted to a quarter of a semi-sphere. Here is a representation of thedifferent geometrical links obtained after simplification:
1 We will make the simulation with sheets of thickness more or less high if it is more
accurate for the interpretation of the results.
We will also increase the velocity of the sphere in order to see the maximal stress and
deformation before the break.
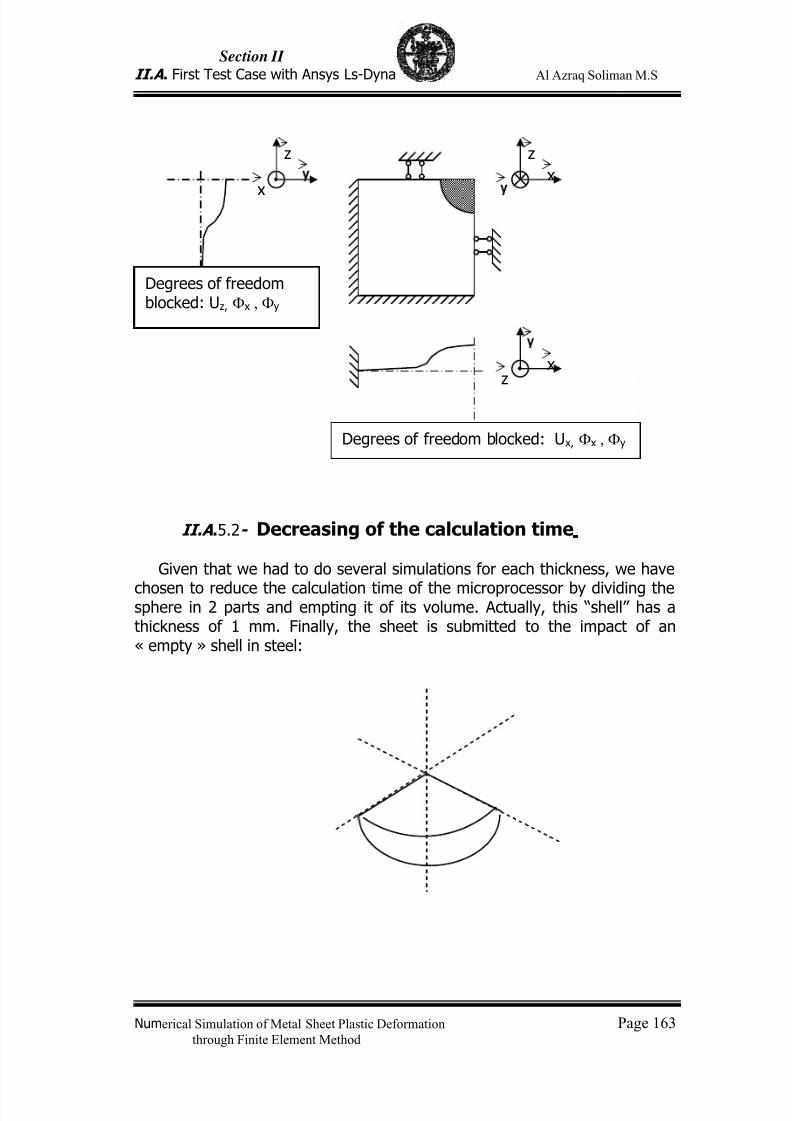
7/23/2019 Al Azraq Ingegneria Chimica Dei Materiali e Della Produzione
http://slidepdf.com/reader/full/al-azraq-ingegneria-chimica-dei-materiali-e-della-produzione 173/419
Section II
II.A . First Test Case with Ansys Ls-Dyna Al Azraq Soliman M.S
Numerical Simulation of Metal Sheet Plastic Deformation Page 163through Finite Element Method
II.A .5.2- Decreasing of the calculation time
Given that we had to do several simulations for each thickness, we have
chosen to reduce the calculation time of the microprocessor by dividing thesphere in 2 parts and empting it of its volume. Actually, this “shell” has athickness of 1 mm. Finally, the sheet is submitted to the impact of an« empty » shell in steel:
z
x
z
x
Degrees of freedomblocked: Uz, Φx , Φy
xz
Degrees of freedom blocked: Ux, Φx , Φy
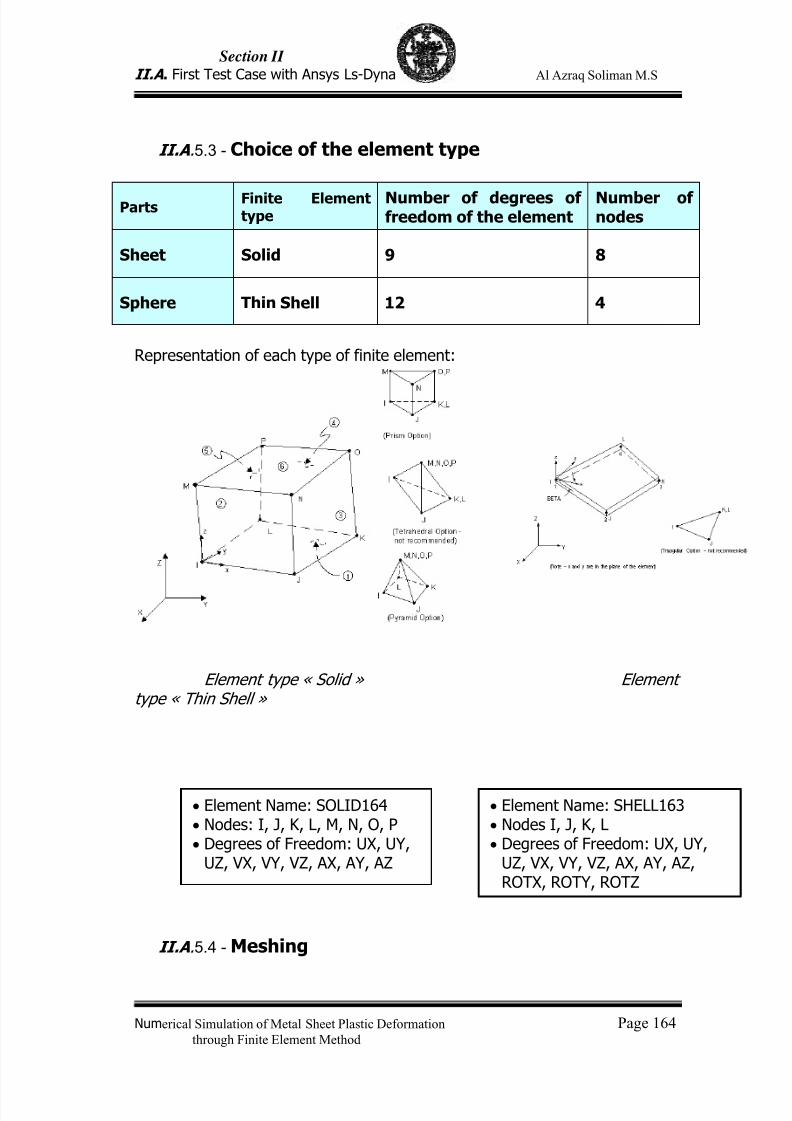
7/23/2019 Al Azraq Ingegneria Chimica Dei Materiali e Della Produzione
http://slidepdf.com/reader/full/al-azraq-ingegneria-chimica-dei-materiali-e-della-produzione 174/419
Section II
II.A . First Test Case with Ansys Ls-Dyna Al Azraq Soliman M.S
Numerical Simulation of Metal Sheet Plastic Deformation Page 164through Finite Element Method
II.A .5.3 - Choice of the element type
Parts Finite Elementtype
Number of degrees offreedom of the element
Number ofnodes
Sheet Solid 9 8
Sphere Thin Shell 12 4
Representation of each type of finite element:
Element type « Solid » Elementtype « Thin Shell »
II.A .5.4 - Meshing
• Element Name: SOLID164• Nodes: I, J, K, L, M, N, O, P• Degrees of Freedom: UX, UY,
UZ, VX, VY, VZ, AX, AY, AZ
• Element Name: SHELL163• Nodes I, J, K, L• Degrees of Freedom: UX, UY,
UZ, VX, VY, VZ, AX, AY, AZ,ROTX, ROTY, ROTZ
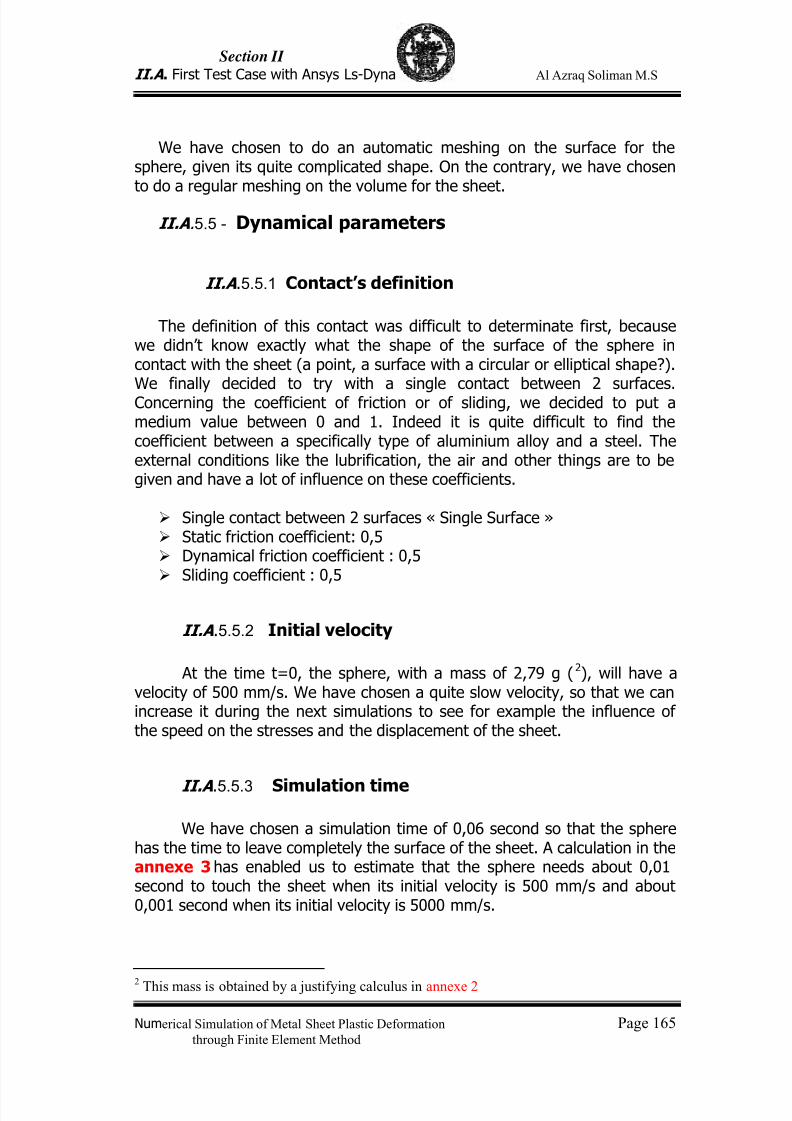
7/23/2019 Al Azraq Ingegneria Chimica Dei Materiali e Della Produzione
http://slidepdf.com/reader/full/al-azraq-ingegneria-chimica-dei-materiali-e-della-produzione 175/419
Section II
II.A . First Test Case with Ansys Ls-Dyna Al Azraq Soliman M.S
Numerical Simulation of Metal Sheet Plastic Deformation Page 165through Finite Element Method
We have chosen to do an automatic meshing on the surface for thesphere, given its quite complicated shape. On the contrary, we have chosento do a regular meshing on the volume for the sheet.
II.A .5.5 - Dynamical parameters
II.A .5.5.1 Contact’s definition
The definition of this contact was difficult to determinate first, becausewe didn’t know exactly what the shape of the surface of the sphere incontact with the sheet (a point, a surface with a circular or elliptical shape?).We finally decided to try with a single contact between 2 surfaces.Concerning the coefficient of friction or of sliding, we decided to put amedium value between 0 and 1. Indeed it is quite difficult to find thecoefficient between a specifically type of aluminium alloy and a steel. Theexternal conditions like the lubrification, the air and other things are to begiven and have a lot of influence on these coefficients.
Single contact between 2 surfaces « Single Surface » Static friction coefficient: 0,5 Dynamical friction coefficient : 0,5 Sliding coefficient : 0,5
II.A .5.5.2 Initial velocity
At the time t=0, the sphere, with a mass of 2,79 g (2), will have avelocity of 500 mm/s. We have chosen a quite slow velocity, so that we canincrease it during the next simulations to see for example the influence ofthe speed on the stresses and the displacement of the sheet.
II.A .5.5.3 Simulation time
We have chosen a simulation time of 0,06 second so that the spherehas the time to leave completely the surface of the sheet. A calculation in theannexe 3 has enabled us to estimate that the sphere needs about 0,01second to touch the sheet when its initial velocity is 500 mm/s and about0,001 second when its initial velocity is 5000 mm/s.
2 This mass is obtained by a justifying calculus in annexe 2
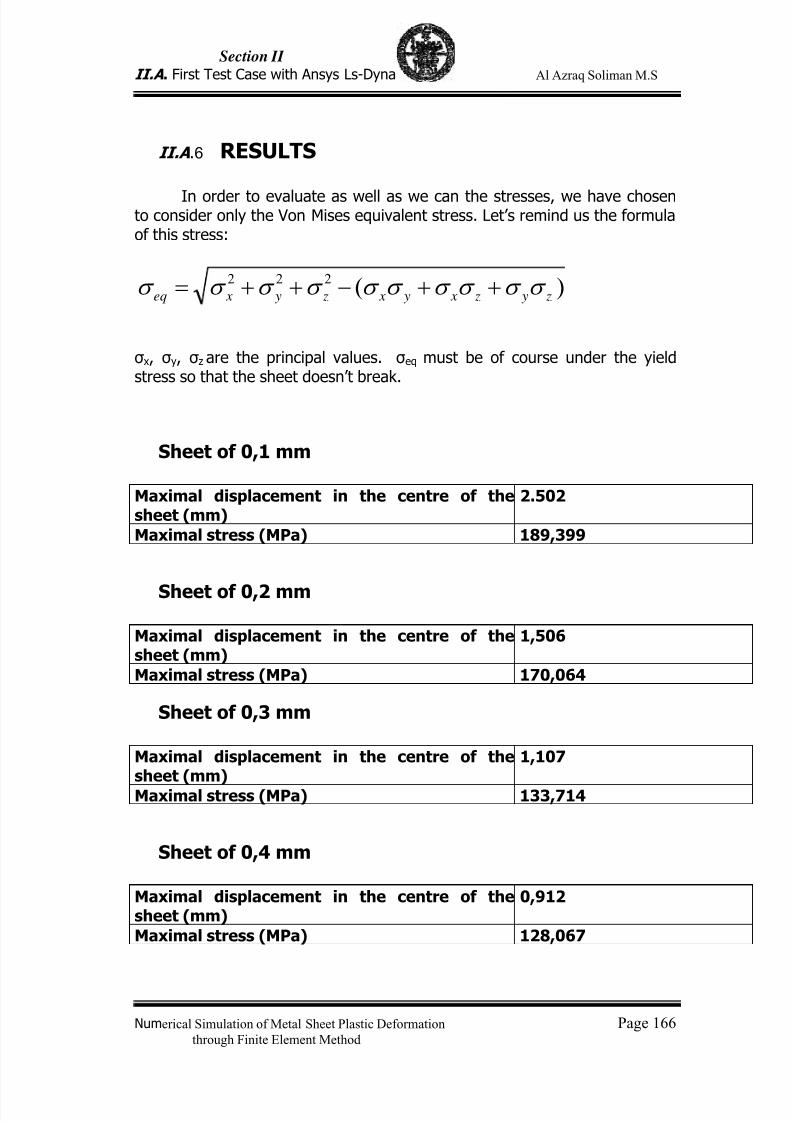
7/23/2019 Al Azraq Ingegneria Chimica Dei Materiali e Della Produzione
http://slidepdf.com/reader/full/al-azraq-ingegneria-chimica-dei-materiali-e-della-produzione 176/419
Section II
II.A . First Test Case with Ansys Ls-Dyna Al Azraq Soliman M.S
Numerical Simulation of Metal Sheet Plastic Deformation Page 166through Finite Element Method
II.A .6 RESULTS
In order to evaluate as well as we can the stresses, we have chosento consider only the Von Mises equivalent stress. Let’s remind us the formulaof this stress:
)(222
z y z x y x z y xeq σ σ σ σ σ σ σ σ σ σ ++−++=
σx, σy, σz are the principal values. σeq must be of course under the yieldstress so that the sheet doesn’t break.
Sheet of 0,1 mm
Maximal displacement in the centre of thesheet (mm)
2.502
Maximal stress (MPa) 189,399
Sheet of 0,2 mm
Maximal displacement in the centre of thesheet (mm)
1,506
Maximal stress (MPa) 170,064
Sheet of 0,3 mm
Maximal displacement in the centre of thesheet (mm)
1,107
Maximal stress (MPa) 133,714
Sheet of 0,4 mm
Maximal displacement in the centre of thesheet (mm)
0,912
Maximal stress (MPa) 128,067
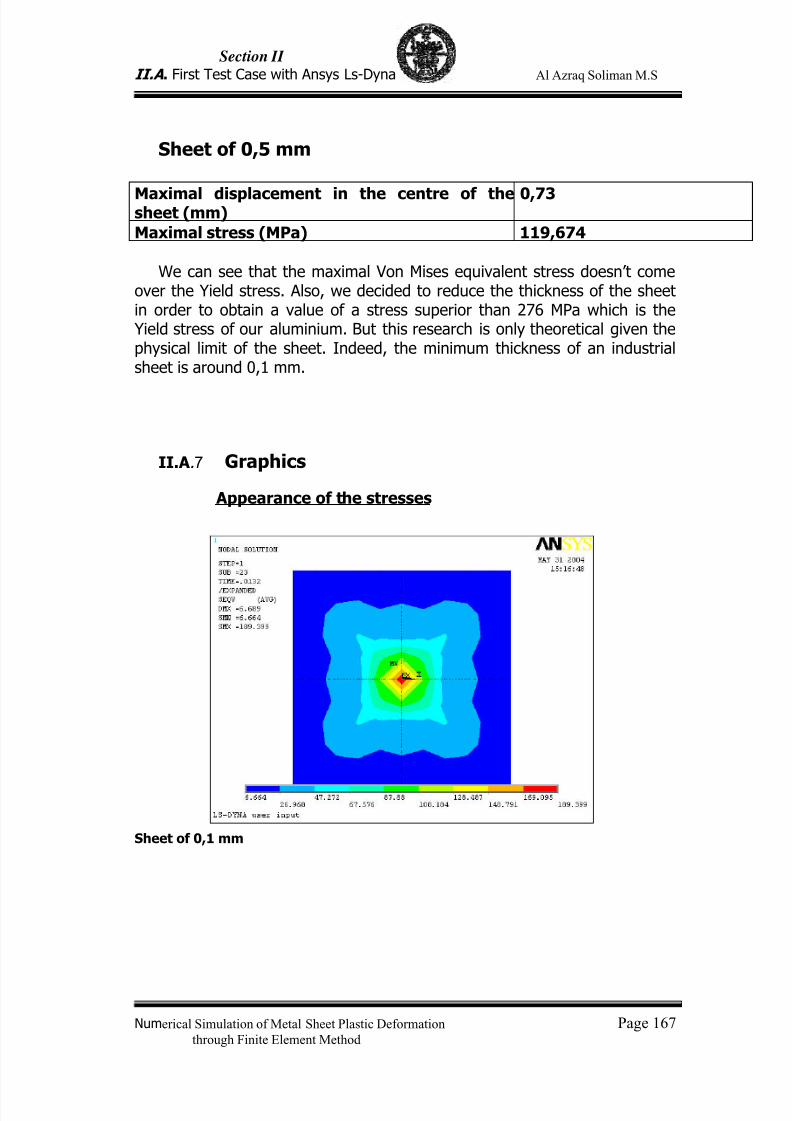
7/23/2019 Al Azraq Ingegneria Chimica Dei Materiali e Della Produzione
http://slidepdf.com/reader/full/al-azraq-ingegneria-chimica-dei-materiali-e-della-produzione 177/419
Section II
II.A . First Test Case with Ansys Ls-Dyna Al Azraq Soliman M.S
Numerical Simulation of Metal Sheet Plastic Deformation Page 167through Finite Element Method
Sheet of 0,5 mm
Maximal displacement in the centre of thesheet (mm)
0,73
Maximal stress (MPa) 119,674
We can see that the maximal Von Mises equivalent stress doesn’t comeover the Yield stress. Also, we decided to reduce the thickness of the sheetin order to obtain a value of a stress superior than 276 MPa which is the Yield stress of our aluminium. But this research is only theoretical given thephysical limit of the sheet. Indeed, the minimum thickness of an industrialsheet is around 0,1 mm.
II.A.7 Graphics
Appearance of the stresses
Sheet of 0,1 mm
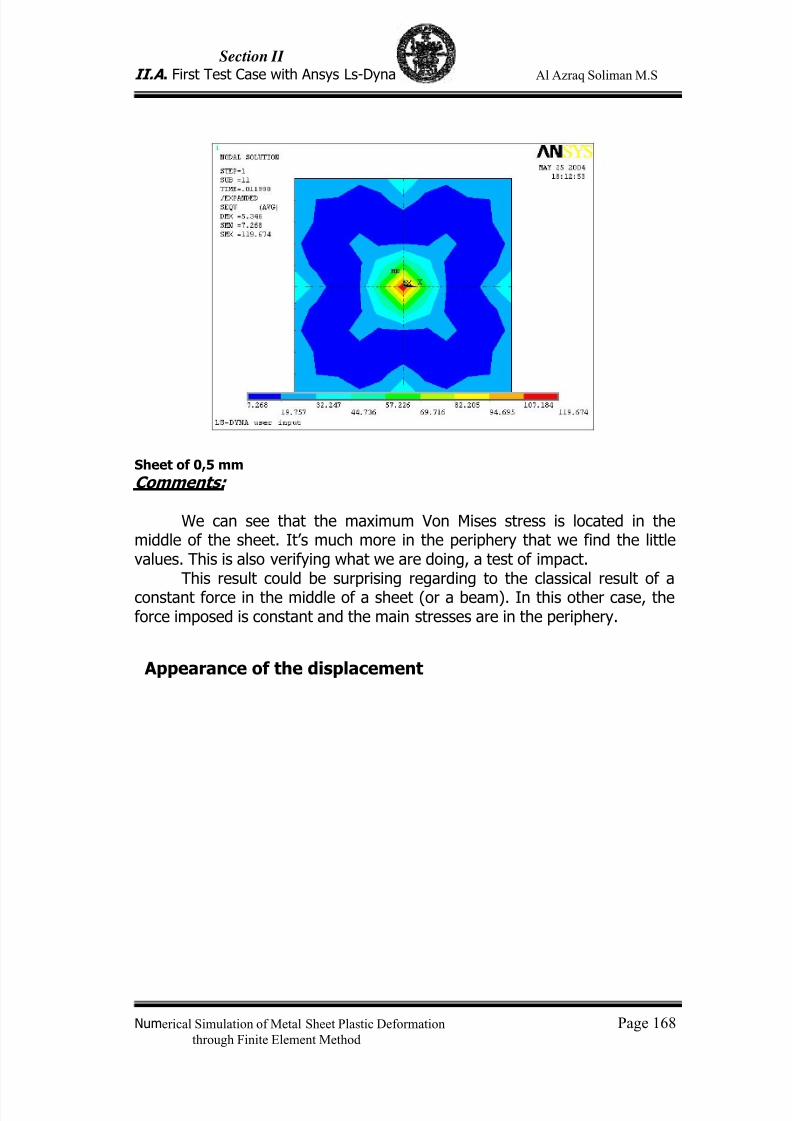
7/23/2019 Al Azraq Ingegneria Chimica Dei Materiali e Della Produzione
http://slidepdf.com/reader/full/al-azraq-ingegneria-chimica-dei-materiali-e-della-produzione 178/419
Section II
II.A . First Test Case with Ansys Ls-Dyna Al Azraq Soliman M.S
Numerical Simulation of Metal Sheet Plastic Deformation Page 168through Finite Element Method
Sheet of 0,5 mm
Comments:
We can see that the maximum Von Mises stress is located in themiddle of the sheet. It’s much more in the periphery that we find the littlevalues. This is also verifying what we are doing, a test of impact.
This result could be surprising regarding to the classical result of aconstant force in the middle of a sheet (or a beam). In this other case, theforce imposed is constant and the main stresses are in the periphery.
Appearance of the displacement

7/23/2019 Al Azraq Ingegneria Chimica Dei Materiali e Della Produzione
http://slidepdf.com/reader/full/al-azraq-ingegneria-chimica-dei-materiali-e-della-produzione 179/419
Section II
II.A . First Test Case with Ansys Ls-Dyna Al Azraq Soliman M.S
Numerical Simulation of Metal Sheet Plastic Deformation Page 169through Finite Element Method
Displacement for a sheet of 0,1 mm
Displacement for a sheet of 0,5 mm
Evolution of the stress of Von Mises in function of the time
7/23/2019 Al Azraq Ingegneria Chimica Dei Materiali e Della Produzione
http://slidepdf.com/reader/full/al-azraq-ingegneria-chimica-dei-materiali-e-della-produzione 180/419
Section II
II.A . First Test Case with Ansys Ls-Dyna Al Azraq Soliman M.S
Numerical Simulation of Metal Sheet Plastic Deformation Page 170through Finite Element Method
Sheet of 0,5 mm
Comments:
These curves enable us only to say that more the sheet is large andmore the stresses are irregular. We can see a phenomenon of vibration ofwhat we will speak further with more reliable curves.
Variation of the displacement in function of thedistance to the centre of the sheet
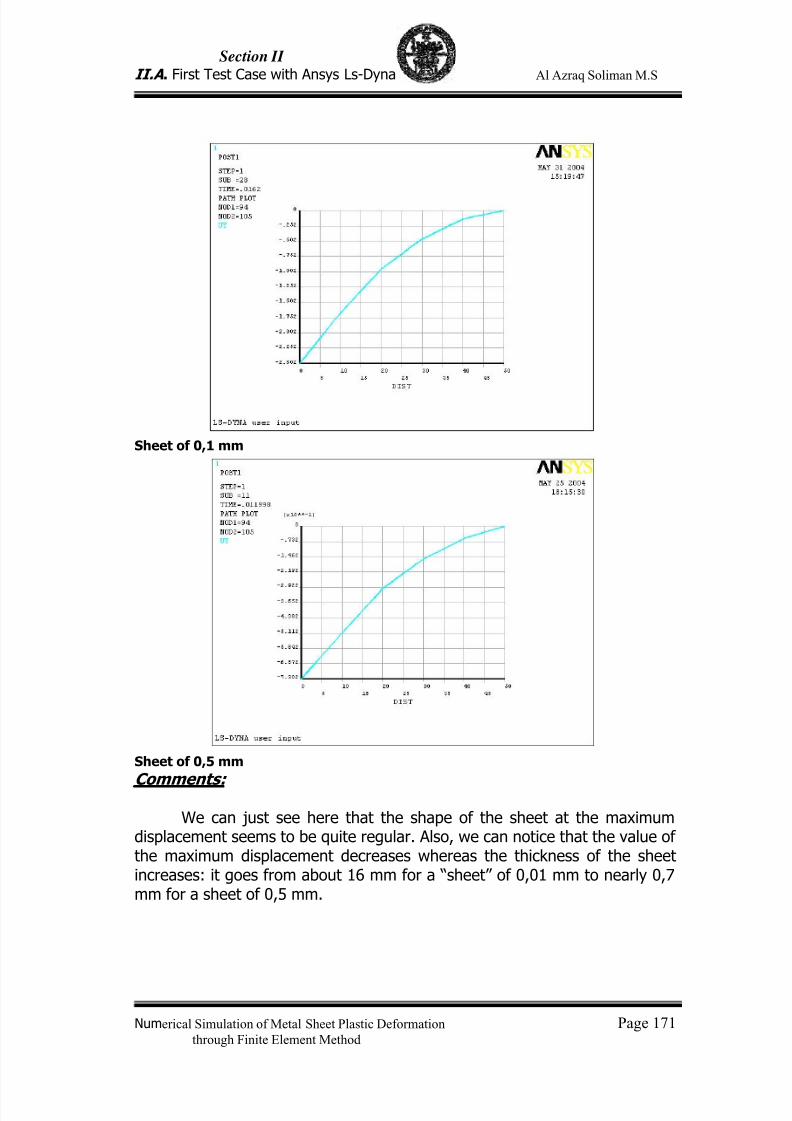
7/23/2019 Al Azraq Ingegneria Chimica Dei Materiali e Della Produzione
http://slidepdf.com/reader/full/al-azraq-ingegneria-chimica-dei-materiali-e-della-produzione 181/419
Section II
II.A . First Test Case with Ansys Ls-Dyna Al Azraq Soliman M.S
Numerical Simulation of Metal Sheet Plastic Deformation Page 171through Finite Element Method
Sheet of 0,1 mm
Sheet of 0,5 mm
Comments:
We can just see here that the shape of the sheet at the maximumdisplacement seems to be quite regular. Also, we can notice that the value ofthe maximum displacement decreases whereas the thickness of the sheetincreases: it goes from about 16 mm for a “sheet” of 0,01 mm to nearly 0,7mm for a sheet of 0,5 mm.
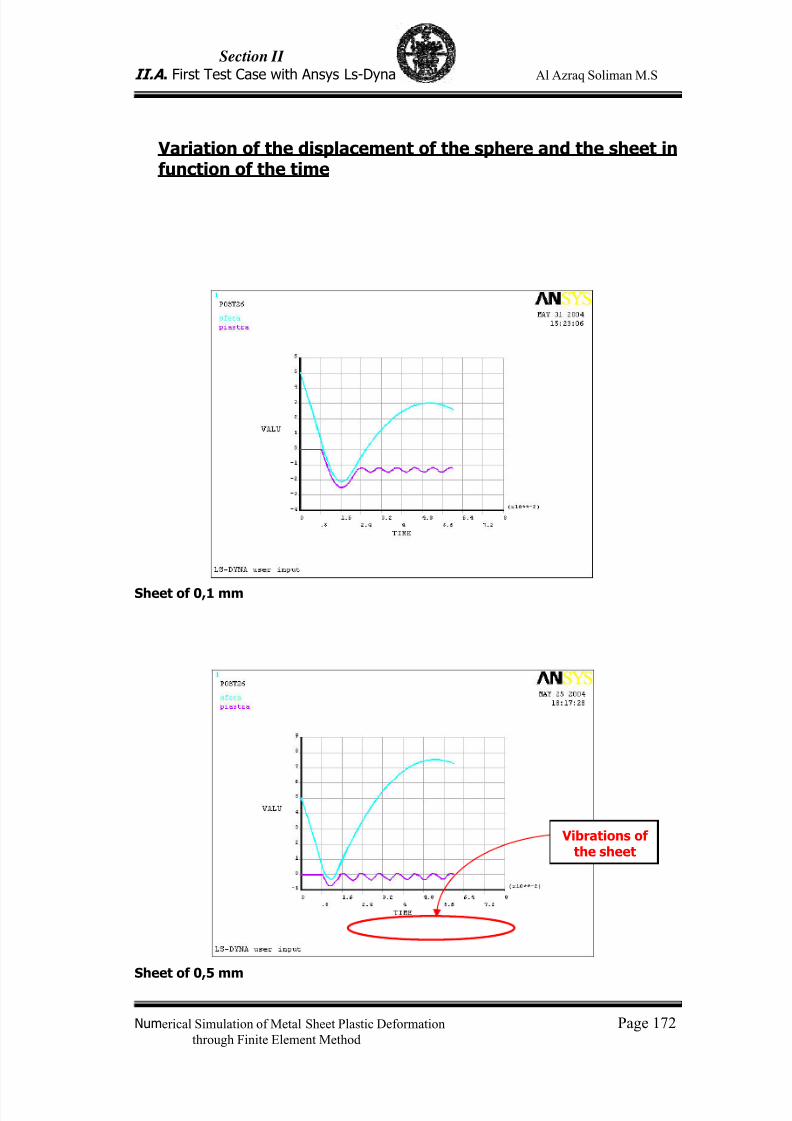
7/23/2019 Al Azraq Ingegneria Chimica Dei Materiali e Della Produzione
http://slidepdf.com/reader/full/al-azraq-ingegneria-chimica-dei-materiali-e-della-produzione 182/419
Section II
II.A . First Test Case with Ansys Ls-Dyna Al Azraq Soliman M.S
Numerical Simulation of Metal Sheet Plastic Deformation Page 172through Finite Element Method
Variation of the displacement of the sphere and the sheet infunction of the time
Sheet of 0,1 mm
Sheet of 0,5 mm
Vibrations ofthe sheet
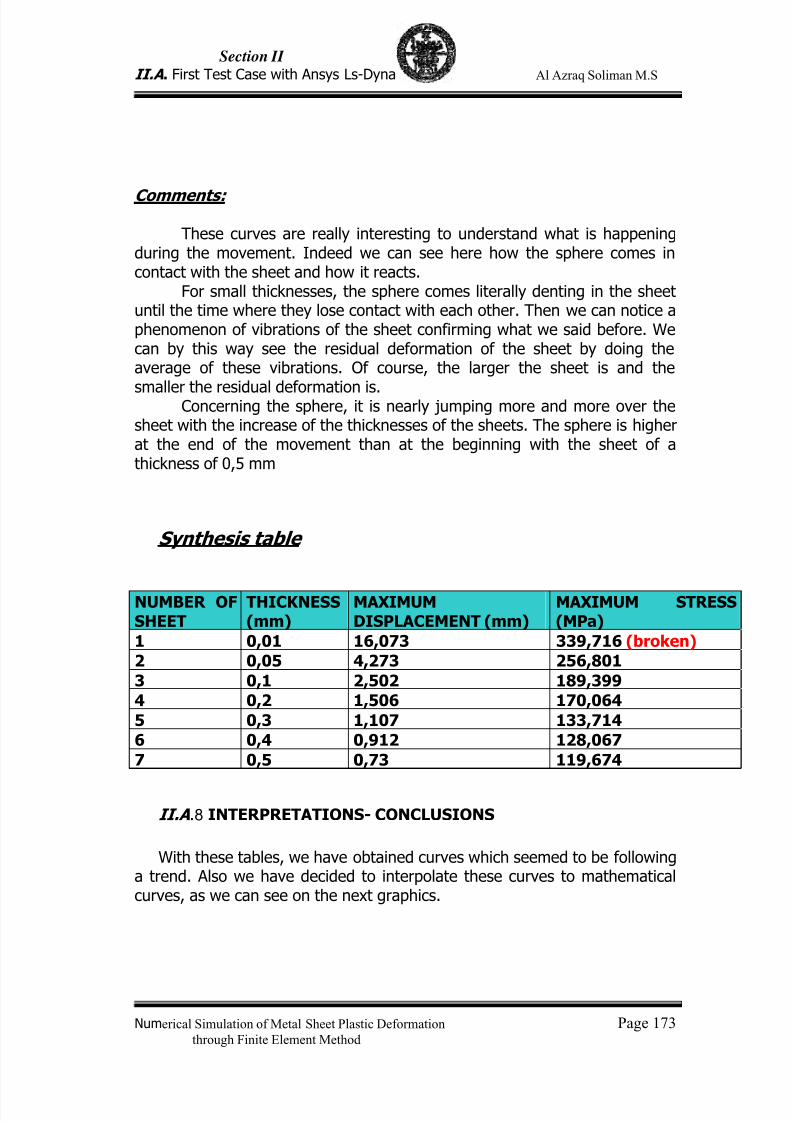
7/23/2019 Al Azraq Ingegneria Chimica Dei Materiali e Della Produzione
http://slidepdf.com/reader/full/al-azraq-ingegneria-chimica-dei-materiali-e-della-produzione 183/419
Section II
II.A . First Test Case with Ansys Ls-Dyna Al Azraq Soliman M.S
Numerical Simulation of Metal Sheet Plastic Deformation Page 173through Finite Element Method
Comments:
These curves are really interesting to understand what is happeningduring the movement. Indeed we can see here how the sphere comes incontact with the sheet and how it reacts.
For small thicknesses, the sphere comes literally denting in the sheetuntil the time where they lose contact with each other. Then we can notice aphenomenon of vibrations of the sheet confirming what we said before. Wecan by this way see the residual deformation of the sheet by doing theaverage of these vibrations. Of course, the larger the sheet is and the
smaller the residual deformation is.Concerning the sphere, it is nearly jumping more and more over thesheet with the increase of the thicknesses of the sheets. The sphere is higherat the end of the movement than at the beginning with the sheet of athickness of 0,5 mm
Synthesis table
NUMBER OFSHEET
THICKNESS(mm)
MAXIMUMDISPLACEMENT (mm)
MAXIMUM STRESS(MPa)
1 0,01 16,073 339,716 (broken)
2 0,05 4,273 256,801
3 0,1 2,502 189,399
4 0,2 1,506 170,064
5 0,3 1,107 133,714
6 0,4 0,912 128,067
7 0,5 0,73 119,674
II.A .8 INTERPRETATIONS- CONCLUSIONS
With these tables, we have obtained curves which seemed to be followinga trend. Also we have decided to interpolate these curves to mathematicalcurves, as we can see on the next graphics.
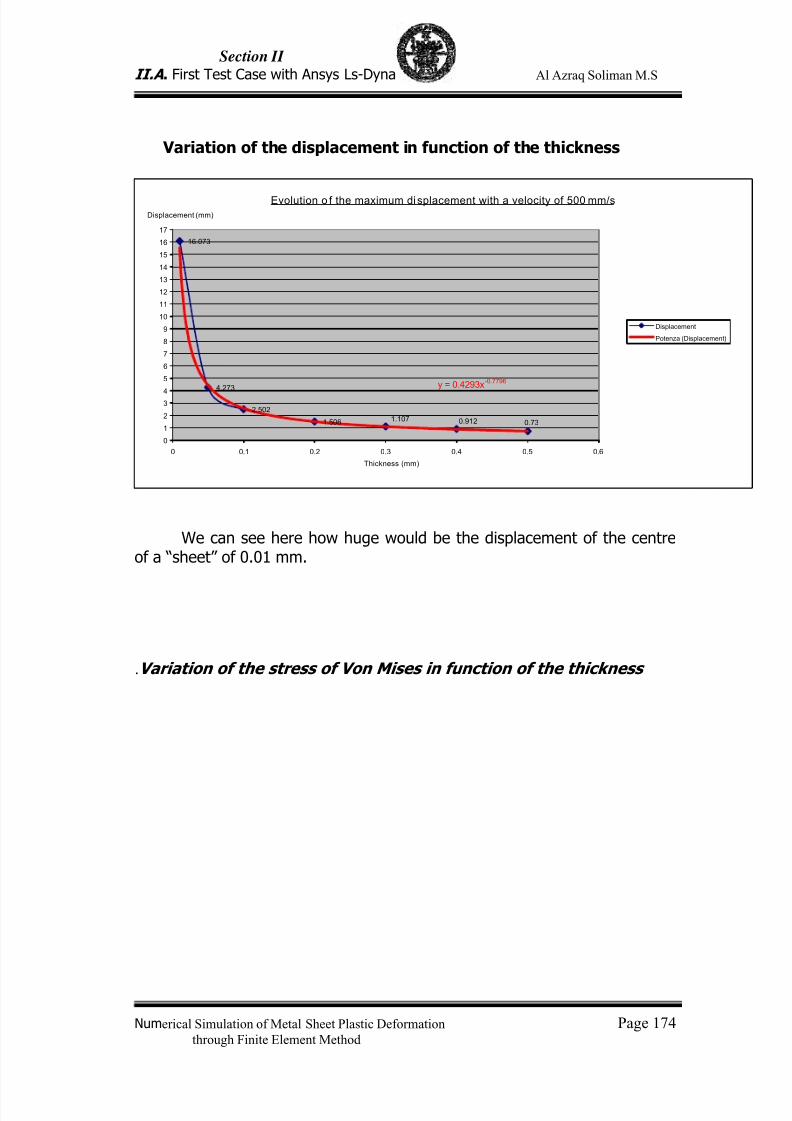
7/23/2019 Al Azraq Ingegneria Chimica Dei Materiali e Della Produzione
http://slidepdf.com/reader/full/al-azraq-ingegneria-chimica-dei-materiali-e-della-produzione 184/419
Section II
II.A . First Test Case with Ansys Ls-Dyna Al Azraq Soliman M.S
Numerical Simulation of Metal Sheet Plastic Deformation Page 174through Finite Element Method
Variation of the displacement in function of the thickness
Evolution o f the maximum di splacement with a velocity of 500 mm/s
16.073
4.273
2.502
1.506 1.107 0.912 0.73
y = 0.4293x-0.7796
0
1
2
34
5
6
7
8
9
10
11
12
13
14
15
16
17
0 0.1 0.2 0.3 0.4 0.5 0.6
Thickness (mm)
Displacement (mm)
Displacement
Potenza (Displacement)
We can see here how huge would be the displacement of the centreof a “sheet” of 0.01 mm.
.Variation of the stress of Von Mises in function of the thickness
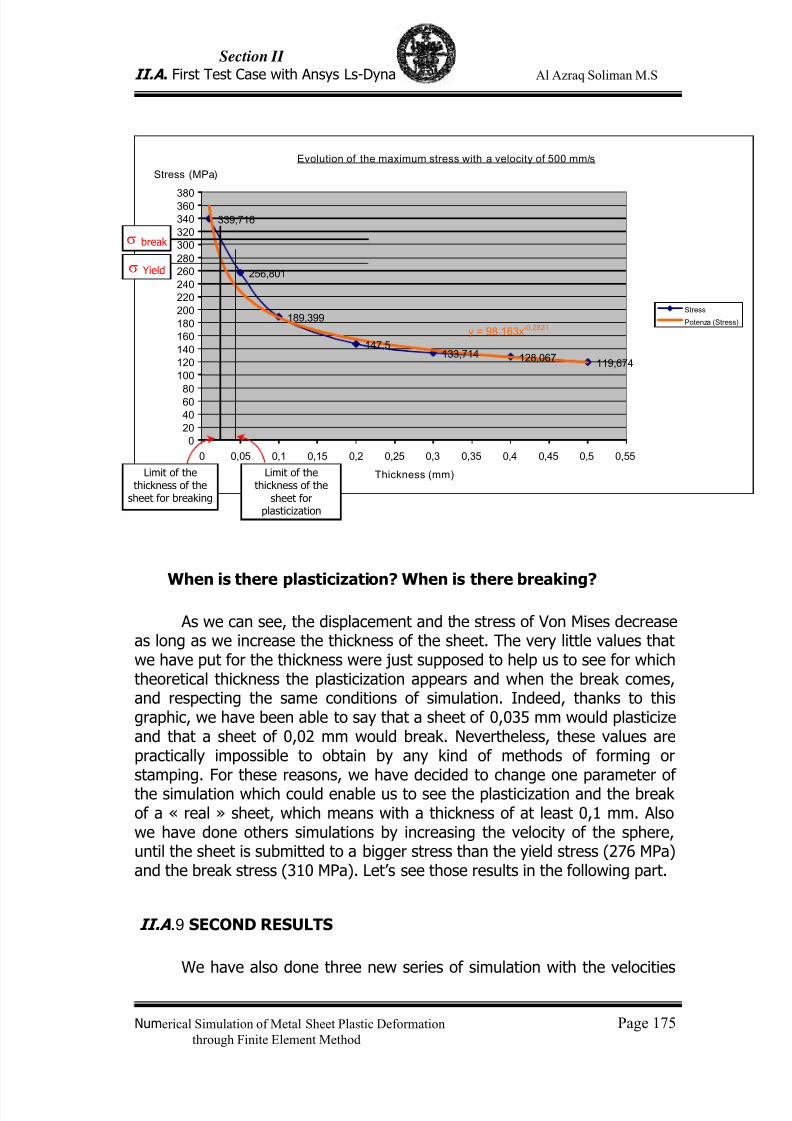
7/23/2019 Al Azraq Ingegneria Chimica Dei Materiali e Della Produzione
http://slidepdf.com/reader/full/al-azraq-ingegneria-chimica-dei-materiali-e-della-produzione 185/419
Section II
II.A . First Test Case with Ansys Ls-Dyna Al Azraq Soliman M.S
Numerical Simulation of Metal Sheet Plastic Deformation Page 175through Finite Element Method
Evolution of the maximum stress with a velocity of 500 mm/s
339,716
256,801
189,399
147,5133,714 128,067
119,674
y = 98,163x-0,2821
0
20
40
6080
100
120
140
160
180
200
220
240
260
280
300
320
340
360380
0 0,05 0,1 0,15 0,2 0,25 0,3 0,35 0,4 0,45 0,5 0,55
Thickness (mm)
Stress (MPa)
Stress
Potenza (Stress)
When is there plasticization? When is there breaking?
As we can see, the displacement and the stress of Von Mises decreaseas long as we increase the thickness of the sheet. The very little values thatwe have put for the thickness were just supposed to help us to see for whichtheoretical thickness the plasticization appears and when the break comes,and respecting the same conditions of simulation. Indeed, thanks to thisgraphic, we have been able to say that a sheet of 0,035 mm would plasticizeand that a sheet of 0,02 mm would break. Nevertheless, these values arepractically impossible to obtain by any kind of methods of forming orstamping. For these reasons, we have decided to change one parameter ofthe simulation which could enable us to see the plasticization and the breakof a « real » sheet, which means with a thickness of at least 0,1 mm. Alsowe have done others simulations by increasing the velocity of the sphere,until the sheet is submitted to a bigger stress than the yield stress (276 MPa)and the break stress (310 MPa). Let’s see those results in the following part.
II.A .9 SECOND RESULTS
We have also done three new series of simulation with the velocities
Limit of thethickness of the
sheet for breaking
σ break
σ Yield
Limit of thethickness of the
sheet forplasticization
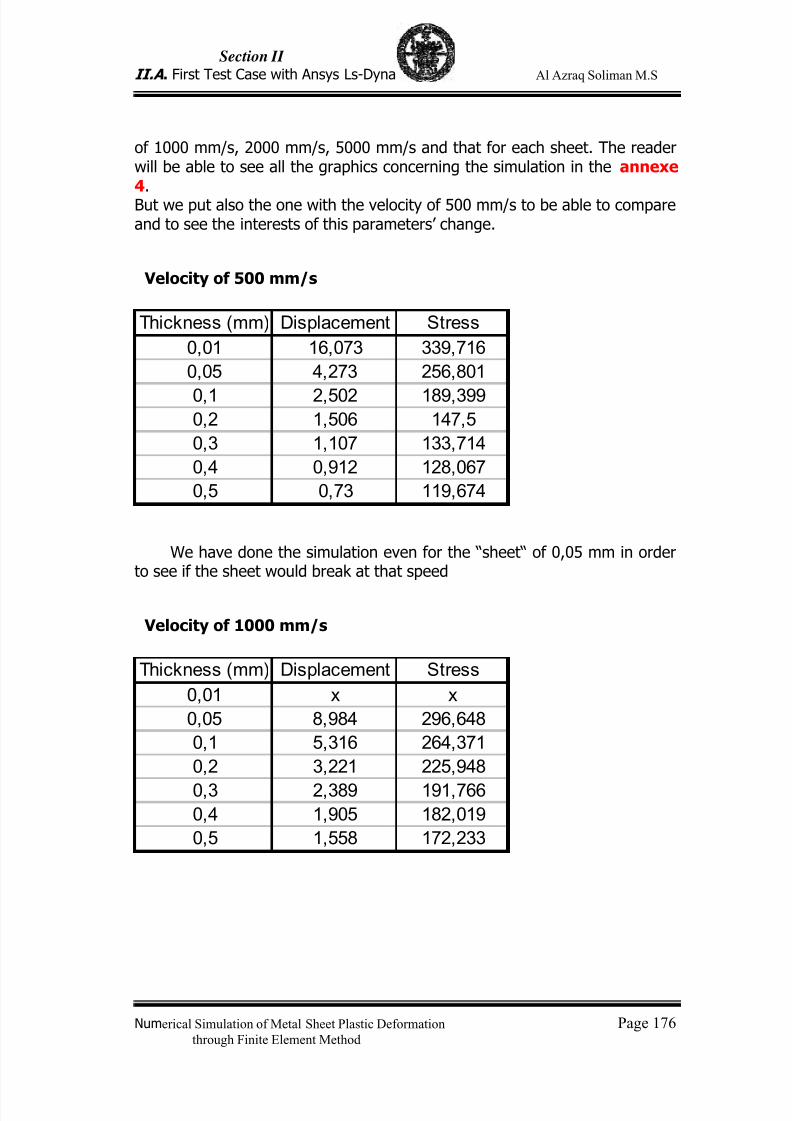
7/23/2019 Al Azraq Ingegneria Chimica Dei Materiali e Della Produzione
http://slidepdf.com/reader/full/al-azraq-ingegneria-chimica-dei-materiali-e-della-produzione 186/419
Section II
II.A . First Test Case with Ansys Ls-Dyna Al Azraq Soliman M.S
Numerical Simulation of Metal Sheet Plastic Deformation Page 176through Finite Element Method
of 1000 mm/s, 2000 mm/s, 5000 mm/s and that for each sheet. The readerwill be able to see all the graphics concerning the simulation in the annexe4.But we put also the one with the velocity of 500 mm/s to be able to compareand to see the interests of this parameters’ change.
Velocity of 500 mm/s
Thickness (mm) Displacement Stress
0,01 16,073 339,716
0,05 4,273 256,801
0,1 2,502 189,3990,2 1,506 147,5
0,3 1,107 133,714
0,4 0,912 128,067
0,5 0,73 119,674
We have done the simulation even for the “sheet“ of 0,05 mm in orderto see if the sheet would break at that speed
Velocity of 1000 mm/s
Thickness (mm) Displacement Stress
0,01 x x
0,05 8,984 296,648
0,1 5,316 264,371
0,2 3,221 225,948
0,3 2,389 191,7660,4 1,905 182,019
0,5 1,558 172,233
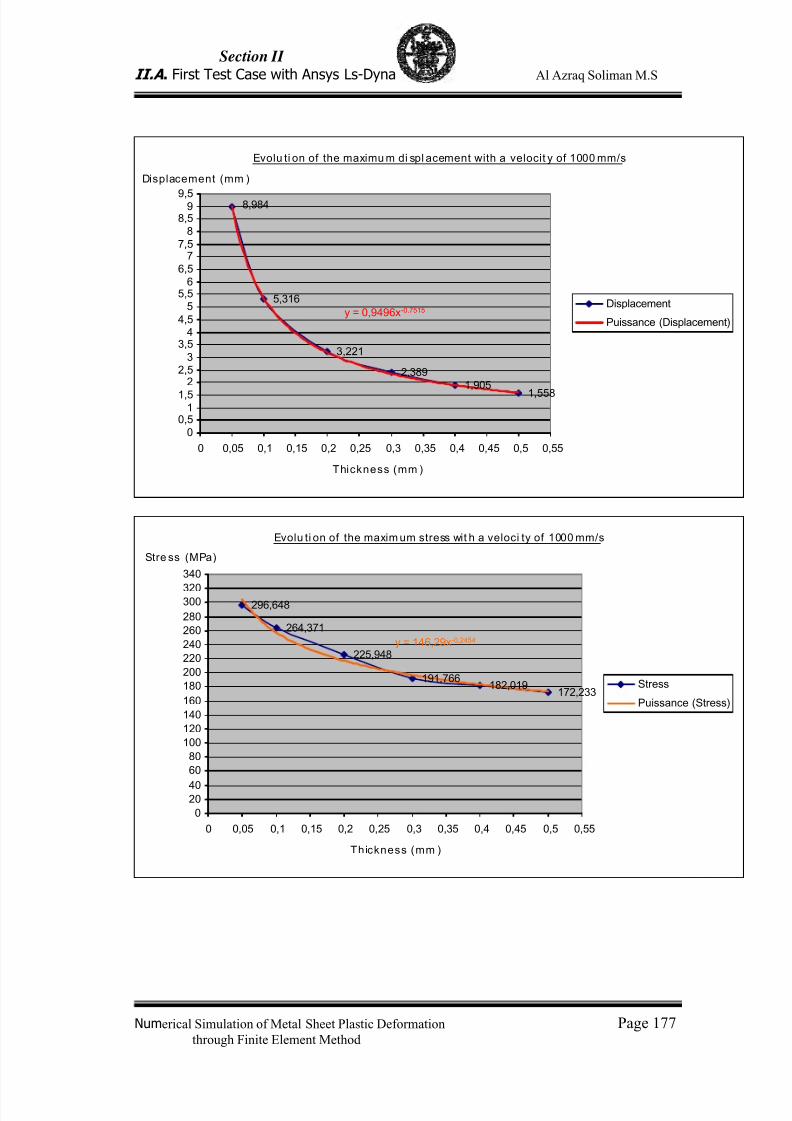
7/23/2019 Al Azraq Ingegneria Chimica Dei Materiali e Della Produzione
http://slidepdf.com/reader/full/al-azraq-ingegneria-chimica-dei-materiali-e-della-produzione 187/419
Section II
II.A . First Test Case with Ansys Ls-Dyna Al Azraq Soliman M.S
Numerical Simulation of Metal Sheet Plastic Deformation Page 177through Finite Element Method
Evolu ti on of the maximu m di spl acement with a velocit y of 1000 mm/s
5,316
3,221
2,389
1,9051,558
8,984
y = 0,9496x-0,7515
0
0,51
1,5
22,5
3
3,54
4,5
55,5
6
6,5
77,5
8
8,59
9,5
0 0,05 0,1 0,15 0,2 0,25 0,3 0,35 0,4 0,45 0,5 0,55
Thickness (mm )
Displacement (mm )
Displacement
Puissance (Displacement)
Evolu ti on of the maxim um stress wit h a veloci ty of 1000 mm/s
296,648
264,371
225,948
191,766182,019
172,233
y = 146,29x-0,2454
0
2040
60
80
100
120
140
160
180
200
220
240
260
280
300320
340
0 0,05 0,1 0,15 0,2 0,25 0,3 0,35 0,4 0,45 0,5 0,55
Thickness (mm )
Stre ss (MPa)
Stress
Puissance (Stress)
7/23/2019 Al Azraq Ingegneria Chimica Dei Materiali e Della Produzione
http://slidepdf.com/reader/full/al-azraq-ingegneria-chimica-dei-materiali-e-della-produzione 188/419
Section II
II.A . First Test Case with Ansys Ls-Dyna Al Azraq Soliman M.S
Numerical Simulation of Metal Sheet Plastic Deformation Page 178through Finite Element Method
Velocity of 2000 mm/s
Thickness (mm) Displacement Stress
0,01 x x
0,05 x x
0,1 12,707 316,532
0,2 7,759 283,497
0,3 5,775 263,617
0,4 4,707 248,092
0,5 3,98 230,228
Evolut io n of the maxi mum di spl acement with a veloci ty of 2000 mm/s
12,707
7,759
5,775
4,7073,98
y = 2,4259x -0,7202
0
1
2
3
4
5
6
7
8
9
10
11
12
13
14
0 0,1 0,2 0,3 0,4 0,5 0,6
Thickness (mm)
Displacement (mm)
Displacement
Puissance (Displacement)
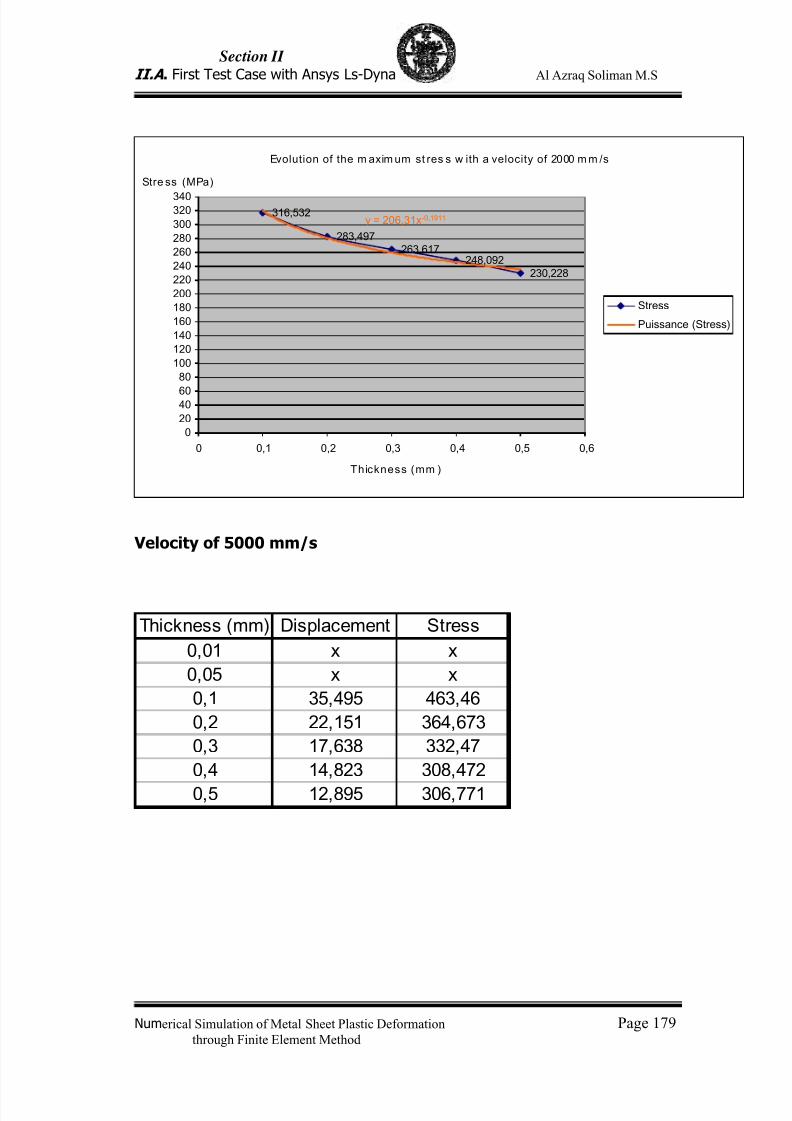
7/23/2019 Al Azraq Ingegneria Chimica Dei Materiali e Della Produzione
http://slidepdf.com/reader/full/al-azraq-ingegneria-chimica-dei-materiali-e-della-produzione 189/419
Section II
II.A . First Test Case with Ansys Ls-Dyna Al Azraq Soliman M.S
Numerical Simulation of Metal Sheet Plastic Deformation Page 179through Finite Element Method
Evolution of the m axim um st res s w ith a velocity of 2000 m m /s
316,532
283,497
263,617248,092
230,228
y = 206,31x-0,1911
0
20
4060
80
100
120
140
160
180
200
220
240
260
280
300
320340
0 0,1 0,2 0,3 0,4 0,5 0,6
Thickness (mm )
Stre ss (MPa)
Stress
Puissance (Stress)
Velocity of 5000 mm/s
Thickness (mm) Displacement Stress
0,01 x x
0,05 x x
0,1 35,495 463,46
0,2 22,151 364,673
0,3 17,638 332,47
0,4 14,823 308,472
0,5 12,895 306,771
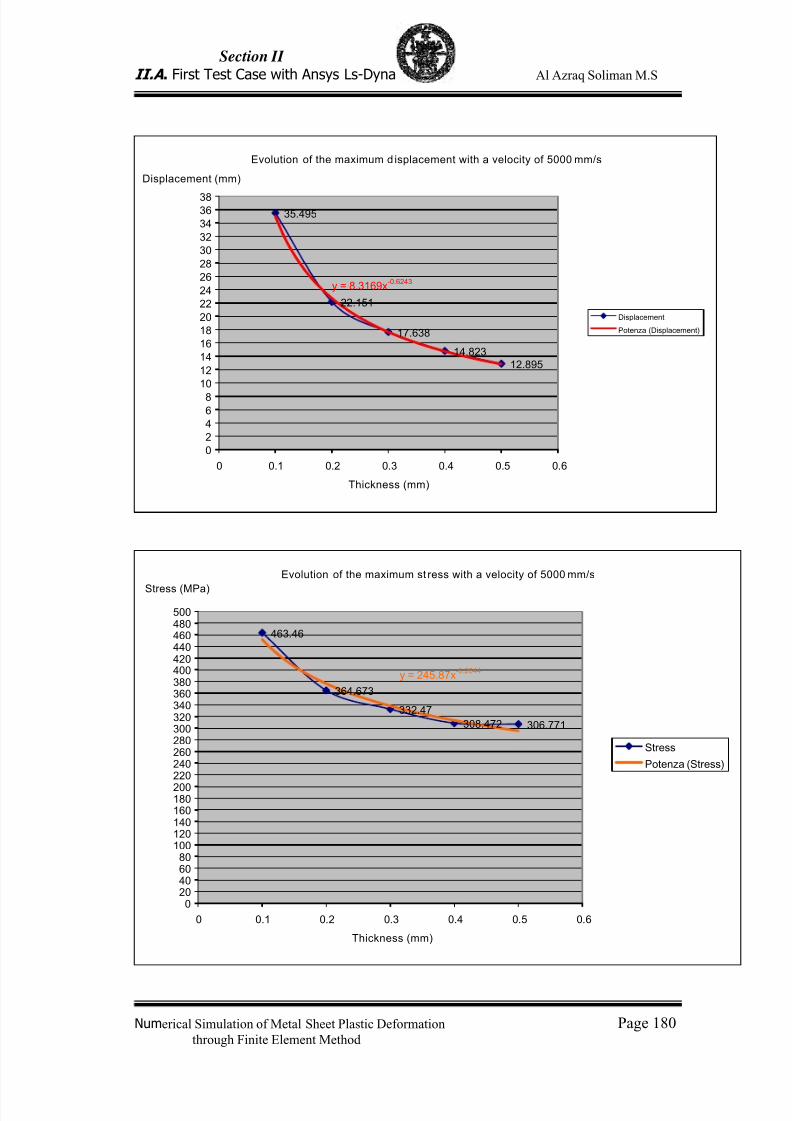
7/23/2019 Al Azraq Ingegneria Chimica Dei Materiali e Della Produzione
http://slidepdf.com/reader/full/al-azraq-ingegneria-chimica-dei-materiali-e-della-produzione 190/419
Section II
II.A . First Test Case with Ansys Ls-Dyna Al Azraq Soliman M.S
Numerical Simulation of Metal Sheet Plastic Deformation Page 180through Finite Element Method
Evolution of the maximum d isplacement with a velocity of 5000 mm/s
35.495
22.151
17.638
14.823
12.895
y = 8.3169x-0.6243
0
2
4
6
8
10
12
14
16
18
20
22
24
26
28
30
32
34
3638
0 0.1 0.2 0.3 0.4 0.5 0.6
Thickness (mm)
Displacement (mm)
Displacement
Potenza (Displacement)
Evolution of the maximum st ress with a velocity of 5000 mm/s
463.46
364.673
332.47
308.472 306.771
y = 245.87x-0.2644
020406080
100120140160180200
220240260280300320340360380400420440460480500
0 0.1 0.2 0.3 0.4 0.5 0.6
Thickness (mm)
Stress (MPa)
Stress
Potenza (Stress)
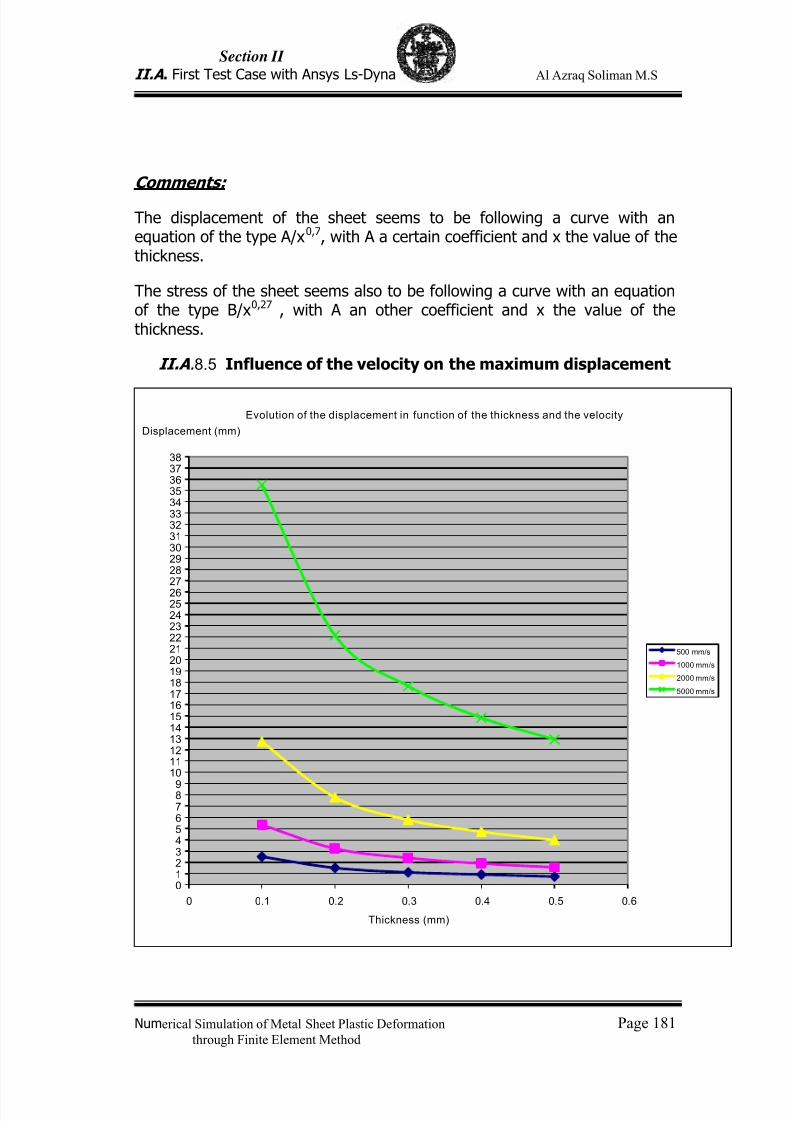
7/23/2019 Al Azraq Ingegneria Chimica Dei Materiali e Della Produzione
http://slidepdf.com/reader/full/al-azraq-ingegneria-chimica-dei-materiali-e-della-produzione 191/419
Section II
II.A . First Test Case with Ansys Ls-Dyna Al Azraq Soliman M.S
Numerical Simulation of Metal Sheet Plastic Deformation Page 181through Finite Element Method
Comments:
The displacement of the sheet seems to be following a curve with anequation of the type A/x0,7, with A a certain coefficient and x the value of thethickness.
The stress of the sheet seems also to be following a curve with an equationof the type B/x0,27 , with A an other coefficient and x the value of thethickness.
II.A .8.5 Influence of the velocity on the maximum displacement
Evolution of the displacement in function of the thickness and the velocity
0123456789
1011121314151617181920212223242526272829303132333435363738
0 0.1 0.2 0.3 0.4 0.5 0.6
Thickness (mm)
Displacement (mm)
500 mm/s
1000 mm/s
2000 mm/s
5000 mm/s
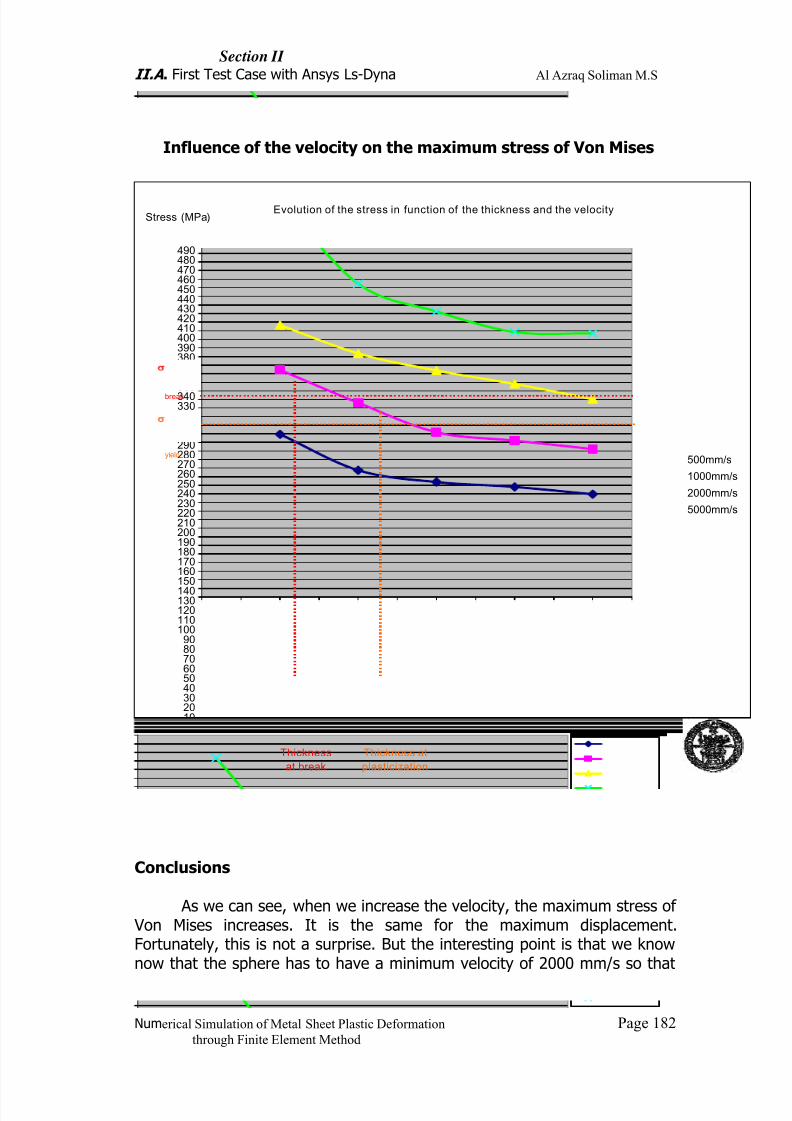
7/23/2019 Al Azraq Ingegneria Chimica Dei Materiali e Della Produzione
http://slidepdf.com/reader/full/al-azraq-ingegneria-chimica-dei-materiali-e-della-produzione 192/419
Section II
II.A . First Test Case with Ansys Ls-Dyna Al Azraq Soliman M.S
Numerical Simulation of Metal Sheet Plastic Deformation Page 182through Finite Element Method
Influence of the velocity on the maximum stress of Von Mises
Evolution of the stress in function of the thickness and the velocity
0102030405060708090
100110120130140150160170180190200210220230240250260270280290300310320330340350360370380390400410420430440450460470480490
0 0.05 0.1 0.15 0.2 0.25 0.3 0.35 0.4 0.45 0.5 0.55
Thickness (mm)
Stress (MPa)
500mm/s
1000mm/s
2000mm/s
5000mm/s
yield
break
Thickness
at break
Thickness at
plasticization
Conclusions
As we can see, when we increase the velocity, the maximum stress of Von Mises increases. It is the same for the maximum displacement.Fortunately, this is not a surprise. But the interesting point is that we knownow that the sphere has to have a minimum velocity of 2000 mm/s so that

7/23/2019 Al Azraq Ingegneria Chimica Dei Materiali e Della Produzione
http://slidepdf.com/reader/full/al-azraq-ingegneria-chimica-dei-materiali-e-della-produzione 193/419
Section II
II.A . First Test Case with Ansys Ls-Dyna Al Azraq Soliman M.S
Numerical Simulation of Metal Sheet Plastic Deformation Page 183through Finite Element Method
the sheet breaks. At the speed of 5000 mm/s, the sheet breaks for everythickness except the one of 0,5 mm.
Concerning the plasticization, we know that it does not arrive at aspeed of 1000 mm/s. We have the plasticization for a sheet of about 0,225mm with the speed of 2000 mm/s.
To conclude, we can say that the sheet will not plasticize as long asthe speed of the sphere does not overcome 1000 mm/s.Concerning the break, the velocity of the sphere must not be more than2000 mm/s.

7/23/2019 Al Azraq Ingegneria Chimica Dei Materiali e Della Produzione
http://slidepdf.com/reader/full/al-azraq-ingegneria-chimica-dei-materiali-e-della-produzione 194/419
Section II
II.A . First Test Case with Ansys Ls-Dyna Al Azraq Soliman M.S
Numerical Simulation of Metal Sheet Plastic Deformation Page 184through Finite Element Method
ANNEXES
ANNEXE 1
Calculation of the energy of the sphere at the impact
We want to know the total energy of the sphere when it hits the sheet, so:
at z=0. We have:
U E E E k P ++=
With: E = total energy of the sphereEp = potential energy of the sphereEk = kinetic energy of the sphereU = internal energy of the sphere 0≈ Joule
Let’s take the origin of the energy at z=0. In this case, at z=0, Ep=0 and we
have:
2
2
1vm E E k ⋅⋅==
With: m = mass of the spherev = velocity of the sphere
And: V m ⋅= ρ
With: ρ = volumic mass of the sphere (=7,872e -6 kg/mm 3)
V = volume of the sphere

7/23/2019 Al Azraq Ingegneria Chimica Dei Materiali e Della Produzione
http://slidepdf.com/reader/full/al-azraq-ingegneria-chimica-dei-materiali-e-della-produzione 195/419
Section II
II.A . First Test Case with Ansys Ls-Dyna Al Azraq Soliman M.S
Numerical Simulation of Metal Sheet Plastic Deformation Page 185through Finite Element Method
)(3
4 33r RV −⋅⋅= π
N.A: V= 707,906 mm3 m=5,57 g
For half a sphere, we have: m=2,79 g.
Now, let’s calculate the velocity of the sphere at the impact for each initialvelocity:
t gvt avv ⋅+=⋅+= 00
For v0=500 mm/s, v=590 mm/sE = 486 J
For v0=1000 mm/s, v=1047,9 mm/sE = 1532 J
For v0=500 mm/s, v=2024,4 mm/s
E = 5717 J
For v0=500 mm/s, v=5009,8 mm/sE = 35012 J
R =8
r =7 mm
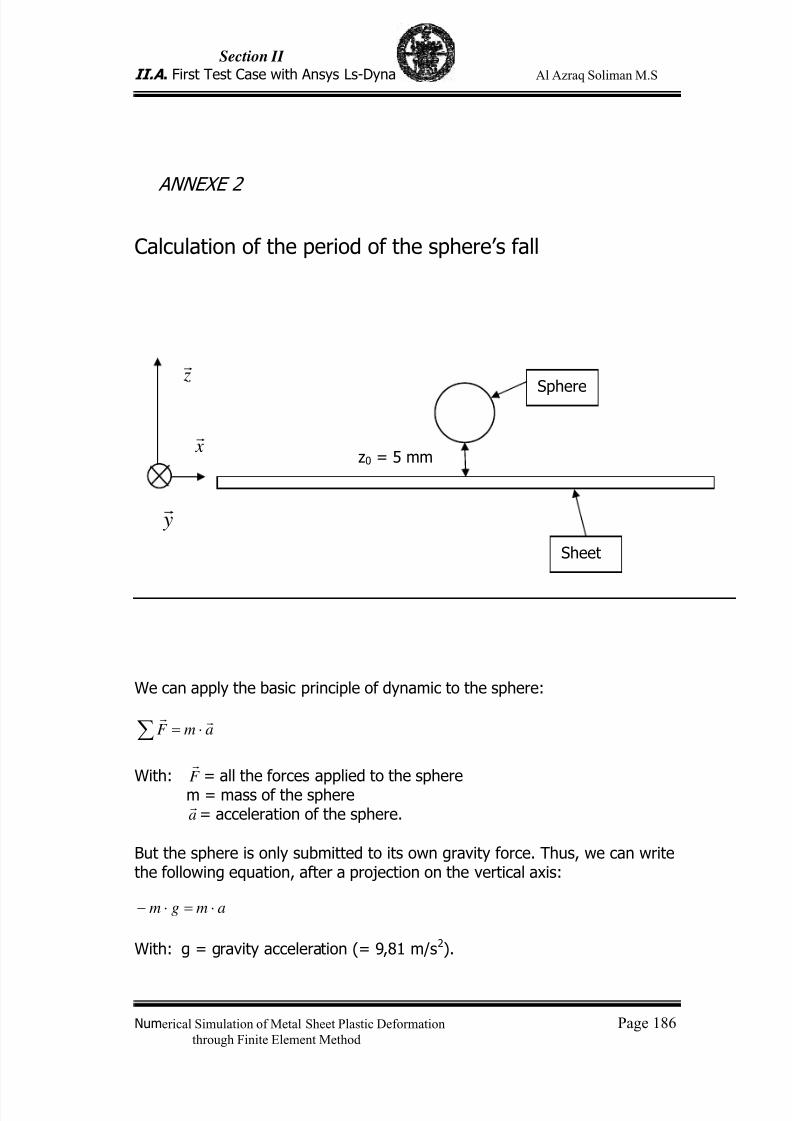
7/23/2019 Al Azraq Ingegneria Chimica Dei Materiali e Della Produzione
http://slidepdf.com/reader/full/al-azraq-ingegneria-chimica-dei-materiali-e-della-produzione 196/419
Section II
II.A . First Test Case with Ansys Ls-Dyna Al Azraq Soliman M.S
Numerical Simulation of Metal Sheet Plastic Deformation Page 186through Finite Element Method
ANNEXE 2
Calculation of the period of the sphere’s fall
We can apply the basic principle of dynamic to the sphere:
∑ ⋅= amF r
r
With: F r
= all the forces applied to the spherem = mass of the spherear
= acceleration of the sphere.
But the sphere is only submitted to its own gravity force. Thus, we can writethe following equation, after a projection on the vertical axis:
amgm ⋅=⋅−
With: g = gravity acceleration (= 9,81 m/s2).
Sphere
Sheet
z0 = 5 mm
zr
xr
yr

7/23/2019 Al Azraq Ingegneria Chimica Dei Materiali e Della Produzione
http://slidepdf.com/reader/full/al-azraq-ingegneria-chimica-dei-materiali-e-della-produzione 197/419
Section II
II.A . First Test Case with Ansys Ls-Dyna Al Azraq Soliman M.S
Numerical Simulation of Metal Sheet Plastic Deformation Page 187through Finite Element Method
Then, it comes:
ga −=
After two successive integrations on the time, we can obtain:
00
2
2
1 zt vt g z +⋅−⋅⋅−=
with : z = position of the lowest point of the sphere on the vertical axisz0 = initial position of the lowest point of the sphere on the vertical
axis (=0,005 m)v0 = initial velocity of the spheret = time
We want to know how long the period of the fall is. It is the period betweenthe moments when the sphere is at z0 and when it is at z=0. So, we have tosolve the following equation:
02
1
00
2=+⋅−⋅⋅−
zt vt g
The two solutions of this equation are:
)2(1
0
2
001 g zvvg
t ⋅⋅++−⋅= or: 0)2(1
0
2
002 ≤⋅⋅+−−⋅= g zvvg
t
As t2 is negative, this solution is impossible. So, we have:
)2(
10
2
00 g zvvgt ⋅⋅++−⋅=
Numerical applications:
For v0=500 mm/s, t=0,009174 s For v0=1000 mm/s, t=0,004883 s For v0=2000 mm/s, t=0,002485 s For v0=5000 mm/s, t=0,000999 s
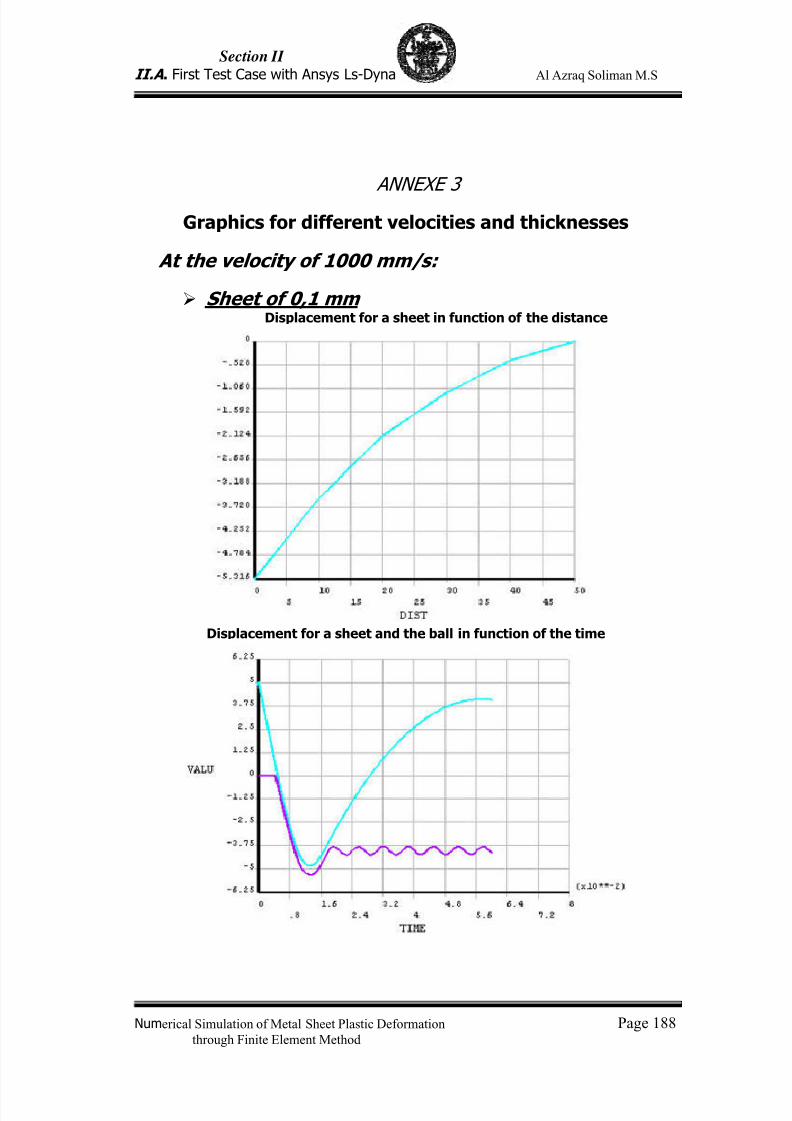
7/23/2019 Al Azraq Ingegneria Chimica Dei Materiali e Della Produzione
http://slidepdf.com/reader/full/al-azraq-ingegneria-chimica-dei-materiali-e-della-produzione 198/419
Section II
II.A . First Test Case with Ansys Ls-Dyna Al Azraq Soliman M.S
Numerical Simulation of Metal Sheet Plastic Deformation Page 188through Finite Element Method
ANNEXE 3
Graphics for different velocities and thicknesses
At the velocity of 1000 mm/s:
Sheet of 0,1 mmDisplacement for a sheet in function of the distance
Displacement for a sheet and the ball in function of the time
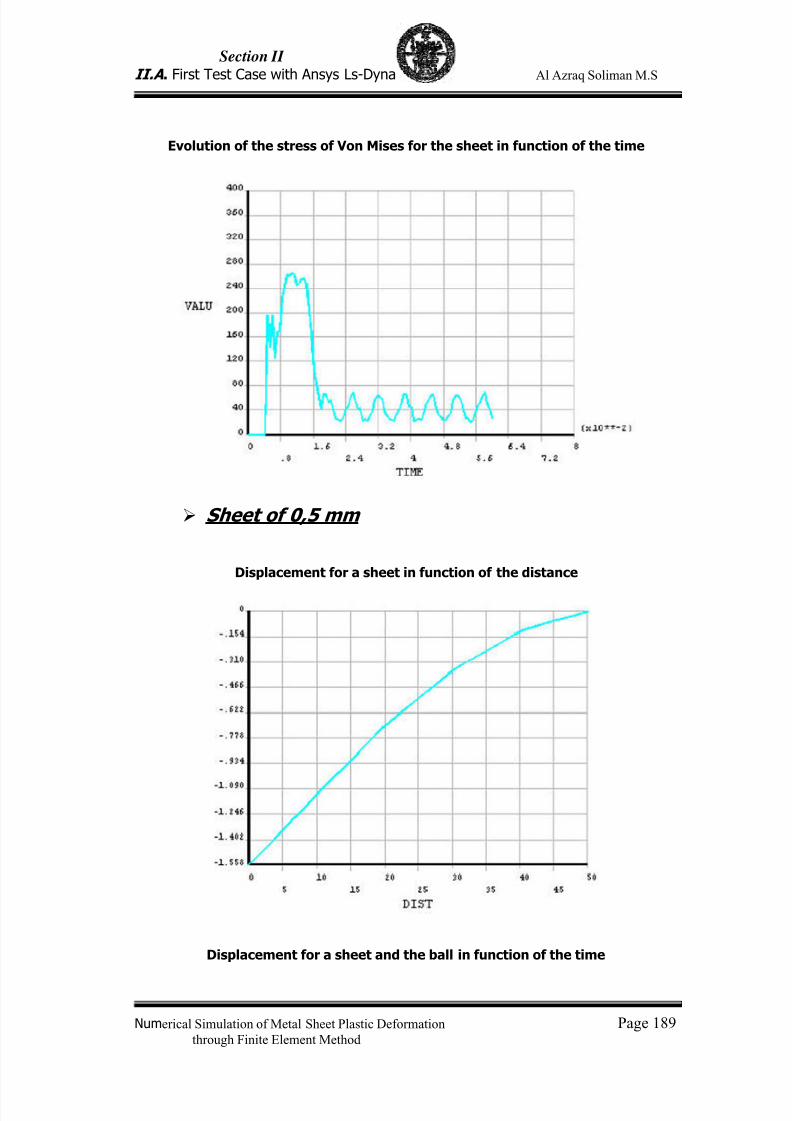
7/23/2019 Al Azraq Ingegneria Chimica Dei Materiali e Della Produzione
http://slidepdf.com/reader/full/al-azraq-ingegneria-chimica-dei-materiali-e-della-produzione 199/419
Section II
II.A . First Test Case with Ansys Ls-Dyna Al Azraq Soliman M.S
Numerical Simulation of Metal Sheet Plastic Deformation Page 189through Finite Element Method
Evolution of the stress of Von Mises for the sheet in function of the time
Sheet of 0,5 mm
Displacement for a sheet in function of the distance
Displacement for a sheet and the ball in function of the time
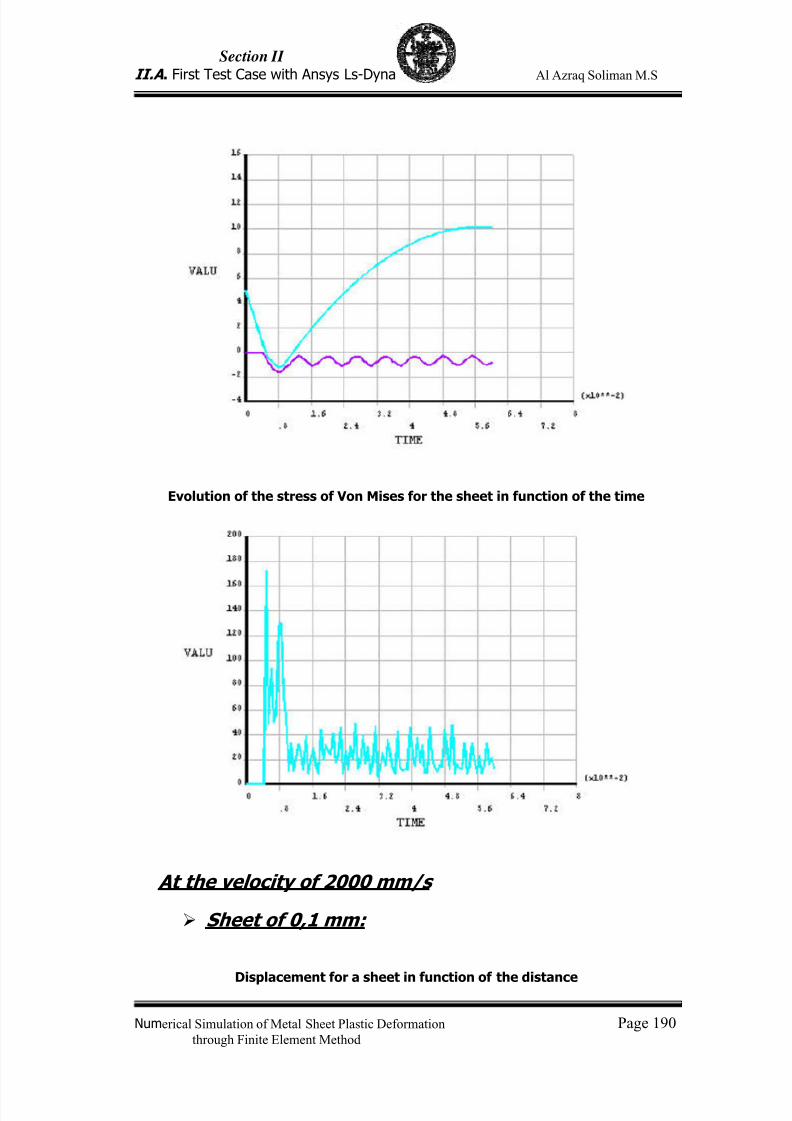
7/23/2019 Al Azraq Ingegneria Chimica Dei Materiali e Della Produzione
http://slidepdf.com/reader/full/al-azraq-ingegneria-chimica-dei-materiali-e-della-produzione 200/419
Section II
II.A . First Test Case with Ansys Ls-Dyna Al Azraq Soliman M.S
Numerical Simulation of Metal Sheet Plastic Deformation Page 190through Finite Element Method
Evolution of the stress of Von Mises for the sheet in function of the time
At the velocity of 2000 mm/s
Sheet of 0,1 mm:
Displacement for a sheet in function of the distance
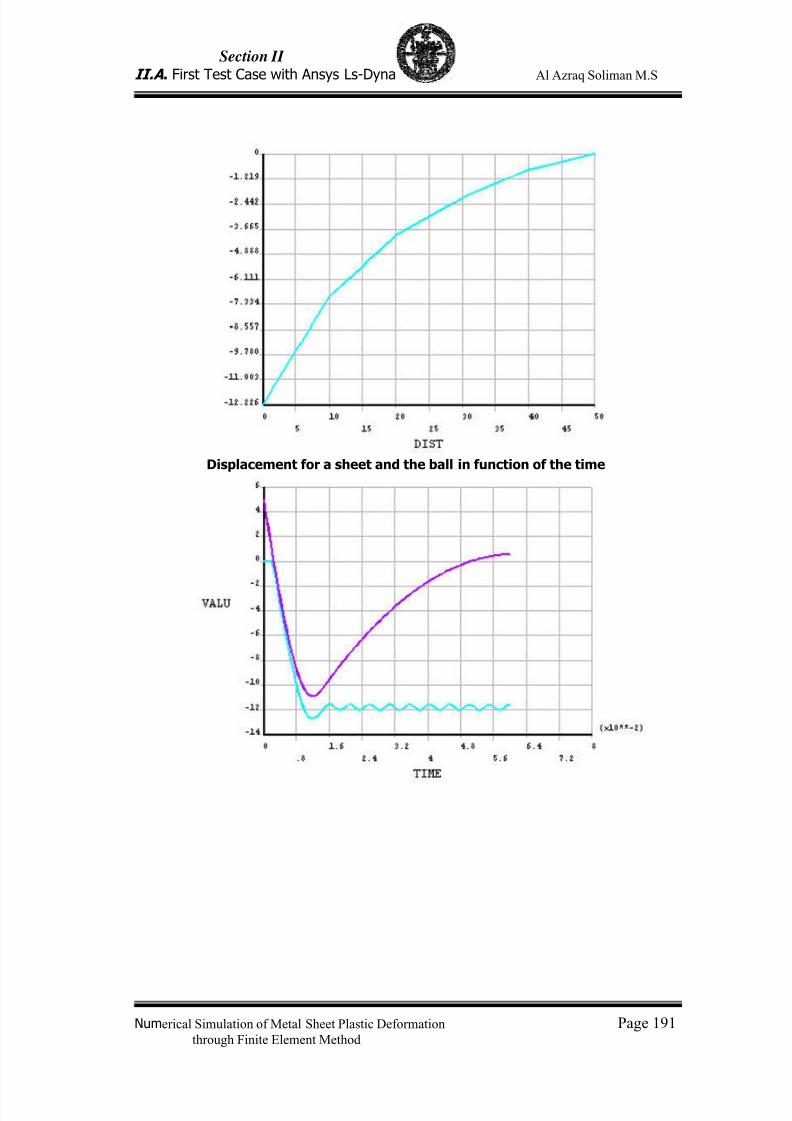
7/23/2019 Al Azraq Ingegneria Chimica Dei Materiali e Della Produzione
http://slidepdf.com/reader/full/al-azraq-ingegneria-chimica-dei-materiali-e-della-produzione 201/419
Section II
II.A . First Test Case with Ansys Ls-Dyna Al Azraq Soliman M.S
Numerical Simulation of Metal Sheet Plastic Deformation Page 191through Finite Element Method
Displacement for a sheet and the ball in function of the time
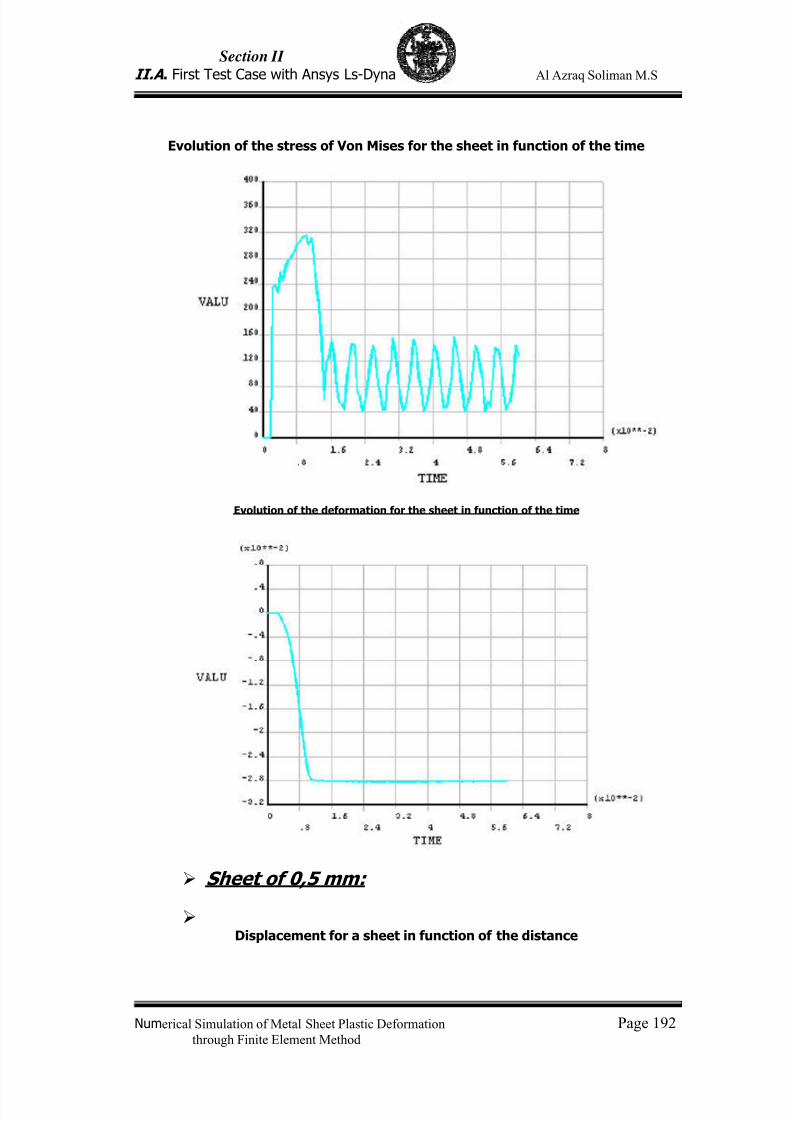
7/23/2019 Al Azraq Ingegneria Chimica Dei Materiali e Della Produzione
http://slidepdf.com/reader/full/al-azraq-ingegneria-chimica-dei-materiali-e-della-produzione 202/419
Section II
II.A . First Test Case with Ansys Ls-Dyna Al Azraq Soliman M.S
Numerical Simulation of Metal Sheet Plastic Deformation Page 192through Finite Element Method
Evolution of the stress of Von Mises for the sheet in function of the time
Evolution of the deformation for the sheet in function of the time
Sheet of 0,5 mm:
Displacement for a sheet in function of the distance
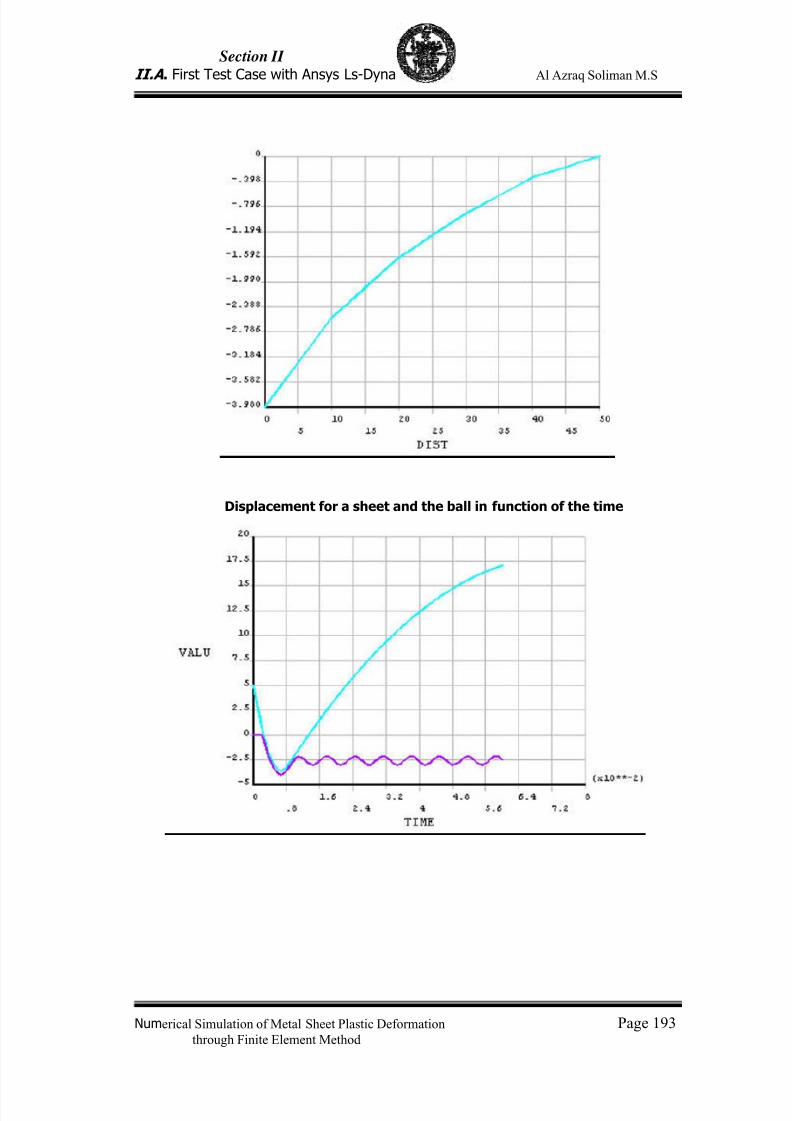
7/23/2019 Al Azraq Ingegneria Chimica Dei Materiali e Della Produzione
http://slidepdf.com/reader/full/al-azraq-ingegneria-chimica-dei-materiali-e-della-produzione 203/419
Section II
II.A . First Test Case with Ansys Ls-Dyna Al Azraq Soliman M.S
Numerical Simulation of Metal Sheet Plastic Deformation Page 193through Finite Element Method
Displacement for a sheet and the ball in function of the time

7/23/2019 Al Azraq Ingegneria Chimica Dei Materiali e Della Produzione
http://slidepdf.com/reader/full/al-azraq-ingegneria-chimica-dei-materiali-e-della-produzione 204/419
Section II
II.A . First Test Case with Ansys Ls-Dyna Al Azraq Soliman M.S
Numerical Simulation of Metal Sheet Plastic Deformation Page 194through Finite Element Method
Evolution of the stress of Von Mises for the sheet in function of the time
Evolution of the deformation for the sheet in function of the time
At the velocity of 5000 mm/s:
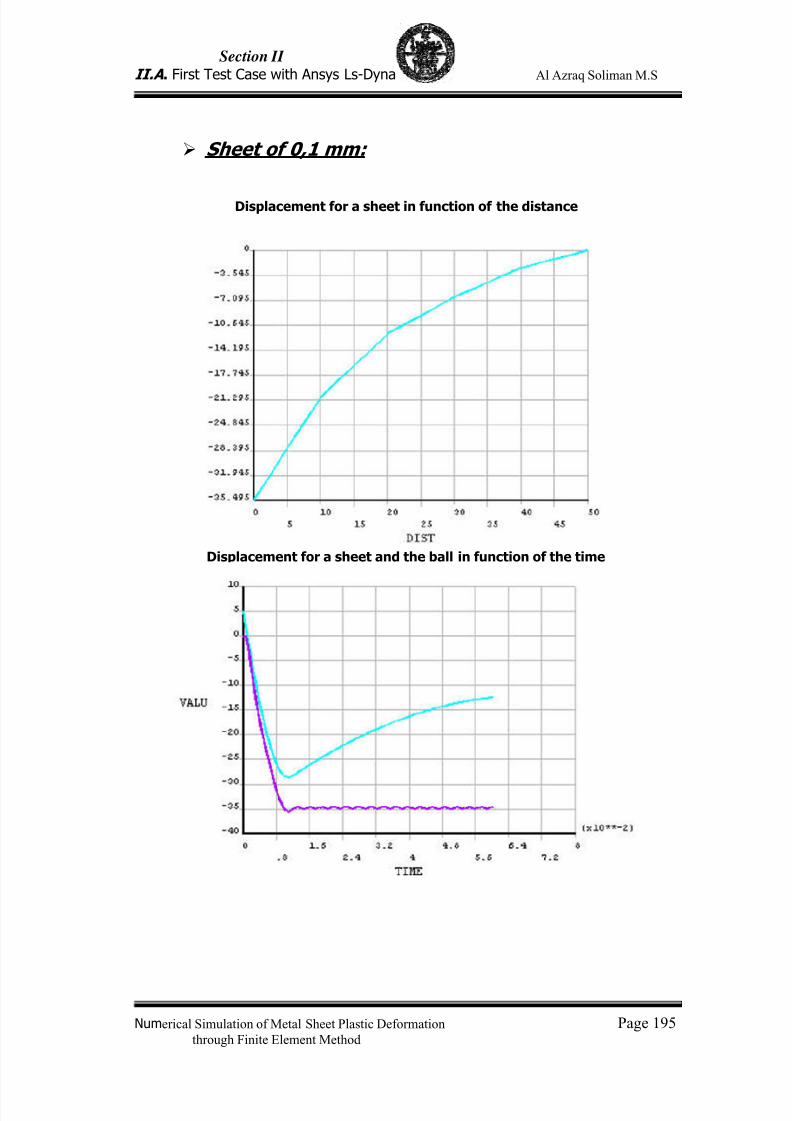
7/23/2019 Al Azraq Ingegneria Chimica Dei Materiali e Della Produzione
http://slidepdf.com/reader/full/al-azraq-ingegneria-chimica-dei-materiali-e-della-produzione 205/419
Section II
II.A . First Test Case with Ansys Ls-Dyna Al Azraq Soliman M.S
Numerical Simulation of Metal Sheet Plastic Deformation Page 195through Finite Element Method
Sheet of 0,1 mm:
Displacement for a sheet in function of the distance
Displacement for a sheet and the ball in function of the time
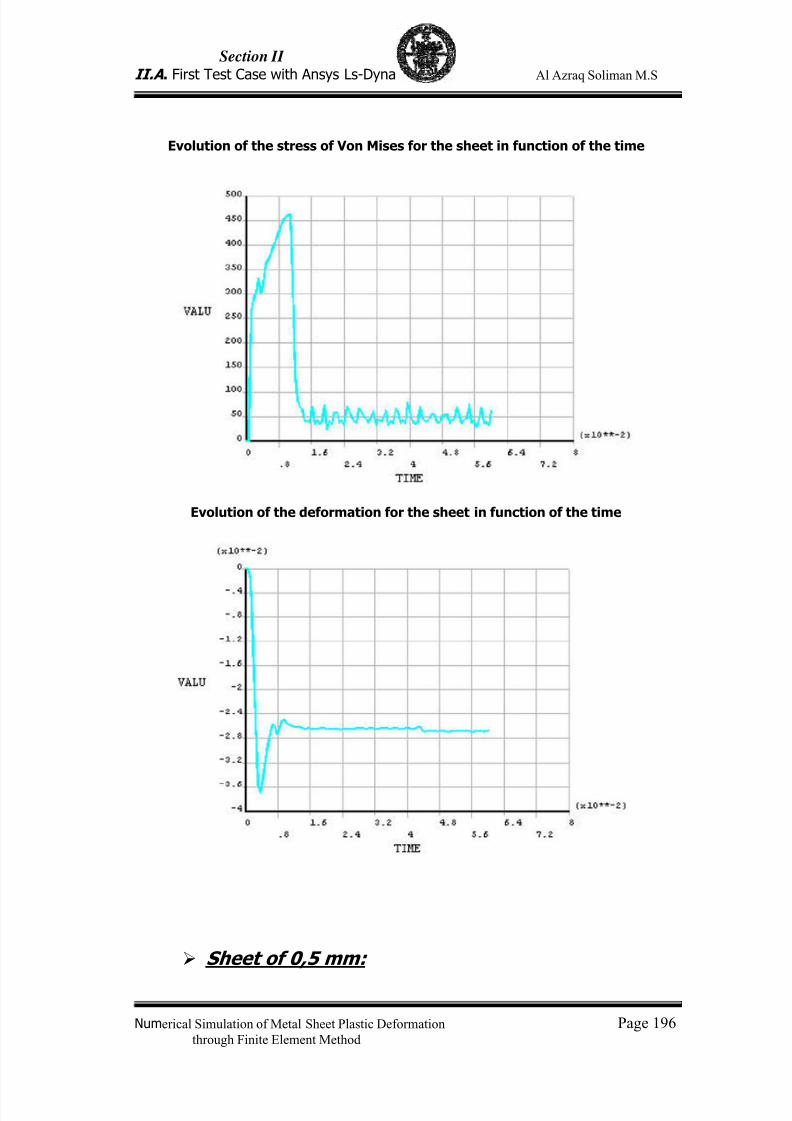
7/23/2019 Al Azraq Ingegneria Chimica Dei Materiali e Della Produzione
http://slidepdf.com/reader/full/al-azraq-ingegneria-chimica-dei-materiali-e-della-produzione 206/419
Section II
II.A . First Test Case with Ansys Ls-Dyna Al Azraq Soliman M.S
Numerical Simulation of Metal Sheet Plastic Deformation Page 196through Finite Element Method
Evolution of the stress of Von Mises for the sheet in function of the time
Evolution of the deformation for the sheet in function of the time
Sheet of 0,5 mm:
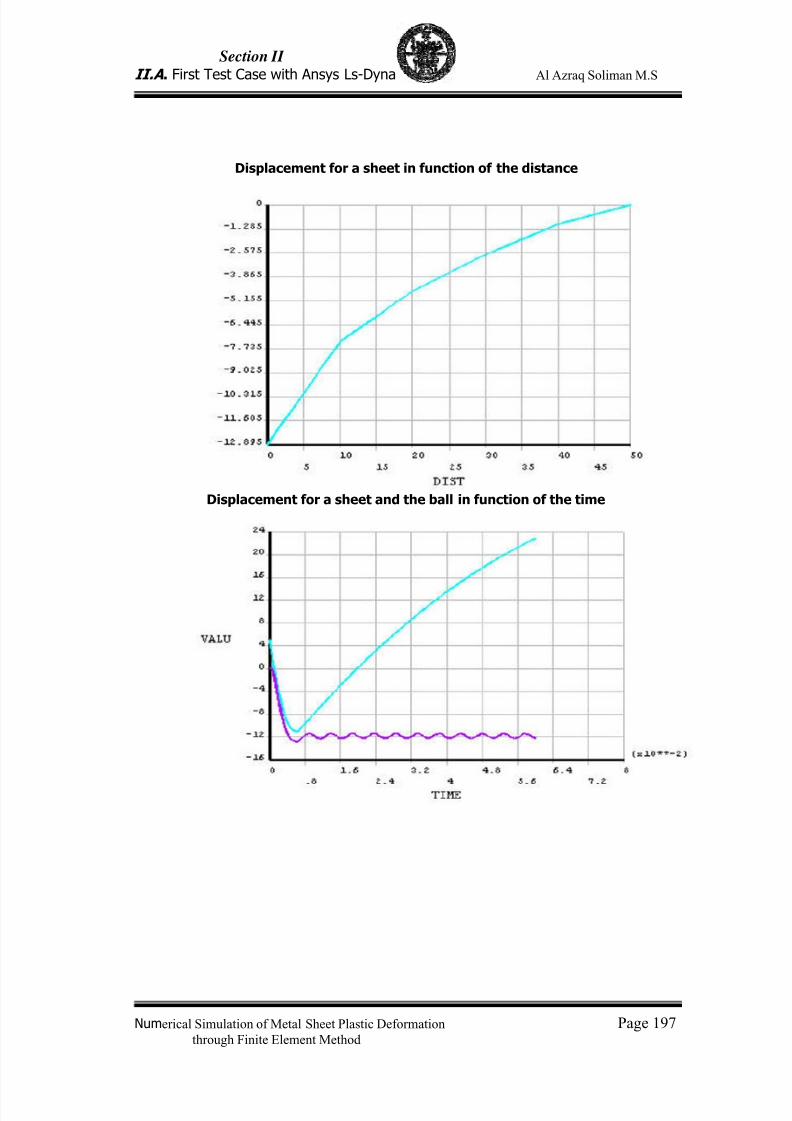
7/23/2019 Al Azraq Ingegneria Chimica Dei Materiali e Della Produzione
http://slidepdf.com/reader/full/al-azraq-ingegneria-chimica-dei-materiali-e-della-produzione 207/419
Section II
II.A . First Test Case with Ansys Ls-Dyna Al Azraq Soliman M.S
Numerical Simulation of Metal Sheet Plastic Deformation Page 197through Finite Element Method
Displacement for a sheet in function of the distance
Displacement for a sheet and the ball in function of the time

7/23/2019 Al Azraq Ingegneria Chimica Dei Materiali e Della Produzione
http://slidepdf.com/reader/full/al-azraq-ingegneria-chimica-dei-materiali-e-della-produzione 208/419
Section II
II.A . First Test Case with Ansys Ls-Dyna Al Azraq Soliman M.S
Numerical Simulation of Metal Sheet Plastic Deformation Page 198through Finite Element Method
Evolution of the stress of Von Mises for the sheet in function of the time
Evolution of the deformation for the sheet in function of the time
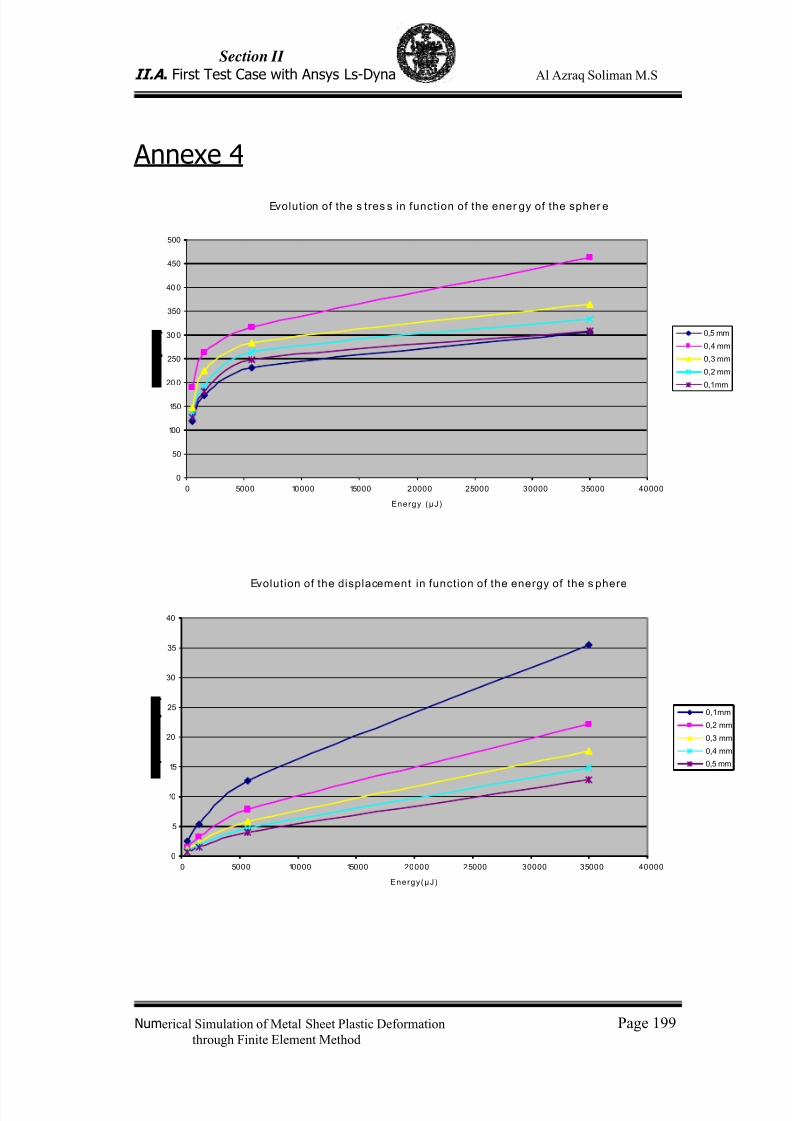
7/23/2019 Al Azraq Ingegneria Chimica Dei Materiali e Della Produzione
http://slidepdf.com/reader/full/al-azraq-ingegneria-chimica-dei-materiali-e-della-produzione 209/419
Section II
II.A . First Test Case with Ansys Ls-Dyna Al Azraq Soliman M.S
Numerical Simulation of Metal Sheet Plastic Deformation Page 199through Finite Element Method
Annexe 4
Evolution of the s tres s in function of the ener gy of the spher e
0
50
100
150
20 0
250
30 0
350
40 0
450
500
0 5000 10000 15000 20000 25000 30000 35000 40000
Energy (µJ)
0,5 mm
0,4 mm
0,3 mm
0,2 mm
0,1mm
Evolution of the displacement in function of the energy of the s phere
0
5
10
15
20
25
30
35
40
0 5000 10000 15000 20000 25000 30000 35000 40000
Energy(µJ)
0,1mm
0,2 mm
0,3 mm
0,4 mm
0,5 mm

7/23/2019 Al Azraq Ingegneria Chimica Dei Materiali e Della Produzione
http://slidepdf.com/reader/full/al-azraq-ingegneria-chimica-dei-materiali-e-della-produzione 210/419
Section II
II.A . First Test Case with Ansys Ls-Dyna Al Azraq Soliman M.S
Numerical Simulation of Metal Sheet Plastic Deformation Page 200through Finite Element Method
I.A .11. Bibliography :
[1] Beltzer, A.I. 1990. Variational and finite element method: a symboliccomputation approach. Berlin.[2] de Weck, Olivier - Young Kim, Il. January 2004. Finite Element Method,Engineering Design and Rapid Prototyping [read April 22nd 2005]http://ocw.mit.edu/NR/rdonlyres/Aeronautics-and-Astronautics/16-810January--IAP-2004/21C7E953-505B-41C7-8DB7-25A0E5D98B4E/0/l4_cae.pdf[3] Ansys guide[4](Getting Started with LS-DYNA 2002: 1-1).[5] (LS-DYNA Developed by Livermore Software Technology Corp. MaterialModels: 1)
[5] www.matweb.com[6] www.goodfellow.com

7/23/2019 Al Azraq Ingegneria Chimica Dei Materiali e Della Produzione
http://slidepdf.com/reader/full/al-azraq-ingegneria-chimica-dei-materiali-e-della-produzione 211/419
Section II.B
The Second test case is sheet of Glare and a sheet of aluminiumalloy bounded on the side, submitted to the impact of a spheremade of steel with an initial velocity.
7/23/2019 Al Azraq Ingegneria Chimica Dei Materiali e Della Produzione
http://slidepdf.com/reader/full/al-azraq-ingegneria-chimica-dei-materiali-e-della-produzione 212/419
Section II
II.B . Second Test Case of Ansys Ls-Dyna Al Azraq Soliman M.S
Numerical Simulation of Metal Sheet Plastic Deformation Page 201through Finite Element Method
III.B .1 - INTRODUCTION
The main objective of this work is to achieve a sufficiently goodsimulation of GLARE behaviour when it suffers a impact using the ANSYS LSDYNA Software. The main application of GLARE is in the aerospace industrywhere it is used in some parts of the fuselage of aircraft. Hence, GLAREneeds to be resistant to low velocity impacts: bird strike, baggage andground handling equipment, runway debris, etc. These tests are timeconsuming, expensive and difficult to perform, so the ability to simulatethese tests is of high importance.
III.B .2 - WHAT IS GLARE ?
GLARE (GLAss REinforced) is the name of a glass fibre reinforcedmetal laminate, developed at the TU-Delft. Alternating sheets of thinaluminium foils and high strength glass fibre epoxy prepegs are used aslayers for this composite. There are several types of GLARE that differ onefrom another in the thickness and the number of the layers. Being a veryrecent material, there is little information about it; GLARE shows excellentproperties in fatigue. Hence, Glare is suitable as a material for thepressurized fuselage of commercial aircraft. GLARE has become famous forits application in the new large aircraft, the Airbus A-380 (built to compete
with Boeing’s 747 “jumbo jet”) and will be used in the upper part of itsfuselage. GLARE main advantages are[1] :
● Damage tolerance− fatigue− impact− corrosion● Reduced weight● Fire resistance
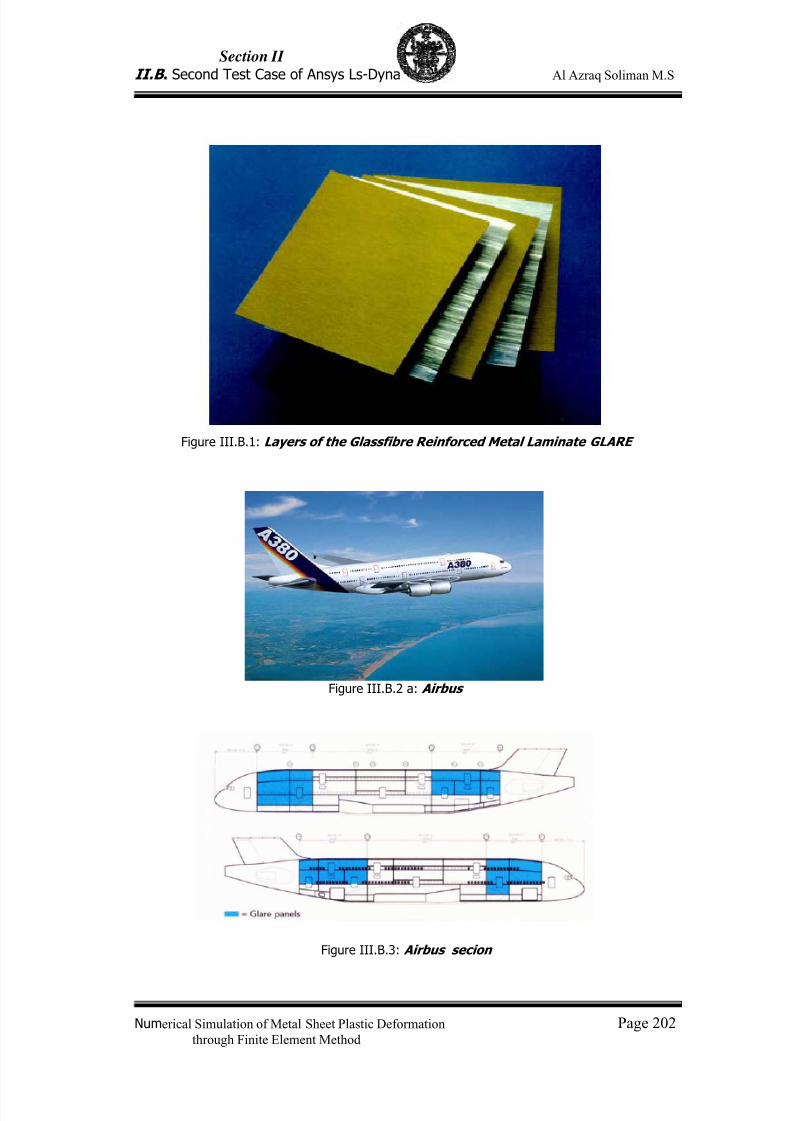
7/23/2019 Al Azraq Ingegneria Chimica Dei Materiali e Della Produzione
http://slidepdf.com/reader/full/al-azraq-ingegneria-chimica-dei-materiali-e-della-produzione 213/419
Section II
II.B . Second Test Case of Ansys Ls-Dyna Al Azraq Soliman M.S
Numerical Simulation of Metal Sheet Plastic Deformation Page 202through Finite Element Method
Figure III.B.1: Layers of the Glassfibre Reinforced Metal Laminate GLARE
Figure III.B.3: Airbus secion
Figure III.B.2 a: Airbus
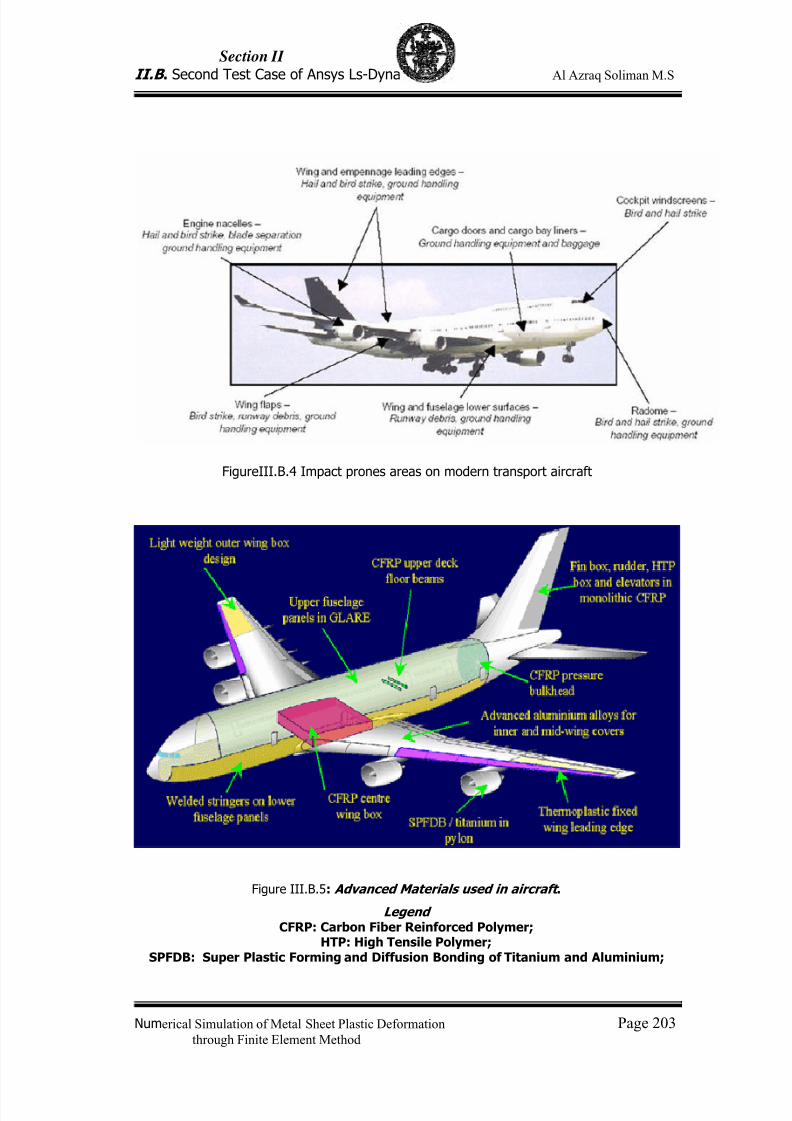
7/23/2019 Al Azraq Ingegneria Chimica Dei Materiali e Della Produzione
http://slidepdf.com/reader/full/al-azraq-ingegneria-chimica-dei-materiali-e-della-produzione 214/419
Section II
II.B . Second Test Case of Ansys Ls-Dyna Al Azraq Soliman M.S
Numerical Simulation of Metal Sheet Plastic Deformation Page 203through Finite Element Method
FigureIII.B.4 Impact prones areas on modern transport aircraft
Figure III.B.5: Advanced Materials used in aircraft .
LegendCFRP: Carbon Fiber Reinforced Polymer;
HTP: High Tensile Polymer;SPFDB: Super Plastic Forming and Diffusion Bonding of Titanium and Aluminium;

7/23/2019 Al Azraq Ingegneria Chimica Dei Materiali e Della Produzione
http://slidepdf.com/reader/full/al-azraq-ingegneria-chimica-dei-materiali-e-della-produzione 215/419
Section II
II.B . Second Test Case of Ansys Ls-Dyna Al Azraq Soliman M.S
Numerical Simulation of Metal Sheet Plastic Deformation Page 204through Finite Element Method
Figure III.B.6: Crack Growth behaviour of unidirectional GLARE 2, cross-plied GLARE 3,
ARALL 2 and 2024-T3 for a fuselage loading
Figure III.B.7: Fatigue cracks are less likely to form and take longer to grow in Glarethan with solid 2024 aluminium. The Glare layers can be tailored for differentcharacteristics.
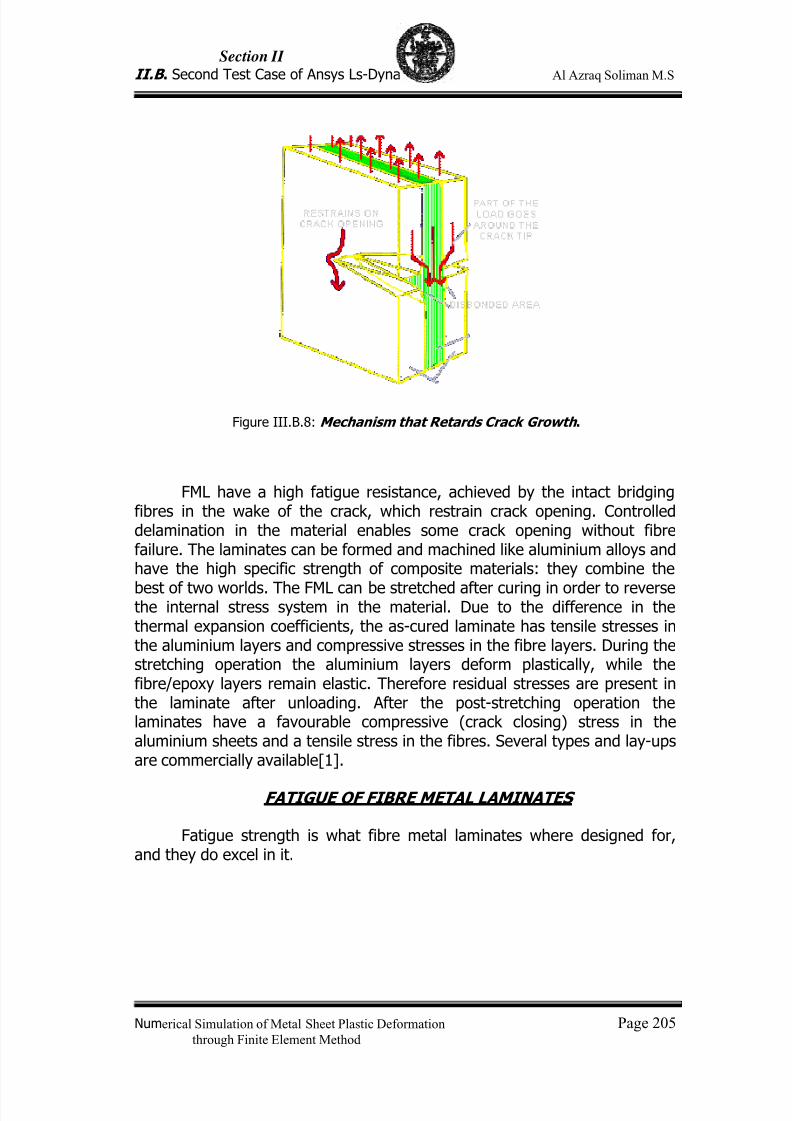
7/23/2019 Al Azraq Ingegneria Chimica Dei Materiali e Della Produzione
http://slidepdf.com/reader/full/al-azraq-ingegneria-chimica-dei-materiali-e-della-produzione 216/419
Section II
II.B . Second Test Case of Ansys Ls-Dyna Al Azraq Soliman M.S
Numerical Simulation of Metal Sheet Plastic Deformation Page 205through Finite Element Method
Figure III.B.8: Mechanism that Retards Crack Growth .
FML have a high fatigue resistance, achieved by the intact bridgingfibres in the wake of the crack, which restrain crack opening. Controlleddelamination in the material enables some crack opening without fibrefailure. The laminates can be formed and machined like aluminium alloys andhave the high specific strength of composite materials: they combine the
best of two worlds. The FML can be stretched after curing in order to reversethe internal stress system in the material. Due to the difference in thethermal expansion coefficients, the as-cured laminate has tensile stresses inthe aluminium layers and compressive stresses in the fibre layers. During thestretching operation the aluminium layers deform plastically, while thefibre/epoxy layers remain elastic. Therefore residual stresses are present inthe laminate after unloading. After the post-stretching operation thelaminates have a favourable compressive (crack closing) stress in thealuminium sheets and a tensile stress in the fibres. Several types and lay-upsare commercially available[1].
FATIGUE OF FIBRE METAL LAMINATES
Fatigue strength is what fibre metal laminates where designed for,and they do excel in it.
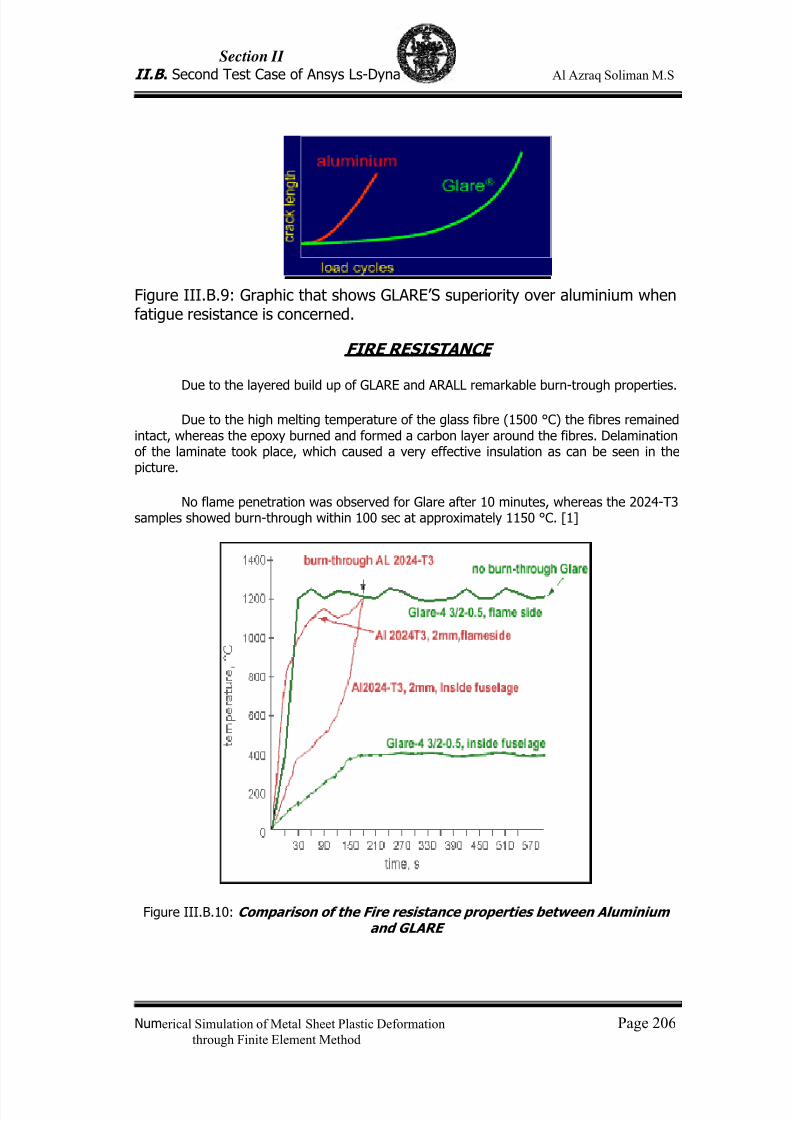
7/23/2019 Al Azraq Ingegneria Chimica Dei Materiali e Della Produzione
http://slidepdf.com/reader/full/al-azraq-ingegneria-chimica-dei-materiali-e-della-produzione 217/419
Section II
II.B . Second Test Case of Ansys Ls-Dyna Al Azraq Soliman M.S
Numerical Simulation of Metal Sheet Plastic Deformation Page 206through Finite Element Method
Figure III.B.9: Graphic that shows GLARE’S superiority over aluminium whenfatigue resistance is concerned.
FIRE RESISTANCE
Due to the layered build up of GLARE and ARALL remarkable burn-trough properties.
Due to the high melting temperature of the glass fibre (1500 °C) the fibres remainedintact, whereas the epoxy burned and formed a carbon layer around the fibres. Delaminationof the laminate took place, which caused a very effective insulation as can be seen in thepicture.
No flame penetration was observed for Glare after 10 minutes, whereas the 2024-T3samples showed burn-through within 100 sec at approximately 1150 °C. [1]
Figure III.B.10: Comparison of the Fire resistance properties between Aluminiumand GLARE
7/23/2019 Al Azraq Ingegneria Chimica Dei Materiali e Della Produzione
http://slidepdf.com/reader/full/al-azraq-ingegneria-chimica-dei-materiali-e-della-produzione 218/419
Section II
II.B . Second Test Case of Ansys Ls-Dyna Al Azraq Soliman M.S
Numerical Simulation of Metal Sheet Plastic Deformation Page 207through Finite Element Method
III.B .3 - METHODOLOGY OF THE WORK
The goal of this work was to find a reasonably good way to performa simulation on the behaviour of GLARE under a low velocity impact. Easiersaid than done, modelling GLARE in ANSYS is difficult because of theinteraction between layers.
The scarcity of information on GLARE made progression slow andthe only available information on it was on the internet and even thereeverything found was generic, consisting almost exclusively of magazinearticles. ANSYS tutorials and a previous thesis gave some guidance butadvancing on this was like shooting in the dark. Comparing GLARE toaluminium is very important because GLARE is supposed to substitutealuminium and because the mechanical properties of aluminium are similar to
those of GLARE so it is a point of reference. It was decided to simulateGLARE and aluminium and then compare the results.
III.B .4 - GLARE AND FIBER METAL LAMINATES
Composite materials have been subject of permanent interest ofseveral industries specialists during the last few decades. The first militarycomposite applications in the aircraft industry were in the thirties and fortiesand triggered off their commercial use after the Second World War. The use
of modern composites enables significant weight reduction in the structures.Composites offer many advantages when compared to alloys, especially highstrength and stiffness, excellent fatigue properties and corrosion resistance.On the other side, they have several disadvantages like low fracturetoughness and moisture absorption. In addition, inspections can be difficultand maintenance complicated or impossible. These arguments speak for theuse of aluminium alloys in primary aircraft structures and they are the mainreason why airworthiness authorities did not accept composite materials in awider scale. [2]
During the last few decades, many scientists aimed their efforts to
develop a fatigue resistant material, which would keep low weight and goodmechanical properties of aluminium alloys. The most successful in this fieldwas the team of Prof. Schjive at Delft University of Technology, whichdeveloped fibre metal laminates (FML) called ARALL (Aramid Reinforced
Aluminium Laminates) and GLARE (GLAss REinforced) at the beginning of theeighties. FML are a new group of aerospace materials that join theadvantages of aluminium alloys and composites, having high strength andexcellent fatigue properties. They are created by stacking thin aluminiumsheets (0.2-0.5mm) and prepegs containing aramid or glass fibres. GLAREand ARALL started to be produced commercially by the structural laminatescompany formed by Alcoa and Akzo at the beginning of the nineties. Both
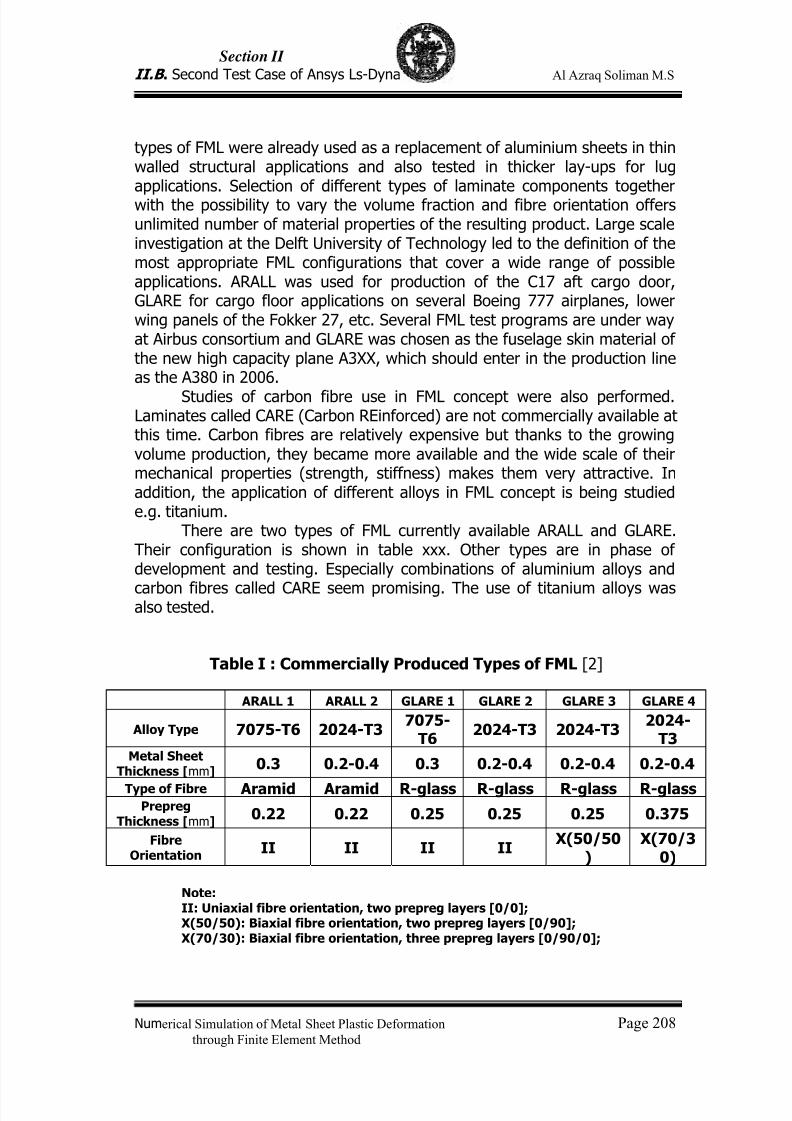
7/23/2019 Al Azraq Ingegneria Chimica Dei Materiali e Della Produzione
http://slidepdf.com/reader/full/al-azraq-ingegneria-chimica-dei-materiali-e-della-produzione 219/419
Section II
II.B . Second Test Case of Ansys Ls-Dyna Al Azraq Soliman M.S
Numerical Simulation of Metal Sheet Plastic Deformation Page 208through Finite Element Method
types of FML were already used as a replacement of aluminium sheets in thinwalled structural applications and also tested in thicker lay-ups for lugapplications. Selection of different types of laminate components togetherwith the possibility to vary the volume fraction and fibre orientation offersunlimited number of material properties of the resulting product. Large scaleinvestigation at the Delft University of Technology led to the definition of themost appropriate FML configurations that cover a wide range of possibleapplications. ARALL was used for production of the C17 aft cargo door,GLARE for cargo floor applications on several Boeing 777 airplanes, lowerwing panels of the Fokker 27, etc. Several FML test programs are under wayat Airbus consortium and GLARE was chosen as the fuselage skin material ofthe new high capacity plane A3XX, which should enter in the production lineas the A380 in 2006.
Studies of carbon fibre use in FML concept were also performed.Laminates called CARE (Carbon REinforced) are not commercially available atthis time. Carbon fibres are relatively expensive but thanks to the growingvolume production, they became more available and the wide scale of theirmechanical properties (strength, stiffness) makes them very attractive. Inaddition, the application of different alloys in FML concept is being studiede.g. titanium.
There are two types of FML currently available ARALL and GLARE.Their configuration is shown in table xxx. Other types are in phase ofdevelopment and testing. Especially combinations of aluminium alloys and
carbon fibres called CARE seem promising. The use of titanium alloys wasalso tested.
Table I : Commercially Produced Types of FML [2]
ARALL 1 ARALL 2 GLARE 1 GLARE 2 GLARE 3 GLARE 4
Alloy Type 7075-T6 2024-T37075-
T62024-T3 2024-T3
2024-T3
Metal SheetThickness [mm]
0.3 0.2-0.4 0.3 0.2-0.4 0.2-0.4 0.2-0.4
Type of Fibre Aramid Aramid R-glass R-glass R-glass R-glassPrepreg
Thickness [mm]0.22 0.22 0.25 0.25 0.25 0.375
FibreOrientation
II II II II X(50/50
) X(70/3
0)
Note:II: Uniaxial fibre orientation, two prepreg layers [0/0]; X(50/50): Biaxial fibre orientation, two prepreg layers [0/90]; X(70/30): Biaxial fibre orientation, three prepreg layers [0/90/0];
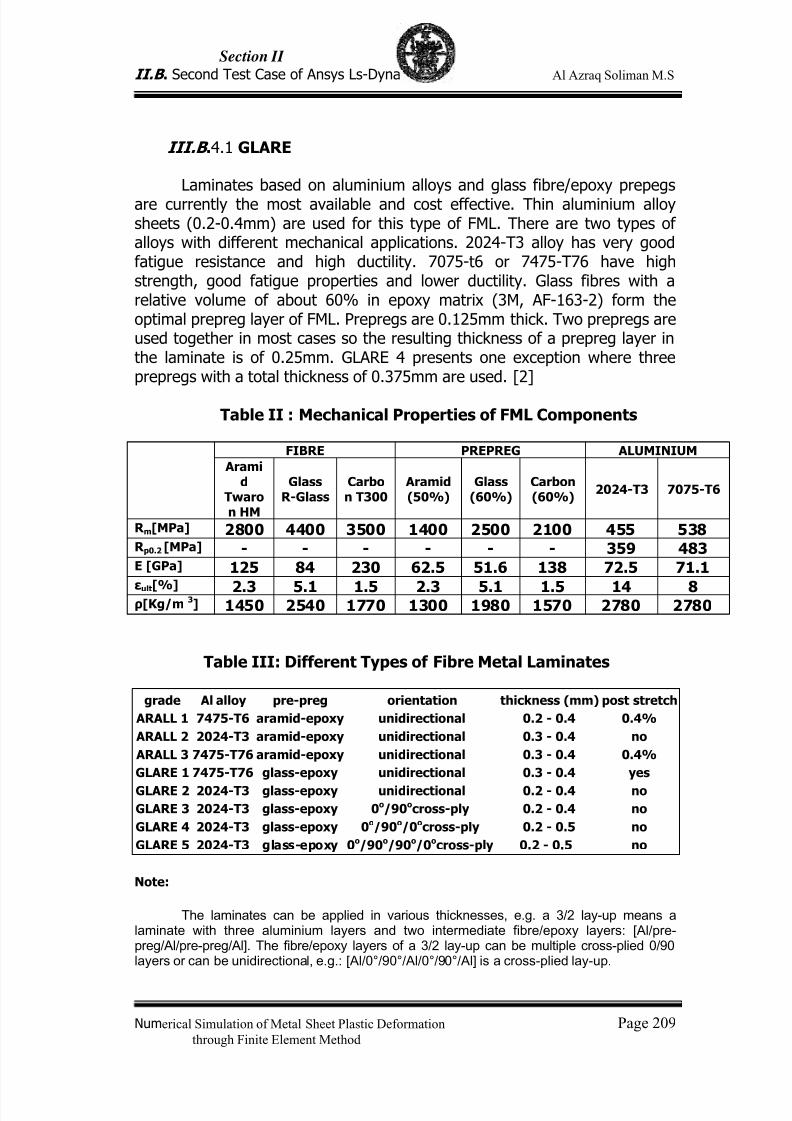
7/23/2019 Al Azraq Ingegneria Chimica Dei Materiali e Della Produzione
http://slidepdf.com/reader/full/al-azraq-ingegneria-chimica-dei-materiali-e-della-produzione 220/419
Section II
II.B . Second Test Case of Ansys Ls-Dyna Al Azraq Soliman M.S
Numerical Simulation of Metal Sheet Plastic Deformation Page 209through Finite Element Method
III.B .4.1 GLARE
Laminates based on aluminium alloys and glass fibre/epoxy prepegsare currently the most available and cost effective. Thin aluminium alloysheets (0.2-0.4mm) are used for this type of FML. There are two types ofalloys with different mechanical applications. 2024-T3 alloy has very goodfatigue resistance and high ductility. 7075-t6 or 7475-T76 have highstrength, good fatigue properties and lower ductility. Glass fibres with arelative volume of about 60% in epoxy matrix (3M, AF-163-2) form theoptimal prepreg layer of FML. Prepregs are 0.125mm thick. Two prepregs areused together in most cases so the resulting thickness of a prepreg layer inthe laminate is of 0.25mm. GLARE 4 presents one exception where threeprepregs with a total thickness of 0.375mm are used. [2]
Table II : Mechanical Properties of FML Components
FIBRE PREPREG ALUMINIUM
Aramid
Twaron HM
GlassR-Glass
Carbon T300
Aramid(50%)
Glass(60%)
Carbon(60%)
2024-T3 7075-T6
R m [MPa] 2800 4400 3500 1400 2500 2100 455 538R p0.2 [MPa] - - - - - - 359 483E [GPa] 125 84 230 62.5 51.6 138 72.5 71.1
εult [%] 2.3 5.1 1.5 2.3 5.1 1.5 14 8ρ [Kg/m 3] 1450 2540 1770 1300 1980 1570 2780 2780
Table III: Different Types of Fibre Metal Laminates
grade Al alloy pre-preg orientation thickness (mm) post stretch
ARALL 1 7475-T6 aramid-epoxy unidirectional 0.2 - 0.4 0.4% ARALL 2 2024-T3 aramid-epoxy unidirectional 0.3 - 0.4 no ARALL 3 7475-T76 aramid-epoxy unidirectional 0.3 - 0.4 0.4% GLARE 1 7475-T76 glass-epoxy unidirectional 0.3 - 0.4 yes GLARE 2 2024-T3 glass-epoxy unidirectional 0.2 - 0.4 no GLARE 3 2024-T3 glass-epoxy 0o/90o cross-ply 0.2 - 0.4 no GLARE 4 2024-T3 glass-epoxy 0o/90o/0o cross-ply 0.2 - 0.5 no GLARE 5 2024-T3 glass-epoxy 0o/90o/90o/0o cross-ply 0.2 - 0.5 no
Note:
The laminates can be applied in various thicknesses, e.g. a 3/2 lay-up means alaminate with three aluminium layers and two intermediate fibre/epoxy layers: [Al/pre-preg/Al/pre-preg/Al]. The fibre/epoxy layers of a 3/2 lay-up can be multiple cross-plied 0/90layers or can be unidirectional, e.g.: [Al/0°/90°/Al/0°/90°/Al] is a cross-plied lay-up.
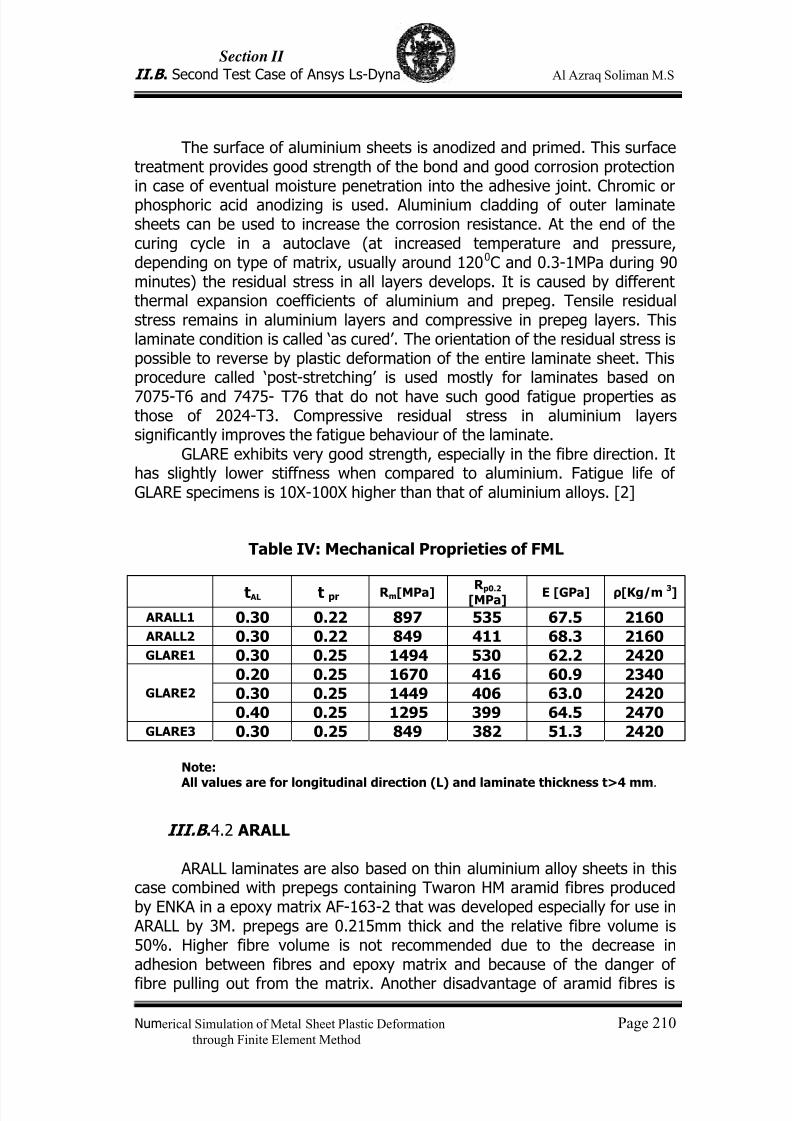
7/23/2019 Al Azraq Ingegneria Chimica Dei Materiali e Della Produzione
http://slidepdf.com/reader/full/al-azraq-ingegneria-chimica-dei-materiali-e-della-produzione 221/419
Section II
II.B . Second Test Case of Ansys Ls-Dyna Al Azraq Soliman M.S
Numerical Simulation of Metal Sheet Plastic Deformation Page 210through Finite Element Method
The surface of aluminium sheets is anodized and primed. This surfacetreatment provides good strength of the bond and good corrosion protectionin case of eventual moisture penetration into the adhesive joint. Chromic orphosphoric acid anodizing is used. Aluminium cladding of outer laminatesheets can be used to increase the corrosion resistance. At the end of thecuring cycle in a autoclave (at increased temperature and pressure,depending on type of matrix, usually around 1200C and 0.3-1MPa during 90minutes) the residual stress in all layers develops. It is caused by differentthermal expansion coefficients of aluminium and prepeg. Tensile residualstress remains in aluminium layers and compressive in prepeg layers. Thislaminate condition is called ‘as cured’. The orientation of the residual stress ispossible to reverse by plastic deformation of the entire laminate sheet. Thisprocedure called ‘post-stretching’ is used mostly for laminates based on
7075-T6 and 7475- T76 that do not have such good fatigue properties asthose of 2024-T3. Compressive residual stress in aluminium layerssignificantly improves the fatigue behaviour of the laminate.
GLARE exhibits very good strength, especially in the fibre direction. Ithas slightly lower stiffness when compared to aluminium. Fatigue life ofGLARE specimens is 10X-100X higher than that of aluminium alloys. [2]
Table IV: Mechanical Proprieties of FML
t AL t pr R m [MPa] R p0.2[MPa] E [GPa] ρ [Kg/m 3]
ARALL1 0.30 0.22 897 535 67.5 2160 ARALL2 0.30 0.22 849 411 68.3 2160GLARE1 0.30 0.25 1494 530 62.2 2420
0.20 0.25 1670 416 60.9 2340
0.30 0.25 1449 406 63.0 2420GLARE2
0.40 0.25 1295 399 64.5 2470GLARE3 0.30 0.25 849 382 51.3 2420
Note:
All values are for longitudinal direction (L) and laminate thickness t>4 mm.
III.B .4.2 ARALL
ARALL laminates are also based on thin aluminium alloy sheets in thiscase combined with prepegs containing Twaron HM aramid fibres producedby ENKA in a epoxy matrix AF-163-2 that was developed especially for use in
ARALL by 3M. prepegs are 0.215mm thick and the relative fibre volume is50%. Higher fibre volume is not recommended due to the decrease inadhesion between fibres and epoxy matrix and because of the danger of
fibre pulling out from the matrix. Another disadvantage of aramid fibres is
7/23/2019 Al Azraq Ingegneria Chimica Dei Materiali e Della Produzione
http://slidepdf.com/reader/full/al-azraq-ingegneria-chimica-dei-materiali-e-della-produzione 222/419
Section II
II.B . Second Test Case of Ansys Ls-Dyna Al Azraq Soliman M.S
Numerical Simulation of Metal Sheet Plastic Deformation Page 211through Finite Element Method
the low resistance to compressive deformation. Because of this it isnecessary to ‘post-stretch’ the ARALL laminate sheets after curing, and toreverse the residual stress to tensile in prepreg layers and compressive inaluminium layers.
ARALL laminates are produced only with uniaxially fibres. They exhibitlower strength but higher stiffness when compared to GLARE. Fatigueresistance is the best in the case of asymmetric tensile cycle loading. Thanksto the low density of aramid fibres ARALL is the lightest of the currentlyproduced types of FML.
III.B .4.3 CARE
CARE is based on a combination of thin aluminium alloy sheets and
carbon fibres prepregs. Application of prepregs containing various carbonfibres from high strength to high modulus types were tested at DelftUniversity of Technology.
The possibility of galvanic corrosion presents a potential problemwhen combining carbon fibres and aluminium. The fibres in the prepregs arecovered by an epoxy matrix, which should represent an isolating layer, but inspite of that, direct contact between fibre and aluminium can occur. Only twoways of preventing the eventual galvanic cell formation were developed andtested so far:
- aluminium sheets covered by very thin (0.02mm) thermoplastic layer
based on polyetherimide (PEI)- thin glass fibre prepreg (0.1mm) isolates the carbon fibre prepreg on
both sides
CARE laminates with uniaxially and biaxially oriented fibres weretested. They show similar strength as ARALL laminates. The stiffness ofCARE strongly depends on the type of fibres used and can be twice as highwhen compared to ARALL or GLARE. Fatigue performance might be slightlylowered when PEI coating is used but it still is fully comparable with thefatigue performance of GLARE. Specific weight of CARE varies between
values valid for ARALL and GLARE depending on the applied type of carbonfibres and isolating layer. There is no commercial version of CARE currentlyavailable.
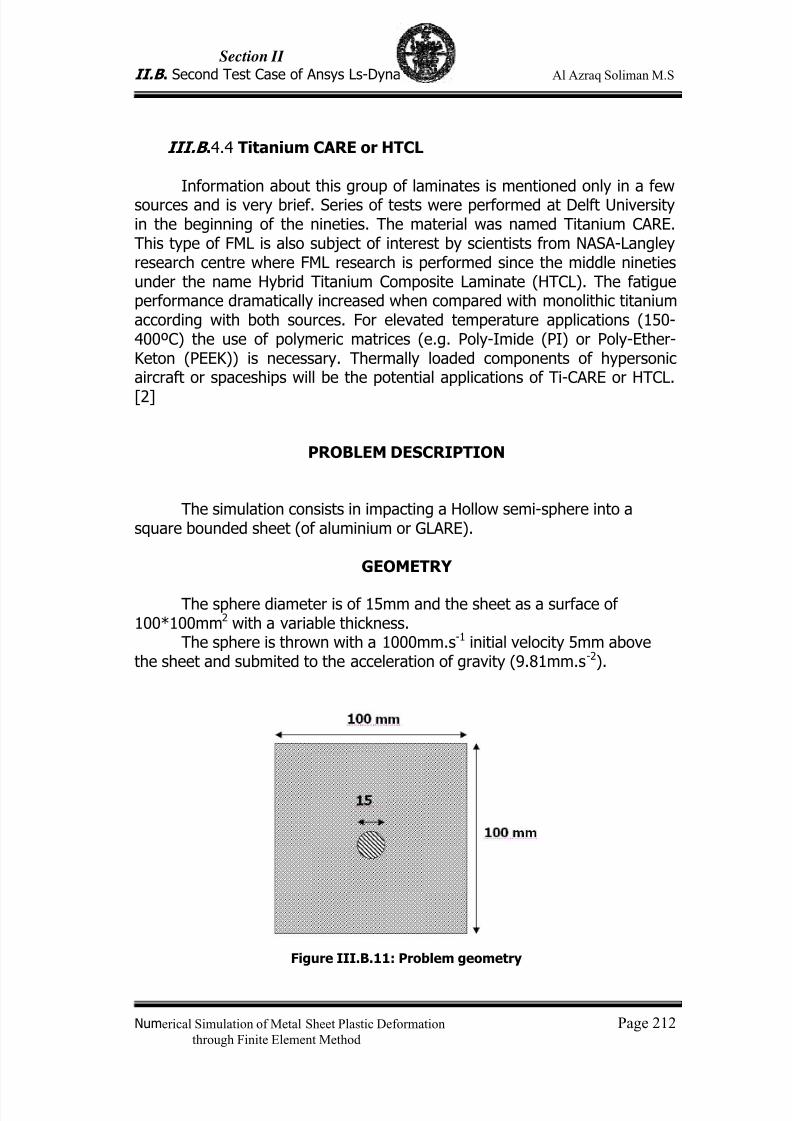
7/23/2019 Al Azraq Ingegneria Chimica Dei Materiali e Della Produzione
http://slidepdf.com/reader/full/al-azraq-ingegneria-chimica-dei-materiali-e-della-produzione 223/419
Section II
II.B . Second Test Case of Ansys Ls-Dyna Al Azraq Soliman M.S
Numerical Simulation of Metal Sheet Plastic Deformation Page 212through Finite Element Method
III.B .4.4 Titanium CARE or HTCL
Information about this group of laminates is mentioned only in a fewsources and is very brief. Series of tests were performed at Delft Universityin the beginning of the nineties. The material was named Titanium CARE.This type of FML is also subject of interest by scientists from NASA-Langleyresearch centre where FML research is performed since the middle ninetiesunder the name Hybrid Titanium Composite Laminate (HTCL). The fatigueperformance dramatically increased when compared with monolithic titaniumaccording with both sources. For elevated temperature applications (150-400ºC) the use of polymeric matrices (e.g. Poly-Imide (PI) or Poly-Ether-Keton (PEEK)) is necessary. Thermally loaded components of hypersonicaircraft or spaceships will be the potential applications of Ti-CARE or HTCL.
[2]
PROBLEM DESCRIPTION
The simulation consists in impacting a Hollow semi-sphere into asquare bounded sheet (of aluminium or GLARE).
GEOMETRY
The sphere diameter is of 15mm and the sheet as a surface of100*100mm2 with a variable thickness.
The sphere is thrown with a 1000mm.s-1 initial velocity 5mm abovethe sheet and submited to the acceleration of gravity (9.81mm.s-2).
Figure III.B.11: Problem geometry
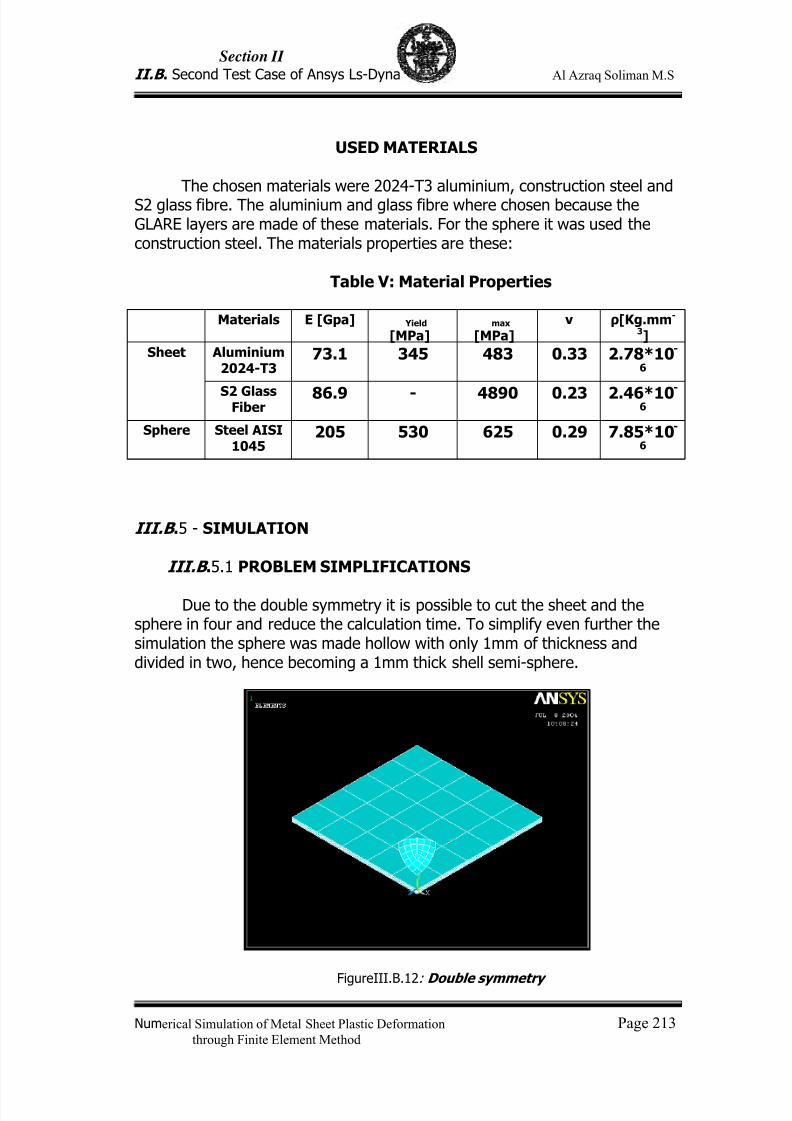
7/23/2019 Al Azraq Ingegneria Chimica Dei Materiali e Della Produzione
http://slidepdf.com/reader/full/al-azraq-ingegneria-chimica-dei-materiali-e-della-produzione 224/419
Section II
II.B . Second Test Case of Ansys Ls-Dyna Al Azraq Soliman M.S
Numerical Simulation of Metal Sheet Plastic Deformation Page 213through Finite Element Method
USED MATERIALS
The chosen materials were 2024-T3 aluminium, construction steel andS2 glass fibre. The aluminium and glass fibre where chosen because theGLARE layers are made of these materials. For the sphere it was used theconstruction steel. The materials properties are these:
Table V: Material Properties
III.B .5 - SIMULATION
III.B .5.1 PROBLEM SIMPLIFICATIONS
Due to the double symmetry it is possible to cut the sheet and thesphere in four and reduce the calculation time. To simplify even further thesimulation the sphere was made hollow with only 1mm of thickness anddivided in two, hence becoming a 1mm thick shell semi-sphere.
FigureIII.B.12: Double symmetry
Materials E [Gpa] Yield
[MPa]
max
[MPa]
ν ρ[Kg.mm-
3]
Aluminium2024-T3
73.1 345 483 0.33 2.78*10-
6
Sheet
S2 GlassFiber
86.9 - 4890 0.23 2.46*10-6
Sphere Steel AISI1045
205 530 625 0.29 7.85*10-
6
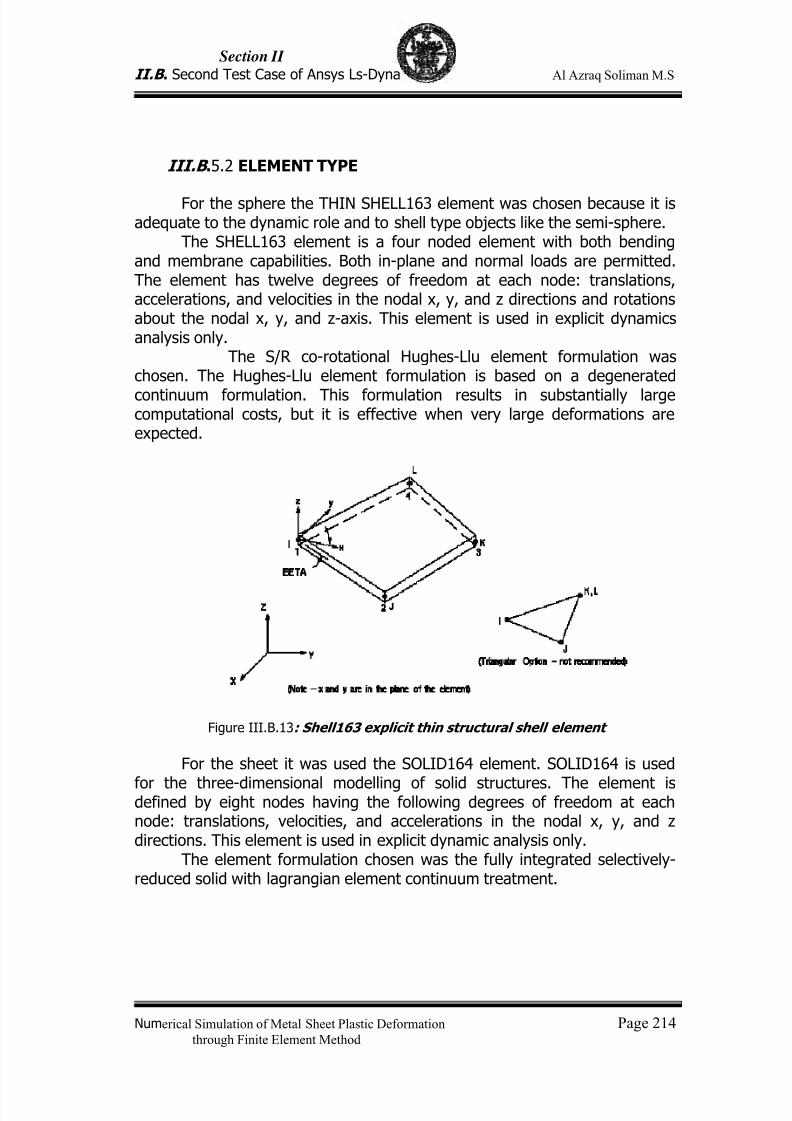
7/23/2019 Al Azraq Ingegneria Chimica Dei Materiali e Della Produzione
http://slidepdf.com/reader/full/al-azraq-ingegneria-chimica-dei-materiali-e-della-produzione 225/419
Section II
II.B . Second Test Case of Ansys Ls-Dyna Al Azraq Soliman M.S
Numerical Simulation of Metal Sheet Plastic Deformation Page 214through Finite Element Method
III.B .5.2 ELEMENT TYPE
For the sphere the THIN SHELL163 element was chosen because it isadequate to the dynamic role and to shell type objects like the semi-sphere.
The SHELL163 element is a four noded element with both bendingand membrane capabilities. Both in-plane and normal loads are permitted.The element has twelve degrees of freedom at each node: translations,accelerations, and velocities in the nodal x, y, and z directions and rotationsabout the nodal x, y, and z-axis. This element is used in explicit dynamicsanalysis only.
The S/R co-rotational Hughes-Llu element formulation waschosen. The Hughes-Llu element formulation is based on a degenerated
continuum formulation. This formulation results in substantially largecomputational costs, but it is effective when very large deformations areexpected.
Figure III.B.13: Shell163 explicit thin structural shell element
For the sheet it was used the SOLID164 element. SOLID164 is used
for the three-dimensional modelling of solid structures. The element isdefined by eight nodes having the following degrees of freedom at eachnode: translations, velocities, and accelerations in the nodal x, y, and zdirections. This element is used in explicit dynamic analysis only.
The element formulation chosen was the fully integrated selectively-reduced solid with lagrangian element continuum treatment.
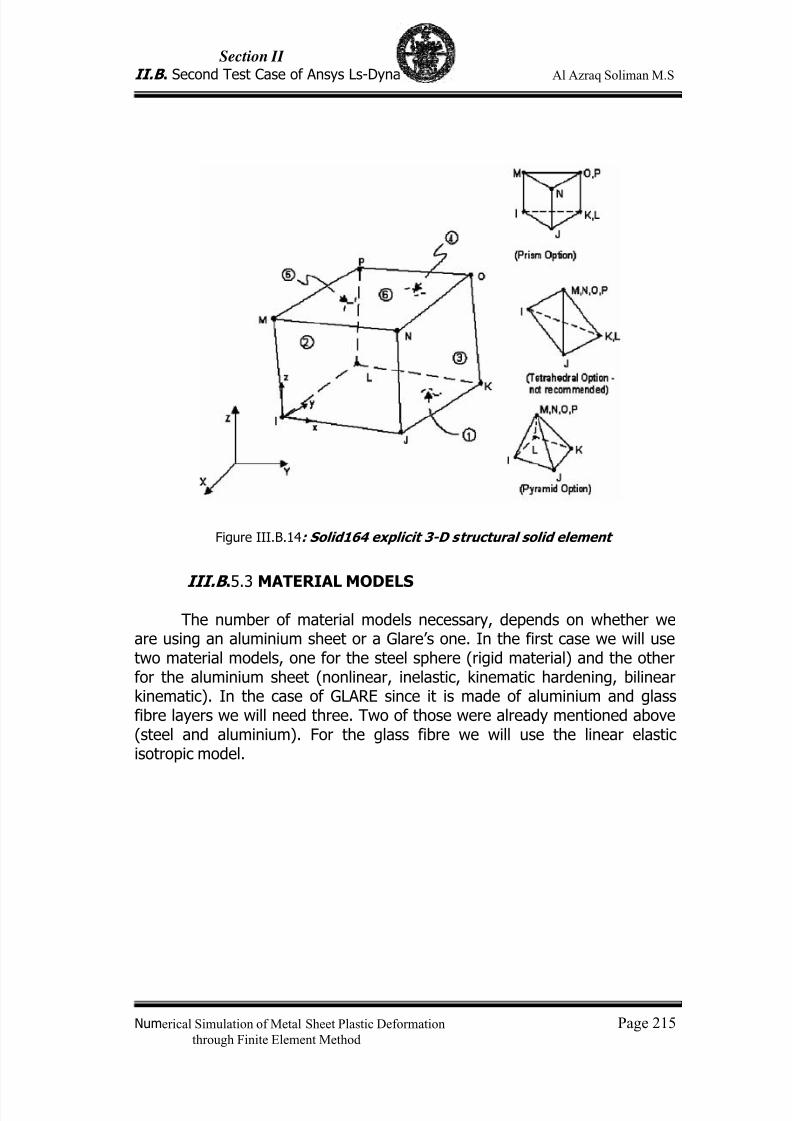
7/23/2019 Al Azraq Ingegneria Chimica Dei Materiali e Della Produzione
http://slidepdf.com/reader/full/al-azraq-ingegneria-chimica-dei-materiali-e-della-produzione 226/419
Section II
II.B . Second Test Case of Ansys Ls-Dyna Al Azraq Soliman M.S
Numerical Simulation of Metal Sheet Plastic Deformation Page 215through Finite Element Method
Figure III.B.14: Solid164 explicit 3-D structural solid element
III.B .5.3 MATERIAL MODELS
The number of material models necessary, depends on whether weare using an aluminium sheet or a Glare’s one. In the first case we will usetwo material models, one for the steel sphere (rigid material) and the otherfor the aluminium sheet (nonlinear, inelastic, kinematic hardening, bilinearkinematic). In the case of GLARE since it is made of aluminium and glassfibre layers we will need three. Two of those were already mentioned above(steel and aluminium). For the glass fibre we will use the linear elasticisotropic model.
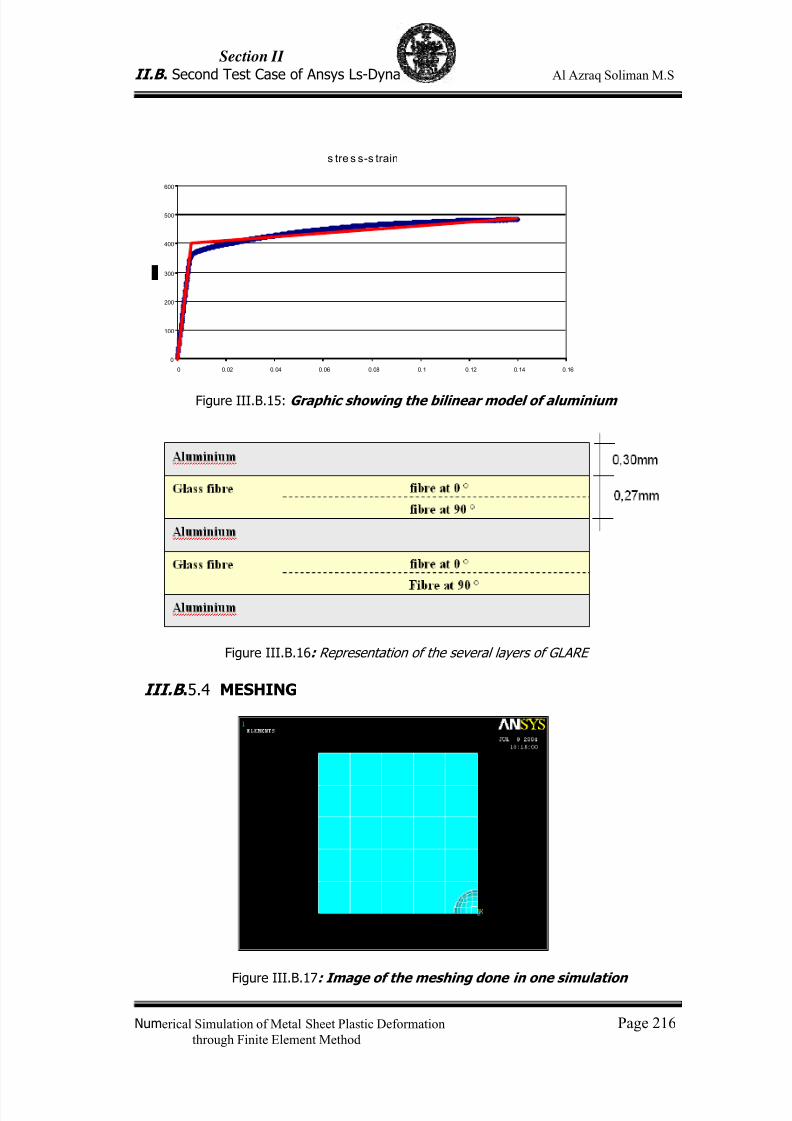
7/23/2019 Al Azraq Ingegneria Chimica Dei Materiali e Della Produzione
http://slidepdf.com/reader/full/al-azraq-ingegneria-chimica-dei-materiali-e-della-produzione 227/419
Section II
II.B . Second Test Case of Ansys Ls-Dyna Al Azraq Soliman M.S
Numerical Simulation of Metal Sheet Plastic Deformation Page 216through Finite Element Method
s tre s s -s train
0
100
200
300
400
500
600
0 0.02 0.04 0.06 0.08 0.1 0.12 0.14 0.16
Figure III.B.15: Graphic showing the bilinear model of aluminium
Figure III.B.16: Representation of the several layers of GLARE
III.B .5.4 MESHING
Figure III.B.17: Image of the meshing done in one simulation
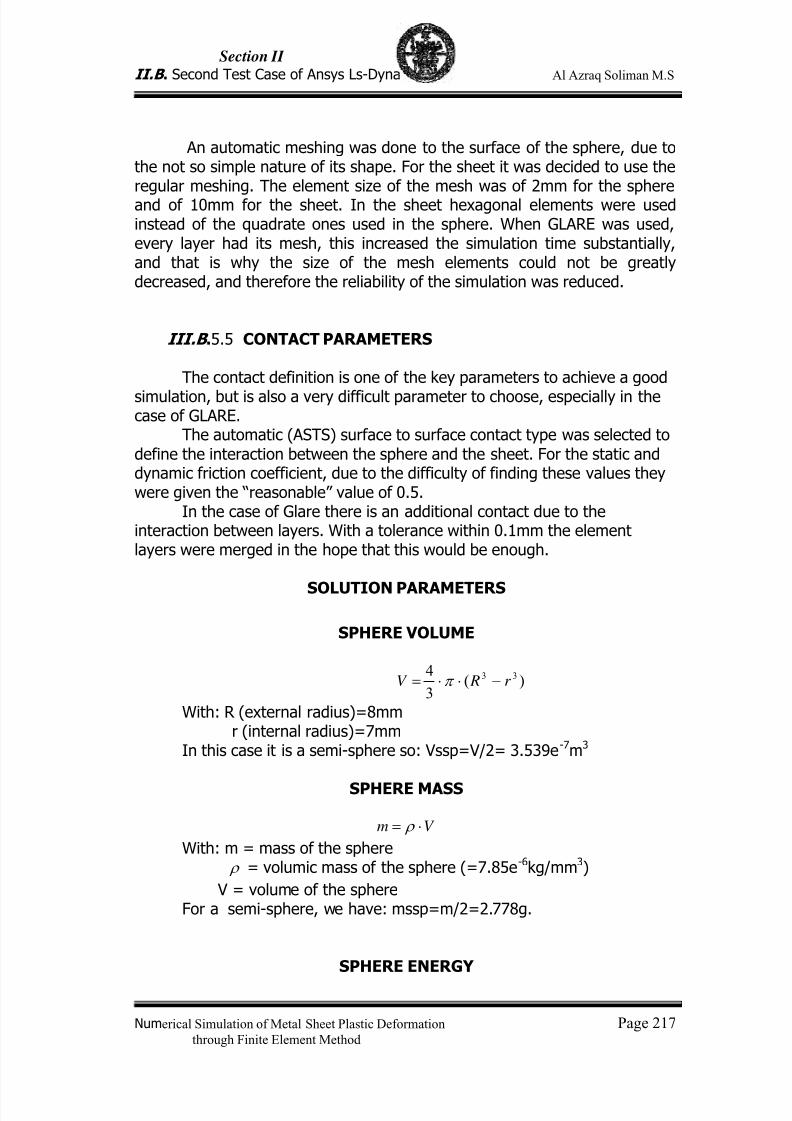
7/23/2019 Al Azraq Ingegneria Chimica Dei Materiali e Della Produzione
http://slidepdf.com/reader/full/al-azraq-ingegneria-chimica-dei-materiali-e-della-produzione 228/419
Section II
II.B . Second Test Case of Ansys Ls-Dyna Al Azraq Soliman M.S
Numerical Simulation of Metal Sheet Plastic Deformation Page 217through Finite Element Method
An automatic meshing was done to the surface of the sphere, due tothe not so simple nature of its shape. For the sheet it was decided to use theregular meshing. The element size of the mesh was of 2mm for the sphereand of 10mm for the sheet. In the sheet hexagonal elements were usedinstead of the quadrate ones used in the sphere. When GLARE was used,every layer had its mesh, this increased the simulation time substantially,and that is why the size of the mesh elements could not be greatlydecreased, and therefore the reliability of the simulation was reduced.
III.B .5.5 CONTACT PARAMETERS
The contact definition is one of the key parameters to achieve a good
simulation, but is also a very difficult parameter to choose, especially in thecase of GLARE.
The automatic (ASTS) surface to surface contact type was selected todefine the interaction between the sphere and the sheet. For the static anddynamic friction coefficient, due to the difficulty of finding these values theywere given the “reasonable” value of 0.5.
In the case of Glare there is an additional contact due to theinteraction between layers. With a tolerance within 0.1mm the elementlayers were merged in the hope that this would be enough.
SOLUTION PARAMETERS
SPHERE VOLUME
)(3
4 33r RV −⋅⋅= π
With: R (external radius)=8mmr (internal radius)=7mm
In this case it is a semi-sphere so: Vssp=V/2= 3.539e-7m3
SPHERE MASS
V m ⋅= ρ
With: m = mass of the sphere ρ = volumic mass of the sphere (=7.85e-6kg/mm3)
V = volume of the sphereFor a semi-sphere, we have: mssp=m/2=2.778g.
SPHERE ENERGY
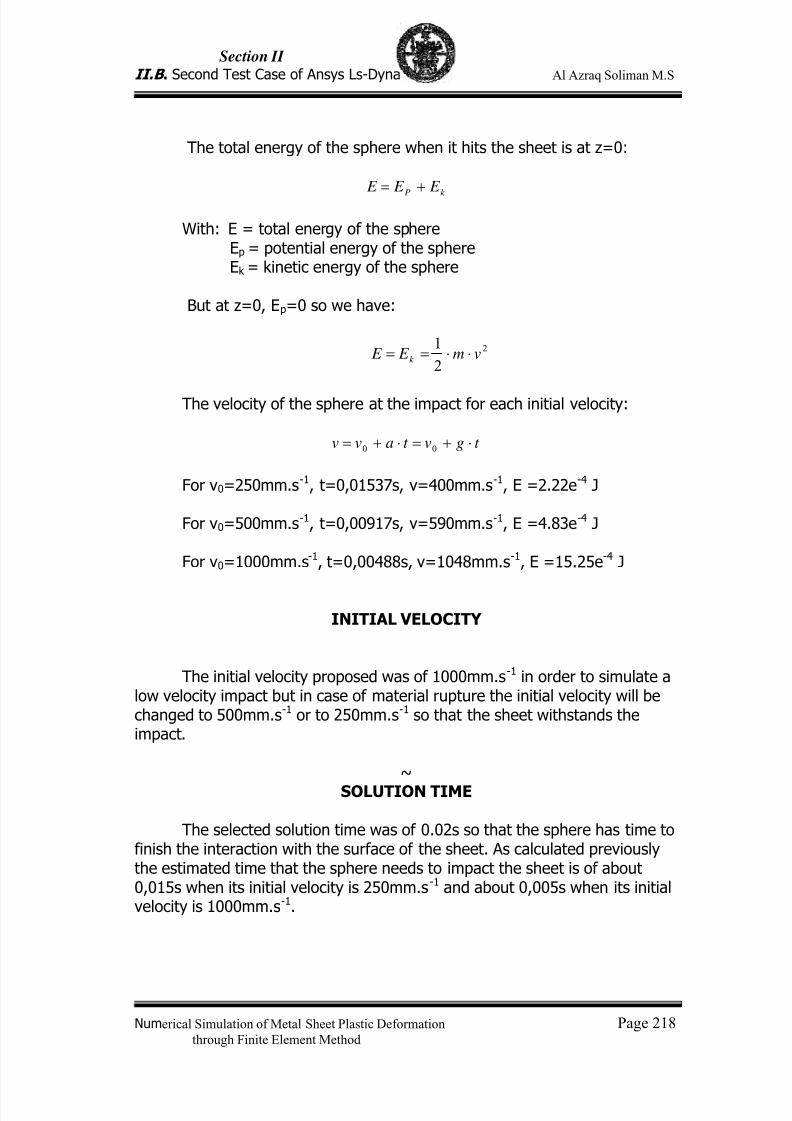
7/23/2019 Al Azraq Ingegneria Chimica Dei Materiali e Della Produzione
http://slidepdf.com/reader/full/al-azraq-ingegneria-chimica-dei-materiali-e-della-produzione 229/419
Section II
II.B . Second Test Case of Ansys Ls-Dyna Al Azraq Soliman M.S
Numerical Simulation of Metal Sheet Plastic Deformation Page 218through Finite Element Method
The total energy of the sphere when it hits the sheet is at z=0:
k P
E E E +=
With: E = total energy of the sphereEp = potential energy of the sphereEk = kinetic energy of the sphere
But at z=0, Ep=0 so we have:
2
2
1vm E E k ⋅⋅==
The velocity of the sphere at the impact for each initial velocity:
t gvt avv ⋅+=⋅+= 00
For v0=250mm.s-1, t=0,01537s, v=400mm.s-1, E =2.22e-4 J
For v0=500mm.s-1, t=0,00917s, v=590mm.s-1, E =4.83e-4 J
For v0=1000mm.s-1, t=0,00488s, v=1048mm.s-1, E =15.25e-4 J
INITIAL VELOCITY
The initial velocity proposed was of 1000mm.s-1 in order to simulate alow velocity impact but in case of material rupture the initial velocity will bechanged to 500mm.s-1 or to 250mm.s-1 so that the sheet withstands theimpact .
~
SOLUTION TIME
The selected solution time was of 0.02s so that the sphere has time tofinish the interaction with the surface of the sheet. As calculated previouslythe estimated time that the sphere needs to impact the sheet is of about0,015s when its initial velocity is 250mm.s-1 and about 0,005s when its initialvelocity is 1000mm.s-1.
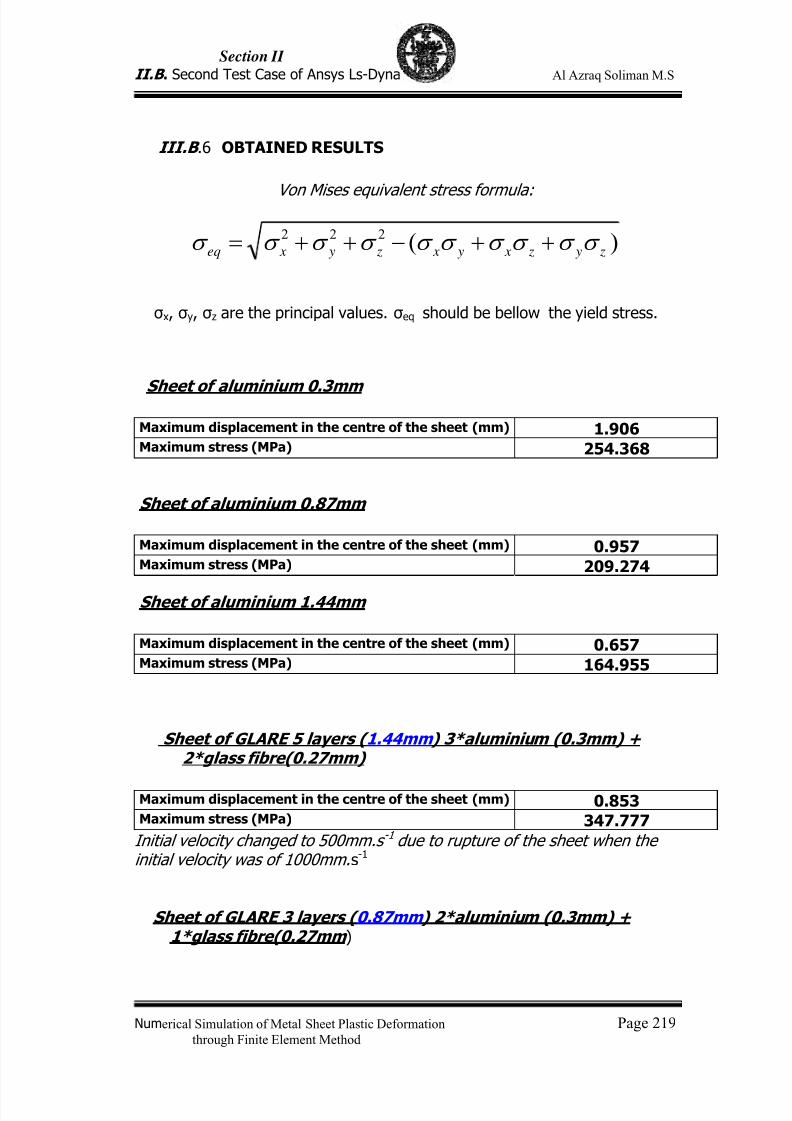
7/23/2019 Al Azraq Ingegneria Chimica Dei Materiali e Della Produzione
http://slidepdf.com/reader/full/al-azraq-ingegneria-chimica-dei-materiali-e-della-produzione 230/419
Section II
II.B . Second Test Case of Ansys Ls-Dyna Al Azraq Soliman M.S
Numerical Simulation of Metal Sheet Plastic Deformation Page 219through Finite Element Method
III.B .6 OBTAINED RESULTS
Von Mises equivalent stress formula:
)(222
z y z x y x z y xeq σ σ σ σ σ σ σ σ σ σ ++−++=
σx, σy, σz are the principal values. σeq should be bellow the yield stress.
Sheet of aluminium 0.3mm
Maximum displacement in the centre of the sheet (mm) 1.906Maximum stress (MPa) 254.368
Sheet of aluminium 0.87mm
Maximum displacement in the centre of the sheet (mm) 0.957Maximum stress (MPa) 209.274
Sheet of aluminium 1.44mm
Maximum displacement in the centre of the sheet (mm) 0.657Maximum stress (MPa) 164.955
Sheet of GLARE 5 layers ( 1.44mm ) 3*aluminium (0.3mm) +2*glass fibre(0.27mm)
Maximum displacement in the centre of the sheet (mm) 0.853Maximum stress (MPa) 347.777
Initial velocity changed to 500mm.s -1 due to rupture of the sheet when theinitial velocity was of 1000mm.s-1
Sheet of GLARE 3 layers ( 0.87mm ) 2*aluminium (0.3mm) +1*glass fibre(0.27mm )
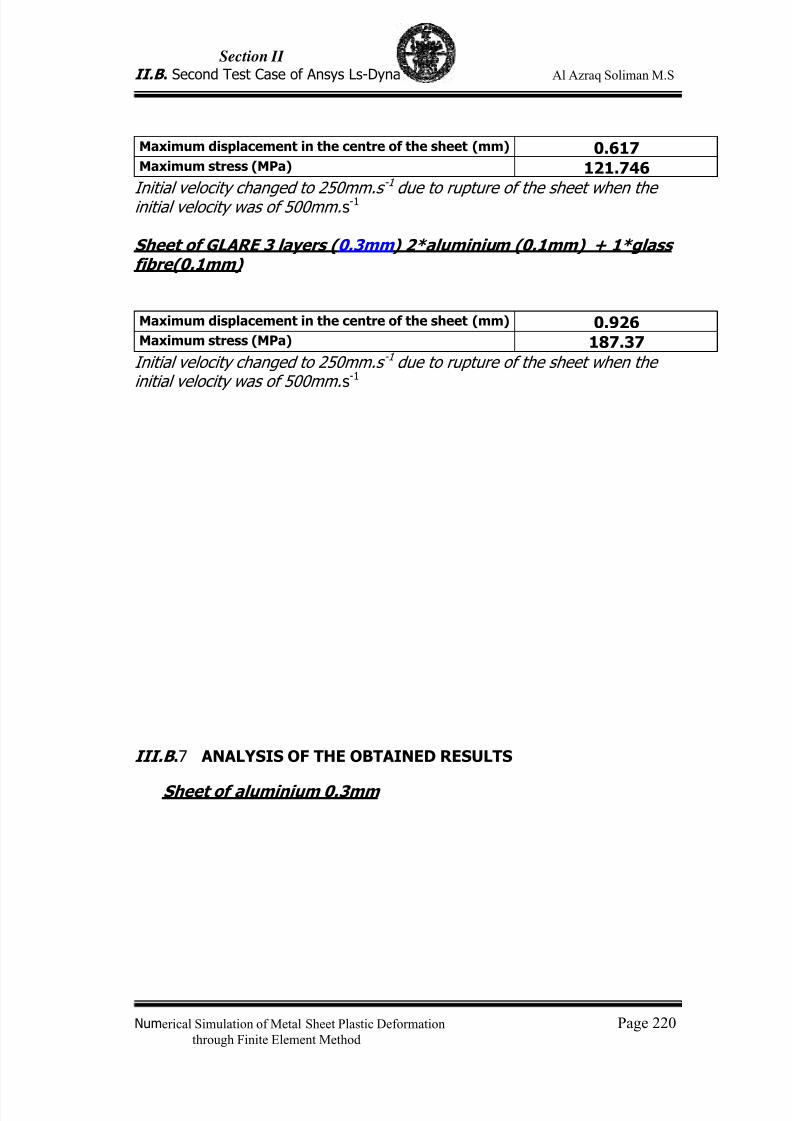
7/23/2019 Al Azraq Ingegneria Chimica Dei Materiali e Della Produzione
http://slidepdf.com/reader/full/al-azraq-ingegneria-chimica-dei-materiali-e-della-produzione 231/419
Section II
II.B . Second Test Case of Ansys Ls-Dyna Al Azraq Soliman M.S
Numerical Simulation of Metal Sheet Plastic Deformation Page 220through Finite Element Method
Maximum displacement in the centre of the sheet (mm) 0.617Maximum stress (MPa) 121.746
Initial velocity changed to 250mm.s
-1
due to rupture of the sheet when theinitial velocity was of 500mm.s-1
Sheet of GLARE 3 layers ( 0.3mm ) 2*aluminium (0.1mm) + 1*glassfibre(0.1mm)
Maximum displacement in the centre of the sheet (mm) 0.926Maximum stress (MPa) 187.37
Initial velocity changed to 250mm.s -1 due to rupture of the sheet when theinitial velocity was of 500mm.s-1
III.B .7 ANALYSIS OF THE OBTAINED RESULTS
Sheet of aluminium 0.3mm
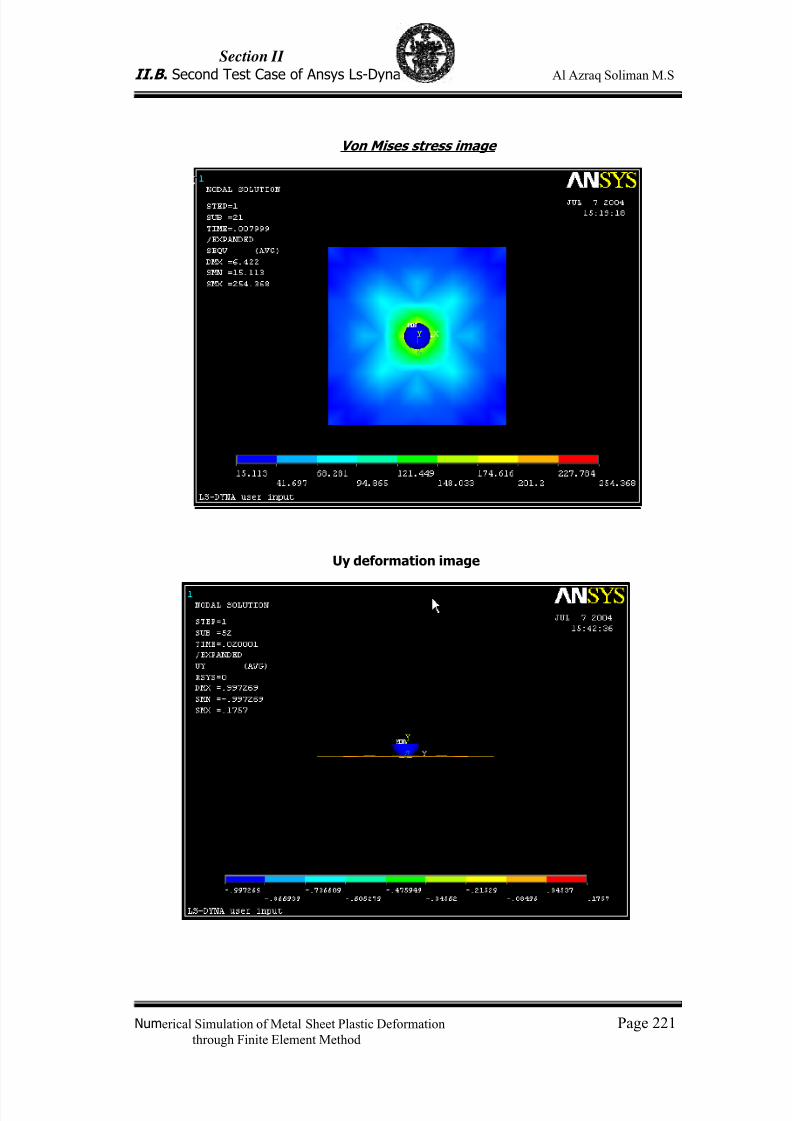
7/23/2019 Al Azraq Ingegneria Chimica Dei Materiali e Della Produzione
http://slidepdf.com/reader/full/al-azraq-ingegneria-chimica-dei-materiali-e-della-produzione 232/419
Section II
II.B . Second Test Case of Ansys Ls-Dyna Al Azraq Soliman M.S
Numerical Simulation of Metal Sheet Plastic Deformation Page 221through Finite Element Method
Von Mises stress image
Uy deformation image
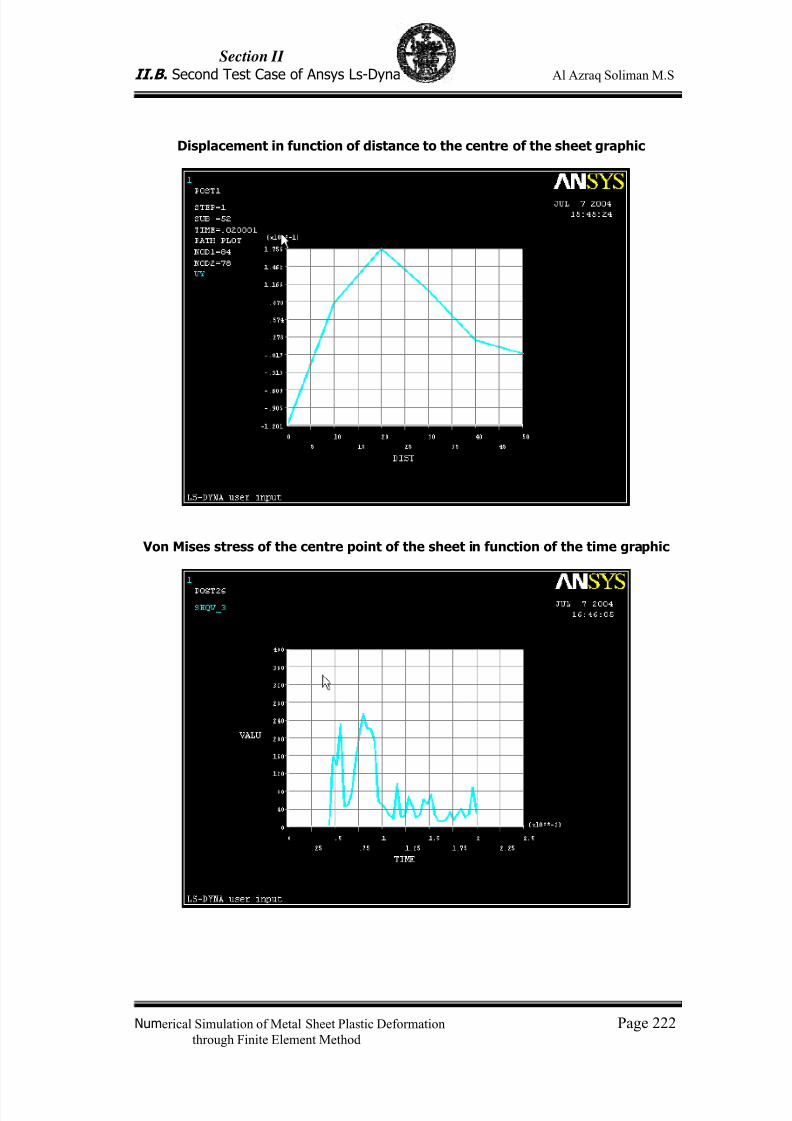
7/23/2019 Al Azraq Ingegneria Chimica Dei Materiali e Della Produzione
http://slidepdf.com/reader/full/al-azraq-ingegneria-chimica-dei-materiali-e-della-produzione 233/419
Section II
II.B . Second Test Case of Ansys Ls-Dyna Al Azraq Soliman M.S
Numerical Simulation of Metal Sheet Plastic Deformation Page 222through Finite Element Method
Displacement in function of distance to the centre of the sheet graphic
Von Mises stress of the centre point of the sheet in function of the time graphic
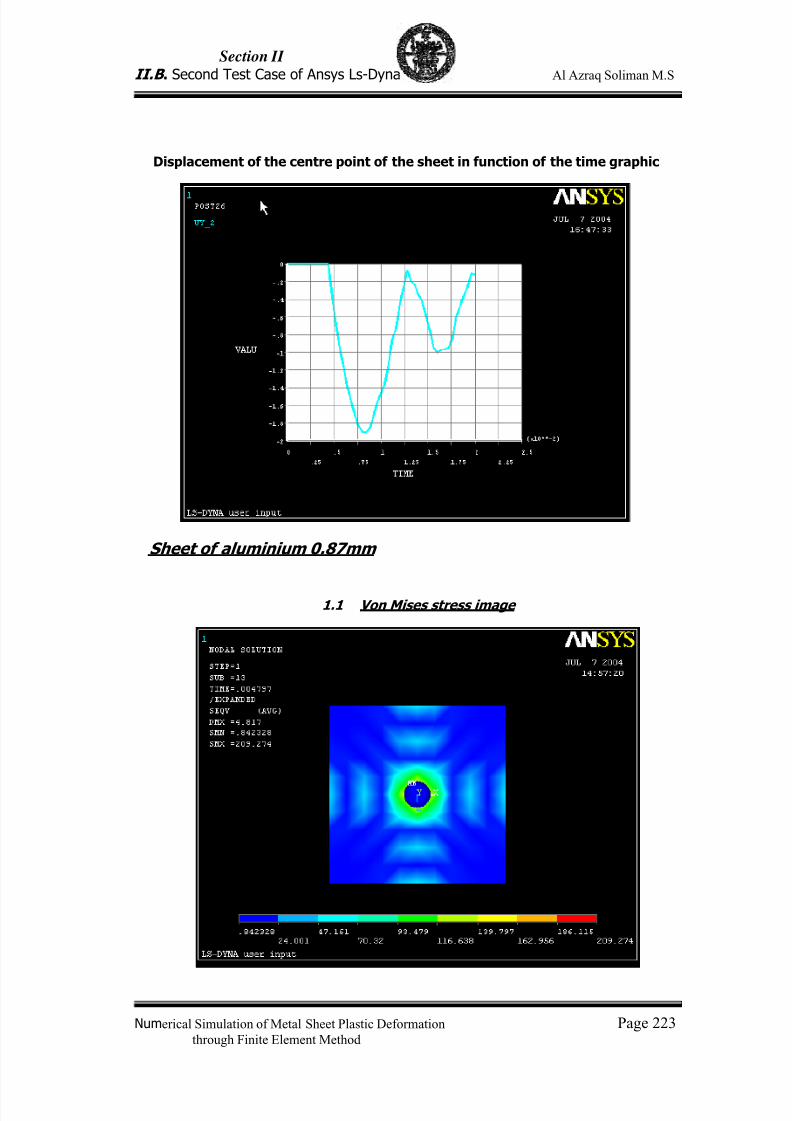
7/23/2019 Al Azraq Ingegneria Chimica Dei Materiali e Della Produzione
http://slidepdf.com/reader/full/al-azraq-ingegneria-chimica-dei-materiali-e-della-produzione 234/419
Section II
II.B . Second Test Case of Ansys Ls-Dyna Al Azraq Soliman M.S
Numerical Simulation of Metal Sheet Plastic Deformation Page 223through Finite Element Method
Displacement of the centre point of the sheet in function of the time graphic
Sheet of aluminium 0.87mm
1.1 Von Mises stress image
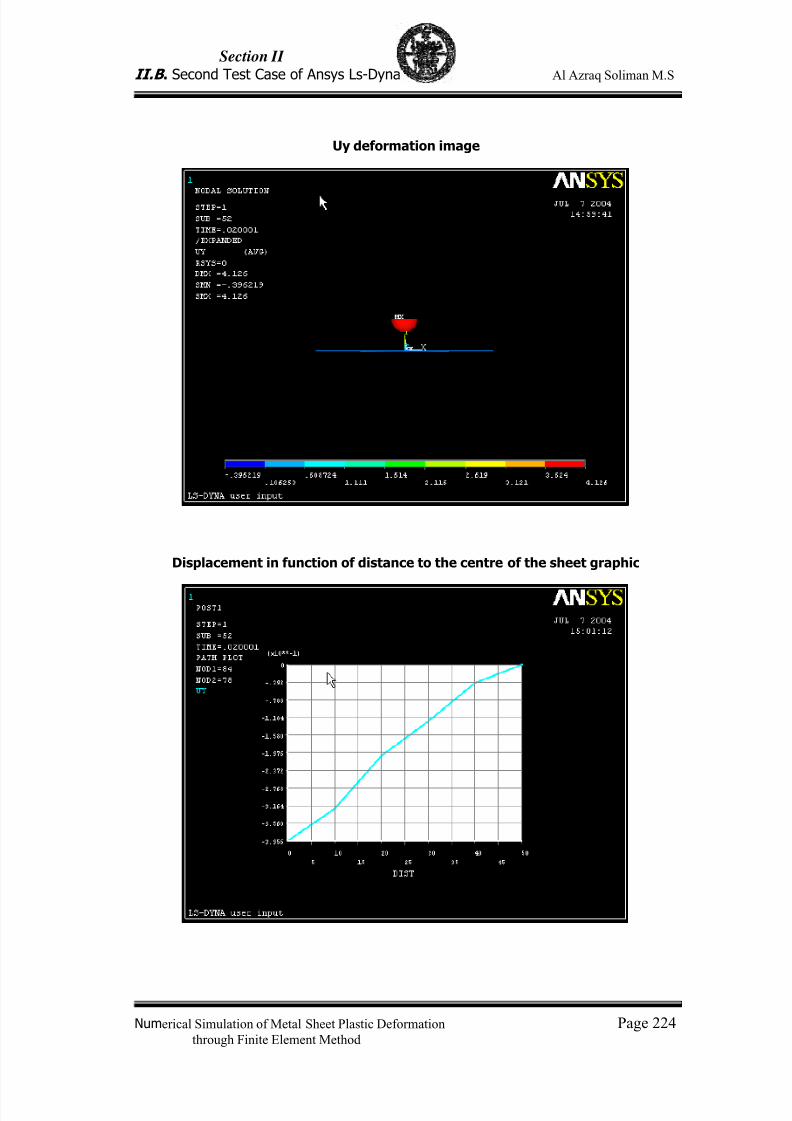
7/23/2019 Al Azraq Ingegneria Chimica Dei Materiali e Della Produzione
http://slidepdf.com/reader/full/al-azraq-ingegneria-chimica-dei-materiali-e-della-produzione 235/419
Section II
II.B . Second Test Case of Ansys Ls-Dyna Al Azraq Soliman M.S
Numerical Simulation of Metal Sheet Plastic Deformation Page 224through Finite Element Method
Uy deformation image
Displacement in function of distance to the centre of the sheet graphic

7/23/2019 Al Azraq Ingegneria Chimica Dei Materiali e Della Produzione
http://slidepdf.com/reader/full/al-azraq-ingegneria-chimica-dei-materiali-e-della-produzione 236/419
Section II
II.B . Second Test Case of Ansys Ls-Dyna Al Azraq Soliman M.S
Numerical Simulation of Metal Sheet Plastic Deformation Page 225through Finite Element Method
Von Mises stress of the centre point of the sheet in function of the time graphic
Displacement of the centre point of the sheet in function of the time graphic
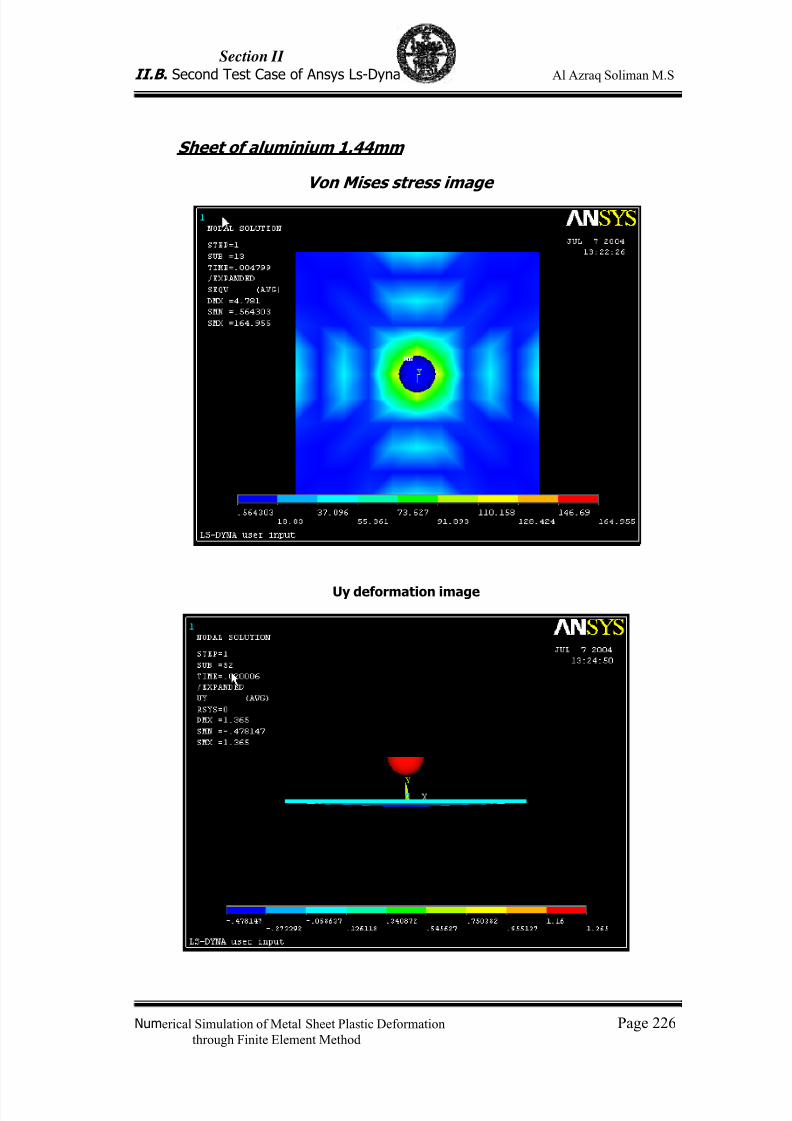
7/23/2019 Al Azraq Ingegneria Chimica Dei Materiali e Della Produzione
http://slidepdf.com/reader/full/al-azraq-ingegneria-chimica-dei-materiali-e-della-produzione 237/419
Section II
II.B . Second Test Case of Ansys Ls-Dyna Al Azraq Soliman M.S
Numerical Simulation of Metal Sheet Plastic Deformation Page 226through Finite Element Method
Sheet of aluminium 1.44mm
Von Mises stress image
Uy deformation image

7/23/2019 Al Azraq Ingegneria Chimica Dei Materiali e Della Produzione
http://slidepdf.com/reader/full/al-azraq-ingegneria-chimica-dei-materiali-e-della-produzione 238/419
Section II
II.B . Second Test Case of Ansys Ls-Dyna Al Azraq Soliman M.S
Numerical Simulation of Metal Sheet Plastic Deformation Page 227through Finite Element Method
Displacement in function of distance to the centre of the sheet graphic
Von Mises stress of the centre point of the sheet in function of the time graphic
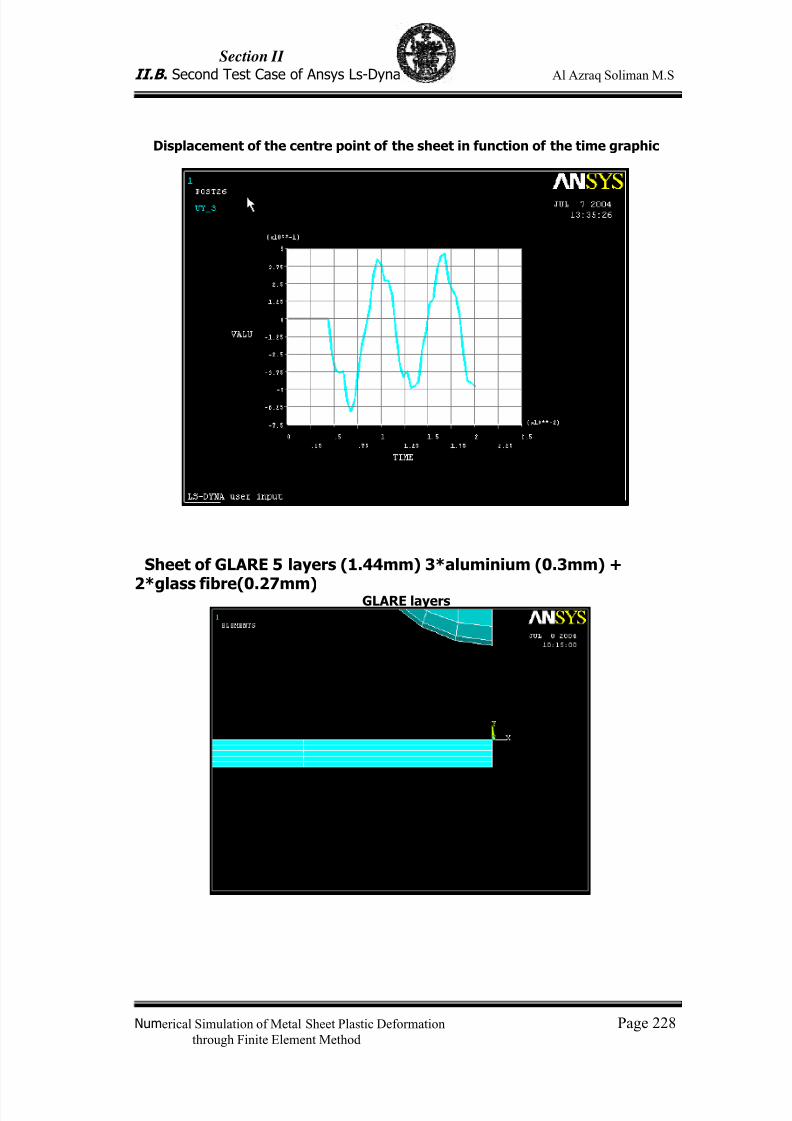
7/23/2019 Al Azraq Ingegneria Chimica Dei Materiali e Della Produzione
http://slidepdf.com/reader/full/al-azraq-ingegneria-chimica-dei-materiali-e-della-produzione 239/419
Section II
II.B . Second Test Case of Ansys Ls-Dyna Al Azraq Soliman M.S
Numerical Simulation of Metal Sheet Plastic Deformation Page 228through Finite Element Method
Displacement of the centre point of the sheet in function of the time graphic
Sheet of GLARE 5 layers (1.44mm) 3*aluminium (0.3mm) +
2*glass fibre(0.27mm) GLARE layers
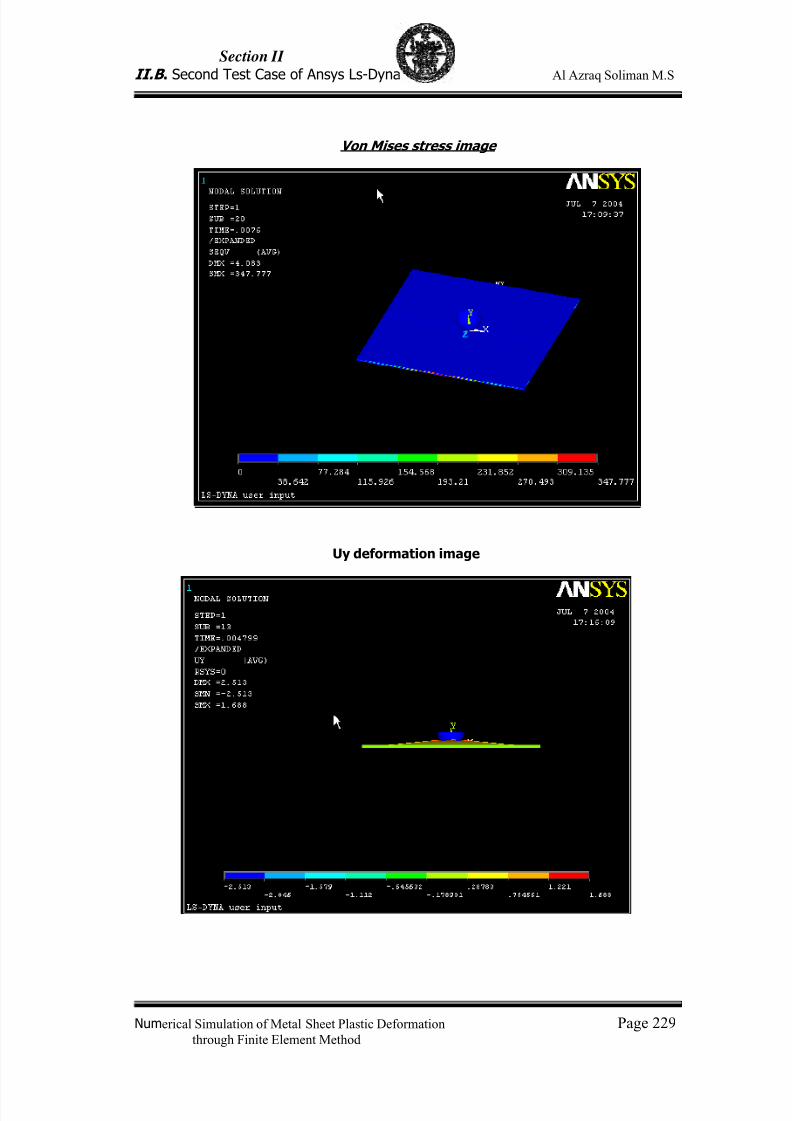
7/23/2019 Al Azraq Ingegneria Chimica Dei Materiali e Della Produzione
http://slidepdf.com/reader/full/al-azraq-ingegneria-chimica-dei-materiali-e-della-produzione 240/419
Section II
II.B . Second Test Case of Ansys Ls-Dyna Al Azraq Soliman M.S
Numerical Simulation of Metal Sheet Plastic Deformation Page 229through Finite Element Method
Von Mises stress image
Uy deformation image
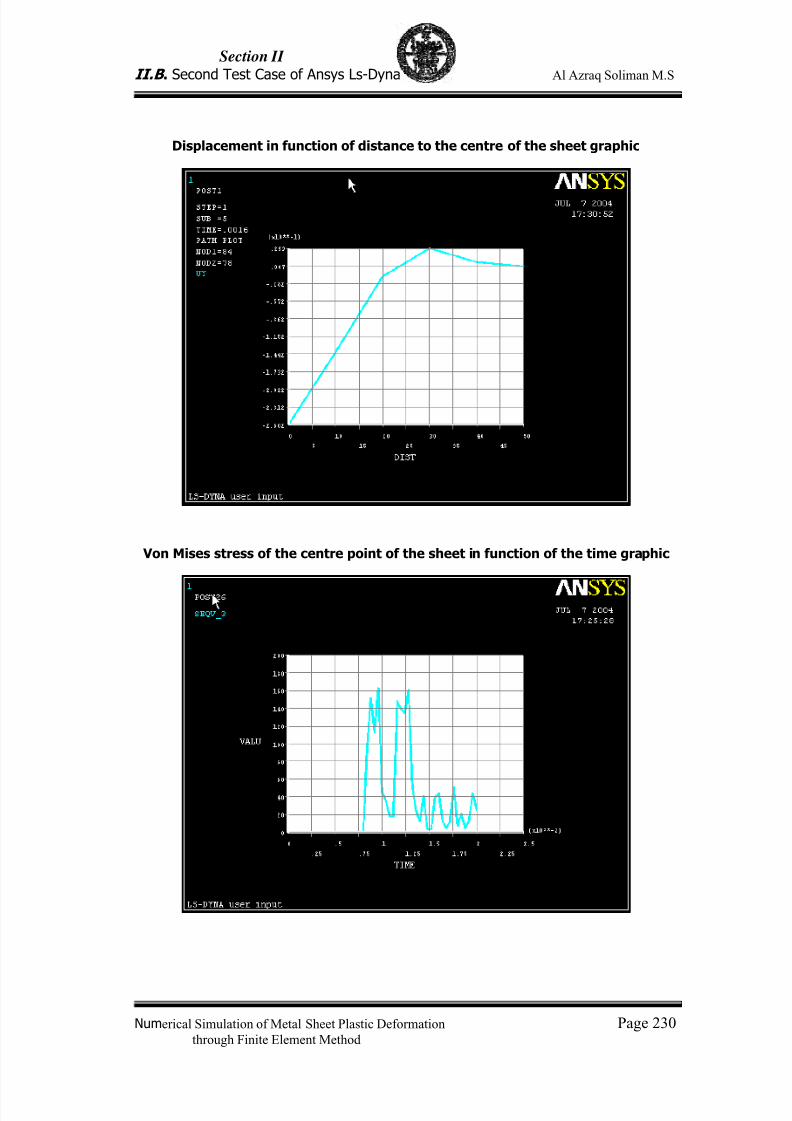
7/23/2019 Al Azraq Ingegneria Chimica Dei Materiali e Della Produzione
http://slidepdf.com/reader/full/al-azraq-ingegneria-chimica-dei-materiali-e-della-produzione 241/419
Section II
II.B . Second Test Case of Ansys Ls-Dyna Al Azraq Soliman M.S
Numerical Simulation of Metal Sheet Plastic Deformation Page 230through Finite Element Method
Displacement in function of distance to the centre of the sheet graphic
Von Mises stress of the centre point of the sheet in function of the time graphic
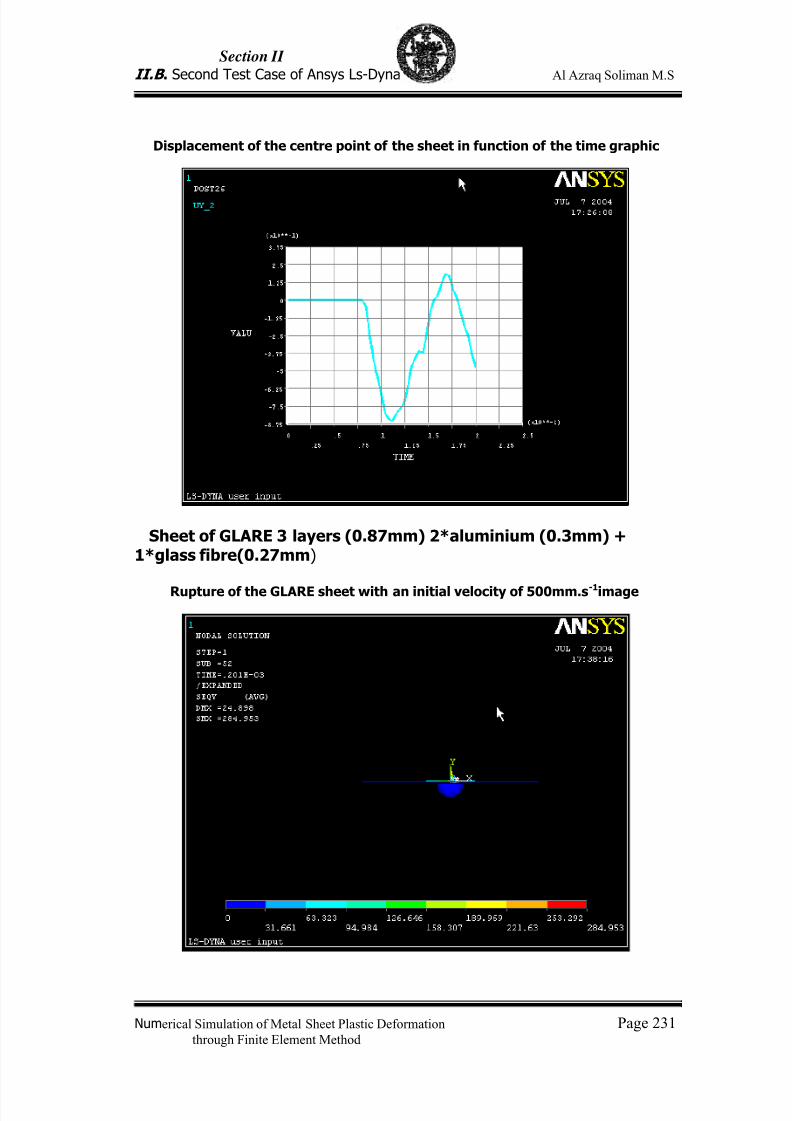
7/23/2019 Al Azraq Ingegneria Chimica Dei Materiali e Della Produzione
http://slidepdf.com/reader/full/al-azraq-ingegneria-chimica-dei-materiali-e-della-produzione 242/419
Section II
II.B . Second Test Case of Ansys Ls-Dyna Al Azraq Soliman M.S
Numerical Simulation of Metal Sheet Plastic Deformation Page 231through Finite Element Method
Displacement of the centre point of the sheet in function of the time graphic
Sheet of GLARE 3 layers (0.87mm) 2*aluminium (0.3mm) +1*glass fibre(0.27mm)
Rupture of the GLARE sheet with an initial velocity of 500mm.s-1 image
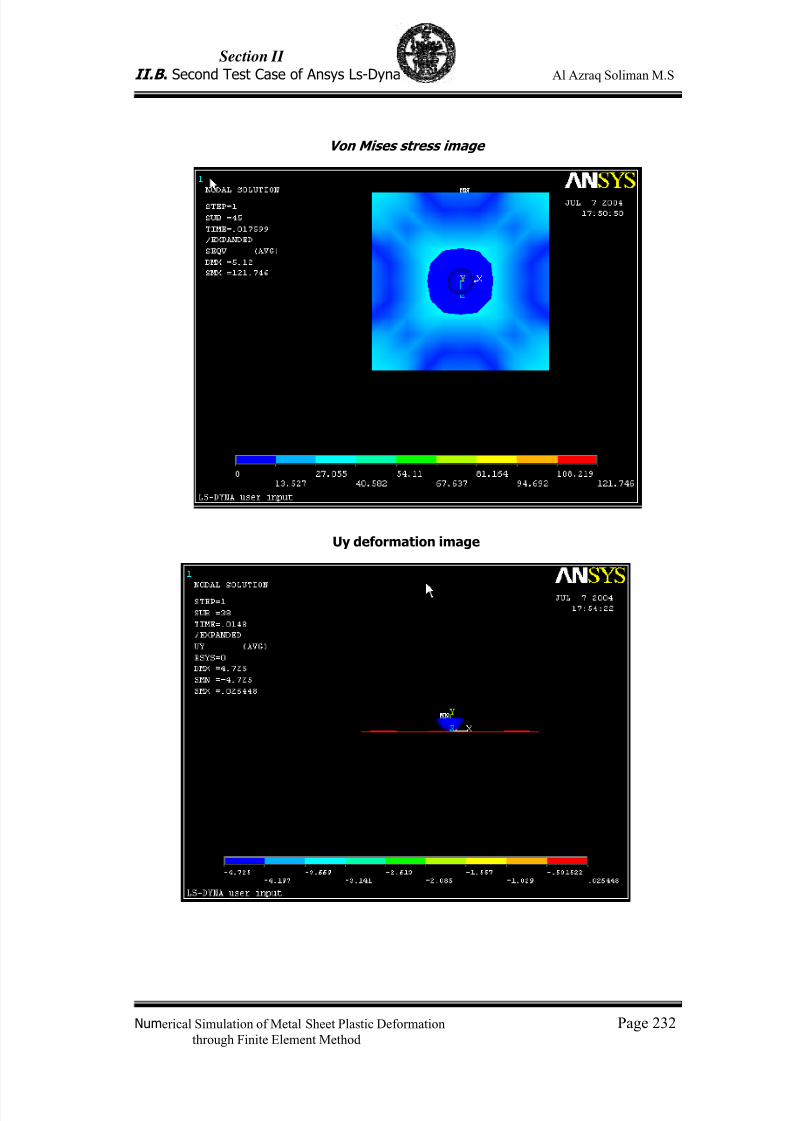
7/23/2019 Al Azraq Ingegneria Chimica Dei Materiali e Della Produzione
http://slidepdf.com/reader/full/al-azraq-ingegneria-chimica-dei-materiali-e-della-produzione 243/419
Section II
II.B . Second Test Case of Ansys Ls-Dyna Al Azraq Soliman M.S
Numerical Simulation of Metal Sheet Plastic Deformation Page 232through Finite Element Method
Von Mises stress image
Uy deformation image
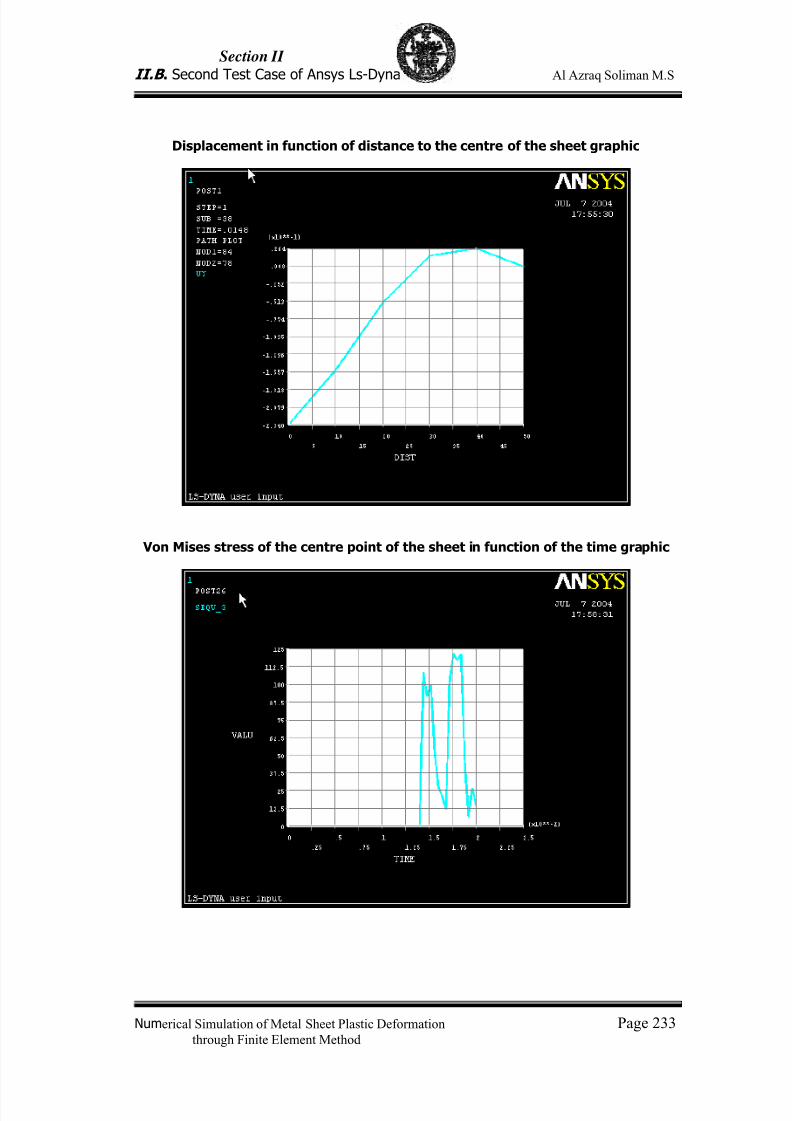
7/23/2019 Al Azraq Ingegneria Chimica Dei Materiali e Della Produzione
http://slidepdf.com/reader/full/al-azraq-ingegneria-chimica-dei-materiali-e-della-produzione 244/419
Section II
II.B . Second Test Case of Ansys Ls-Dyna Al Azraq Soliman M.S
Numerical Simulation of Metal Sheet Plastic Deformation Page 233through Finite Element Method
Displacement in function of distance to the centre of the sheet graphic
Von Mises stress of the centre point of the sheet in function of the time graphic
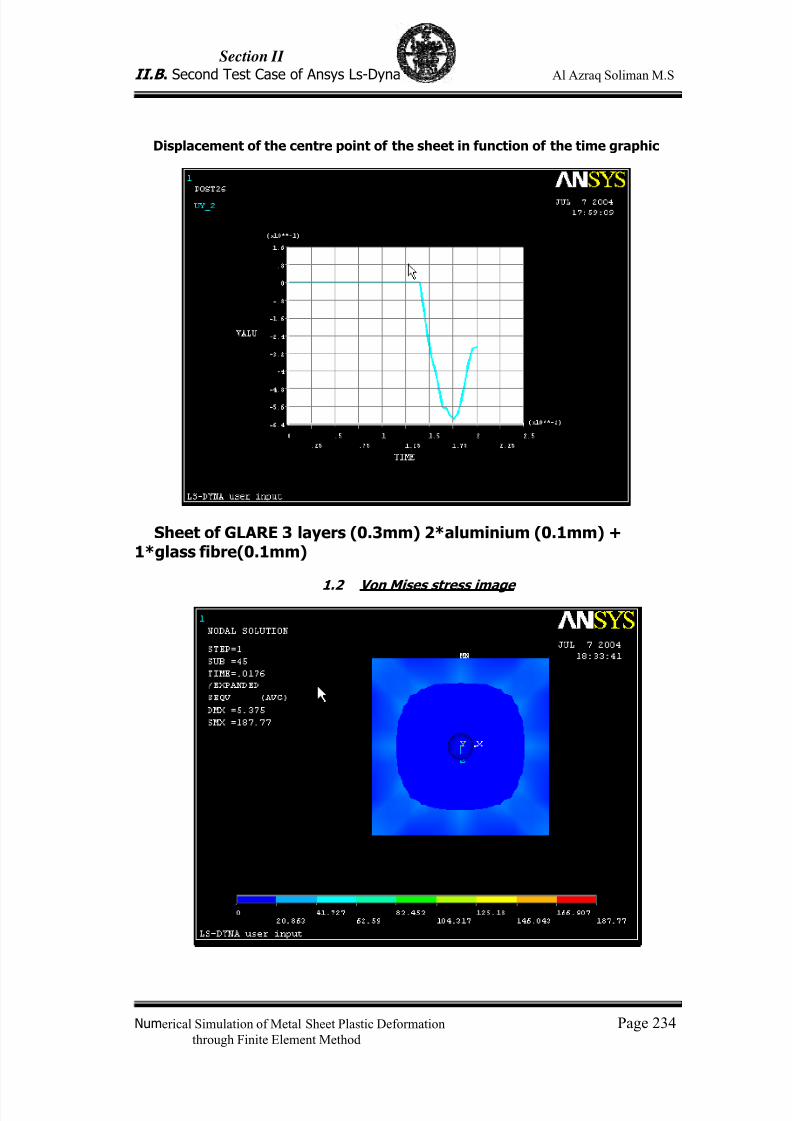
7/23/2019 Al Azraq Ingegneria Chimica Dei Materiali e Della Produzione
http://slidepdf.com/reader/full/al-azraq-ingegneria-chimica-dei-materiali-e-della-produzione 245/419
Section II
II.B . Second Test Case of Ansys Ls-Dyna Al Azraq Soliman M.S
Numerical Simulation of Metal Sheet Plastic Deformation Page 234through Finite Element Method
Displacement of the centre point of the sheet in function of the time graphic
Sheet of GLARE 3 layers (0.3mm) 2*aluminium (0.1mm) +1*glass fibre(0.1mm)
1.2
Von Mises stress image
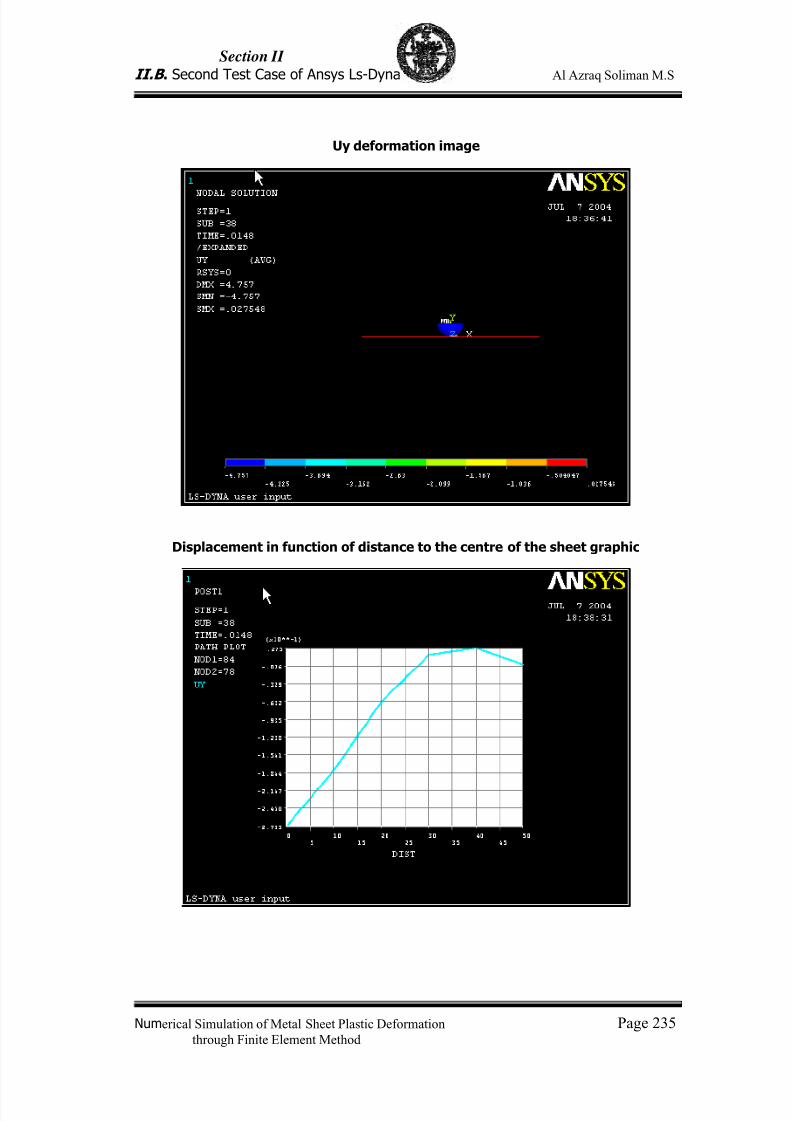
7/23/2019 Al Azraq Ingegneria Chimica Dei Materiali e Della Produzione
http://slidepdf.com/reader/full/al-azraq-ingegneria-chimica-dei-materiali-e-della-produzione 246/419
Section II
II.B . Second Test Case of Ansys Ls-Dyna Al Azraq Soliman M.S
Numerical Simulation of Metal Sheet Plastic Deformation Page 235through Finite Element Method
Uy deformation image
Displacement in function of distance to the centre of the sheet graphic
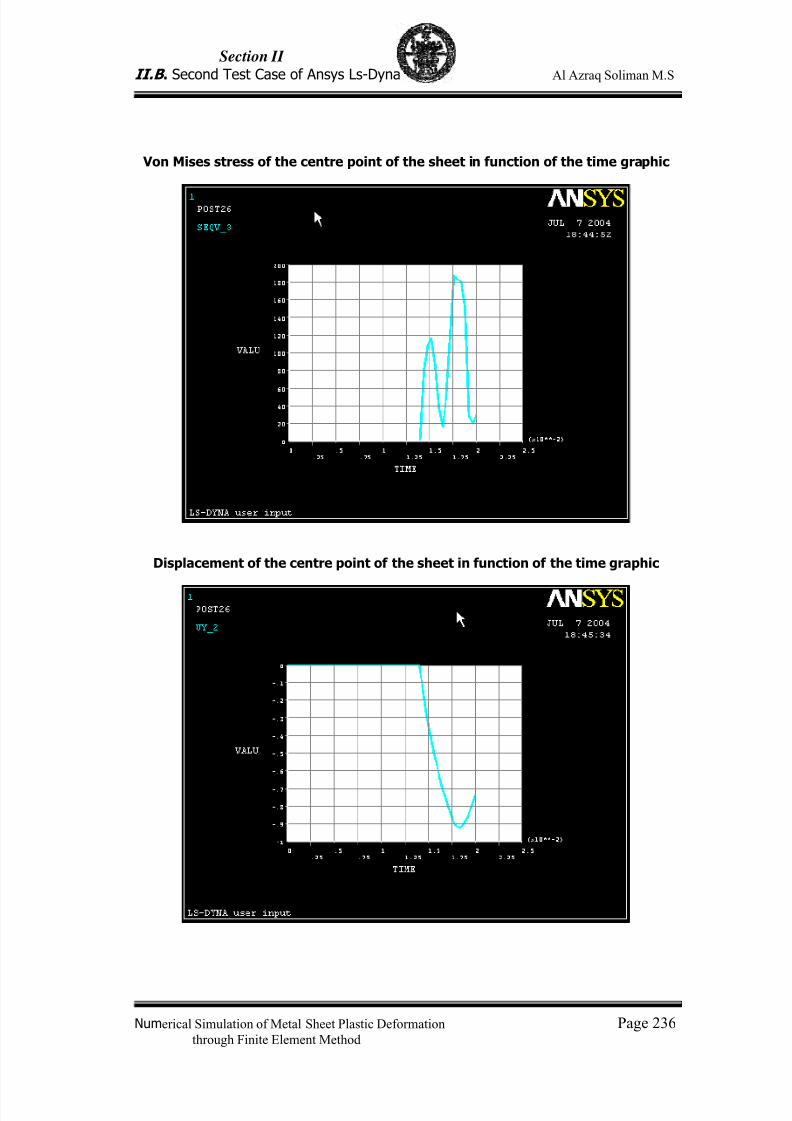
7/23/2019 Al Azraq Ingegneria Chimica Dei Materiali e Della Produzione
http://slidepdf.com/reader/full/al-azraq-ingegneria-chimica-dei-materiali-e-della-produzione 247/419
Section II
II.B . Second Test Case of Ansys Ls-Dyna Al Azraq Soliman M.S
Numerical Simulation of Metal Sheet Plastic Deformation Page 236through Finite Element Method
Von Mises stress of the centre point of the sheet in function of the time graphic
Displacement of the centre point of the sheet in function of the time graphic
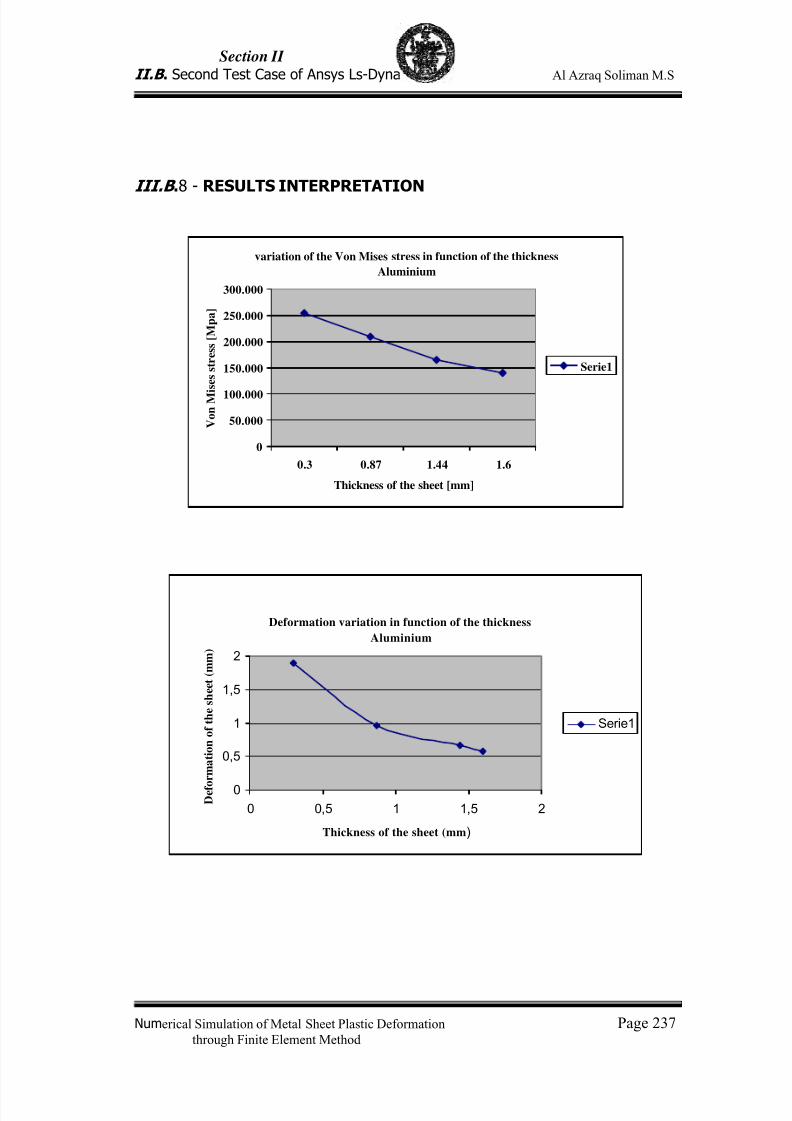
7/23/2019 Al Azraq Ingegneria Chimica Dei Materiali e Della Produzione
http://slidepdf.com/reader/full/al-azraq-ingegneria-chimica-dei-materiali-e-della-produzione 248/419
Section II
II.B . Second Test Case of Ansys Ls-Dyna Al Azraq Soliman M.S
Numerical Simulation of Metal Sheet Plastic Deformation Page 237through Finite Element Method
III.B .8 - RESULTS INTERPRETATION
variation of the Von Mises stress in function of the thickness
Aluminium
0
50.000
100.000
150.000
200.000
250.000
300.000
0.3 0.87 1.44 1.6
Thickness of the sheet [mm]
V o n M i s e s s t r e s s [ M p a ]
Serie1
Deformation variation in function of the thickness
Aluminium
0
0,5
1
1,5
2
0 0,5 1 1,5 2
Thickness of the sheet (mm)
D e f o
r m a t i o n o f t h e s h e e t ( m m )
Serie1

7/23/2019 Al Azraq Ingegneria Chimica Dei Materiali e Della Produzione
http://slidepdf.com/reader/full/al-azraq-ingegneria-chimica-dei-materiali-e-della-produzione 249/419
Section II
II.B . Second Test Case of Ansys Ls-Dyna Al Azraq Soliman M.S
Numerical Simulation of Metal Sheet Plastic Deformation Page 238through Finite Element Method
CONCLUSIONS
It can be concluded that the aluminium simulation is reasonably good,the results seem to confirm this. When we compare GLARE to aluminium it isclear that the simulated GLARE has a much inferior resistance to impact.That should not be the case, because GLARE has similar mechanicalproperties as aluminium. So we can conclude that the GLARE simulation doesnot work properly. The main problem seems to be how to define correctlythe contact between layers, this seems to be more important when thesolicitation increases, and when this happens the established contactbetween layers almost disappears, hence greatly reducing its resistance tosimulated impacts, ANSYS does not seem a good software to simulatecomposite materials. There are ways of improving the efficiency of the
simulation, but at the cost of a drastically increased calculation time. One ofthese ways is to divide when meshing each layer at least in five, other way isto manually input the parameters that define the contact between layers. Butthis is very difficult because until now no one seemed to achieve asatisfactory result, despite all the research made.

7/23/2019 Al Azraq Ingegneria Chimica Dei Materiali e Della Produzione
http://slidepdf.com/reader/full/al-azraq-ingegneria-chimica-dei-materiali-e-della-produzione 250/419
Section II
II.B . Second Test Case of Ansys Ls-Dyna Al Azraq Soliman M.S
Numerical Simulation of Metal Sheet Plastic Deformation Page 239through Finite Element Method
II.B .9. Bibliography
[1] Vermeeren, C.A.J.R.: The application of carbon fibres and ARALLlaminates, Report LR-658, TU DELFt, 1991, 38Pg
[2] Dymacek, P., Klement, J.: Properties and Manufacturing of Steel-C/epoxyFibre-Metal Laminates, Proceedings of Recent Research and Design Progresson Aeronautical Engineering and its Influence on education , Warsaw,Poland, 2000 .

7/23/2019 Al Azraq Ingegneria Chimica Dei Materiali e Della Produzione
http://slidepdf.com/reader/full/al-azraq-ingegneria-chimica-dei-materiali-e-della-produzione 251/419
Section III.A
The first test case is the forming simulation of an automobilecomponents
(deck lid inner body panel)
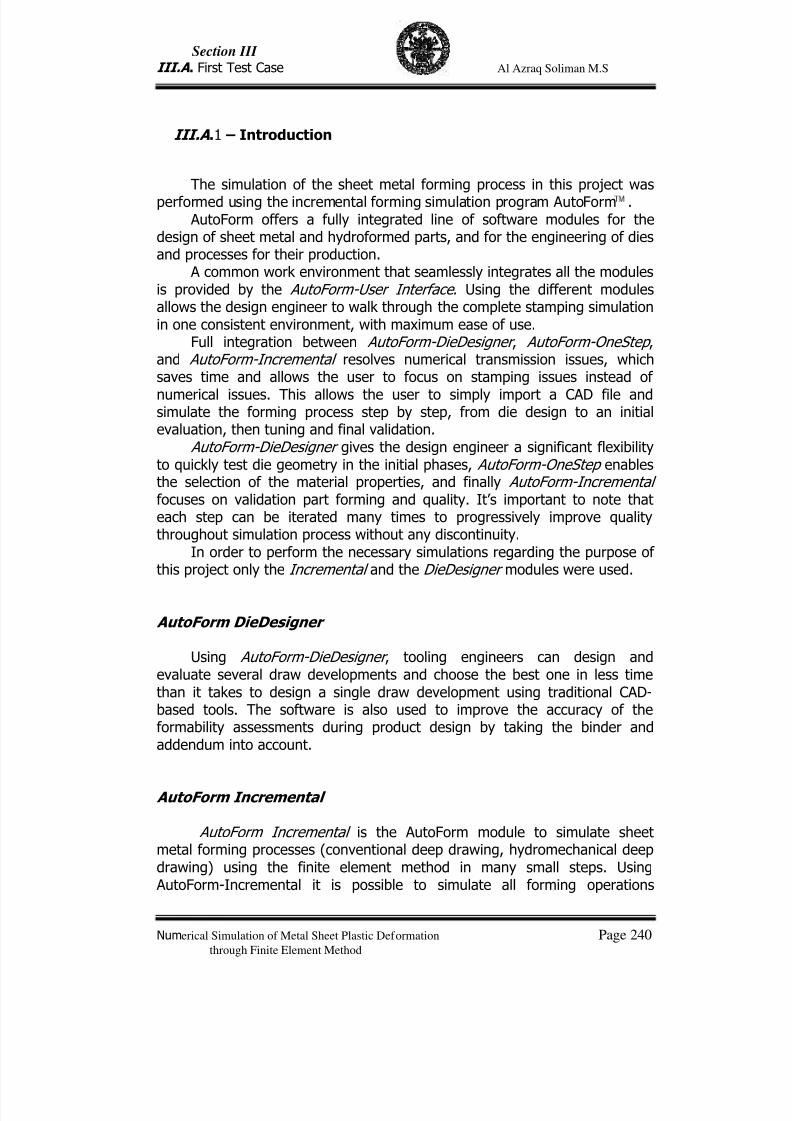
7/23/2019 Al Azraq Ingegneria Chimica Dei Materiali e Della Produzione
http://slidepdf.com/reader/full/al-azraq-ingegneria-chimica-dei-materiali-e-della-produzione 252/419
Section III
III.A . First Test Case Al Azraq Soliman M.S
Numerical Simulation of Metal Sheet Plastic Deformation Page 240through Finite Element Method
III.A .1 – Introduction
The simulation of the sheet metal forming process in this project was
performed using the incremental forming simulation program AutoForm . AutoForm offers a fully integrated line of software modules for the
design of sheet metal and hydroformed parts, and for the engineering of diesand processes for their production.
A common work environment that seamlessly integrates all the modulesis provided by the AutoForm-User Interface . Using the different modulesallows the design engineer to walk through the complete stamping simulationin one consistent environment, with maximum ease of use.
Full integration between AutoForm-DieDesigner , AutoForm-OneStep ,and AutoForm-Incremental resolves numerical transmission issues, whichsaves time and allows the user to focus on stamping issues instead of
numerical issues. This allows the user to simply import a CAD file andsimulate the forming process step by step, from die design to an initialevaluation, then tuning and final validation.
AutoForm-DieDesigner gives the design engineer a significant flexibilityto quickly test die geometry in the initial phases, AutoForm-OneStep enablesthe selection of the material properties, and finally AutoForm-Incremental focuses on validation part forming and quality. It’s important to note thateach step can be iterated many times to progressively improve qualitythroughout simulation process without any discontinuity.
In order to perform the necessary simulations regarding the purpose ofthis project only the Incremental and the DieDesigner modules were used.
AutoForm DieDesigner
Using AutoForm-DieDesigner , tooling engineers can design andevaluate several draw developments and choose the best one in less timethan it takes to design a single draw development using traditional CAD-based tools. The software is also used to improve the accuracy of theformability assessments during product design by taking the binder andaddendum into account.
AutoForm Incremental
AutoForm Incremental is the AutoForm module to simulate sheetmetal forming processes (conventional deep drawing, hydromechanical deepdrawing) using the finite element method in many small steps. Using AutoForm-Incremental it is possible to simulate all forming operations
7/23/2019 Al Azraq Ingegneria Chimica Dei Materiali e Della Produzione
http://slidepdf.com/reader/full/al-azraq-ingegneria-chimica-dei-materiali-e-della-produzione 253/419
Section III
III.A . First Test Case Al Azraq Soliman M.S
Numerical Simulation of Metal Sheet Plastic Deformation Page 241through Finite Element Method
beginning with the plane blank sheet and ending with the finished car bodypart, including springback calculation.
AutoForm Incremental is an implicit FE-program. The displacement ofthe nodes is calculated by a quasi-static balance. Since it is specific for sheetmetal forming, the mesh and remeshing generation are automatic. Thecontacts and elements are formulated as a function of the typical conditionsof the process, using, in order to simulate the required drawing process, twotypes of elements:
- Full Shell Elements- Bending-enhanced membrane elementsOppositely to full shell elements, Bending-enhanced membrane
elements do not react to bending: the deformations are imposed by toolgeometry and movement.
To calculate the stress-deformation condition a convenient correctionalgorithm is implemented. Thanks to this mixed formulation, trustable results
are obtained with acceptable computing time.
III.A .2 - Forming Analysis with AutoForm-Incremental
It is essential to have a reliable and robust simulation program for thesheet metal forming process to get trustable results when analysing astamped part. Throughout this project, the finite element program AutoForm-Incremental was used.
AutoForm-Incremental is a highly specialized and optimized solver forthe sheet metal forming process, which has been well established in the
automotive industry during the last few years. It is proven that it meets theindustrial requirements such as ease of use, high efficiency and sufficientaccuracy even for complex parts.
Since the sheet metal forming process takes place at low velocity, aquasistatic implicit formulation is used.
The full implicit approach to solve the equilibrium equations
(1)
is to use a Newton-Raphson iteration, where R is the vector of externally
applied nodal forces, F is the vector of nodal point forces corresponding tothe element stresses, M denotes the lump mass matrix, and U and Ü are thevectors of nodal point displacements and accelerations, respectively.
The Newton-Raphson iteration for Eq. 1 is to solve
(2)
7/23/2019 Al Azraq Ingegneria Chimica Dei Materiali e Della Produzione
http://slidepdf.com/reader/full/al-azraq-ingegneria-chimica-dei-materiali-e-della-produzione 254/419
Section III
III.A . First Test Case Al Azraq Soliman M.S
Numerical Simulation of Metal Sheet Plastic Deformation Page 242through Finite Element Method
until convergence measures are satisfied, where
(3)
and the initial conditions correspond to the state calculated for time t .
(4)
In Eq. 2, K is the tangent stiffness matrix. The nonlinear iterationcounter is given by the underscript (i ).
Considering the implicit solution approach, the major computational
challenge is the solution of a large sparse system of linear equations. Thereare two main approaches to solving the sparse linear systems from thenonlinear Newton method.
The first approach is more conservative and uses sparse direct solvertechnology. In the last few years algorithmic improvements alone havereduced the time for the direct solution of symmetric and unsymmetricsparse systems of linear equations by almost one or two orders ofmagnitude.
Remarkable progress has been made in the increase of reliability,parallelization and consistent high performance is now achieved for a widerange of computing architectures. As a result, a number of sparse direct
solver packages for solving such systems are available and it is now commonto solve these sparse linear systems of equations with a direct method thatmight have been considered as too large until recently.
Nevertheless, in large simulations with more than 300K elements, thememory requirements of direct methods as well as the time for thefactorization may be too high.
Therefore, a second approach using the preconditioned Krylowsubspace method is often employed to solve these systems. This iterativeapproach has smaller memory requirements and often smaller CPU timerequirements than a direct method. However, an iterative method may notconverge to the solution in some cases where a direct method is capable offinding the solution.
The sparse linear systems from sheet metal forming simulation areextremely ill-conditioned and therefore quite challenging for iterativemethods. To overcome problems with ill-conditioned linear systems and toreduce the number of degrees of freedom, a special membrane elementformulation is used in AutoForm-Incremental . Within each time step thetransversal (bending) displacements and the tangential (stretching)displacements are uncoupled resulting in significantly better conditioned
7/23/2019 Al Azraq Ingegneria Chimica Dei Materiali e Della Produzione
http://slidepdf.com/reader/full/al-azraq-ingegneria-chimica-dei-materiali-e-della-produzione 255/419
Section III
III.A . First Test Case Al Azraq Soliman M.S
Numerical Simulation of Metal Sheet Plastic Deformation Page 243through Finite Element Method
systems. The AutoForm-Incremental method decouples these bending andstretching degrees of freedom, and the bending shape and material flow aredetermined separately. As a consequence of this simplification, stabilityproblems are avoided and the condition of the system matrix is improved, sothat iterative methods for the solution of the linear equations can be used.This is a reasonable simplification for the deep drawing process as the shapeof the sheet is mostly defined by the tools; especially at the end of theprocess when the tools are closed, there are no degrees of freedom innormal direction.
Shell elements are used as well, providing results with extremely highaccuracy.
An elasto-plastic material model is used. For the elastic part ofdeformation, Hooke's isotropic law is applied. For plastic yielding and thedirection of plastic flow an anisotropical yield surface similar to Hill48
( Appendix C ) is used. The constitutive equations are integrated numericallywith the radial return method.
The stiffness of the tools which are used for the forming process ismuch higher than the stiffness of the sheet. For this reason it is suitable tomodel the tools as rigid bodies. The friction between the sheet and the toolsplay an important role in the drawing process. Friction is modelled byCoulomb's law with a constant friction coefficient. Values between 0.05(good lubrication) and 0.25 (no lubrication) are typically used.
During the deep drawing process large displacements are present. Thisleads to the permanent change of the zones where fine-grained elements areneeded. An adaptive modification of the mesh during the simulation is
applied to solve this problem. In AutoForm-Incremental , an automaticrefinement as well as an automatic coarsening is used. As refinementcriteria, curvature, strain gradient, and penetration between sheet and toolsare used. Using this method it is possible to handle complex industrial partswith a reasonable number of elements. A complex outer panel of a car, forexample, can be modelled with approximately 200K elements.
III.A .3 - Synthetic Description of AutoForm Process Steps
1. Pre-Processing of Input Data
Import geometry
- Import part geometry from CAD
7/23/2019 Al Azraq Ingegneria Chimica Dei Materiali e Della Produzione
http://slidepdf.com/reader/full/al-azraq-ingegneria-chimica-dei-materiali-e-della-produzione 256/419
Section III
III.A . First Test Case Al Azraq Soliman M.S
Numerical Simulation of Metal Sheet Plastic Deformation Page 244through Finite Element Method
Part Geometry (Geometry Generator)
- Prepare
- Fillet
- Balance (Tip)
- Filling Holes (Modify Part Geometry)
- External Contour (Boundary Fill)
- Binder
- Addendum
- Modify Tools
Process Data Input (Input Generator)
- Tools
- Blank
- Lube
- Drawbeads
Material Properties / Material Selection
- True stress-True strain curve
- Normal anisotropy coefficient
- Forming limit curve
Process Description
- Process (Gravity, Closing, Drawing, Cuttings, Springback…)
Calculus Configuration
- Control data
2. Computational Analysis
7/23/2019 Al Azraq Ingegneria Chimica Dei Materiali e Della Produzione
http://slidepdf.com/reader/full/al-azraq-ingegneria-chimica-dei-materiali-e-della-produzione 257/419
Section III
III.A . First Test Case Al Azraq Soliman M.S
Numerical Simulation of Metal Sheet Plastic Deformation Page 245through Finite Element Method
3. Post-Processing of Results
Visual evaluation
Forming evaluation
- Formability- Forming Limit Diagram (FLD)- Wrinkling criterion- Maximum Failure
Thickness / Strain evaluation
- Thickness
-
Thinning- Plastic strain- Major strain- Minor strain
Springback evaluation
- Normal displacement- Dynamic section
The following Diagram presents the methodology used in AutoForm.
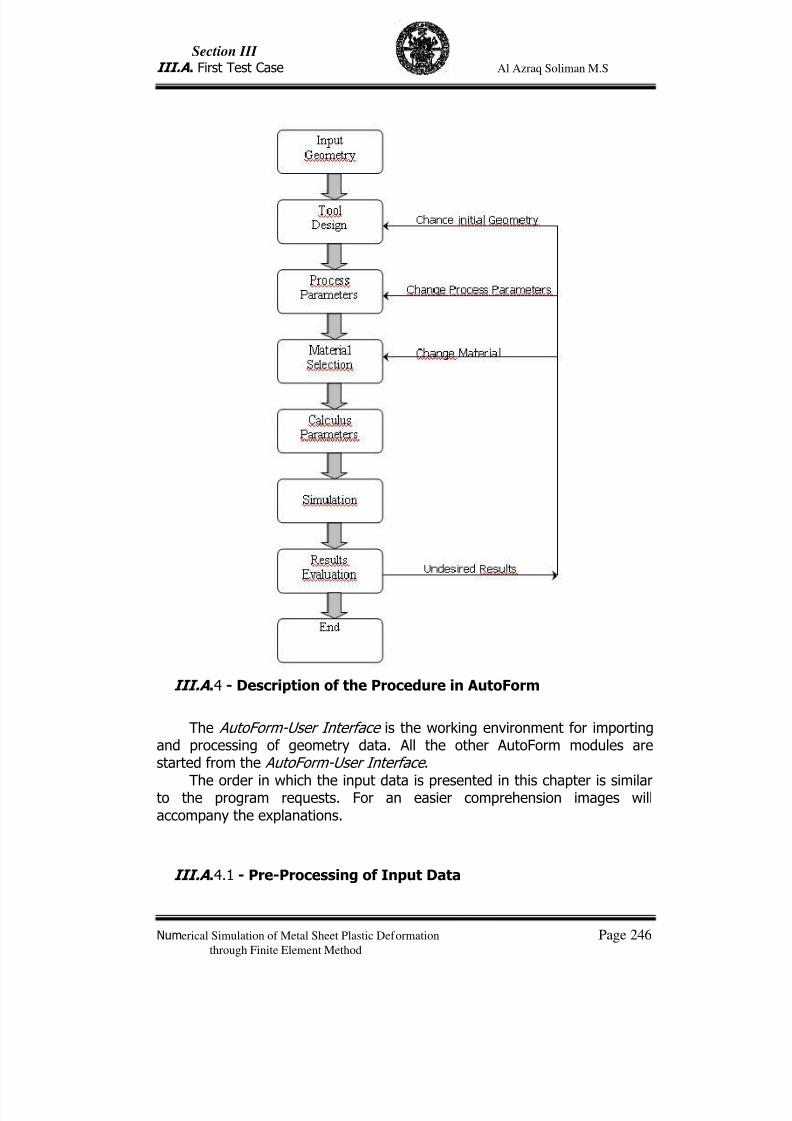
7/23/2019 Al Azraq Ingegneria Chimica Dei Materiali e Della Produzione
http://slidepdf.com/reader/full/al-azraq-ingegneria-chimica-dei-materiali-e-della-produzione 258/419
Section III
III.A . First Test Case Al Azraq Soliman M.S
Numerical Simulation of Metal Sheet Plastic Deformation Page 246through Finite Element Method
III.A .4 - Description of the Procedure in AutoForm
The AutoForm-User Interface is the working environment for importingand processing of geometry data. All the other AutoForm modules arestarted from the AutoForm-User Interface .
The order in which the input data is presented in this chapter is similarto the program requests. For an easier comprehension images willaccompany the explanations.
III.A .4.1 - Pre-Processing of Input Data
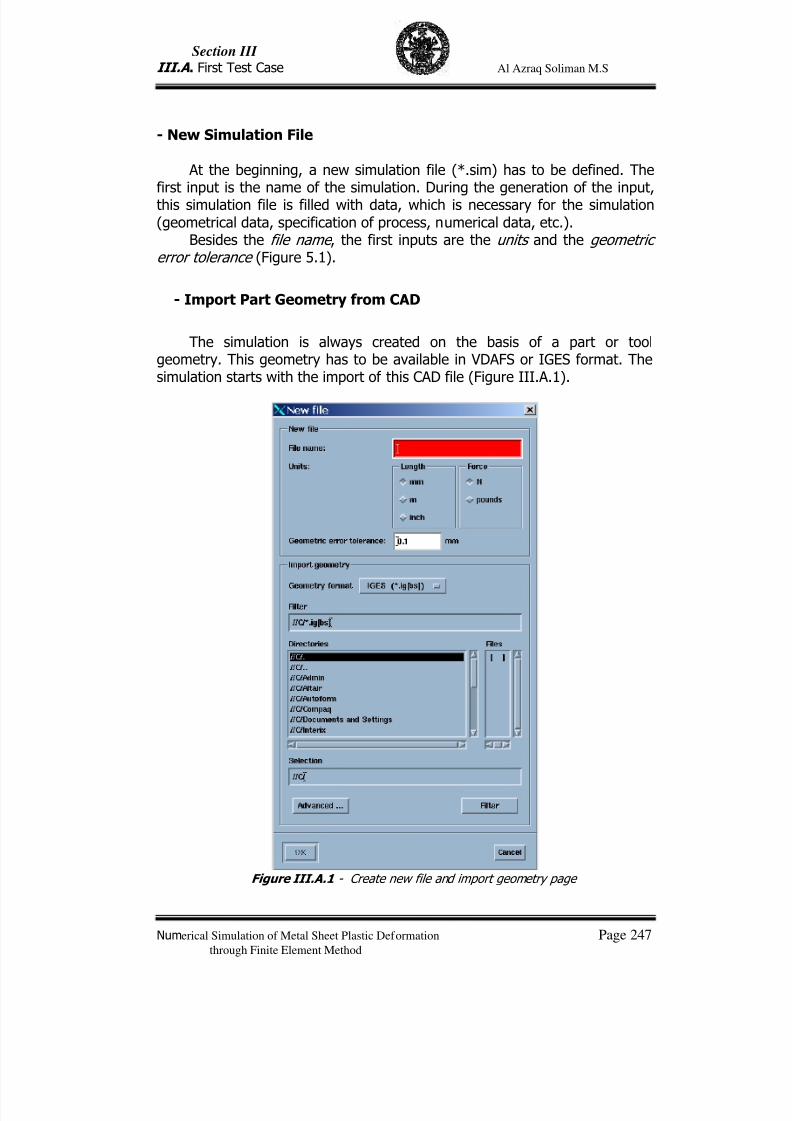
7/23/2019 Al Azraq Ingegneria Chimica Dei Materiali e Della Produzione
http://slidepdf.com/reader/full/al-azraq-ingegneria-chimica-dei-materiali-e-della-produzione 259/419
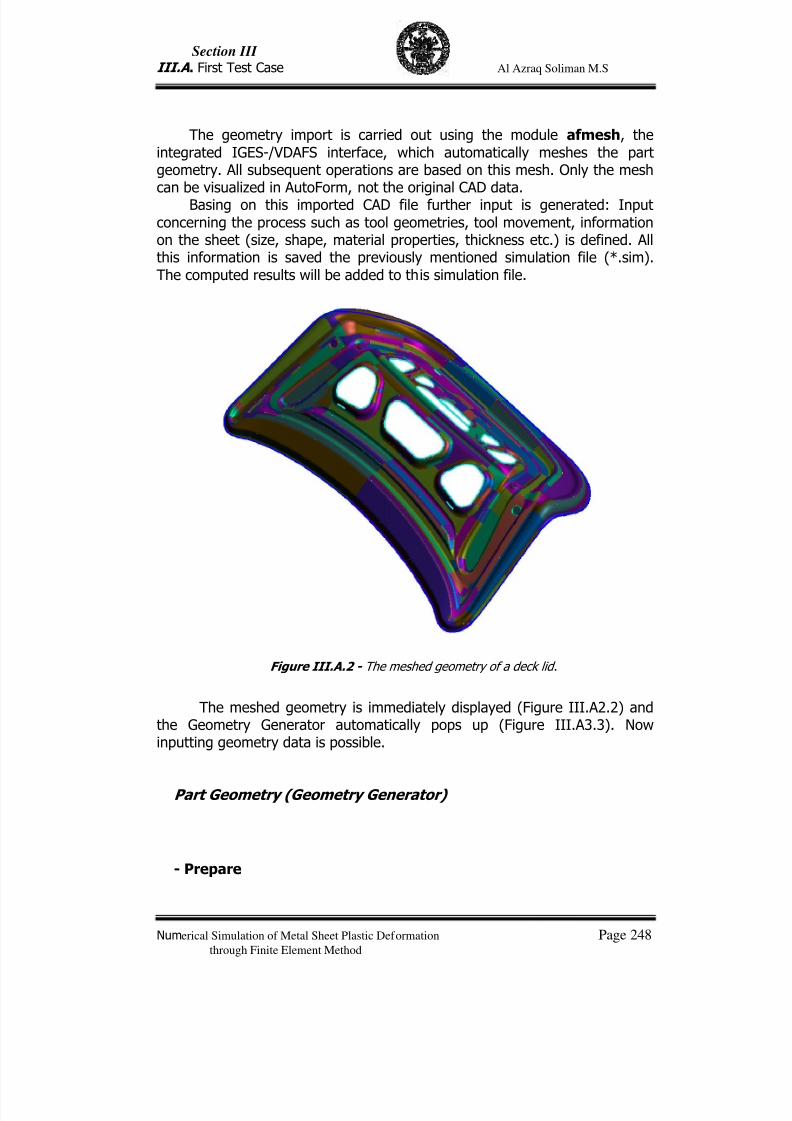
7/23/2019 Al Azraq Ingegneria Chimica Dei Materiali e Della Produzione
http://slidepdf.com/reader/full/al-azraq-ingegneria-chimica-dei-materiali-e-della-produzione 260/419
Section III
III.A . First Test Case Al Azraq Soliman M.S
Numerical Simulation of Metal Sheet Plastic Deformation Page 248through Finite Element Method
The geometry import is carried out using the module afmesh, theintegrated IGES-/VDAFS interface, which automatically meshes the partgeometry. All subsequent operations are based on this mesh. Only the meshcan be visualized in AutoForm, not the original CAD data.
Basing on this imported CAD file further input is generated: Inputconcerning the process such as tool geometries, tool movement, informationon the sheet (size, shape, material properties, thickness etc.) is defined. Allthis information is saved the previously mentioned simulation file (*.sim).The computed results will be added to this simulation file.
Figure III.A.2 - The meshed geometry of a deck lid .
The meshed geometry is immediately displayed (Figure III.A2.2) andthe Geometry Generator automatically pops up (Figure III.A3.3). Nowinputting geometry data is possible.
Part Geometry (Geometry Generator)
- Prepare
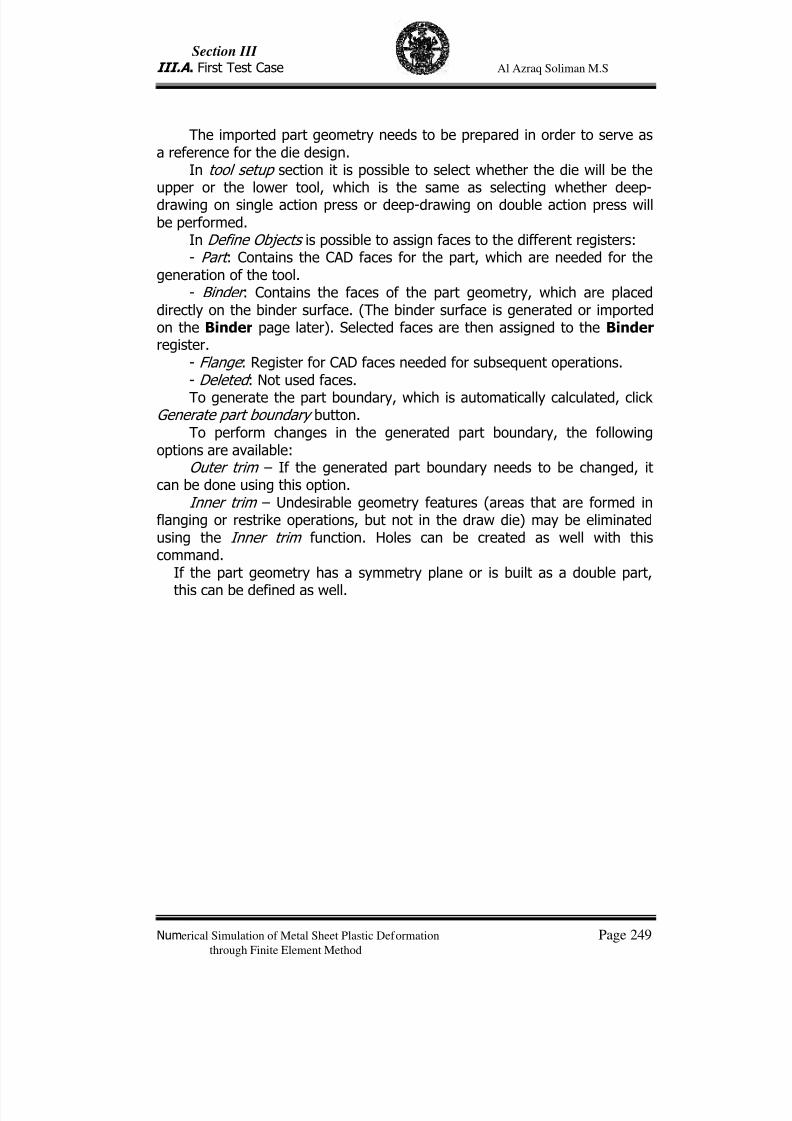
7/23/2019 Al Azraq Ingegneria Chimica Dei Materiali e Della Produzione
http://slidepdf.com/reader/full/al-azraq-ingegneria-chimica-dei-materiali-e-della-produzione 261/419
Section III
III.A . First Test Case Al Azraq Soliman M.S
Numerical Simulation of Metal Sheet Plastic Deformation Page 249through Finite Element Method
The imported part geometry needs to be prepared in order to serve asa reference for the die design.
In tool setup section it is possible to select whether the die will be theupper or the lower tool, which is the same as selecting whether deep-drawing on single action press or deep-drawing on double action press willbe performed.
In Define Objects is possible to assign faces to the different registers:- Part : Contains the CAD faces for the part, which are needed for the
generation of the tool.- Binder : Contains the faces of the part geometry, which are placed
directly on the binder surface. (The binder surface is generated or importedon the Binder page later). Selected faces are then assigned to the Binder register.
- Flange : Register for CAD faces needed for subsequent operations.- Deleted : Not used faces.
To generate the part boundary, which is automatically calculated, clickGenerate part boundary button.
To perform changes in the generated part boundary, the followingoptions are available:
Outer trim – If the generated part boundary needs to be changed, itcan be done using this option.
Inner trim – Undesirable geometry features (areas that are formed inflanging or restrike operations, but not in the draw die) may be eliminatedusing the Inner trim function. Holes can be created as well with thiscommand.
If the part geometry has a symmetry plane or is built as a double part,
this can be defined as well.
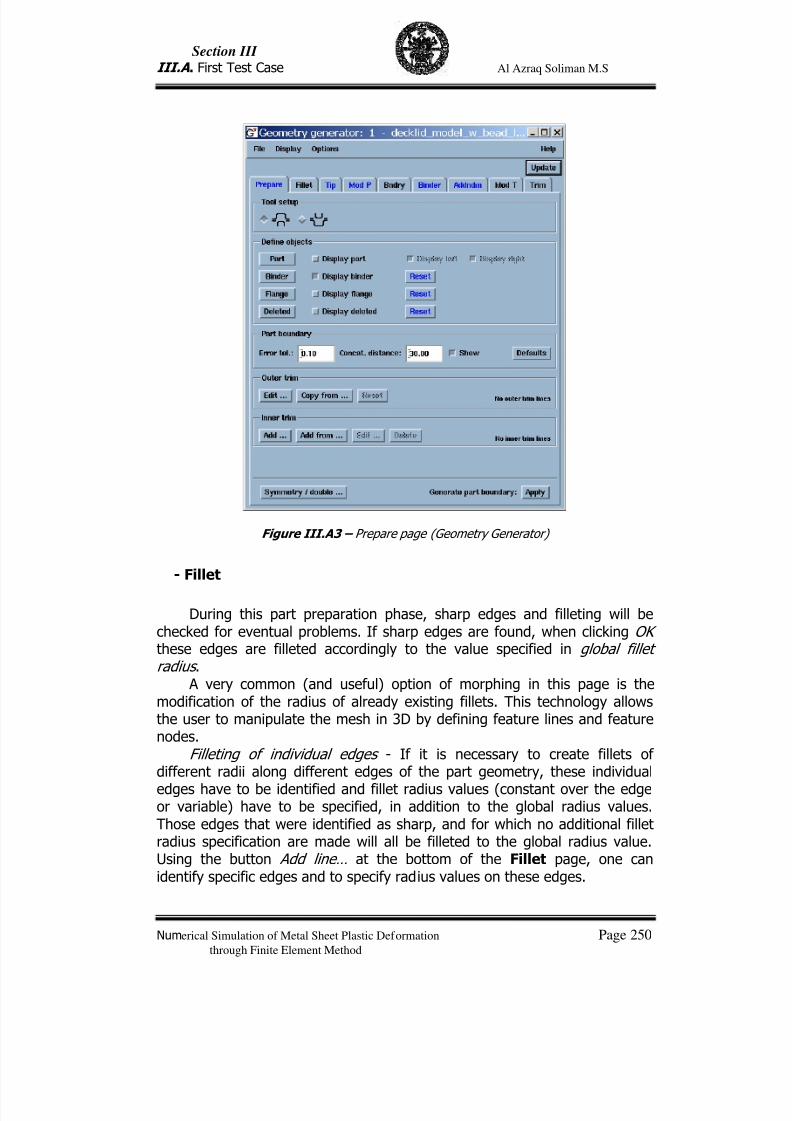
7/23/2019 Al Azraq Ingegneria Chimica Dei Materiali e Della Produzione
http://slidepdf.com/reader/full/al-azraq-ingegneria-chimica-dei-materiali-e-della-produzione 262/419
Section III
III.A . First Test Case Al Azraq Soliman M.S
Numerical Simulation of Metal Sheet Plastic Deformation Page 250through Finite Element Method
Figure III.A3 – Prepare page (Geometry Generator)
- Fillet
During this part preparation phase, sharp edges and filleting will bechecked for eventual problems. If sharp edges are found, when clicking OK these edges are filleted accordingly to the value specified in global filletradius .
A very common (and useful) option of morphing in this page is themodification of the radius of already existing fillets. This technology allowsthe user to manipulate the mesh in 3D by defining feature lines and featurenodes.
Filleting of individual edges - If it is necessary to create fillets ofdifferent radii along different edges of the part geometry, these individual
edges have to be identified and fillet radius values (constant over the edgeor variable) have to be specified, in addition to the global radius values.Those edges that were identified as sharp, and for which no additional filletradius specification are made will all be filleted to the global radius value.Using the button Add line… at the bottom of the Fillet page, one canidentify specific edges and to specify radius values on these edges.
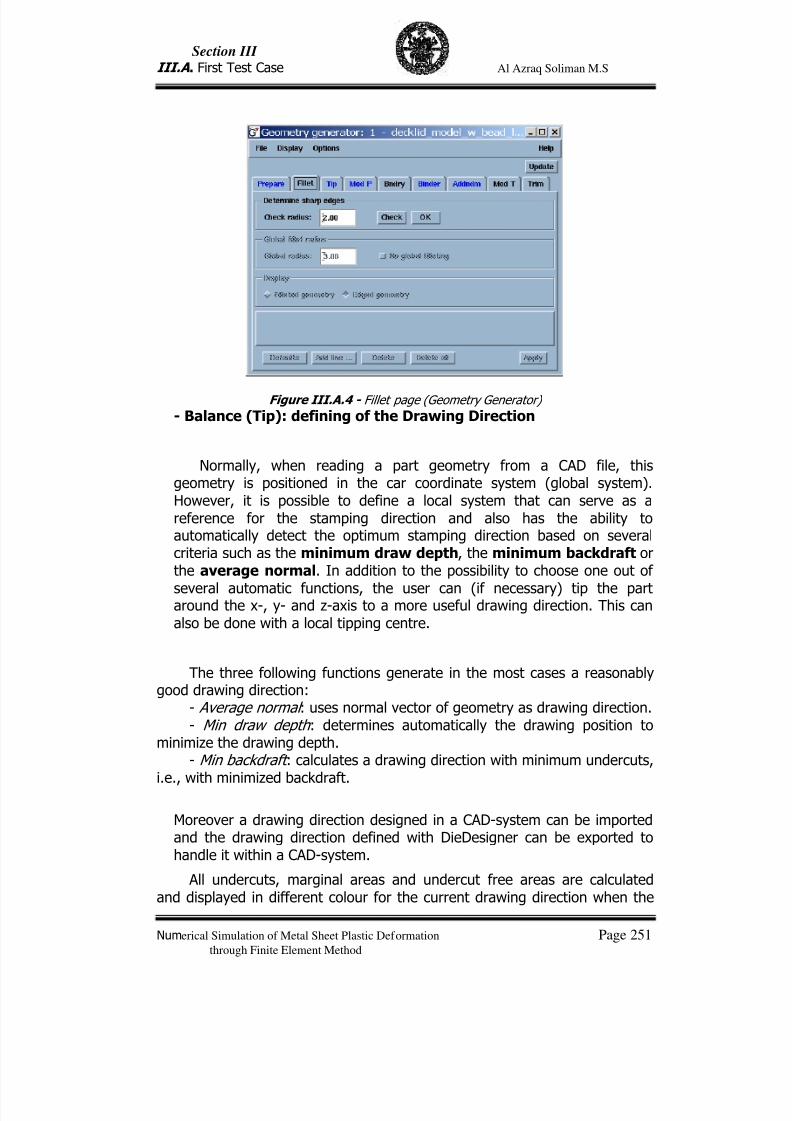
7/23/2019 Al Azraq Ingegneria Chimica Dei Materiali e Della Produzione
http://slidepdf.com/reader/full/al-azraq-ingegneria-chimica-dei-materiali-e-della-produzione 263/419
Section III
III.A . First Test Case Al Azraq Soliman M.S
Numerical Simulation of Metal Sheet Plastic Deformation Page 251through Finite Element Method
Figure III.A.4 - Fillet page (Geometry Generator)
- Balance (Tip): defining of the Drawing Direction
Normally, when reading a part geometry from a CAD file, thisgeometry is positioned in the car coordinate system (global system).However, it is possible to define a local system that can serve as areference for the stamping direction and also has the ability toautomatically detect the optimum stamping direction based on severalcriteria such as the minimum draw depth, the minimum backdraft orthe average normal. In addition to the possibility to choose one out of
several automatic functions, the user can (if necessary) tip the partaround the x-, y- and z-axis to a more useful drawing direction. This canalso be done with a local tipping centre.
The three following functions generate in the most cases a reasonablygood drawing direction:
- Average normal : uses normal vector of geometry as drawing direction.- Min draw depth : determines automatically the drawing position to
minimize the drawing depth.- Min backdraft : calculates a drawing direction with minimum undercuts,
i.e., with minimized backdraft.
Moreover a drawing direction designed in a CAD-system can be importedand the drawing direction defined with DieDesigner can be exported tohandle it within a CAD-system.
All undercuts, marginal areas and undercut free areas are calculatedand displayed in different colour for the current drawing direction when the
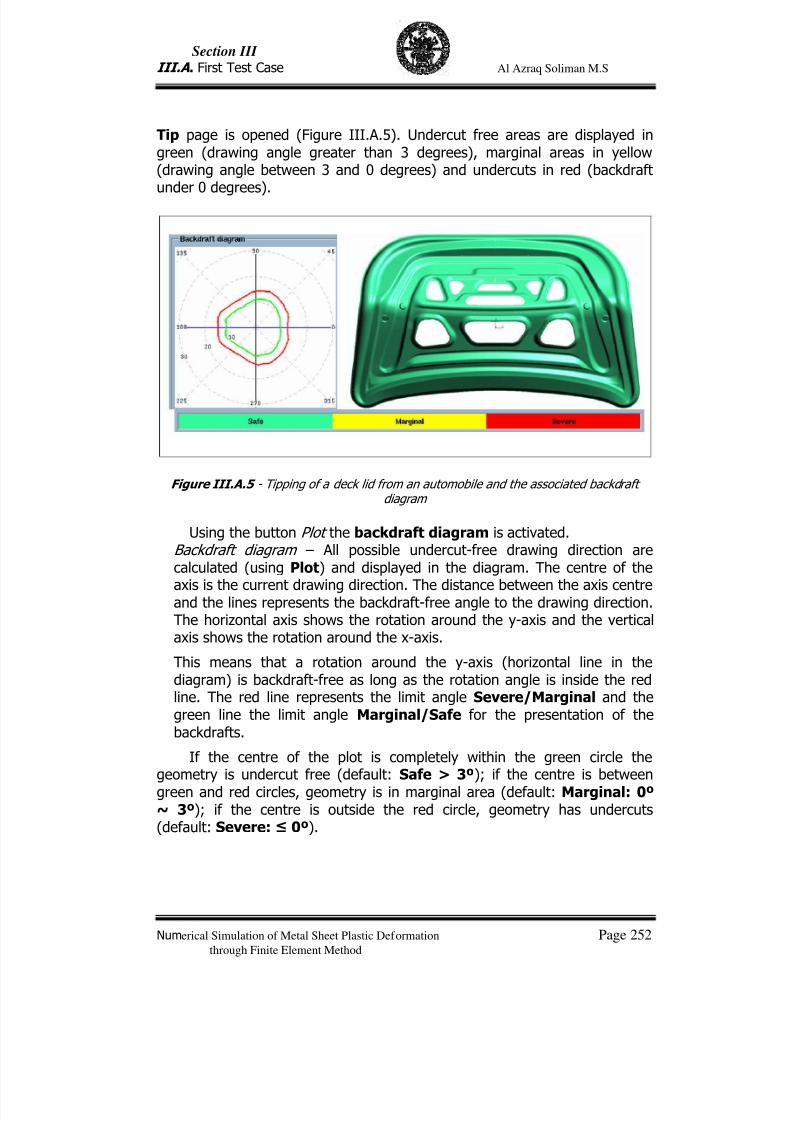
7/23/2019 Al Azraq Ingegneria Chimica Dei Materiali e Della Produzione
http://slidepdf.com/reader/full/al-azraq-ingegneria-chimica-dei-materiali-e-della-produzione 264/419
Section III
III.A . First Test Case Al Azraq Soliman M.S
Numerical Simulation of Metal Sheet Plastic Deformation Page 252through Finite Element Method
Tip page is opened (Figure III.A.5). Undercut free areas are displayed ingreen (drawing angle greater than 3 degrees), marginal areas in yellow(drawing angle between 3 and 0 degrees) and undercuts in red (backdraftunder 0 degrees).
Figure III.A.5 - Tipping of a deck lid from an automobile and the associated backdraftdiagram
Using the button Plot the backdraft diagram is activated. Backdraft diagram – All possible undercut-free drawing direction arecalculated (using Plot) and displayed in the diagram. The centre of the
axis is the current drawing direction. The distance between the axis centreand the lines represents the backdraft-free angle to the drawing direction.The horizontal axis shows the rotation around the y-axis and the verticalaxis shows the rotation around the x-axis.
This means that a rotation around the y-axis (horizontal line in thediagram) is backdraft-free as long as the rotation angle is inside the redline. The red line represents the limit angle Severe/Marginal and thegreen line the limit angle Marginal/Safe for the presentation of thebackdrafts.
If the centre of the plot is completely within the green circle thegeometry is undercut free (default: Safe > 3º); if the centre is betweengreen and red circles, geometry is in marginal area (default: Marginal: 0º~ 3º); if the centre is outside the red circle, geometry has undercuts(default: Severe: ≤ 0º).
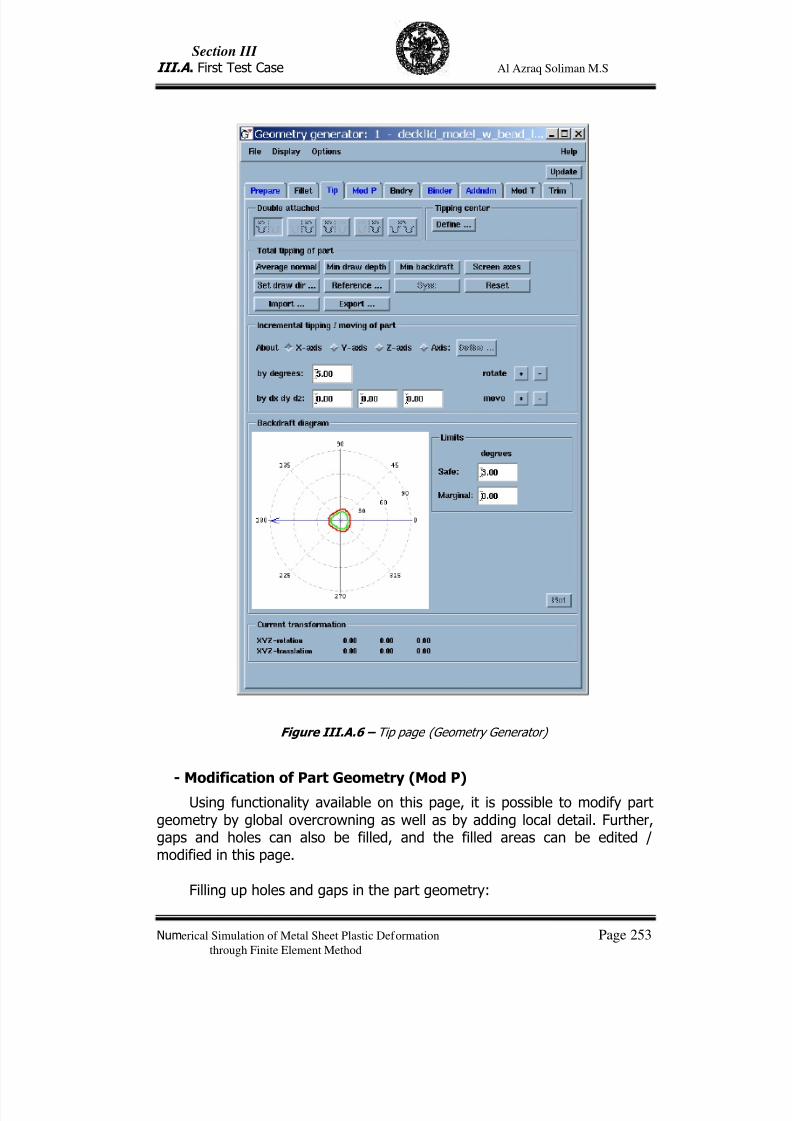
7/23/2019 Al Azraq Ingegneria Chimica Dei Materiali e Della Produzione
http://slidepdf.com/reader/full/al-azraq-ingegneria-chimica-dei-materiali-e-della-produzione 265/419
Section III
III.A . First Test Case Al Azraq Soliman M.S
Numerical Simulation of Metal Sheet Plastic Deformation Page 253through Finite Element Method
Figure III.A.6 – Tip page (Geometry Generator)
- Modification of Part Geometry (Mod P)
Using functionality available on this page, it is possible to modify partgeometry by global overcrowning as well as by adding local detail. Further,gaps and holes can also be filled, and the filled areas can be edited /modified in this page.
Filling up holes and gaps in the part geometry:
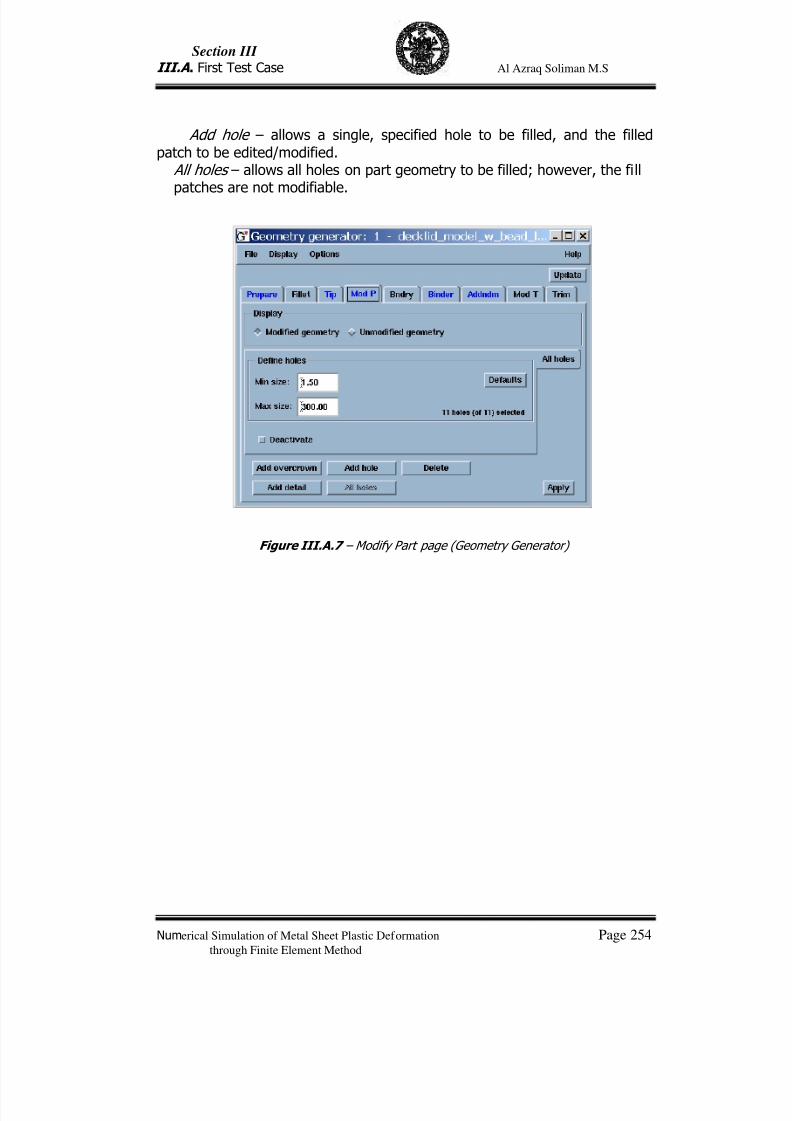
7/23/2019 Al Azraq Ingegneria Chimica Dei Materiali e Della Produzione
http://slidepdf.com/reader/full/al-azraq-ingegneria-chimica-dei-materiali-e-della-produzione 266/419
Section III
III.A . First Test Case Al Azraq Soliman M.S
Numerical Simulation of Metal Sheet Plastic Deformation Page 254through Finite Element Method
Add hole – allows a single, specified hole to be filled, and the filledpatch to be edited/modified.
All holes – allows all holes on part geometry to be filled; however, the fillpatches are not modifiable.
Figure III.A.7 – Modify Part page (Geometry Generator)
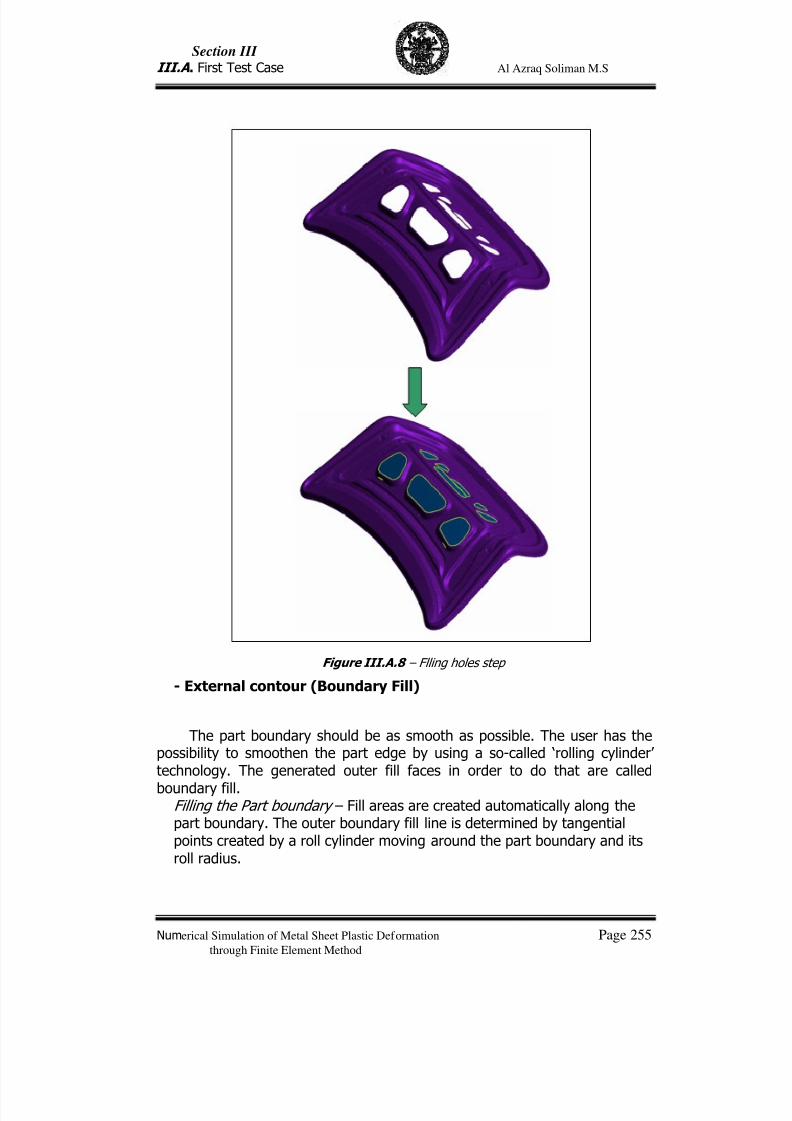
7/23/2019 Al Azraq Ingegneria Chimica Dei Materiali e Della Produzione
http://slidepdf.com/reader/full/al-azraq-ingegneria-chimica-dei-materiali-e-della-produzione 267/419
Section III
III.A . First Test Case Al Azraq Soliman M.S
Numerical Simulation of Metal Sheet Plastic Deformation Page 255through Finite Element Method
Figure III.A.8 – Flling holes step
- External contour (Boundary Fill)
The part boundary should be as smooth as possible. The user has thepossibility to smoothen the part edge by using a so-called ‘rolling cylinder’technology. The generated outer fill faces in order to do that are called
boundary fill. Filling the Part boundary – Fill areas are created automatically along thepart boundary. The outer boundary fill line is determined by tangentialpoints created by a roll cylinder moving around the part boundary and itsroll radius.
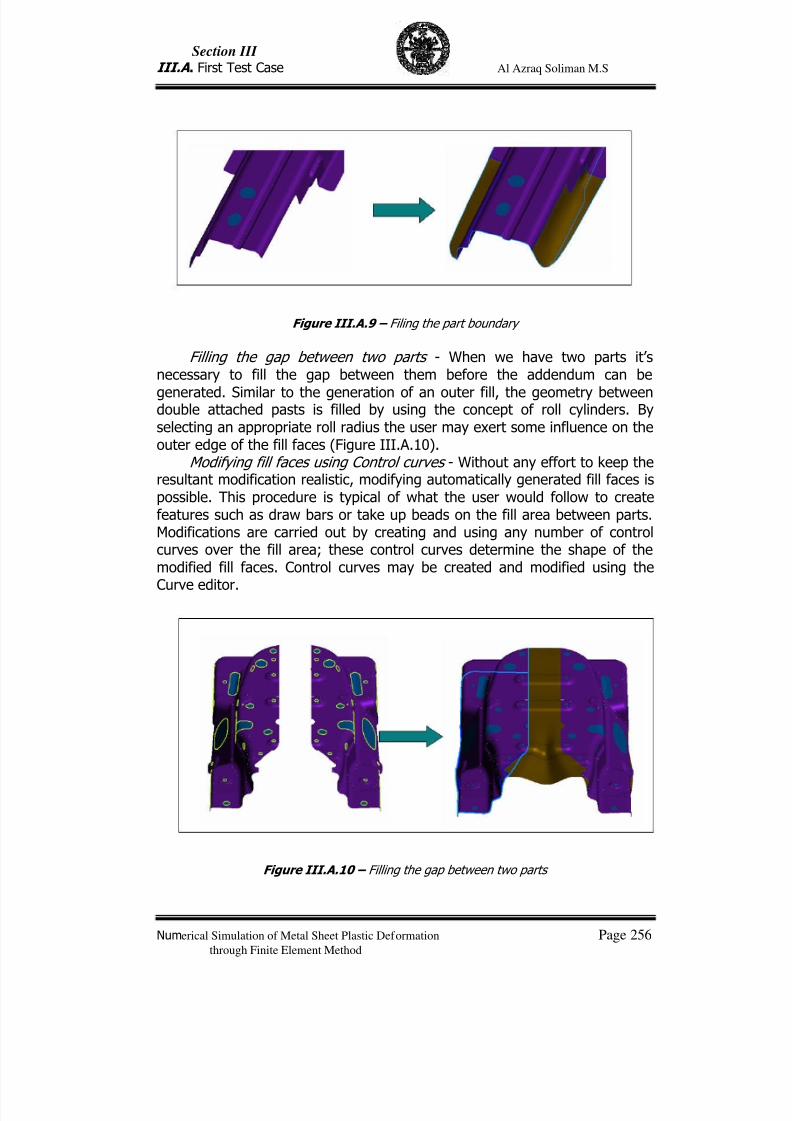
7/23/2019 Al Azraq Ingegneria Chimica Dei Materiali e Della Produzione
http://slidepdf.com/reader/full/al-azraq-ingegneria-chimica-dei-materiali-e-della-produzione 268/419
Section III
III.A . First Test Case Al Azraq Soliman M.S
Numerical Simulation of Metal Sheet Plastic Deformation Page 256through Finite Element Method
Figure III.A.9 – Filing the part boundary
Filling the gap between two parts - When we have two parts it’snecessary to fill the gap between them before the addendum can be
generated. Similar to the generation of an outer fill, the geometry betweendouble attached pasts is filled by using the concept of roll cylinders. Byselecting an appropriate roll radius the user may exert some influence on theouter edge of the fill faces (Figure III.A.10).
Modifying fill faces using Control curves - Without any effort to keep theresultant modification realistic, modifying automatically generated fill faces ispossible. This procedure is typical of what the user would follow to createfeatures such as draw bars or take up beads on the fill area between parts.Modifications are carried out by creating and using any number of controlcurves over the fill area; these control curves determine the shape of themodified fill faces. Control curves may be created and modified using the
Curve editor.
Figure III.A.10 – Filling the gap between two parts
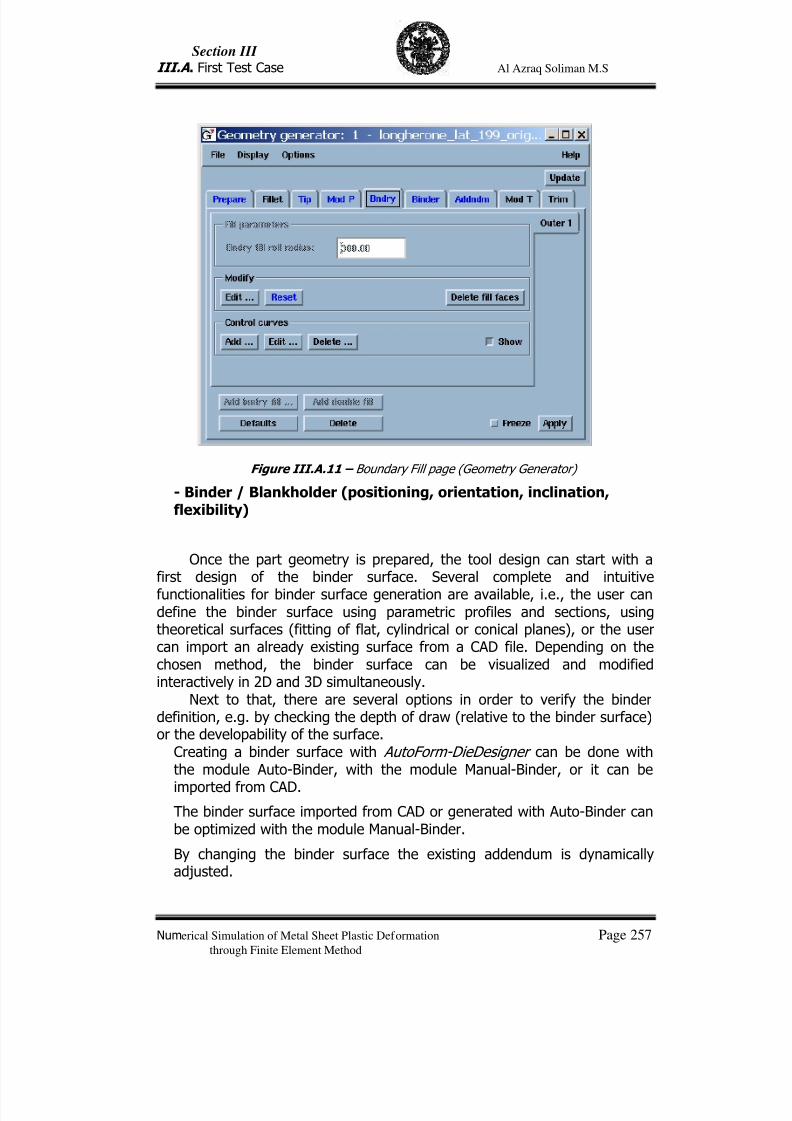
7/23/2019 Al Azraq Ingegneria Chimica Dei Materiali e Della Produzione
http://slidepdf.com/reader/full/al-azraq-ingegneria-chimica-dei-materiali-e-della-produzione 269/419
Section III
III.A . First Test Case Al Azraq Soliman M.S
Numerical Simulation of Metal Sheet Plastic Deformation Page 257through Finite Element Method
Figure III.A.11 – Boundary Fill page (Geometry Generator)
- Binder / Blankholder (positioning, orientation, inclination,flexibility)
Once the part geometry is prepared, the tool design can start with afirst design of the binder surface. Several complete and intuitive
functionalities for binder surface generation are available, i.e., the user candefine the binder surface using parametric profiles and sections, usingtheoretical surfaces (fitting of flat, cylindrical or conical planes), or the usercan import an already existing surface from a CAD file. Depending on thechosen method, the binder surface can be visualized and modifiedinteractively in 2D and 3D simultaneously.
Next to that, there are several options in order to verify the binderdefinition, e.g. by checking the depth of draw (relative to the binder surface)or the developability of the surface.
Creating a binder surface with AutoForm-DieDesigner can be done withthe module Auto-Binder, with the module Manual-Binder, or it can be
imported from CAD.
The binder surface imported from CAD or generated with Auto-Binder canbe optimized with the module Manual-Binder.
By changing the binder surface the existing addendum is dynamicallyadjusted.
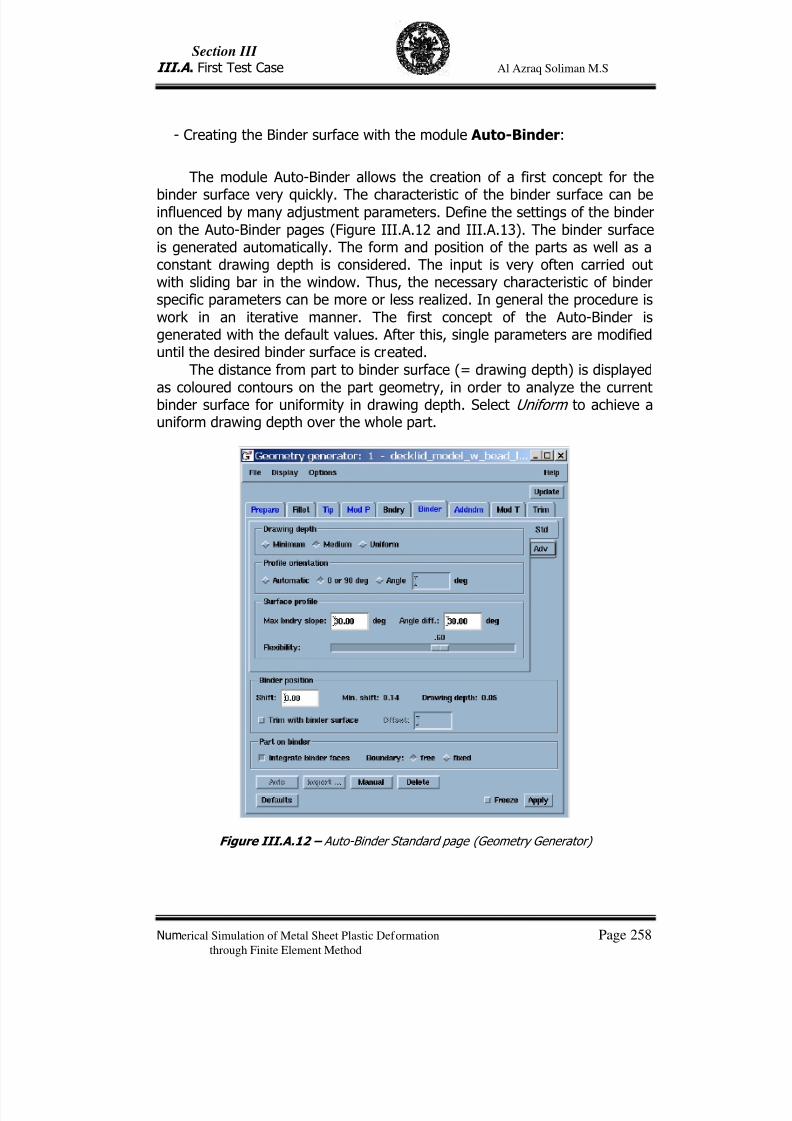
7/23/2019 Al Azraq Ingegneria Chimica Dei Materiali e Della Produzione
http://slidepdf.com/reader/full/al-azraq-ingegneria-chimica-dei-materiali-e-della-produzione 270/419
Section III
III.A . First Test Case Al Azraq Soliman M.S
Numerical Simulation of Metal Sheet Plastic Deformation Page 258through Finite Element Method
- Creating the Binder surface with the module Auto-Binder:
The module Auto-Binder allows the creation of a first concept for the
binder surface very quickly. The characteristic of the binder surface can beinfluenced by many adjustment parameters. Define the settings of the binderon the Auto-Binder pages (Figure III.A.12 and III.A.13). The binder surfaceis generated automatically. The form and position of the parts as well as aconstant drawing depth is considered. The input is very often carried outwith sliding bar in the window. Thus, the necessary characteristic of binderspecific parameters can be more or less realized. In general the procedure iswork in an iterative manner. The first concept of the Auto-Binder isgenerated with the default values. After this, single parameters are modifieduntil the desired binder surface is created.
The distance from part to binder surface (= drawing depth) is displayed
as coloured contours on the part geometry, in order to analyze the currentbinder surface for uniformity in drawing depth. Select Uniform to achieve auniform drawing depth over the whole part.
Figure III.A.12 – Auto-Binder Standard page (Geometry Generator)
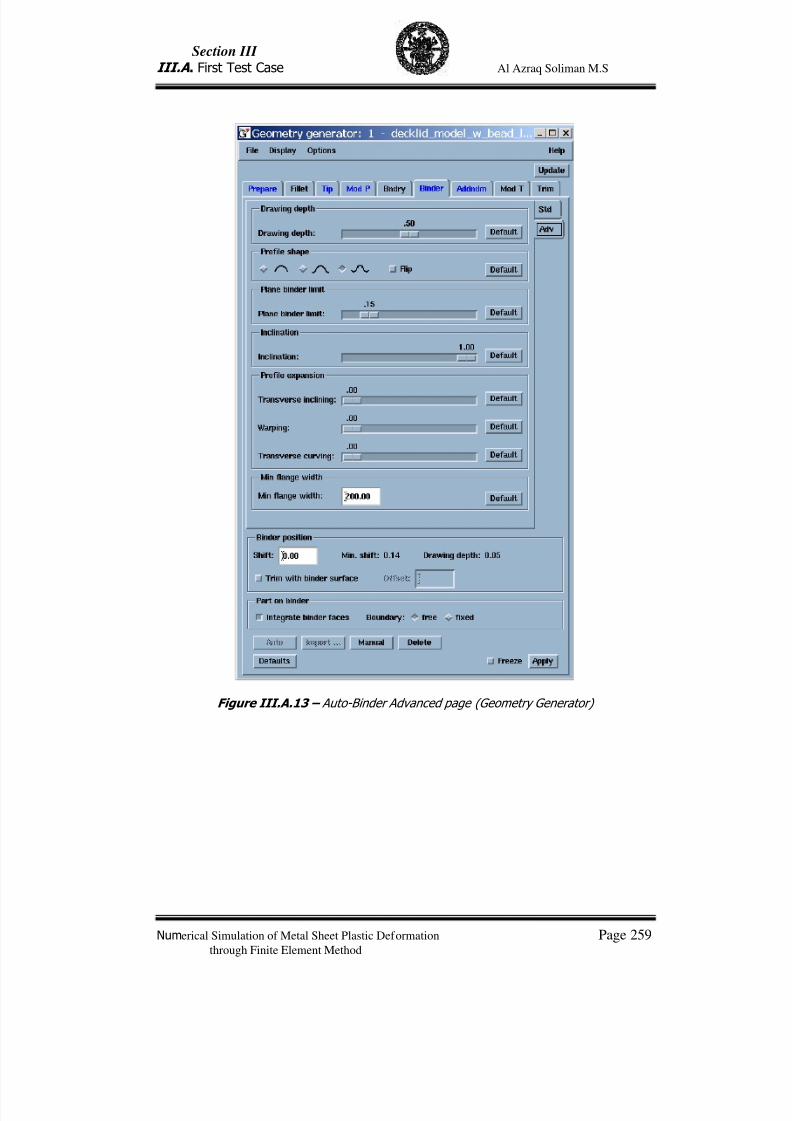
7/23/2019 Al Azraq Ingegneria Chimica Dei Materiali e Della Produzione
http://slidepdf.com/reader/full/al-azraq-ingegneria-chimica-dei-materiali-e-della-produzione 271/419
Section III
III.A . First Test Case Al Azraq Soliman M.S
Numerical Simulation of Metal Sheet Plastic Deformation Page 259through Finite Element Method
Figure III.A.13 – Auto-Binder Advanced page (Geometry Generator)
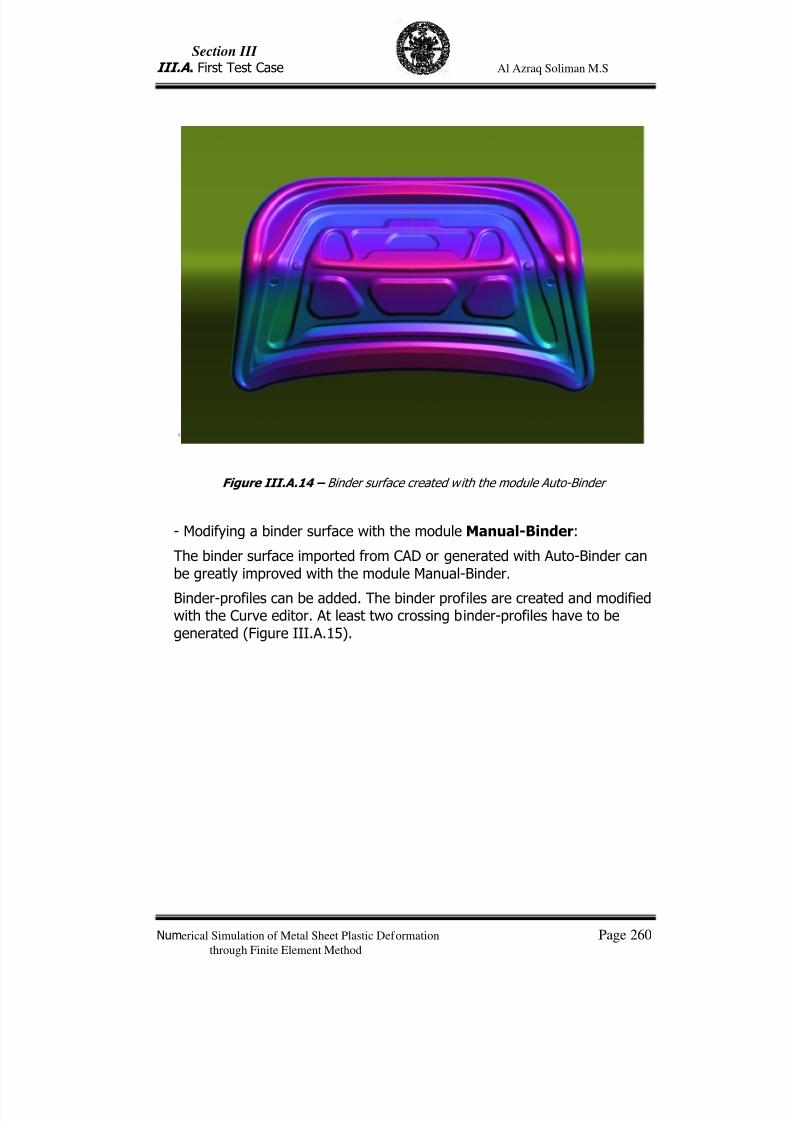
7/23/2019 Al Azraq Ingegneria Chimica Dei Materiali e Della Produzione
http://slidepdf.com/reader/full/al-azraq-ingegneria-chimica-dei-materiali-e-della-produzione 272/419
Section III
III.A . First Test Case Al Azraq Soliman M.S
Numerical Simulation of Metal Sheet Plastic Deformation Page 260through Finite Element Method
Figure III.A.14 – Binder surface created with the module Auto-Binder
- Modifying a binder surface with the module Manual-Binder:
The binder surface imported from CAD or generated with Auto-Binder canbe greatly improved with the module Manual-Binder.
Binder-profiles can be added. The binder profiles are created and modifiedwith the Curve editor. At least two crossing binder-profiles have to begenerated (Figure III.A.15).
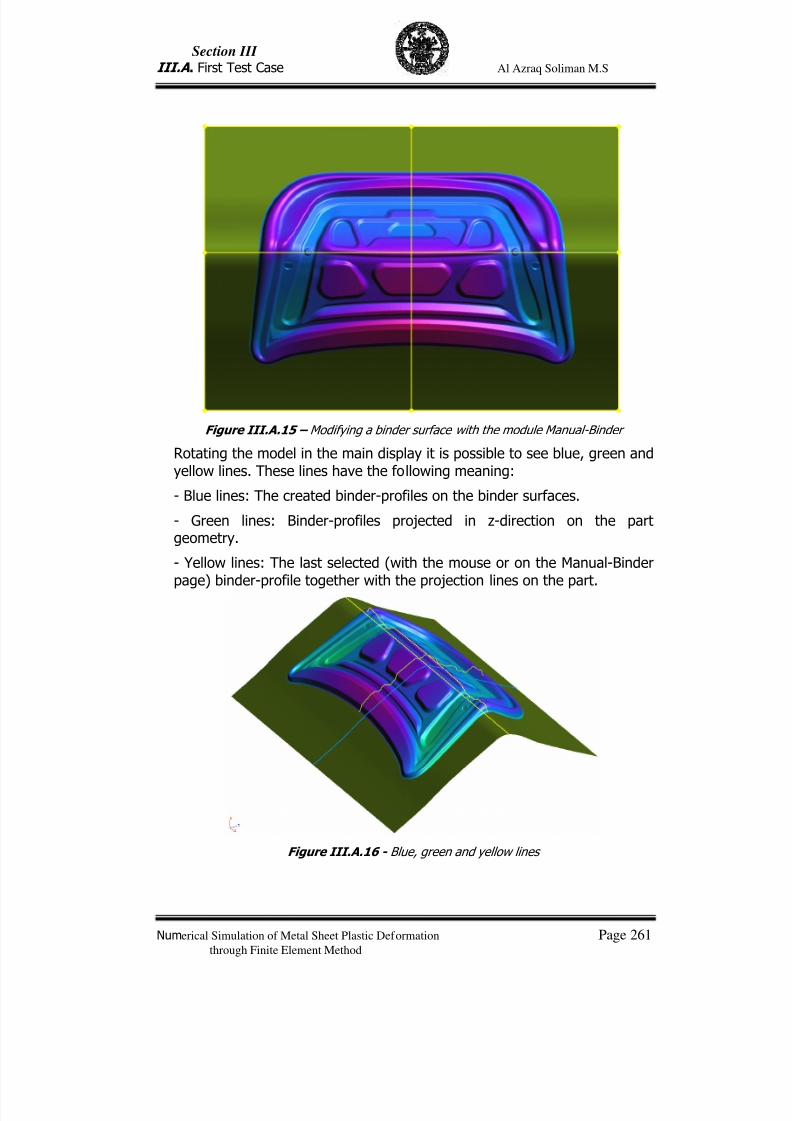
7/23/2019 Al Azraq Ingegneria Chimica Dei Materiali e Della Produzione
http://slidepdf.com/reader/full/al-azraq-ingegneria-chimica-dei-materiali-e-della-produzione 273/419
Section III
III.A . First Test Case Al Azraq Soliman M.S
Numerical Simulation of Metal Sheet Plastic Deformation Page 261through Finite Element Method
Figure III.A.15 – Modifying a binder surface with the module Manual-Binder
Rotating the model in the main display it is possible to see blue, green andyellow lines. These lines have the following meaning:
- Blue lines: The created binder-profiles on the binder surfaces.
- Green lines: Binder-profiles projected in z-direction on the partgeometry.
- Yellow lines: The last selected (with the mouse or on the Manual-Binderpage) binder-profile together with the projection lines on the part.
Figure III.A.16 - Blue, green and yellow lines
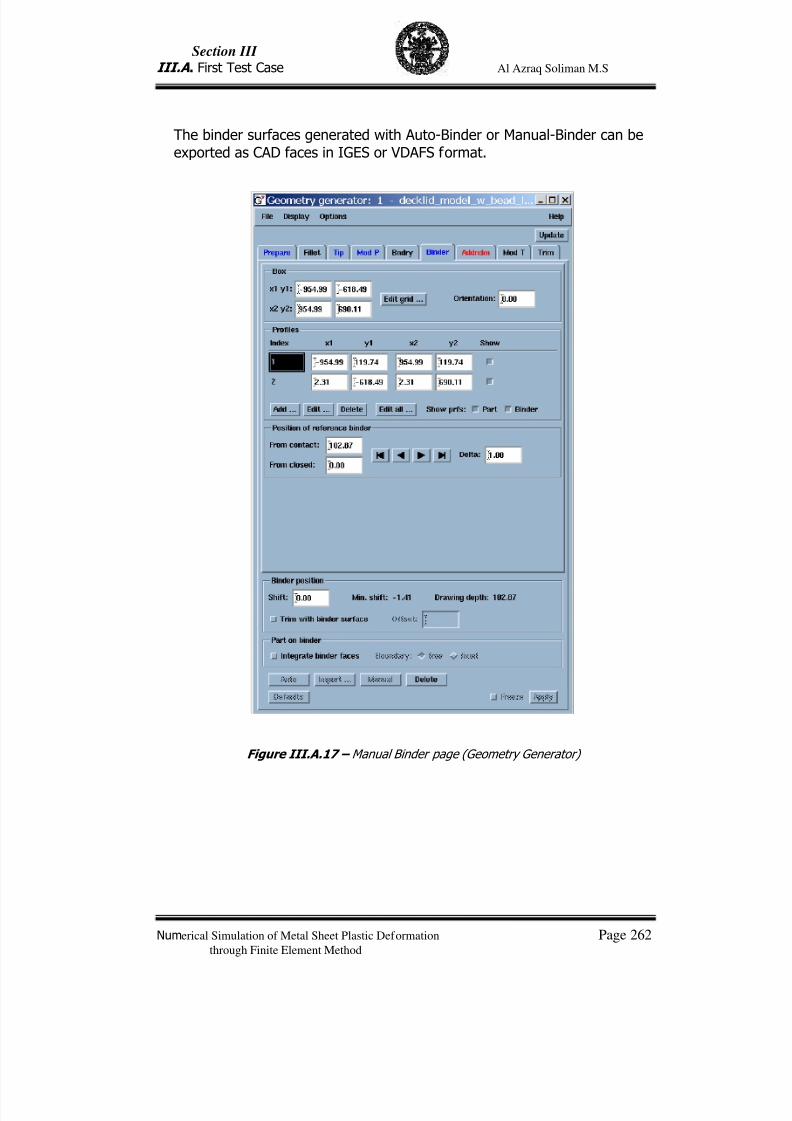
7/23/2019 Al Azraq Ingegneria Chimica Dei Materiali e Della Produzione
http://slidepdf.com/reader/full/al-azraq-ingegneria-chimica-dei-materiali-e-della-produzione 274/419
Section III
III.A . First Test Case Al Azraq Soliman M.S
Numerical Simulation of Metal Sheet Plastic Deformation Page 262through Finite Element Method
The binder surfaces generated with Auto-Binder or Manual-Binder can beexported as CAD faces in IGES or VDAFS format.
Figure III.A.17 – Manual Binder page (Geometry Generator)
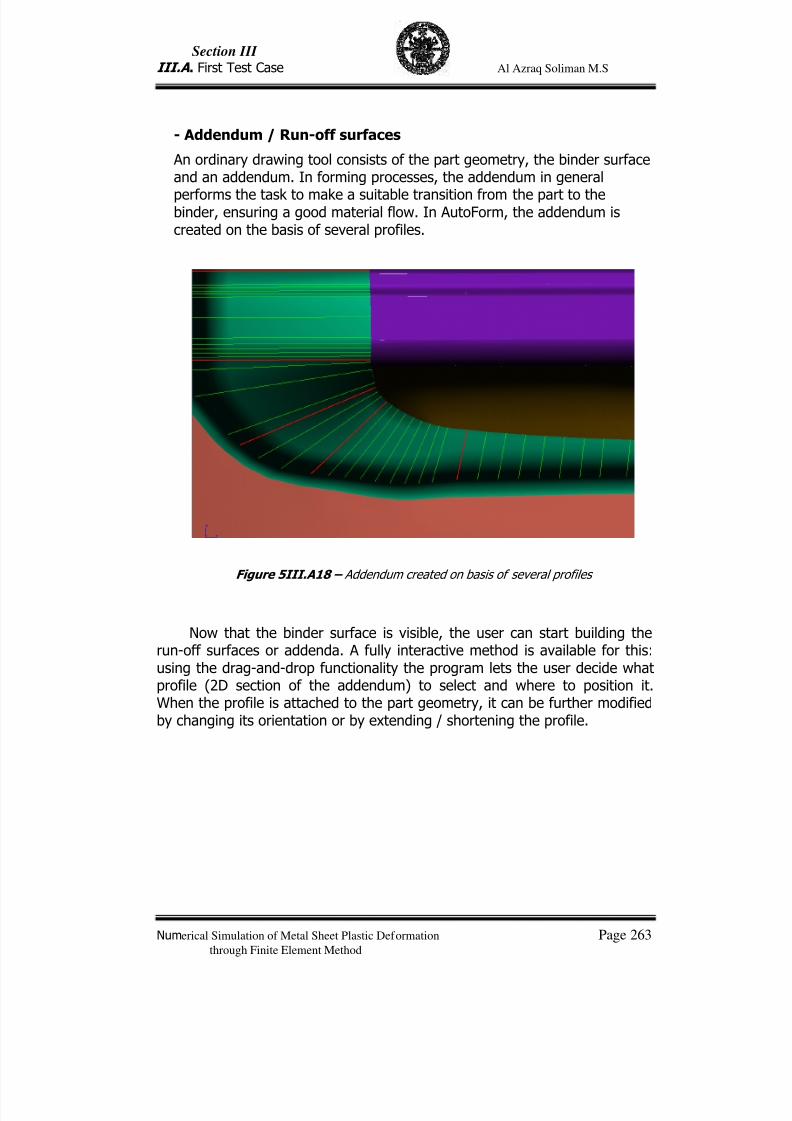
7/23/2019 Al Azraq Ingegneria Chimica Dei Materiali e Della Produzione
http://slidepdf.com/reader/full/al-azraq-ingegneria-chimica-dei-materiali-e-della-produzione 275/419
Section III
III.A . First Test Case Al Azraq Soliman M.S
Numerical Simulation of Metal Sheet Plastic Deformation Page 263through Finite Element Method
- Addendum / Run-off surfaces
An ordinary drawing tool consists of the part geometry, the binder surfaceand an addendum. In forming processes, the addendum in general
performs the task to make a suitable transition from the part to thebinder, ensuring a good material flow. In AutoForm, the addendum iscreated on the basis of several profiles.
Figure 5III.A18 – Addendum created on basis of several profiles
Now that the binder surface is visible, the user can start building therun-off surfaces or addenda. A fully interactive method is available for this:using the drag-and-drop functionality the program lets the user decide whatprofile (2D section of the addendum) to select and where to position it.When the profile is attached to the part geometry, it can be further modifiedby changing its orientation or by extending / shortening the profile.
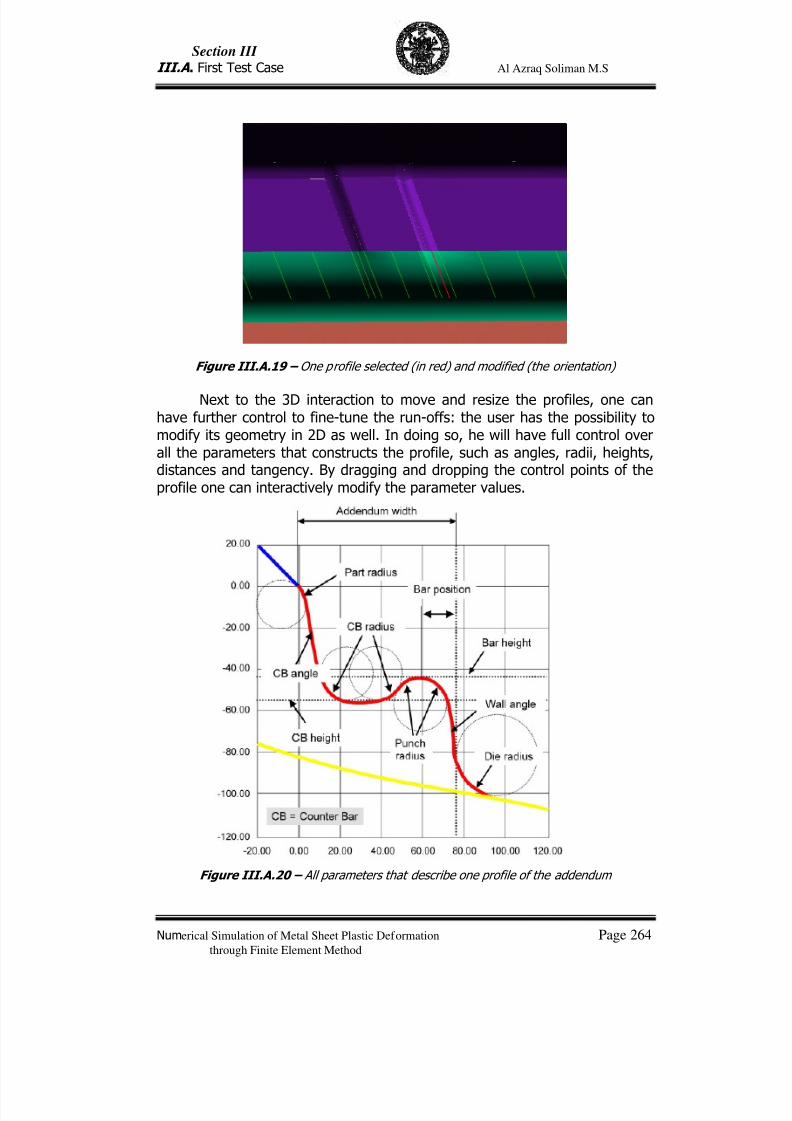
7/23/2019 Al Azraq Ingegneria Chimica Dei Materiali e Della Produzione
http://slidepdf.com/reader/full/al-azraq-ingegneria-chimica-dei-materiali-e-della-produzione 276/419
Section III
III.A . First Test Case Al Azraq Soliman M.S
Numerical Simulation of Metal Sheet Plastic Deformation Page 264through Finite Element Method
Figure III.A.19 – One profile selected (in red) and modified (the orientation)
Next to the 3D interaction to move and resize the profiles, one canhave further control to fine-tune the run-offs: the user has the possibility tomodify its geometry in 2D as well. In doing so, he will have full control overall the parameters that constructs the profile, such as angles, radii, heights,distances and tangency. By dragging and dropping the control points of theprofile one can interactively modify the parameter values.
Figure III.A.20 – All parameters that describe one profile of the addendum
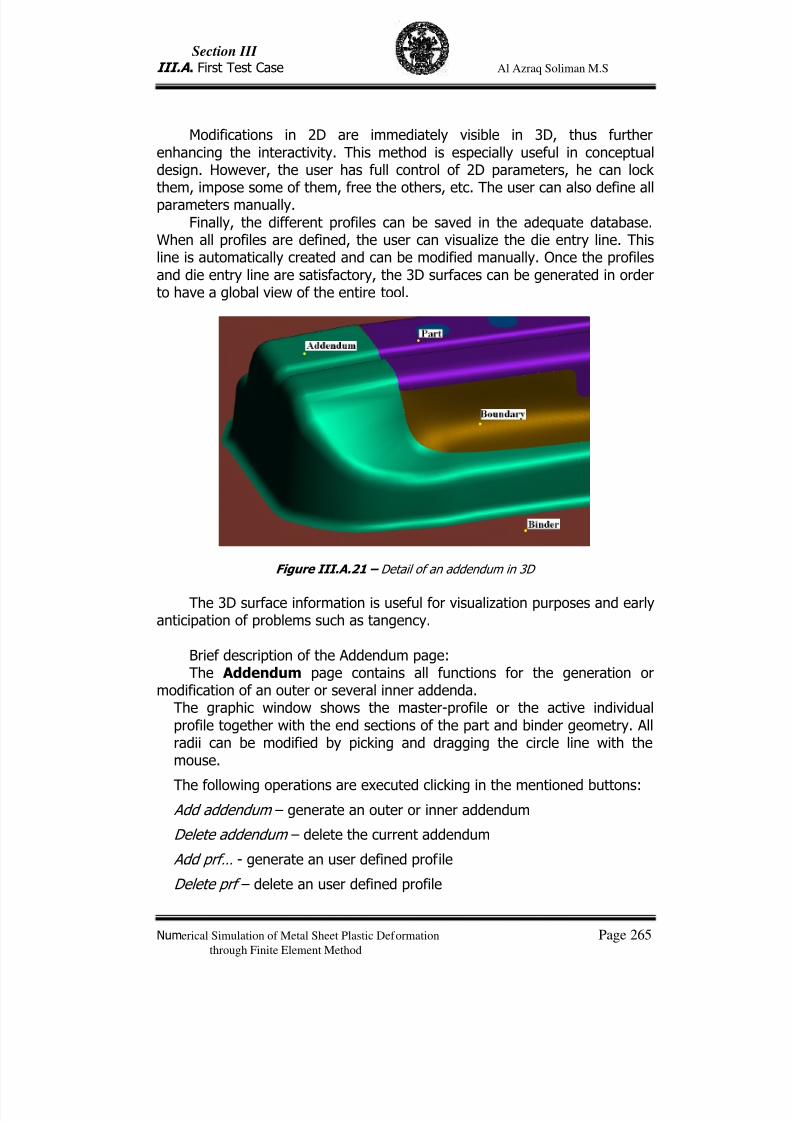
7/23/2019 Al Azraq Ingegneria Chimica Dei Materiali e Della Produzione
http://slidepdf.com/reader/full/al-azraq-ingegneria-chimica-dei-materiali-e-della-produzione 277/419
Section III
III.A . First Test Case Al Azraq Soliman M.S
Numerical Simulation of Metal Sheet Plastic Deformation Page 265through Finite Element Method
Modifications in 2D are immediately visible in 3D, thus furtherenhancing the interactivity. This method is especially useful in conceptualdesign. However, the user has full control of 2D parameters, he can lockthem, impose some of them, free the others, etc. The user can also define allparameters manually.
Finally, the different profiles can be saved in the adequate database.When all profiles are defined, the user can visualize the die entry line. Thisline is automatically created and can be modified manually. Once the profilesand die entry line are satisfactory, the 3D surfaces can be generated in orderto have a global view of the entire tool.
Figure III.A.21 – Detail of an addendum in 3D
The 3D surface information is useful for visualization purposes and earlyanticipation of problems such as tangency.
Brief description of the Addendum page:The Addendum page contains all functions for the generation or
modification of an outer or several inner addenda.The graphic window shows the master-profile or the active individualprofile together with the end sections of the part and binder geometry. Allradii can be modified by picking and dragging the circle line with themouse.
The following operations are executed clicking in the mentioned buttons:
Add addendum – generate an outer or inner addendum
Delete addendum – delete the current addendum
Add prf… - generate an user defined profile
Delete prf – delete an user defined profile
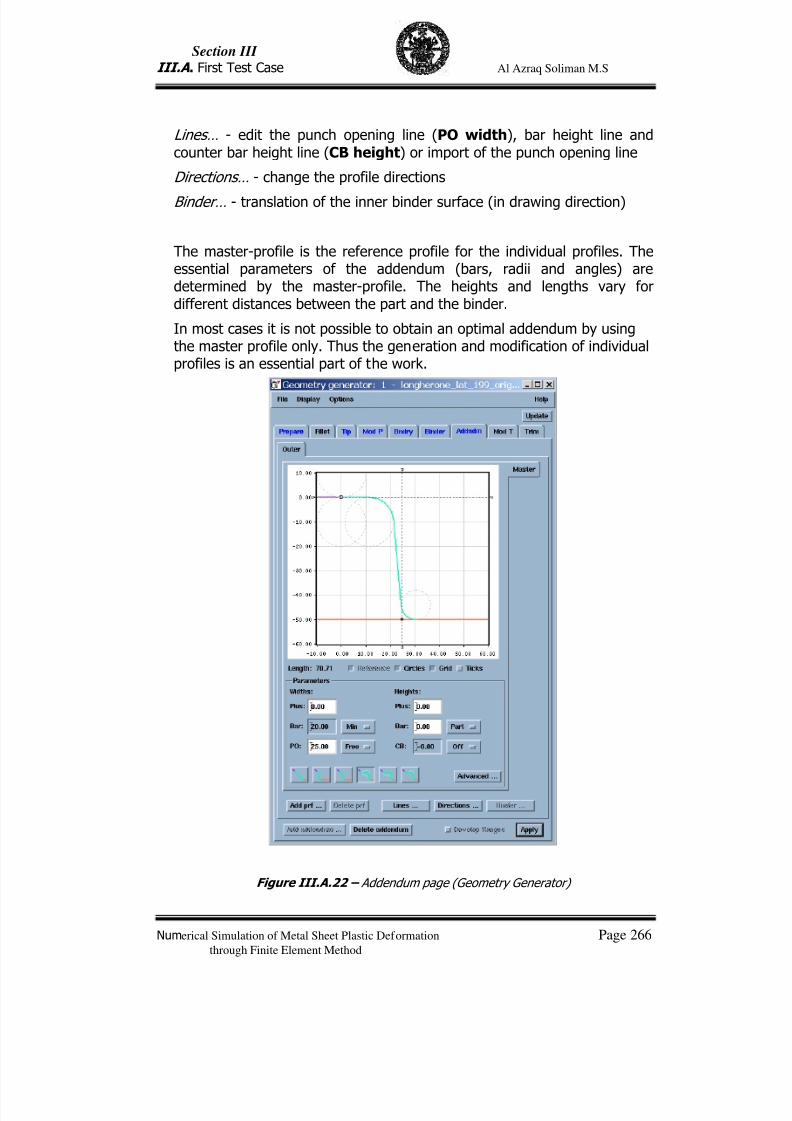
7/23/2019 Al Azraq Ingegneria Chimica Dei Materiali e Della Produzione
http://slidepdf.com/reader/full/al-azraq-ingegneria-chimica-dei-materiali-e-della-produzione 278/419
Section III
III.A . First Test Case Al Azraq Soliman M.S
Numerical Simulation of Metal Sheet Plastic Deformation Page 266through Finite Element Method
Lines… - edit the punch opening line (PO width), bar height line andcounter bar height line (CB height) or import of the punch opening line
Directions… - change the profile directions
Binder… - translation of the inner binder surface (in drawing direction)
The master-profile is the reference profile for the individual profiles. Theessential parameters of the addendum (bars, radii and angles) aredetermined by the master-profile. The heights and lengths vary fordifferent distances between the part and the binder.
In most cases it is not possible to obtain an optimal addendum by usingthe master profile only. Thus the generation and modification of individualprofiles is an essential part of the work.
Figure III.A.22 – Addendum page (Geometry Generator)
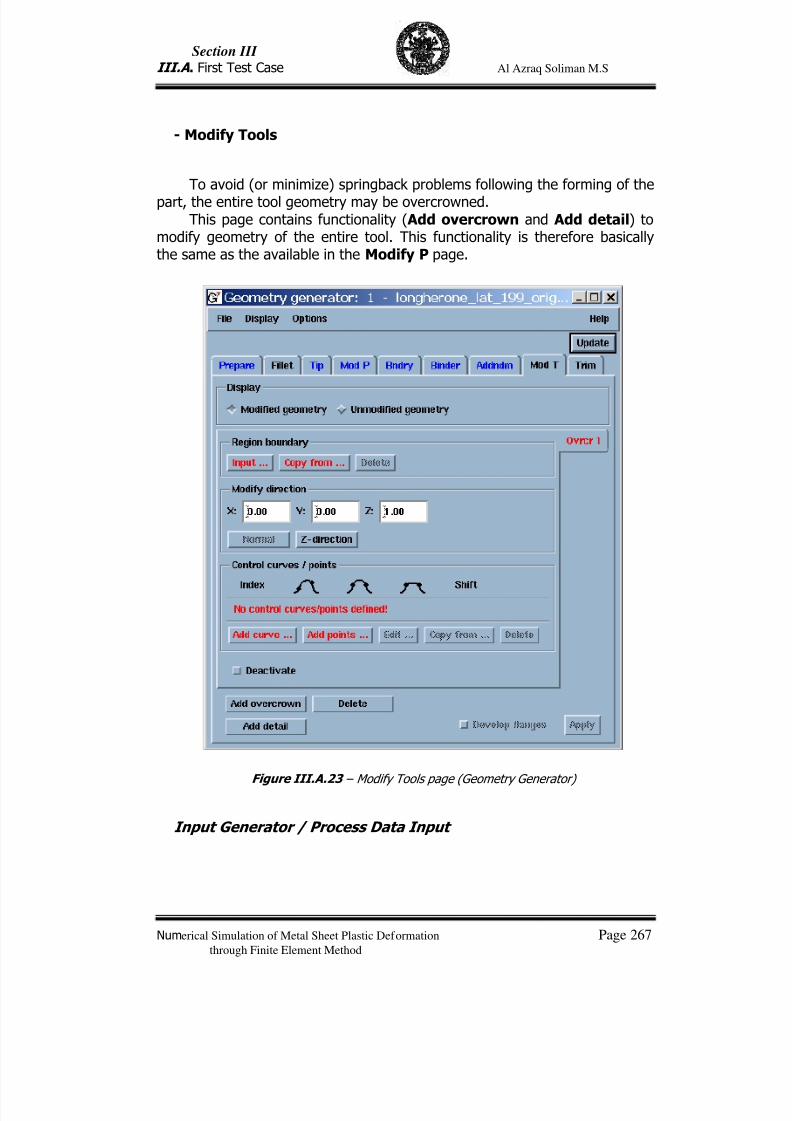
7/23/2019 Al Azraq Ingegneria Chimica Dei Materiali e Della Produzione
http://slidepdf.com/reader/full/al-azraq-ingegneria-chimica-dei-materiali-e-della-produzione 279/419
Section III
III.A . First Test Case Al Azraq Soliman M.S
Numerical Simulation of Metal Sheet Plastic Deformation Page 267through Finite Element Method
- Modify Tools
To avoid (or minimize) springback problems following the forming of the
part, the entire tool geometry may be overcrowned.This page contains functionality ( Add overcrown and Add detail) to
modify geometry of the entire tool. This functionality is therefore basicallythe same as the available in the Modify P page.
Figure III.A.23 – Modify Tools page (Geometry Generator)
Input Generator / Process Data Input
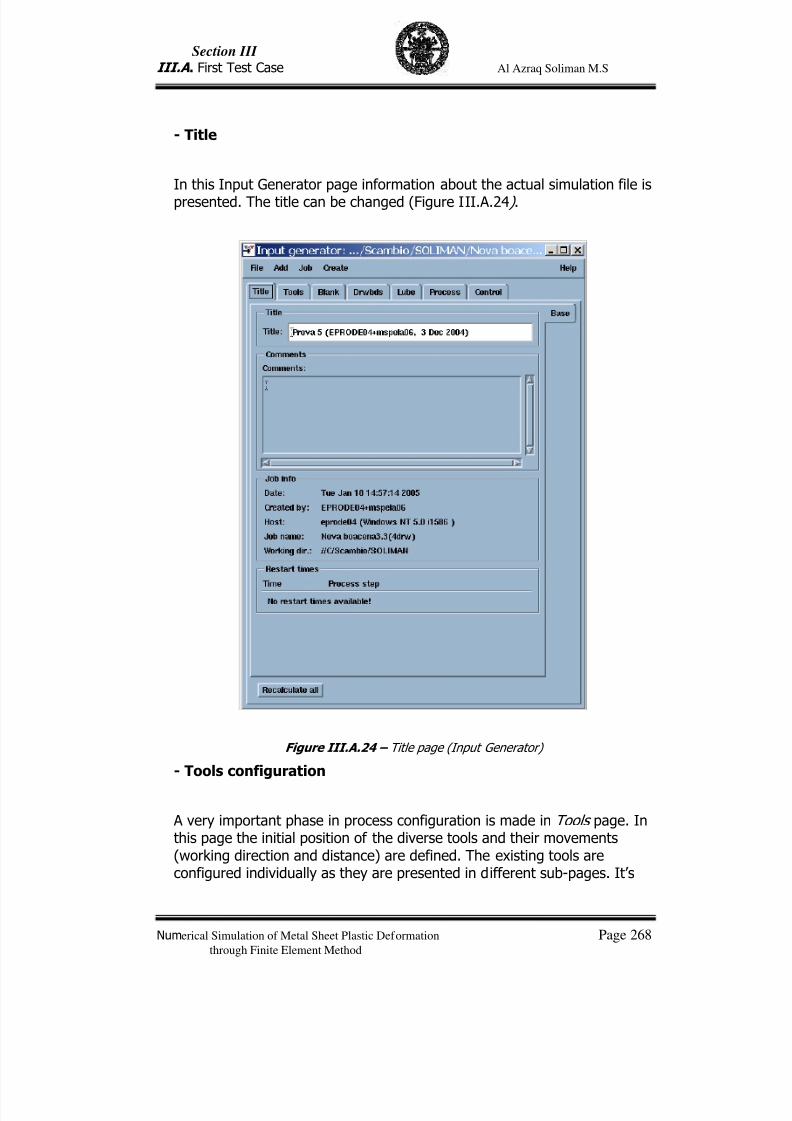
7/23/2019 Al Azraq Ingegneria Chimica Dei Materiali e Della Produzione
http://slidepdf.com/reader/full/al-azraq-ingegneria-chimica-dei-materiali-e-della-produzione 280/419
Section III
III.A . First Test Case Al Azraq Soliman M.S
Numerical Simulation of Metal Sheet Plastic Deformation Page 268through Finite Element Method
- Title
In this Input Generator page information about the actual simulation file is
presented. The title can be changed (Figure III.A.24 ) .
Figure III.A.24 – Title page (Input Generator)
- Tools configuration
A very important phase in process configuration is made in Tools page. Inthis page the initial position of the diverse tools and their movements(working direction and distance) are defined. The existing tools areconfigured individually as they are presented in different sub-pages. It’s
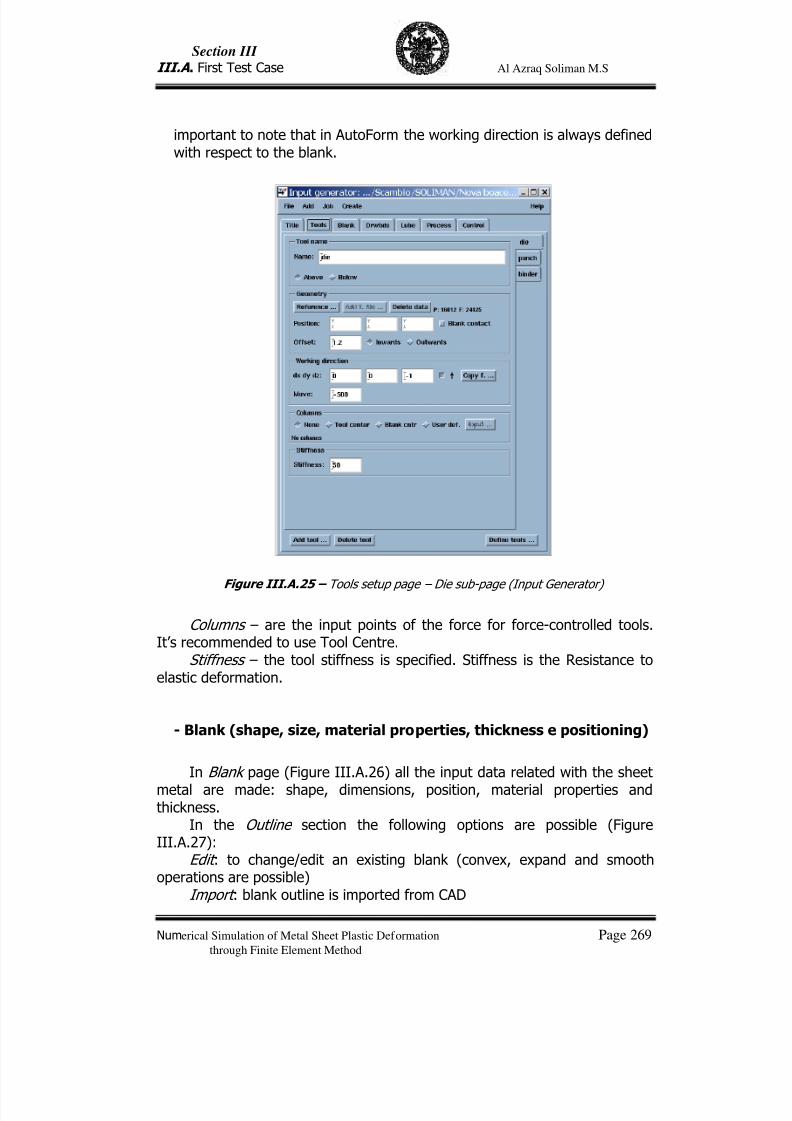
7/23/2019 Al Azraq Ingegneria Chimica Dei Materiali e Della Produzione
http://slidepdf.com/reader/full/al-azraq-ingegneria-chimica-dei-materiali-e-della-produzione 281/419
Section III
III.A . First Test Case Al Azraq Soliman M.S
Numerical Simulation of Metal Sheet Plastic Deformation Page 269through Finite Element Method
important to note that in AutoForm the working direction is always definedwith respect to the blank.
Figure III.A.25 – Tools setup page – Die sub-page (Input Generator)
Columns – are the input points of the force for force-controlled tools.It’s recommended to use Tool Centre.
Stiffness – the tool stiffness is specified. Stiffness is the Resistance toelastic deformation.
- Blank (shape, size, material properties, thickness e positioning)
In Blank page (Figure III.A.26) all the input data related with the sheet
metal are made: shape, dimensions, position, material properties andthickness.
In the Outline section the following options are possible (FigureIII.A.27):
Edit : to change/edit an existing blank (convex, expand and smoothoperations are possible)
Import : blank outline is imported from CAD
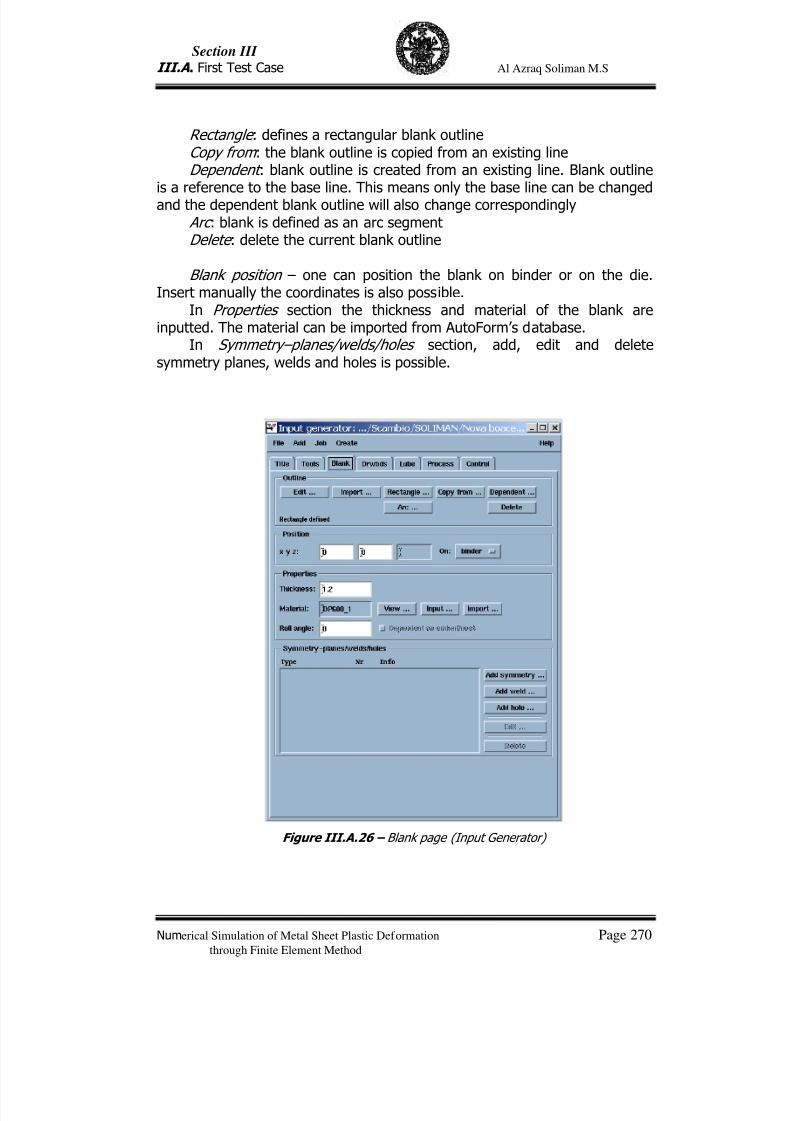
7/23/2019 Al Azraq Ingegneria Chimica Dei Materiali e Della Produzione
http://slidepdf.com/reader/full/al-azraq-ingegneria-chimica-dei-materiali-e-della-produzione 282/419
Section III
III.A . First Test Case Al Azraq Soliman M.S
Numerical Simulation of Metal Sheet Plastic Deformation Page 270through Finite Element Method
Rectangle : defines a rectangular blank outline Copy from : the blank outline is copied from an existing lineDependent : blank outline is created from an existing line. Blank outline
is a reference to the base line. This means only the base line can be changedand the dependent blank outline will also change correspondingly
Arc : blank is defined as an arc segment Delete : delete the current blank outline
Blank position – one can position the blank on binder or on the die.Insert manually the coordinates is also possible.
In Properties section the thickness and material of the blank areinputted. The material can be imported from AutoForm’s database.
In Symmetry–planes/welds/holes section, add, edit and deletesymmetry planes, welds and holes is possible.
Figure III.A.26 – Blank page (Input Generator)
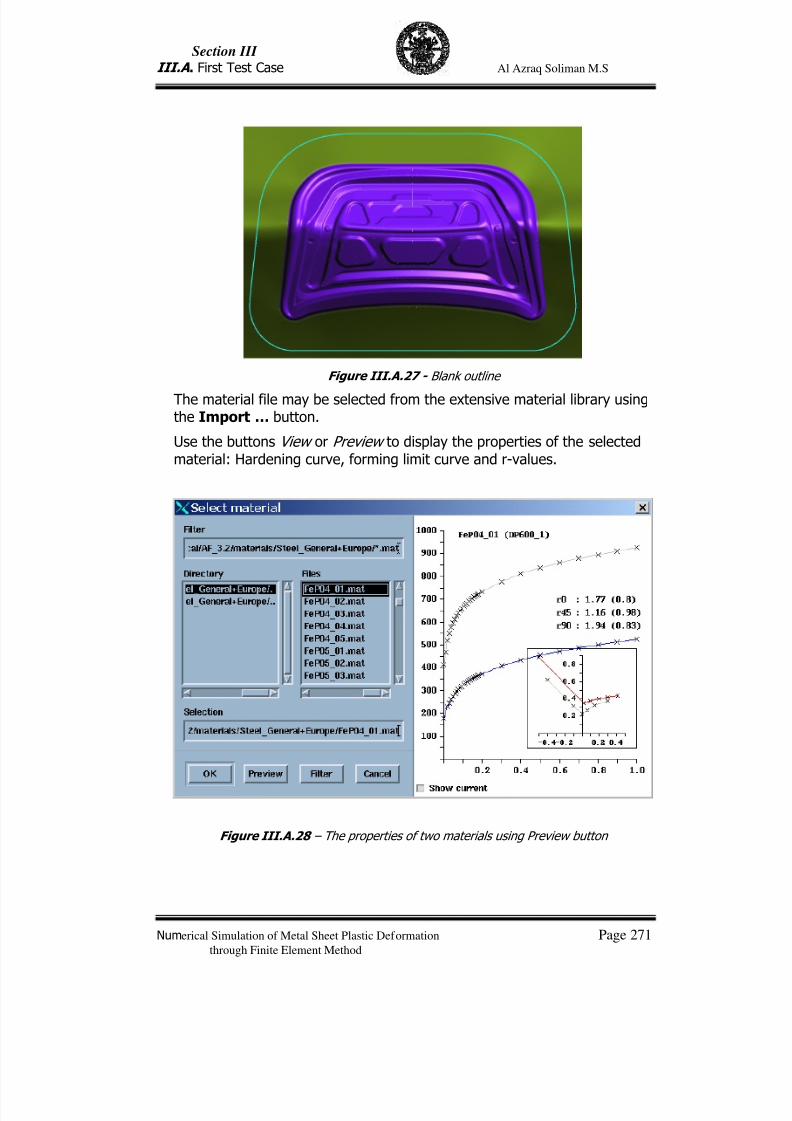
7/23/2019 Al Azraq Ingegneria Chimica Dei Materiali e Della Produzione
http://slidepdf.com/reader/full/al-azraq-ingegneria-chimica-dei-materiali-e-della-produzione 283/419
Section III
III.A . First Test Case Al Azraq Soliman M.S
Numerical Simulation of Metal Sheet Plastic Deformation Page 271through Finite Element Method
Figure III.A.27 - Blank outline
The material file may be selected from the extensive material library usingthe Import … button.
Use the buttons View or Preview to display the properties of the selectedmaterial: Hardening curve, forming limit curve and r-values.
Figure III.A.28 – The properties of two materials using Preview button
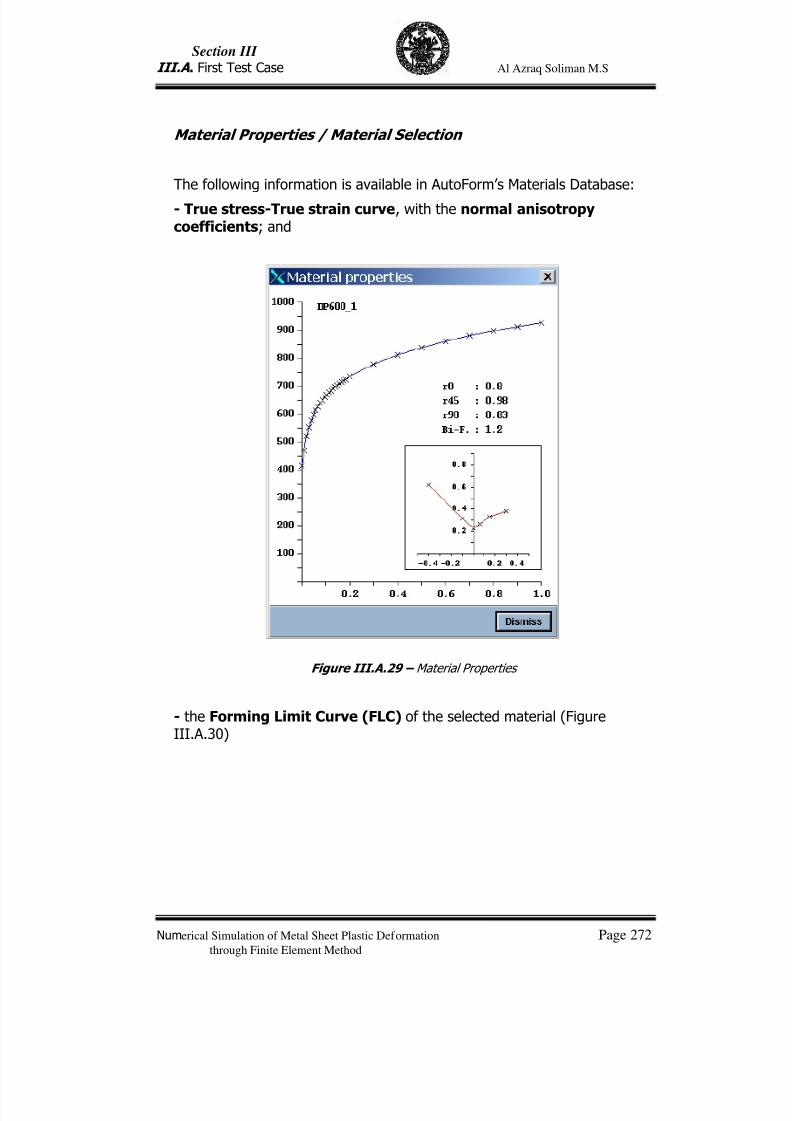
7/23/2019 Al Azraq Ingegneria Chimica Dei Materiali e Della Produzione
http://slidepdf.com/reader/full/al-azraq-ingegneria-chimica-dei-materiali-e-della-produzione 284/419
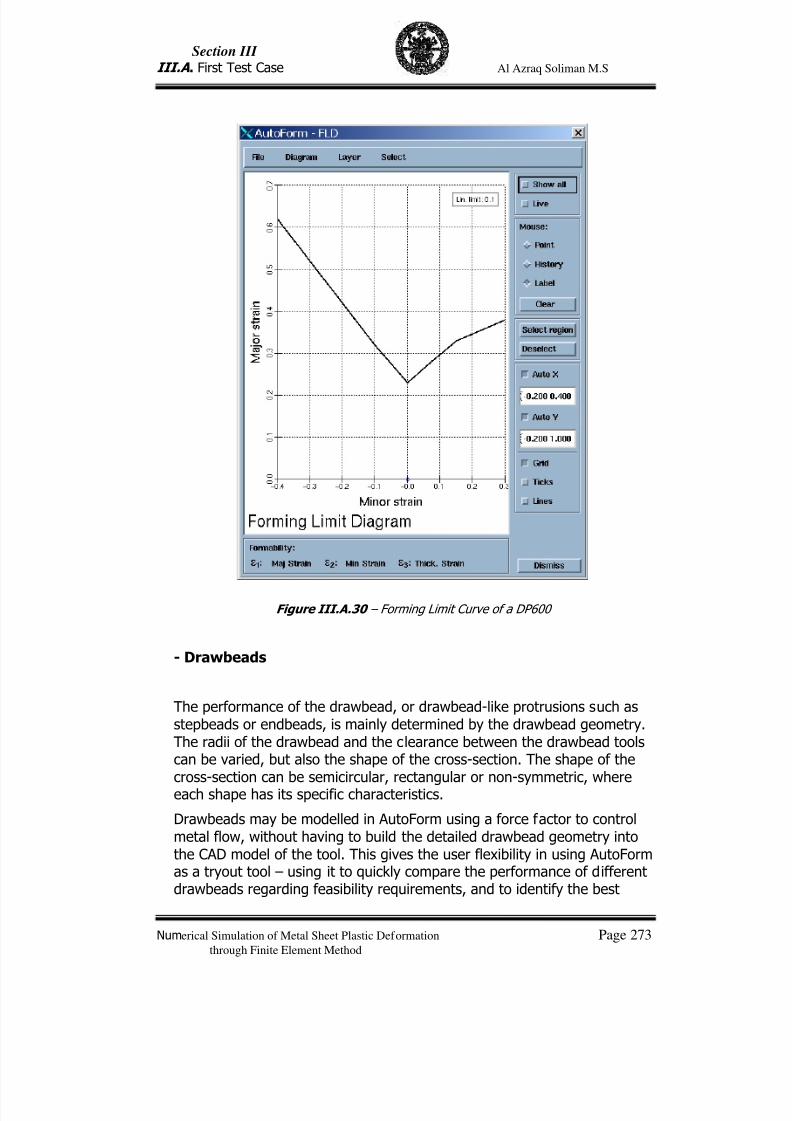
7/23/2019 Al Azraq Ingegneria Chimica Dei Materiali e Della Produzione
http://slidepdf.com/reader/full/al-azraq-ingegneria-chimica-dei-materiali-e-della-produzione 285/419
Section III
III.A . First Test Case Al Azraq Soliman M.S
Numerical Simulation of Metal Sheet Plastic Deformation Page 273through Finite Element Method
Figure III.A.30 – Forming Limit Curve of a DP600
- Drawbeads
The performance of the drawbead, or drawbead-like protrusions such asstepbeads or endbeads, is mainly determined by the drawbead geometry.The radii of the drawbead and the clearance between the drawbead toolscan be varied, but also the shape of the cross-section. The shape of thecross-section can be semicircular, rectangular or non-symmetric, whereeach shape has its specific characteristics.
Drawbeads may be modelled in AutoForm using a force factor to controlmetal flow, without having to build the detailed drawbead geometry intothe CAD model of the tool. This gives the user flexibility in using AutoFormas a tryout tool – using it to quickly compare the performance of differentdrawbeads regarding feasibility requirements, and to identify the best
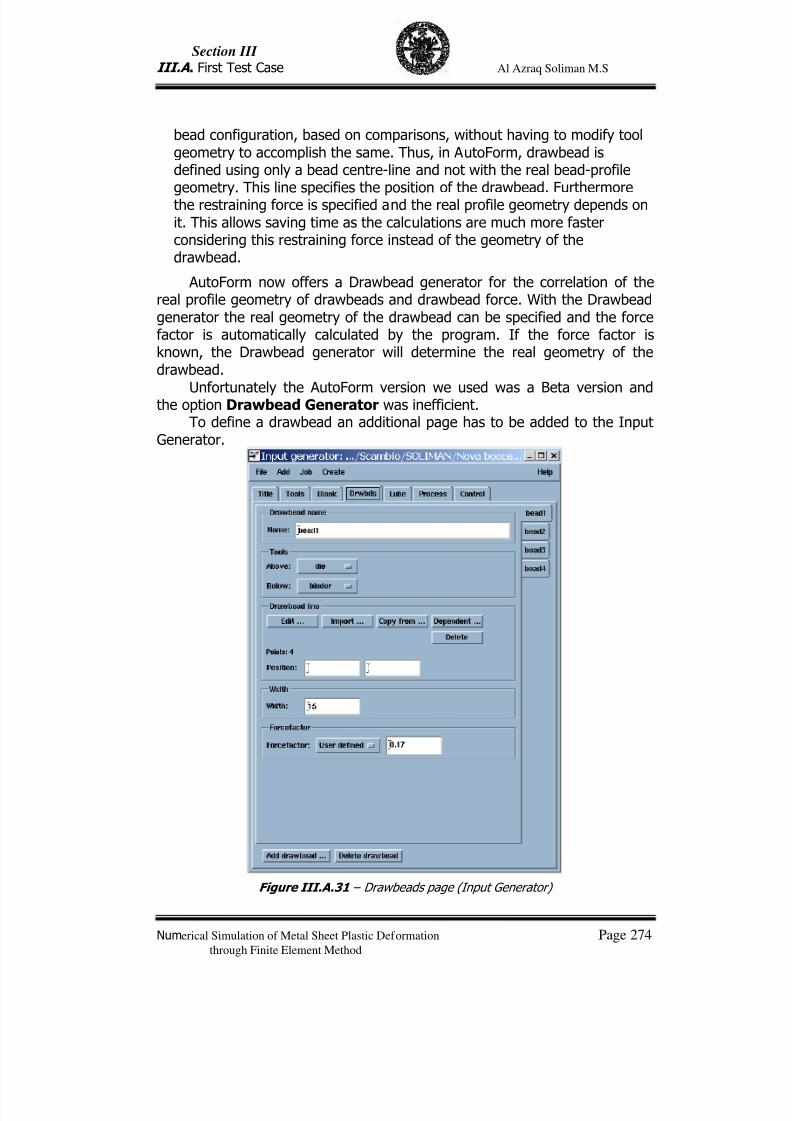
7/23/2019 Al Azraq Ingegneria Chimica Dei Materiali e Della Produzione
http://slidepdf.com/reader/full/al-azraq-ingegneria-chimica-dei-materiali-e-della-produzione 286/419
Section III
III.A . First Test Case Al Azraq Soliman M.S
Numerical Simulation of Metal Sheet Plastic Deformation Page 274through Finite Element Method
bead configuration, based on comparisons, without having to modify toolgeometry to accomplish the same. Thus, in AutoForm, drawbead isdefined using only a bead centre-line and not with the real bead-profilegeometry. This line specifies the position of the drawbead. Furthermorethe restraining force is specified and the real profile geometry depends onit. This allows saving time as the calculations are much more fasterconsidering this restraining force instead of the geometry of thedrawbead.
AutoForm now offers a Drawbead generator for the correlation of thereal profile geometry of drawbeads and drawbead force. With the Drawbeadgenerator the real geometry of the drawbead can be specified and the forcefactor is automatically calculated by the program. If the force factor isknown, the Drawbead generator will determine the real geometry of thedrawbead.
Unfortunately the AutoForm version we used was a Beta version andthe option Drawbead Generator was inefficient.To define a drawbead an additional page has to be added to the Input
Generator.
Figure III.A.31 – Drawbeads page (Input Generator)
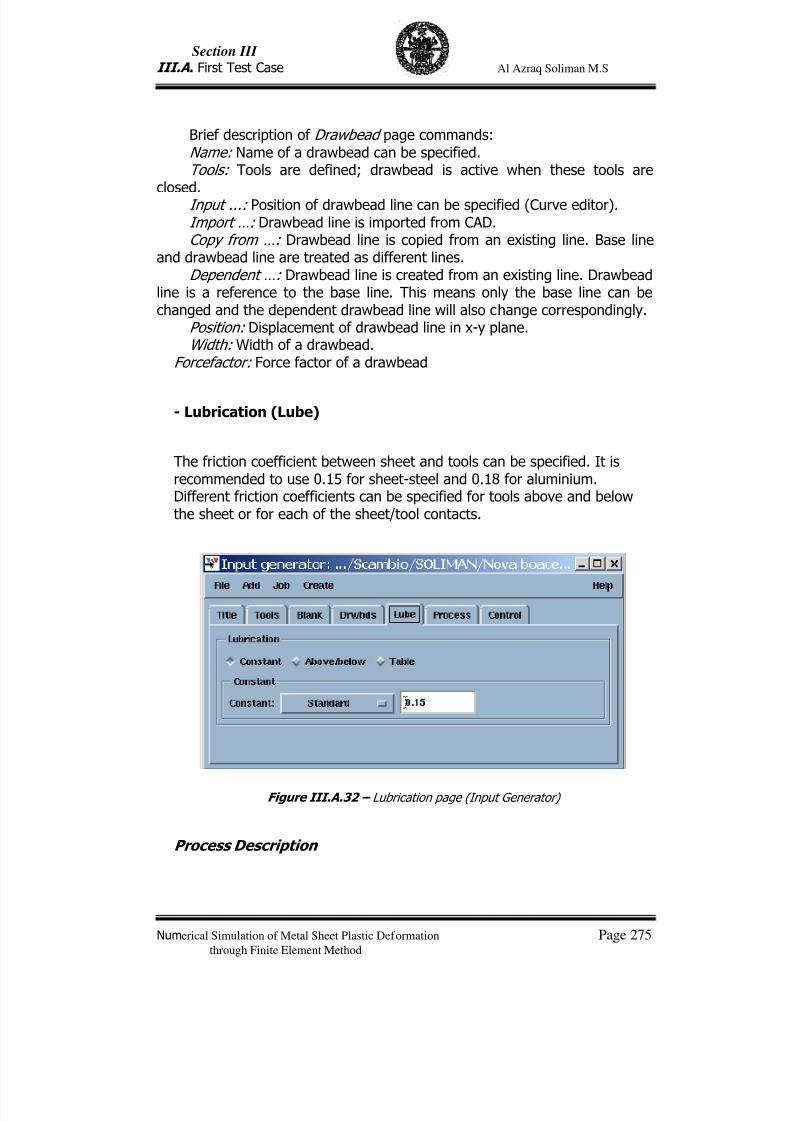
7/23/2019 Al Azraq Ingegneria Chimica Dei Materiali e Della Produzione
http://slidepdf.com/reader/full/al-azraq-ingegneria-chimica-dei-materiali-e-della-produzione 287/419
Section III
III.A . First Test Case Al Azraq Soliman M.S
Numerical Simulation of Metal Sheet Plastic Deformation Page 275through Finite Element Method
Brief description of Drawbead page commands:Name: Name of a drawbead can be specified.Tools: Tools are defined; drawbead is active when these tools are
closed.Input ...: Position of drawbead line can be specified (Curve editor).Import …: Drawbead line is imported from CAD.Copy from …: Drawbead line is copied from an existing line. Base line
and drawbead line are treated as different lines.Dependent …: Drawbead line is created from an existing line. Drawbead
line is a reference to the base line. This means only the base line can bechanged and the dependent drawbead line will also change correspondingly.
Position: Displacement of drawbead line in x-y plane.Width: Width of a drawbead.
Forcefactor: Force factor of a drawbead
- Lubrication (Lube)
The friction coefficient between sheet and tools can be specified. It isrecommended to use 0.15 for sheet-steel and 0.18 for aluminium.Different friction coefficients can be specified for tools above and belowthe sheet or for each of the sheet/tool contacts.
Figure III.A.32 – Lubrication page (Input Generator)
Process Description
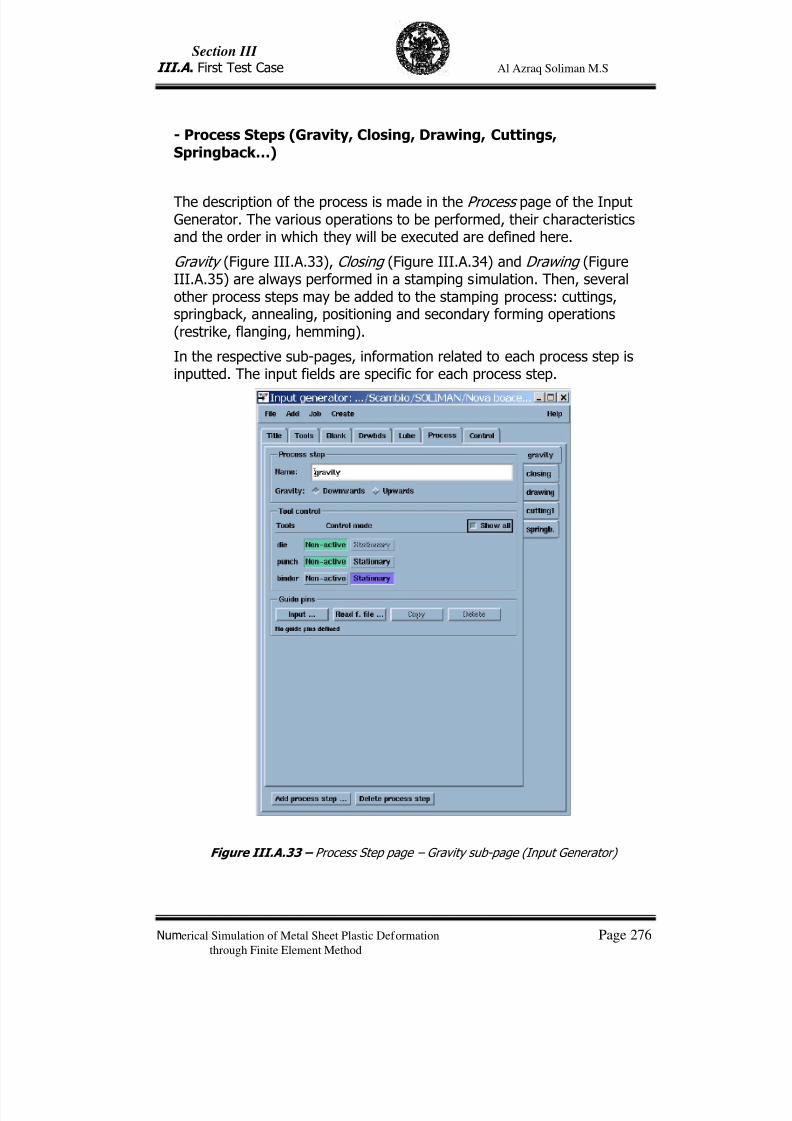
7/23/2019 Al Azraq Ingegneria Chimica Dei Materiali e Della Produzione
http://slidepdf.com/reader/full/al-azraq-ingegneria-chimica-dei-materiali-e-della-produzione 288/419
Section III
III.A . First Test Case Al Azraq Soliman M.S
Numerical Simulation of Metal Sheet Plastic Deformation Page 276through Finite Element Method
- Process Steps (Gravity, Closing, Drawing, Cuttings,Springback…)
The description of the process is made in the Process page of the InputGenerator. The various operations to be performed, their characteristicsand the order in which they will be executed are defined here.
Gravity (Figure III.A.33), Closing (Figure III.A.34) and Drawing (FigureIII.A.35) are always performed in a stamping simulation. Then, severalother process steps may be added to the stamping process: cuttings,springback, annealing, positioning and secondary forming operations(restrike, flanging, hemming).
In the respective sub-pages, information related to each process step isinputted. The input fields are specific for each process step.
Figure III.A.33 – Process Step page – Gravity sub-page (Input Generator)
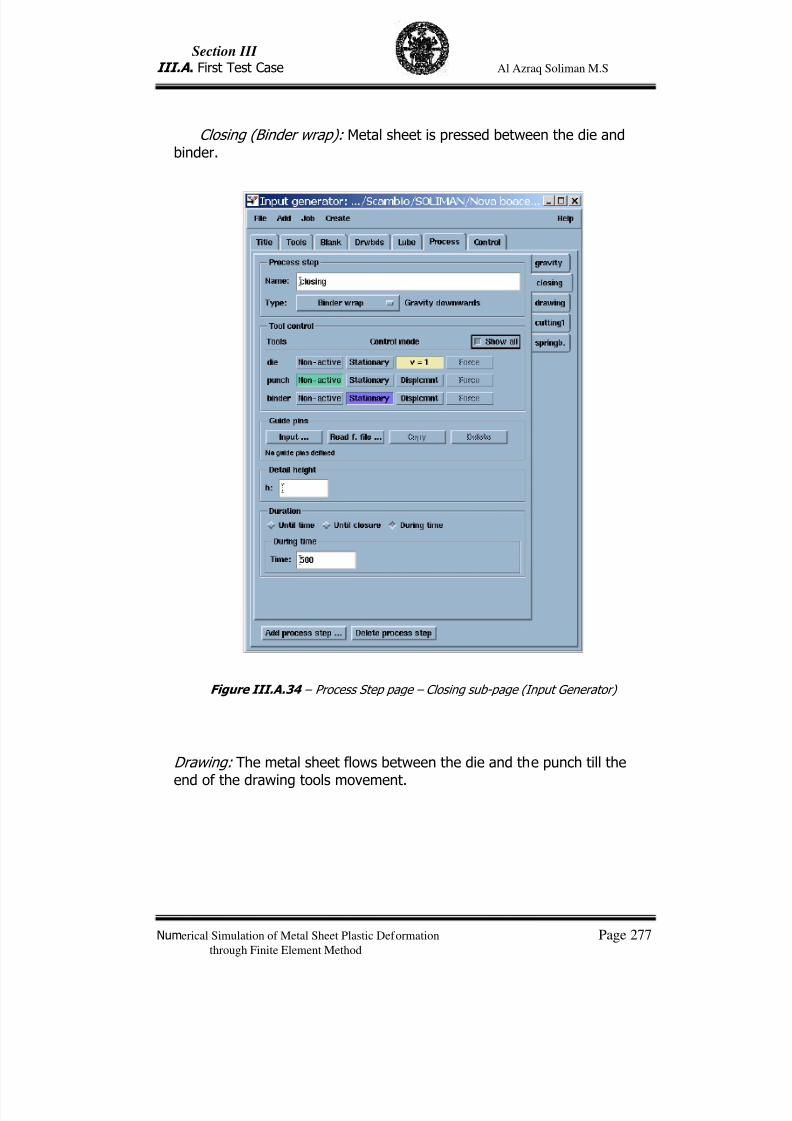
7/23/2019 Al Azraq Ingegneria Chimica Dei Materiali e Della Produzione
http://slidepdf.com/reader/full/al-azraq-ingegneria-chimica-dei-materiali-e-della-produzione 289/419
Section III
III.A . First Test Case Al Azraq Soliman M.S
Numerical Simulation of Metal Sheet Plastic Deformation Page 277through Finite Element Method
Closing (Binder wrap): Metal sheet is pressed between the die andbinder.
Figure III.A.34 – Process Step page – Closing sub-page (Input Generator)
Drawing: The metal sheet flows between the die and the punch till the
end of the drawing tools movement.
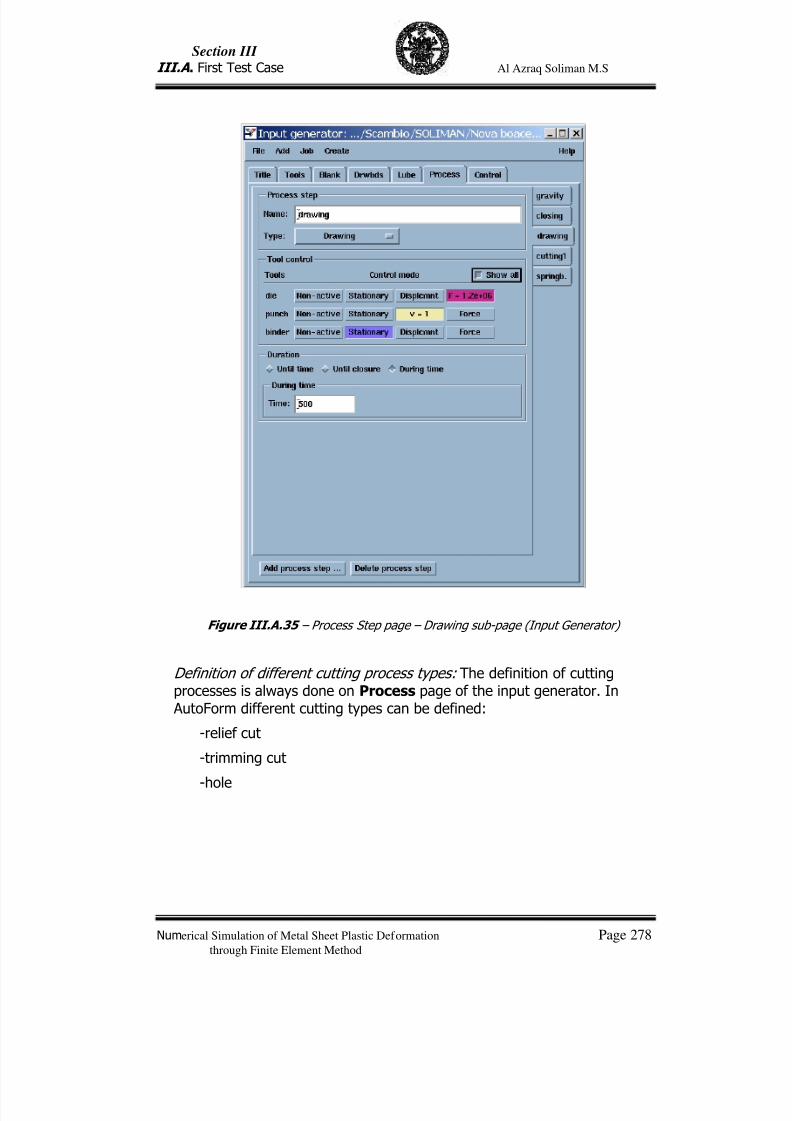
7/23/2019 Al Azraq Ingegneria Chimica Dei Materiali e Della Produzione
http://slidepdf.com/reader/full/al-azraq-ingegneria-chimica-dei-materiali-e-della-produzione 290/419
Section III
III.A . First Test Case Al Azraq Soliman M.S
Numerical Simulation of Metal Sheet Plastic Deformation Page 278through Finite Element Method
Figure III.A.35 – Process Step page – Drawing sub-page (Input Generator)
Definition of different cutting process types: The definition of cuttingprocesses is always done on Process page of the input generator. In AutoForm different cutting types can be defined:
-relief cut
-trimming cut
-hole
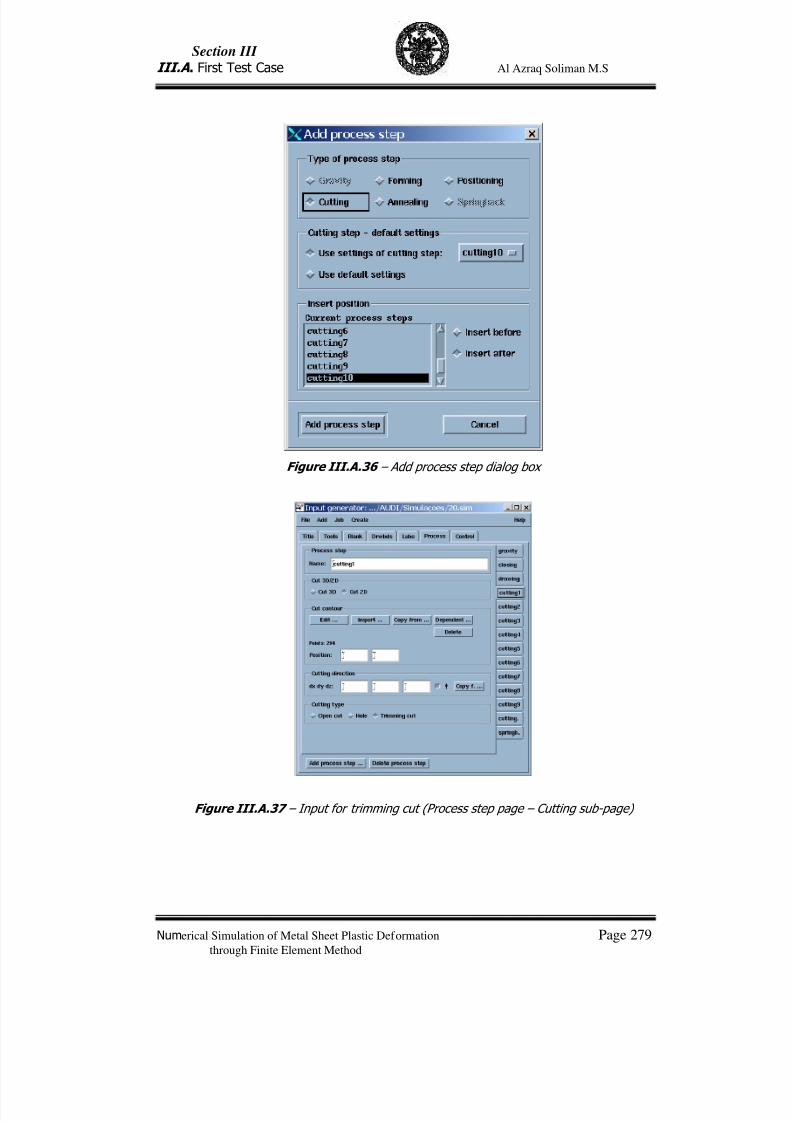
7/23/2019 Al Azraq Ingegneria Chimica Dei Materiali e Della Produzione
http://slidepdf.com/reader/full/al-azraq-ingegneria-chimica-dei-materiali-e-della-produzione 291/419
Section III
III.A . First Test Case Al Azraq Soliman M.S
Numerical Simulation of Metal Sheet Plastic Deformation Page 279through Finite Element Method
Figure III.A.36 – Add process step dialog box
Figure III.A.37 – Input for trimming cut (Process step page – Cutting sub-page)
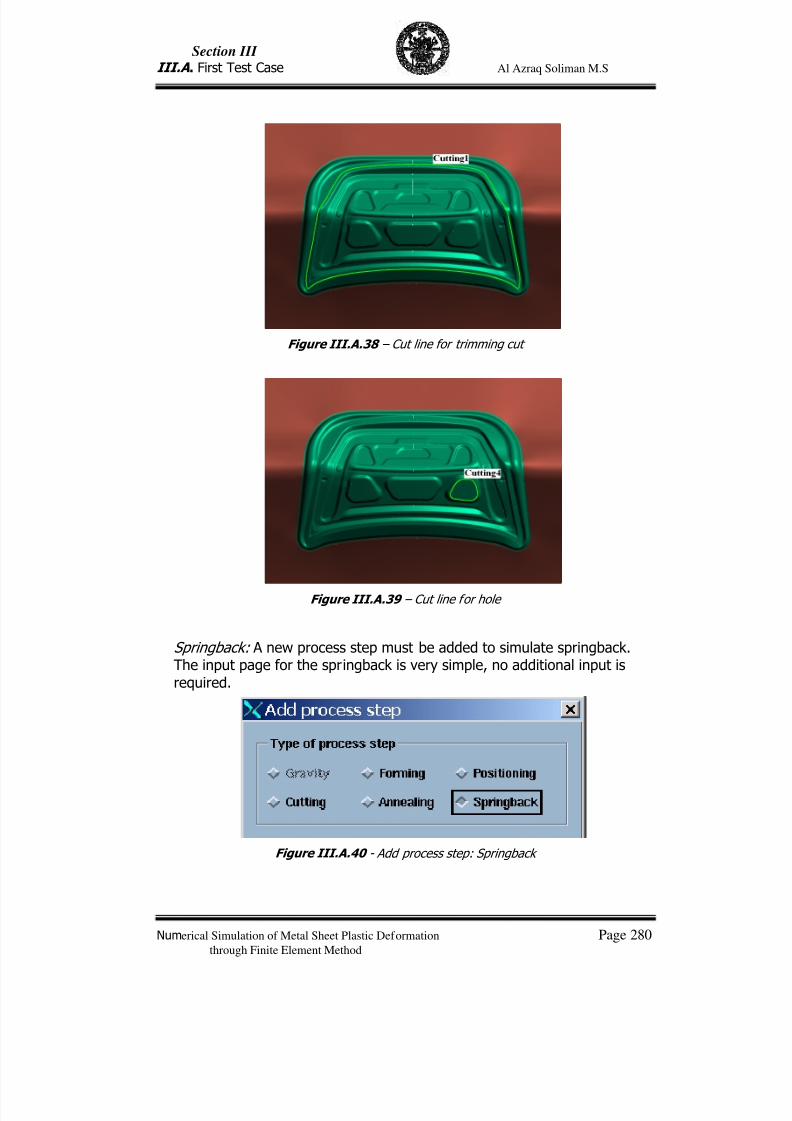
7/23/2019 Al Azraq Ingegneria Chimica Dei Materiali e Della Produzione
http://slidepdf.com/reader/full/al-azraq-ingegneria-chimica-dei-materiali-e-della-produzione 292/419
Section III
III.A . First Test Case Al Azraq Soliman M.S
Numerical Simulation of Metal Sheet Plastic Deformation Page 280through Finite Element Method
Figure III.A.38 – Cut line for trimming cut
Figure III.A.39 – Cut line for hole
Springback: A new process step must be added to simulate springback.The input page for the springback is very simple, no additional input isrequired.
Figure III.A.40 - Add process step: Springback
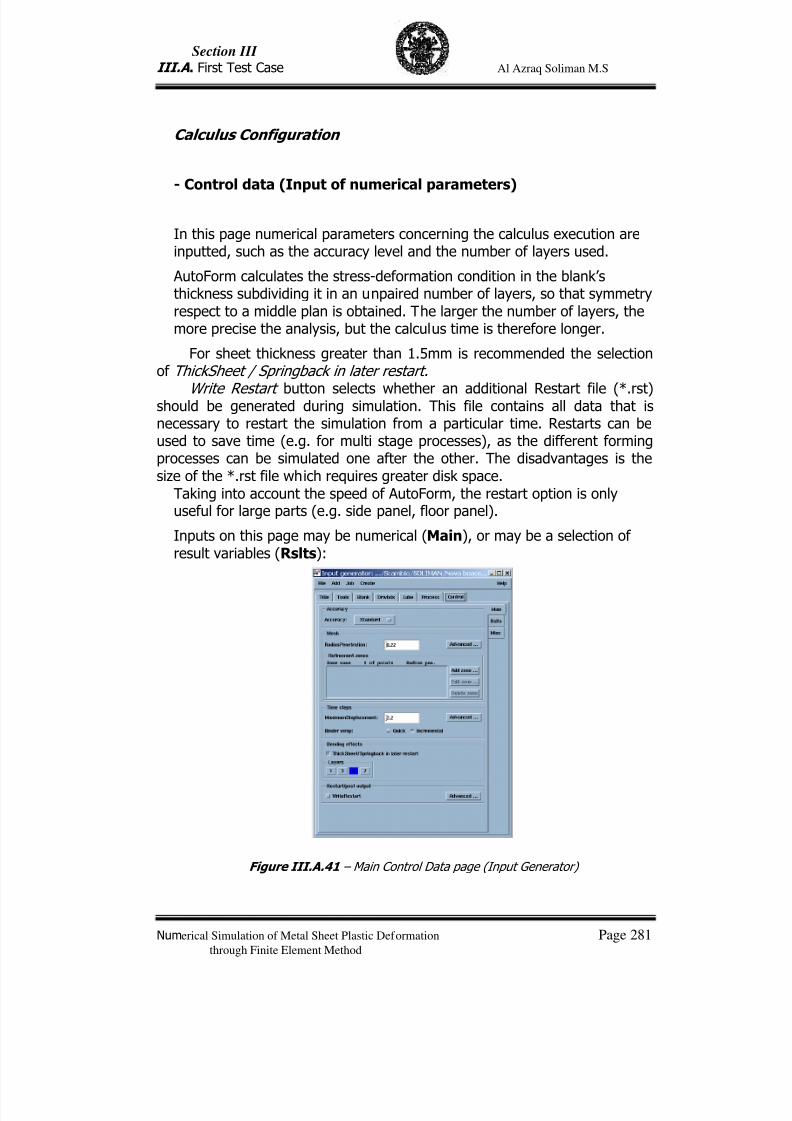
7/23/2019 Al Azraq Ingegneria Chimica Dei Materiali e Della Produzione
http://slidepdf.com/reader/full/al-azraq-ingegneria-chimica-dei-materiali-e-della-produzione 293/419
Section III
III.A . First Test Case Al Azraq Soliman M.S
Numerical Simulation of Metal Sheet Plastic Deformation Page 281through Finite Element Method
Calculus Configuration
- Control data (Input of numerical parameters)
In this page numerical parameters concerning the calculus execution areinputted, such as the accuracy level and the number of layers used.
AutoForm calculates the stress-deformation condition in the blank’sthickness subdividing it in an unpaired number of layers, so that symmetryrespect to a middle plan is obtained. The larger the number of layers, themore precise the analysis, but the calculus time is therefore longer.
For sheet thickness greater than 1.5mm is recommended the selectionof ThickSheet / Springback in later restart.
Write Restart button selects whether an additional Restart file (*.rst)should be generated during simulation. This file contains all data that isnecessary to restart the simulation from a particular time. Restarts can beused to save time (e.g. for multi stage processes), as the different formingprocesses can be simulated one after the other. The disadvantages is thesize of the *.rst file which requires greater disk space.
Taking into account the speed of AutoForm, the restart option is onlyuseful for large parts (e.g. side panel, floor panel).
Inputs on this page may be numerical (Main), or may be a selection ofresult variables (Rslts):
Figure III.A.41 – Main Control Data page (Input Generator)
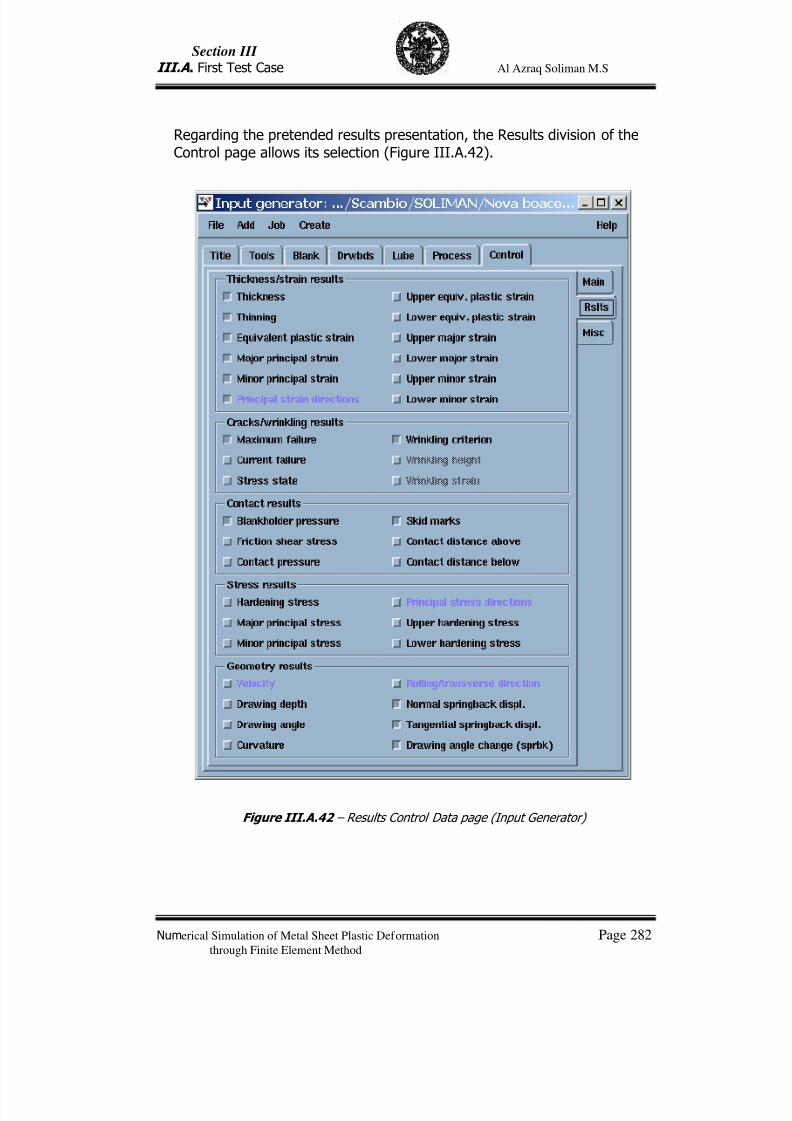
7/23/2019 Al Azraq Ingegneria Chimica Dei Materiali e Della Produzione
http://slidepdf.com/reader/full/al-azraq-ingegneria-chimica-dei-materiali-e-della-produzione 294/419
Section III
III.A . First Test Case Al Azraq Soliman M.S
Numerical Simulation of Metal Sheet Plastic Deformation Page 282through Finite Element Method
Regarding the pretended results presentation, the Results division of theControl page allows its selection (Figure III.A.42).
Figure III.A.42 – Results Control Data page (Input Generator)

7/23/2019 Al Azraq Ingegneria Chimica Dei Materiali e Della Produzione
http://slidepdf.com/reader/full/al-azraq-ingegneria-chimica-dei-materiali-e-della-produzione 295/419
Section III
III.A . First Test Case Al Azraq Soliman M.S
Numerical Simulation of Metal Sheet Plastic Deformation Page 283through Finite Element Method
III.A .4.2 - Computational Analysis
After the inputting of all data required, the simulation can now be
executed. Selecting Start Simulation in the menu bar option Run, the Start job window is opened (Figure III.A.43). Clicking in Start button it is possibleto start the computation of the simulation.
However, a previous kinematic check may be useful. Selecting Kinematiccheck only option the computer checks the tool movement only. This iscompleted in a few seconds. This functionality helps avoid possible errorsof the tool movement or tool positioning and is recognized during thesimulation. If this button is activated, only the tool movements arecalculated and displayed. The blank remains undeformed.
Figure III.A.43 – Start job window: to run a simulation or a kinematic check only
While all the information is being processed by the computer during thecalculation, the process iterations are presented in an output window asshown in Figure III.A.44.
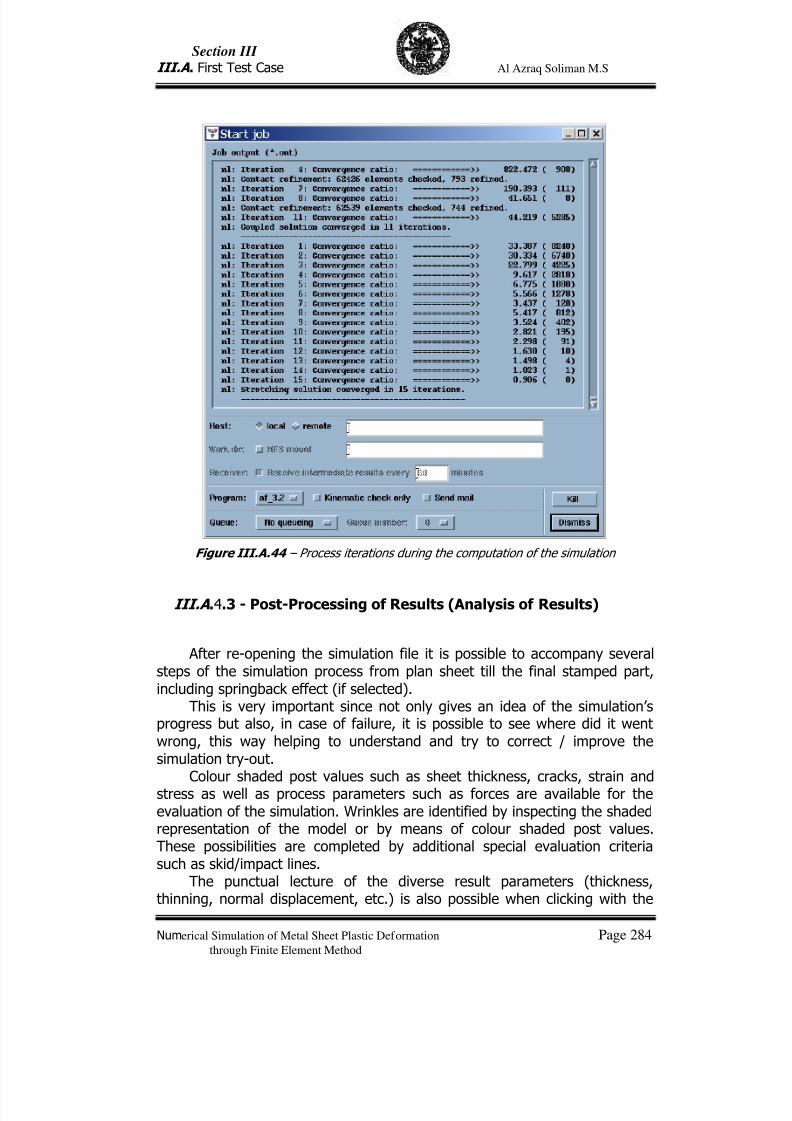
7/23/2019 Al Azraq Ingegneria Chimica Dei Materiali e Della Produzione
http://slidepdf.com/reader/full/al-azraq-ingegneria-chimica-dei-materiali-e-della-produzione 296/419
Section III
III.A . First Test Case Al Azraq Soliman M.S
Numerical Simulation of Metal Sheet Plastic Deformation Page 284through Finite Element Method
Figure III.A.44 – Process iterations during the computation of the simulation
III.A .4.3 - Post-Processing of Results (Analysis of Results)
After re-opening the simulation file it is possible to accompany severalsteps of the simulation process from plan sheet till the final stamped part,including springback effect (if selected).
This is very important since not only gives an idea of the simulation’sprogress but also, in case of failure, it is possible to see where did it wentwrong, this way helping to understand and try to correct / improve thesimulation try-out.
Colour shaded post values such as sheet thickness, cracks, strain andstress as well as process parameters such as forces are available for theevaluation of the simulation. Wrinkles are identified by inspecting the shadedrepresentation of the model or by means of colour shaded post values.These possibilities are completed by additional special evaluation criteriasuch as skid/impact lines.
The punctual lecture of the diverse result parameters (thickness,thinning, normal displacement, etc.) is also possible when clicking with the
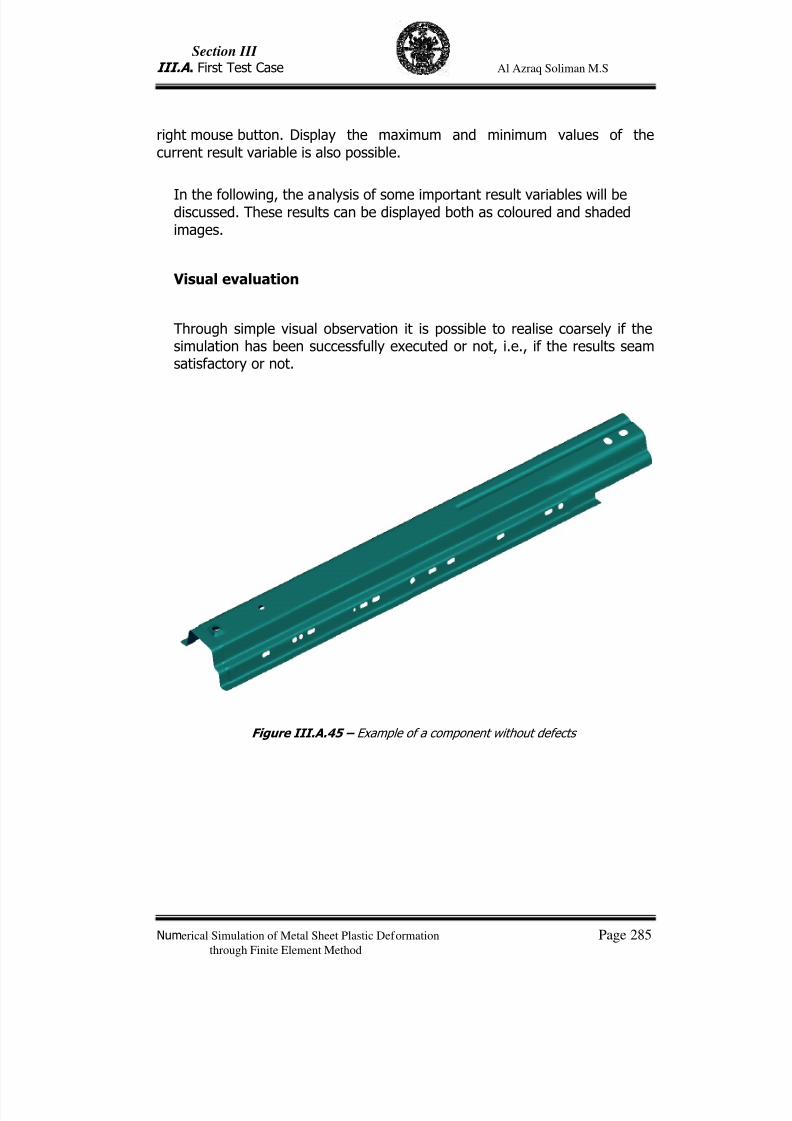
7/23/2019 Al Azraq Ingegneria Chimica Dei Materiali e Della Produzione
http://slidepdf.com/reader/full/al-azraq-ingegneria-chimica-dei-materiali-e-della-produzione 297/419
Section III
III.A . First Test Case Al Azraq Soliman M.S
Numerical Simulation of Metal Sheet Plastic Deformation Page 285through Finite Element Method
right mouse button. Display the maximum and minimum values of thecurrent result variable is also possible.
In the following, the analysis of some important result variables will bediscussed. These results can be displayed both as coloured and shadedimages.
Visual evaluation
Through simple visual observation it is possible to realise coarsely if thesimulation has been successfully executed or not, i.e., if the results seamsatisfactory or not.
Figure III.A.45 – Example of a component without defects
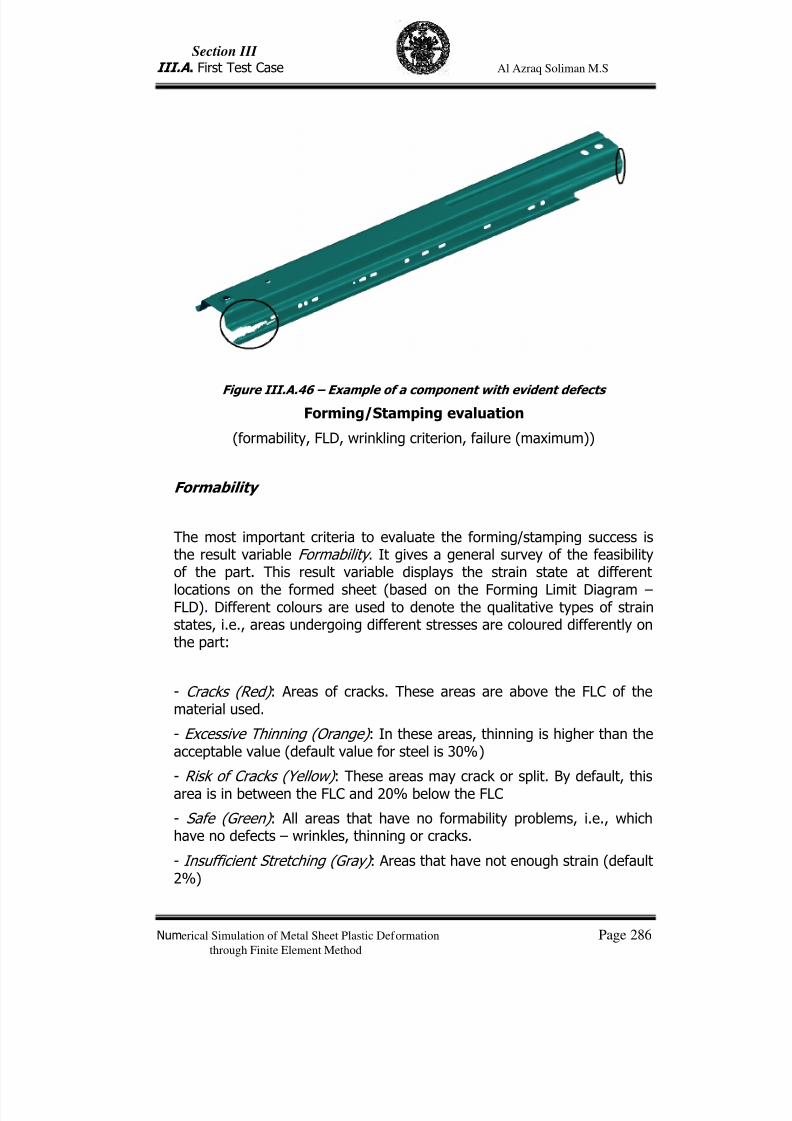
7/23/2019 Al Azraq Ingegneria Chimica Dei Materiali e Della Produzione
http://slidepdf.com/reader/full/al-azraq-ingegneria-chimica-dei-materiali-e-della-produzione 298/419
Section III
III.A . First Test Case Al Azraq Soliman M.S
Numerical Simulation of Metal Sheet Plastic Deformation Page 286through Finite Element Method
Figure III.A.46 – Example of a component with evident defects Forming/Stamping evaluation
(formability, FLD, wrinkling criterion, failure (maximum))
Formability
The most important criteria to evaluate the forming/stamping success isthe result variable Formability . It gives a general survey of the feasibilityof the part. This result variable displays the strain state at different
locations on the formed sheet (based on the Forming Limit Diagram –FLD). Different colours are used to denote the qualitative types of strainstates, i.e., areas undergoing different stresses are coloured differently onthe part:
- Cracks (Red) : Areas of cracks. These areas are above the FLC of thematerial used.
- Excessive Thinning (Orange) : In these areas, thinning is higher than theacceptable value (default value for steel is 30%)
- Risk of Cracks (Yellow) : These areas may crack or split. By default, thisarea is in between the FLC and 20% below the FLC
- Safe (Green) : All areas that have no formability problems, i.e., whichhave no defects – wrinkles, thinning or cracks.
- Insufficient Stretching (Gray) : Areas that have not enough strain (default2%)
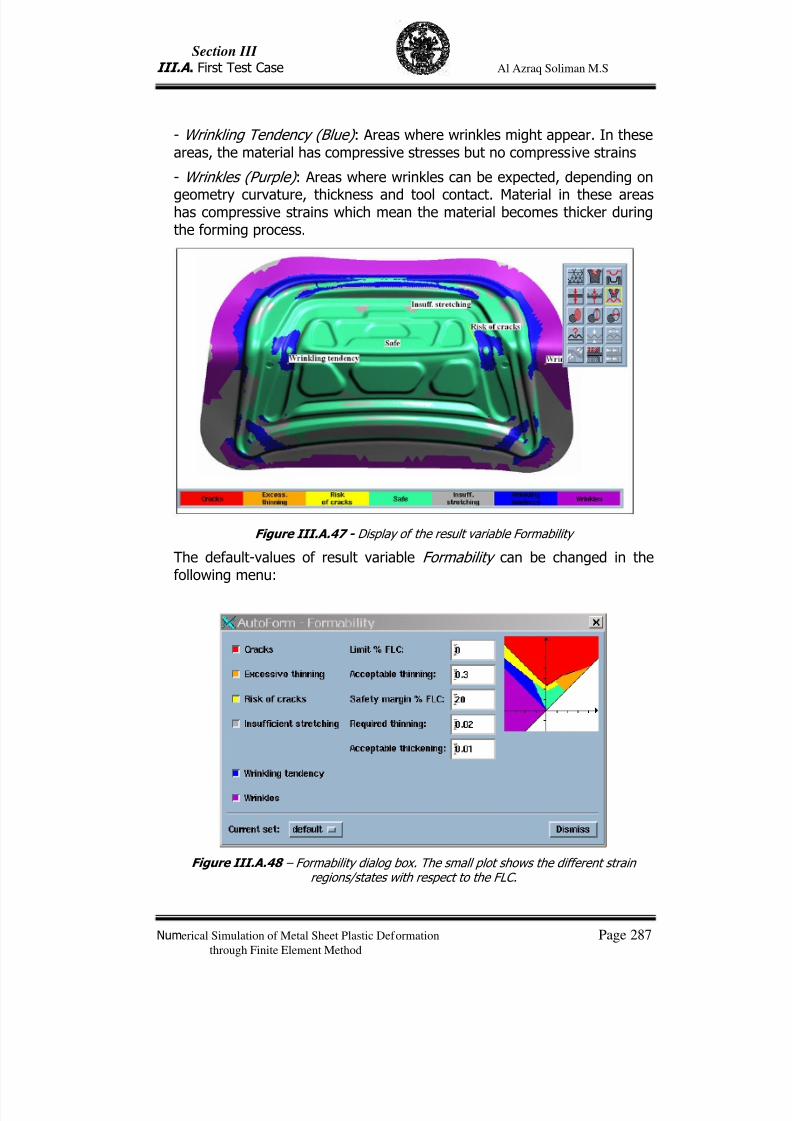
7/23/2019 Al Azraq Ingegneria Chimica Dei Materiali e Della Produzione
http://slidepdf.com/reader/full/al-azraq-ingegneria-chimica-dei-materiali-e-della-produzione 299/419
Section III
III.A . First Test Case Al Azraq Soliman M.S
Numerical Simulation of Metal Sheet Plastic Deformation Page 287through Finite Element Method
- Wrinkling Tendency (Blue) : Areas where wrinkles might appear. In theseareas, the material has compressive stresses but no compressive strains
- Wrinkles (Purple) : Areas where wrinkles can be expected, depending on
geometry curvature, thickness and tool contact. Material in these areashas compressive strains which mean the material becomes thicker duringthe forming process.
Figure III.A.47 - Display of the result variable Formability
The default-values of result variable Formability can be changed in thefollowing menu:
Figure III.A.48 – Formability dialog box. The small plot shows the different strainregions/states with respect to the FLC.
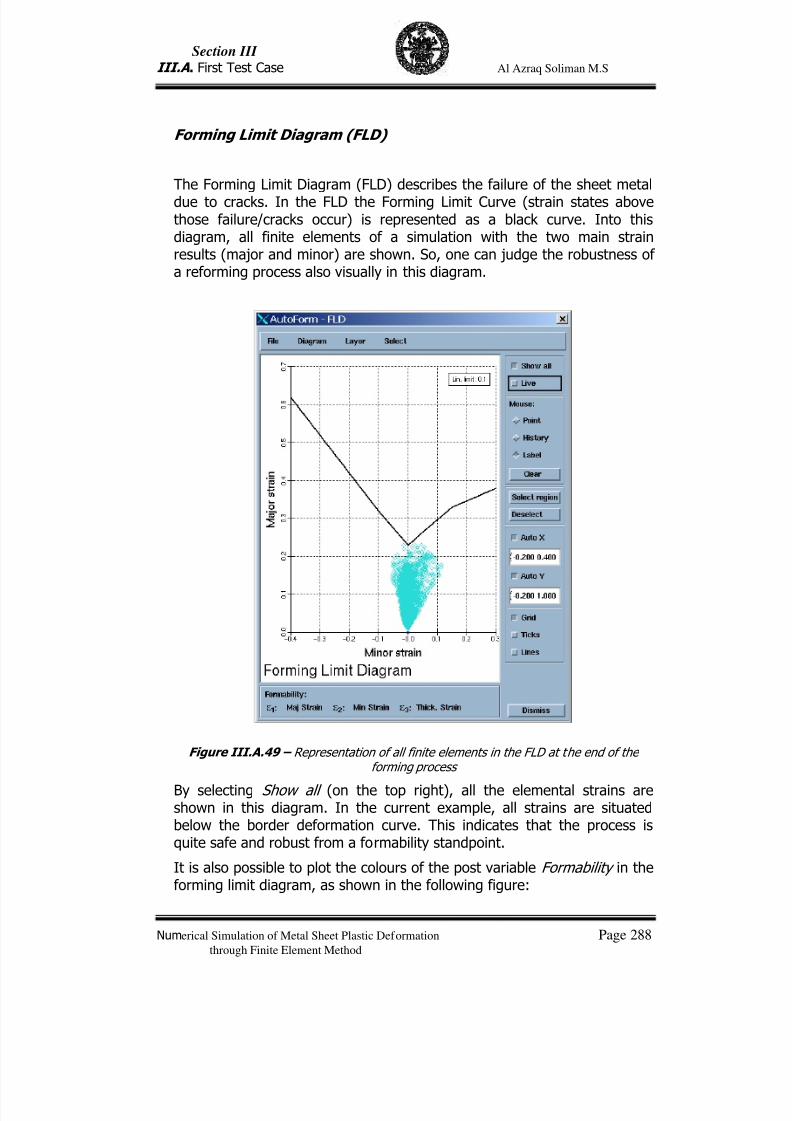
7/23/2019 Al Azraq Ingegneria Chimica Dei Materiali e Della Produzione
http://slidepdf.com/reader/full/al-azraq-ingegneria-chimica-dei-materiali-e-della-produzione 300/419
Section III
III.A . First Test Case Al Azraq Soliman M.S
Numerical Simulation of Metal Sheet Plastic Deformation Page 288through Finite Element Method
Forming Limit Diagram (FLD)
The Forming Limit Diagram (FLD) describes the failure of the sheet metal
due to cracks. In the FLD the Forming Limit Curve (strain states abovethose failure/cracks occur) is represented as a black curve. Into thisdiagram, all finite elements of a simulation with the two main strainresults (major and minor) are shown. So, one can judge the robustness ofa reforming process also visually in this diagram.
Figure III.A.49 – Representation of all finite elements in the FLD at the end of theforming process
By selecting Show all (on the top right), all the elemental strains areshown in this diagram. In the current example, all strains are situatedbelow the border deformation curve. This indicates that the process isquite safe and robust from a formability standpoint.
It is also possible to plot the colours of the post variable Formability in theforming limit diagram, as shown in the following figure:
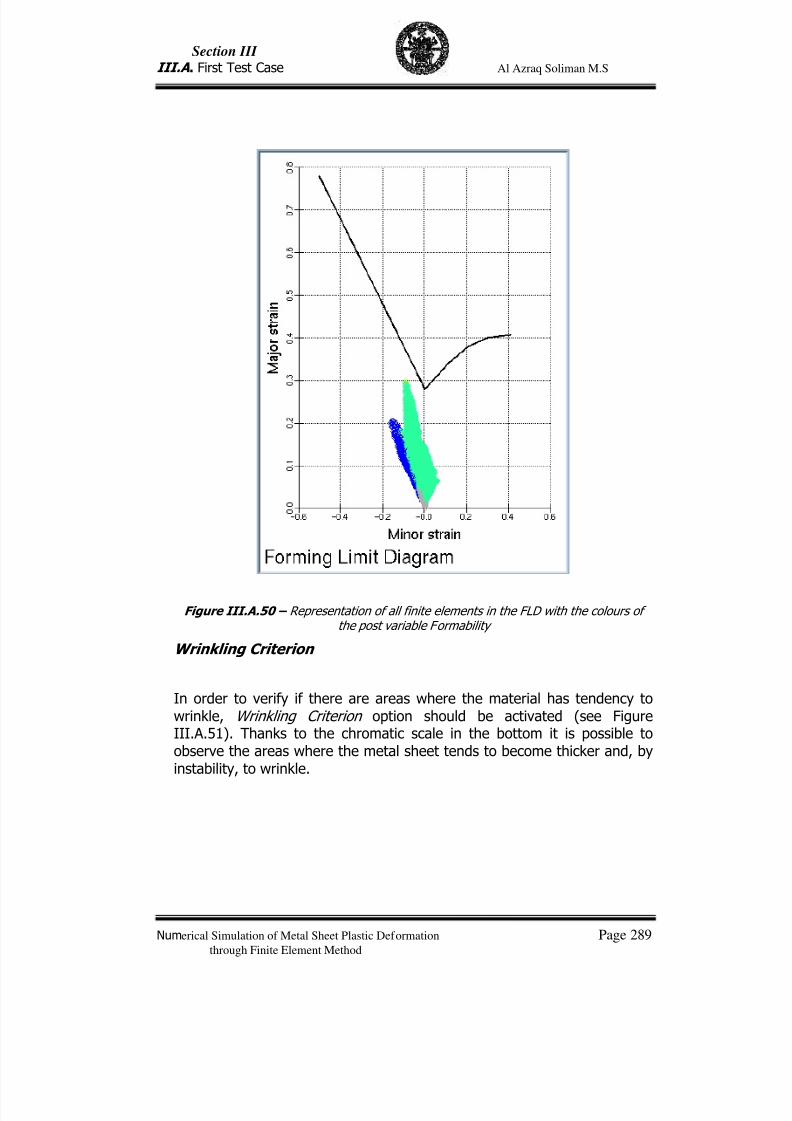
7/23/2019 Al Azraq Ingegneria Chimica Dei Materiali e Della Produzione
http://slidepdf.com/reader/full/al-azraq-ingegneria-chimica-dei-materiali-e-della-produzione 301/419
Section III
III.A . First Test Case Al Azraq Soliman M.S
Numerical Simulation of Metal Sheet Plastic Deformation Page 289through Finite Element Method
Figure III.A.50 – Representation of all finite elements in the FLD with the colours ofthe post variable Formability
Wrinkling Criterion
In order to verify if there are areas where the material has tendency towrinkle, Wrinkling Criterion option should be activated (see FigureIII.A.51). Thanks to the chromatic scale in the bottom it is possible toobserve the areas where the metal sheet tends to become thicker and, byinstability, to wrinkle.

7/23/2019 Al Azraq Ingegneria Chimica Dei Materiali e Della Produzione
http://slidepdf.com/reader/full/al-azraq-ingegneria-chimica-dei-materiali-e-della-produzione 302/419
Section III
III.A . First Test Case Al Azraq Soliman M.S
Numerical Simulation of Metal Sheet Plastic Deformation Page 290through Finite Element Method
Figure III.A.51 – Wrinkling criterion analysis of an automobile deck lid
Thickness / Strain evaluation
(thinning, thickness, plastic strain, major strain and minor strain)
Thinning
Another result variable that is often used is the percentage thinning ofthe material (Thinning ).
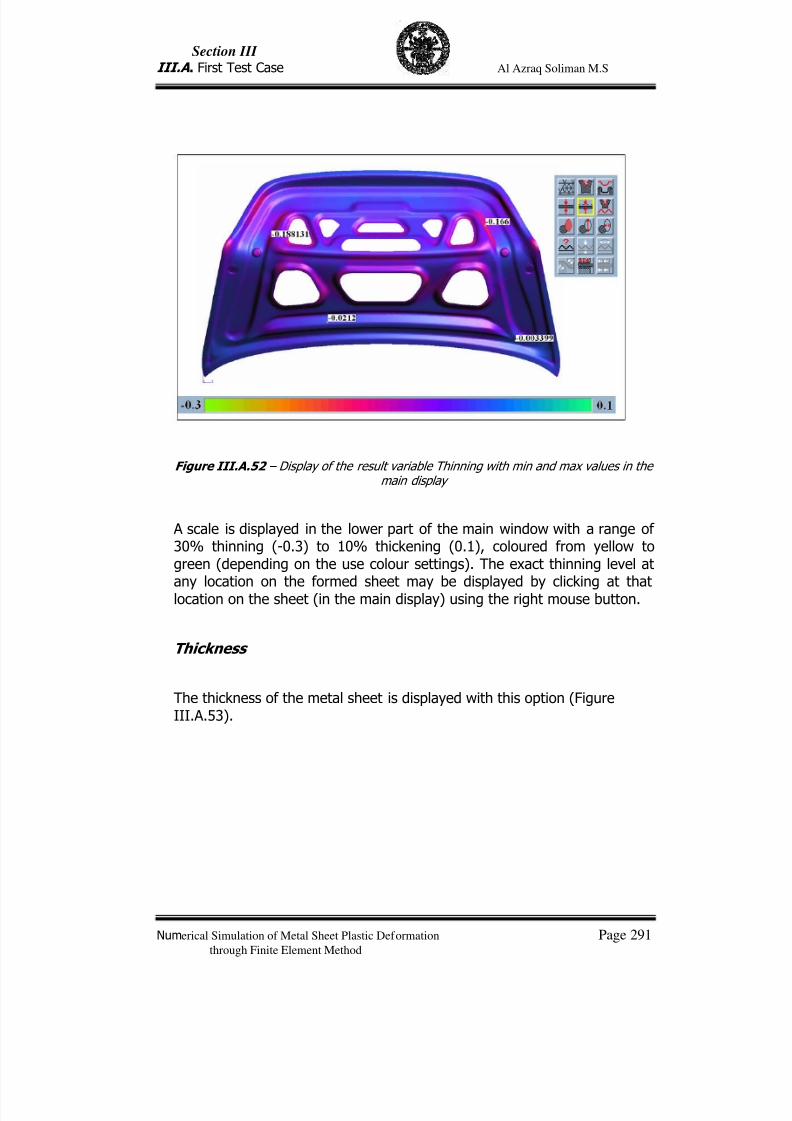
7/23/2019 Al Azraq Ingegneria Chimica Dei Materiali e Della Produzione
http://slidepdf.com/reader/full/al-azraq-ingegneria-chimica-dei-materiali-e-della-produzione 303/419
Section III
III.A . First Test Case Al Azraq Soliman M.S
Numerical Simulation of Metal Sheet Plastic Deformation Page 291through Finite Element Method
Figure III.A.52 – Display of the result variable Thinning with min and max values in themain display
A scale is displayed in the lower part of the main window with a range of30% thinning (-0.3) to 10% thickening (0.1), coloured from yellow togreen (depending on the use colour settings). The exact thinning level at
any location on the formed sheet may be displayed by clicking at thatlocation on the sheet (in the main display) using the right mouse button.
Thickness
The thickness of the metal sheet is displayed with this option (FigureIII.A.53).
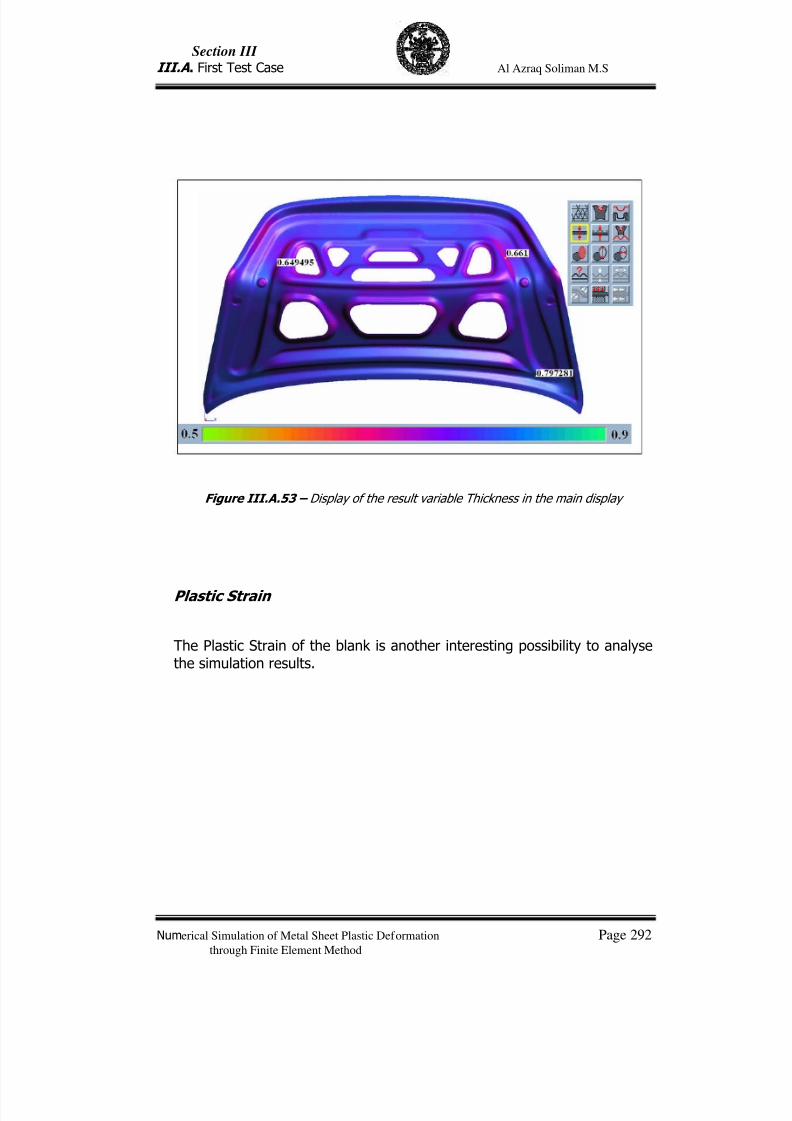
7/23/2019 Al Azraq Ingegneria Chimica Dei Materiali e Della Produzione
http://slidepdf.com/reader/full/al-azraq-ingegneria-chimica-dei-materiali-e-della-produzione 304/419
Section III
III.A . First Test Case Al Azraq Soliman M.S
Numerical Simulation of Metal Sheet Plastic Deformation Page 292through Finite Element Method
Figure III.A.53 – Display of the result variable Thickness in the main display
Plastic Strain
The Plastic Strain of the blank is another interesting possibility to analysethe simulation results.
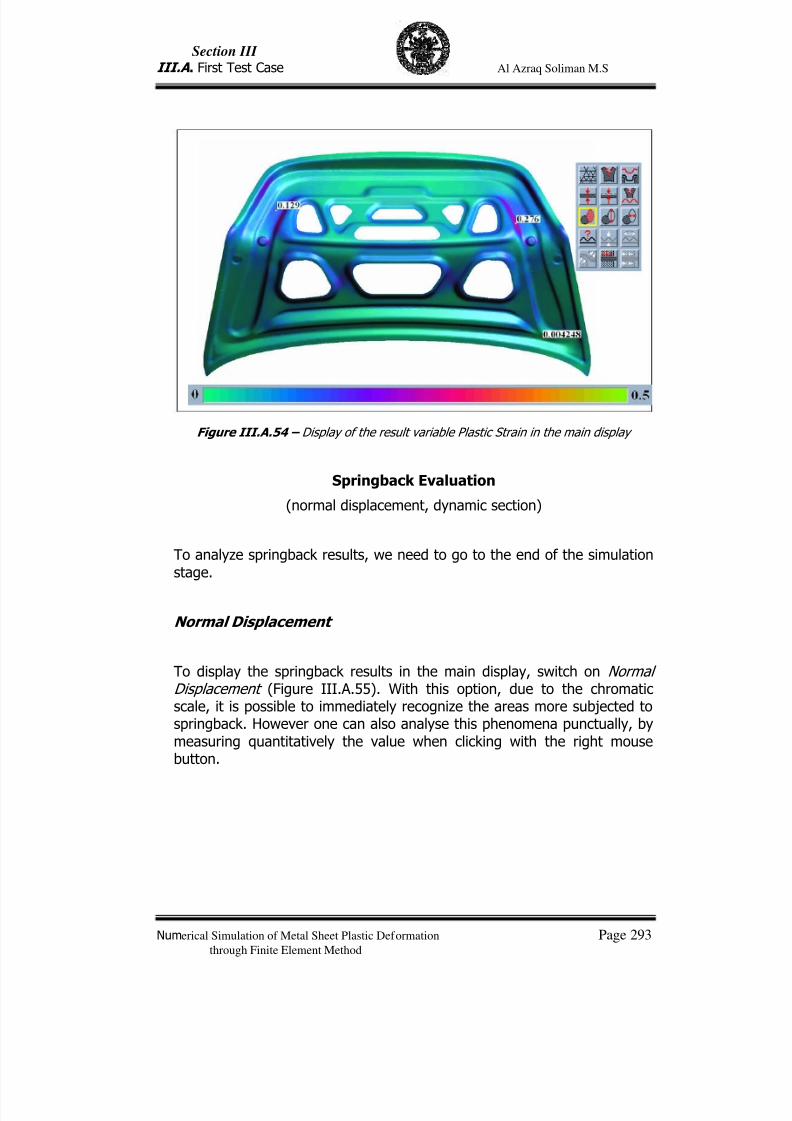
7/23/2019 Al Azraq Ingegneria Chimica Dei Materiali e Della Produzione
http://slidepdf.com/reader/full/al-azraq-ingegneria-chimica-dei-materiali-e-della-produzione 305/419
Section III
III.A . First Test Case Al Azraq Soliman M.S
Numerical Simulation of Metal Sheet Plastic Deformation Page 293through Finite Element Method
Figure III.A.54 – Display of the result variable Plastic Strain in the main display
Springback Evaluation
(normal displacement, dynamic section)
To analyze springback results, we need to go to the end of the simulationstage.
Normal Displacement
To display the springback results in the main display, switch on NormalDisplacement (Figure III.A.55). With this option, due to the chromaticscale, it is possible to immediately recognize the areas more subjected tospringback. However one can also analyse this phenomena punctually, bymeasuring quantitatively the value when clicking with the right mousebutton.
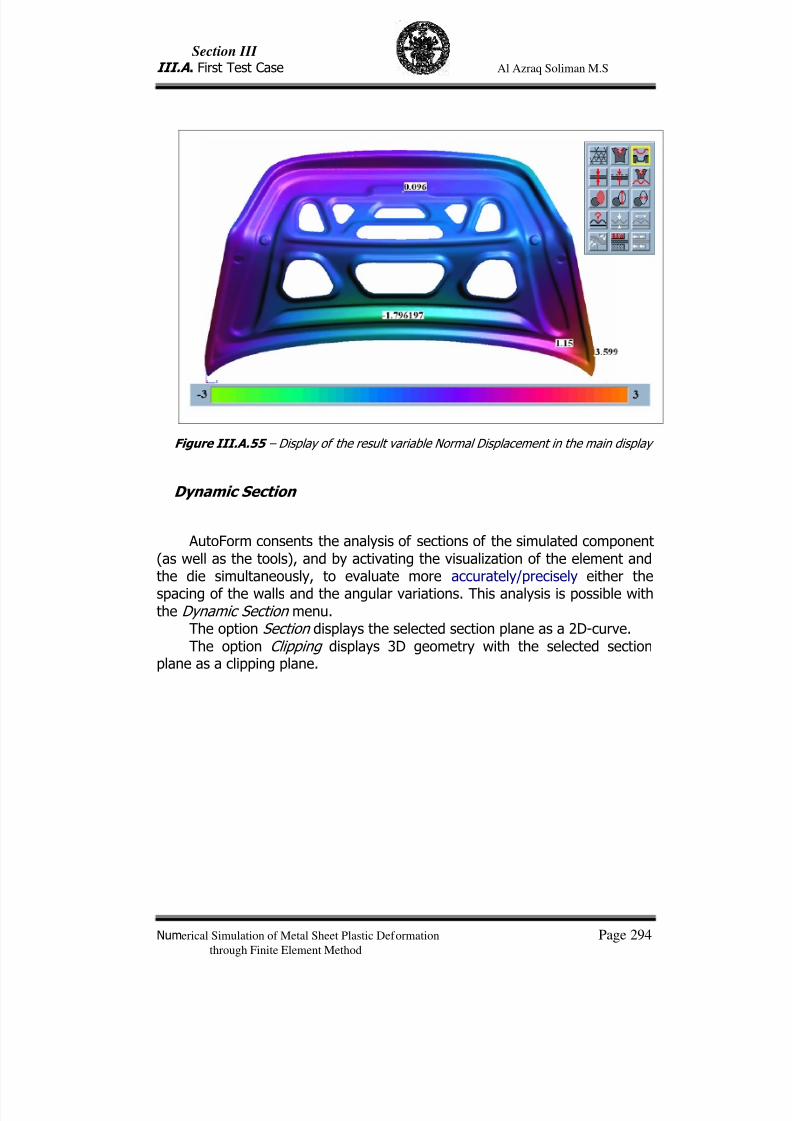
7/23/2019 Al Azraq Ingegneria Chimica Dei Materiali e Della Produzione
http://slidepdf.com/reader/full/al-azraq-ingegneria-chimica-dei-materiali-e-della-produzione 306/419
Section III
III.A . First Test Case Al Azraq Soliman M.S
Numerical Simulation of Metal Sheet Plastic Deformation Page 294through Finite Element Method
Figure III.A.55 – Display of the result variable Normal Displacement in the main display
Dynamic Section
AutoForm consents the analysis of sections of the simulated component(as well as the tools), and by activating the visualization of the element andthe die simultaneously, to evaluate more accurately/precisely either the
spacing of the walls and the angular variations. This analysis is possible withthe Dynamic Section menu.
The option Section displays the selected section plane as a 2D-curve.The option Clipping displays 3D geometry with the selected section
plane as a clipping plane.
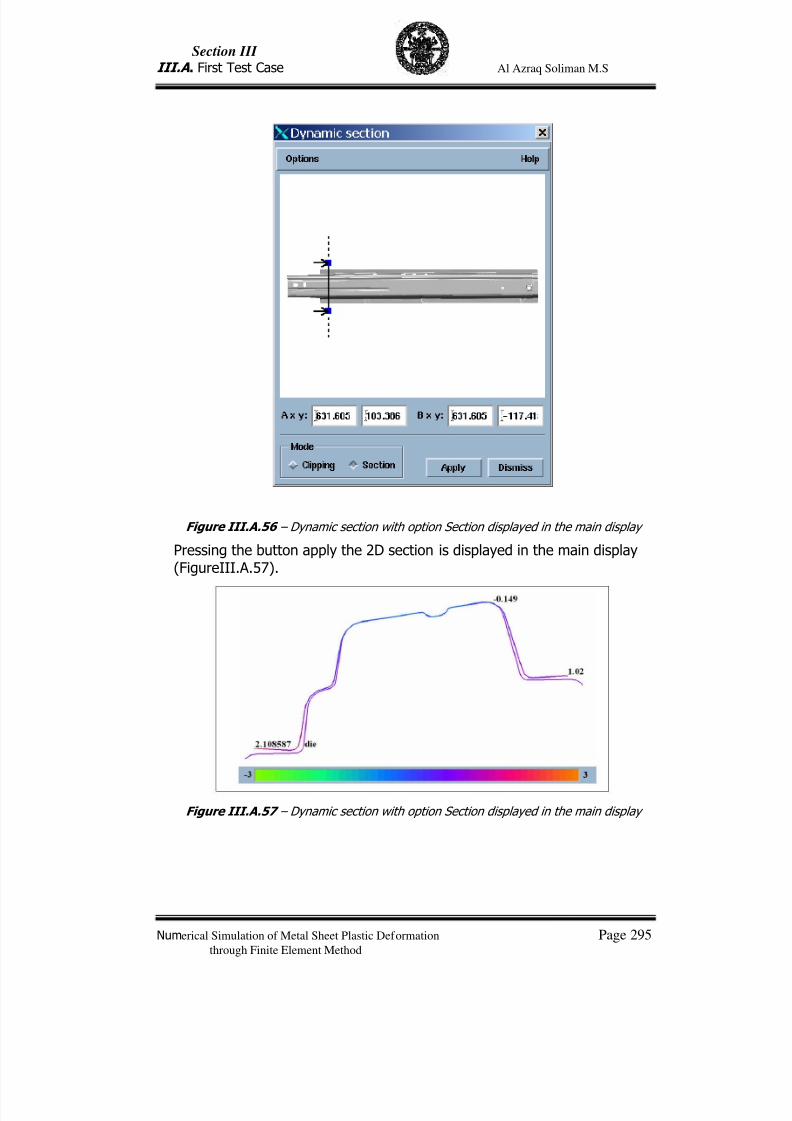
7/23/2019 Al Azraq Ingegneria Chimica Dei Materiali e Della Produzione
http://slidepdf.com/reader/full/al-azraq-ingegneria-chimica-dei-materiali-e-della-produzione 307/419
Section III
III.A . First Test Case Al Azraq Soliman M.S
Numerical Simulation of Metal Sheet Plastic Deformation Page 295through Finite Element Method
Figure III.A.56 – Dynamic section with option Section displayed in the main display
Pressing the button apply the 2D section is displayed in the main display(FigureIII.A.57).
Figure III.A.57 – Dynamic section with option Section displayed in the main display

7/23/2019 Al Azraq Ingegneria Chimica Dei Materiali e Della Produzione
http://slidepdf.com/reader/full/al-azraq-ingegneria-chimica-dei-materiali-e-della-produzione 308/419
Section III
III.A . First Test Case Al Azraq Soliman M.S
Numerical Simulation of Metal Sheet Plastic Deformation Page 296through Finite Element Method
III.A .5 Bibliography:
[1]
Schenk O and Hillmann M. Optimal design of metal forming die surfaceswith evolution strategies. Journal Computers&Structures, Volume 82,Issues 20-21 , August 2004, Pages 1695-1705.
[2] www.autoform.com
[3] AutoForm Workshop Manual
[4]
Kubli W and Reissner J. Optimization of Sheet-Metal Forming ProcessUsing the Special-Purpose Program AUTOFORM. Journal of MaterialsProcessing Technology, 50, 1995, pp. 292-305.
[5] Sester M. Implementation of the Selected Elastoplastic Models in AutoForm-Incremental. Workshop 3DS, Villetaneuse, June 2002.

7/23/2019 Al Azraq Ingegneria Chimica Dei Materiali e Della Produzione
http://slidepdf.com/reader/full/al-azraq-ingegneria-chimica-dei-materiali-e-della-produzione 309/419
Section III.B
The second test case is the forming simulation of an automobilecomponent
( lateral longeron of Fiat Stilo)
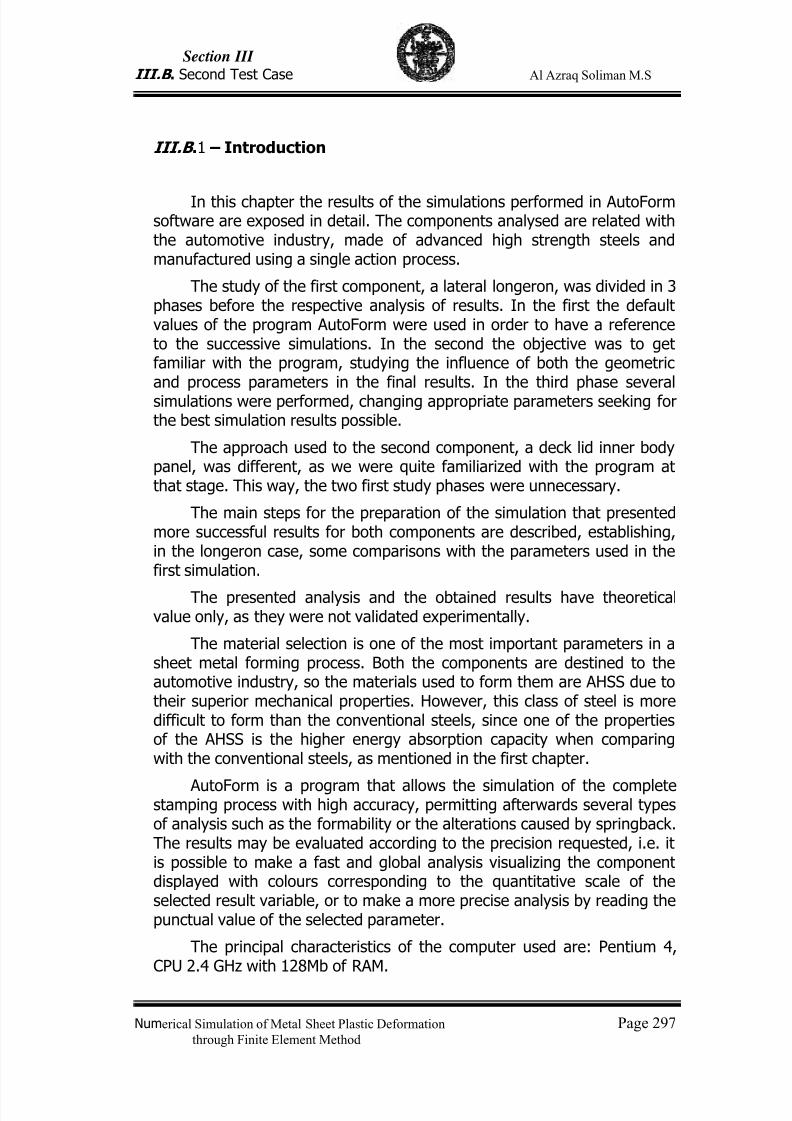
7/23/2019 Al Azraq Ingegneria Chimica Dei Materiali e Della Produzione
http://slidepdf.com/reader/full/al-azraq-ingegneria-chimica-dei-materiali-e-della-produzione 310/419
Section III
III.B . Second Test Case Al Azraq Soliman M.S
Numerical Simulation of Metal Sheet Plastic Deformation Page 297through Finite Element Method
III.B .1 – Introduction
In this chapter the results of the simulations performed in AutoFormsoftware are exposed in detail. The components analysed are related withthe automotive industry, made of advanced high strength steels andmanufactured using a single action process.
The study of the first component, a lateral longeron, was divided in 3phases before the respective analysis of results. In the first the defaultvalues of the program AutoForm were used in order to have a referenceto the successive simulations. In the second the objective was to getfamiliar with the program, studying the influence of both the geometricand process parameters in the final results. In the third phase severalsimulations were performed, changing appropriate parameters seeking forthe best simulation results possible.
The approach used to the second component, a deck lid inner bodypanel, was different, as we were quite familiarized with the program atthat stage. This way, the two first study phases were unnecessary.
The main steps for the preparation of the simulation that presentedmore successful results for both components are described, establishing,in the longeron case, some comparisons with the parameters used in thefirst simulation.
The presented analysis and the obtained results have theoreticalvalue only, as they were not validated experimentally.
The material selection is one of the most important parameters in asheet metal forming process. Both the components are destined to theautomotive industry, so the materials used to form them are AHSS due totheir superior mechanical properties. However, this class of steel is moredifficult to form than the conventional steels, since one of the propertiesof the AHSS is the higher energy absorption capacity when comparingwith the conventional steels, as mentioned in the first chapter.
AutoForm is a program that allows the simulation of the completestamping process with high accuracy, permitting afterwards several typesof analysis such as the formability or the alterations caused by springback.The results may be evaluated according to the precision requested, i.e. itis possible to make a fast and global analysis visualizing the componentdisplayed with colours corresponding to the quantitative scale of theselected result variable, or to make a more precise analysis by reading thepunctual value of the selected parameter.
The principal characteristics of the computer used are: Pentium 4,CPU 2.4 GHz with 128Mb of RAM.
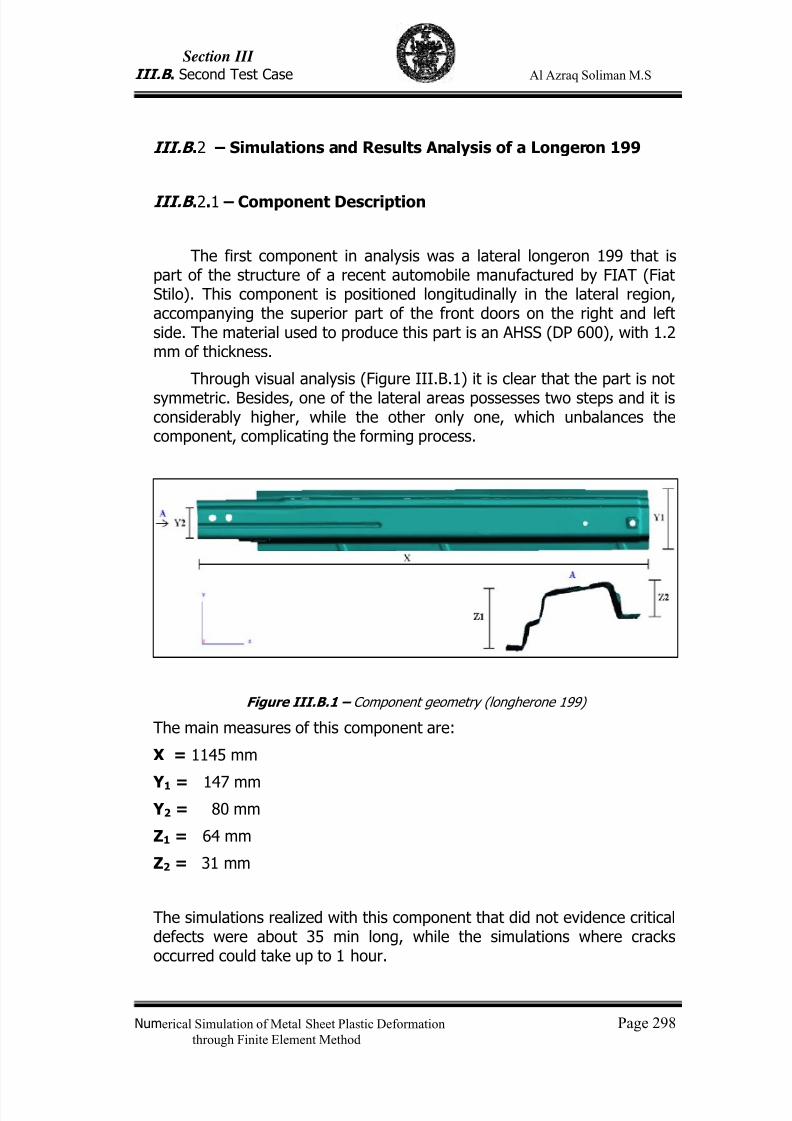
7/23/2019 Al Azraq Ingegneria Chimica Dei Materiali e Della Produzione
http://slidepdf.com/reader/full/al-azraq-ingegneria-chimica-dei-materiali-e-della-produzione 311/419
Section III
III.B . Second Test Case Al Azraq Soliman M.S
Numerical Simulation of Metal Sheet Plastic Deformation Page 298through Finite Element Method
III.B .2 – Simulations and Results Analysis of a Longeron 199
III.B .2.1 – Component Description
The first component in analysis was a lateral longeron 199 that ispart of the structure of a recent automobile manufactured by FIAT (FiatStilo). This component is positioned longitudinally in the lateral region,accompanying the superior part of the front doors on the right and leftside. The material used to produce this part is an AHSS (DP 600), with 1.2mm of thickness.
Through visual analysis (Figure III.B.1) it is clear that the part is not
symmetric. Besides, one of the lateral areas possesses two steps and it isconsiderably higher, while the other only one, which unbalances thecomponent, complicating the forming process.
Figure III.B.1 – Component geometry (longherone 199)
The main measures of this component are:
X = 1145 mm
Y 1 = 147 mm Y 2 = 80 mm
Z1 = 64 mm
Z2 = 31 mm
The simulations realized with this component that did not evidence criticaldefects were about 35 min long, while the simulations where cracksoccurred could take up to 1 hour.
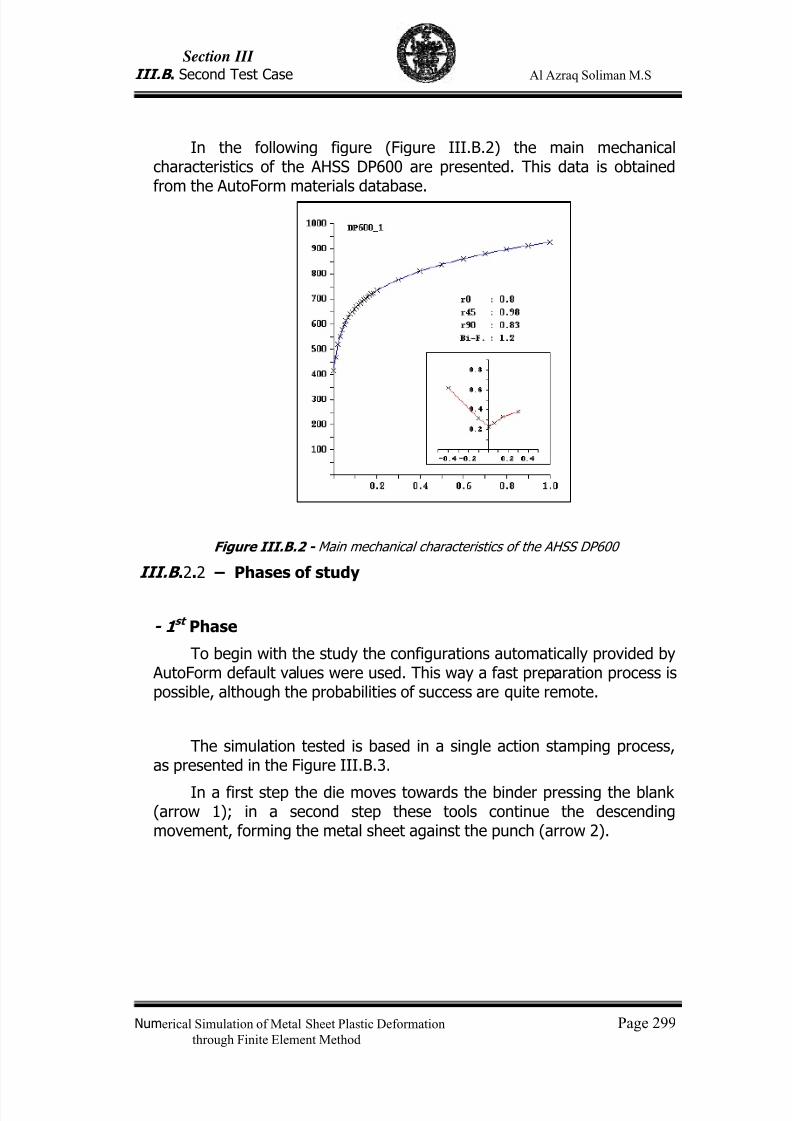
7/23/2019 Al Azraq Ingegneria Chimica Dei Materiali e Della Produzione
http://slidepdf.com/reader/full/al-azraq-ingegneria-chimica-dei-materiali-e-della-produzione 312/419
Section III
III.B . Second Test Case Al Azraq Soliman M.S
Numerical Simulation of Metal Sheet Plastic Deformation Page 299through Finite Element Method
In the following figure (Figure III.B.2) the main mechanicalcharacteristics of the AHSS DP600 are presented. This data is obtainedfrom the AutoForm materials database.
Figure III.B.2 - Main mechanical characteristics of the AHSS DP600
III.B .2.2 – Phases of study
- 1 st Phase
To begin with the study the configurations automatically provided by AutoForm default values were used. This way a fast preparation process ispossible, although the probabilities of success are quite remote.
The simulation tested is based in a single action stamping process,as presented in the Figure III.B.3.
In a first step the die moves towards the binder pressing the blank(arrow 1); in a second step these tools continue the descendingmovement, forming the metal sheet against the punch (arrow 2).
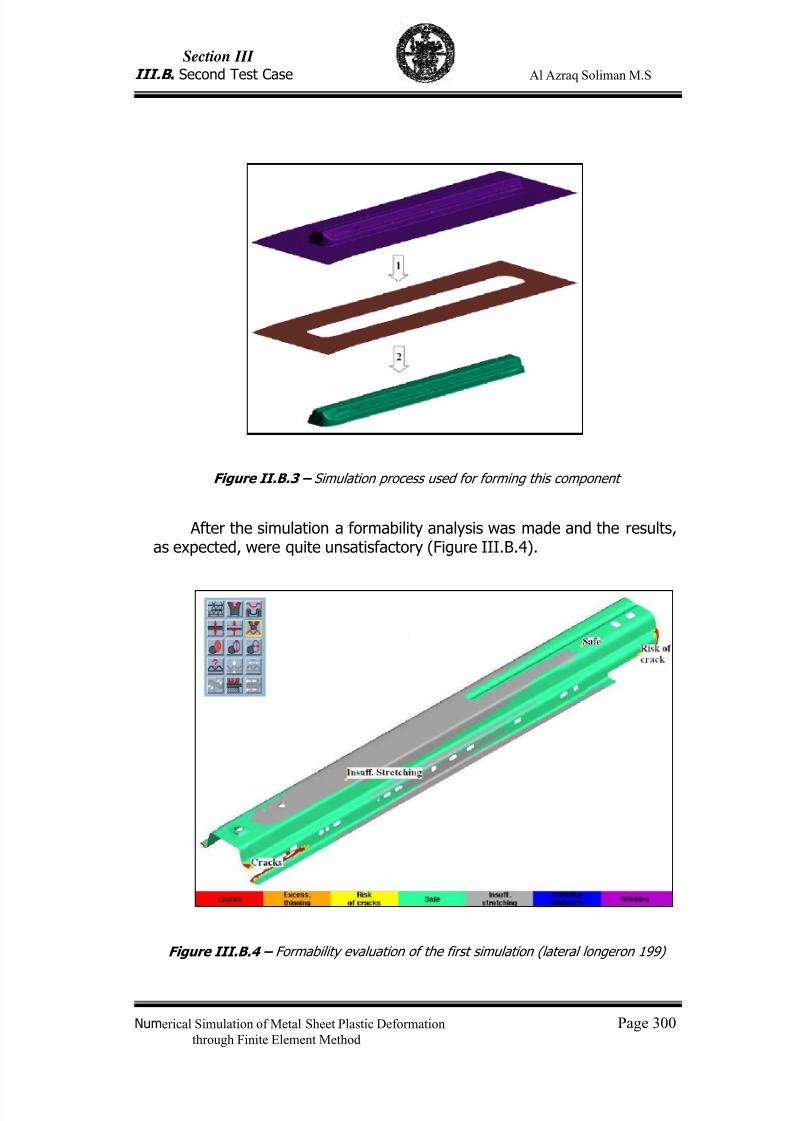
7/23/2019 Al Azraq Ingegneria Chimica Dei Materiali e Della Produzione
http://slidepdf.com/reader/full/al-azraq-ingegneria-chimica-dei-materiali-e-della-produzione 313/419
Section III
III.B . Second Test Case Al Azraq Soliman M.S
Numerical Simulation of Metal Sheet Plastic Deformation Page 300through Finite Element Method
Figure II.B.3 – Simulation process used for forming this component
After the simulation a formability analysis was made and the results,as expected, were quite unsatisfactory (Figure III.B.4).
Figure III.B.4 – Formability evaluation of the first simulation (lateral longeron 199)
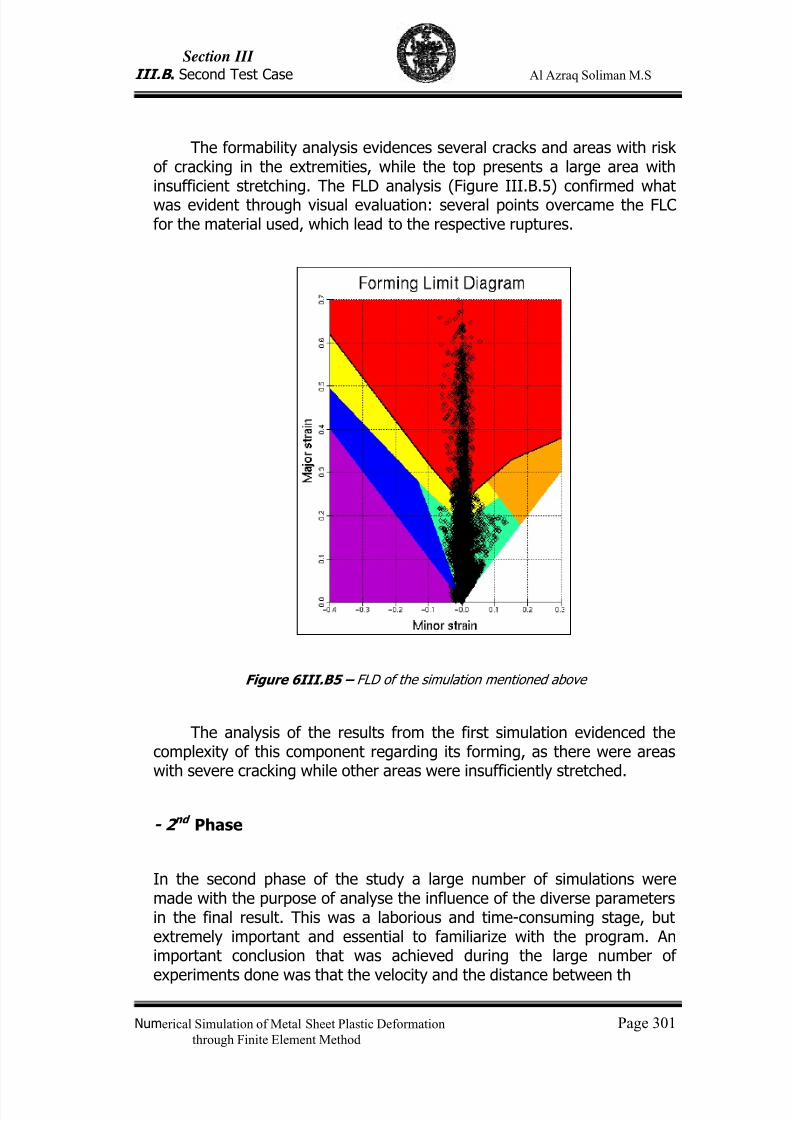
7/23/2019 Al Azraq Ingegneria Chimica Dei Materiali e Della Produzione
http://slidepdf.com/reader/full/al-azraq-ingegneria-chimica-dei-materiali-e-della-produzione 314/419
Section III
III.B . Second Test Case Al Azraq Soliman M.S
Numerical Simulation of Metal Sheet Plastic Deformation Page 301through Finite Element Method
The formability analysis evidences several cracks and areas with riskof cracking in the extremities, while the top presents a large area withinsufficient stretching. The FLD analysis (Figure III.B.5) confirmed whatwas evident through visual evaluation: several points overcame the FLCfor the material used, which lead to the respective ruptures.
Figure 6III.B5 – FLD of the simulation mentioned above
The analysis of the results from the first simulation evidenced thecomplexity of this component regarding its forming, as there were areaswith severe cracking while other areas were insufficiently stretched.
- 2 nd Phase
In the second phase of the study a large number of simulations weremade with the purpose of analyse the influence of the diverse parametersin the final result. This was a laborious and time-consuming stage, butextremely important and essential to familiarize with the program. Animportant conclusion that was achieved during the large number of
experiments done was that the velocity and the distance between th
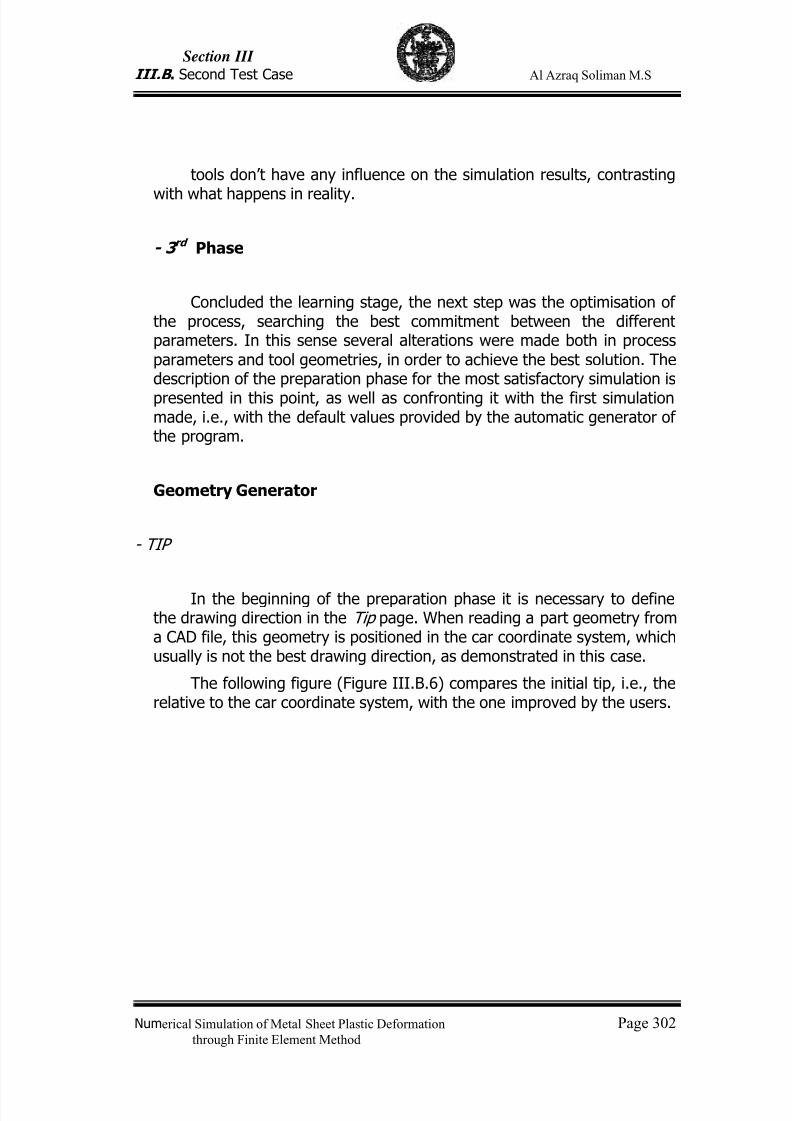
7/23/2019 Al Azraq Ingegneria Chimica Dei Materiali e Della Produzione
http://slidepdf.com/reader/full/al-azraq-ingegneria-chimica-dei-materiali-e-della-produzione 315/419
Section III
III.B . Second Test Case Al Azraq Soliman M.S
Numerical Simulation of Metal Sheet Plastic Deformation Page 302through Finite Element Method
tools don’t have any influence on the simulation results, contrasting
with what happens in reality.
- 3 rd Phase
Concluded the learning stage, the next step was the optimisation ofthe process, searching the best commitment between the differentparameters. In this sense several alterations were made both in processparameters and tool geometries, in order to achieve the best solution. Thedescription of the preparation phase for the most satisfactory simulation is
presented in this point, as well as confronting it with the first simulationmade, i.e., with the default values provided by the automatic generator ofthe program.
Geometry Generator
- TIP
In the beginning of the preparation phase it is necessary to definethe drawing direction in the Tip page. When reading a part geometry froma CAD file, this geometry is positioned in the car coordinate system, whichusually is not the best drawing direction, as demonstrated in this case.
The following figure (Figure III.B.6) compares the initial tip, i.e., therelative to the car coordinate system, with the one improved by the users.
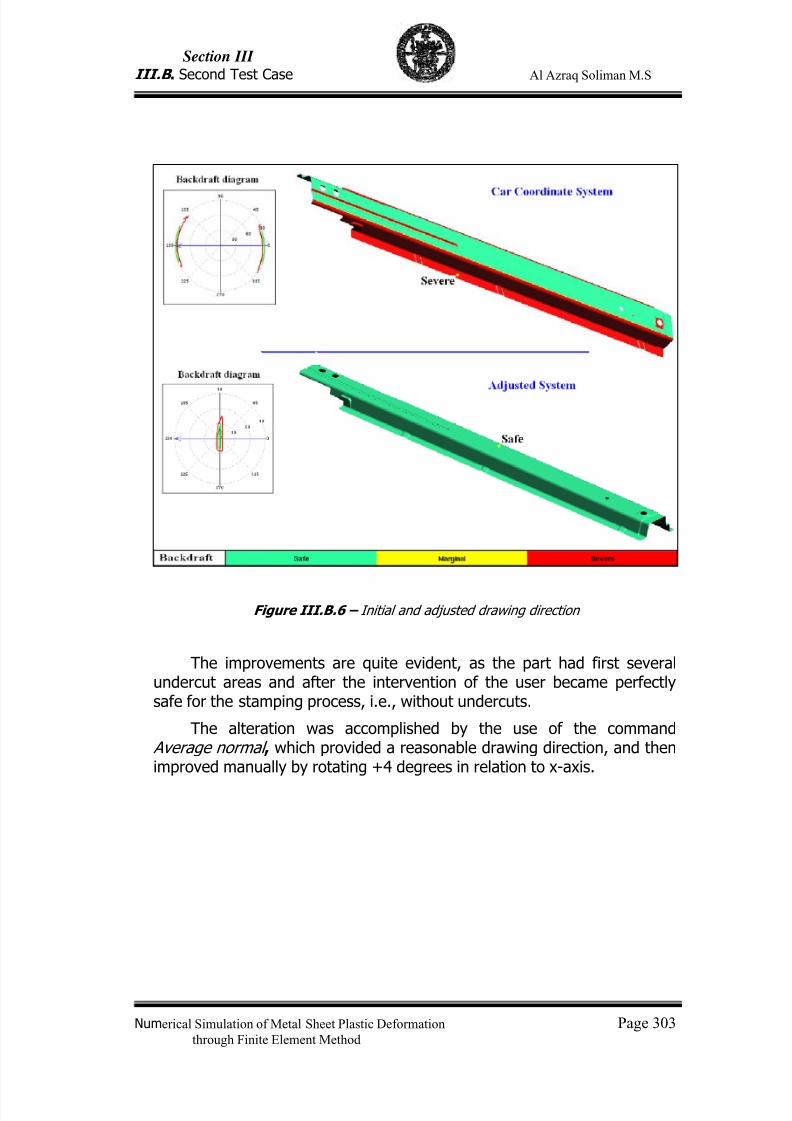
7/23/2019 Al Azraq Ingegneria Chimica Dei Materiali e Della Produzione
http://slidepdf.com/reader/full/al-azraq-ingegneria-chimica-dei-materiali-e-della-produzione 316/419
Section III
III.B . Second Test Case Al Azraq Soliman M.S
Numerical Simulation of Metal Sheet Plastic Deformation Page 303through Finite Element Method
Figure III.B.6 – Initial and adjusted drawing direction
The improvements are quite evident, as the part had first severalundercut areas and after the intervention of the user became perfectlysafe for the stamping process, i.e., without undercuts.
The alteration was accomplished by the use of the command Average normal , which provided a reasonable drawing direction, and thenimproved manually by rotating +4 degrees in relation to x-axis.
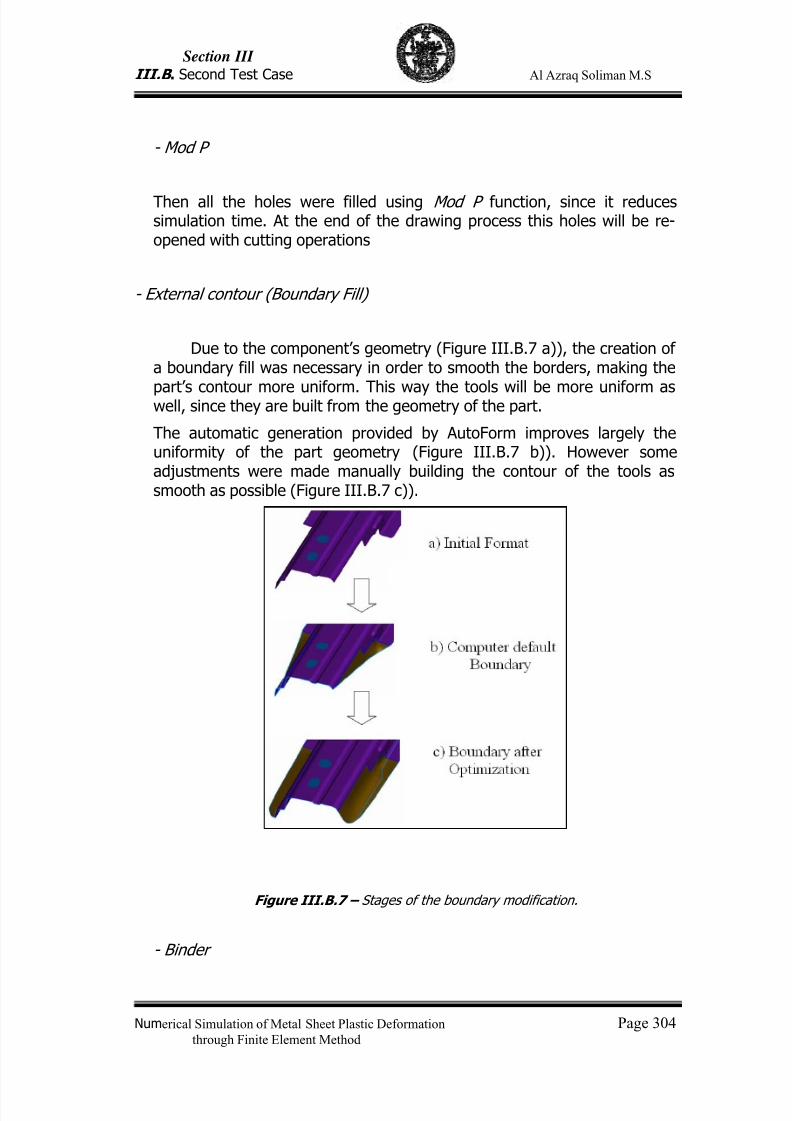
7/23/2019 Al Azraq Ingegneria Chimica Dei Materiali e Della Produzione
http://slidepdf.com/reader/full/al-azraq-ingegneria-chimica-dei-materiali-e-della-produzione 317/419
Section III
III.B . Second Test Case Al Azraq Soliman M.S
Numerical Simulation of Metal Sheet Plastic Deformation Page 304through Finite Element Method
- Mod P
Then all the holes were filled using Mod P function, since it reducessimulation time. At the end of the drawing process this holes will be re-opened with cutting operations
- External contour (Boundary Fill)
Due to the component’s geometry (Figure III.B.7 a)), the creation ofa boundary fill was necessary in order to smooth the borders, making the
part’s contour more uniform. This way the tools will be more uniform aswell, since they are built from the geometry of the part.
The automatic generation provided by AutoForm improves largely theuniformity of the part geometry (Figure III.B.7 b)). However someadjustments were made manually building the contour of the tools assmooth as possible (Figure III.B.7 c)).
Figure III.B.7 – Stages of the boundary modification.
- Binder
7/23/2019 Al Azraq Ingegneria Chimica Dei Materiali e Della Produzione
http://slidepdf.com/reader/full/al-azraq-ingegneria-chimica-dei-materiali-e-della-produzione 318/419
Section III
III.B . Second Test Case Al Azraq Soliman M.S
Numerical Simulation of Metal Sheet Plastic Deformation Page 305through Finite Element Method
Initially a binder automatically generated by the software was used,but the results produced were not satisfactory. Therefore, the bindergenerated with Auto-Binder was improved by the addition of profiles withthe Manual-Binder module, in order to provide a draw depth as uniform aspossible.
The following figure (Figure III.B.8) represents the comparisonbetween the binder generated automatically and the one optimisedmanually. By analysing the figure, one can easily verify that the manuallyoptimised binder has larger probabilities of success.
Figure III.B.8 – Binder optimization
- Addendum
An ordinary drawing tool consists of the part geometry, the bindersurface and an addendum. In forming processes, the addendum ingeneral performs the task to make a suitable transition from the part tothe binder, ensuring a good material flow.
This was undoubtedly the parameter that suffered more changesduring all the simulations performed. Initially an addendum automaticallygenerated by the software was used (Figure III.B.9 a)), but due to itsunsmooth geometry the material suffered rupture in several areas(illustrated in Figure 6.4). Afterwards the profiles (Figure 6.10) and theirrespective orientations were modified (Figure 6.11)) in way to create atool with a smoother geometry, that allows an easier material flow (FigureIII.B.9b)).
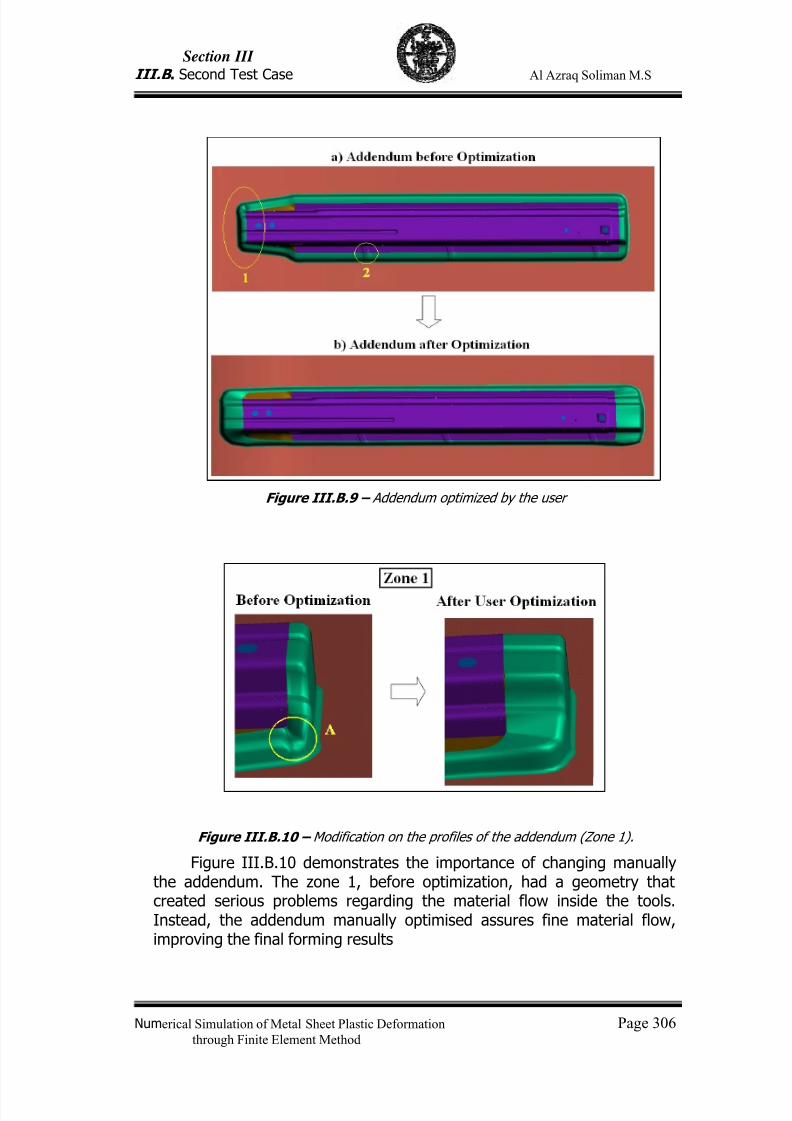
7/23/2019 Al Azraq Ingegneria Chimica Dei Materiali e Della Produzione
http://slidepdf.com/reader/full/al-azraq-ingegneria-chimica-dei-materiali-e-della-produzione 319/419
Section III
III.B . Second Test Case Al Azraq Soliman M.S
Numerical Simulation of Metal Sheet Plastic Deformation Page 306through Finite Element Method
Figure III.B.9 – Addendum optimized by the user
Figure III.B.10 – Modification on the profiles of the addendum (Zone 1).
Figure III.B.10 demonstrates the importance of changing manuallythe addendum. The zone 1, before optimization, had a geometry thatcreated serious problems regarding the material flow inside the tools.Instead, the addendum manually optimised assures fine material flow,improving the final forming results
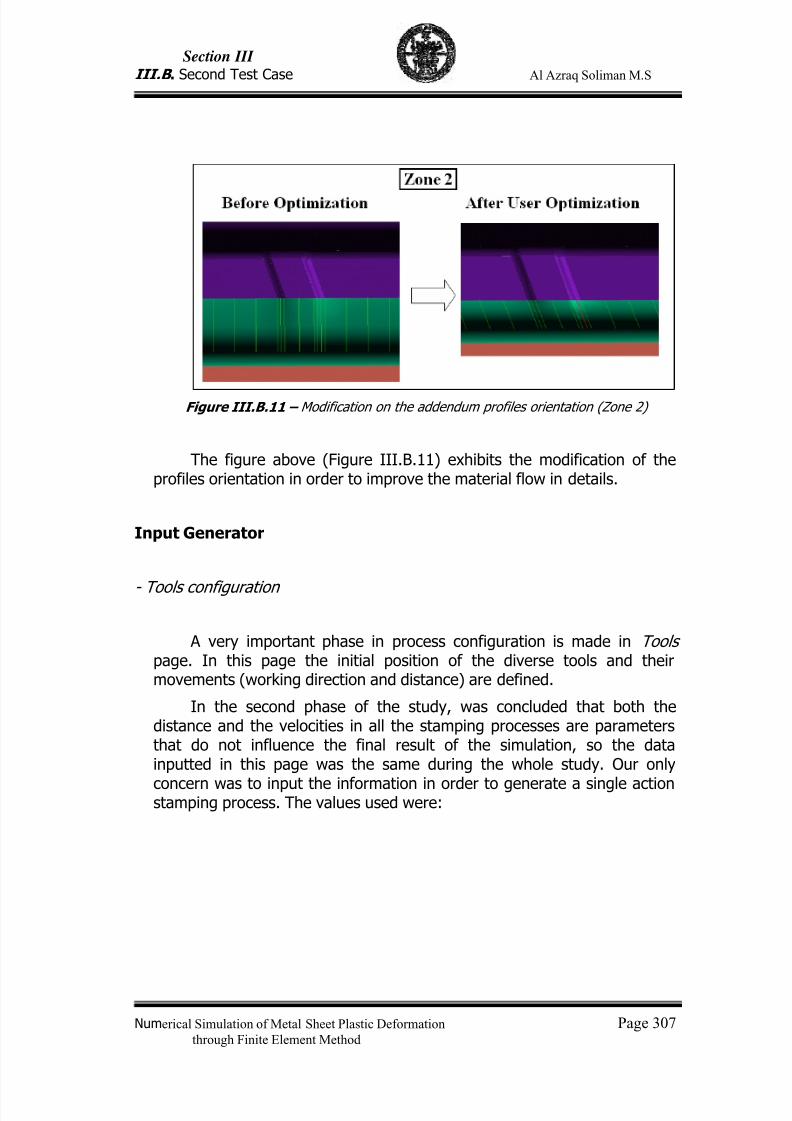
7/23/2019 Al Azraq Ingegneria Chimica Dei Materiali e Della Produzione
http://slidepdf.com/reader/full/al-azraq-ingegneria-chimica-dei-materiali-e-della-produzione 320/419
Section III
III.B . Second Test Case Al Azraq Soliman M.S
Numerical Simulation of Metal Sheet Plastic Deformation Page 307through Finite Element Method
Figure III.B.11 – Modification on the addendum profiles orientation (Zone 2)
The figure above (Figure III.B.11) exhibits the modification of theprofiles orientation in order to improve the material flow in details.
Input Generator
- Tools configuration
A very important phase in process configuration is made in Toolspage. In this page the initial position of the diverse tools and theirmovements (working direction and distance) are defined.
In the second phase of the study, was concluded that both thedistance and the velocities in all the stamping processes are parametersthat do not influence the final result of the simulation, so the datainputted in this page was the same during the whole study. Our only
concern was to input the information in order to generate a single actionstamping process. The values used were:
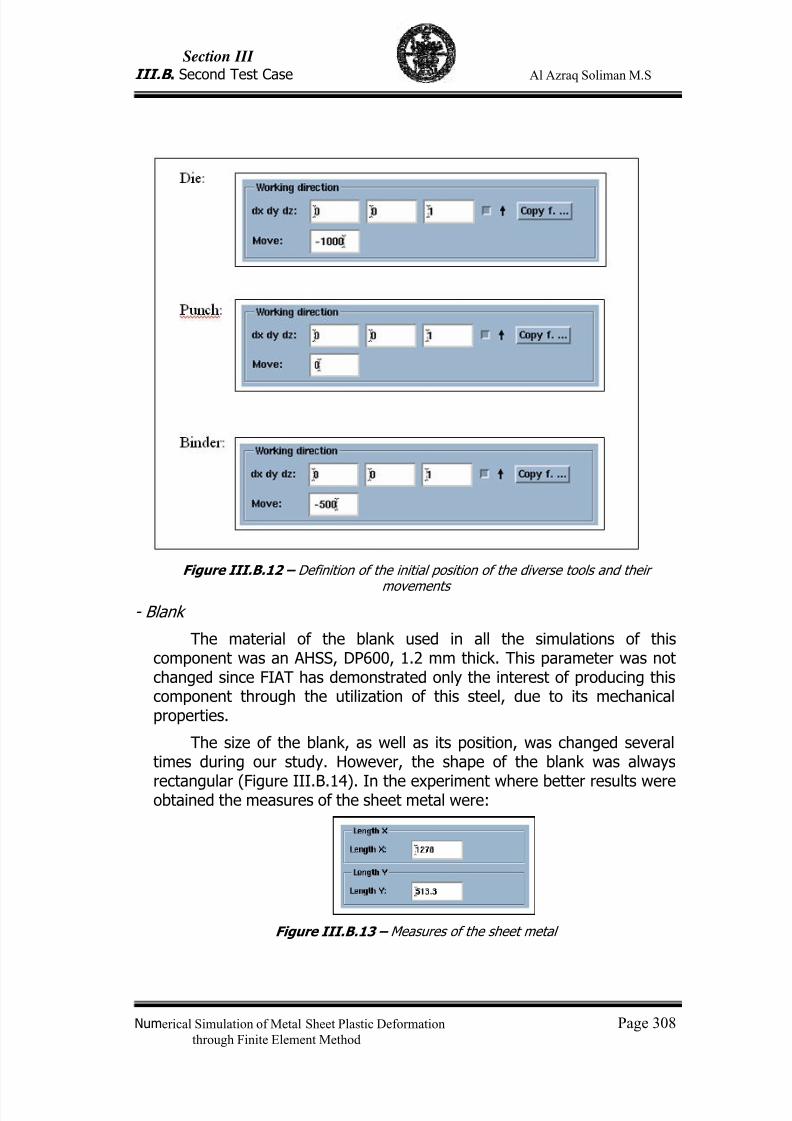
7/23/2019 Al Azraq Ingegneria Chimica Dei Materiali e Della Produzione
http://slidepdf.com/reader/full/al-azraq-ingegneria-chimica-dei-materiali-e-della-produzione 321/419
Section III
III.B . Second Test Case Al Azraq Soliman M.S
Numerical Simulation of Metal Sheet Plastic Deformation Page 308through Finite Element Method
Figure III.B.12 – Definition of the initial position of the diverse tools and their
movements
- Blank
The material of the blank used in all the simulations of thiscomponent was an AHSS, DP600, 1.2 mm thick. This parameter was notchanged since FIAT has demonstrated only the interest of producing thiscomponent through the utilization of this steel, due to its mechanicalproperties.
The size of the blank, as well as its position, was changed severaltimes during our study. However, the shape of the blank was always
rectangular (Figure III.B.14). In the experiment where better results wereobtained the measures of the sheet metal were:
Figure III.B.13 – Measures of the sheet metal
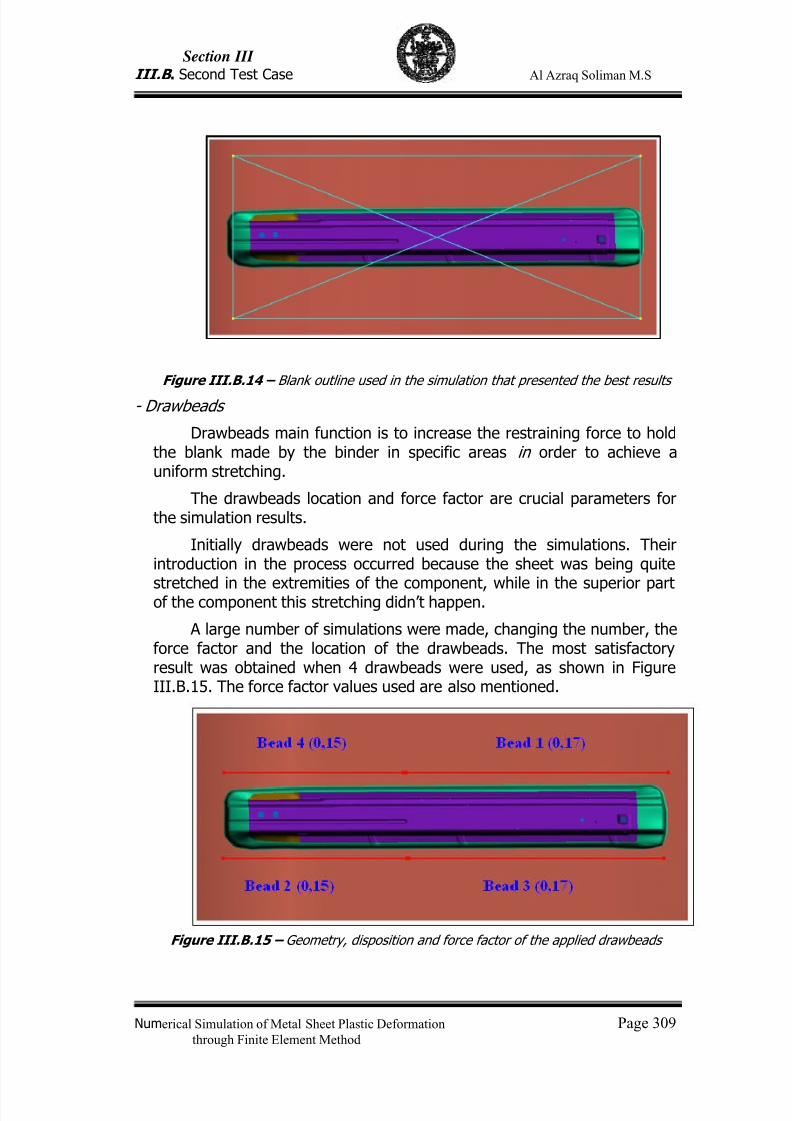
7/23/2019 Al Azraq Ingegneria Chimica Dei Materiali e Della Produzione
http://slidepdf.com/reader/full/al-azraq-ingegneria-chimica-dei-materiali-e-della-produzione 322/419
Section III
III.B . Second Test Case Al Azraq Soliman M.S
Numerical Simulation of Metal Sheet Plastic Deformation Page 309through Finite Element Method
Figure III.B.14 – Blank outline used in the simulation that presented the best results
- Drawbeads
Drawbeads main function is to increase the restraining force to holdthe blank made by the binder in specific areas in order to achieve auniform stretching.
The drawbeads location and force factor are crucial parameters forthe simulation results.
Initially drawbeads were not used during the simulations. Theirintroduction in the process occurred because the sheet was being quite
stretched in the extremities of the component, while in the superior partof the component this stretching didn’t happen.
A large number of simulations were made, changing the number, theforce factor and the location of the drawbeads. The most satisfactoryresult was obtained when 4 drawbeads were used, as shown in FigureIII.B.15. The force factor values used are also mentioned.
Figure III.B.15 – Geometry, disposition and force factor of the applied drawbeads
7/23/2019 Al Azraq Ingegneria Chimica Dei Materiali e Della Produzione
http://slidepdf.com/reader/full/al-azraq-ingegneria-chimica-dei-materiali-e-della-produzione 323/419
Section III
III.B . Second Test Case Al Azraq Soliman M.S
Numerical Simulation of Metal Sheet Plastic Deformation Page 310through Finite Element Method
- Lube
The lubrication values weren’t subjected to great changes, as both theFIAT representatives and the software manual recommended theutilization of values in the order of 0.15 for this type of steels. Though,
lubrication values between 0.09 and 0.20 were tested, withoutproducing however very satisfactory results.
- Process
During the several simulations made to find the process with thebest results in the stamping of this car body part the process steps to beperformed were always the same. The only parameter that changed wasthe value of the force to press the blank between the die and binder. Thisparameter varied between 0.6e+06 and 2.0e+06 and the best result wasachieved with 1.2e+06.
The process steps to be executed in order to stamp this componentare: Gravity, Closing, Drawing, several Cuttings (the trimming cut to
release the part from the rest of the blank and to make all the holes) andfinally Springback calculation.

7/23/2019 Al Azraq Ingegneria Chimica Dei Materiali e Della Produzione
http://slidepdf.com/reader/full/al-azraq-ingegneria-chimica-dei-materiali-e-della-produzione 324/419
Section III
III.B . Second Test Case Al Azraq Soliman M.S
Numerical Simulation of Metal Sheet Plastic Deformation Page 311through Finite Element Method
Figure III.B.16 – Definition of the forming process steps
III.B .2.3 – Results Evaluation
The simulation that provided the best results will be analyzed indetail and through several aspects. The results analysis was divided inthree main fields: Forming, Thickness/Strain evaluation and Springback.Special attention was given to formability and springback analysis.
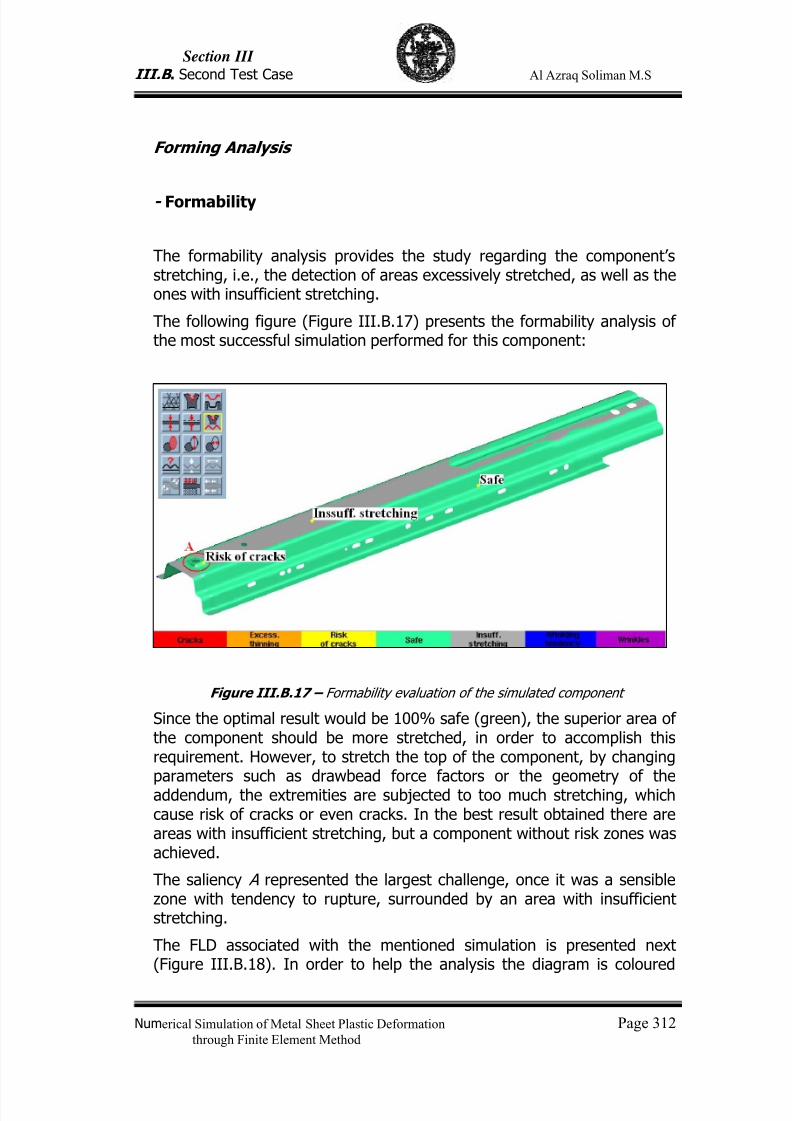
7/23/2019 Al Azraq Ingegneria Chimica Dei Materiali e Della Produzione
http://slidepdf.com/reader/full/al-azraq-ingegneria-chimica-dei-materiali-e-della-produzione 325/419
Section III
III.B . Second Test Case Al Azraq Soliman M.S
Numerical Simulation of Metal Sheet Plastic Deformation Page 312through Finite Element Method
Forming Analysis
- Formability
The formability analysis provides the study regarding the component’sstretching, i.e., the detection of areas excessively stretched, as well as theones with insufficient stretching.
The following figure (Figure III.B.17) presents the formability analysis ofthe most successful simulation performed for this component:
Figure III.B.17 – Formability evaluation of the simulated component
Since the optimal result would be 100% safe (green), the superior area ofthe component should be more stretched, in order to accomplish thisrequirement. However, to stretch the top of the component, by changingparameters such as drawbead force factors or the geometry of theaddendum, the extremities are subjected to too much stretching, whichcause risk of cracks or even cracks. In the best result obtained there areareas with insufficient stretching, but a component without risk zones wasachieved.
The saliency A represented the largest challenge, once it was a sensiblezone with tendency to rupture, surrounded by an area with insufficientstretching.
The FLD associated with the mentioned simulation is presented next(Figure III.B.18). In order to help the analysis the diagram is coloured
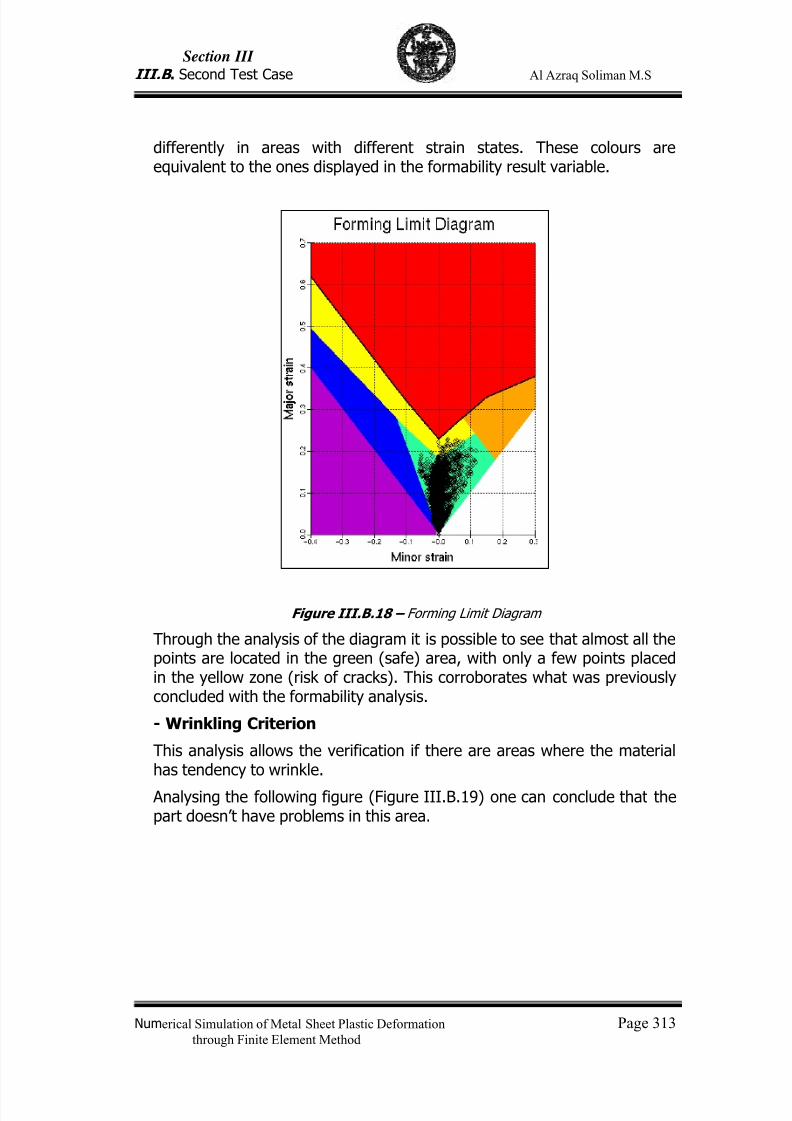
7/23/2019 Al Azraq Ingegneria Chimica Dei Materiali e Della Produzione
http://slidepdf.com/reader/full/al-azraq-ingegneria-chimica-dei-materiali-e-della-produzione 326/419
Section III
III.B . Second Test Case Al Azraq Soliman M.S
Numerical Simulation of Metal Sheet Plastic Deformation Page 313through Finite Element Method
differently in areas with different strain states. These colours areequivalent to the ones displayed in the formability result variable.
Figure III.B.18 – Forming Limit Diagram
Through the analysis of the diagram it is possible to see that almost all thepoints are located in the green (safe) area, with only a few points placedin the yellow zone (risk of cracks). This corroborates what was previouslyconcluded with the formability analysis.
- Wrinkling Criterion
This analysis allows the verification if there are areas where the materialhas tendency to wrinkle.
Analysing the following figure (Figure III.B.19) one can conclude that thepart doesn’t have problems in this area.
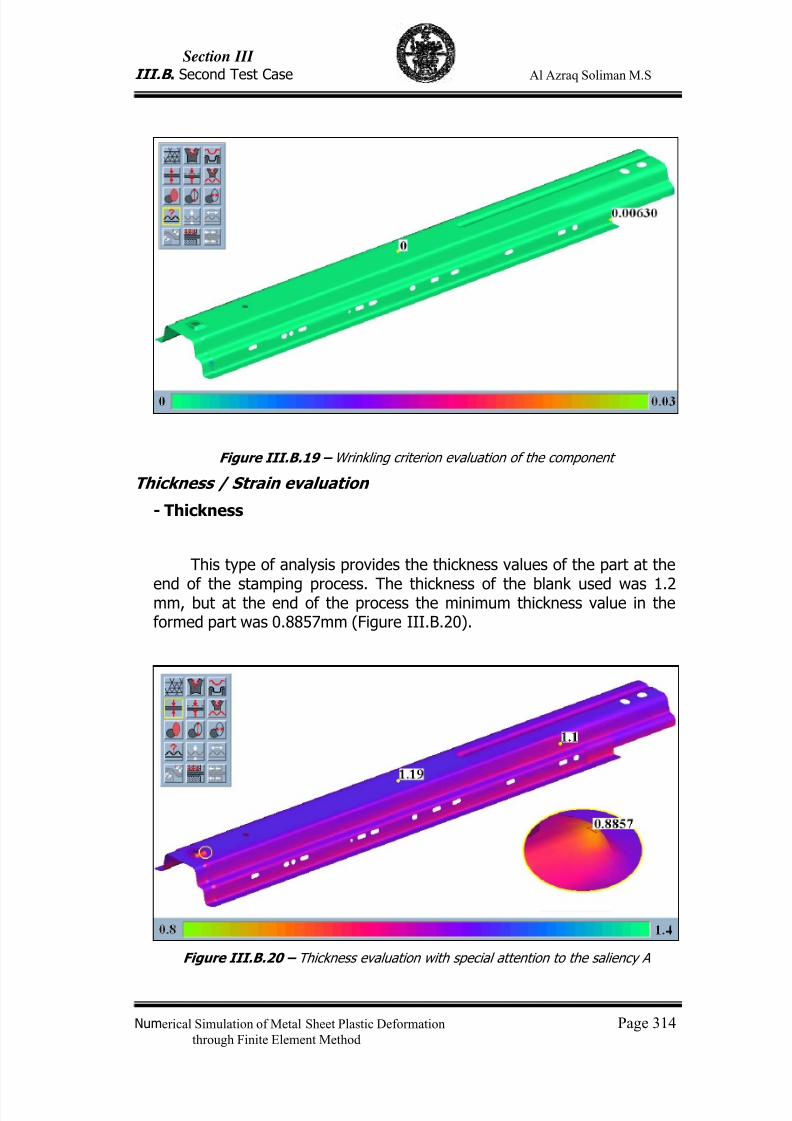
7/23/2019 Al Azraq Ingegneria Chimica Dei Materiali e Della Produzione
http://slidepdf.com/reader/full/al-azraq-ingegneria-chimica-dei-materiali-e-della-produzione 327/419
Section III
III.B . Second Test Case Al Azraq Soliman M.S
Numerical Simulation of Metal Sheet Plastic Deformation Page 314through Finite Element Method
Figure III.B.19 – Wrinkling criterion evaluation of the component
Thickness / Strain evaluation
- Thickness
This type of analysis provides the thickness values of the part at the
end of the stamping process. The thickness of the blank used was 1.2mm, but at the end of the process the minimum thickness value in theformed part was 0.8857mm (Figure III.B.20).
Figure III.B.20 – Thickness evaluation with special attention to the saliency A
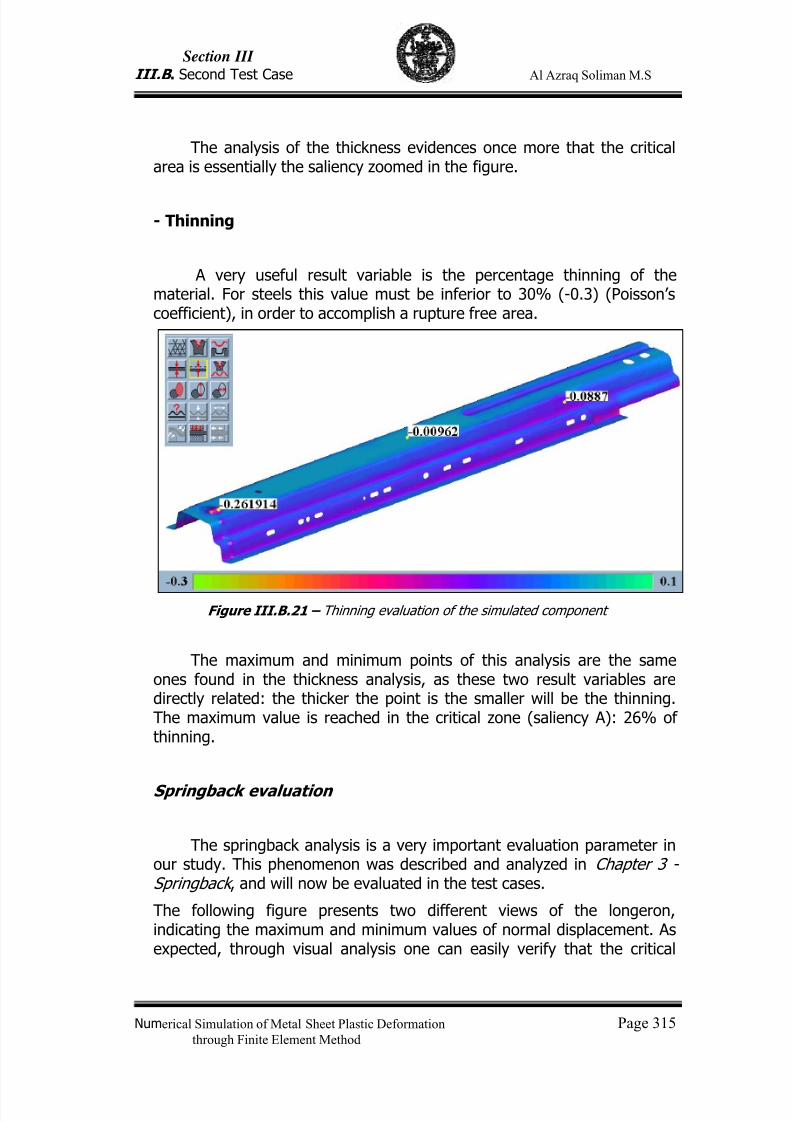
7/23/2019 Al Azraq Ingegneria Chimica Dei Materiali e Della Produzione
http://slidepdf.com/reader/full/al-azraq-ingegneria-chimica-dei-materiali-e-della-produzione 328/419
Section III
III.B . Second Test Case Al Azraq Soliman M.S
Numerical Simulation of Metal Sheet Plastic Deformation Page 315through Finite Element Method
The analysis of the thickness evidences once more that the criticalarea is essentially the saliency zoomed in the figure.
- Thinning
A very useful result variable is the percentage thinning of thematerial. For steels this value must be inferior to 30% (-0.3) (Poisson’scoefficient), in order to accomplish a rupture free area.
Figure III.B.21 – Thinning evaluation of the simulated component
The maximum and minimum points of this analysis are the sameones found in the thickness analysis, as these two result variables aredirectly related: the thicker the point is the smaller will be the thinning.The maximum value is reached in the critical zone (saliency A): 26% ofthinning.
Springback evaluation
The springback analysis is a very important evaluation parameter inour study. This phenomenon was described and analyzed in Chapter 3 -Springback , and will now be evaluated in the test cases.
The following figure presents two different views of the longeron,indicating the maximum and minimum values of normal displacement. Asexpected, through visual analysis one can easily verify that the critical
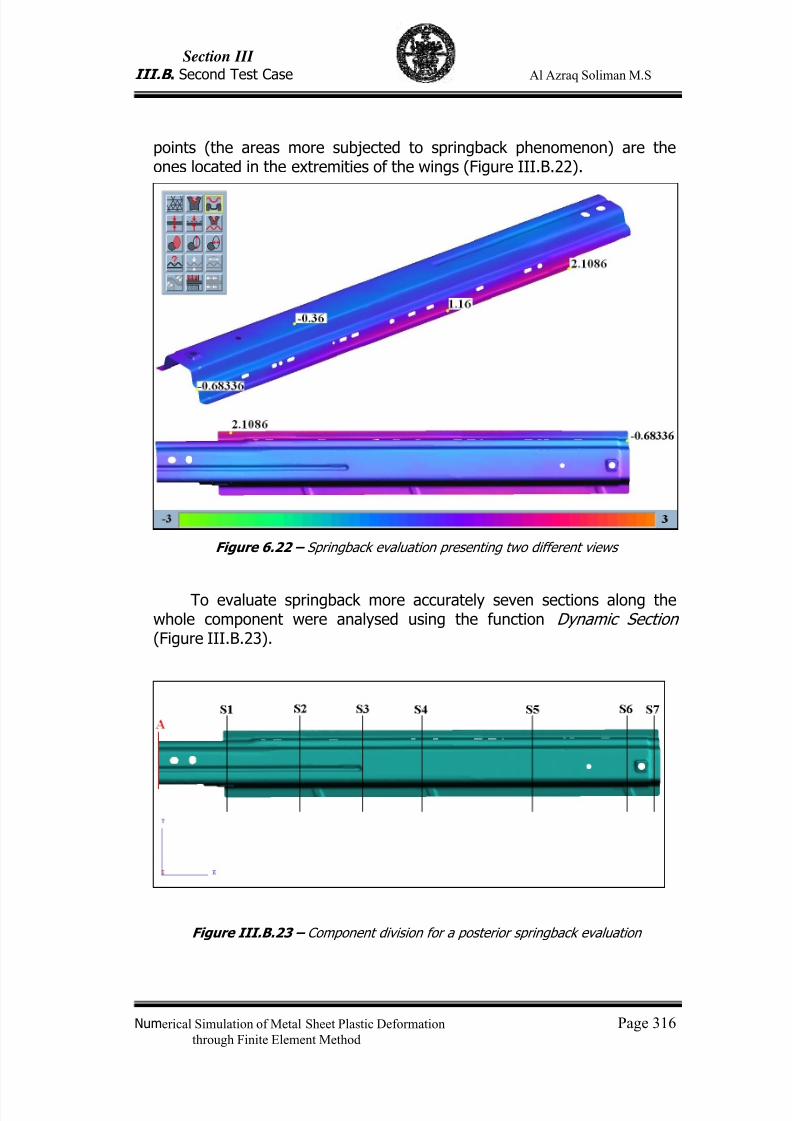
7/23/2019 Al Azraq Ingegneria Chimica Dei Materiali e Della Produzione
http://slidepdf.com/reader/full/al-azraq-ingegneria-chimica-dei-materiali-e-della-produzione 329/419
Section III
III.B . Second Test Case Al Azraq Soliman M.S
Numerical Simulation of Metal Sheet Plastic Deformation Page 316through Finite Element Method
points (the areas more subjected to springback phenomenon) are theones located in the extremities of the wings (Figure III.B.22).
Figure 6.22 – Springback evaluation presenting two different views
To evaluate springback more accurately seven sections along thewhole component were analysed using the function Dynamic Section(Figure III.B.23).
Figure III.B.23 – Component division for a posterior springback evaluation
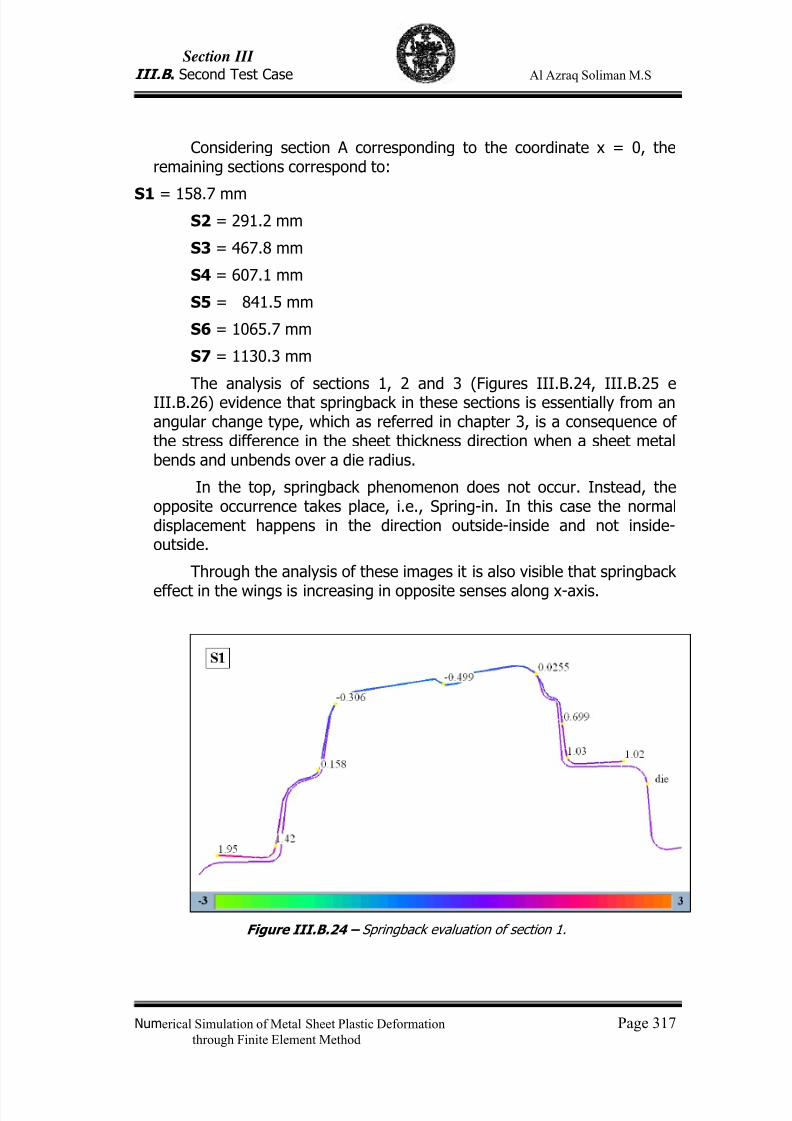
7/23/2019 Al Azraq Ingegneria Chimica Dei Materiali e Della Produzione
http://slidepdf.com/reader/full/al-azraq-ingegneria-chimica-dei-materiali-e-della-produzione 330/419
Section III
III.B . Second Test Case Al Azraq Soliman M.S
Numerical Simulation of Metal Sheet Plastic Deformation Page 317through Finite Element Method
Considering section A corresponding to the coordinate x = 0, theremaining sections correspond to:
S1 = 158.7 mmS2 = 291.2 mm
S3 = 467.8 mm
S4 = 607.1 mm
S5 = 841.5 mm
S6 = 1065.7 mm
S7 = 1130.3 mm
The analysis of sections 1, 2 and 3 (Figures III.B.24, III.B.25 eIII.B.26) evidence that springback in these sections is essentially from anangular change type, which as referred in chapter 3, is a consequence ofthe stress difference in the sheet thickness direction when a sheet metalbends and unbends over a die radius.
In the top, springback phenomenon does not occur. Instead, theopposite occurrence takes place, i.e., Spring-in. In this case the normaldisplacement happens in the direction outside-inside and not inside-outside.
Through the analysis of these images it is also visible that springback
effect in the wings is increasing in opposite senses along x-axis.
Figure III.B.24 – Springback evaluation of section 1.
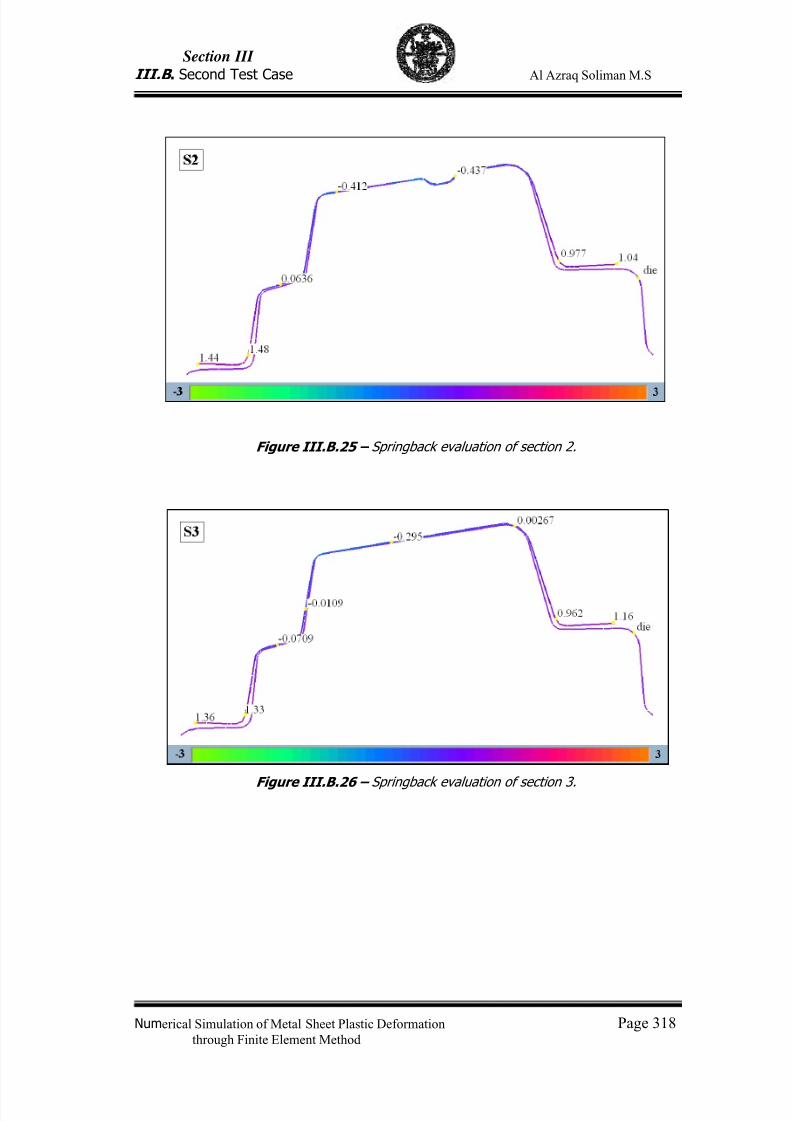
7/23/2019 Al Azraq Ingegneria Chimica Dei Materiali e Della Produzione
http://slidepdf.com/reader/full/al-azraq-ingegneria-chimica-dei-materiali-e-della-produzione 331/419
Section III
III.B . Second Test Case Al Azraq Soliman M.S
Numerical Simulation of Metal Sheet Plastic Deformation Page 318through Finite Element Method
Figure III.B.25 – Springback evaluation of section 2.
Figure III.B.26 – Springback evaluation of section 3.

7/23/2019 Al Azraq Ingegneria Chimica Dei Materiali e Della Produzione
http://slidepdf.com/reader/full/al-azraq-ingegneria-chimica-dei-materiali-e-della-produzione 332/419
Section III.C
The third application is the test case realized in AutoForm 4.04
Incremental code is a simple profile stamping simulation withangle variations in the component vertical side walls using two
different Advanced High Strength Steel (AHSS) materials.

7/23/2019 Al Azraq Ingegneria Chimica Dei Materiali e Della Produzione
http://slidepdf.com/reader/full/al-azraq-ingegneria-chimica-dei-materiali-e-della-produzione 333/419
Section III
III.C . Third Test Case Al Azraq Soliman M.S
Numerical Simulation of Metal Sheet Plastic Deformation Page 319through Finite Element Method
III.C .1 – Introduction
The simulation of the sheet metal forming process in this project wasperformed using the incremental forming simulation program AutoForm4.04®.
The aim of the numerical simulation carried out in this chapter is toverify the stamping process and the shape of the final component forstudying springback of AHSS, with a synthetic description of the processsteps. The test case is the stamping simulation of three simple profiles fortwo different AHSS: Dual-Phase (DP 600) and Transformation-InducedPlasticity (TRIP 800).
AutoForm-Incremental is the AutoForm module to simulate sheetmetal forming processes (conventional deep drawing, hydro-mechanical deep
drawing) using the finite element method in many small steps. Using AutoForm-Incremental it is possible to simulate all forming operationsbeginning with the plane blank sheet and ending with the finished partincluding springback calculation.
The simulation is always created on the basis of a part or toolgeometry. This geometry has to be available in VDAFS- or IGES-format. Thesimulation starts with the import of this CAD file.
Basing on this imported CAD file further input is generated: Inputconcerning the process such as tool geometries, tool movement, informationon the sheet (size, shape, material proprieties, thickness etc.) is defined. All
this information are saved in a simulation file (*.SIM).
III.C .2 – Methodology in AutoForm
Basically, AutoForm is a simulator of stamping processes, in figureIII.C.1 are described all the steps on it utilization.
It is a ‘trial and error’ software where the operator prepares thestamping tools and analyzing the final results decide if it is finished or if haveto make some changes to get the wanted results.
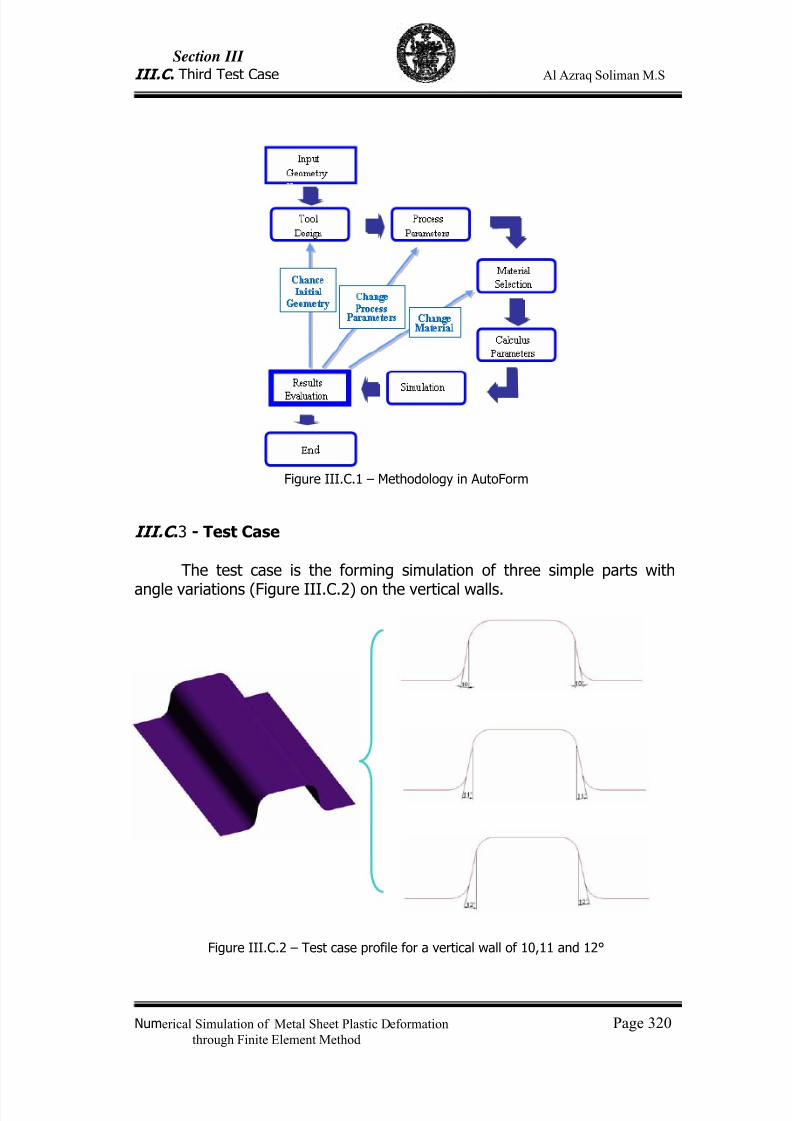
7/23/2019 Al Azraq Ingegneria Chimica Dei Materiali e Della Produzione
http://slidepdf.com/reader/full/al-azraq-ingegneria-chimica-dei-materiali-e-della-produzione 334/419
Section III
III.C . Third Test Case Al Azraq Soliman M.S
Numerical Simulation of Metal Sheet Plastic Deformation Page 320through Finite Element Method
Figure III.C.1 – Methodology in AutoForm
III.C .3 - Test Case
The test case is the forming simulation of three simple parts with
angle variations (Figure III.C.2) on the vertical walls.
Figure III.C.2 – Test case profile for a vertical wall of 10,11 and 12°
7/23/2019 Al Azraq Ingegneria Chimica Dei Materiali e Della Produzione
http://slidepdf.com/reader/full/al-azraq-ingegneria-chimica-dei-materiali-e-della-produzione 335/419
Section III
III.C . Third Test Case Al Azraq Soliman M.S
Numerical Simulation of Metal Sheet Plastic Deformation Page 321through Finite Element Method
III.C .4 - Synthetic Description of AutoForm Process Steps
1. Pre-Processing of Input Data
Import geometry- Import part geometry from CAD
Part Geometry (Geometry Generator)- Prepare- Fillet- Balance (Tip)- Filling Holes (Modify Part Geometry)- External Contour (Boundary Fill)
- Binder- Addendum
Process Data Input (Input Generator)- Tools- Blank- Lube- Drawbeads
Material Properties / Material Selection
- True stress-True strain curve- Normal anisotropy coefficient- Forming limit curve
Process Description-Process (Gravity, Closing, Drawing)-Cutting-Springback
Calculus Configuration
- Control data
2. Computational Analysis
3. Post-Processing of ResultsVisual evaluationForming evaluation
-Formability (FLC)-Forming Limit Diagram (FLD)-Wrinkling criterion-Maximum Failure
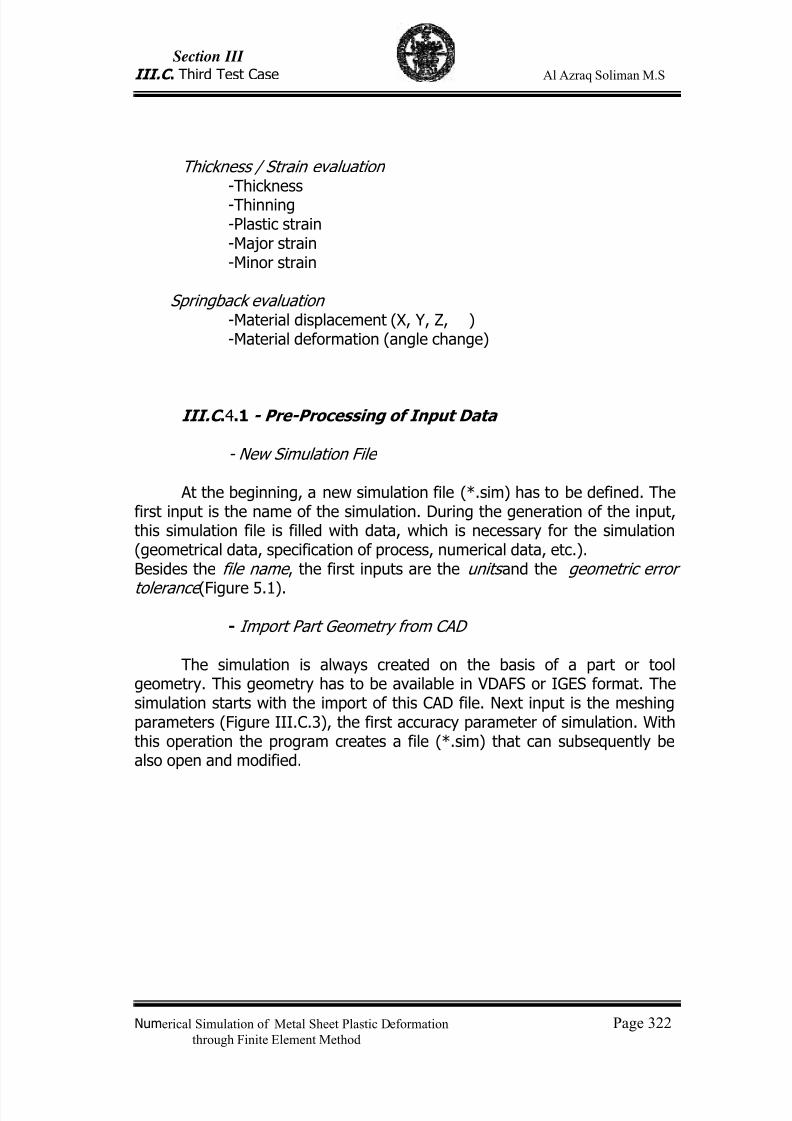
7/23/2019 Al Azraq Ingegneria Chimica Dei Materiali e Della Produzione
http://slidepdf.com/reader/full/al-azraq-ingegneria-chimica-dei-materiali-e-della-produzione 336/419
Section III
III.C . Third Test Case Al Azraq Soliman M.S
Numerical Simulation of Metal Sheet Plastic Deformation Page 322through Finite Element Method
Thickness / Strain evaluation-Thickness-Thinning-Plastic strain-Major strain-Minor strain
Springback evaluation-Material displacement (X, Y, Z, )-Material deformation (angle change)
III.C .4.1 - Pre-Processing of Input Data
- New Simulation File
At the beginning, a new simulation file (*.sim) has to be defined. Thefirst input is the name of the simulation. During the generation of the input,this simulation file is filled with data, which is necessary for the simulation(geometrical data, specification of process, numerical data, etc.).Besides the file name , the first inputs are the units and the geometric error
tolerance (Figure 5.1).
- Import Part Geometry from CAD
The simulation is always created on the basis of a part or toolgeometry. This geometry has to be available in VDAFS or IGES format. Thesimulation starts with the import of this CAD file. Next input is the meshingparameters (Figure III.C.3), the first accuracy parameter of simulation. Withthis operation the program creates a file (*.sim) that can subsequently bealso open and modified.
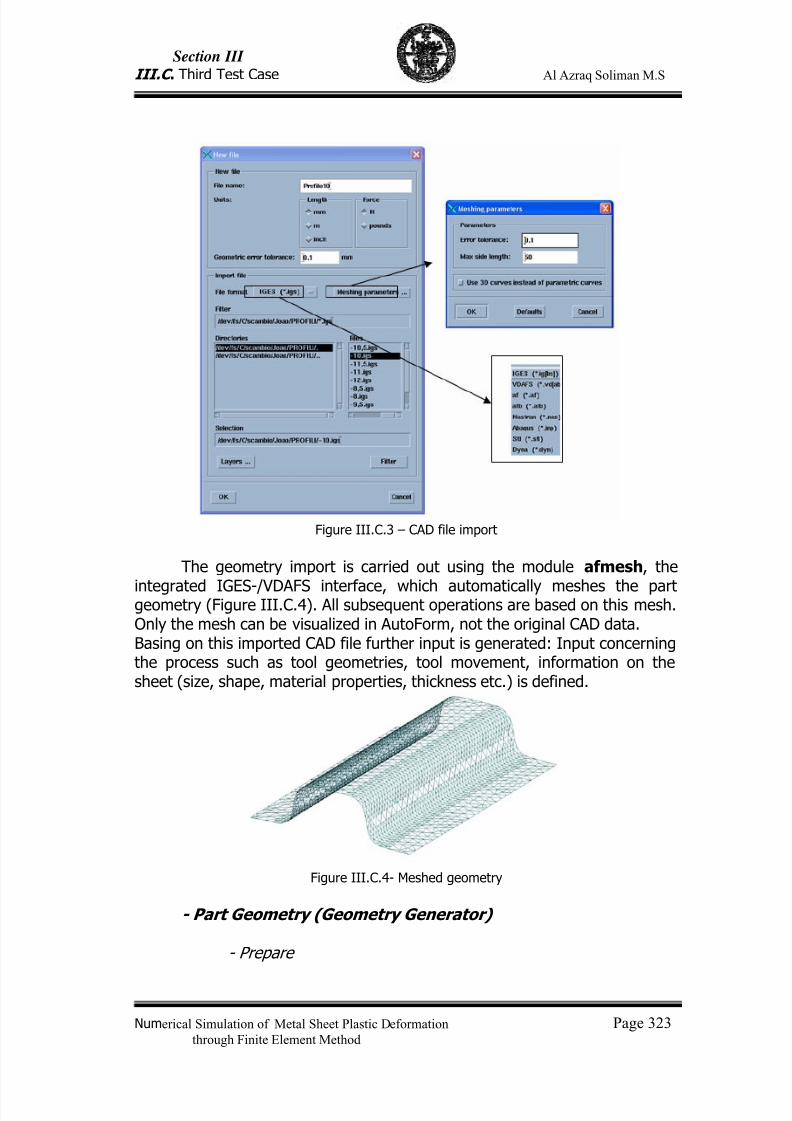
7/23/2019 Al Azraq Ingegneria Chimica Dei Materiali e Della Produzione
http://slidepdf.com/reader/full/al-azraq-ingegneria-chimica-dei-materiali-e-della-produzione 337/419
Section III
III.C . Third Test Case Al Azraq Soliman M.S
Numerical Simulation of Metal Sheet Plastic Deformation Page 323through Finite Element Method
Figure III.C.3 – CAD file import
The geometry import is carried out using the module afmesh, the
integrated IGES-/VDAFS interface, which automatically meshes the partgeometry (Figure III.C.4). All subsequent operations are based on this mesh.Only the mesh can be visualized in AutoForm, not the original CAD data.Basing on this imported CAD file further input is generated: Input concerningthe process such as tool geometries, tool movement, information on thesheet (size, shape, material properties, thickness etc.) is defined.
Figure III.C.4- Meshed geometry
- Part Geometry (Geometry Generator)
- Prepare
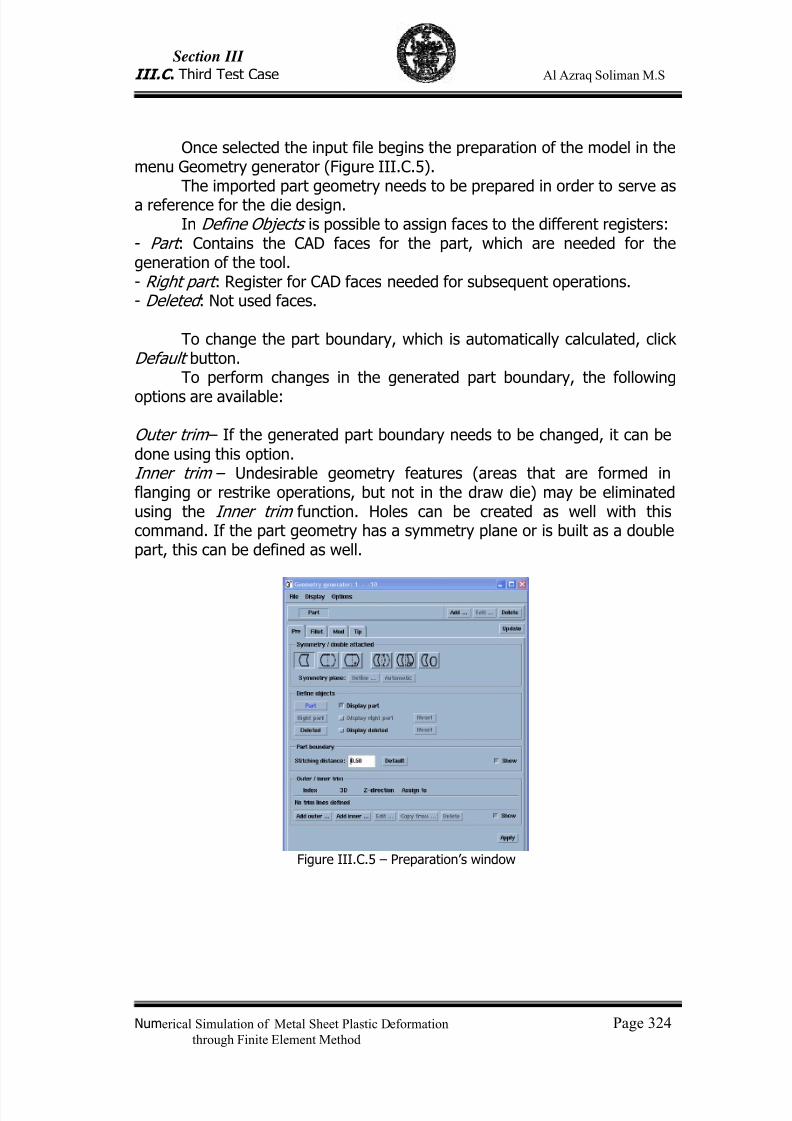
7/23/2019 Al Azraq Ingegneria Chimica Dei Materiali e Della Produzione
http://slidepdf.com/reader/full/al-azraq-ingegneria-chimica-dei-materiali-e-della-produzione 338/419
Section III
III.C . Third Test Case Al Azraq Soliman M.S
Numerical Simulation of Metal Sheet Plastic Deformation Page 324through Finite Element Method
Once selected the input file begins the preparation of the model in themenu Geometry generator (Figure III.C.5).
The imported part geometry needs to be prepared in order to serve asa reference for the die design.
In Define Objects is possible to assign faces to the different registers:- Part : Contains the CAD faces for the part, which are needed for thegeneration of the tool.- Right part : Register for CAD faces needed for subsequent operations.- Deleted : Not used faces.
To change the part boundary, which is automatically calculated, clickDefault button.
To perform changes in the generated part boundary, the following
options are available:
Outer trim – If the generated part boundary needs to be changed, it can bedone using this option.Inner trim – Undesirable geometry features (areas that are formed inflanging or restrike operations, but not in the draw die) may be eliminatedusing the Inner trim function. Holes can be created as well with thiscommand. If the part geometry has a symmetry plane or is built as a doublepart, this can be defined as well.
Figure III.C.5 – Preparation’s window
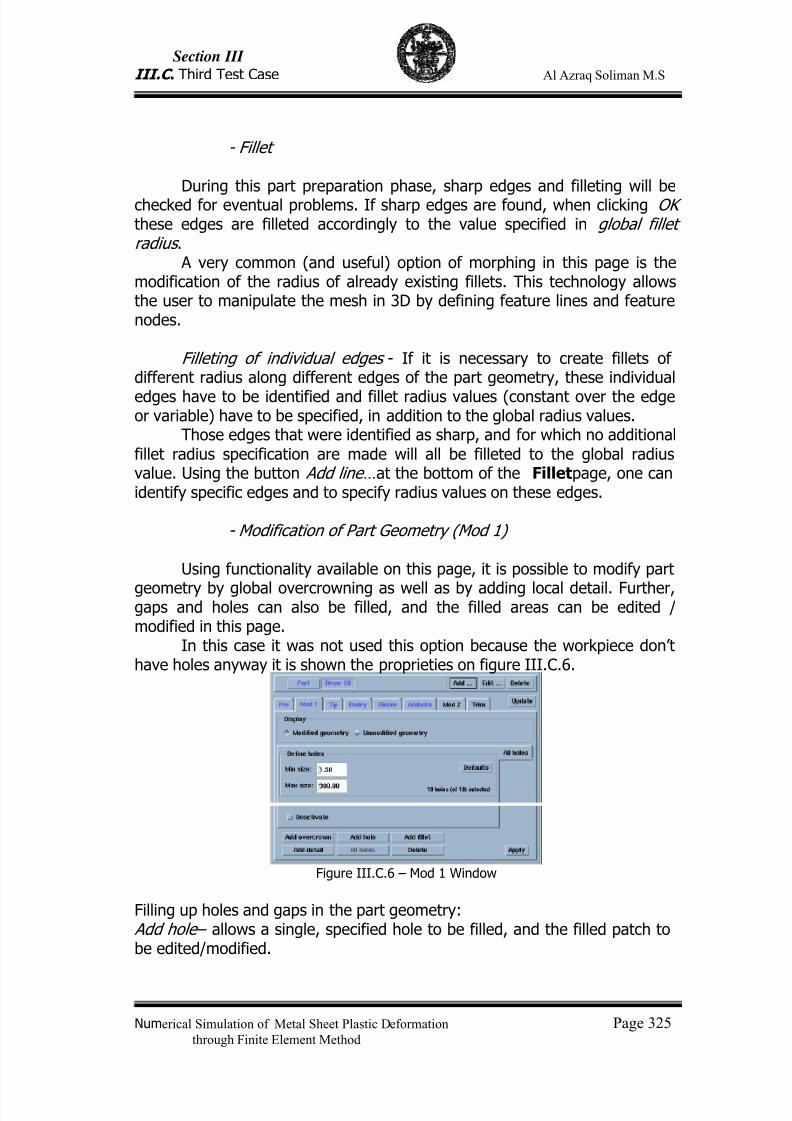
7/23/2019 Al Azraq Ingegneria Chimica Dei Materiali e Della Produzione
http://slidepdf.com/reader/full/al-azraq-ingegneria-chimica-dei-materiali-e-della-produzione 339/419
Section III
III.C . Third Test Case Al Azraq Soliman M.S
Numerical Simulation of Metal Sheet Plastic Deformation Page 325through Finite Element Method
- Fillet
During this part preparation phase, sharp edges and filleting will bechecked for eventual problems. If sharp edges are found, when clicking OK these edges are filleted accordingly to the value specified in global filletradius .
A very common (and useful) option of morphing in this page is themodification of the radius of already existing fillets. This technology allowsthe user to manipulate the mesh in 3D by defining feature lines and featurenodes.
Filleting of individual edges - If it is necessary to create fillets ofdifferent radius along different edges of the part geometry, these individual
edges have to be identified and fillet radius values (constant over the edgeor variable) have to be specified, in addition to the global radius values.
Those edges that were identified as sharp, and for which no additionalfillet radius specification are made will all be filleted to the global radiusvalue. Using the button Add line… at the bottom of the Fillet page, one canidentify specific edges and to specify radius values on these edges.
- Modification of Part Geometry (Mod 1)
Using functionality available on this page, it is possible to modify part
geometry by global overcrowning as well as by adding local detail. Further,gaps and holes can also be filled, and the filled areas can be edited /modified in this page.
In this case it was not used this option because the workpiece don’thave holes anyway it is shown the proprieties on figure III.C.6.
Figure III.C.6 – Mod 1 Window
Filling up holes and gaps in the part geometry: Add hole – allows a single, specified hole to be filled, and the filled patch tobe edited/modified.
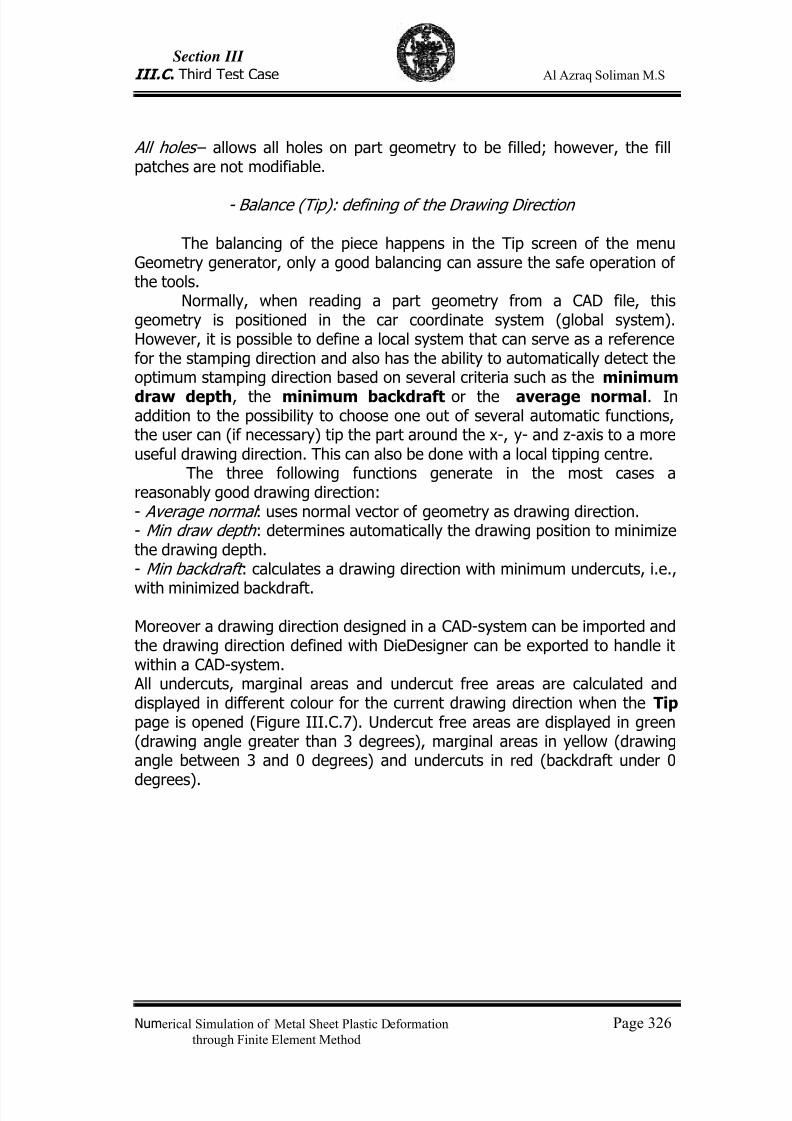
7/23/2019 Al Azraq Ingegneria Chimica Dei Materiali e Della Produzione
http://slidepdf.com/reader/full/al-azraq-ingegneria-chimica-dei-materiali-e-della-produzione 340/419
Section III
III.C . Third Test Case Al Azraq Soliman M.S
Numerical Simulation of Metal Sheet Plastic Deformation Page 326through Finite Element Method
All holes – allows all holes on part geometry to be filled; however, the fillpatches are not modifiable.
- Balance (Tip): defining of the Drawing Direction
The balancing of the piece happens in the Tip screen of the menuGeometry generator, only a good balancing can assure the safe operation ofthe tools.
Normally, when reading a part geometry from a CAD file, thisgeometry is positioned in the car coordinate system (global system).However, it is possible to define a local system that can serve as a referencefor the stamping direction and also has the ability to automatically detect theoptimum stamping direction based on several criteria such as the minimum
draw depth, the minimum backdraft or the average normal. Inaddition to the possibility to choose one out of several automatic functions,the user can (if necessary) tip the part around the x-, y- and z-axis to a moreuseful drawing direction. This can also be done with a local tipping centre.
The three following functions generate in the most cases areasonably good drawing direction:- Average normal : uses normal vector of geometry as drawing direction.- Min draw depth : determines automatically the drawing position to minimizethe drawing depth.- Min backdraft : calculates a drawing direction with minimum undercuts, i.e.,
with minimized backdraft.
Moreover a drawing direction designed in a CAD-system can be imported andthe drawing direction defined with DieDesigner can be exported to handle itwithin a CAD-system. All undercuts, marginal areas and undercut free areas are calculated anddisplayed in different colour for the current drawing direction when the Tip page is opened (Figure III.C.7). Undercut free areas are displayed in green(drawing angle greater than 3 degrees), marginal areas in yellow (drawingangle between 3 and 0 degrees) and undercuts in red (backdraft under 0
degrees).
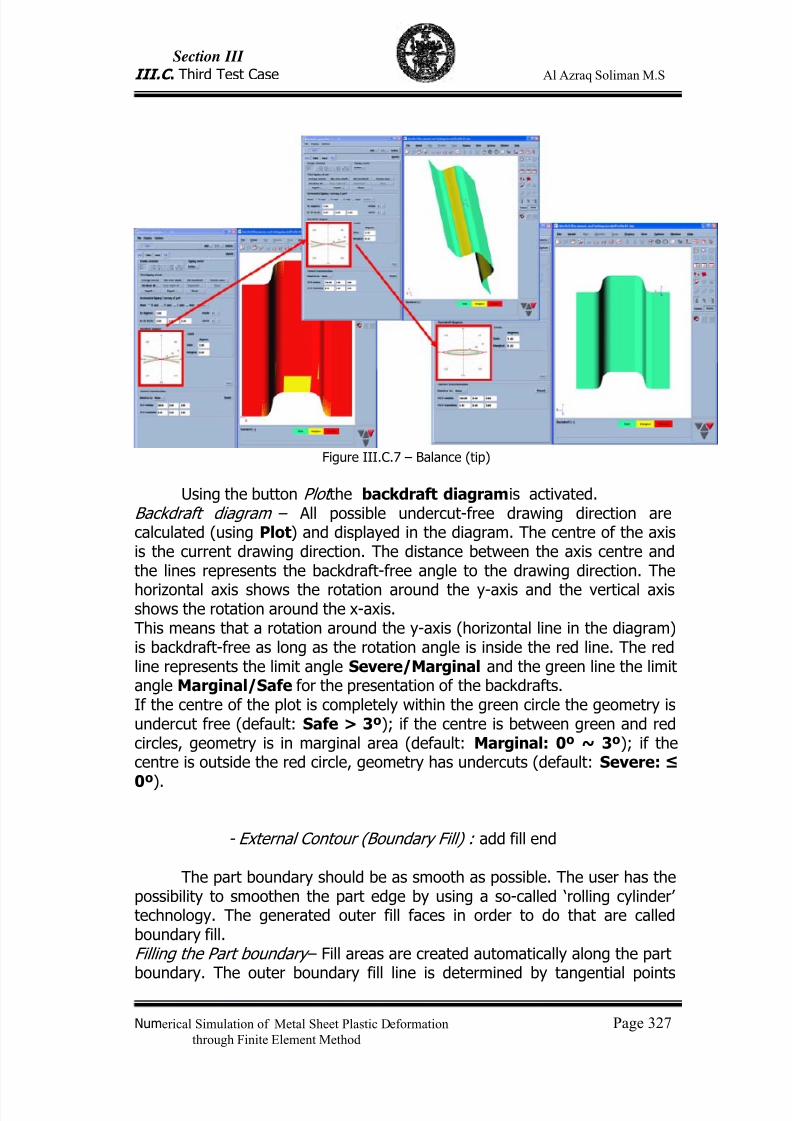
7/23/2019 Al Azraq Ingegneria Chimica Dei Materiali e Della Produzione
http://slidepdf.com/reader/full/al-azraq-ingegneria-chimica-dei-materiali-e-della-produzione 341/419
Section III
III.C . Third Test Case Al Azraq Soliman M.S
Numerical Simulation of Metal Sheet Plastic Deformation Page 327through Finite Element Method
Figure III.C.7 – Balance (tip)
Using the button Plot the backdraft diagram is activated. Backdraft diagram – All possible undercut-free drawing direction arecalculated (using Plot) and displayed in the diagram. The centre of the axisis the current drawing direction. The distance between the axis centre andthe lines represents the backdraft-free angle to the drawing direction. The
horizontal axis shows the rotation around the y-axis and the vertical axisshows the rotation around the x-axis.This means that a rotation around the y-axis (horizontal line in the diagram)is backdraft-free as long as the rotation angle is inside the red line. The redline represents the limit angle Severe/Marginal and the green line the limitangle Marginal/Safe for the presentation of the backdrafts.If the centre of the plot is completely within the green circle the geometry isundercut free (default: Safe > 3º); if the centre is between green and redcircles, geometry is in marginal area (default: Marginal: 0º ~ 3º); if thecentre is outside the red circle, geometry has undercuts (default: Severe: ≤
0º).
- External Contour (Boundary Fill) : add fill end
The part boundary should be as smooth as possible. The user has thepossibility to smoothen the part edge by using a so-called ‘rolling cylinder’technology. The generated outer fill faces in order to do that are calledboundary fill.Filling the Part boundary – Fill areas are created automatically along the partboundary. The outer boundary fill line is determined by tangential points
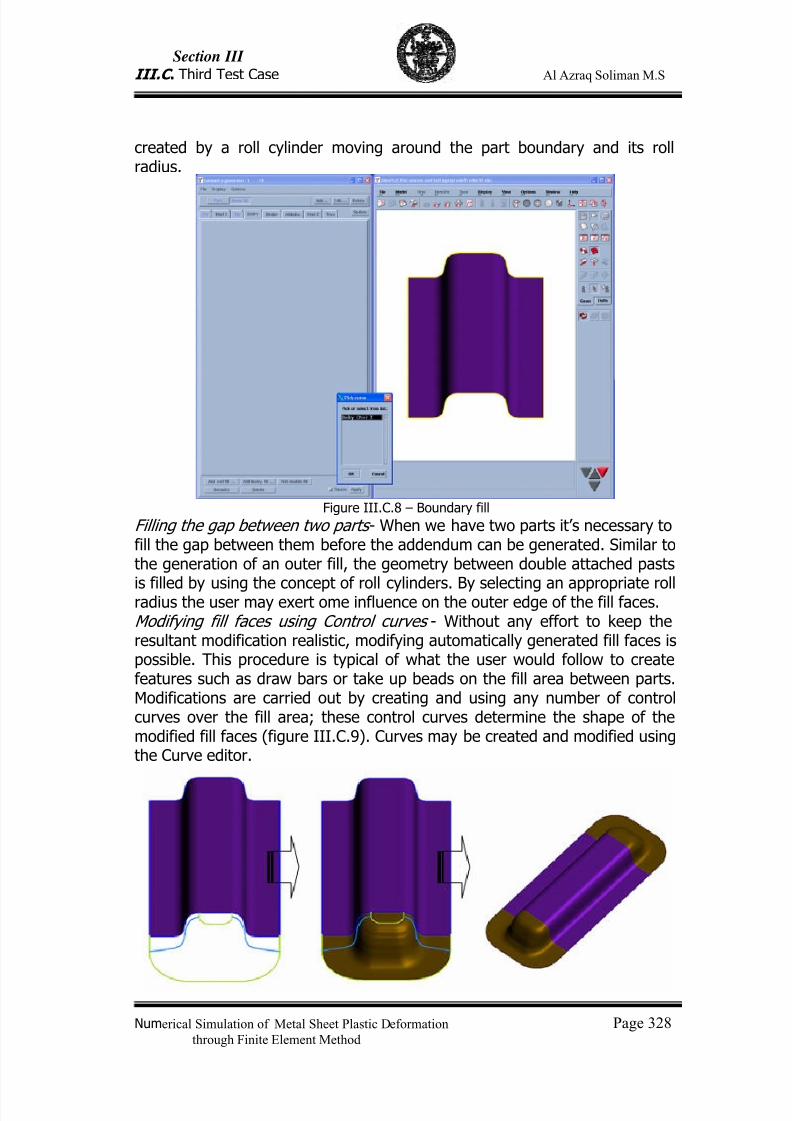
7/23/2019 Al Azraq Ingegneria Chimica Dei Materiali e Della Produzione
http://slidepdf.com/reader/full/al-azraq-ingegneria-chimica-dei-materiali-e-della-produzione 342/419
Section III
III.C . Third Test Case Al Azraq Soliman M.S
Numerical Simulation of Metal Sheet Plastic Deformation Page 328through Finite Element Method
created by a roll cylinder moving around the part boundary and its rollradius.
Figure III.C.8 – Boundary fill
Filling the gap between two parts - When we have two parts it’s necessary tofill the gap between them before the addendum can be generated. Similar tothe generation of an outer fill, the geometry between double attached pasts
is filled by using the concept of roll cylinders. By selecting an appropriate rollradius the user may exert ome influence on the outer edge of the fill faces. Modifying fill faces using Control curves - Without any effort to keep theresultant modification realistic, modifying automatically generated fill faces ispossible. This procedure is typical of what the user would follow to createfeatures such as draw bars or take up beads on the fill area between parts.Modifications are carried out by creating and using any number of controlcurves over the fill area; these control curves determine the shape of themodified fill faces (figure III.C.9). Curves may be created and modified usingthe Curve editor.
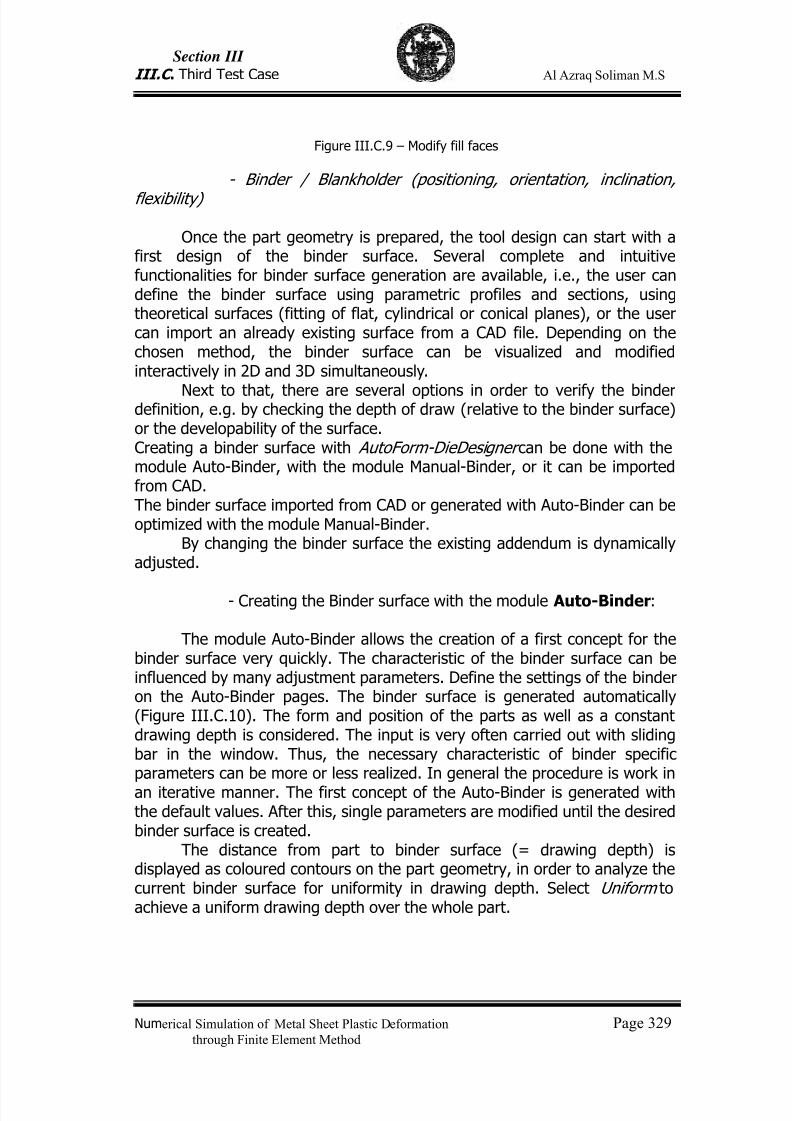
7/23/2019 Al Azraq Ingegneria Chimica Dei Materiali e Della Produzione
http://slidepdf.com/reader/full/al-azraq-ingegneria-chimica-dei-materiali-e-della-produzione 343/419
Section III
III.C . Third Test Case Al Azraq Soliman M.S
Numerical Simulation of Metal Sheet Plastic Deformation Page 329through Finite Element Method
Figure III.C.9 – Modify fill faces
- Binder / Blankholder (positioning, orientation, inclination,
flexibility)
Once the part geometry is prepared, the tool design can start with afirst design of the binder surface. Several complete and intuitivefunctionalities for binder surface generation are available, i.e., the user candefine the binder surface using parametric profiles and sections, usingtheoretical surfaces (fitting of flat, cylindrical or conical planes), or the usercan import an already existing surface from a CAD file. Depending on thechosen method, the binder surface can be visualized and modifiedinteractively in 2D and 3D simultaneously.
Next to that, there are several options in order to verify the binderdefinition, e.g. by checking the depth of draw (relative to the binder surface)or the developability of the surface.Creating a binder surface with AutoForm-DieDesigner can be done with themodule Auto-Binder, with the module Manual-Binder, or it can be importedfrom CAD.The binder surface imported from CAD or generated with Auto-Binder can beoptimized with the module Manual-Binder.
By changing the binder surface the existing addendum is dynamicallyadjusted.
- Creating the Binder surface with the module Auto-Binder:
The module Auto-Binder allows the creation of a first concept for thebinder surface very quickly. The characteristic of the binder surface can beinfluenced by many adjustment parameters. Define the settings of the binderon the Auto-Binder pages. The binder surface is generated automatically(Figure III.C.10). The form and position of the parts as well as a constantdrawing depth is considered. The input is very often carried out with slidingbar in the window. Thus, the necessary characteristic of binder specificparameters can be more or less realized. In general the procedure is work inan iterative manner. The first concept of the Auto-Binder is generated withthe default values. After this, single parameters are modified until the desiredbinder surface is created.
The distance from part to binder surface (= drawing depth) isdisplayed as coloured contours on the part geometry, in order to analyze thecurrent binder surface for uniformity in drawing depth. Select Uniform toachieve a uniform drawing depth over the whole part.
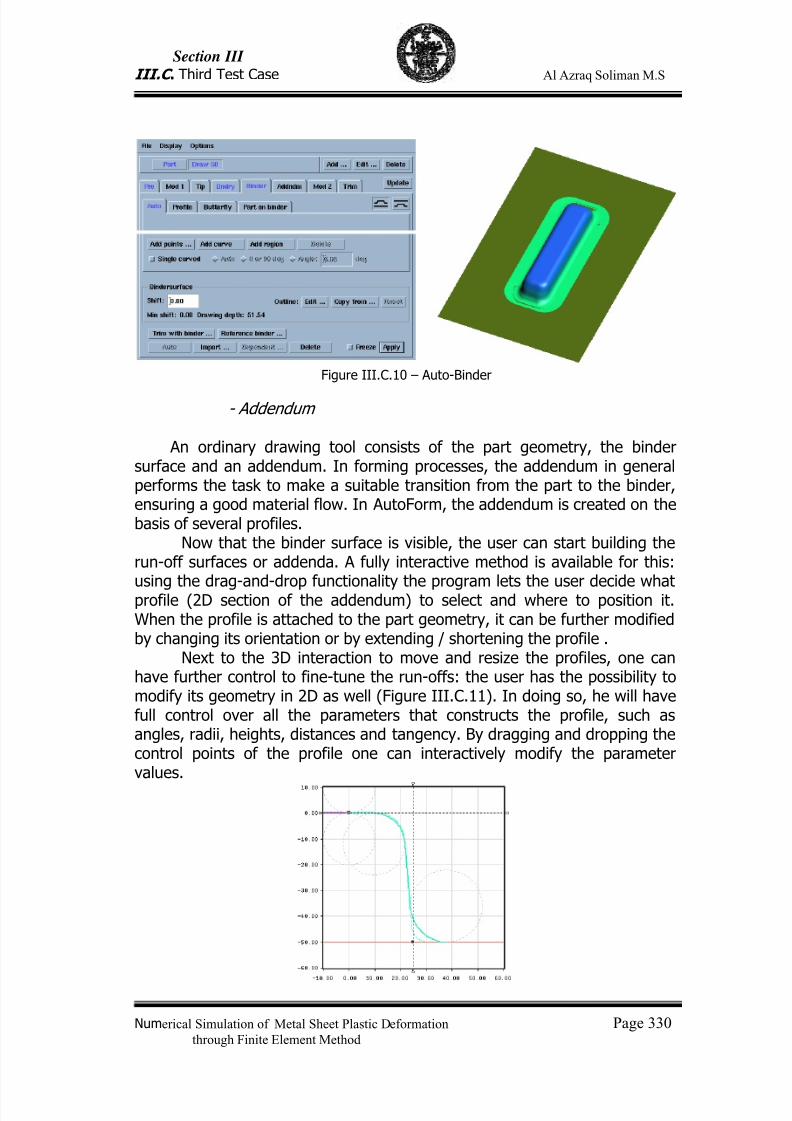
7/23/2019 Al Azraq Ingegneria Chimica Dei Materiali e Della Produzione
http://slidepdf.com/reader/full/al-azraq-ingegneria-chimica-dei-materiali-e-della-produzione 344/419
Section III
III.C . Third Test Case Al Azraq Soliman M.S
Numerical Simulation of Metal Sheet Plastic Deformation Page 330through Finite Element Method
Figure III.C.10 – Auto-Binder
- Addendum
An ordinary drawing tool consists of the part geometry, the bindersurface and an addendum. In forming processes, the addendum in generalperforms the task to make a suitable transition from the part to the binder,ensuring a good material flow. In AutoForm, the addendum is created on thebasis of several profiles.
Now that the binder surface is visible, the user can start building therun-off surfaces or addenda. A fully interactive method is available for this:
using the drag-and-drop functionality the program lets the user decide whatprofile (2D section of the addendum) to select and where to position it.When the profile is attached to the part geometry, it can be further modifiedby changing its orientation or by extending / shortening the profile .
Next to the 3D interaction to move and resize the profiles, one canhave further control to fine-tune the run-offs: the user has the possibility tomodify its geometry in 2D as well (Figure III.C.11). In doing so, he will havefull control over all the parameters that constructs the profile, such asangles, radii, heights, distances and tangency. By dragging and dropping thecontrol points of the profile one can interactively modify the parametervalues.
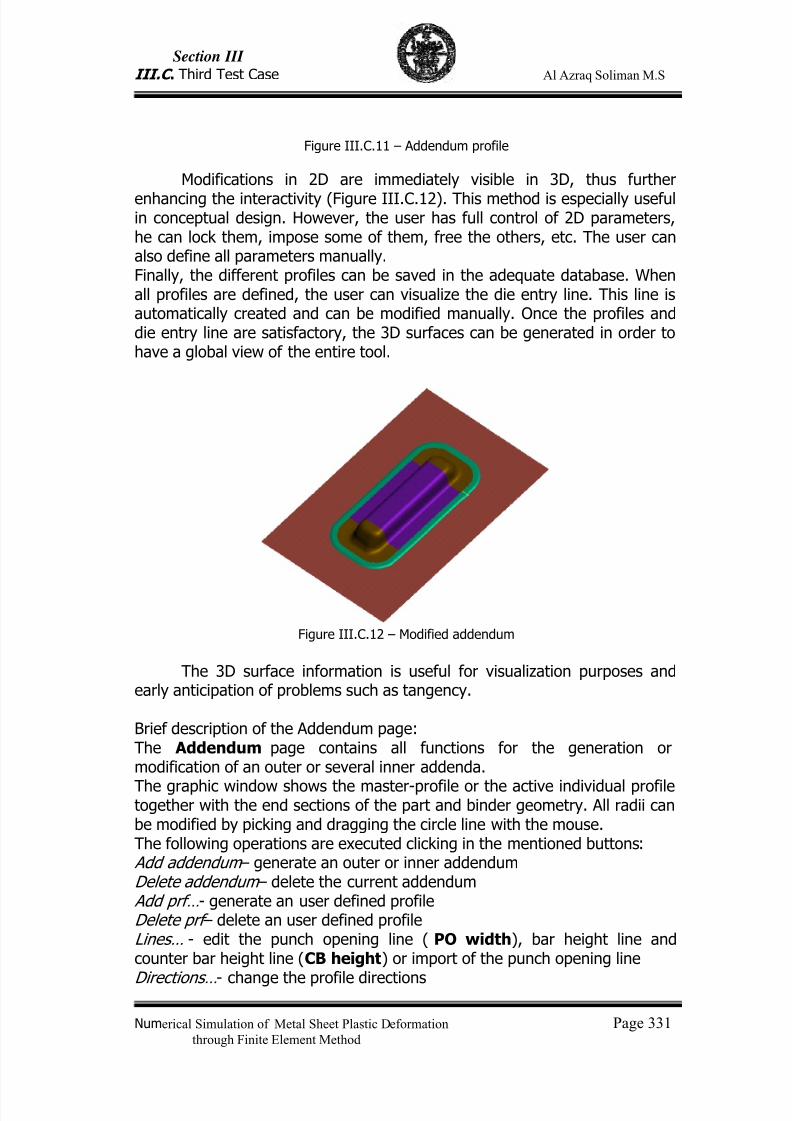
7/23/2019 Al Azraq Ingegneria Chimica Dei Materiali e Della Produzione
http://slidepdf.com/reader/full/al-azraq-ingegneria-chimica-dei-materiali-e-della-produzione 345/419
Section III
III.C . Third Test Case Al Azraq Soliman M.S
Numerical Simulation of Metal Sheet Plastic Deformation Page 331through Finite Element Method
Figure III.C.11 – Addendum profile
Modifications in 2D are immediately visible in 3D, thus further
enhancing the interactivity (Figure III.C.12). This method is especially usefulin conceptual design. However, the user has full control of 2D parameters,he can lock them, impose some of them, free the others, etc. The user canalso define all parameters manually.Finally, the different profiles can be saved in the adequate database. Whenall profiles are defined, the user can visualize the die entry line. This line isautomatically created and can be modified manually. Once the profiles anddie entry line are satisfactory, the 3D surfaces can be generated in order tohave a global view of the entire tool.
Figure III.C.12 – Modified addendum
The 3D surface information is useful for visualization purposes andearly anticipation of problems such as tangency.
Brief description of the Addendum page:The Addendum page contains all functions for the generation ormodification of an outer or several inner addenda.
The graphic window shows the master-profile or the active individual profiletogether with the end sections of the part and binder geometry. All radii canbe modified by picking and dragging the circle line with the mouse.The following operations are executed clicking in the mentioned buttons:
Add addendum – generate an outer or inner addendumDelete addendum – delete the current addendum
Add prf… - generate an user defined profileDelete prf – delete an user defined profileLines… - edit the punch opening line ( PO width), bar height line andcounter bar height line (CB height) or import of the punch opening line
Directions… - change the profile directions
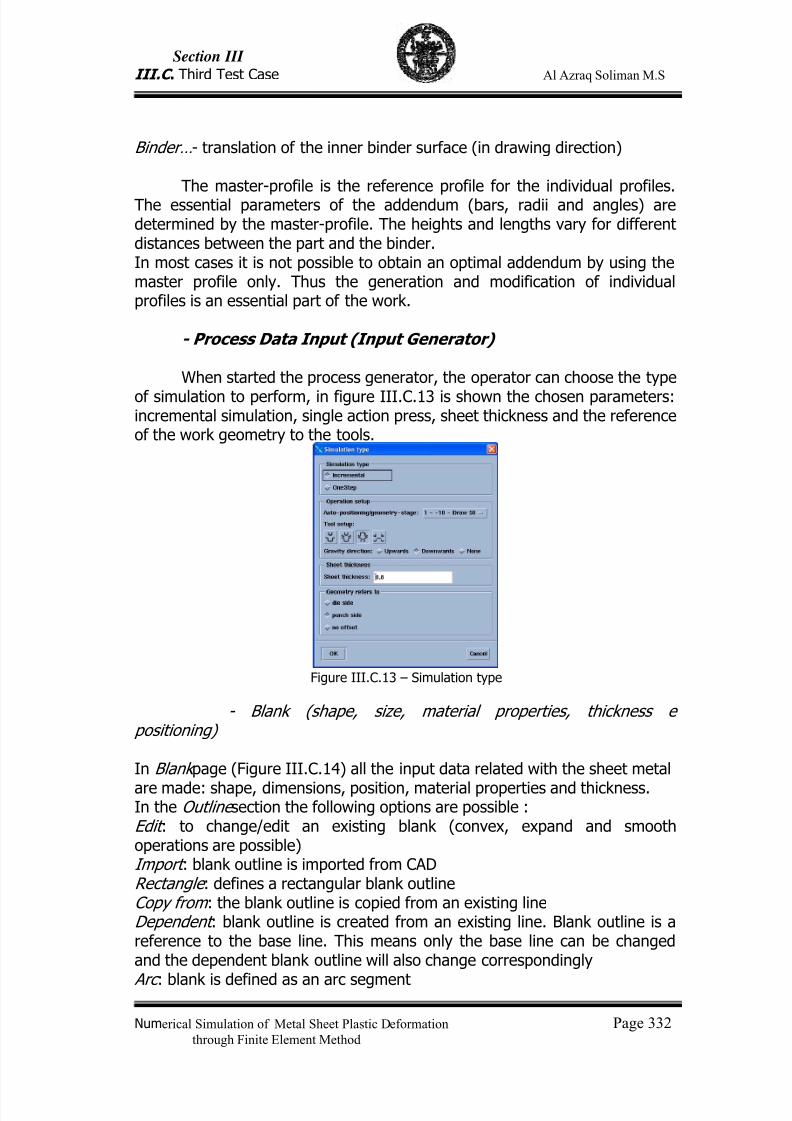
7/23/2019 Al Azraq Ingegneria Chimica Dei Materiali e Della Produzione
http://slidepdf.com/reader/full/al-azraq-ingegneria-chimica-dei-materiali-e-della-produzione 346/419
Section III
III.C . Third Test Case Al Azraq Soliman M.S
Numerical Simulation of Metal Sheet Plastic Deformation Page 332through Finite Element Method
Binder… - translation of the inner binder surface (in drawing direction)
The master-profile is the reference profile for the individual profiles.The essential parameters of the addendum (bars, radii and angles) aredetermined by the master-profile. The heights and lengths vary for differentdistances between the part and the binder.In most cases it is not possible to obtain an optimal addendum by using themaster profile only. Thus the generation and modification of individualprofiles is an essential part of the work.
- Process Data Input (Input Generator)
When started the process generator, the operator can choose the type
of simulation to perform, in figure III.C.13 is shown the chosen parameters:incremental simulation, single action press, sheet thickness and the referenceof the work geometry to the tools.
Figure III.C.13 – Simulation type
- Blank (shape, size, material properties, thickness e positioning)
In Blank page (Figure III.C.14) all the input data related with the sheet metal
are made: shape, dimensions, position, material properties and thickness.In the Outline section the following options are possible :Edit : to change/edit an existing blank (convex, expand and smoothoperations are possible)Import : blank outline is imported from CADRectangle : defines a rectangular blank outlineCopy from : the blank outline is copied from an existing lineDependent : blank outline is created from an existing line. Blank outline is areference to the base line. This means only the base line can be changedand the dependent blank outline will also change correspondingly
Arc : blank is defined as an arc segment
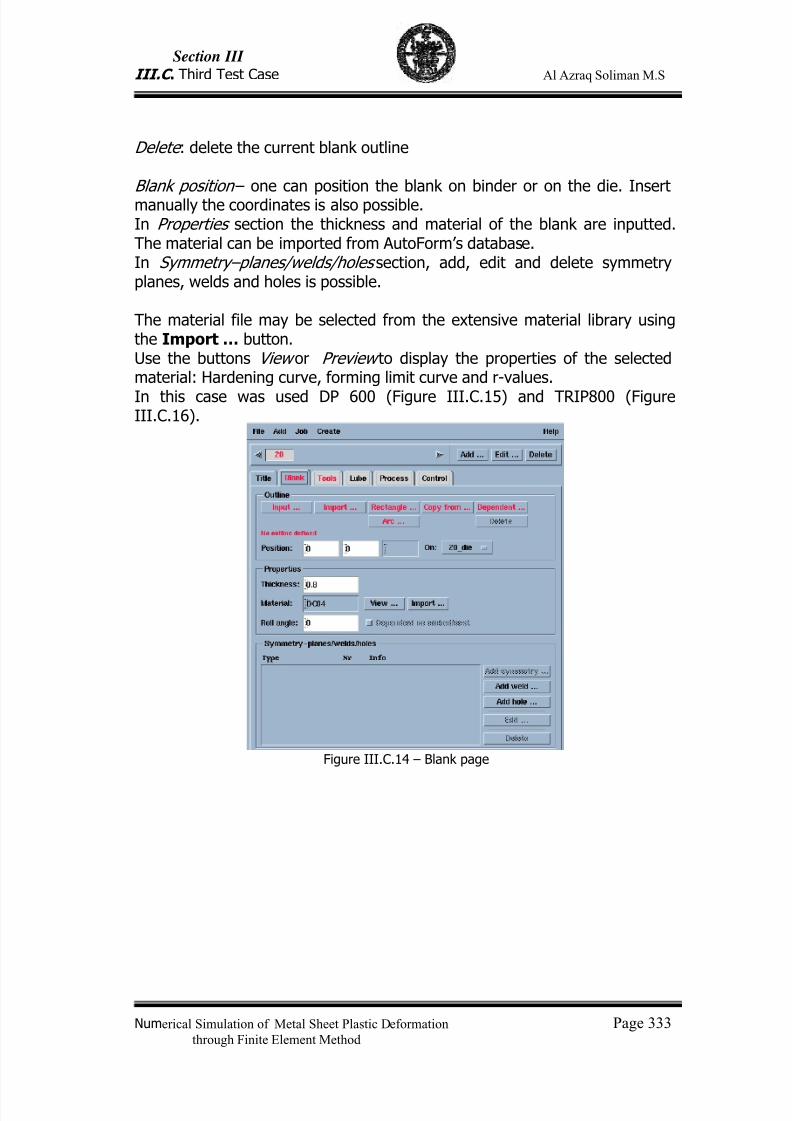
7/23/2019 Al Azraq Ingegneria Chimica Dei Materiali e Della Produzione
http://slidepdf.com/reader/full/al-azraq-ingegneria-chimica-dei-materiali-e-della-produzione 347/419
Section III
III.C . Third Test Case Al Azraq Soliman M.S
Numerical Simulation of Metal Sheet Plastic Deformation Page 333through Finite Element Method
Delete : delete the current blank outline
Blank position – one can position the blank on binder or on the die. Insertmanually the coordinates is also possible.In Properties section the thickness and material of the blank are inputted.The material can be imported from AutoForm’s database.In Symmetry–planes/welds/holes section, add, edit and delete symmetryplanes, welds and holes is possible.
The material file may be selected from the extensive material library usingthe Import … button.Use the buttons View or Preview to display the properties of the selectedmaterial: Hardening curve, forming limit curve and r-values.
In this case was used DP 600 (Figure III.C.15) and TRIP800 (FigureIII.C.16).
Figure III.C.14 – Blank page
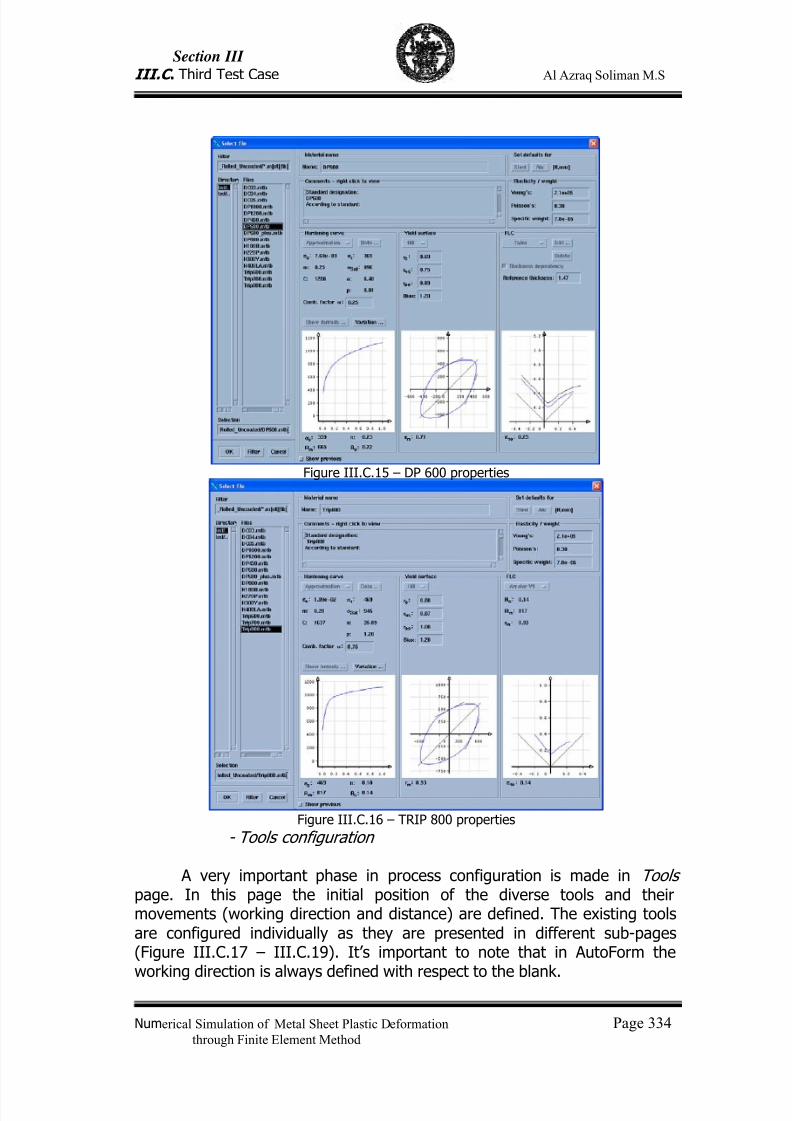
7/23/2019 Al Azraq Ingegneria Chimica Dei Materiali e Della Produzione
http://slidepdf.com/reader/full/al-azraq-ingegneria-chimica-dei-materiali-e-della-produzione 348/419
Section III
III.C . Third Test Case Al Azraq Soliman M.S
Numerical Simulation of Metal Sheet Plastic Deformation Page 334through Finite Element Method
Figure III.C.15 – DP 600 properties
Figure III.C.16 – TRIP 800 properties
- Tools configuration
A very important phase in process configuration is made in Toolspage. In this page the initial position of the diverse tools and theirmovements (working direction and distance) are defined. The existing toolsare configured individually as they are presented in different sub-pages(Figure III.C.17 – III.C.19). It’s important to note that in AutoForm theworking direction is always defined with respect to the blank.
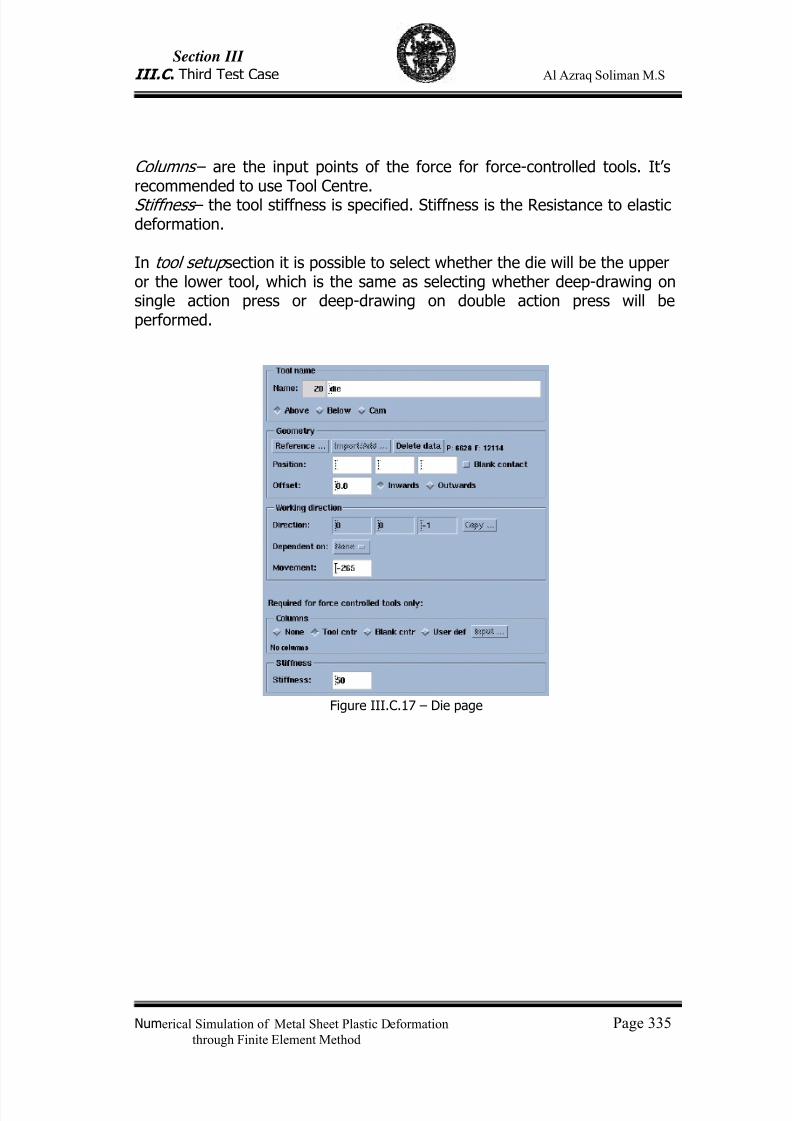
7/23/2019 Al Azraq Ingegneria Chimica Dei Materiali e Della Produzione
http://slidepdf.com/reader/full/al-azraq-ingegneria-chimica-dei-materiali-e-della-produzione 349/419
Section III
III.C . Third Test Case Al Azraq Soliman M.S
Numerical Simulation of Metal Sheet Plastic Deformation Page 335through Finite Element Method
Columns – are the input points of the force for force-controlled tools. It’srecommended to use Tool Centre. Stiffness – the tool stiffness is specified. Stiffness is the Resistance to elasticdeformation.
In tool setup section it is possible to select whether the die will be the upperor the lower tool, which is the same as selecting whether deep-drawing onsingle action press or deep-drawing on double action press will beperformed.
Figure III.C.17 – Die page
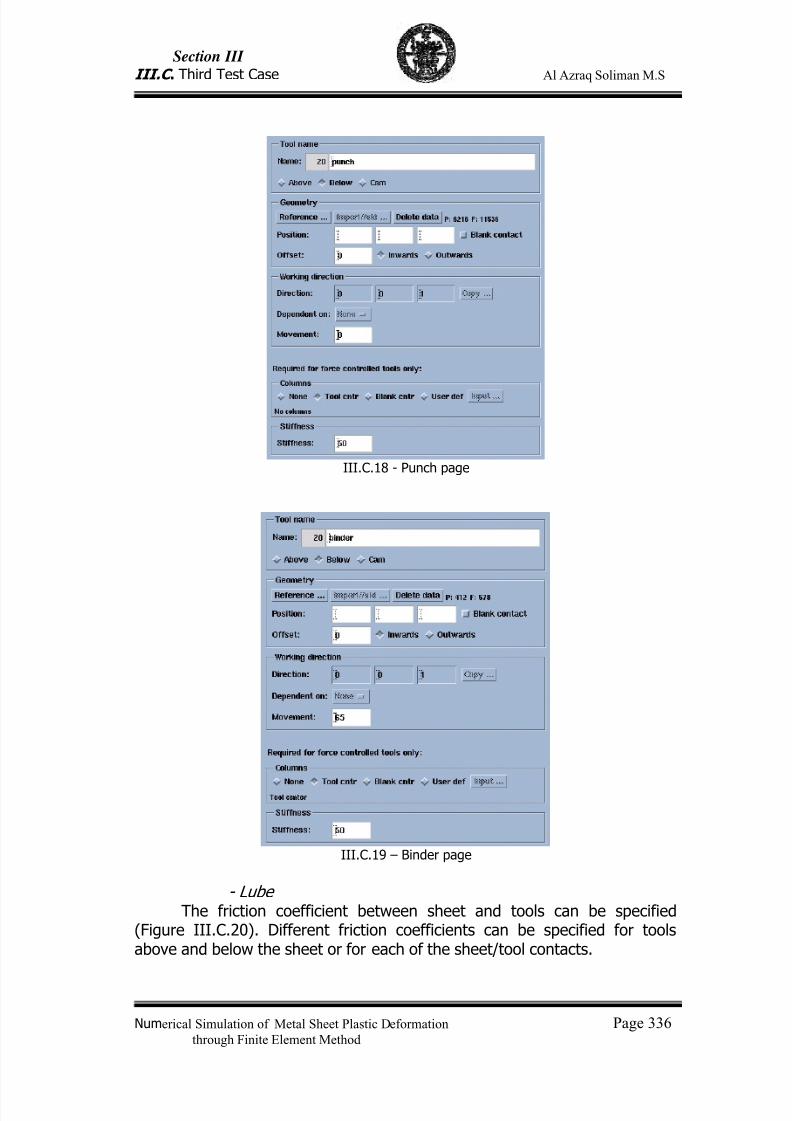
7/23/2019 Al Azraq Ingegneria Chimica Dei Materiali e Della Produzione
http://slidepdf.com/reader/full/al-azraq-ingegneria-chimica-dei-materiali-e-della-produzione 350/419
Section III
III.C . Third Test Case Al Azraq Soliman M.S
Numerical Simulation of Metal Sheet Plastic Deformation Page 336through Finite Element Method
III.C.18 - Punch page
III.C.19 – Binder page
- LubeThe friction coefficient between sheet and tools can be specified
(Figure III.C.20). Different friction coefficients can be specified for toolsabove and below the sheet or for each of the sheet/tool contacts.
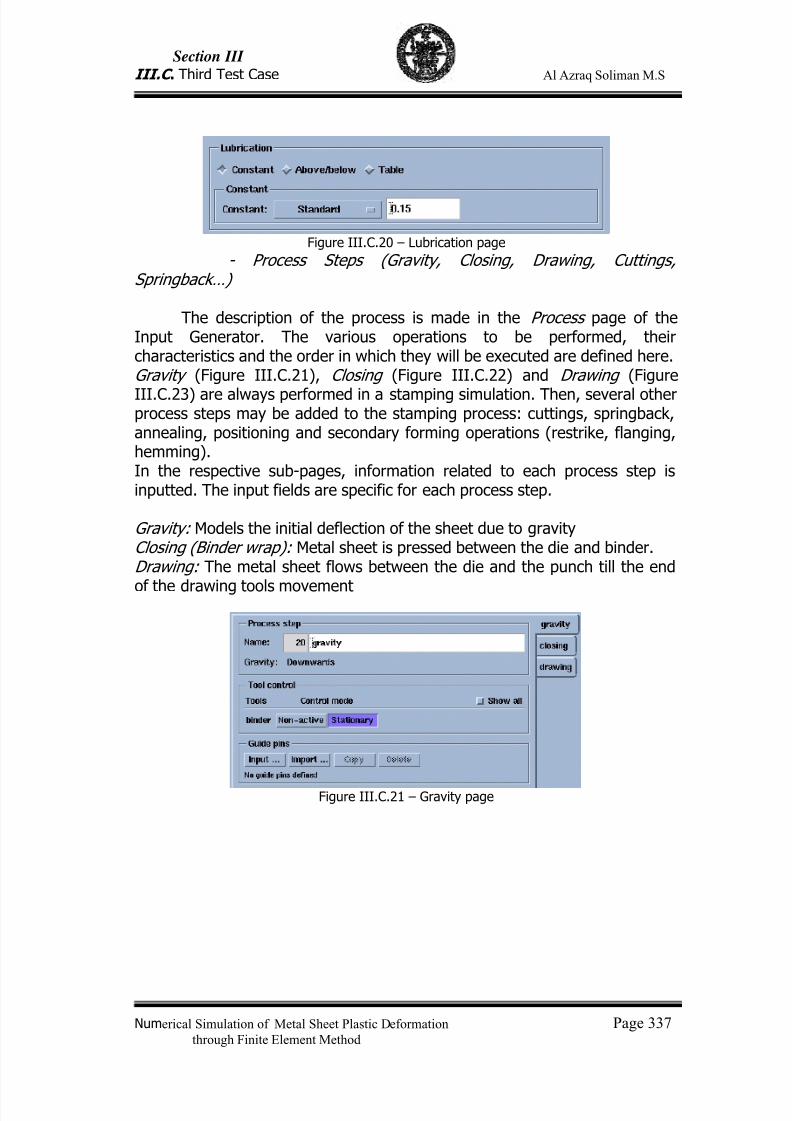
7/23/2019 Al Azraq Ingegneria Chimica Dei Materiali e Della Produzione
http://slidepdf.com/reader/full/al-azraq-ingegneria-chimica-dei-materiali-e-della-produzione 351/419
Section III
III.C . Third Test Case Al Azraq Soliman M.S
Numerical Simulation of Metal Sheet Plastic Deformation Page 337through Finite Element Method
Figure III.C.20 – Lubrication page
- Process Steps (Gravity, Closing, Drawing, Cuttings,Springback…)
The description of the process is made in the Process page of theInput Generator. The various operations to be performed, theircharacteristics and the order in which they will be executed are defined here.Gravity (Figure III.C.21), Closing (Figure III.C.22) and Drawing (Figure
III.C.23) are always performed in a stamping simulation. Then, several otherprocess steps may be added to the stamping process: cuttings, springback,annealing, positioning and secondary forming operations (restrike, flanging,hemming).In the respective sub-pages, information related to each process step isinputted. The input fields are specific for each process step.
Gravity: Models the initial deflection of the sheet due to gravity Closing (Binder wrap): Metal sheet is pressed between the die and binder.Drawing: The metal sheet flows between the die and the punch till the end
of the drawing tools movement
Figure III.C.21 – Gravity page
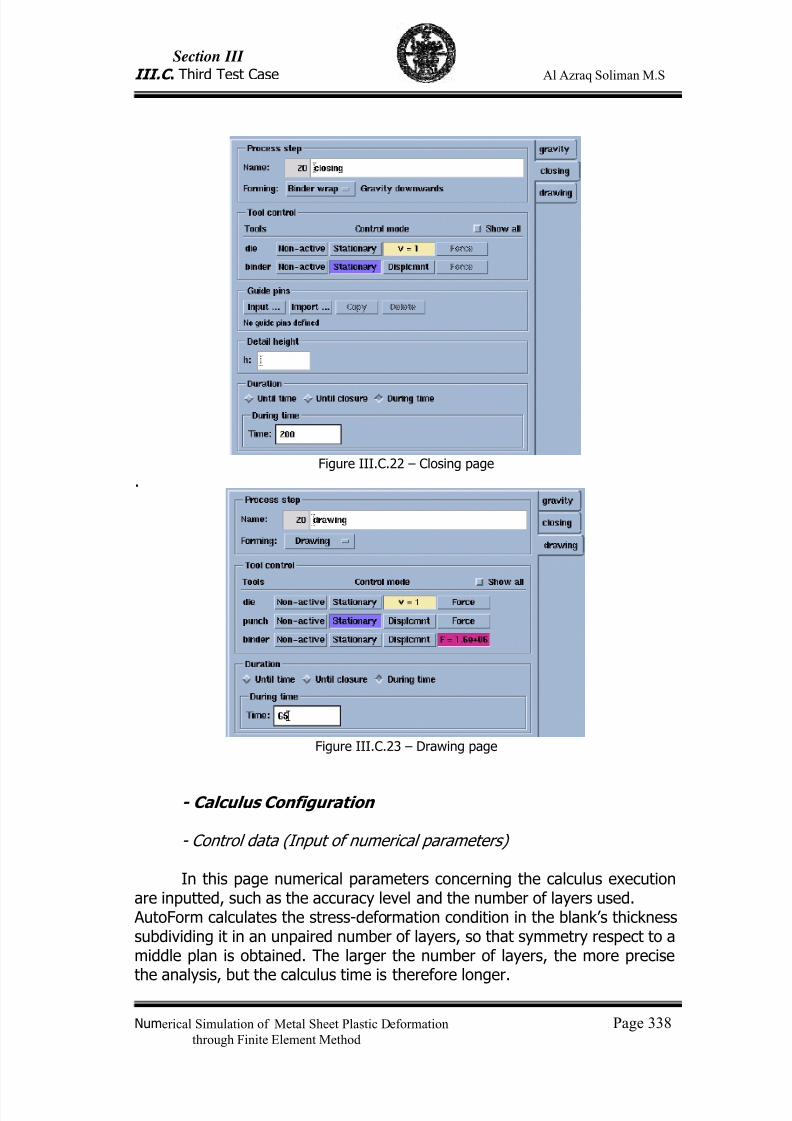
7/23/2019 Al Azraq Ingegneria Chimica Dei Materiali e Della Produzione
http://slidepdf.com/reader/full/al-azraq-ingegneria-chimica-dei-materiali-e-della-produzione 352/419
Section III
III.C . Third Test Case Al Azraq Soliman M.S
Numerical Simulation of Metal Sheet Plastic Deformation Page 338through Finite Element Method
Figure III.C.22 – Closing page
.
Figure III.C.23 – Drawing page
- Calculus Configuration
- Control data (Input of numerical parameters)
In this page numerical parameters concerning the calculus executionare inputted, such as the accuracy level and the number of layers used. AutoForm calculates the stress-deformation condition in the blank’s thicknesssubdividing it in an unpaired number of layers, so that symmetry respect to amiddle plan is obtained. The larger the number of layers, the more precise
the analysis, but the calculus time is therefore longer.
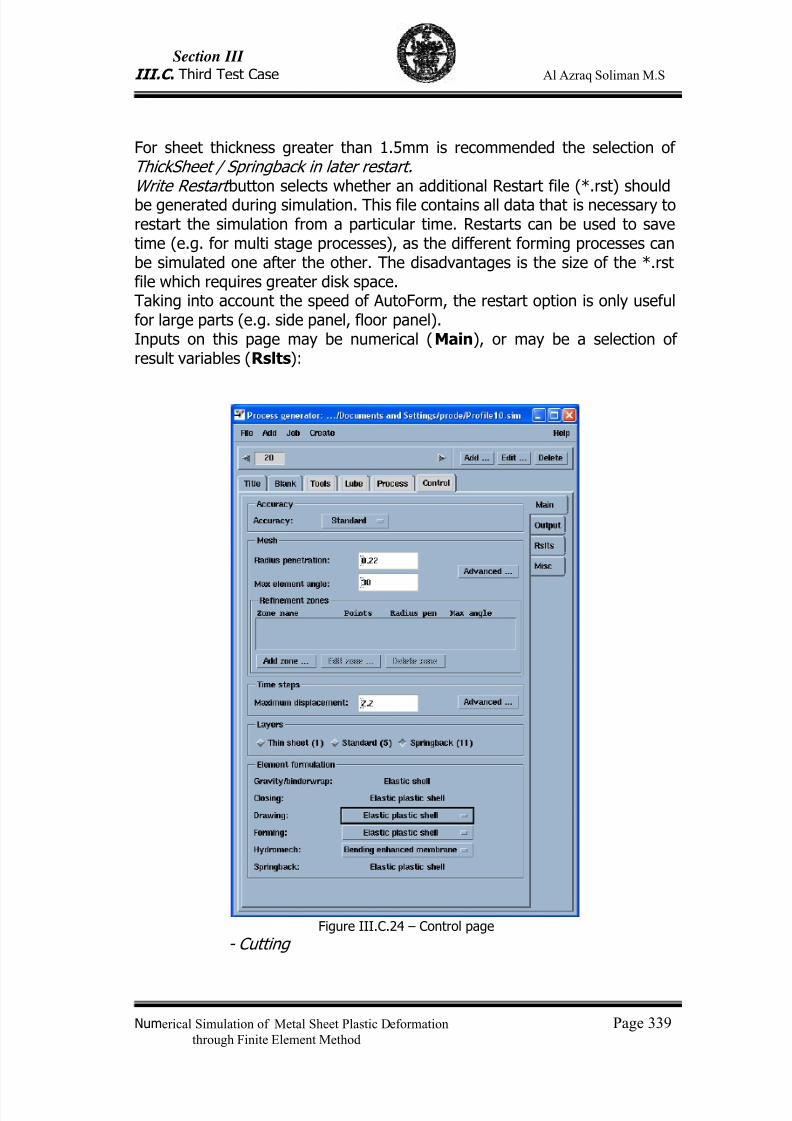
7/23/2019 Al Azraq Ingegneria Chimica Dei Materiali e Della Produzione
http://slidepdf.com/reader/full/al-azraq-ingegneria-chimica-dei-materiali-e-della-produzione 353/419
Section III
III.C . Third Test Case Al Azraq Soliman M.S
Numerical Simulation of Metal Sheet Plastic Deformation Page 339through Finite Element Method
For sheet thickness greater than 1.5mm is recommended the selection ofThickSheet / Springback in later restart. Write Restart button selects whether an additional Restart file (*.rst) shouldbe generated during simulation. This file contains all data that is necessary torestart the simulation from a particular time. Restarts can be used to savetime (e.g. for multi stage processes), as the different forming processes canbe simulated one after the other. The disadvantages is the size of the *.rstfile which requires greater disk space.Taking into account the speed of AutoForm, the restart option is only usefulfor large parts (e.g. side panel, floor panel).Inputs on this page may be numerical (Main), or may be a selection ofresult variables (Rslts):
Figure III.C.24 – Control page
- Cutting
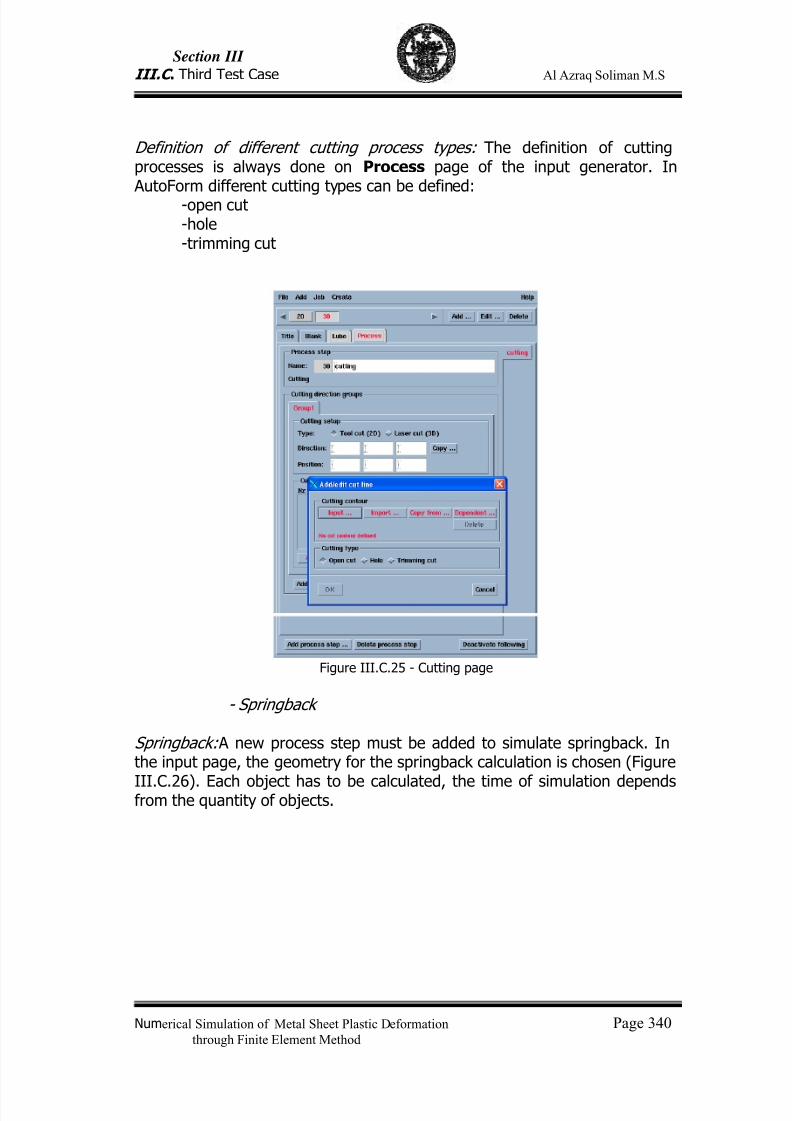
7/23/2019 Al Azraq Ingegneria Chimica Dei Materiali e Della Produzione
http://slidepdf.com/reader/full/al-azraq-ingegneria-chimica-dei-materiali-e-della-produzione 354/419
Section III
III.C . Third Test Case Al Azraq Soliman M.S
Numerical Simulation of Metal Sheet Plastic Deformation Page 340through Finite Element Method
Definition of different cutting process types: The definition of cuttingprocesses is always done on Process page of the input generator. In AutoForm different cutting types can be defined:
-open cut-hole-trimming cut
Figure III.C.25 - Cutting page
- Springback
Springback: A new process step must be added to simulate springback. Inthe input page, the geometry for the springback calculation is chosen (Figure
III.C.26). Each object has to be calculated, the time of simulation dependsfrom the quantity of objects.
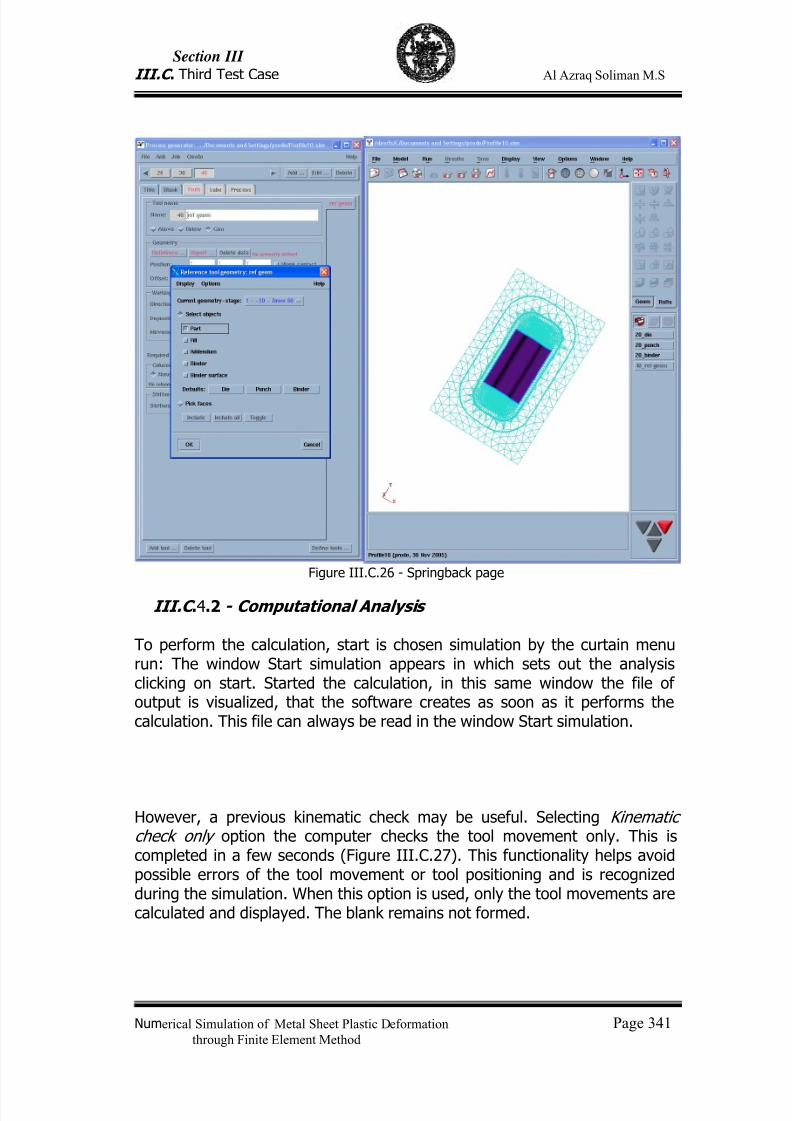
7/23/2019 Al Azraq Ingegneria Chimica Dei Materiali e Della Produzione
http://slidepdf.com/reader/full/al-azraq-ingegneria-chimica-dei-materiali-e-della-produzione 355/419
Section III
III.C . Third Test Case Al Azraq Soliman M.S
Numerical Simulation of Metal Sheet Plastic Deformation Page 341through Finite Element Method
Figure III.C.26 - Springback page
III.C .4.2 - Computational Analysis
To perform the calculation, start is chosen simulation by the curtain menurun: The window Start simulation appears in which sets out the analysisclicking on start. Started the calculation, in this same window the file ofoutput is visualized, that the software creates as soon as it performs thecalculation. This file can always be read in the window Start simulation.
However, a previous kinematic check may be useful. Selecting Kinematiccheck only option the computer checks the tool movement only. This iscompleted in a few seconds (Figure III.C.27). This functionality helps avoidpossible errors of the tool movement or tool positioning and is recognizedduring the simulation. When this option is used, only the tool movements arecalculated and displayed. The blank remains not formed.
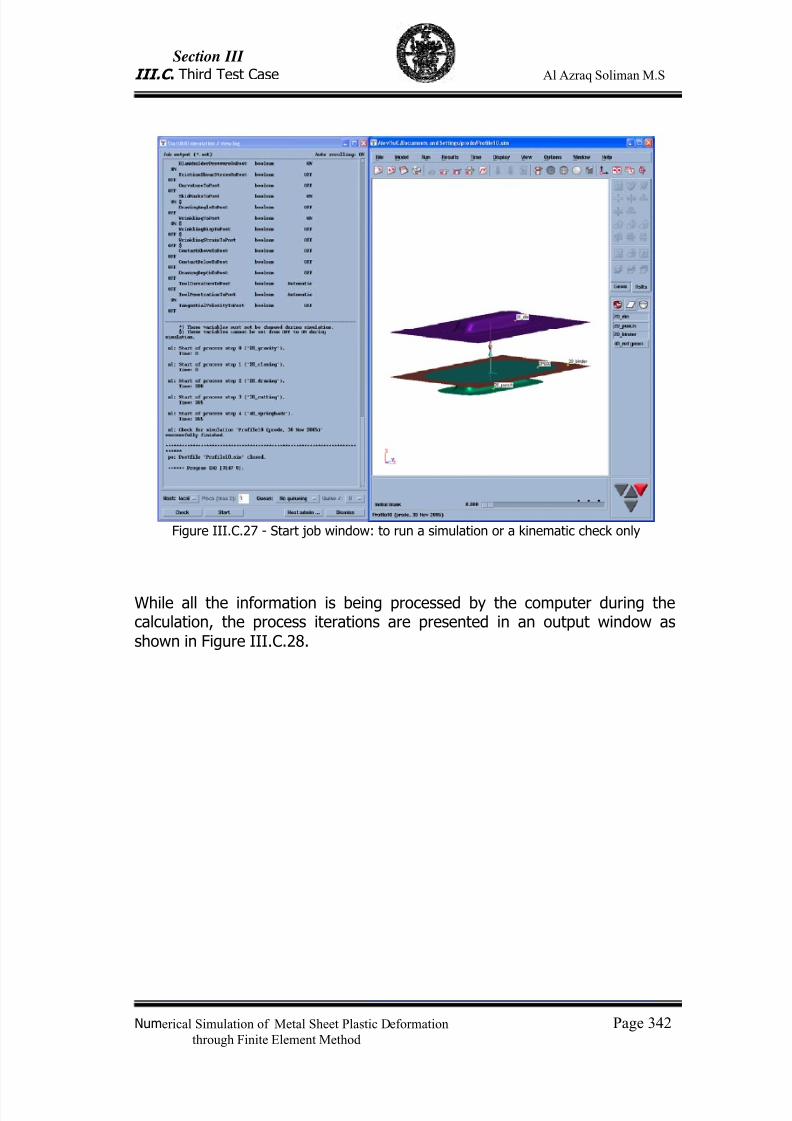
7/23/2019 Al Azraq Ingegneria Chimica Dei Materiali e Della Produzione
http://slidepdf.com/reader/full/al-azraq-ingegneria-chimica-dei-materiali-e-della-produzione 356/419
Section III
III.C . Third Test Case Al Azraq Soliman M.S
Numerical Simulation of Metal Sheet Plastic Deformation Page 342through Finite Element Method
Figure III.C.27 - Start job window: to run a simulation or a kinematic check only
While all the information is being processed by the computer during thecalculation, the process iterations are presented in an output window asshown in Figure III.C.28.
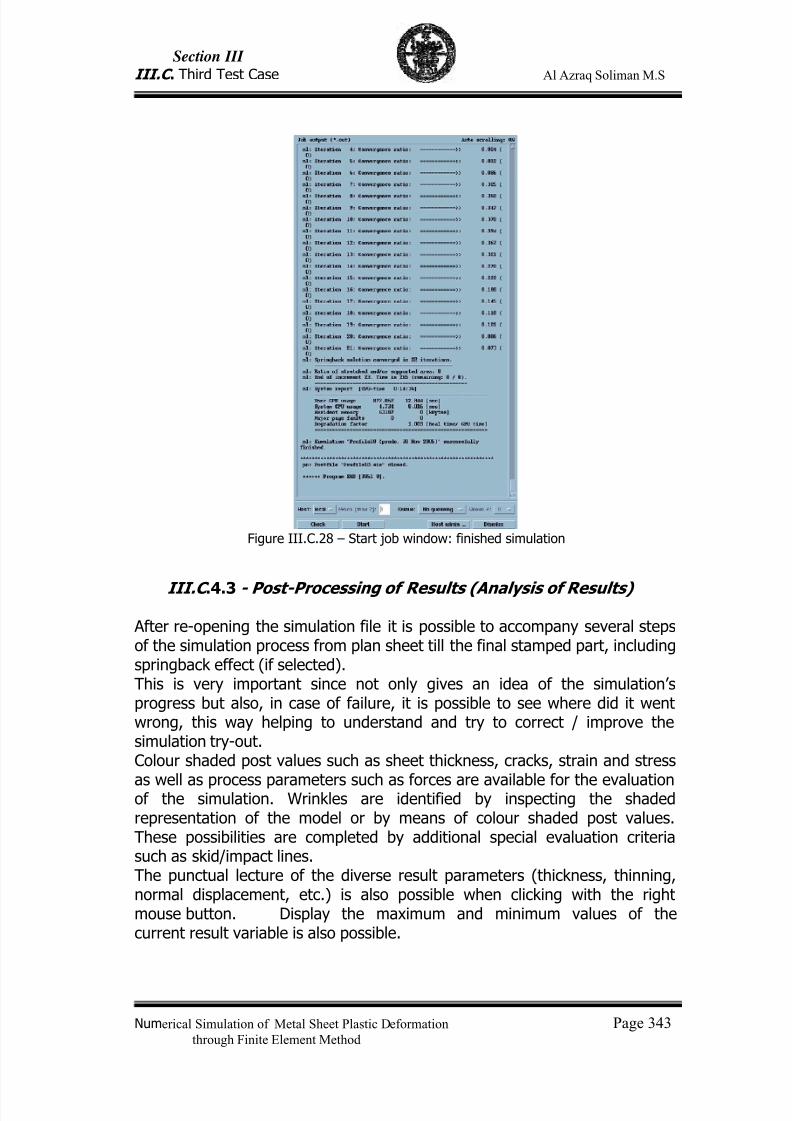
7/23/2019 Al Azraq Ingegneria Chimica Dei Materiali e Della Produzione
http://slidepdf.com/reader/full/al-azraq-ingegneria-chimica-dei-materiali-e-della-produzione 357/419
Section III
III.C . Third Test Case Al Azraq Soliman M.S
Numerical Simulation of Metal Sheet Plastic Deformation Page 343through Finite Element Method
Figure III.C.28 – Start job window: finished simulation
III.C .4.3 - Post-Processing of Results (Analysis of Results)
After re-opening the simulation file it is possible to accompany several stepsof the simulation process from plan sheet till the final stamped part, includingspringback effect (if selected).This is very important since not only gives an idea of the simulation’sprogress but also, in case of failure, it is possible to see where did it wentwrong, this way helping to understand and try to correct / improve thesimulation try-out.Colour shaded post values such as sheet thickness, cracks, strain and stress
as well as process parameters such as forces are available for the evaluationof the simulation. Wrinkles are identified by inspecting the shadedrepresentation of the model or by means of colour shaded post values.These possibilities are completed by additional special evaluation criteriasuch as skid/impact lines.The punctual lecture of the diverse result parameters (thickness, thinning,normal displacement, etc.) is also possible when clicking with the rightmouse button. Display the maximum and minimum values of thecurrent result variable is also possible.
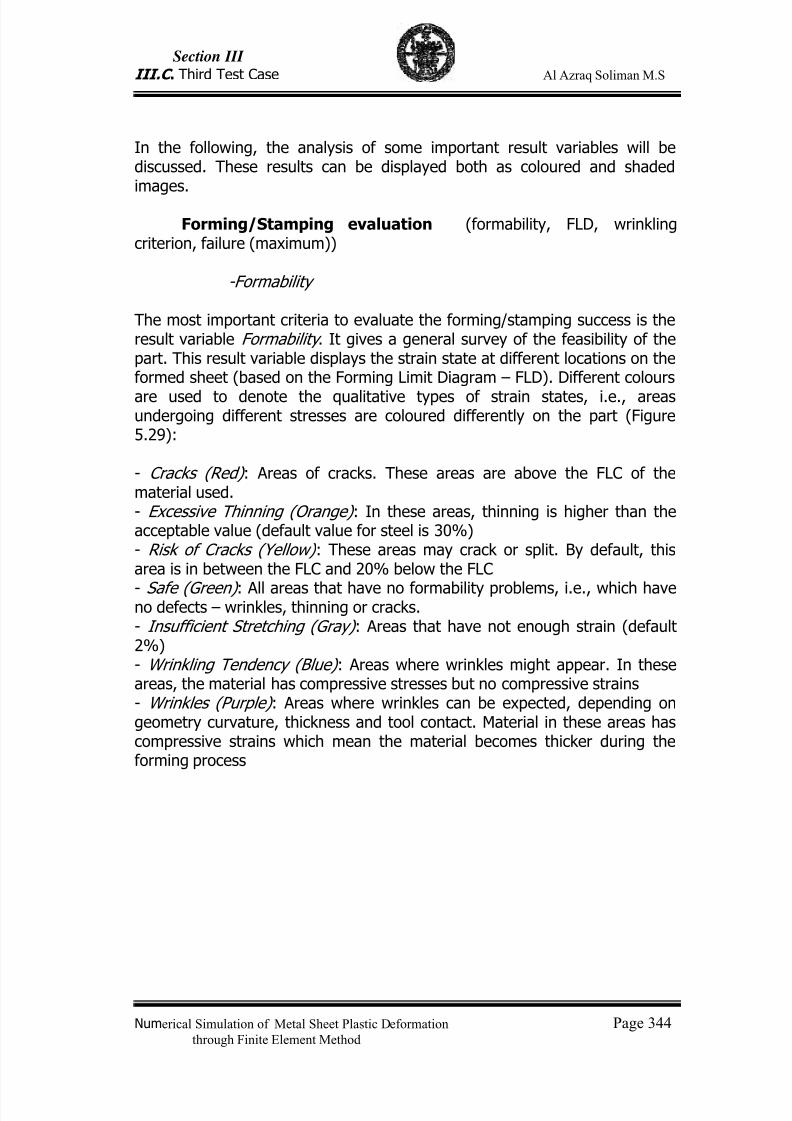
7/23/2019 Al Azraq Ingegneria Chimica Dei Materiali e Della Produzione
http://slidepdf.com/reader/full/al-azraq-ingegneria-chimica-dei-materiali-e-della-produzione 358/419
Section III
III.C . Third Test Case Al Azraq Soliman M.S
Numerical Simulation of Metal Sheet Plastic Deformation Page 344through Finite Element Method
In the following, the analysis of some important result variables will bediscussed. These results can be displayed both as coloured and shadedimages.
Forming/Stamping evaluation (formability, FLD, wrinklingcriterion, failure (maximum))
-Formability
The most important criteria to evaluate the forming/stamping success is theresult variable Formability . It gives a general survey of the feasibility of thepart. This result variable displays the strain state at different locations on theformed sheet (based on the Forming Limit Diagram – FLD). Different colours
are used to denote the qualitative types of strain states, i.e., areasundergoing different stresses are coloured differently on the part (Figure5.29):
- Cracks (Red) : Areas of cracks. These areas are above the FLC of thematerial used.- Excessive Thinning (Orange) : In these areas, thinning is higher than theacceptable value (default value for steel is 30%)- Risk of Cracks (Yellow) : These areas may crack or split. By default, thisarea is in between the FLC and 20% below the FLC
- Safe (Green) : All areas that have no formability problems, i.e., which haveno defects – wrinkles, thinning or cracks.- Insufficient Stretching (Gray) : Areas that have not enough strain (default2%)- Wrinkling Tendency (Blue) : Areas where wrinkles might appear. In theseareas, the material has compressive stresses but no compressive strains- Wrinkles (Purple) : Areas where wrinkles can be expected, depending ongeometry curvature, thickness and tool contact. Material in these areas hascompressive strains which mean the material becomes thicker during theforming process
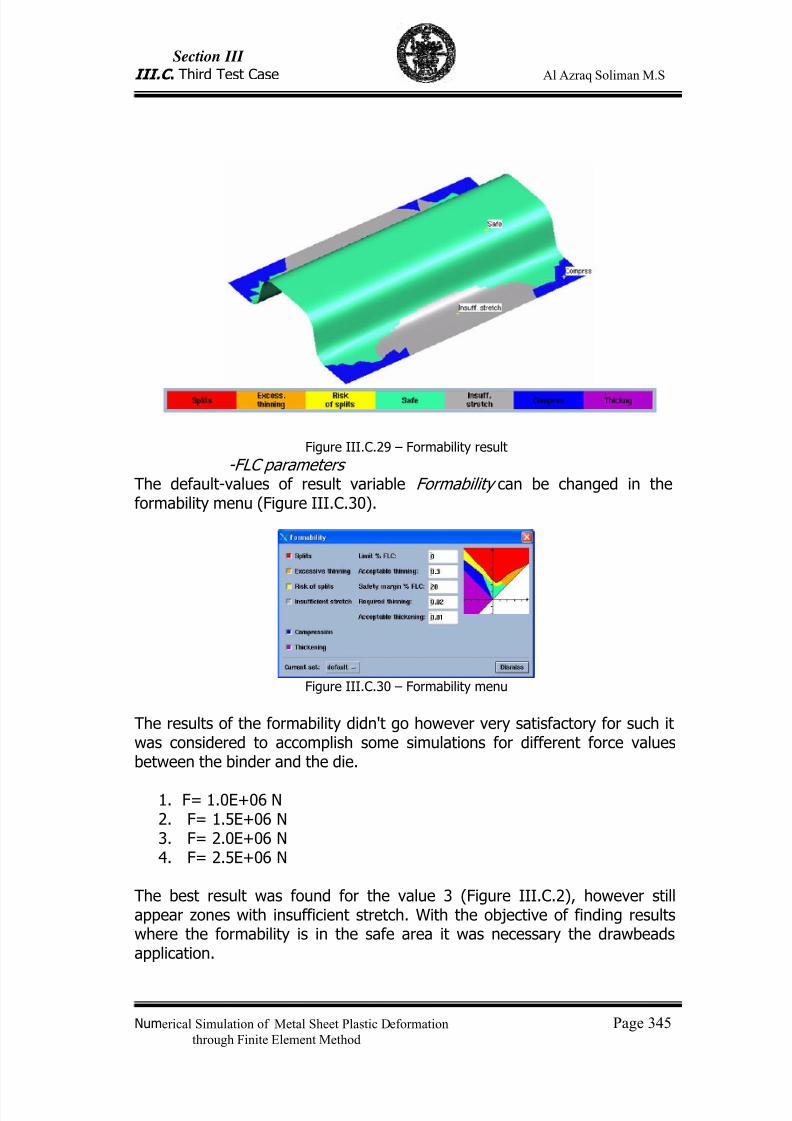
7/23/2019 Al Azraq Ingegneria Chimica Dei Materiali e Della Produzione
http://slidepdf.com/reader/full/al-azraq-ingegneria-chimica-dei-materiali-e-della-produzione 359/419
Section III
III.C . Third Test Case Al Azraq Soliman M.S
Numerical Simulation of Metal Sheet Plastic Deformation Page 345through Finite Element Method
Figure III.C.29 – Formability result
-FLC parametersThe default-values of result variable Formability can be changed in theformability menu (Figure III.C.30).
Figure III.C.30 – Formability menu
The results of the formability didn't go however very satisfactory for such itwas considered to accomplish some simulations for different force valuesbetween the binder and the die.
1. F= 1.0E+06 N2. F= 1.5E+06 N3. F= 2.0E+06 N4. F= 2.5E+06 N
The best result was found for the value 3 (Figure III.C.2), however stillappear zones with insufficient stretch. With the objective of finding resultswhere the formability is in the safe area it was necessary the drawbeadsapplication.
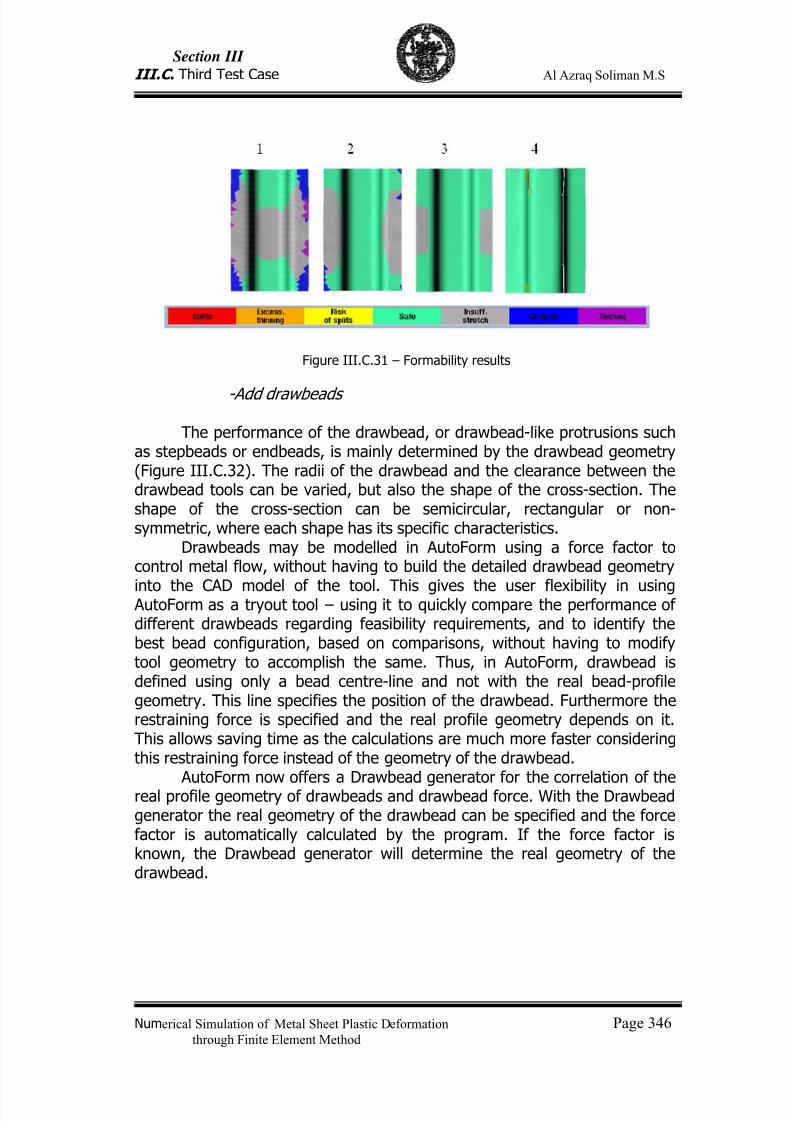
7/23/2019 Al Azraq Ingegneria Chimica Dei Materiali e Della Produzione
http://slidepdf.com/reader/full/al-azraq-ingegneria-chimica-dei-materiali-e-della-produzione 360/419
Section III
III.C . Third Test Case Al Azraq Soliman M.S
Numerical Simulation of Metal Sheet Plastic Deformation Page 346through Finite Element Method
Figure III.C.31 – Formability results
-Add drawbeads
The performance of the drawbead, or drawbead-like protrusions suchas stepbeads or endbeads, is mainly determined by the drawbead geometry(Figure III.C.32). The radii of the drawbead and the clearance between thedrawbead tools can be varied, but also the shape of the cross-section. Theshape of the cross-section can be semicircular, rectangular or non-symmetric, where each shape has its specific characteristics.
Drawbeads may be modelled in AutoForm using a force factor tocontrol metal flow, without having to build the detailed drawbead geometry
into the CAD model of the tool. This gives the user flexibility in using AutoForm as a tryout tool – using it to quickly compare the performance ofdifferent drawbeads regarding feasibility requirements, and to identify thebest bead configuration, based on comparisons, without having to modifytool geometry to accomplish the same. Thus, in AutoForm, drawbead isdefined using only a bead centre-line and not with the real bead-profilegeometry. This line specifies the position of the drawbead. Furthermore therestraining force is specified and the real profile geometry depends on it.This allows saving time as the calculations are much more faster consideringthis restraining force instead of the geometry of the drawbead.
AutoForm now offers a Drawbead generator for the correlation of thereal profile geometry of drawbeads and drawbead force. With the Drawbeadgenerator the real geometry of the drawbead can be specified and the forcefactor is automatically calculated by the program. If the force factor isknown, the Drawbead generator will determine the real geometry of thedrawbead.
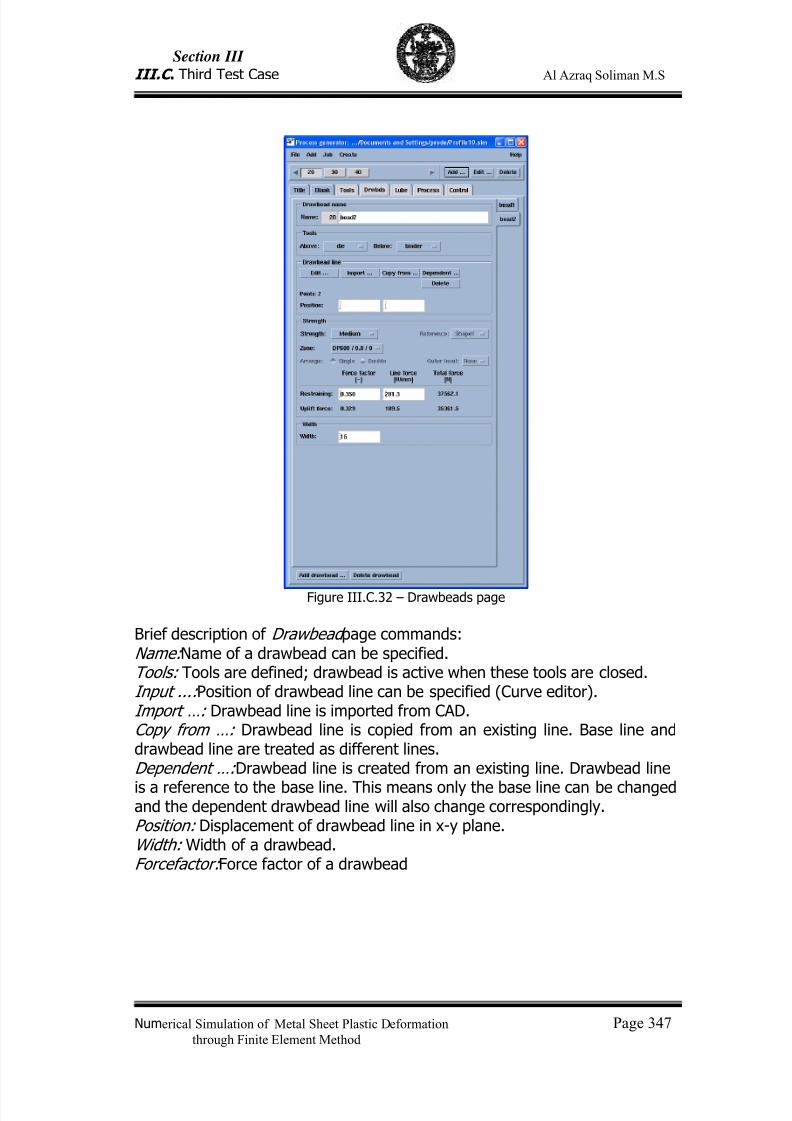
7/23/2019 Al Azraq Ingegneria Chimica Dei Materiali e Della Produzione
http://slidepdf.com/reader/full/al-azraq-ingegneria-chimica-dei-materiali-e-della-produzione 361/419
Section III
III.C . Third Test Case Al Azraq Soliman M.S
Numerical Simulation of Metal Sheet Plastic Deformation Page 347through Finite Element Method
Figure III.C.32 – Drawbeads page
Brief description of Drawbead page commands:Name: Name of a drawbead can be specified.Tools: Tools are defined; drawbead is active when these tools are closed.Input ...: Position of drawbead line can be specified (Curve editor).Import …: Drawbead line is imported from CAD.Copy from …: Drawbead line is copied from an existing line. Base line anddrawbead line are treated as different lines.Dependent …: Drawbead line is created from an existing line. Drawbead line
is a reference to the base line. This means only the base line can be changedand the dependent drawbead line will also change correspondingly.Position: Displacement of drawbead line in x-y plane.Width: Width of a drawbead.Forcefactor: Force factor of a drawbead
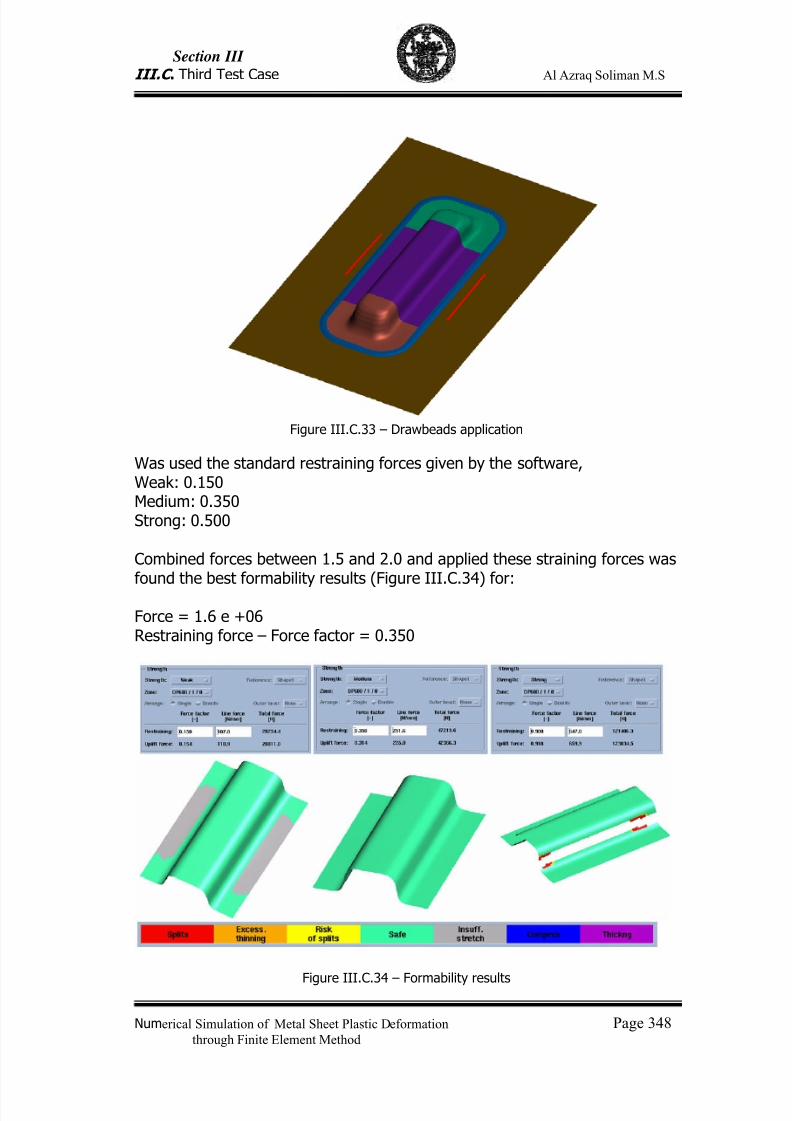
7/23/2019 Al Azraq Ingegneria Chimica Dei Materiali e Della Produzione
http://slidepdf.com/reader/full/al-azraq-ingegneria-chimica-dei-materiali-e-della-produzione 362/419
Section III
III.C . Third Test Case Al Azraq Soliman M.S
Numerical Simulation of Metal Sheet Plastic Deformation Page 348through Finite Element Method
Figure III.C.33 – Drawbeads application
Was used the standard restraining forces given by the software,Weak: 0.150Medium: 0.350Strong: 0.500
Combined forces between 1.5 and 2.0 and applied these straining forces wasfound the best formability results (Figure III.C.34) for:
Force = 1.6 e +06Restraining force – Force factor = 0.350
Figure III.C.34 – Formability results
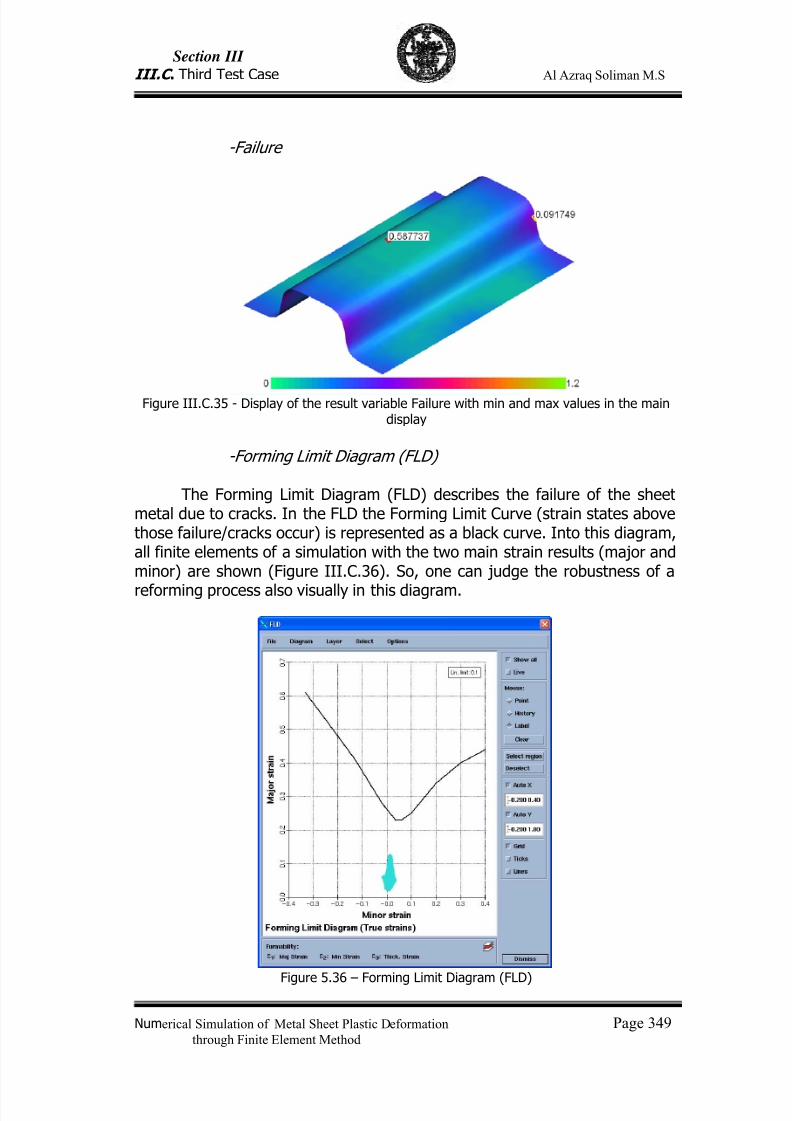
7/23/2019 Al Azraq Ingegneria Chimica Dei Materiali e Della Produzione
http://slidepdf.com/reader/full/al-azraq-ingegneria-chimica-dei-materiali-e-della-produzione 363/419
Section III
III.C . Third Test Case Al Azraq Soliman M.S
Numerical Simulation of Metal Sheet Plastic Deformation Page 349through Finite Element Method
-Failure
Figure III.C.35 - Display of the result variable Failure with min and max values in the maindisplay
-Forming Limit Diagram (FLD)
The Forming Limit Diagram (FLD) describes the failure of the sheetmetal due to cracks. In the FLD the Forming Limit Curve (strain states abovethose failure/cracks occur) is represented as a black curve. Into this diagram,all finite elements of a simulation with the two main strain results (major andminor) are shown (Figure III.C.36). So, one can judge the robustness of a
reforming process also visually in this diagram.
Figure 5.36 – Forming Limit Diagram (FLD)
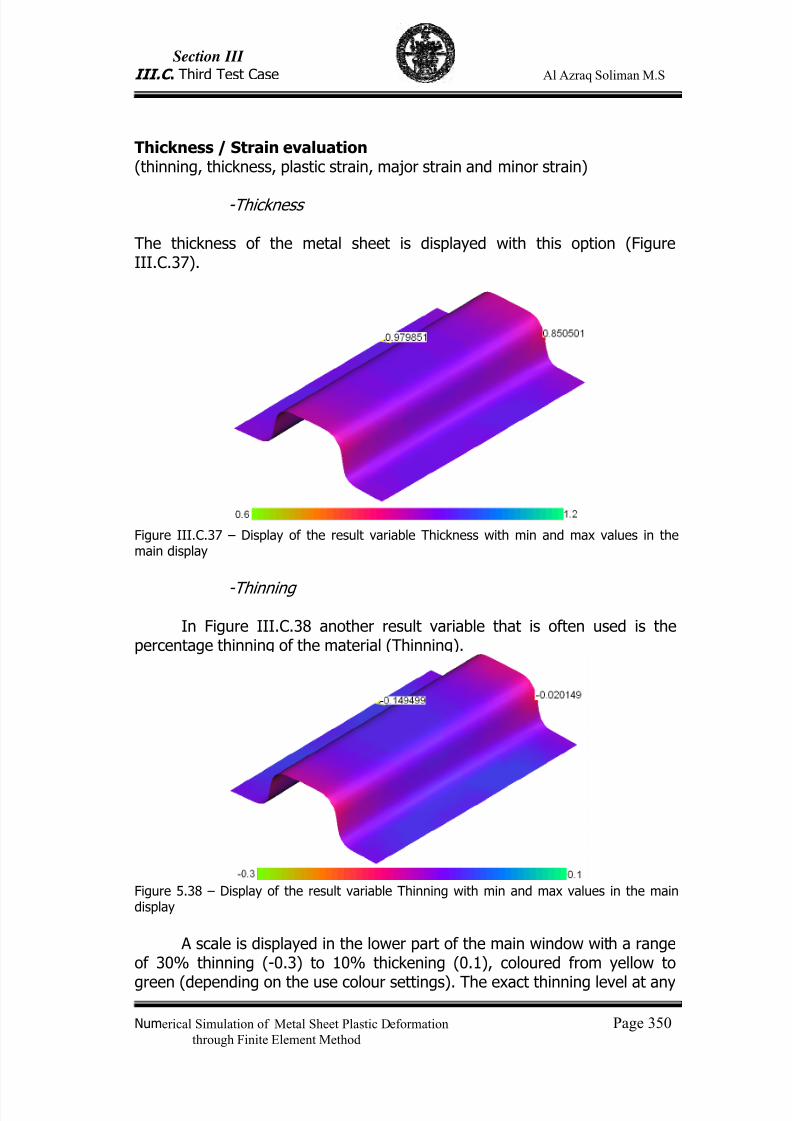
7/23/2019 Al Azraq Ingegneria Chimica Dei Materiali e Della Produzione
http://slidepdf.com/reader/full/al-azraq-ingegneria-chimica-dei-materiali-e-della-produzione 364/419
Section III
III.C . Third Test Case Al Azraq Soliman M.S
Numerical Simulation of Metal Sheet Plastic Deformation Page 350through Finite Element Method
Thickness / Strain evaluation(thinning, thickness, plastic strain, major strain and minor strain)
-Thickness
The thickness of the metal sheet is displayed with this option (FigureIII.C.37).
Figure III.C.37 – Display of the result variable Thickness with min and max values in themain display
-Thinning
In Figure III.C.38 another result variable that is often used is thepercentage thinning of the material (Thinning).
Figure 5.38 – Display of the result variable Thinning with min and max values in the maindisplay
A scale is displayed in the lower part of the main window with a rangeof 30% thinning (-0.3) to 10% thickening (0.1), coloured from yellow to
green (depending on the use colour settings). The exact thinning level at any
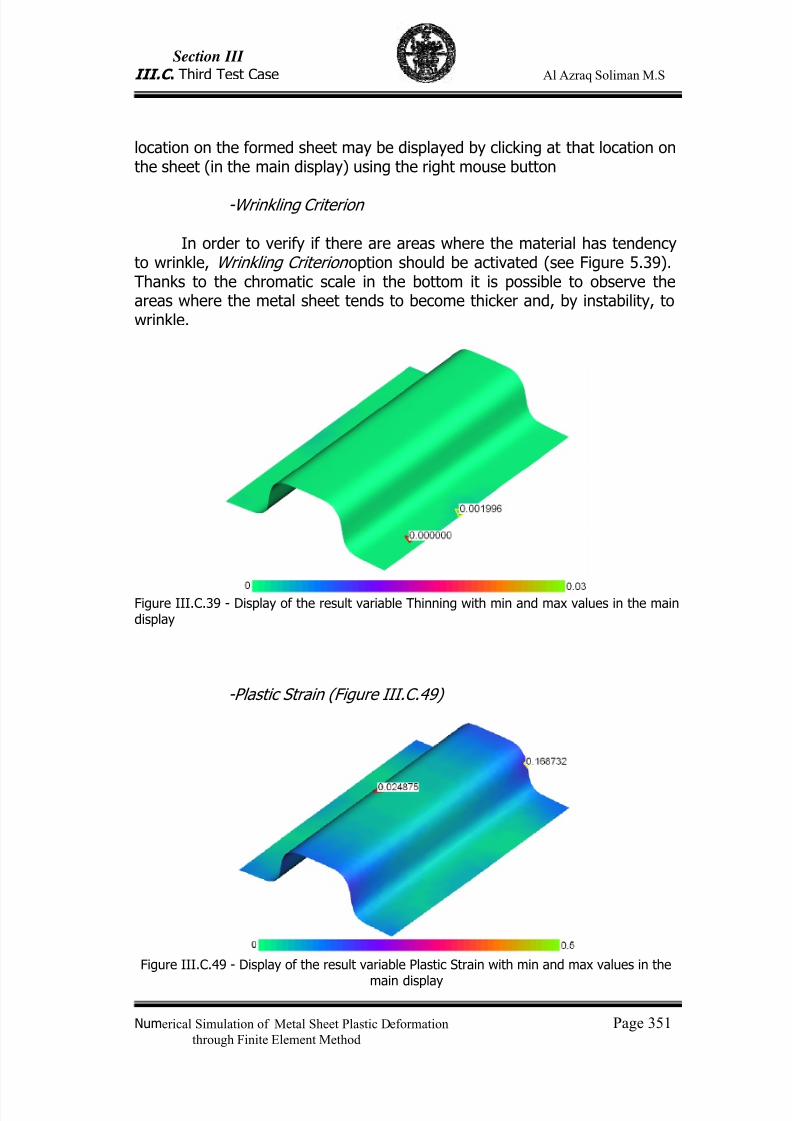
7/23/2019 Al Azraq Ingegneria Chimica Dei Materiali e Della Produzione
http://slidepdf.com/reader/full/al-azraq-ingegneria-chimica-dei-materiali-e-della-produzione 365/419
Section III
III.C . Third Test Case Al Azraq Soliman M.S
Numerical Simulation of Metal Sheet Plastic Deformation Page 351through Finite Element Method
location on the formed sheet may be displayed by clicking at that location onthe sheet (in the main display) using the right mouse button
-Wrinkling Criterion
In order to verify if there are areas where the material has tendencyto wrinkle, Wrinkling Criterion option should be activated (see Figure 5.39).Thanks to the chromatic scale in the bottom it is possible to observe theareas where the metal sheet tends to become thicker and, by instability, towrinkle.
Figure III.C.39 - Display of the result variable Thinning with min and max values in the maindisplay
-Plastic Strain (Figure III.C.49)
Figure III.C.49 - Display of the result variable Plastic Strain with min and max values in the
main display
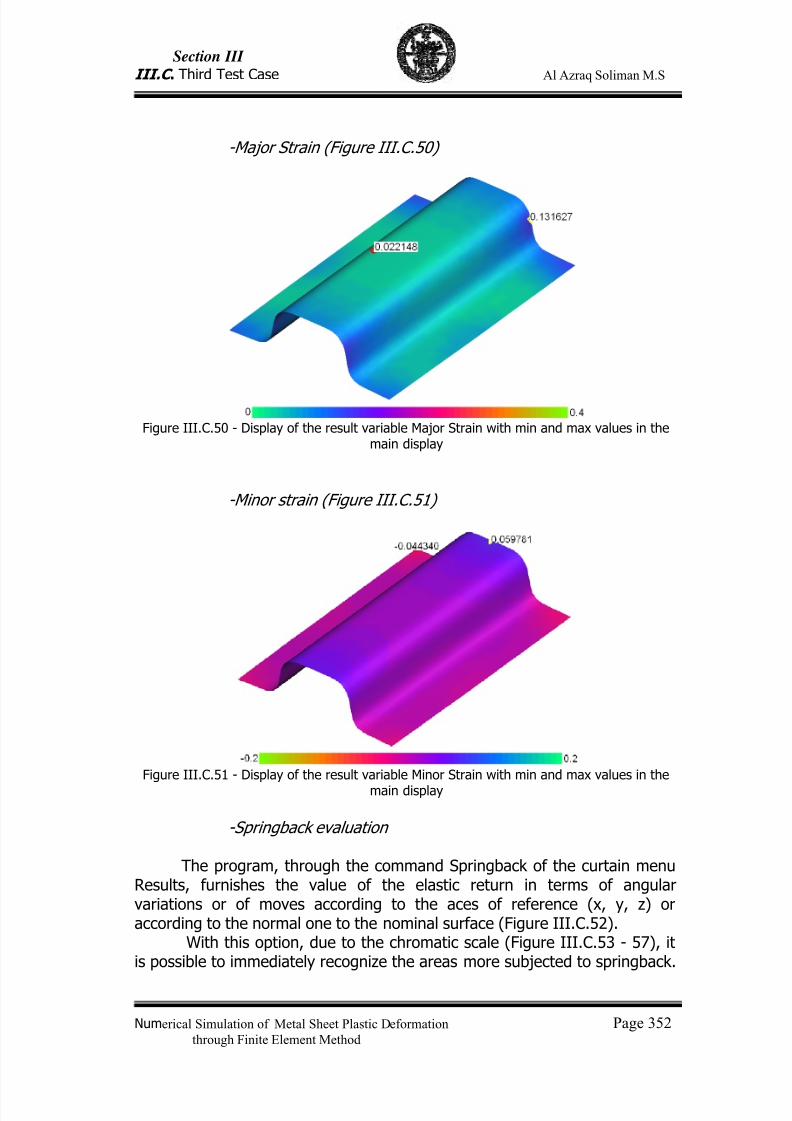
7/23/2019 Al Azraq Ingegneria Chimica Dei Materiali e Della Produzione
http://slidepdf.com/reader/full/al-azraq-ingegneria-chimica-dei-materiali-e-della-produzione 366/419
Section III
III.C . Third Test Case Al Azraq Soliman M.S
Numerical Simulation of Metal Sheet Plastic Deformation Page 352through Finite Element Method
-Major Strain (Figure III.C.50)
Figure III.C.50 - Display of the result variable Major Strain with min and max values in themain display
-Minor strain (Figure III.C.51)
Figure III.C.51 - Display of the result variable Minor Strain with min and max values in the
main display
-Springback evaluation
The program, through the command Springback of the curtain menuResults, furnishes the value of the elastic return in terms of angularvariations or of moves according to the aces of reference (x, y, z) oraccording to the normal one to the nominal surface (Figure III.C.52).
With this option, due to the chromatic scale (Figure III.C.53 - 57), itis possible to immediately recognize the areas more subjected to springback.
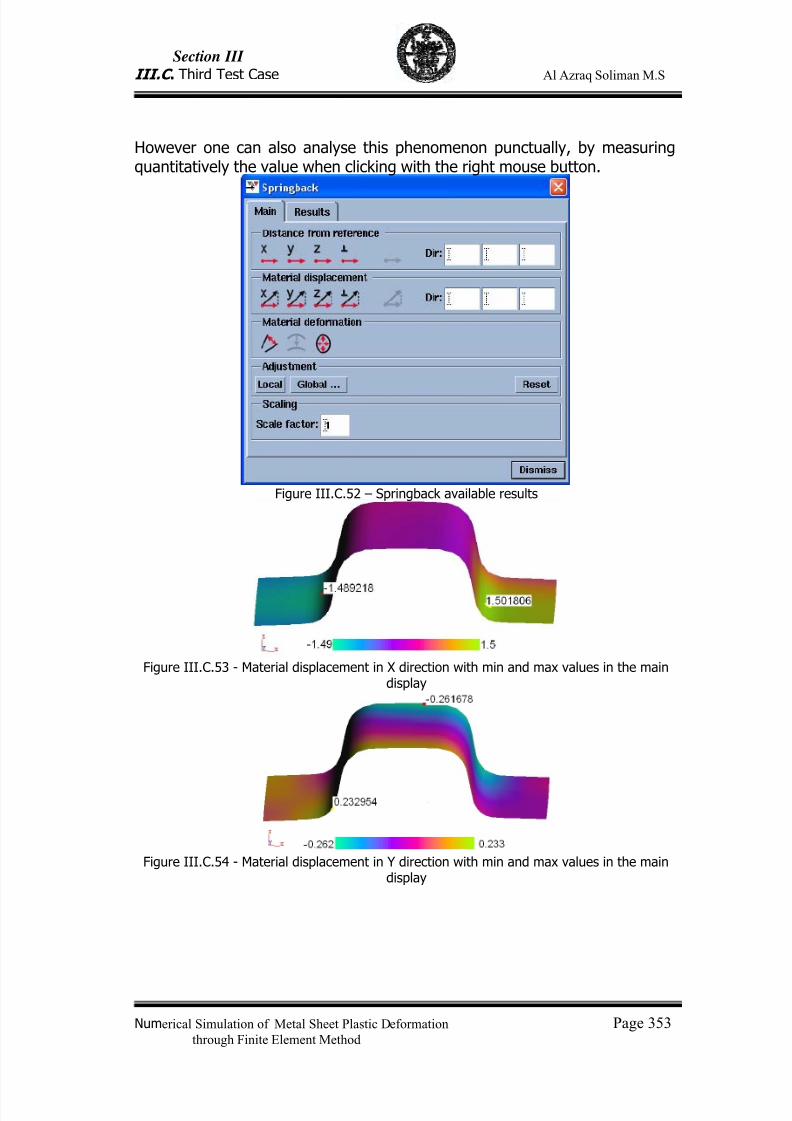
7/23/2019 Al Azraq Ingegneria Chimica Dei Materiali e Della Produzione
http://slidepdf.com/reader/full/al-azraq-ingegneria-chimica-dei-materiali-e-della-produzione 367/419
Section III
III.C . Third Test Case Al Azraq Soliman M.S
Numerical Simulation of Metal Sheet Plastic Deformation Page 353through Finite Element Method
However one can also analyse this phenomenon punctually, by measuringquantitatively the value when clicking with the right mouse button.
Figure III.C.52 – Springback available results
Figure III.C.53 - Material displacement in X direction with min and max values in the maindisplay
Figure III.C.54 - Material displacement in Y direction with min and max values in the maindisplay
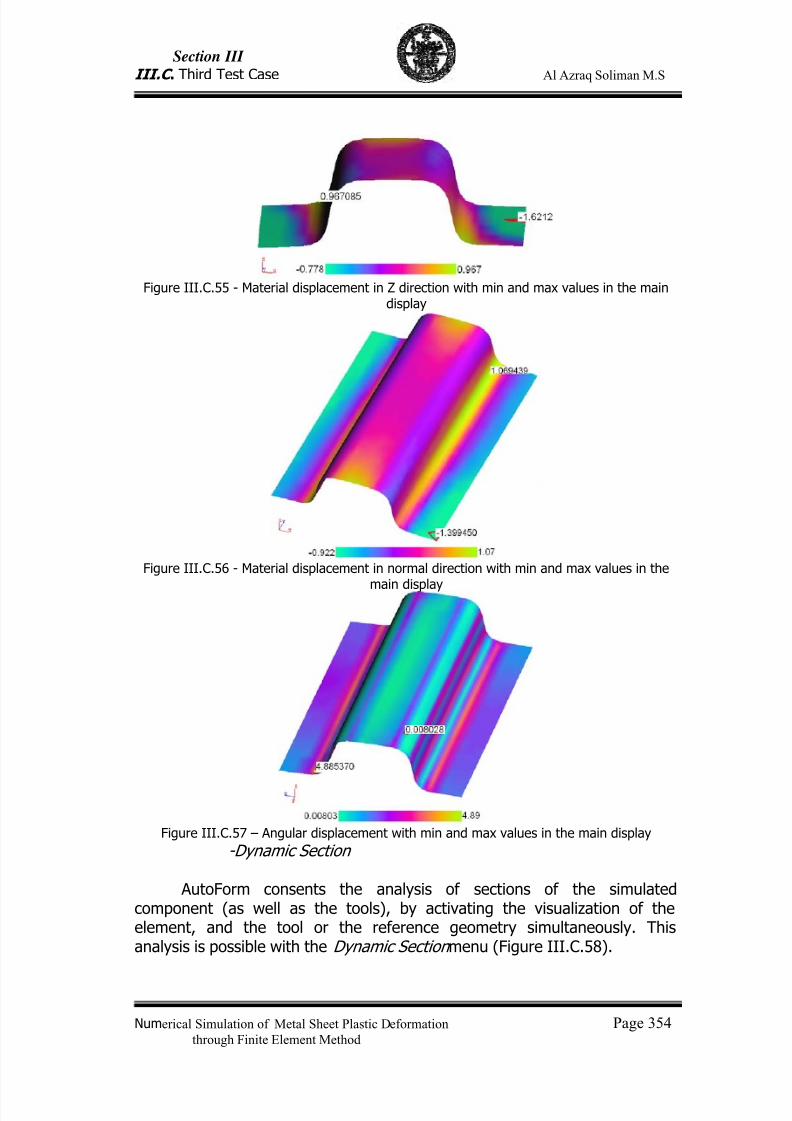
7/23/2019 Al Azraq Ingegneria Chimica Dei Materiali e Della Produzione
http://slidepdf.com/reader/full/al-azraq-ingegneria-chimica-dei-materiali-e-della-produzione 368/419
Section III
III.C . Third Test Case Al Azraq Soliman M.S
Numerical Simulation of Metal Sheet Plastic Deformation Page 354through Finite Element Method
Figure III.C.55 - Material displacement in Z direction with min and max values in the maindisplay
Figure III.C.56 - Material displacement in normal direction with min and max values in the
main display
Figure III.C.57 – Angular displacement with min and max values in the main display
-Dynamic Section
AutoForm consents the analysis of sections of the simulatedcomponent (as well as the tools), by activating the visualization of theelement, and the tool or the reference geometry simultaneously. Thisanalysis is possible with the Dynamic Section menu (Figure III.C.58).
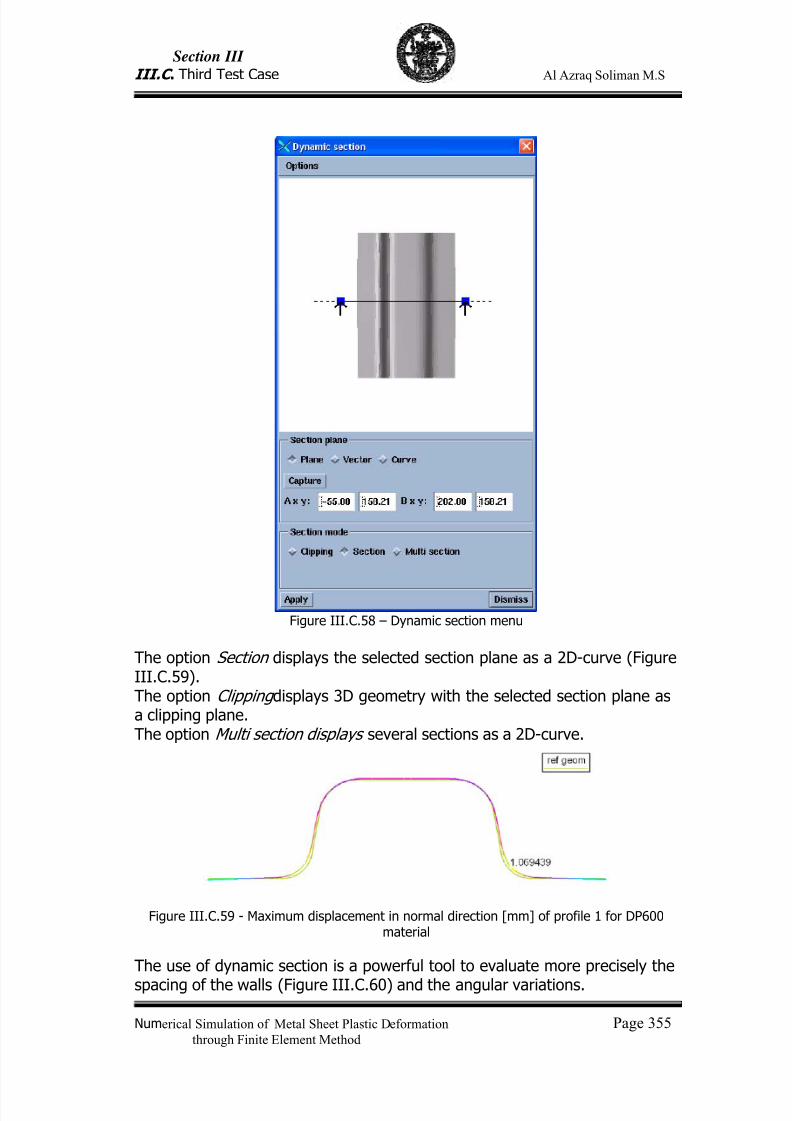
7/23/2019 Al Azraq Ingegneria Chimica Dei Materiali e Della Produzione
http://slidepdf.com/reader/full/al-azraq-ingegneria-chimica-dei-materiali-e-della-produzione 369/419
Section III
III.C . Third Test Case Al Azraq Soliman M.S
Numerical Simulation of Metal Sheet Plastic Deformation Page 355through Finite Element Method
Figure III.C.58 – Dynamic section menu
The option Section displays the selected section plane as a 2D-curve (FigureIII.C.59).The option Clipping displays 3D geometry with the selected section plane asa clipping plane.The option Multi section displays several sections as a 2D-curve.
Figure III.C.59 - Maximum displacement in normal direction [mm] of profile 1 for DP600material
The use of dynamic section is a powerful tool to evaluate more precisely the
spacing of the walls (Figure III.C.60) and the angular variations.
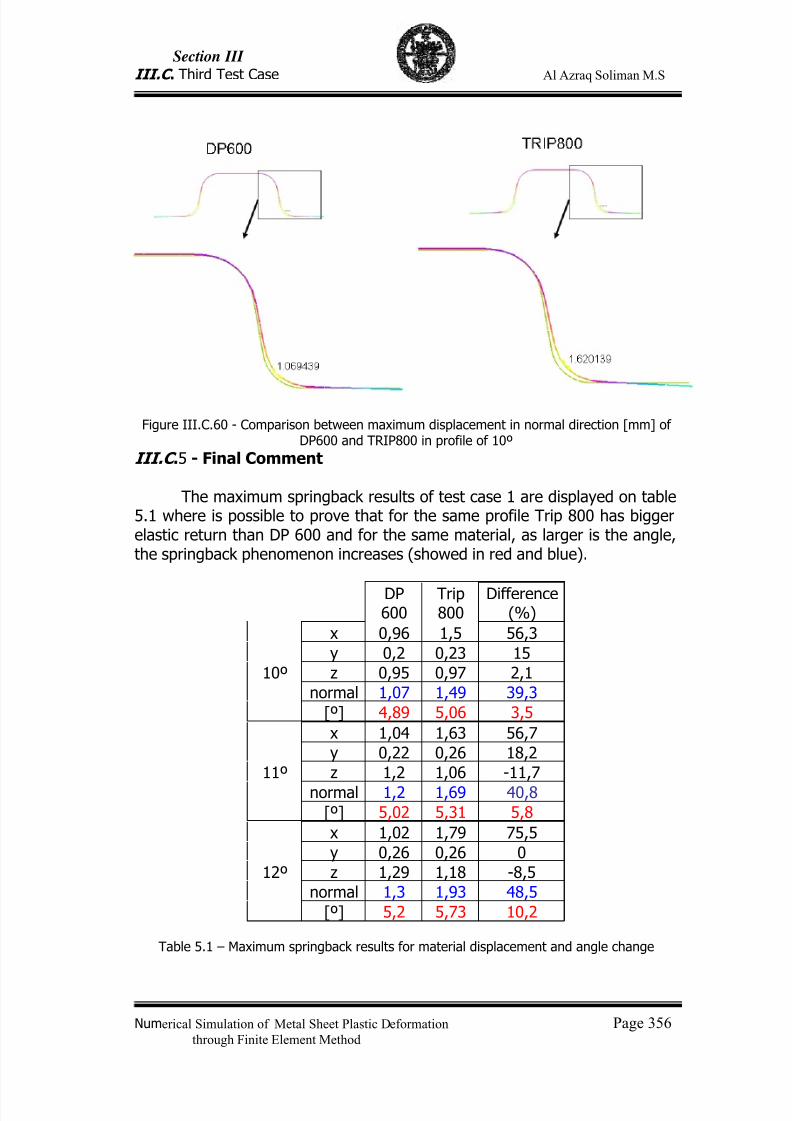
7/23/2019 Al Azraq Ingegneria Chimica Dei Materiali e Della Produzione
http://slidepdf.com/reader/full/al-azraq-ingegneria-chimica-dei-materiali-e-della-produzione 370/419
Section III
III.C . Third Test Case Al Azraq Soliman M.S
Numerical Simulation of Metal Sheet Plastic Deformation Page 356through Finite Element Method
Figure III.C.60 - Comparison between maximum displacement in normal direction [mm] ofDP600 and TRIP800 in profile of 10º
III.C .5 - Final Comment
The maximum springback results of test case 1 are displayed on table5.1 where is possible to prove that for the same profile Trip 800 has biggerelastic return than DP 600 and for the same material, as larger is the angle,the springback phenomenon increases (showed in red and blue).
DP600
Trip800
Difference(%)
x 0,96 1,5 56,3
y 0,2 0,23 15
10º z 0,95 0,97 2,1
normal 1,07 1,49 39,3
[º] 4,89 5,06 3,5
x 1,04 1,63 56,7
y 0,22 0,26 18,2
11º z 1,2 1,06 -11,7
normal 1,2 1,69 40,8
[º] 5,02 5,31 5,8
x 1,02 1,79 75,5
y 0,26 0,26 0
12º z 1,29 1,18 -8,5
normal 1,3 1,93 48,5
[º] 5,2 5,73 10,2
Table 5.1 – Maximum springback results for material displacement and angle change

7/23/2019 Al Azraq Ingegneria Chimica Dei Materiali e Della Produzione
http://slidepdf.com/reader/full/al-azraq-ingegneria-chimica-dei-materiali-e-della-produzione 371/419
Section III.D
The fourth project, A test case was the stamping simulation of alateral longeron for the Group Fiat. For that was considered
eleven different profiles differing in angular variations realizedwith DP600 material.
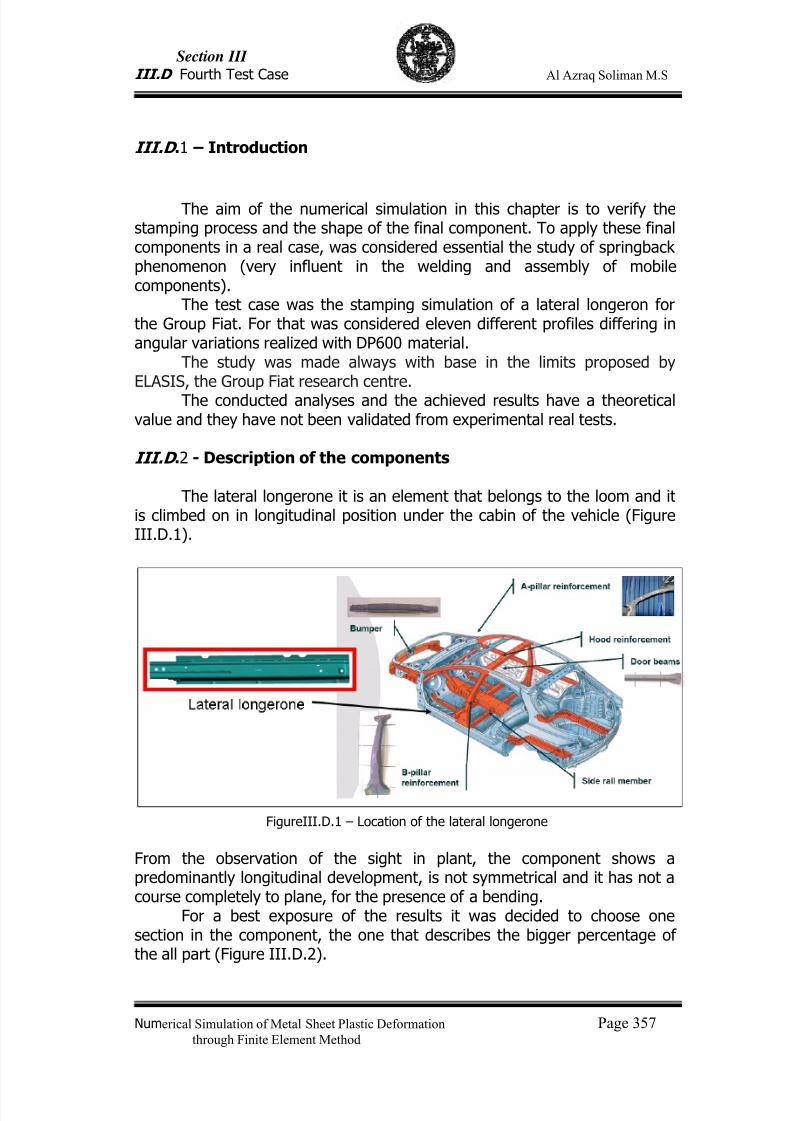
7/23/2019 Al Azraq Ingegneria Chimica Dei Materiali e Della Produzione
http://slidepdf.com/reader/full/al-azraq-ingegneria-chimica-dei-materiali-e-della-produzione 372/419
Section III
III.D Fourth Test Case Al Azraq Soliman M.S
Numerical Simulation of Metal Sheet Plastic Deformation Page 357through Finite Element Method
III.D .1 – Introduction
The aim of the numerical simulation in this chapter is to verify thestamping process and the shape of the final component. To apply these finalcomponents in a real case, was considered essential the study of springbackphenomenon (very influent in the welding and assembly of mobilecomponents).
The test case was the stamping simulation of a lateral longeron forthe Group Fiat. For that was considered eleven different profiles differing inangular variations realized with DP600 material.
The study was made always with base in the limits proposed byELASIS, the Group Fiat research centre.
The conducted analyses and the achieved results have a theoreticalvalue and they have not been validated from experimental real tests.
III.D .2 - Description of the components
The lateral longerone it is an element that belongs to the loom and itis climbed on in longitudinal position under the cabin of the vehicle (FigureIII.D.1).
FigureIII.D.1 – Location of the lateral longerone
From the observation of the sight in plant, the component shows apredominantly longitudinal development, is not symmetrical and it has not acourse completely to plane, for the presence of a bending.
For a best exposure of the results it was decided to choose onesection in the component, the one that describes the bigger percentage ofthe all part (Figure III.D.2).
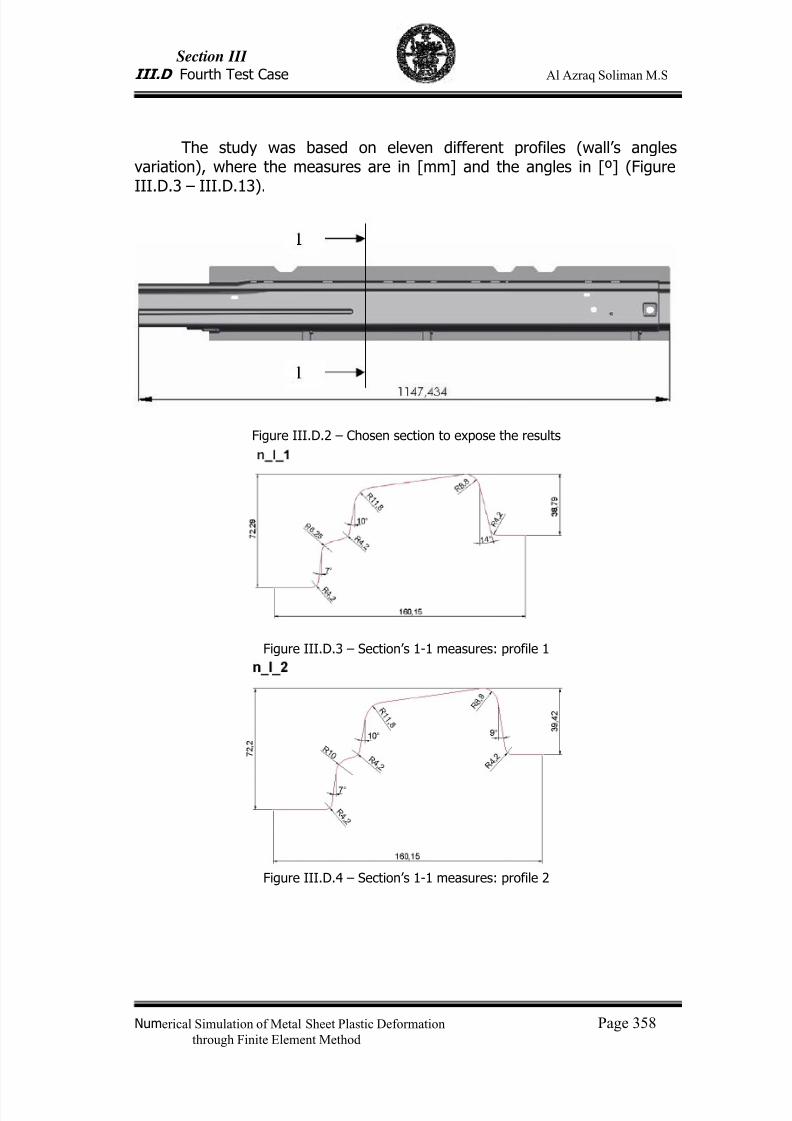
7/23/2019 Al Azraq Ingegneria Chimica Dei Materiali e Della Produzione
http://slidepdf.com/reader/full/al-azraq-ingegneria-chimica-dei-materiali-e-della-produzione 373/419
Section III
III.D Fourth Test Case Al Azraq Soliman M.S
Numerical Simulation of Metal Sheet Plastic Deformation Page 358through Finite Element Method
The study was based on eleven different profiles (wall’s anglesvariation), where the measures are in [mm] and the angles in [º] (FigureIII.D.3 – III.D.13).
Figure III.D.2 – Chosen section to expose the results
Figure III.D.3 – Section’s 1-1 measures: profile 1
Figure III.D.4 – Section’s 1-1 measures: profile 2
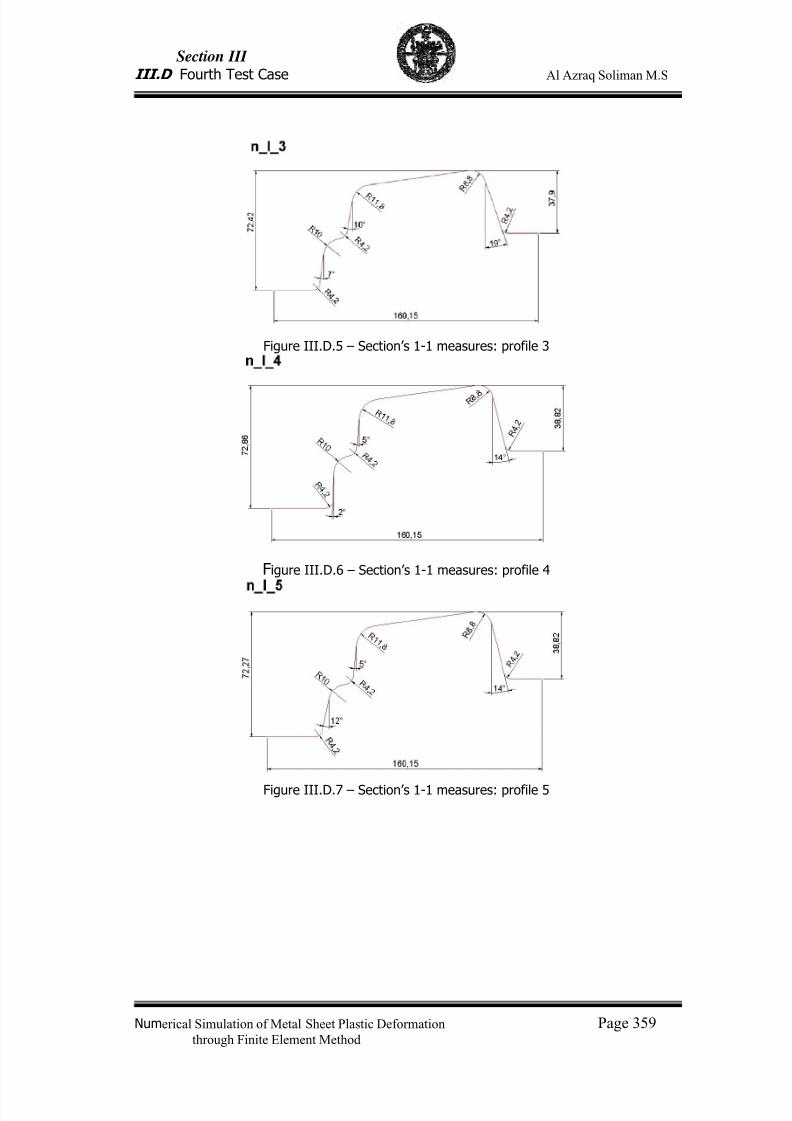
7/23/2019 Al Azraq Ingegneria Chimica Dei Materiali e Della Produzione
http://slidepdf.com/reader/full/al-azraq-ingegneria-chimica-dei-materiali-e-della-produzione 374/419
Section III
III.D Fourth Test Case Al Azraq Soliman M.S
Numerical Simulation of Metal Sheet Plastic Deformation Page 359through Finite Element Method
Figure III.D.5 – Section’s 1-1 measures: profile 3
Figure III.D.6 – Section’s 1-1 measures: profile 4
Figure III.D.7 – Section’s 1-1 measures: profile 5
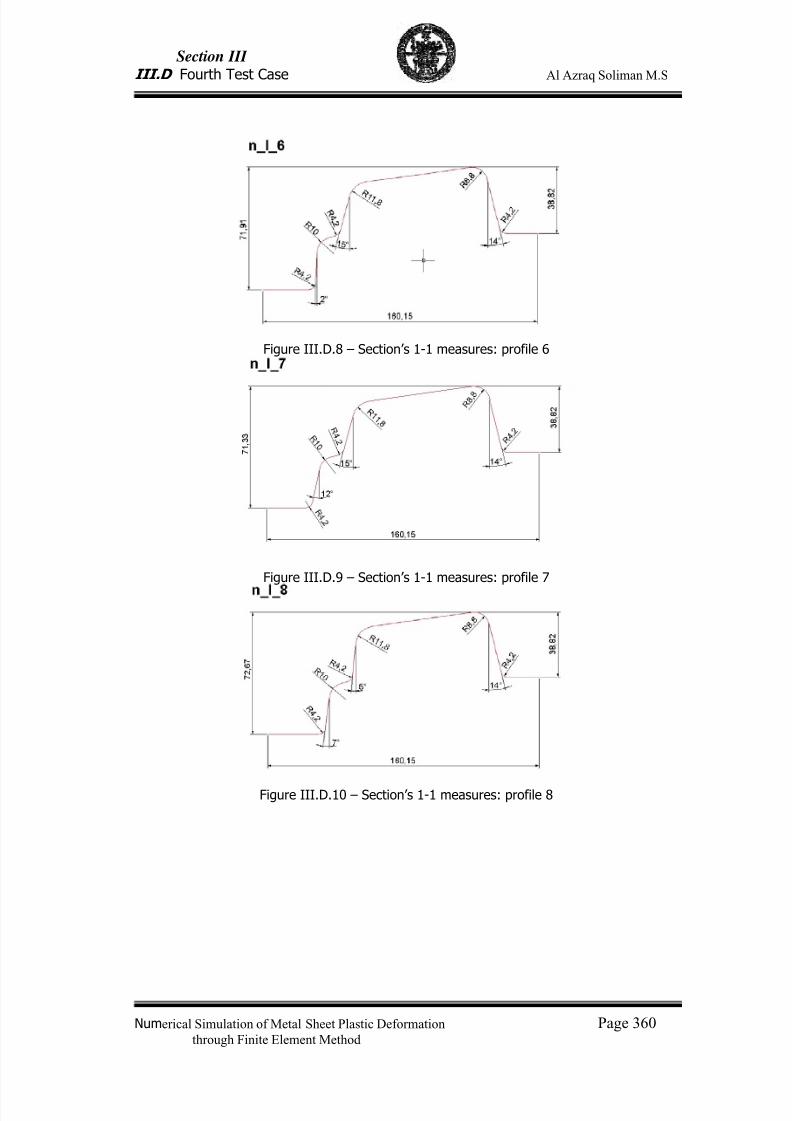
7/23/2019 Al Azraq Ingegneria Chimica Dei Materiali e Della Produzione
http://slidepdf.com/reader/full/al-azraq-ingegneria-chimica-dei-materiali-e-della-produzione 375/419
Section III
III.D Fourth Test Case Al Azraq Soliman M.S
Numerical Simulation of Metal Sheet Plastic Deformation Page 360through Finite Element Method
Figure III.D.8 – Section’s 1-1 measures: profile 6
Figure III.D.9 – Section’s 1-1 measures: profile 7
Figure III.D.10 – Section’s 1-1 measures: profile 8
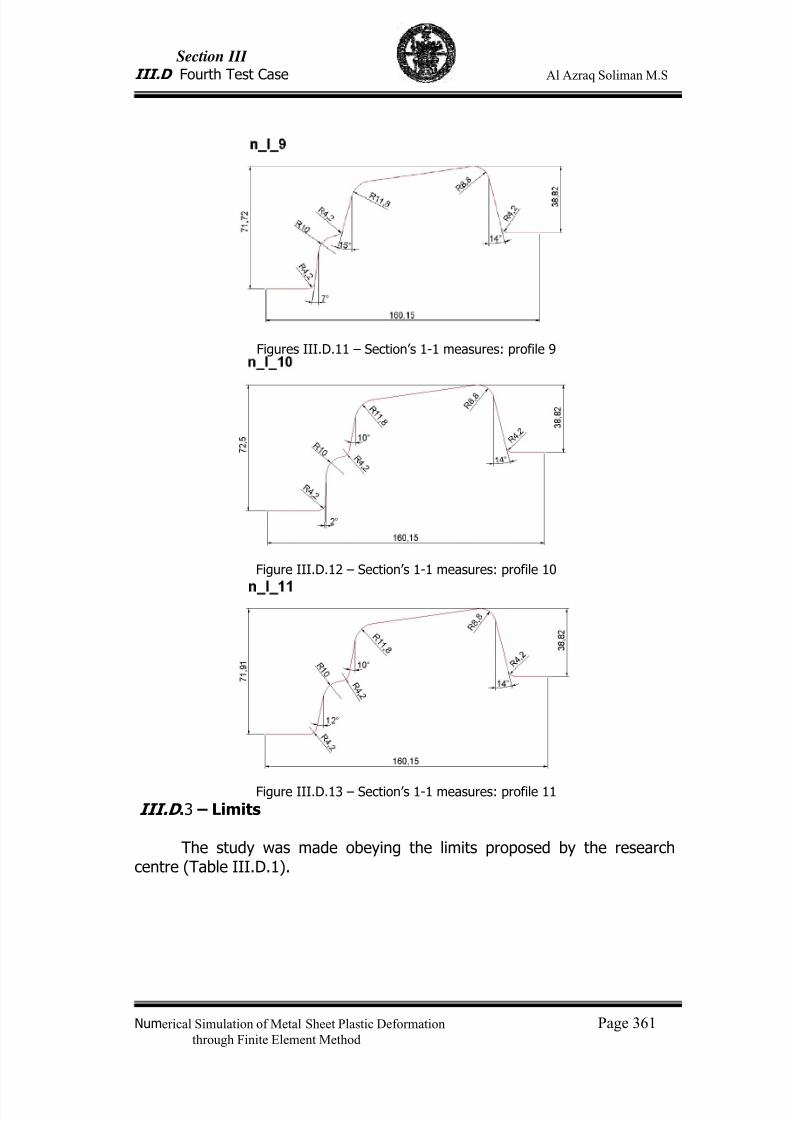
7/23/2019 Al Azraq Ingegneria Chimica Dei Materiali e Della Produzione
http://slidepdf.com/reader/full/al-azraq-ingegneria-chimica-dei-materiali-e-della-produzione 376/419
Section III
III.D Fourth Test Case Al Azraq Soliman M.S
Numerical Simulation of Metal Sheet Plastic Deformation Page 361through Finite Element Method
Figures III.D.11 – Section’s 1-1 measures: profile 9
Figure III.D.12 – Section’s 1-1 measures: profile 10
Figure III.D.13 – Section’s 1-1 measures: profile 11
III.D .3 – Limits
The study was made obeying the limits proposed by the researchcentre (Table III.D.1).
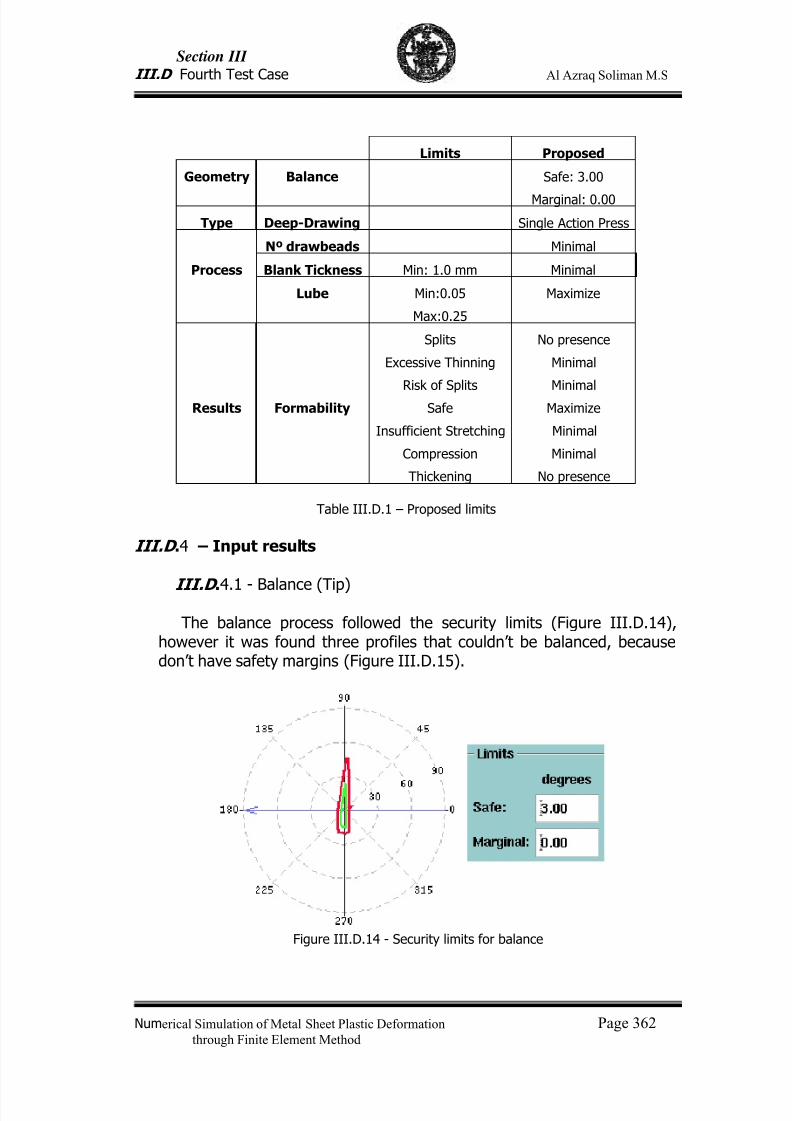
7/23/2019 Al Azraq Ingegneria Chimica Dei Materiali e Della Produzione
http://slidepdf.com/reader/full/al-azraq-ingegneria-chimica-dei-materiali-e-della-produzione 377/419
Section III
III.D Fourth Test Case Al Azraq Soliman M.S
Numerical Simulation of Metal Sheet Plastic Deformation Page 362through Finite Element Method
Limits Proposed
Geometry Balance Safe: 3.00
Marginal: 0.00
Type Deep-Drawing Single Action Press
Nº drawbeads Minimal
Process Blank Tickness Min: 1.0 mm Minimal
Lube Min:0.05 Maximize
Max:0.25
Splits No presence
Excessive Thinning Minimal
Risk of Splits Minimal
Results Formability Safe Maximize
Insufficient Stretching Minimal
Compression Minimal
Thickening No presence
Table III.D.1 – Proposed limits
III.D .4 – Input results
III.D .4.1 - Balance (Tip)
The balance process followed the security limits (Figure III.D.14),however it was found three profiles that couldn’t be balanced, becausedon’t have safety margins (Figure III.D.15).
Figure III.D.14 - Security limits for balance
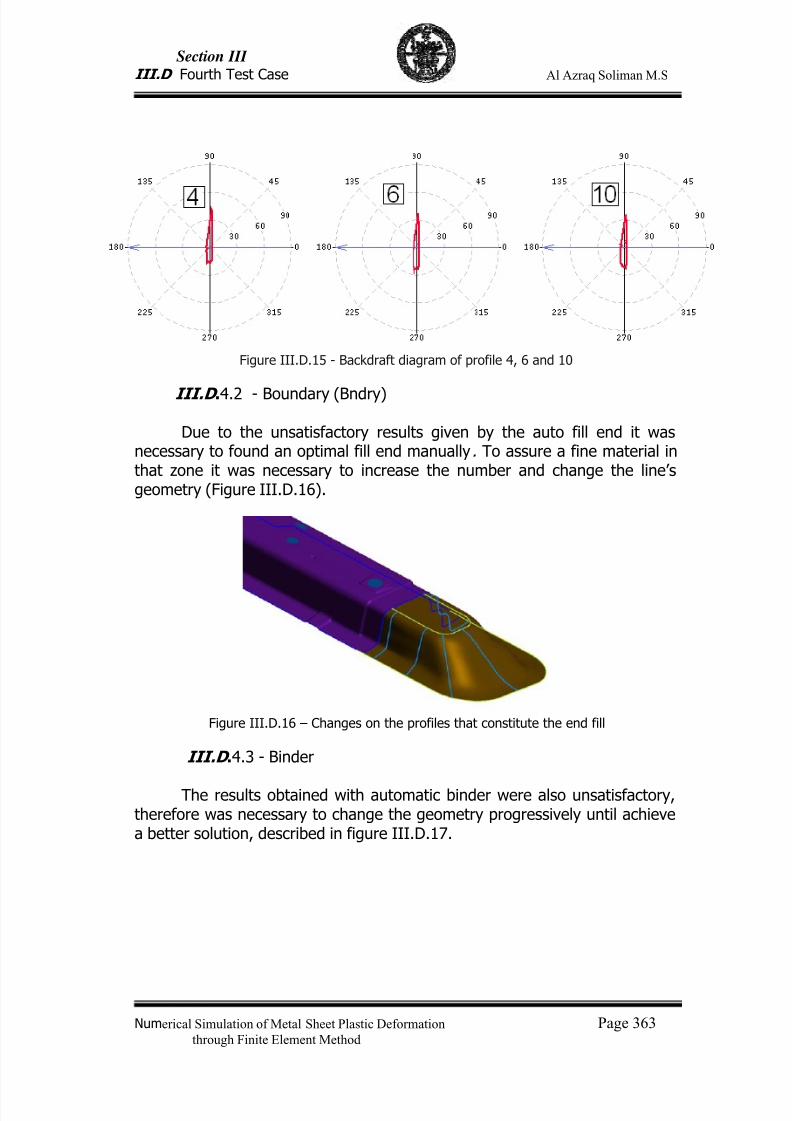
7/23/2019 Al Azraq Ingegneria Chimica Dei Materiali e Della Produzione
http://slidepdf.com/reader/full/al-azraq-ingegneria-chimica-dei-materiali-e-della-produzione 378/419
Section III
III.D Fourth Test Case Al Azraq Soliman M.S
Numerical Simulation of Metal Sheet Plastic Deformation Page 363through Finite Element Method
Figure III.D.15 - Backdraft diagram of profile 4, 6 and 10
III.D .4.2 - Boundary (Bndry)
Due to the unsatisfactory results given by the auto fill end it wasnecessary to found an optimal fill end manually. To assure a fine material inthat zone it was necessary to increase the number and change the line’sgeometry (Figure III.D.16).
Figure III.D.16 – Changes on the profiles that constitute the end fill
III.D .4.3 - Binder
The results obtained with automatic binder were also unsatisfactory,therefore was necessary to change the geometry progressively until achievea better solution, described in figure III.D.17.
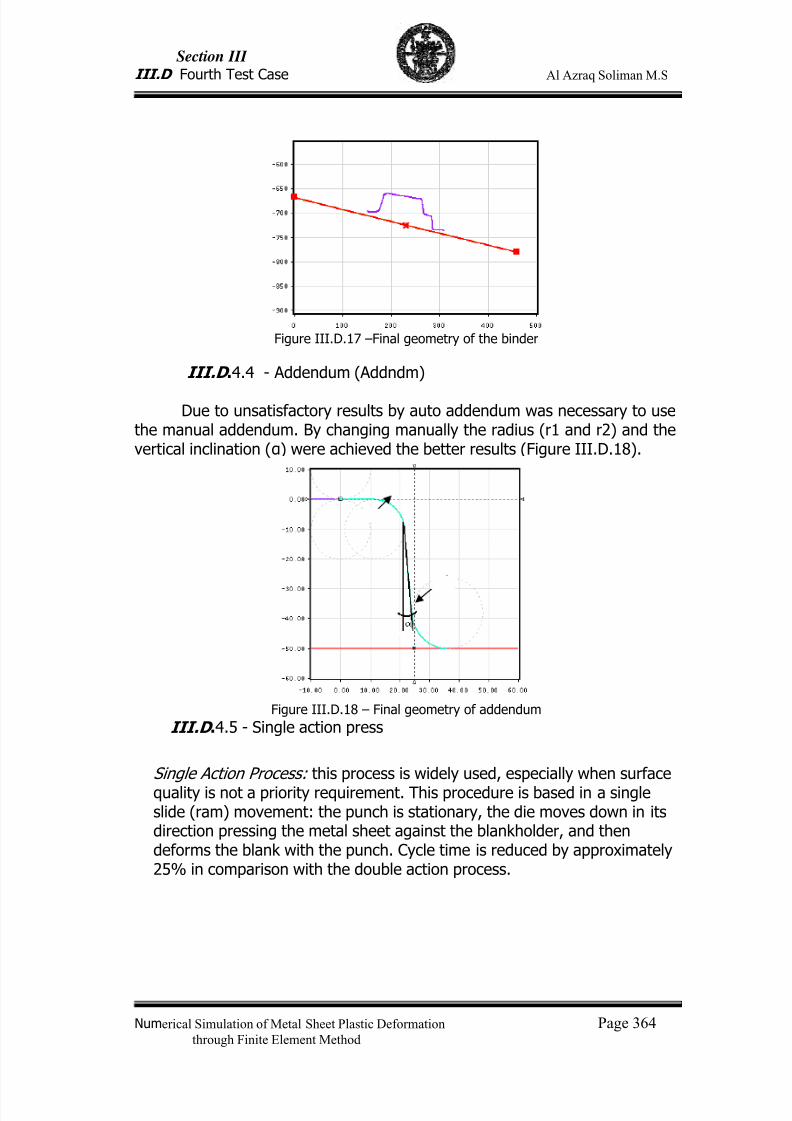
7/23/2019 Al Azraq Ingegneria Chimica Dei Materiali e Della Produzione
http://slidepdf.com/reader/full/al-azraq-ingegneria-chimica-dei-materiali-e-della-produzione 379/419
Section III
III.D Fourth Test Case Al Azraq Soliman M.S
Numerical Simulation of Metal Sheet Plastic Deformation Page 364through Finite Element Method
Figure III.D.17 –Final geometry of the binder
III.D .4.4 - Addendum (Addndm)
Due to unsatisfactory results by auto addendum was necessary to usethe manual addendum. By changing manually the radius (r1 and r2) and thevertical inclination (α) were achieved the better results (Figure III.D.18).
Figure III.D.18 – Final geometry of addendum
III.D .4.5 - Single action press
Single Action Process: this process is widely used, especially when surfacequality is not a priority requirement. This procedure is based in a singleslide (ram) movement: the punch is stationary, the die moves down in itsdirection pressing the metal sheet against the blankholder, and thendeforms the blank with the punch. Cycle time is reduced by approximately25% in comparison with the double action process.
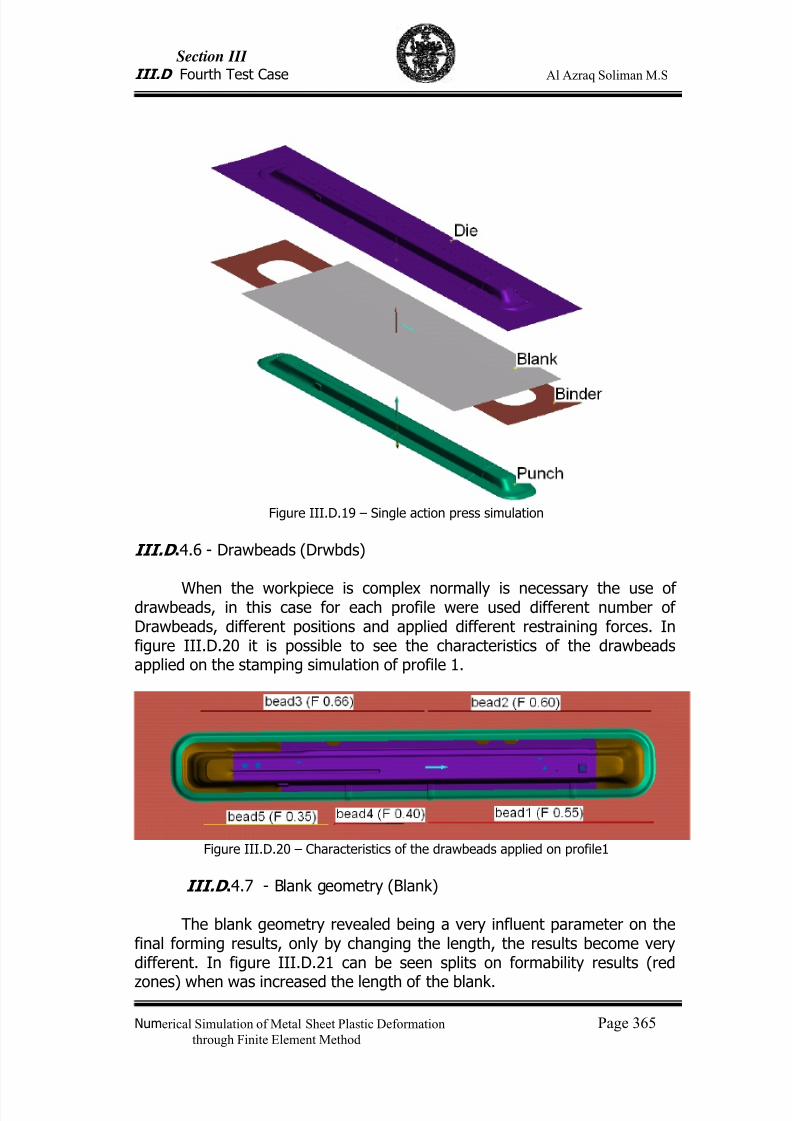
7/23/2019 Al Azraq Ingegneria Chimica Dei Materiali e Della Produzione
http://slidepdf.com/reader/full/al-azraq-ingegneria-chimica-dei-materiali-e-della-produzione 380/419
Section III
III.D Fourth Test Case Al Azraq Soliman M.S
Numerical Simulation of Metal Sheet Plastic Deformation Page 365through Finite Element Method
Figure III.D.19 – Single action press simulation
III.D .4.6 - Drawbeads (Drwbds)
When the workpiece is complex normally is necessary the use ofdrawbeads, in this case for each profile were used different number ofDrawbeads, different positions and applied different restraining forces. Infigure III.D.20 it is possible to see the characteristics of the drawbeadsapplied on the stamping simulation of profile 1.
Figure III.D.20 – Characteristics of the drawbeads applied on profile1
III.D .4.7 - Blank geometry (Blank)
The blank geometry revealed being a very influent parameter on thefinal forming results, only by changing the length, the results become verydifferent. In figure III.D.21 can be seen splits on formability results (red
zones) when was increased the length of the blank.
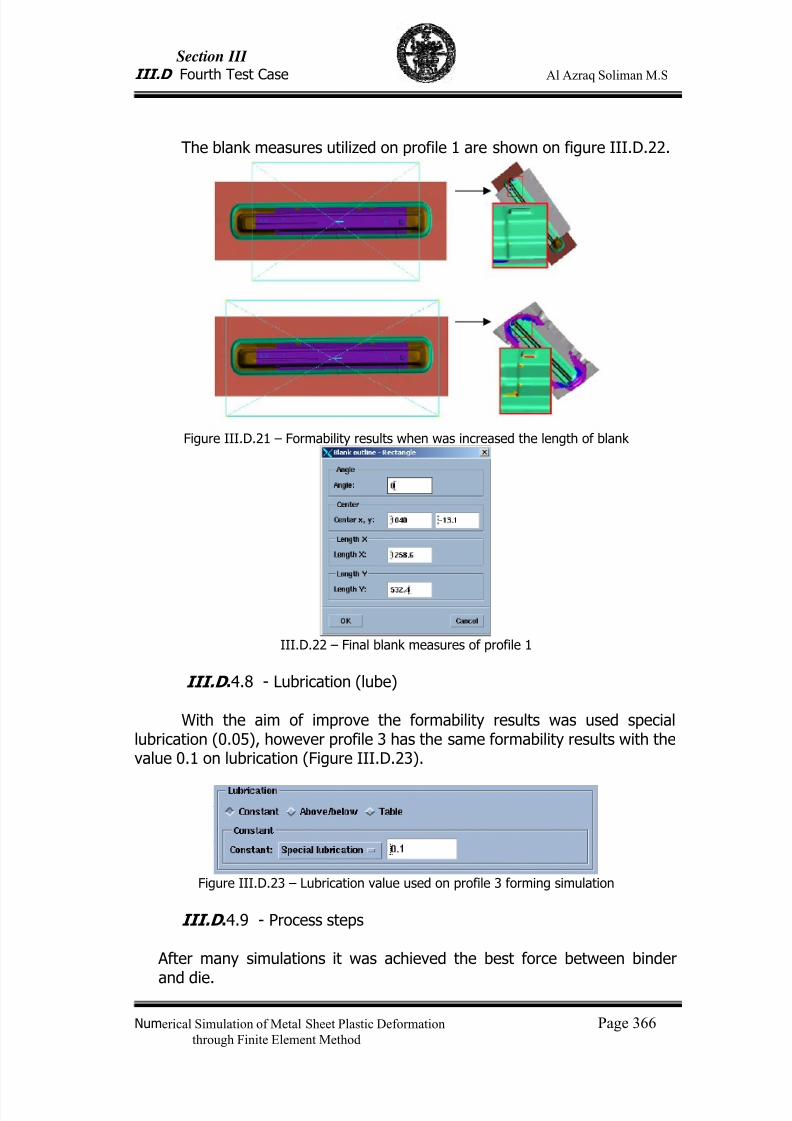
7/23/2019 Al Azraq Ingegneria Chimica Dei Materiali e Della Produzione
http://slidepdf.com/reader/full/al-azraq-ingegneria-chimica-dei-materiali-e-della-produzione 381/419
Section III
III.D Fourth Test Case Al Azraq Soliman M.S
Numerical Simulation of Metal Sheet Plastic Deformation Page 366through Finite Element Method
The blank measures utilized on profile 1 are shown on figure III.D.22.
Figure III.D.21 – Formability results when was increased the length of blank
III.D.22 – Final blank measures of profile 1
III.D .4.8 - Lubrication (lube)
With the aim of improve the formability results was used speciallubrication (0.05), however profile 3 has the same formability results with thevalue 0.1 on lubrication (Figure III.D.23).
Figure III.D.23 – Lubrication value used on profile 3 forming simulation
III.D .4.9 - Process steps
After many simulations it was achieved the best force between binder
and die.
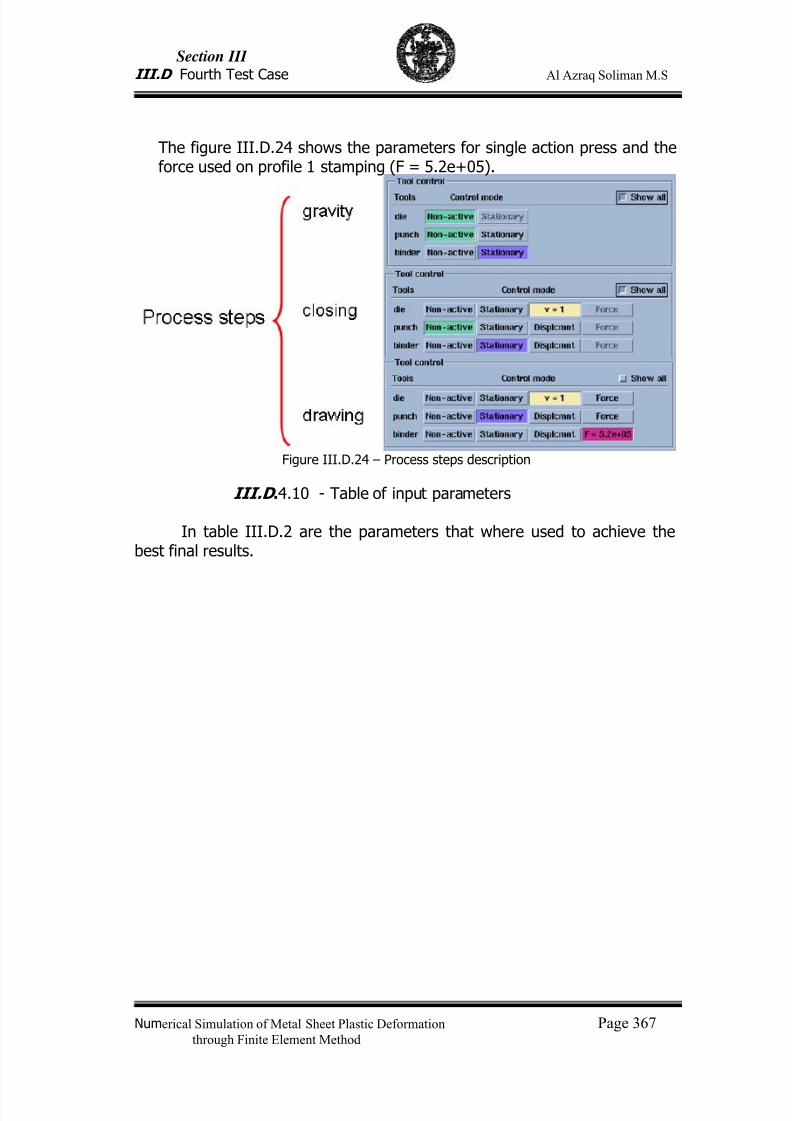
7/23/2019 Al Azraq Ingegneria Chimica Dei Materiali e Della Produzione
http://slidepdf.com/reader/full/al-azraq-ingegneria-chimica-dei-materiali-e-della-produzione 382/419
Section III
III.D Fourth Test Case Al Azraq Soliman M.S
Numerical Simulation of Metal Sheet Plastic Deformation Page 367through Finite Element Method
The figure III.D.24 shows the parameters for single action press and theforce used on profile 1 stamping (F = 5.2e+05).
Figure III.D.24 – Process steps description
III.D .4.10 - Table of input parameters
In table III.D.2 are the parameters that where used to achieve thebest final results.
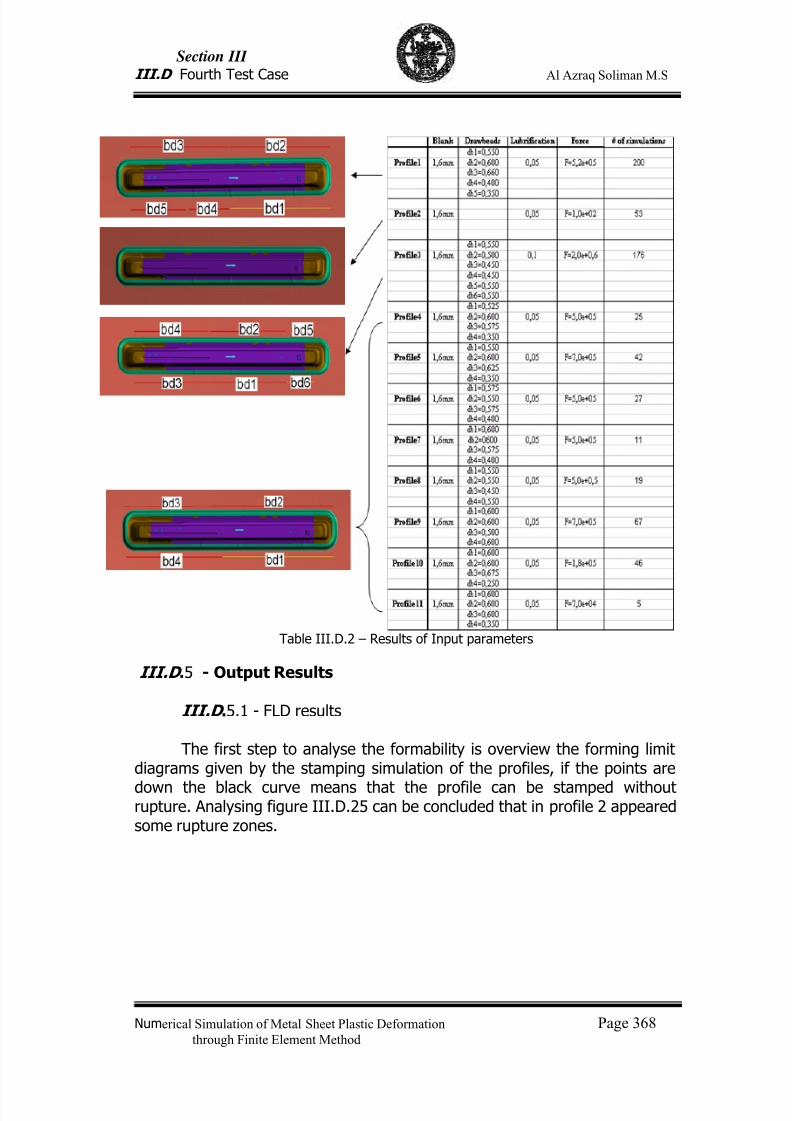
7/23/2019 Al Azraq Ingegneria Chimica Dei Materiali e Della Produzione
http://slidepdf.com/reader/full/al-azraq-ingegneria-chimica-dei-materiali-e-della-produzione 383/419
Section III
III.D Fourth Test Case Al Azraq Soliman M.S
Numerical Simulation of Metal Sheet Plastic Deformation Page 368through Finite Element Method
Table III.D.2 – Results of Input parameters
III.D .5 - Output Results
III.D .5.1 - FLD results
The first step to analyse the formability is overview the forming limitdiagrams given by the stamping simulation of the profiles, if the points are
down the black curve means that the profile can be stamped withoutrupture. Analysing figure III.D.25 can be concluded that in profile 2 appearedsome rupture zones.
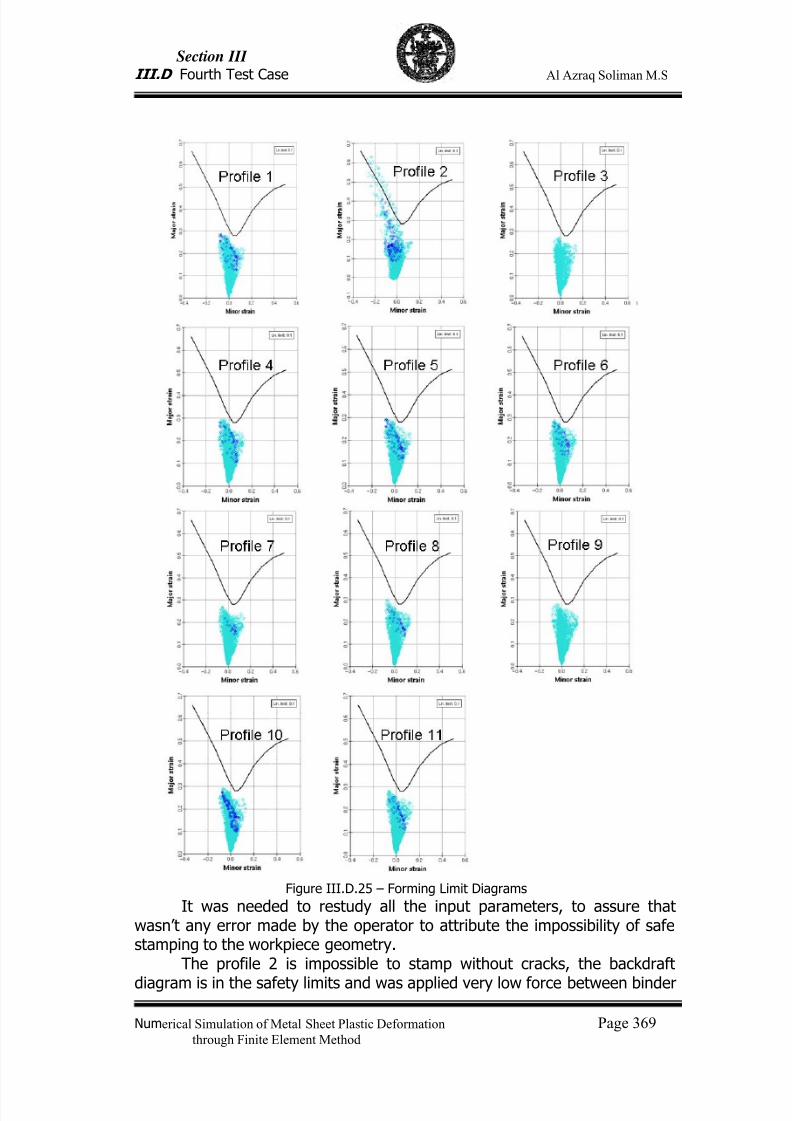
7/23/2019 Al Azraq Ingegneria Chimica Dei Materiali e Della Produzione
http://slidepdf.com/reader/full/al-azraq-ingegneria-chimica-dei-materiali-e-della-produzione 384/419
Section III
III.D Fourth Test Case Al Azraq Soliman M.S
Numerical Simulation of Metal Sheet Plastic Deformation Page 369through Finite Element Method
Figure III.D.25 – Forming Limit Diagrams
It was needed to restudy all the input parameters, to assure thatwasn’t any error made by the operator to attribute the impossibility of safestamping to the workpiece geometry.
The profile 2 is impossible to stamp without cracks, the backdraft
diagram is in the safety limits and was applied very low force between binder
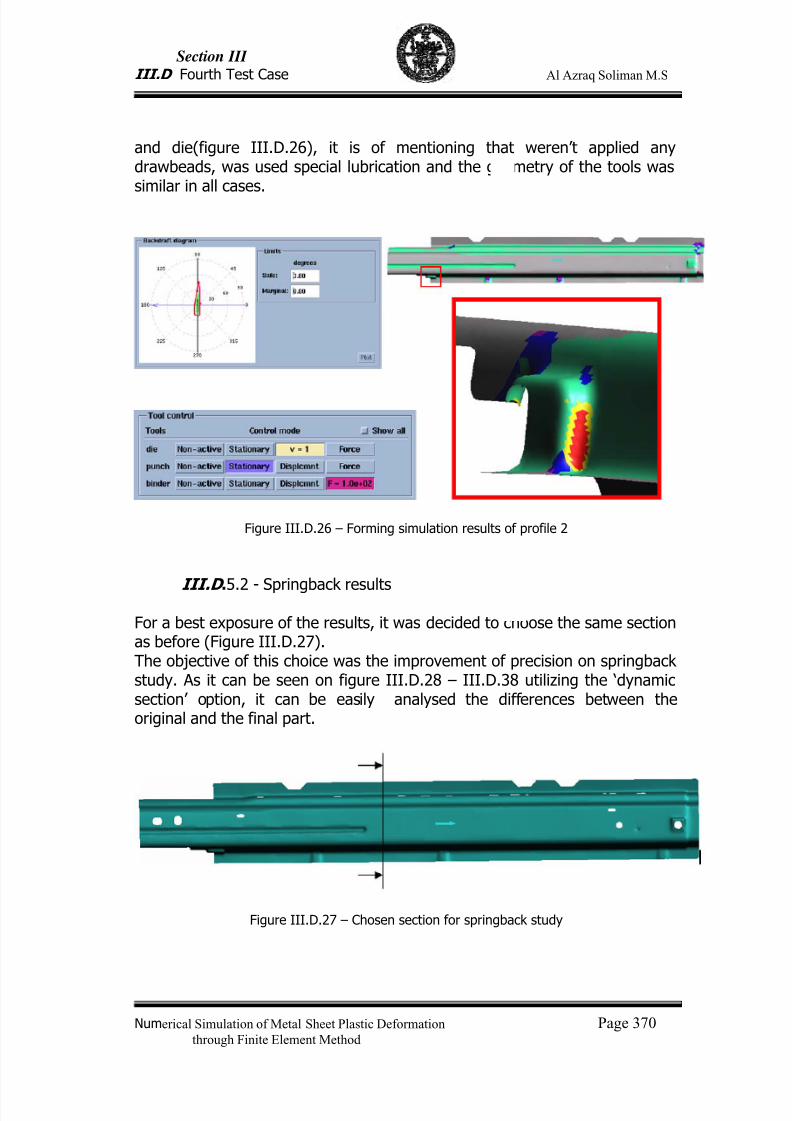
7/23/2019 Al Azraq Ingegneria Chimica Dei Materiali e Della Produzione
http://slidepdf.com/reader/full/al-azraq-ingegneria-chimica-dei-materiali-e-della-produzione 385/419
Section III
III.D Fourth Test Case Al Azraq Soliman M.S
Numerical Simulation of Metal Sheet Plastic Deformation Page 370through Finite Element Method
and die(figure III.D.26), it is of mentioning that weren’t applied anydrawbeads, was used special lubrication and the geometry of the tools wassimilar in all cases.
Figure III.D.26 – Forming simulation results of profile 2
III.D .5.2 - Springback results
For a best exposure of the results, it was decided to choose the same sectionas before (Figure III.D.27).The objective of this choice was the improvement of precision on springbackstudy. As it can be seen on figure III.D.28 – III.D.38 utilizing the ‘dynamicsection’ option, it can be easily analysed the differences between theoriginal and the final part.
Figure III.D.27 – Chosen section for springback study
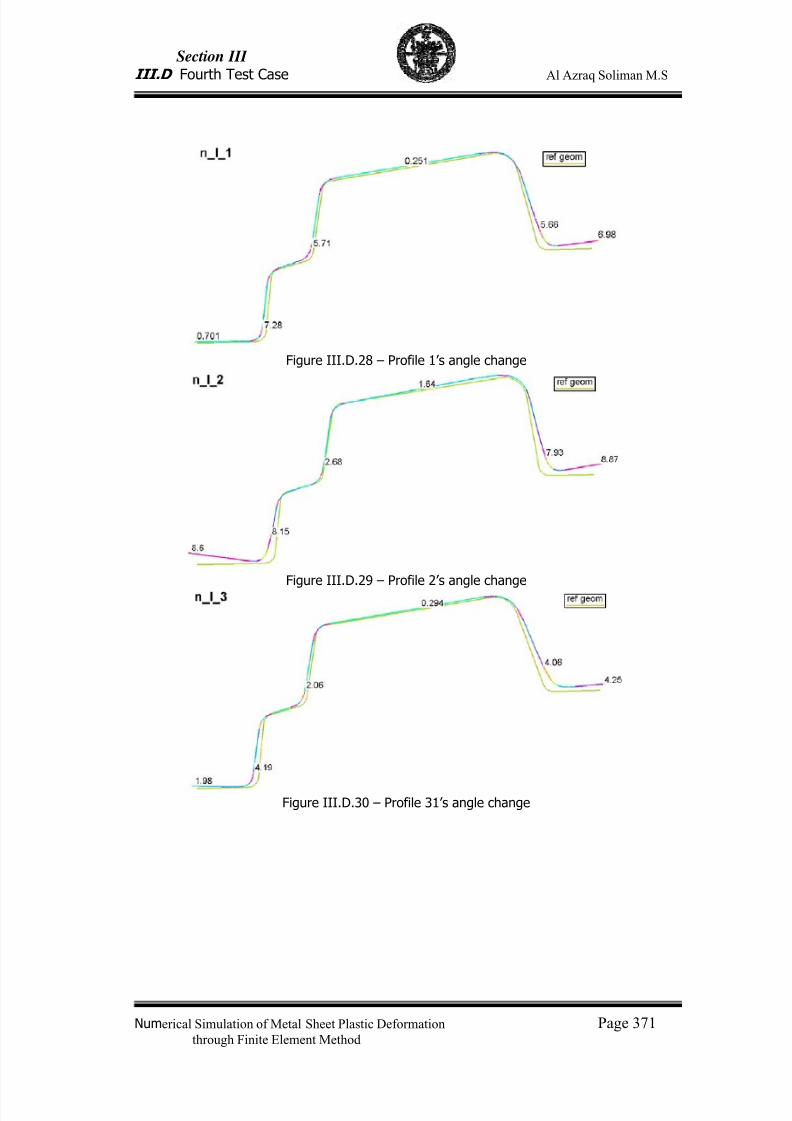
7/23/2019 Al Azraq Ingegneria Chimica Dei Materiali e Della Produzione
http://slidepdf.com/reader/full/al-azraq-ingegneria-chimica-dei-materiali-e-della-produzione 386/419
Section III
III.D Fourth Test Case Al Azraq Soliman M.S
Numerical Simulation of Metal Sheet Plastic Deformation Page 371through Finite Element Method
Figure III.D.28 – Profile 1’s angle change
Figure III.D.29 – Profile 2’s angle change
Figure III.D.30 – Profile 31’s angle change
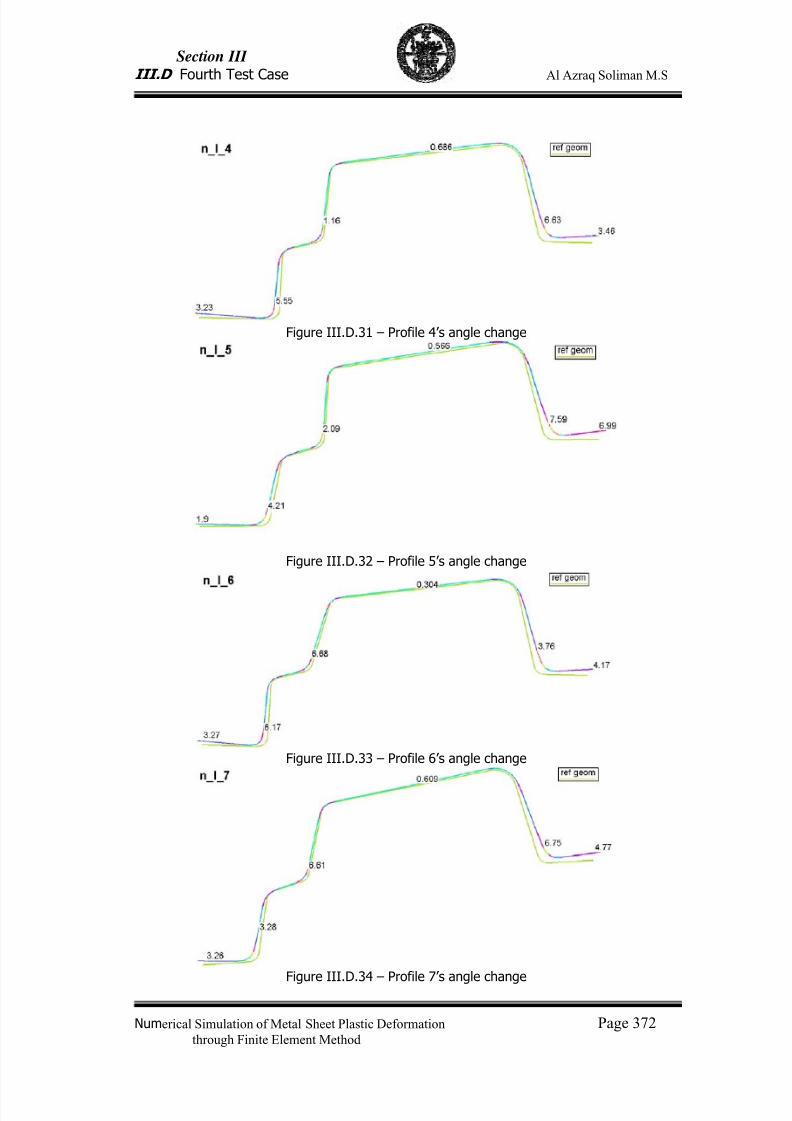
7/23/2019 Al Azraq Ingegneria Chimica Dei Materiali e Della Produzione
http://slidepdf.com/reader/full/al-azraq-ingegneria-chimica-dei-materiali-e-della-produzione 387/419
Section III
III.D Fourth Test Case Al Azraq Soliman M.S
Numerical Simulation of Metal Sheet Plastic Deformation Page 372through Finite Element Method
Figure III.D.31 – Profile 4’s angle change
Figure III.D.32 – Profile 5’s angle change
Figure III.D.33 – Profile 6’s angle change
Figure III.D.34 – Profile 7’s angle change
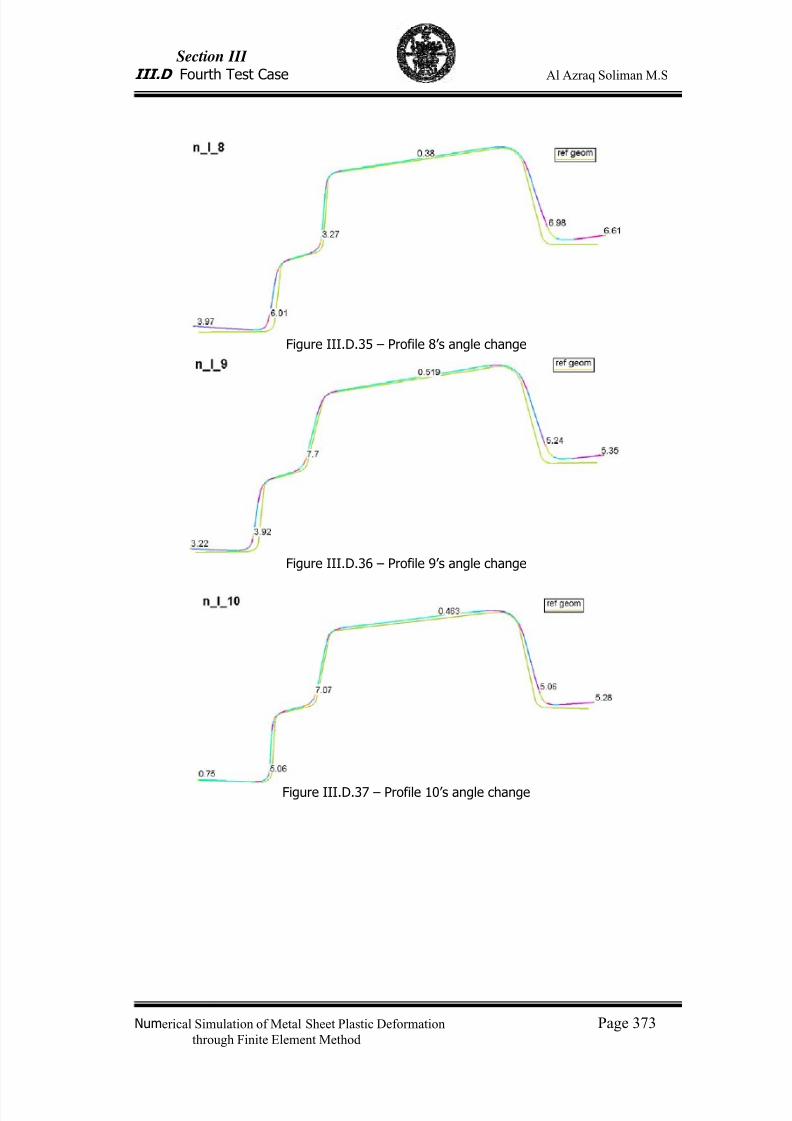
7/23/2019 Al Azraq Ingegneria Chimica Dei Materiali e Della Produzione
http://slidepdf.com/reader/full/al-azraq-ingegneria-chimica-dei-materiali-e-della-produzione 388/419
Section III
III.D Fourth Test Case Al Azraq Soliman M.S
Numerical Simulation of Metal Sheet Plastic Deformation Page 373through Finite Element Method
Figure III.D.35 – Profile 8’s angle change
Figure III.D.36 – Profile 9’s angle change
Figure III.D.37 – Profile 10’s angle change
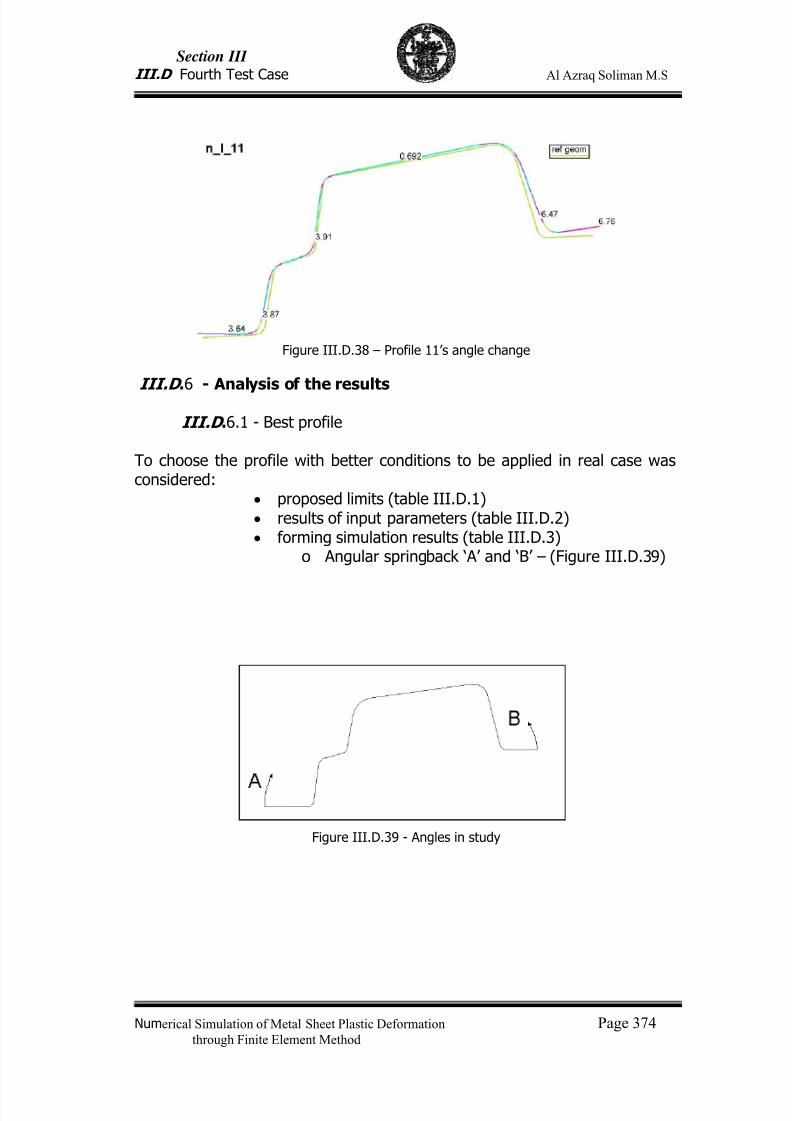
7/23/2019 Al Azraq Ingegneria Chimica Dei Materiali e Della Produzione
http://slidepdf.com/reader/full/al-azraq-ingegneria-chimica-dei-materiali-e-della-produzione 389/419
Section III
III.D Fourth Test Case Al Azraq Soliman M.S
Numerical Simulation of Metal Sheet Plastic Deformation Page 374through Finite Element Method
Figure III.D.38 – Profile 11’s angle change
III.D .6 - Analysis of the results
III.D .6.1 - Best profile
To choose the profile with better conditions to be applied in real case wasconsidered:
• proposed limits (table III.D.1)
• results of input parameters (table III.D.2)• forming simulation results (table III.D.3)
o Angular springback ‘A’ and ‘B’ – (Figure III.D.39)
Figure III.D.39 - Angles in study
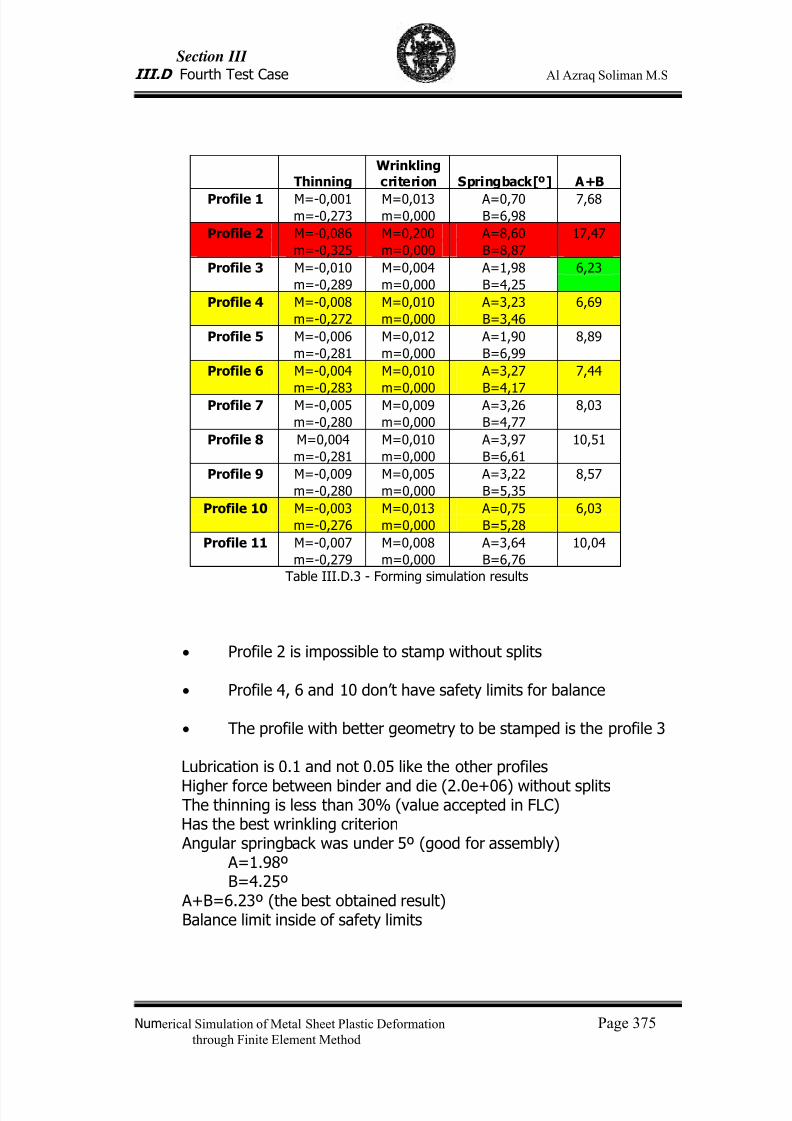
7/23/2019 Al Azraq Ingegneria Chimica Dei Materiali e Della Produzione
http://slidepdf.com/reader/full/al-azraq-ingegneria-chimica-dei-materiali-e-della-produzione 390/419
Section III
III.D Fourth Test Case Al Azraq Soliman M.S
Numerical Simulation of Metal Sheet Plastic Deformation Page 375through Finite Element Method
ThinningWrinklingcriterion Springback[º] A+B
Profile 1 M=-0,001 M=0,013 A=0,70 7,68m=-0,273 m=0,000 B=6,98
Profile 2 M=-0,086 M=0,200 A=8,60 17,47
m=-0,325 m=0,000 B=8,87
Profile 3 M=-0,010 M=0,004 A=1,98 6,23
m=-0,289 m=0,000 B=4,25
Profile 4 M=-0,008 M=0,010 A=3,23 6,69
m=-0,272 m=0,000 B=3,46
Profile 5 M=-0,006 M=0,012 A=1,90 8,89
m=-0,281 m=0,000 B=6,99
Profile 6 M=-0,004 M=0,010 A=3,27 7,44
m=-0,283 m=0,000 B=4,17Profile 7 M=-0,005 M=0,009 A=3,26 8,03
m=-0,280 m=0,000 B=4,77
Profile 8 M=0,004 M=0,010 A=3,97 10,51
m=-0,281 m=0,000 B=6,61
Profile 9 M=-0,009 M=0,005 A=3,22 8,57
m=-0,280 m=0,000 B=5,35
Profile 10 M=-0,003 M=0,013 A=0,75 6,03
m=-0,276 m=0,000 B=5,28
Profile 11 M=-0,007 M=0,008 A=3,64 10,04
m=-0,279 m=0,000 B=6,76
Table III.D.3 - Forming simulation results
• Profile 2 is impossible to stamp without splits
• Profile 4, 6 and 10 don’t have safety limits for balance
• The profile with better geometry to be stamped is the profile 3
Lubrication is 0.1 and not 0.05 like the other profiles
Higher force between binder and die (2.0e+06) without splitsThe thinning is less than 30% (value accepted in FLC)Has the best wrinkling criterion Angular springback was under 5º (good for assembly)
A=1.98ºB=4.25º
A+B=6.23º (the best obtained result)Balance limit inside of safety limits
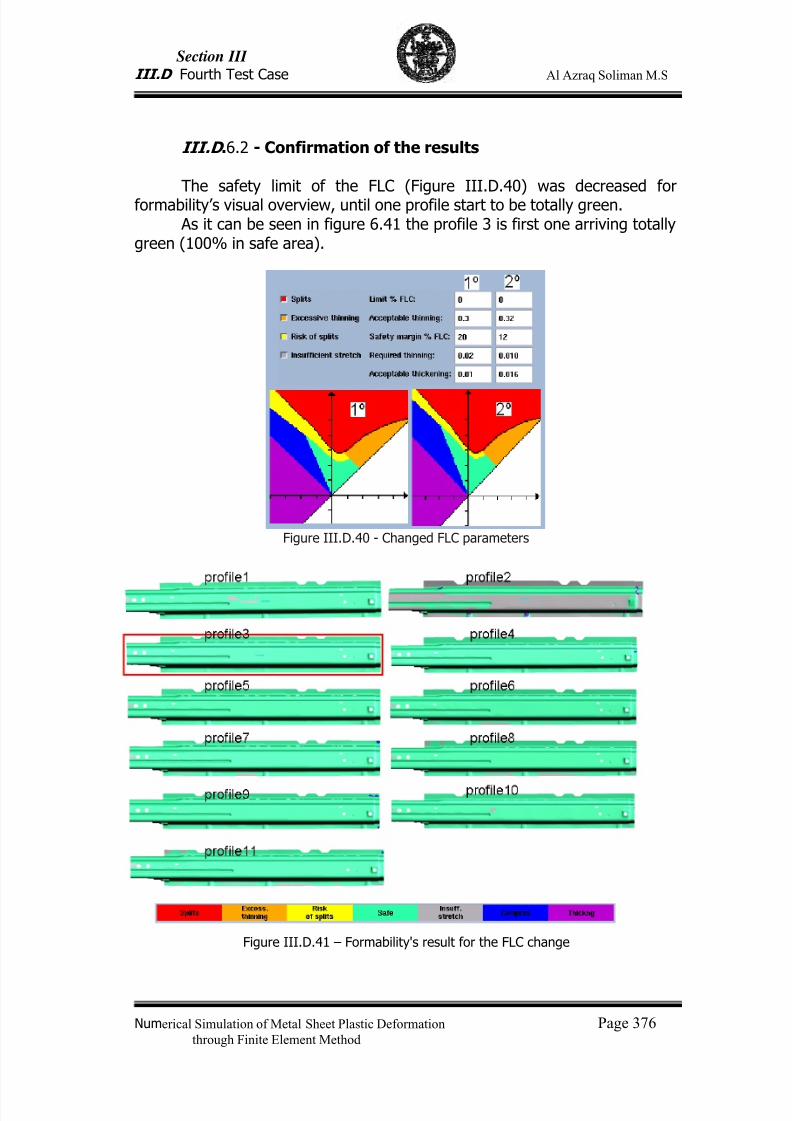
7/23/2019 Al Azraq Ingegneria Chimica Dei Materiali e Della Produzione
http://slidepdf.com/reader/full/al-azraq-ingegneria-chimica-dei-materiali-e-della-produzione 391/419
Section III
III.D Fourth Test Case Al Azraq Soliman M.S
Numerical Simulation of Metal Sheet Plastic Deformation Page 376through Finite Element Method
III.D .6.2 - Confirmation of the results
The safety limit of the FLC (Figure III.D.40) was decreased forformability’s visual overview, until one profile start to be totally green.
As it can be seen in figure 6.41 the profile 3 is first one arriving totallygreen (100% in safe area).
Figure III.D.40 - Changed FLC parameters
Figure III.D.41 – Formability's result for the FLC change
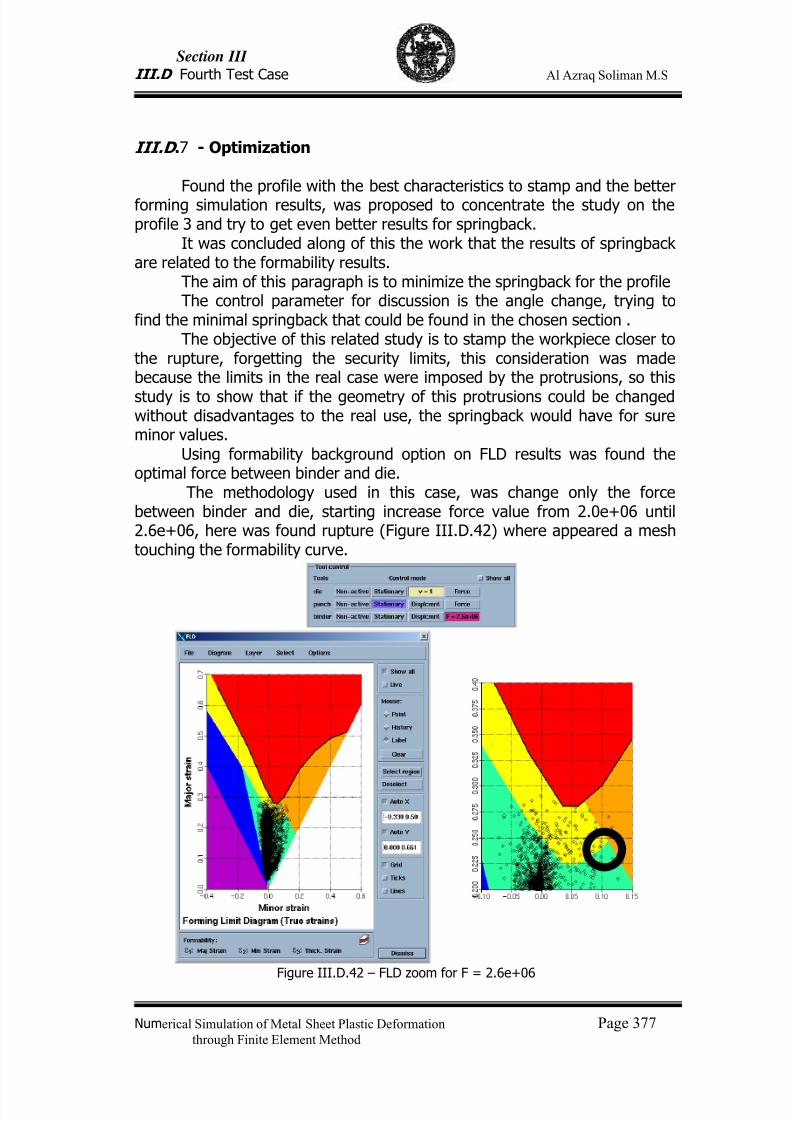
7/23/2019 Al Azraq Ingegneria Chimica Dei Materiali e Della Produzione
http://slidepdf.com/reader/full/al-azraq-ingegneria-chimica-dei-materiali-e-della-produzione 392/419
Section III
III.D Fourth Test Case Al Azraq Soliman M.S
Numerical Simulation of Metal Sheet Plastic Deformation Page 377through Finite Element Method
III.D .7 - Optimization
Found the profile with the best characteristics to stamp and the betterforming simulation results, was proposed to concentrate the study on theprofile 3 and try to get even better results for springback.
It was concluded along of this the work that the results of springbackare related to the formability results.
The aim of this paragraph is to minimize the springback for the profileThe control parameter for discussion is the angle change, trying to
find the minimal springback that could be found in the chosen section .The objective of this related study is to stamp the workpiece closer to
the rupture, forgetting the security limits, this consideration was madebecause the limits in the real case were imposed by the protrusions, so this
study is to show that if the geometry of this protrusions could be changedwithout disadvantages to the real use, the springback would have for sureminor values.
Using formability background option on FLD results was found theoptimal force between binder and die.
The methodology used in this case, was change only the forcebetween binder and die, starting increase force value from 2.0e+06 until2.6e+06, here was found rupture (Figure III.D.42) where appeared a meshtouching the formability curve.
Figure III.D.42 – FLD zoom for F = 2.6e+06
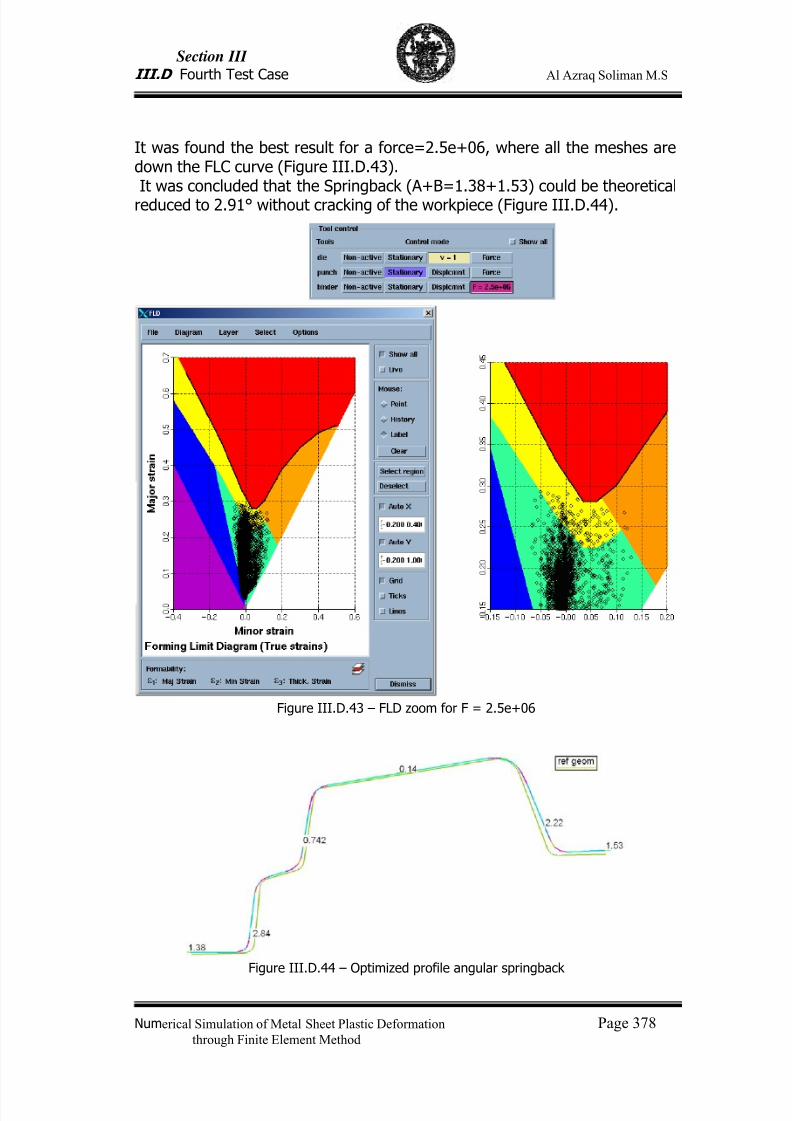
7/23/2019 Al Azraq Ingegneria Chimica Dei Materiali e Della Produzione
http://slidepdf.com/reader/full/al-azraq-ingegneria-chimica-dei-materiali-e-della-produzione 393/419
Section III
III.D Fourth Test Case Al Azraq Soliman M.S
Numerical Simulation of Metal Sheet Plastic Deformation Page 378through Finite Element Method
It was found the best result for a force=2.5e+06, where all the meshes aredown the FLC curve (Figure III.D.43).It was concluded that the Springback (A+B=1.38+1.53) could be theoretical
reduced to 2.91° without cracking of the workpiece (Figure III.D.44).
Figure III.D.43 – FLD zoom for F = 2.5e+06
Figure III.D.44 – Optimized profile angular springback
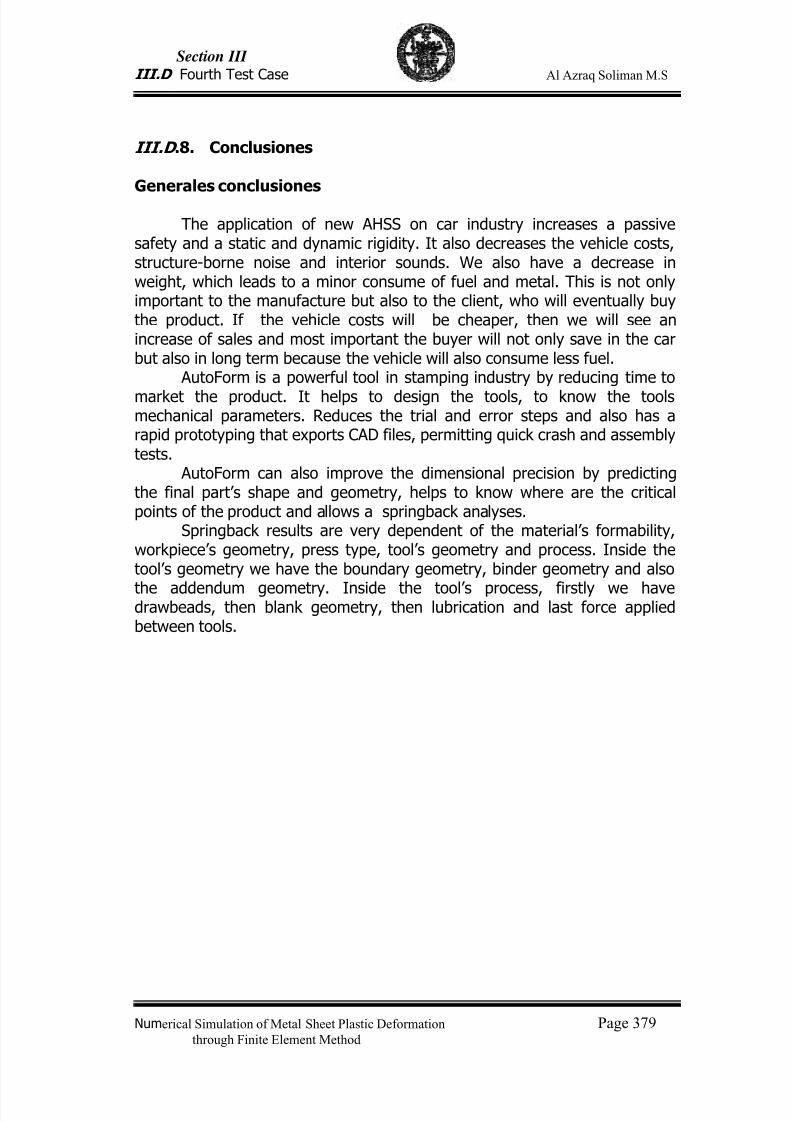
7/23/2019 Al Azraq Ingegneria Chimica Dei Materiali e Della Produzione
http://slidepdf.com/reader/full/al-azraq-ingegneria-chimica-dei-materiali-e-della-produzione 394/419
Section III
III.D Fourth Test Case Al Azraq Soliman M.S
Numerical Simulation of Metal Sheet Plastic Deformation Page 379through Finite Element Method
III.D .8. Conclusiones
Generales conclusiones
The application of new AHSS on car industry increases a passivesafety and a static and dynamic rigidity. It also decreases the vehicle costs,structure-borne noise and interior sounds. We also have a decrease inweight, which leads to a minor consume of fuel and metal. This is not onlyimportant to the manufacture but also to the client, who will eventually buythe product. If the vehicle costs will be cheaper, then we will see anincrease of sales and most important the buyer will not only save in the carbut also in long term because the vehicle will also consume less fuel.
AutoForm is a powerful tool in stamping industry by reducing time to
market the product. It helps to design the tools, to know the toolsmechanical parameters. Reduces the trial and error steps and also has arapid prototyping that exports CAD files, permitting quick crash and assemblytests.
AutoForm can also improve the dimensional precision by predictingthe final part’s shape and geometry, helps to know where are the criticalpoints of the product and allows a springback analyses.
Springback results are very dependent of the material’s formability,workpiece’s geometry, press type, tool’s geometry and process. Inside thetool’s geometry we have the boundary geometry, binder geometry and also
the addendum geometry. Inside the tool’s process, firstly we havedrawbeads, then blank geometry, then lubrication and last force appliedbetween tools.
7/23/2019 Al Azraq Ingegneria Chimica Dei Materiali e Della Produzione
http://slidepdf.com/reader/full/al-azraq-ingegneria-chimica-dei-materiali-e-della-produzione 395/419
Section III
III.D Fourth Test Case Al Azraq Soliman M.S
Numerical Simulation of Metal Sheet Plastic Deformation Page 380through Finite Element Method
Técnicas conclusiones
1 – A uniform drawing depth offers better probabilities of success in theforming process.
2 - A more accented addendum leads to a bigger stretching of the material.3 – Steps in certain zones of the addendum favour the local stretching of
those areas.
4 – The boundary fill may be very important to the stamping process byproviding a smoother connection between the part and the addendum.
5 – The higher is the force factor of the drawbeads, the more stretched willbe the component in the areas influenced by their presence.
6 - In general the simulation is highly sensitive in the critical bendingregions.
7 – The bigger the force factor between the die and blankholder to press theblank is, more stretched is the component.
8 – Unlevelled geometries and the existence of steps difficults the formingprocess.
9 – An incorrect choice of the drawing direction may disable the stampingprocess.
10 – The increase of stretching decreases the tendency to wrinkle.
11 – The points where the thickness values are minimum correspond to the
areas where the thinning is maximum.
12 – An intense springback in the extremities of the component tend tocause the opposite phenomenon (spring-in) in the centre of the part.
7/23/2019 Al Azraq Ingegneria Chimica Dei Materiali e Della Produzione
http://slidepdf.com/reader/full/al-azraq-ingegneria-chimica-dei-materiali-e-della-produzione 396/419
381
FEM analysis of advanced high strength steelcar body drawing process
S. Al Azraqa, R. Teti
a, S. Ardolino
b, G. Monacelli
b
a Dept. of Materials and Production Engineering, University of Naples Federico II, Italy
b Elasis SCpA, Pomigliano d’Arco, Italy
Abstract
Advanced High Strength Steels (AHSS) have been intensively applied to automobile components to improve
crashworthiness, without increasing the body weight, under a strong pressure of the requirements for fuel
consumption, durability and energy absorption. Some of the problems encountered in the forming of AHSS, due to
lack of knowledge about the material behaviour, are presented and described with the purpose of showing the
necessity of sheet metal simulation to save cost and time by replacing physical tryouts with virtual tryouts. The codes
and elements normally used in these types of simulation programs, as well as their common approaches, are presented
and evaluated. Finally, a test case of an automobile component (hood structure) was analysed using the incremental
approach of the AutoForm FEM code.
1. Introduction
Automobiles play an important role in our life.
This makes it necessary to incessantly try to reduce
their production cost in line with the innovation of
production technology. At the same time, measures are
being taken toward the reduction of fuel cost and the
improvement of safety so that eagerly-pursued
harmony with the social and natural environment can
be established. It is safe to say that thin steel sheets for
automobiles have made progress in responding to the
market needs. In recent years, it has become one of the
most important tasks for automobiles to make the
reduction in weight of auto bodies compatible with the
improvement of crashworthiness, particularly with the
aim of reducing CO2 gas emissions by improving fuel
consumption [1]. To satisfy these demands, a new steel
grade, the Advance High Strength Steel (AHSS), has
been developed, pushing the boundaries of what was
previously possible with conventional steel grades.
A major negative consequence of using these new
materials is the absence of knowledge about their
behaviour during both the drawing process and future
physical applications. Engineers turned to forming
simulations in order to closely investigate and try to
minimize this problem. The aim of industrial
application of the simulation for drawing processes is
to replace the physical tryout by the computer tryout,
with the intention of time/cost reduction and quality
improvement in the die design/manufacturing cycle [2].
In the past, a number of analyzing methods have
been developed and applied to various forming
processes. Some of these methods are the slab method,
the slip-line field method, the viscoplasticity method,
upper and lower bound techniques and Hills general
method. These methods have been useful in
qualitatively predicting forming loads, overall
geometry changes of the deformed blank and material
flow, and approximate optimum process conditions.
However, a more accurate determination of the
effects of various process parameters in the drawing
process has become possible only recently, when the
finite element method (FEM) was developed for these
analyses [3]. The FEM codes for sheet metal forming
may be classified accordingly to their type of
integration: implicit or explicit. Their main solution
procedures are the dynamic explicit and the static
implicit ones. The principal analysis methods used in
7/23/2019 Al Azraq Ingegneria Chimica Dei Materiali e Della Produzione
http://slidepdf.com/reader/full/al-azraq-ingegneria-chimica-dei-materiali-e-della-produzione 397/419
382
sheet metal forming simulation are based on shell,
membrane and continuum elements.
2. Metal sheet drawing processes in the car industry
Depending on the component’s complexity and
quality required, the drawing process may be
performed using diverse methods. The most common
are: single action, double action and crash forming.
Single Action Process: this process is widely used,
especially when surface quality is not a priority
requirement. This procedure is based in a single slide
(ram) movement: the punch is stationary, the die moves
down in its direction pressing the metal sheet against
the blankholder, and then deforms the blank with the punch. Cycle time is reduced by approximately 25% in
comparison with the double action process.
Double action: This process is usually used to
form components with large drawing widths needing
large forming efforts, or uniquely because good surface
quality is an important requirement. In this process
type, two distinct and successive actions are
performed: the blank’s blocking and its posterior
deformation. The first step is performed through the
blankholder descending movement, pressing the blank
against the die with a previously defined force factor;
the second step is characterised by punch movement
towards the die, deforming the blank.Crash Forming: This drawing process type
presents as principal characteristic the fact that it does
not have the intervention of the binder [4]. This process
may be divided into three main steps.
- descending movement of the blank towards the die;
- first deformation suffered by the blank when crashing
against the die;
- the punch moves towards the blank, deforming it
against the die.
3. Material requirements for sheet metal drawing
The steel industry has recently produced a number
of Advanced High Strength Steels (AHSS) that are
highly formable, yet possess an excellent combination
of strength, durability, strain rate sensitivity and strain
hardening. These characteristics may enable
automotive designers to achieve both weight reduction
and improved crash safety [5]. The main AHSS used in
automotive industry are the Dual-Phase (DP) and the
Transformation-Induced Plasticity (TRIP) steels.
3.1. Safety requirements
Many of the structural parts of a vehicle are used
to protect passengers in case of crash and are expected
to be strengthened most urgently in line with the
intensifying safety regulations. The materials used in
this kind of components should have as principal
characteristic an excellent energy-absorbing capacity,
as the one evidenced by AHSS.
The two key features that contribute to this high
energy-absorbing property are the high work hardening
(WH) rate and large bake hardening (BH) effect.
The relatively high WH rate, exhibited by AHSS
steels, leads to a higher ultimate tensile strength thanthe one exhibited by conventional HSS of similar yield
strength. This provides for a larger area under the
stress-strain curve, indicating greater energy absorption
when deformed in a crash event to the same degree as
conventional steels. The high WH rate also allows for a
better strain distribution during crash deformation,
providing more stable and predictable axial crush that
is crucial for maximizing energy absorption during a
front or rear crash event [6].
The relatively large BH effect also increases the
energy absorption of DP and TRIP steels by further
increasing the area under the stress-strain curve.
Conventional HSS do not exhibit a strong BH effectand do not benefit from this strengthening mechanism.
3.2. Durability requirements
An automobile component durability depends on
two main factors: corrosion and fatigue resistance.
3.2.1. Corrosion
Vehicle corrosion depends on environmental
causes like:
- exposure of lower body panels and under-vehicle
components to road slush containing de-icing
chemicals [7];- air pollution in industrial centres, particularly where
levels of sulphur dioxide [8] and chloride are high;
- dust control procedures [9] on rural roads (especially
in summer);
- year-round exposure to salt-laden spray, mist, and
other airborne chemicals in combination with high
humidity (in coastal regions).
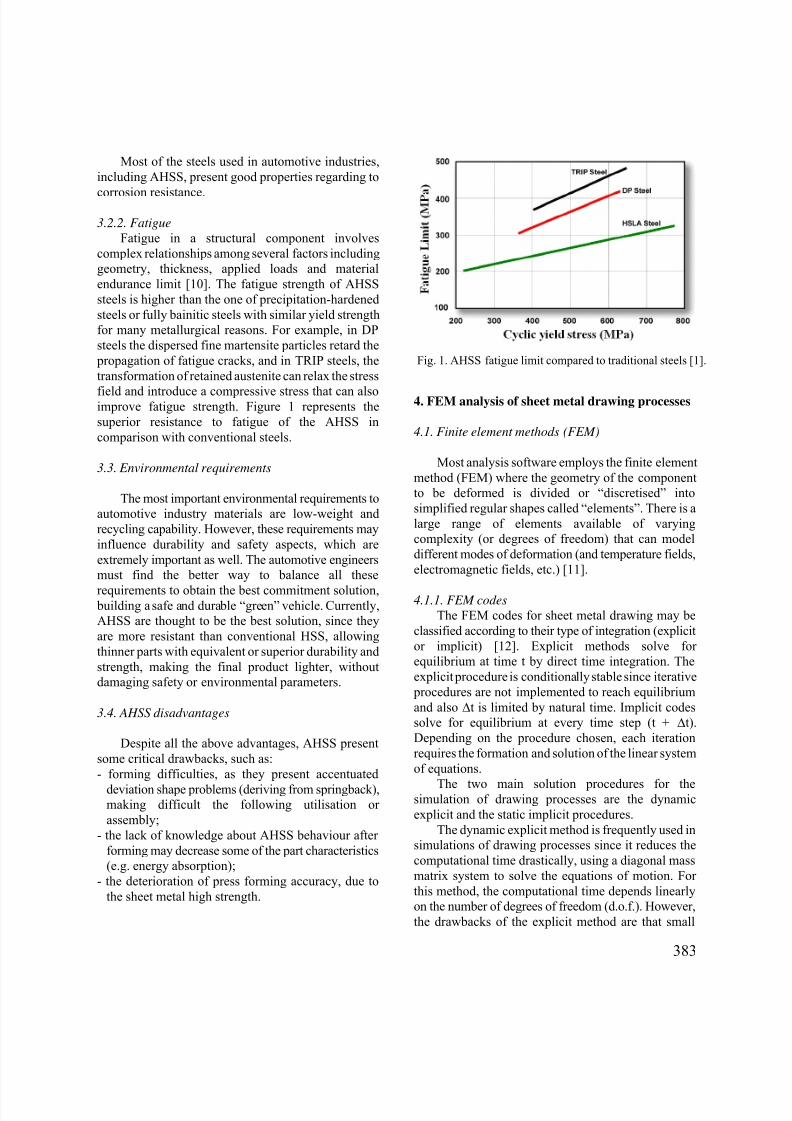
7/23/2019 Al Azraq Ingegneria Chimica Dei Materiali e Della Produzione
http://slidepdf.com/reader/full/al-azraq-ingegneria-chimica-dei-materiali-e-della-produzione 398/419
383
Most of the steels used in automotive industries,
including AHSS, present good properties regarding to
corrosion resistance.
3.2.2. Fatigue
Fatigue in a structural component involves
complex relationships among several factors including
geometry, thickness, applied loads and material
endurance limit [10]. The fatigue strength of AHSS
steels is higher than the one of precipitation-hardened
steels or fully bainitic steels with similar yield strength
for many metallurgical reasons. For example, in DP
steels the dispersed fine martensite particles retard the
propagation of fatigue cracks, and in TRIP steels, the
transformation of retained austenite can relax the stress
field and introduce a compressive stress that can alsoimprove fatigue strength. Figure 1 represents the
superior resistance to fatigue of the AHSS in
comparison with conventional steels.
3.3. Environmental requirements
The most important environmental requirements to
automotive industry materials are low-weight and
recycling capability. However, these requirements may
influence durability and safety aspects, which are
extremely important as well. The automotive engineers
must find the better way to balance all these
requirements to obtain the best commitment solution, building a safe and durable “green” vehicle. Currently,
AHSS are thought to be the best solution, since they
are more resistant than conventional HSS, allowing
thinner parts with equivalent or superior durability and
strength, making the final product lighter, without
damaging safety or environmental parameters.
3.4. AHSS disadvantages
Despite all the above advantages, AHSS present
some critical drawbacks, such as:
- forming difficulties, as they present accentuated
deviation shape problems (deriving from springback),making difficult the following utilisation or
assembly;
- the lack of knowledge about AHSS behaviour after
forming may decrease some of the part characteristics
(e.g. energy absorption);
- the deterioration of press forming accuracy, due to
the sheet metal high strength.
4. FEM analysis of sheet metal drawing processes
4.1. Finite element methods (FEM)
Most analysis software employs the finite element
method (FEM) where the geometry of the component
to be deformed is divided or “discretised” into
simplified regular shapes called “elements”. There is a
large range of elements available of varying
complexity (or degrees of freedom) that can model
different modes of deformation (and temperature fields,
electromagnetic fields, etc.) [11].
4.1.1. FEM codes
The FEM codes for sheet metal drawing may be
classified according to their type of integration (explicit
or implicit) [12]. Explicit methods solve for
equilibrium at time t by direct time integration. The
explicit procedure is conditionally stable since iterative
procedures are not implemented to reach equilibrium
and also ∆t is limited by natural time. Implicit codes
solve for equilibrium at every time step (t + ∆t).
Depending on the procedure chosen, each iteration
requires the formation and solution of the linear system
of equations.
The two main solution procedures for thesimulation of drawing processes are the dynamic
explicit and the static implicit procedures.
The dynamic explicit method is frequently used in
simulations of drawing processes since it reduces the
computational time drastically, using a diagonal mass
matrix system to solve the equations of motion. For
this method, the computational time depends linearly
on the number of degrees of freedom (d.o.f.). However,
the drawbacks of the explicit method are that small
Fig. 1. AHSS fatigue limit compared to traditional steels [1].
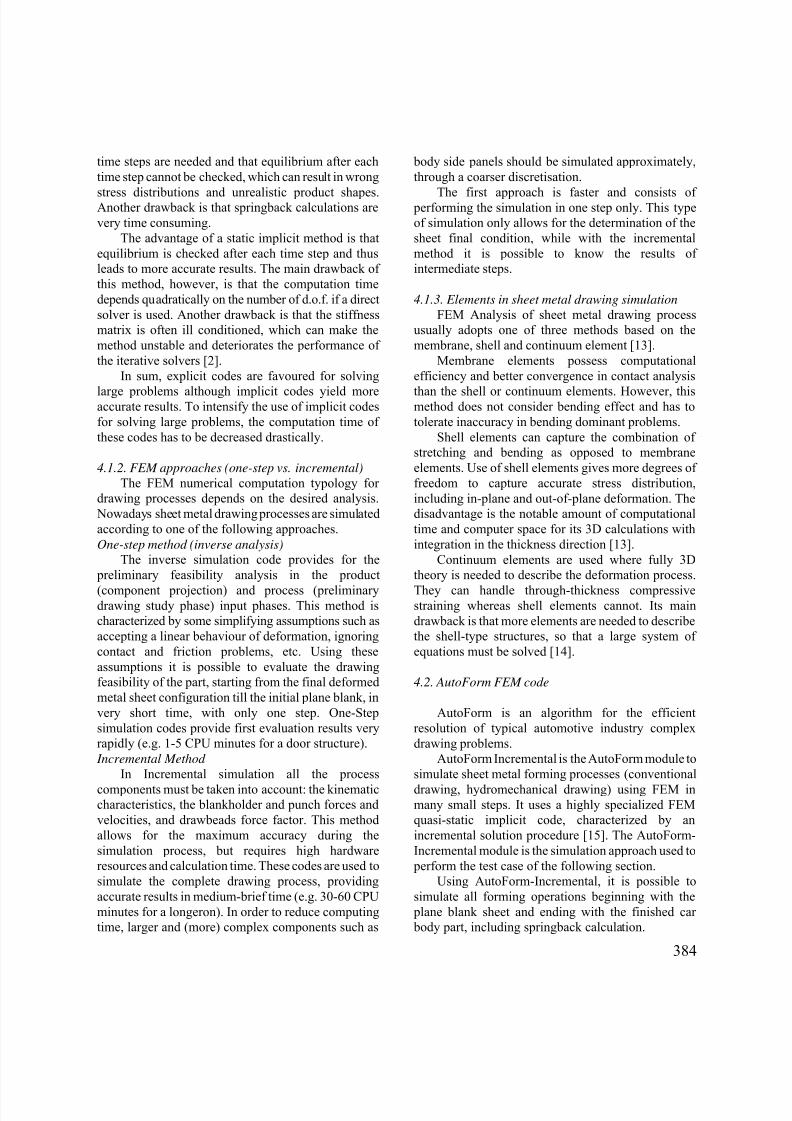
7/23/2019 Al Azraq Ingegneria Chimica Dei Materiali e Della Produzione
http://slidepdf.com/reader/full/al-azraq-ingegneria-chimica-dei-materiali-e-della-produzione 399/419
384
time steps are needed and that equilibrium after each
time step cannot be checked, which can result in wrong
stress distributions and unrealistic product shapes.Another drawback is that springback calculations are
very time consuming.
The advantage of a static implicit method is that
equilibrium is checked after each time step and thus
leads to more accurate results. The main drawback of
this method, however, is that the computation time
depends quadratically on the number of d.o.f. if a direct
solver is used. Another drawback is that the stiffness
matrix is often ill conditioned, which can make the
method unstable and deteriorates the performance of
the iterative solvers [2].
In sum, explicit codes are favoured for solving
large problems although implicit codes yield moreaccurate results. To intensify the use of implicit codes
for solving large problems, the computation time of
these codes has to be decreased drastically.
4.1.2. FEM approaches (one-step vs. incremental)
The FEM numerical computation typology for
drawing processes depends on the desired analysis.
Nowadays sheet metal drawing processes are simulated
according to one of the following approaches.
One-step method (inverse analysis)
The inverse simulation code provides for the
preliminary feasibility analysis in the product
(component projection) and process (preliminarydrawing study phase) input phases. This method is
characterized by some simplifying assumptions such as
accepting a linear behaviour of deformation, ignoring
contact and friction problems, etc. Using these
assumptions it is possible to evaluate the drawing
feasibility of the part, starting from the final deformed
metal sheet configuration till the initial plane blank, in
very short time, with only one step. One-Step
simulation codes provide first evaluation results very
rapidly (e.g. 1-5 CPU minutes for a door structure).
Incremental Method
In Incremental simulation all the process
components must be taken into account: the kinematiccharacteristics, the blankholder and punch forces and
velocities, and drawbeads force factor. This method
allows for the maximum accuracy during the
simulation process, but requires high hardware
resources and calculation time. These codes are used to
simulate the complete drawing process, providing
accurate results in medium-brief time (e.g. 30-60 CPU
minutes for a longeron). In order to reduce computing
time, larger and (more) complex components such as
body side panels should be simulated approximately,
through a coarser discretisation.
The first approach is faster and consists of performing the simulation in one step only. This type
of simulation only allows for the determination of the
sheet final condition, while with the incremental
method it is possible to know the results of
intermediate steps.
4.1.3. Elements in sheet metal drawing simulation
FEM Analysis of sheet metal drawing process
usually adopts one of three methods based on the
membrane, shell and continuum element [13].
Membrane elements possess computational
efficiency and better convergence in contact analysis
than the shell or continuum elements. However, thismethod does not consider bending effect and has to
tolerate inaccuracy in bending dominant problems.
Shell elements can capture the combination of
stretching and bending as opposed to membrane
elements. Use of shell elements gives more degrees of
freedom to capture accurate stress distribution,
including in-plane and out-of-plane deformation. The
disadvantage is the notable amount of computational
time and computer space for its 3D calculations with
integration in the thickness direction [13].
Continuum elements are used where fully 3D
theory is needed to describe the deformation process.
They can handle through-thickness compressivestraining whereas shell elements cannot. Its main
drawback is that more elements are needed to describe
the shell-type structures, so that a large system of
equations must be solved [14].
4.2. AutoForm FEM code
AutoForm is an algorithm for the efficient
resolution of typical automotive industry complex
drawing problems.
AutoForm Incremental is the AutoForm module to
simulate sheet metal forming processes (conventional
drawing, hydromechanical drawing) using FEM inmany small steps. It uses a highly specialized FEM
quasi-static implicit code, characterized by an
incremental solution procedure [15]. The AutoForm-
Incremental module is the simulation approach used to
perform the test case of the following section.
Using AutoForm-Incremental, it is possible to
simulate all forming operations beginning with the
plane blank sheet and ending with the finished car
body part, including springback calculation.
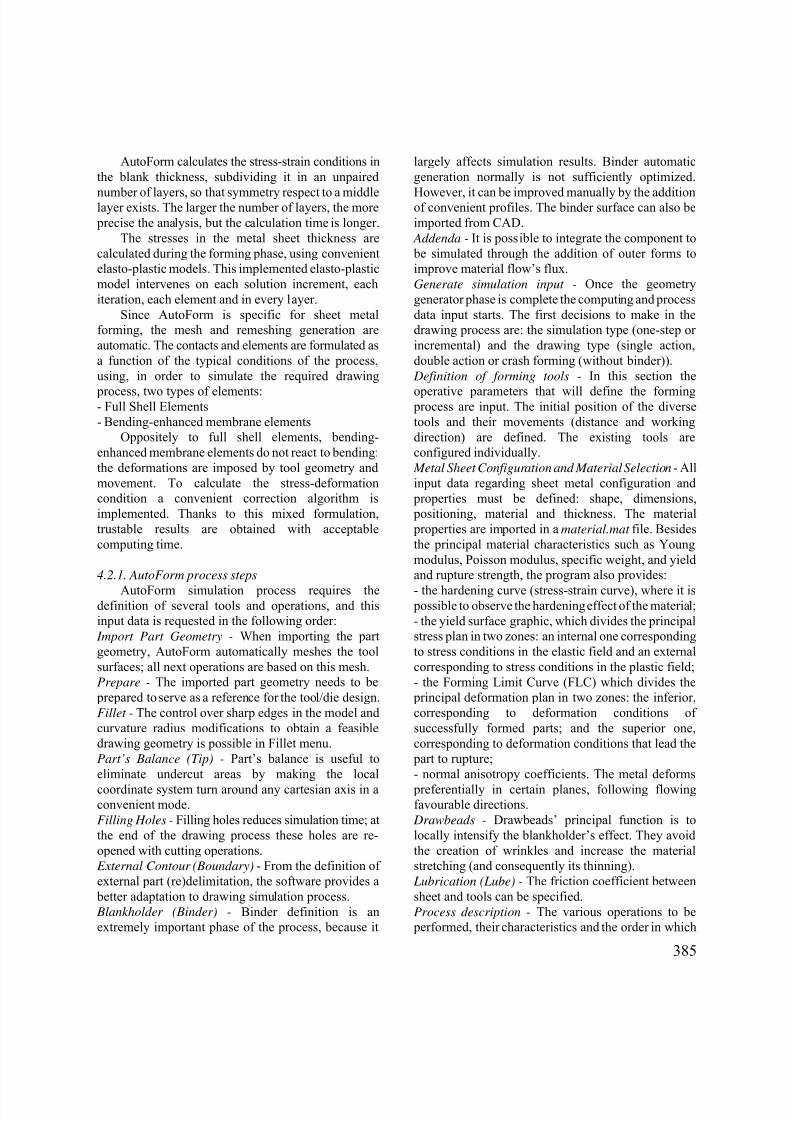
7/23/2019 Al Azraq Ingegneria Chimica Dei Materiali e Della Produzione
http://slidepdf.com/reader/full/al-azraq-ingegneria-chimica-dei-materiali-e-della-produzione 400/419
385
AutoForm calculates the stress-strain conditions in
the blank thickness, subdividing it in an unpaired
number of layers, so that symmetry respect to a middlelayer exists. The larger the number of layers, the more
precise the analysis, but the calculation time is longer.
The stresses in the metal sheet thickness are
calculated during the forming phase, using convenient
elasto-plastic models. This implemented elasto-plastic
model intervenes on each solution increment, each
iteration, each element and in every layer.
Since AutoForm is specific for sheet metal
forming, the mesh and remeshing generation are
automatic. The contacts and elements are formulated as
a function of the typical conditions of the process,
using, in order to simulate the required drawing
process, two types of elements:- Full Shell Elements
- Bending-enhanced membrane elements
Oppositely to full shell elements, bending-
enhanced membrane elements do not react to bending:
the deformations are imposed by tool geometry and
movement. To calculate the stress-deformation
condition a convenient correction algorithm is
implemented. Thanks to this mixed formulation,
trustable results are obtained with acceptable
computing time.
4.2.1. AutoForm process steps
AutoForm simulation process requires thedefinition of several tools and operations, and this
input data is requested in the following order:
Import Part Geometry - When importing the part
geometry, AutoForm automatically meshes the tool
surfaces; all next operations are based on this mesh.
Prepare - The imported part geometry needs to be
prepared to serve as a reference for the tool/die design.
Fillet - The control over sharp edges in the model and
curvature radius modifications to obtain a feasible
drawing geometry is possible in Fillet menu.
Part’s Balance (Tip) - Part’s balance is useful to
eliminate undercut areas by making the local
coordinate system turn around any cartesian axis in aconvenient mode.
Filling Holes - Filling holes reduces simulation time; at
the end of the drawing process these holes are re-
opened with cutting operations.
External Contour (Boundary) - From the definition of
external part (re)delimitation, the software provides a
better adaptation to drawing simulation process.
Blankholder (Binder) - Binder definition is an
extremely important phase of the process, because it
largely affects simulation results. Binder automatic
generation normally is not sufficiently optimized.
However, it can be improved manually by the additionof convenient profiles. The binder surface can also be
imported from CAD.
Addenda - It is possible to integrate the component to
be simulated through the addition of outer forms to
improve material flow’s flux.
Generate simulation input - Once the geometry
generator phase is complete the computing and process
data input starts. The first decisions to make in the
drawing process are: the simulation type (one-step or
incremental) and the drawing type (single action,
double action or crash forming (without binder)).
Definition of forming tools - In this section the
operative parameters that will define the forming process are input. The initial position of the diverse
tools and their movements (distance and working
direction) are defined. The existing tools are
configured individually.
Metal Sheet Configuration and Material Selection - All
input data regarding sheet metal configuration and
properties must be defined: shape, dimensions,
positioning, material and thickness. The material
properties are imported in a material.mat file. Besides
the principal material characteristics such as Young
modulus, Poisson modulus, specific weight, and yield
and rupture strength, the program also provides:
- the hardening curve (stress-strain curve), where it is possible to observe the hardening effect of the material;
- the yield surface graphic, which divides the principal
stress plan in two zones: an internal one corresponding
to stress conditions in the elastic field and an external
corresponding to stress conditions in the plastic field;
- the Forming Limit Curve (FLC) which divides the
principal deformation plan in two zones: the inferior,
corresponding to deformation conditions of
successfully formed parts; and the superior one,
corresponding to deformation conditions that lead the
part to rupture;
- normal anisotropy coefficients. The metal deforms
preferentially in certain planes, following flowingfavourable directions.
Drawbeads - Drawbeads’ principal function is to
locally intensify the blankholder’s effect. They avoid
the creation of wrinkles and increase the material
stretching (and consequently its thinning).
Lubrication (Lube) - The friction coefficient between
sheet and tools can be specified.
Process description - The various operations to be
performed, their characteristics and the order in which
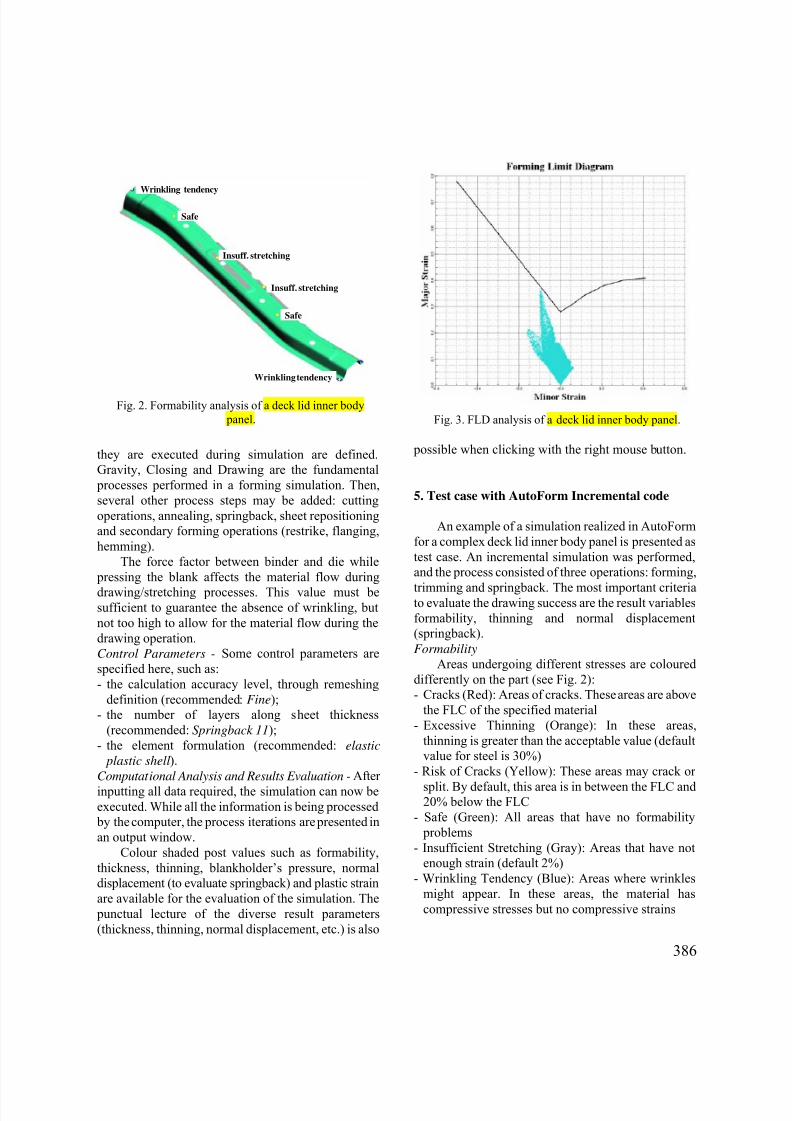
7/23/2019 Al Azraq Ingegneria Chimica Dei Materiali e Della Produzione
http://slidepdf.com/reader/full/al-azraq-ingegneria-chimica-dei-materiali-e-della-produzione 401/419
386
they are executed during simulation are defined.
Gravity, Closing and Drawing are the fundamental
processes performed in a forming simulation. Then,
several other process steps may be added: cutting
operations, annealing, springback, sheet repositioning
and secondary forming operations (restrike, flanging,
hemming).
The force factor between binder and die while
pressing the blank affects the material flow during
drawing/stretching processes. This value must besufficient to guarantee the absence of wrinkling, but
not too high to allow for the material flow during the
drawing operation.
Control Parameters - Some control parameters are
specified here, such as:
- the calculation accuracy level, through remeshing
definition (recommended: Fine);
- the number of layers along sheet thickness
(recommended: Springback 11);
- the element formulation (recommended: elastic
plastic shell).
Computational Analysis and Results Evaluation - After
inputting all data required, the simulation can now be
executed. While all the information is being processed
by the computer, the process iterations are presented in
an output window.
Colour shaded post values such as formability,
thickness, thinning, blankholder’s pressure, normal
displacement (to evaluate springback) and plastic strain
are available for the evaluation of the simulation. The
punctual lecture of the diverse result parameters
(thickness, thinning, normal displacement, etc.) is also
possible when clicking with the right mouse button.
5. Test case with AutoForm Incremental code
An example of a simulation realized in AutoForm
for a complex deck lid inner body panel is presented as
test case. An incremental simulation was performed,
and the process consisted of three operations: forming,
trimming and springback. The most important criteriato evaluate the drawing success are the result variables
formability, thinning and normal displacement
(springback).
Formability
Areas undergoing different stresses are coloured
differently on the part (see Fig. 2):
- Cracks (Red): Areas of cracks. These areas are above
the FLC of the specified material
- Excessive Thinning (Orange): In these areas,
thinning is greater than the acceptable value (default
value for steel is 30%)
- Risk of Cracks (Yellow): These areas may crack or
split. By default, this area is in between the FLC and20% below the FLC
- Safe (Green): All areas that have no formability
problems
- Insufficient Stretching (Gray): Areas that have not
enough strain (default 2%)
- Wrinkling Tendency (Blue): Areas where wrinkles
might appear. In these areas, the material has
compressive stresses but no compressive strains
Fig. 2. Formability analysis of a deck lid inner body
panel. Fig. 3. FLD analysis of a deck lid inner body panel.
Wrinkling tendency
Insuff. stretching
Safe
Safe
Wrinkling tendency
Insuff. stretching
Wrinkling tendency
Insuff. stretching
Safe
Safe
Wrinkling tendency
Insuff. stretching
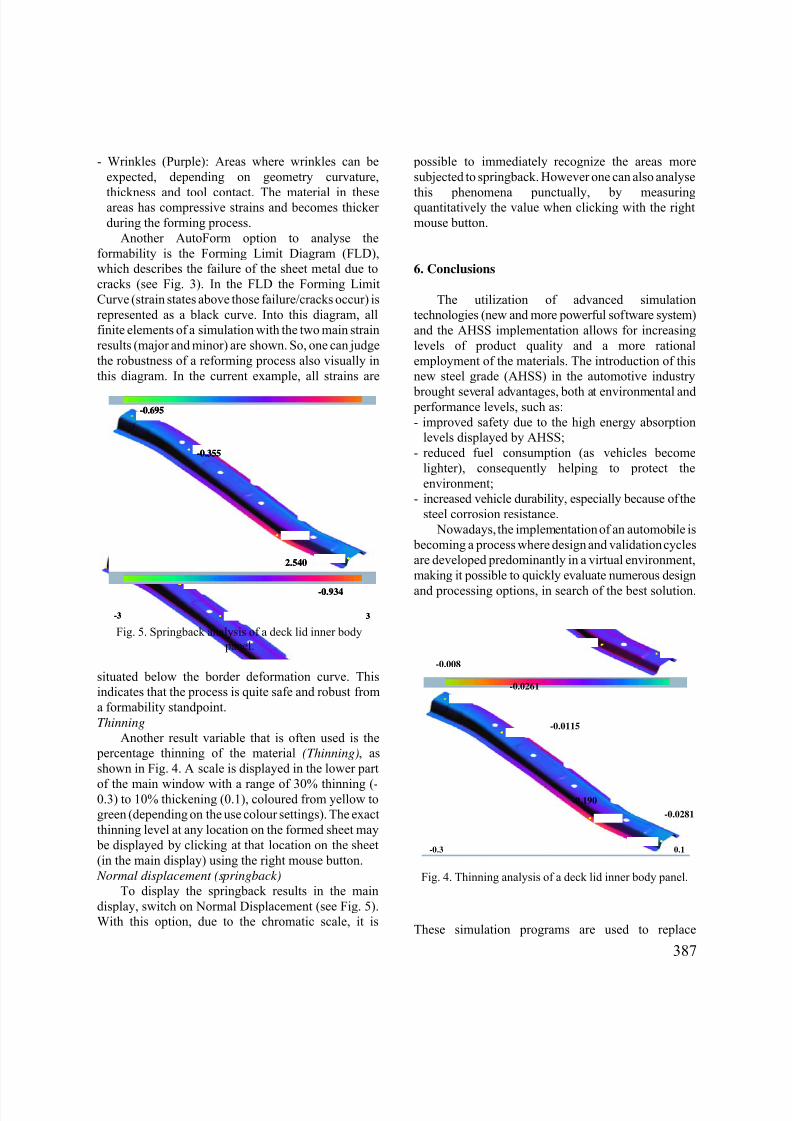
7/23/2019 Al Azraq Ingegneria Chimica Dei Materiali e Della Produzione
http://slidepdf.com/reader/full/al-azraq-ingegneria-chimica-dei-materiali-e-della-produzione 402/419
387
- Wrinkles (Purple): Areas where wrinkles can be
expected, depending on geometry curvature,
thickness and tool contact. The material in theseareas has compressive strains and becomes thicker
during the forming process.
Another AutoForm option to analyse the
formability is the Forming Limit Diagram (FLD),
which describes the failure of the sheet metal due to
cracks (see Fig. 3). In the FLD the Forming Limit
Curve (strain states above those failure/cracks occur) is
represented as a black curve. Into this diagram, all
finite elements of a simulation with the two main strain
results (major and minor) are shown. So, one can judge
the robustness of a reforming process also visually in
this diagram. In the current example, all strains are
situated below the border deformation curve. This
indicates that the process is quite safe and robust from
a formability standpoint.
Thinning
Another result variable that is often used is the
percentage thinning of the material (Thinning), as
shown in Fig. 4. A scale is displayed in the lower part
of the main window with a range of 30% thinning (-0.3) to 10% thickening (0.1), coloured from yellow to
green (depending on the use colour settings). The exact
thinning level at any location on the formed sheet may
be displayed by clicking at that location on the sheet
(in the main display) using the right mouse button.
Normal displacement (springback)
To display the springback results in the main
display, switch on Normal Displacement (see Fig. 5).
With this option, due to the chromatic scale, it is
possible to immediately recognize the areas more
subjected to springback. However one can also analyse
this phenomena punctually, by measuringquantitatively the value when clicking with the right
mouse button.
6. Conclusions
The utilization of advanced simulation
technologies (new and more powerful software system)
and the AHSS implementation allows for increasing
levels of product quality and a more rational
employment of the materials. The introduction of this
new steel grade (AHSS) in the automotive industry
brought several advantages, both at environmental and performance levels, such as:
- improved safety due to the high energy absorption
levels displayed by AHSS;
- reduced fuel consumption (as vehicles become
lighter), consequently helping to protect the
environment;
- increased vehicle durability, especially because of the
steel corrosion resistance.
Nowadays, the implementation of an automobile is
becoming a process where design and validation cycles
are developed predominantly in a virtual environment,
making it possible to quickly evaluate numerous design
and processing options, in search of the best solution.
These simulation programs are used to replace
Fig. 4. Thinning analysis of a deck lid inner body panel.
Fig. 5. Springback analysis of a deck lid inner body
panel.
-0.0261
-0.0115
-0.0281
-0.190
-0.008
-0.3 0.1
-0.0261
-0.0115
-0.0281
-0.190
-0.008
-0.3 0.1
2.540
-0.934
-0.355
-0.695
-3 3
2.540
-0.934
-0.355
-0.695
-3 3
7/23/2019 Al Azraq Ingegneria Chimica Dei Materiali e Della Produzione
http://slidepdf.com/reader/full/al-azraq-ingegneria-chimica-dei-materiali-e-della-produzione 403/419
388
experimental tryouts by virtual tryouts, saving time,
money and resources. Another significant advantage of
its employment is improving and making the die design process much easier, faster and efficient.
The further developments of the research will
include the utilization of a neural network approach to
the modeling of the behaviour of the AHSS work
material under variable strain rate conditions by
reconstructing the stress-strain curves from tensile test
experimental data obtained using different strain rate
values [16].
Acknowledgements
This research work was carried out with partial
support from EC FP6 NoE on Innovative ProductionMachines and Systems – I*PROMS.
References
[1] Takahashi M. Development of high strength steels for
automobiles. Nippon Steel Tech. Rpt. N. 88 July 2003.
[2] Makinouchi A, Teodosiu C and Nakagawa T. Advance
in FEM Simulation and its Related Technologies in
Sheet Metal Forming. SME – Society of
Manufacturing Engineering, 1998.
[3] Boogaard A.H. Van Den, MeindersT., Huetink J.
Efficient implicit finite element analysis of sheet
forming processes. Int. J. Numer. Meth. Eng., 56,2003: 1083-1107.
[4] Schenk1 O.and Selig, M. Advancing crash forming
analysis capabilities through solver technology, 2nd
M.T.I. Conference on Computational fluid and
mechanics, June 17-21, 2003, Boston, USA.
[5] American Iron and Steel Institute & Auto/Steel
Partnership, Automotive Steel Design Manual,
Revision 6.1, August 2002. http://www.steel.org.
[6] International Iron Steel Institute, Advanced High
Strength Steel Application Guidelines, March 2005.
http://www.worldsteel.org.
[7] American Public Works Association, Vehicle
Corrosion Caused by De-icing Salts, Special Report
#34, September 1970. http://www.apwa.net.[8]
Baboian, R. Environmental aspects of automotive
corrosion control, in Corrosion and Corrosion Control
of Aluminum and Steel in Lightweight Automotive
Applications, NACE Intern., Houston, TX, 1995.
[9]
Dust Control, Road Maintenance Costs, Cut with
Calcium Chloride, Public Works, Vol. 121, No. 6, May
1990: 83-84.
[10]
Shaw, R., Zuidema, B. K. New high strength steels
help automakers reach future goals for safety,
affordability, fuel efficiency, and environmental
responsibility SAE Paper 2001-01-3041.
[11]
Miller B and Bond R. The practical use of simulation
in the sheet metal forming industry. Joint paper,
Confed. of British Metalforming Technical Conf. 2001
[12]
Reddy, J.N. An introduction to finite element method,
Mc Graw Hill, Inc., 2nd ed., 1993.
[13]
Hoon Huh, Tae Hoon Choi. Modified membrane Finite
element formulation for sheet metal forming analysis
of planar anisotropic materials. International J. of Mechanical Sciences, 42, 1999: 1623-1643.
[14]
Kawka, M., Makinouchi; A. Shell-element formulation
in the static explicit FEM code for the simulation of
sheet stamping. Journal of Materials Processing
Technology, 50, 1995: 105-115.l
[15] Sester M. Implementation of the selected elastoplastic
models in autoForm-incremental. Workshop 3DS,
Villetaneuse, June 2002.
[16]
Giorleo G., Teti R., Prosco U. and D’Addona D.
Integration of neural network material modelling into
the FEM simulation of metal cutting, 3rd CIRP Int.
Sem. On Intelligent Computation in Manufacturing
Engineering – ICME 2002, Ischia, 3-5 July: 335-342.
7/23/2019 Al Azraq Ingegneria Chimica Dei Materiali e Della Produzione
http://slidepdf.com/reader/full/al-azraq-ingegneria-chimica-dei-materiali-e-della-produzione 404/419
389
Springback prediction with FEM analysis of advancedhigh strength steel stamping process
S. Al Azraq, R. Teti, J. Costa
Dept. of Materials and Production Engineering, University of Naples Federico II, Naples, Italy
Abstract
tool design a very complex task. New demands have led to an increase in the use of Advanced High Strength Steel
(AHSS) as work material. An increase in strength decreases the formability of the material and increases the
springback behaviour. The aim of the numerical simulation carried out in this paper is to verify the stamping process
and the shape of the final component for studying springback of AHSS. Finally, a test case of a simple profilestamping process was analysed using the incremental approach of the AutoForm 4.04 Incremental software code for
two different AHSS materials: Dual-Phase (DP 600) and Transformation-Induced Plasticity (TRIP 800).
Keywords: Springback, Advanced High Strength Steel, Stamping, Finite Element Methods
1. Introduction
As a forming expert in one of the leading car
manufacturing companies, Schacher [1] summarized
the current pressure on this industry as: “In the past we
introduced 3 new models every 10 years, now weintroduce 10 new models every 3 years''. This drastic
reduction of development periods as well as the trend
to reduce weight of the cars in order to reduce the fuel
consumption leads especially in the car manufacturing
industry to a rebuilding of the conventional design and
manufacturing procedures. Sheet metal forming as an
important production process (see for instance [2]) is
heavily experience based and involves trial-and-error
loops. These loops are repeated the more, the less the
experience on the part geometry and the material is. In
innovative process design procedures, however,
trialand-error loops are reduced by means of modern
numerical approximation analysis, which is knownironically also as virtual production. Obtaining
consistent and accurate part dimensions is crucial in
today’s competitive manufacturing industry.
Inconsistencies in part dimensions slow new product
launches, increase changeover times, create difficulties
in downstream processes, require extra quality
assurance efforts, and decrease customer satisfaction
and loyalty for the final product. In the sheet metal
forming process, a major factor preventing accurate
final part dimensions is springback in the work
material [3]. Springback is the geometric difference
between the part in its fully loaded condition, i.e.
conforming to the tooling geometry, and when the part
is in its unloaded condition, i.e. free state. For acomplicated 3-D part, undesirable twist is another form
of springback. The uneven distribution of stress
through the sheet thickness direction and across the
stamping in the loaded condition relaxes during
unloading, thus producing springback. Factors that
affect the amount of springback include variations in
both process and material parameters, such as friction
conditions, tooling geometry, material properties, sheet
thickness, and die temperature [4]. Because controlling
all these variables in the manufacturing process is
nearly impossible, springback, in turn, cannot be
readily controlled. Moreover, as springback is a highly
nonlinear phenomenon, numerical simulations andcorrecting methods become highly complex.
1.1 Forming analysis with AutoForm-Incremental
Finite element methods (FEM) simulations based on
incremental approaches [5] offer a full process model
that simulates the metal sheet forming stages as
accurately as possible in the logical order from
blankholder to final flanging. Consequently,
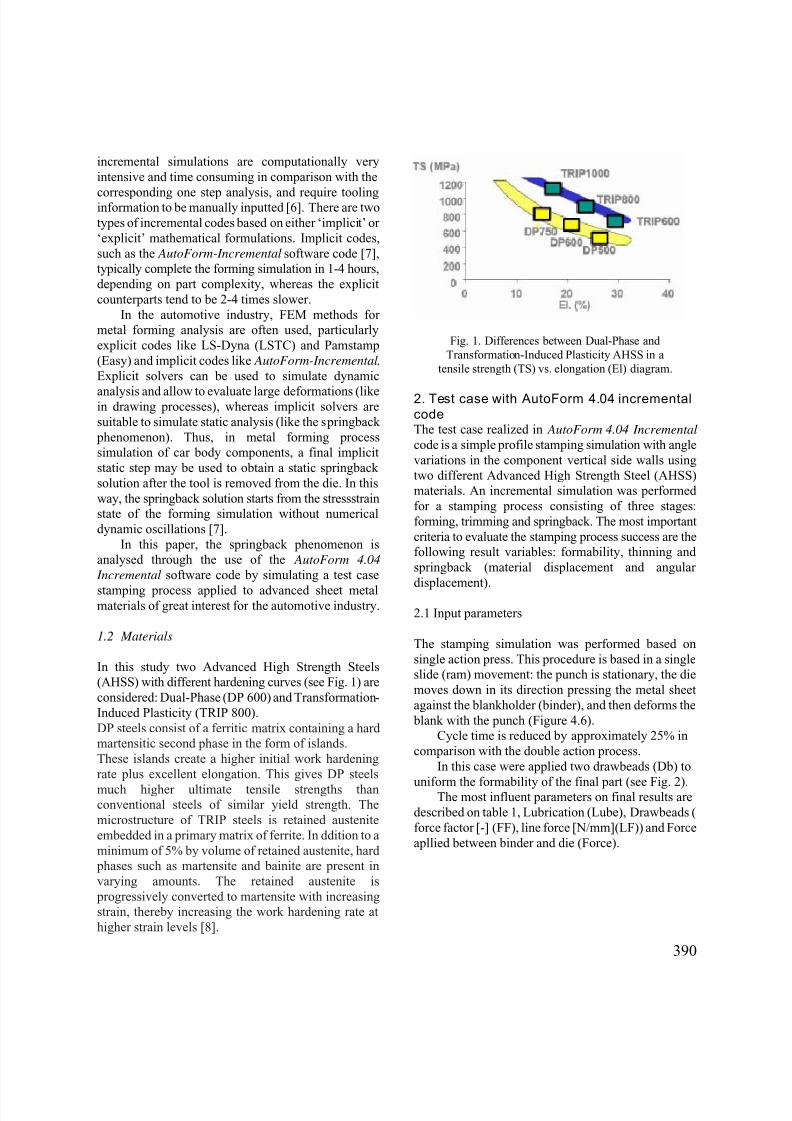
7/23/2019 Al Azraq Ingegneria Chimica Dei Materiali e Della Produzione
http://slidepdf.com/reader/full/al-azraq-ingegneria-chimica-dei-materiali-e-della-produzione 405/419
390
incremental simulations are computationally very
intensive and time consuming in comparison with the
corresponding one step analysis, and require toolinginformation to be manually inputted [6]. There are two
types of incremental codes based on either ‘implicit’ or
‘explicit’ mathematical formulations. Implicit codes,
such as the AutoForm-Incremental software code [7],
typically complete the forming simulation in 1-4 hours,
depending on part complexity, whereas the explicit
counterparts tend to be 2-4 times slower.
In the automotive industry, FEM methods for
metal forming analysis are often used, particularly
explicit codes like LS-Dyna (LSTC) and Pamstamp
(Easy) and implicit codes like AutoForm-Incremental.
Explicit solvers can be used to simulate dynamic
analysis and allow to evaluate large deformations (likein drawing processes), whereas implicit solvers are
suitable to simulate static analysis (like the springback
phenomenon). Thus, in metal forming process
simulation of car body components, a final implicit
static step may be used to obtain a static springback
solution after the tool is removed from the die. In this
way, the springback solution starts from the stressstrain
state of the forming simulation without numerical
dynamic oscillations [7].
In this paper, the springback phenomenon is
analysed through the use of the AutoForm 4.04
Incremental software code by simulating a test case
stamping process applied to advanced sheet metal materials of great interest for the automotive industry.
1.2 Materials
In this study two Advanced High Strength Steels
(AHSS) with different hardening curves (see Fig. 1) are
considered: Dual-Phase (DP 600) and Transformation-
Induced Plasticity (TRIP 800).
DP steels consist of a ferritic matrix containing a hard
martensitic second phase in the form of islands.
These islands create a higher initial work hardening
rate plus excellent elongation. This gives DP steels
much higher ultimate tensile strengths thanconventional steels of similar yield strength. The
microstructure of TRIP steels is retained austenite
embedded in a primary matrix of ferrite. In ddition to a
minimum of 5% by volume of retained austenite, hard
phases such as martensite and bainite are present in
varying amounts. The retained austenite is
progressively converted to martensite with increasing
strain, thereby increasing the work hardening rate at
higher strain levels [8].
Fig. 1. Differences between Dual-Phase and
Transformation-Induced Plasticity AHSS in a
tensile strength (TS) vs. elongation (El) diagram.
2. Test case with AutoForm 4.04 incremental
codeThe test case realized in AutoForm 4.04 Incremental
code is a simple profile stamping simulation with angle
variations in the component vertical side walls using
two different Advanced High Strength Steel (AHSS)
materials. An incremental simulation was performed
for a stamping process consisting of three stages:
forming, trimming and springback. The most important
criteria to evaluate the stamping process success are the
following result variables: formability, thinning and
springback (material displacement and angular
displacement).
2.1 Input parameters
The stamping simulation was performed based on
single action press. This procedure is based in a single
slide (ram) movement: the punch is stationary, the die
moves down in its direction pressing the metal sheet
against the blankholder (binder), and then deforms the
blank with the punch (Figure 4.6).
Cycle time is reduced by approximately 25% in
comparison with the double action process.
In this case were applied two drawbeads (Db) to
uniform the formability of the final part (see Fig. 2).The most influent parameters on final results are
described on table 1, Lubrication (Lube), Drawbeads (
force factor [-] (FF), line force [N/mm](LF)) and Force
apllied between binder and die (Force).
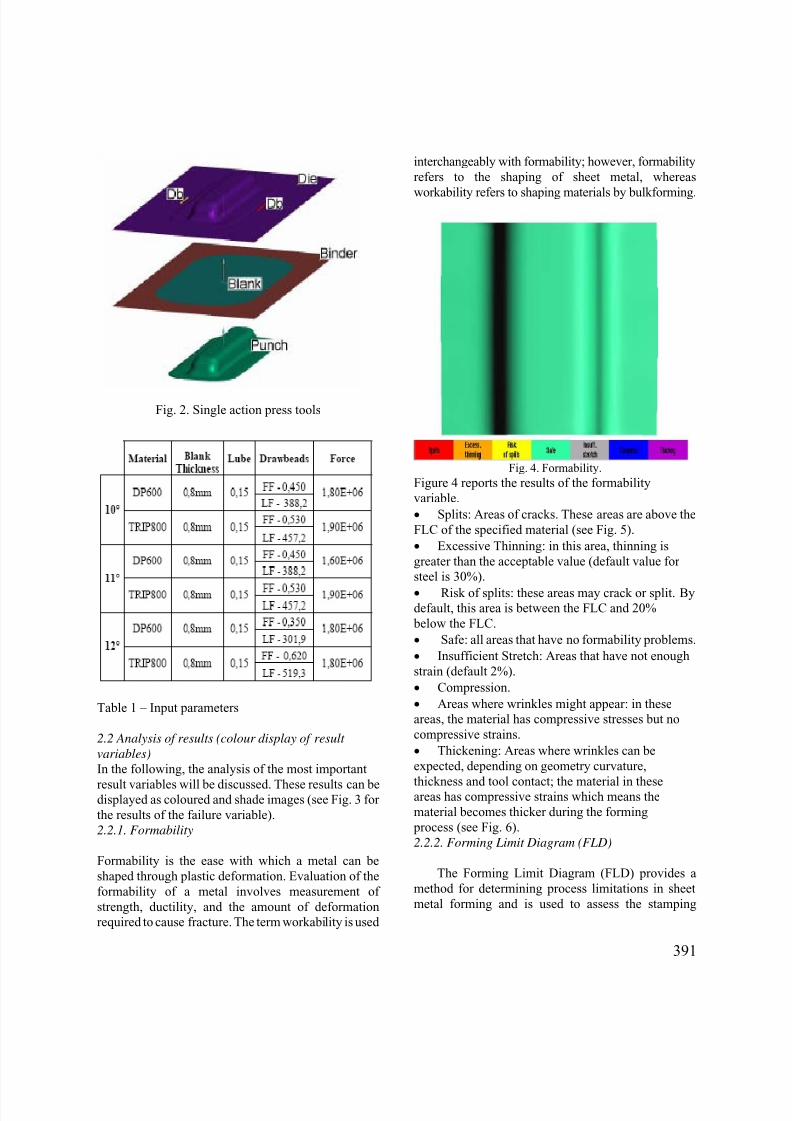
7/23/2019 Al Azraq Ingegneria Chimica Dei Materiali e Della Produzione
http://slidepdf.com/reader/full/al-azraq-ingegneria-chimica-dei-materiali-e-della-produzione 406/419
391
Fig. 2. Single action press tools
Table 1 – Input parameters
2.2 Analysis of results (colour display of result
variables)
In the following, the analysis of the most important
result variables will be discussed. These results can bedisplayed as coloured and shade images (see Fig. 3 for
the results of the failure variable).
2.2.1. Formability
Formability is the ease with which a metal can be
shaped through plastic deformation. Evaluation of the
formability of a metal involves measurement of
strength, ductility, and the amount of deformation
required to cause fracture. The term workability is used
interchangeably with formability; however, formability
refers to the shaping of sheet metal, whereas
workability refers to shaping materials by bulkforming.
Fig. 4. Formability.
Figure 4 reports the results of the formability
variable.
• Splits: Areas of cracks. These areas are above the
FLC of the specified material (see Fig. 5).
• Excessive Thinning: in this area, thinning is
greater than the acceptable value (default value for
steel is 30%).
•
Risk of splits: these areas may crack or split. Bydefault, this area is between the FLC and 20%
below the FLC.
• Safe: all areas that have no formability problems.
• Insufficient Stretch: Areas that have not enough
strain (default 2%).
• Compression.
• Areas where wrinkles might appear: in these
areas, the material has compressive stresses but no
compressive strains.
• Thickening: Areas where wrinkles can be
expected, depending on geometry curvature,
thickness and tool contact; the material in theseareas has compressive strains which means the
material becomes thicker during the forming
process (see Fig. 6).
2.2.2. Forming Limit Diagram (FLD)
The Forming Limit Diagram (FLD) provides a
method for determining process limitations in sheet
metal forming and is used to assess the stamping
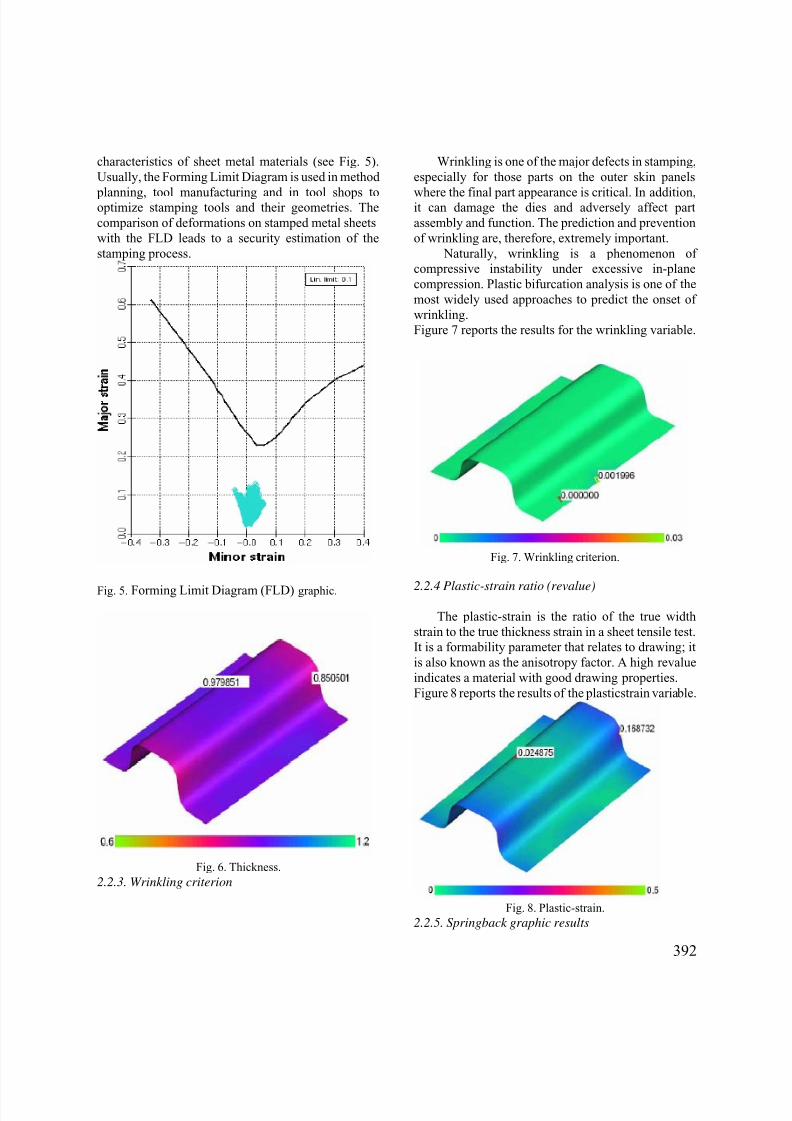
7/23/2019 Al Azraq Ingegneria Chimica Dei Materiali e Della Produzione
http://slidepdf.com/reader/full/al-azraq-ingegneria-chimica-dei-materiali-e-della-produzione 407/419
392
characteristics of sheet metal materials (see Fig. 5).
Usually, the Forming Limit Diagram is used in method
planning, tool manufacturing and in tool shops tooptimize stamping tools and their geometries. The
comparison of deformations on stamped metal sheets
with the FLD leads to a security estimation of the
stamping process.
Fig. 5. Forming Limit Diagram (FLD) graphic.
Fig. 6. Thickness.
2.2.3. Wrinkling criterion
Wrinkling is one of the major defects in stamping,
especially for those parts on the outer skin panels
where the final part appearance is critical. In addition,it can damage the dies and adversely affect part
assembly and function. The prediction and prevention
of wrinkling are, therefore, extremely important.
Naturally, wrinkling is a phenomenon of
compressive instability under excessive in-plane
compression. Plastic bifurcation analysis is one of the
most widely used approaches to predict the onset of
wrinkling.
Figure 7 reports the results for the wrinkling variable.
Fig. 7. Wrinkling criterion.
2.2.4 Plastic-strain ratio (revalue)
The plastic-strain is the ratio of the true width
strain to the true thickness strain in a sheet tensile test.
It is a formability parameter that relates to drawing; it
is also known as the anisotropy factor. A high revalue
indicates a material with good drawing properties.
Figure 8 reports the results of the plasticstrain variable.
Fig. 8. Plastic-strain.
2.2.5. Springback graphic results
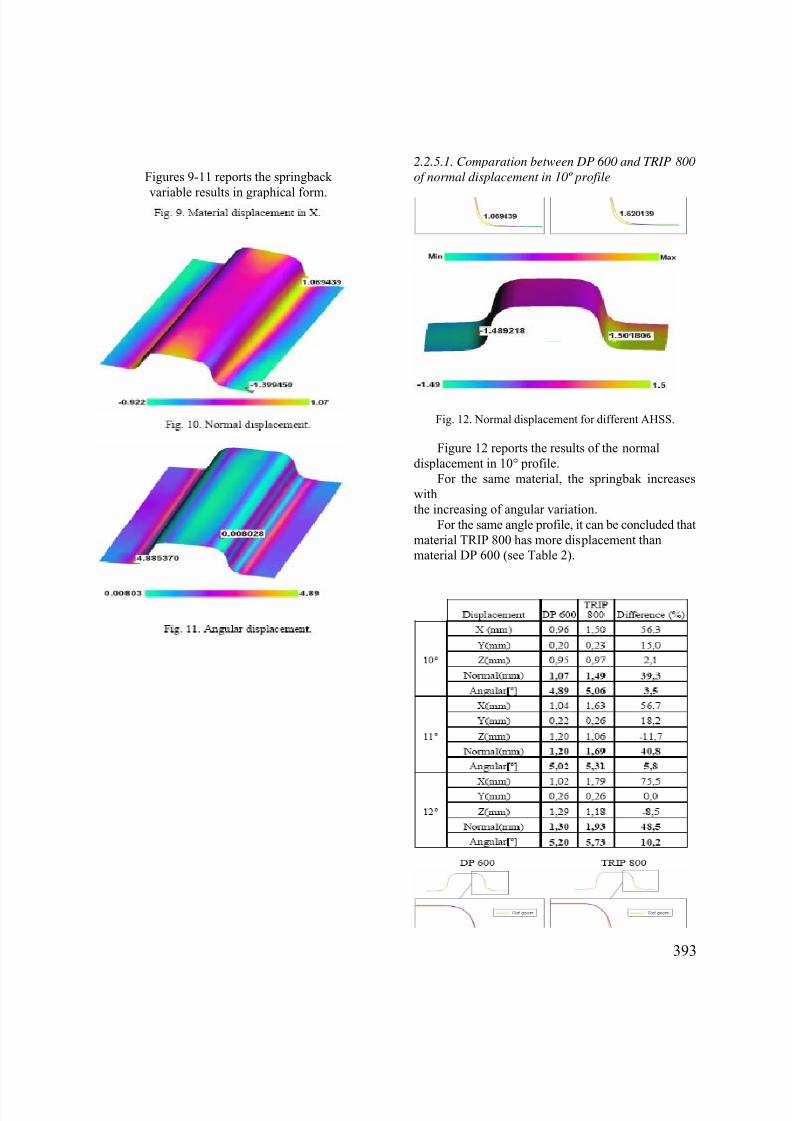
7/23/2019 Al Azraq Ingegneria Chimica Dei Materiali e Della Produzione
http://slidepdf.com/reader/full/al-azraq-ingegneria-chimica-dei-materiali-e-della-produzione 408/419
393
Figures 9-11 reports the springback
variable results in graphical form.
2.2.5.1. Comparation between DP 600 and TRIP 800
of normal displacement in 10º profile
Fig. 12. Normal displacement for different AHSS.
Figure 12 reports the results of the normal
displacement in 10° profile.
For the same material, the springbak increases
with
the increasing of angular variation.
For the same angle profile, it can be concluded that
material TRIP 800 has more displacement than
material DP 600 (see Table 2).
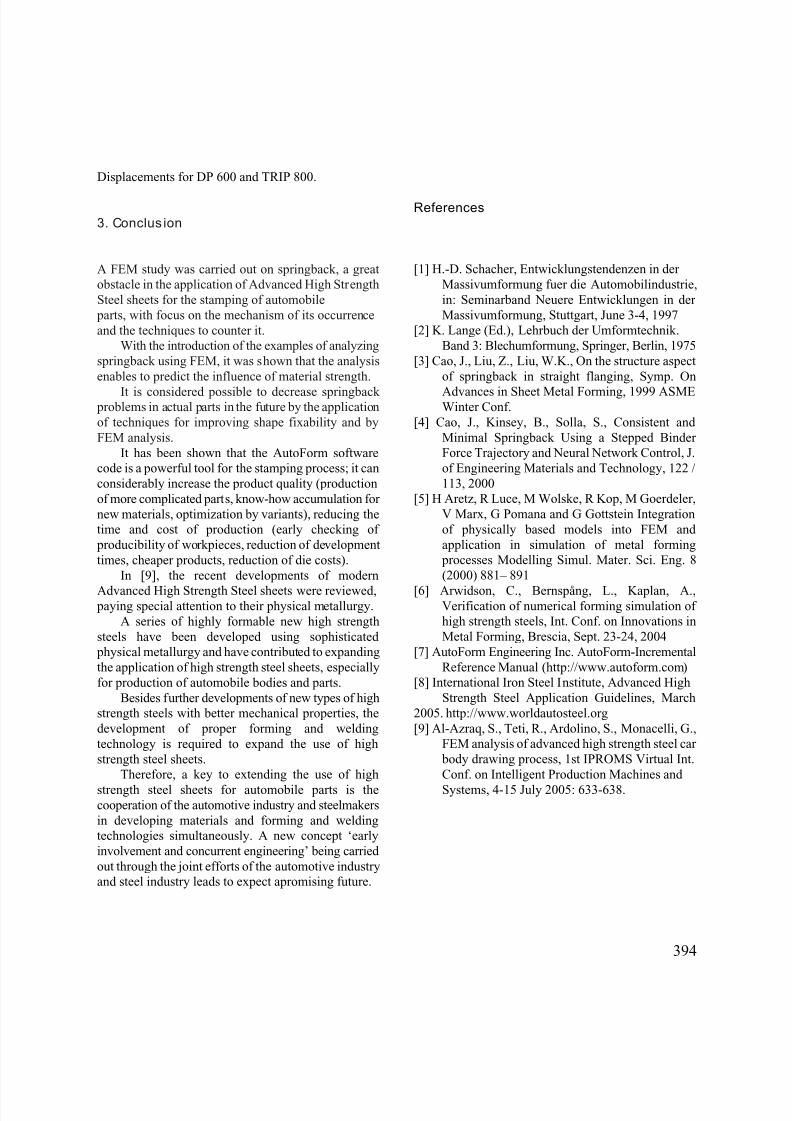
7/23/2019 Al Azraq Ingegneria Chimica Dei Materiali e Della Produzione
http://slidepdf.com/reader/full/al-azraq-ingegneria-chimica-dei-materiali-e-della-produzione 409/419
394
Displacements for DP 600 and TRIP 800.
3. Conclus ion
A FEM study was carried out on springback, a great
obstacle in the application of Advanced High Strength
Steel sheets for the stamping of automobile
parts, with focus on the mechanism of its occurrence
and the techniques to counter it.
With the introduction of the examples of analyzing
springback using FEM, it was shown that the analysis
enables to predict the influence of material strength.
It is considered possible to decrease springback problems in actual parts in the future by the application
of techniques for improving shape fixability and by
FEM analysis.
It has been shown that the AutoForm software
code is a powerful tool for the stamping process; it can
considerably increase the product quality (production
of more complicated parts, know-how accumulation for
new materials, optimization by variants), reducing the
time and cost of production (early checking of
producibility of workpieces, reduction of development
times, cheaper products, reduction of die costs).
In [9], the recent developments of modern
Advanced High Strength Steel sheets were reviewed, paying special attention to their physical metallurgy.
A series of highly formable new high strength
steels have been developed using sophisticated
physical metallurgy and have contributed to expanding
the application of high strength steel sheets, especially
for production of automobile bodies and parts.
Besides further developments of new types of high
strength steels with better mechanical properties, the
development of proper forming and welding
technology is required to expand the use of high
strength steel sheets.
Therefore, a key to extending the use of high
strength steel sheets for automobile parts is thecooperation of the automotive industry and steelmakers
in developing materials and forming and welding
technologies simultaneously. A new concept ‘early
involvement and concurrent engineering’ being carried
out through the joint efforts of the automotive industry
and steel industry leads to expect apromising future.
References
[1] H.-D. Schacher, Entwicklungstendenzen in der
Massivumformung fuer die Automobilindustrie,
in: Seminarband Neuere Entwicklungen in der
Massivumformung, Stuttgart, June 3-4, 1997
[2] K. Lange (Ed.), Lehrbuch der Umformtechnik.
Band 3: Blechumformung, Springer, Berlin, 1975
[3] Cao, J., Liu, Z., Liu, W.K., On the structure aspect
of springback in straight flanging, Symp. On
Advances in Sheet Metal Forming, 1999 ASMEWinter Conf.
[4] Cao, J., Kinsey, B., Solla, S., Consistent and
Minimal Springback Using a Stepped Binder
Force Trajectory and Neural Network Control, J.
of Engineering Materials and Technology, 122 /
113, 2000
[5] H Aretz, R Luce, M Wolske, R Kop, M Goerdeler,
V Marx, G Pomana and G Gottstein Integration
of physically based models into FEM and
application in simulation of metal forming
processes Modelling Simul. Mater. Sci. Eng. 8
(2000) 881– 891
[6] Arwidson, C., Bernspång, L., Kaplan, A.,Verification of numerical forming simulation of
high strength steels, Int. Conf. on Innovations in
Metal Forming, Brescia, Sept. 23-24, 2004
[7] AutoForm Engineering Inc. AutoForm-Incremental
Reference Manual (http://www.autoform.com)
[8] International Iron Steel Institute, Advanced High
Strength Steel Application Guidelines, March
2005. http://www.worldautosteel.org
[9] Al-Azraq, S., Teti, R., Ardolino, S., Monacelli, G.,
FEM analysis of advanced high strength steel car
body drawing process, 1st IPROMS Virtual Int.
Conf. on Intelligent Production Machines and
Systems, 4-15 July 2005: 633-638.
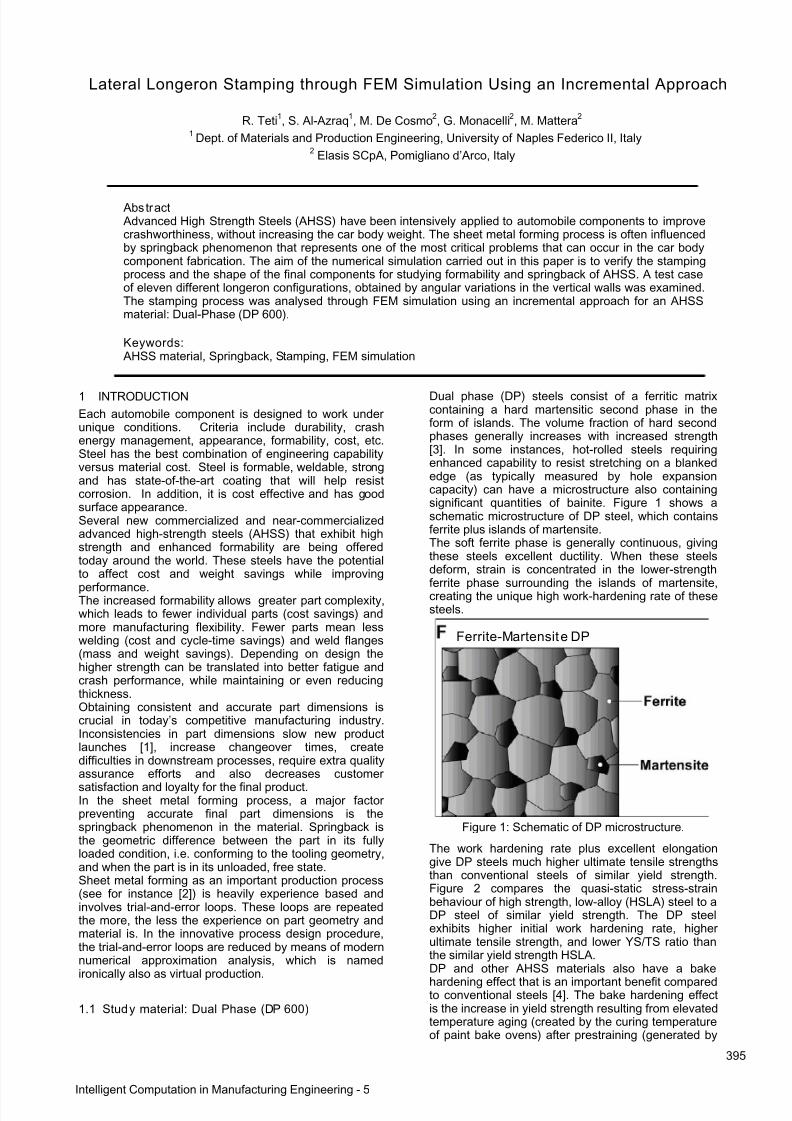
7/23/2019 Al Azraq Ingegneria Chimica Dei Materiali e Della Produzione
http://slidepdf.com/reader/full/al-azraq-ingegneria-chimica-dei-materiali-e-della-produzione 410/419
395
Lateral Longeron Stamping through FEM Simulation Using an Incremental Approach
R. Teti1, S. Al-Azraq
1, M. De Cosmo
2, G. Monacelli
2, M. Mattera
2
1Dept. of Materials and Production Engineering, University of Naples Federico II, Italy
2 Elasis SCpA, Pomigliano d’Arco, Italy
Abs tract Advanced High Strength Steels (AHSS) have been intensively applied to automobile components to improvecrashworthiness, without increasing the car body weight. The sheet metal forming process is often influencedby springback phenomenon that represents one of the most critical problems that can occur in the car bodycomponent fabrication. The aim of the numerical simulation carried out in this paper is to verify the stampingprocess and the shape of the final components for studying formability and springback of AHSS. A test caseof eleven different longeron configurations, obtained by angular variations in the vertical walls was examined.The stamping process was analysed through FEM simulation using an incremental approach for an AHSSmaterial: Dual-Phase (DP 600).
Keywords: AHSS material, Springback, Stamping, FEM simulation
1 INTRODUCTION
Each automobile component is designed to work underunique conditions. Criteria include durability, crashenergy management, appearance, formability, cost, etc.Steel has the best combination of engineering capabilityversus material cost. Steel is formable, weldable, strongand has state-of-the-art coating that will help resistcorrosion. In addition, it is cost effective and has goodsurface appearance.Several new commercialized and near-commercializedadvanced high-strength steels (AHSS) that exhibit highstrength and enhanced formability are being offeredtoday around the world. These steels have the potentialto affect cost and weight savings while improving
performance.The increased formability allows greater part complexity,which leads to fewer individual parts (cost savings) andmore manufacturing flexibility. Fewer parts mean lesswelding (cost and cycle-time savings) and weld flanges(mass and weight savings). Depending on design thehigher strength can be translated into better fatigue andcrash performance, while maintaining or even reducingthickness.Obtaining consistent and accurate part dimensions iscrucial in today’s competitive manufacturing industry.Inconsistencies in part dimensions slow new productlaunches [1], increase changeover times, createdifficulties in downstream processes, require extra qualityassurance efforts and also decreases customer
satisfaction and loyalty for the final product.In the sheet metal forming process, a major factorpreventing accurate final part dimensions is thespringback phenomenon in the material. Springback isthe geometric difference between the part in its fullyloaded condition, i.e. conforming to the tooling geometry,and when the part is in its unloaded, free state.Sheet metal forming as an important production process(see for instance [2]) is heavily experience based andinvolves trial-and-error loops. These loops are repeatedthe more, the less the experience on part geometry andmaterial is. In the innovative process design procedure,the trial-and-error loops are reduced by means of modernnumerical approximation analysis, which is namedironically also as virtual production.
1.1 Study material: Dual Phase (DP 600)
Dual phase (DP) steels consist of a ferritic matrixcontaining a hard martensitic second phase in theform of islands. The volume fraction of hard secondphases generally increases with increased strength[3]. In some instances, hot-rolled steels requiringenhanced capability to resist stretching on a blankededge (as typically measured by hole expansioncapacity) can have a microstructure also containingsignificant quantities of bainite. Figure 1 shows aschematic microstructure of DP steel, which containsferrite plus islands of martensite.The soft ferrite phase is generally continuous, givingthese steels excellent ductility. When these steelsdeform, strain is concentrated in the lower-strength
ferrite phase surrounding the islands of martensite,creating the unique high work-hardening rate of thesesteels.
Figure 1: Schematic of DP microstructure.
The work hardening rate plus excellent elongationgive DP steels much higher ultimate tensile strengthsthan conventional steels of similar yield strength.Figure 2 compares the quasi-static stress-strainbehaviour of high strength, low-alloy (HSLA) steel to aDP steel of similar yield strength. The DP steelexhibits higher initial work hardening rate, higherultimate tensile strength, and lower YS/TS ratio thanthe similar yield strength HSLA.DP and other AHSS materials also have a bake
hardening effect that is an important benefit comparedto conventional steels [4]. The bake hardening effectis the increase in yield strength resulting from elevatedtemperature aging (created by the curing temperatureof paint bake ovens) after prestraining (generated by
Ferrite-Martensite DP
Intelligent Computation in Manufacturing Engineering - 5
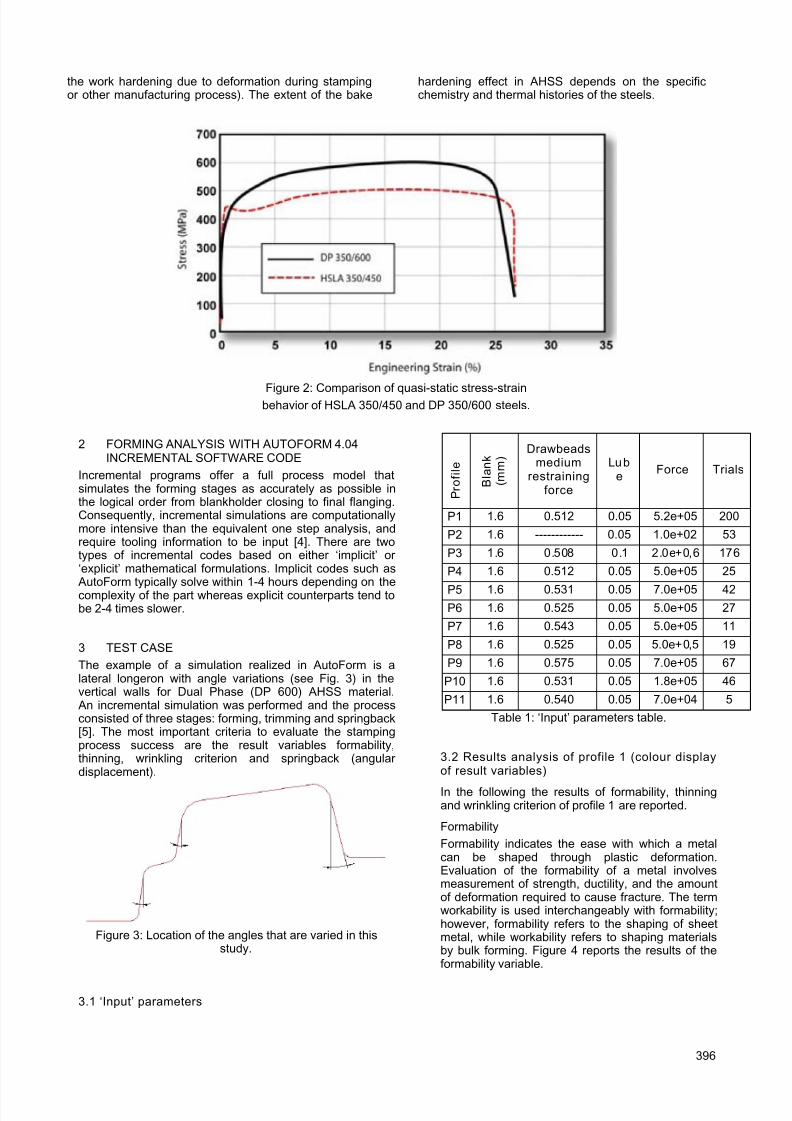
7/23/2019 Al Azraq Ingegneria Chimica Dei Materiali e Della Produzione
http://slidepdf.com/reader/full/al-azraq-ingegneria-chimica-dei-materiali-e-della-produzione 411/419
396
the work hardening due to deformation during stampingor other manufacturing process). The extent of the bake
hardening effect in AHSS depends on the specificchemistry and thermal histories of the steels.
Figure 2: Comparison of quasi-static stress-strainbehavior of HSLA 350/450 and DP 350/600 steels.
2 FORMING ANALYSIS WITH AUTOFORM 4.04INCREMENTAL SOFTWARE CODE
Incremental programs offer a full process model thatsimulates the forming stages as accurately as possible inthe logical order from blankholder closing to final flanging.Consequently, incremental simulations are computationallymore intensive than the equivalent one step analysis, andrequire tooling information to be input [4]. There are twotypes of incremental codes based on either ‘implicit’ or‘explicit’ mathematical formulations. Implicit codes such as AutoForm typically solve within 1-4 hours depending on thecomplexity of the part whereas explicit counterparts tend tobe 2-4 times slower.
3 TEST CASE
The example of a simulation realized in AutoForm is alateral longeron with angle variations (see Fig. 3) in thevertical walls for Dual Phase (DP 600) AHSS material. An incremental simulation was performed and the processconsisted of three stages: forming, trimming and springback[5]. The most important criteria to evaluate the stampingprocess success are the result variables formability,thinning, wrinkling criterion and springback (angulardisplacement).
Figure 3: Location of the angles that are varied in thisstudy.
3.1 ‘Input’ parameters
P r o f i l e
B l a n k
( m m )
Drawbeadsmedium
restrainingforce
Lube
Force Trials
P1 1.6 0.512 0.05 5.2e+05 200
P2 1.6 ------------ 0.05 1.0e+02 53
P3 1.6 0.508 0.1 2.0e+0,6 176
P4 1.6 0.512 0.05 5.0e+05 25
P5 1.6 0.531 0.05 7.0e+05 42P6 1.6 0.525 0.05 5.0e+05 27
P7 1.6 0.543 0.05 5.0e+05 11
P8 1.6 0.525 0.05 5.0e+0,5 19
P9 1.6 0.575 0.05 7.0e+05 67
P10 1.6 0.531 0.05 1.8e+05 46
P11 1.6 0.540 0.05 7.0e+04 5
Table 1: ‘Input’ parameters table.
3.2 Results analysis of profile 1 (colour displayof result variables)
In the following the results of formability, thinningand wrinkling criterion of profile 1 are reported.
Formability
Formability indicates the ease with which a metalcan be shaped through plastic deformation.Evaluation of the formability of a metal involvesmeasurement of strength, ductility, and the amountof deformation required to cause fracture. The termworkability is used interchangeably with formability;however, formability refers to the shaping of sheetmetal, while workability refers to shaping materialsby bulk forming. Figure 4 reports the results of theformability variable.
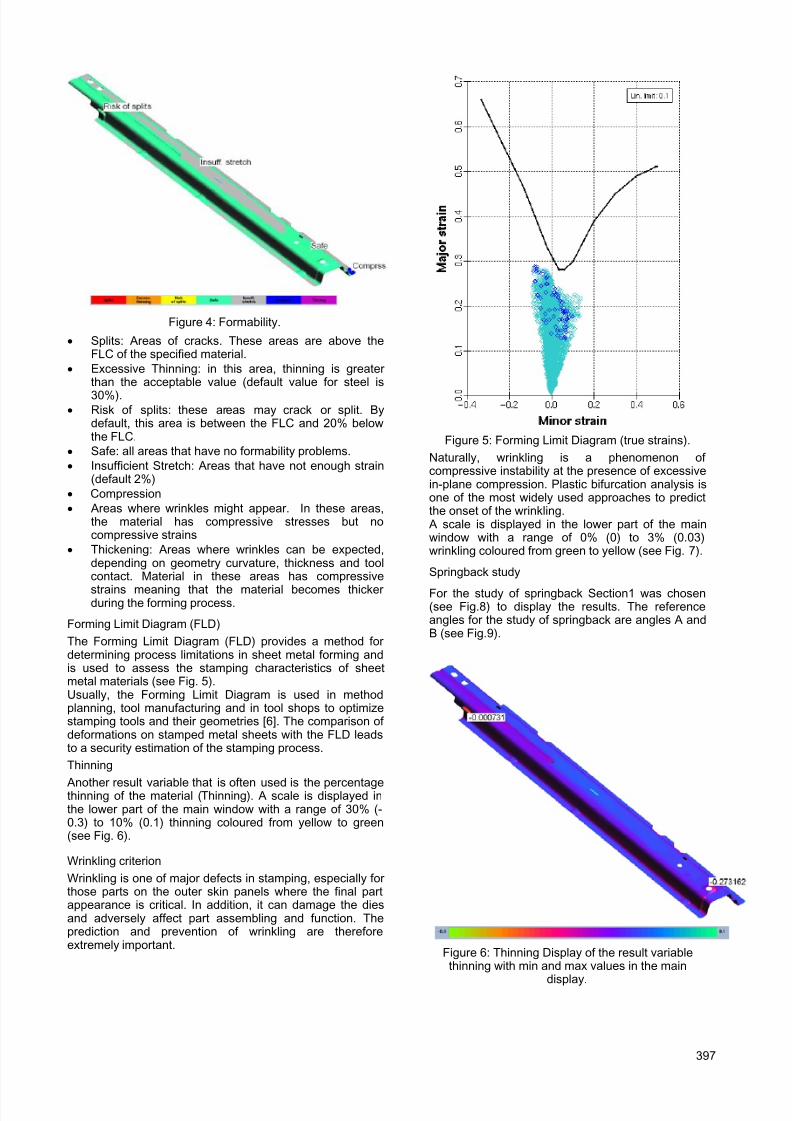
7/23/2019 Al Azraq Ingegneria Chimica Dei Materiali e Della Produzione
http://slidepdf.com/reader/full/al-azraq-ingegneria-chimica-dei-materiali-e-della-produzione 412/419
397
Figure 4: Formability.
• Splits: Areas of cracks. These areas are above theFLC of the specified material.
• Excessive Thinning: in this area, thinning is greaterthan the acceptable value (default value for steel is
30%).• Risk of splits: these areas may crack or split. By
default, this area is between the FLC and 20% belowthe FLC.
• Safe: all areas that have no formability problems.
• Insufficient Stretch: Areas that have not enough strain(default 2%)
• Compression
• Areas where wrinkles might appear. In these areas,the material has compressive stresses but nocompressive strains
• Thickening: Areas where wrinkles can be expected,depending on geometry curvature, thickness and toolcontact. Material in these areas has compressive
strains meaning that the material becomes thickerduring the forming process.
Forming Limit Diagram (FLD)
The Forming Limit Diagram (FLD) provides a method fordetermining process limitations in sheet metal forming andis used to assess the stamping characteristics of sheetmetal materials (see Fig. 5).Usually, the Forming Limit Diagram is used in methodplanning, tool manufacturing and in tool shops to optimizestamping tools and their geometries [6]. The comparison ofdeformations on stamped metal sheets with the FLD leadsto a security estimation of the stamping process.
Thinning
Another result variable that is often used is the percentagethinning of the material (Thinning). A scale is displayed inthe lower part of the main window with a range of 30% (-0.3) to 10% (0.1) thinning coloured from yellow to green(see Fig. 6).
Wrinkling criterion
Wrinkling is one of major defects in stamping, especially forthose parts on the outer skin panels where the final partappearance is critical. In addition, it can damage the diesand adversely affect part assembling and function. Theprediction and prevention of wrinkling are thereforeextremely important.
Figure 5: Forming Limit Diagram (true strains).
Naturally, wrinkling is a phenomenon ofcompressive instability at the presence of excessivein-plane compression. Plastic bifurcation analysis isone of the most widely used approaches to predictthe onset of the wrinkling. A scale is displayed in the lower part of the mainwindow with a range of 0% (0) to 3% (0.03)wrinkling coloured from green to yellow (see Fig. 7).
Springback study
For the study of springback Section1 was chosen(see Fig.8) to display the results. The referenceangles for the study of springback are angles A andB (see Fig.9).
Figure 6: Thinning Display of the result variablethinning with min and max values in the main
display.
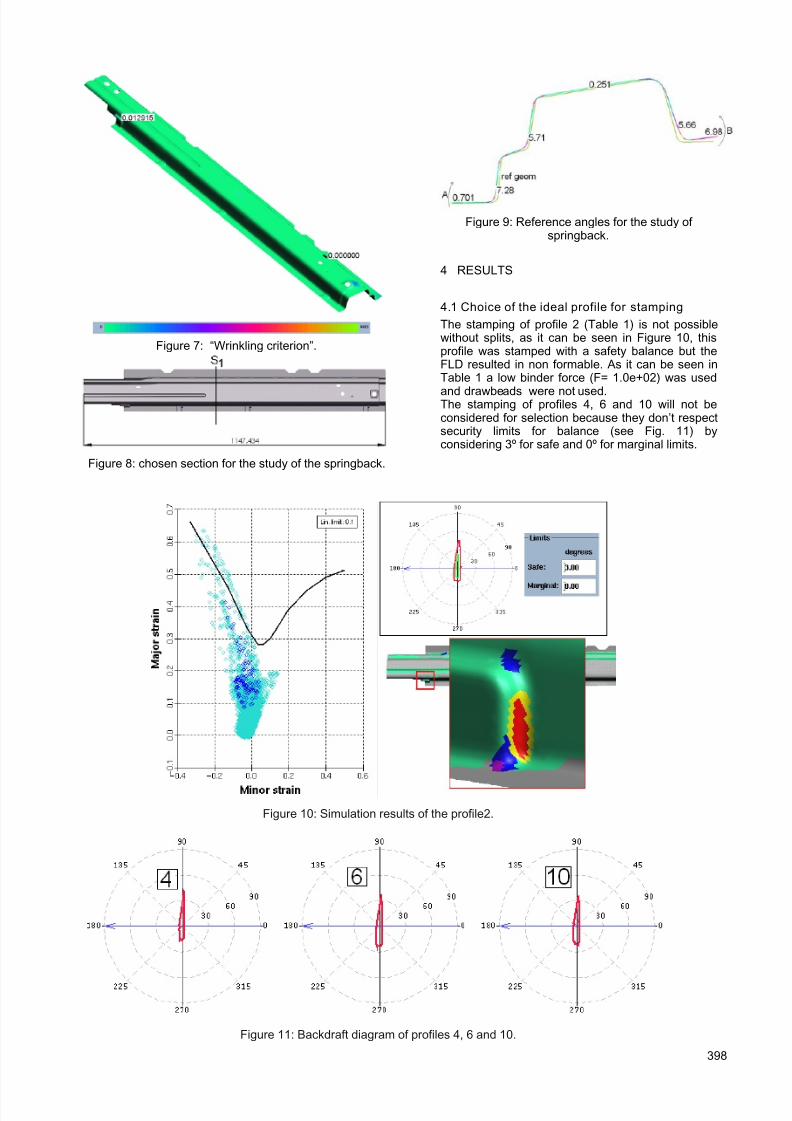
7/23/2019 Al Azraq Ingegneria Chimica Dei Materiali e Della Produzione
http://slidepdf.com/reader/full/al-azraq-ingegneria-chimica-dei-materiali-e-della-produzione 413/419
398
Figure 7: “Wrinkling criterion”.
Figure 8: chosen section for the study of the springback.
Figure 9: Reference angles for the study ofspringback.
4 RESULTS
4.1 Choice of the ideal profile for stamping
The stamping of profile 2 (Table 1) is not possiblewithout splits, as it can be seen in Figure 10, thisprofile was stamped with a safety balance but theFLD resulted in non formable. As it can be seen inTable 1 a low binder force (F= 1.0e+02) was used
and drawbeads were not used.The stamping of profiles 4, 6 and 10 will not beconsidered for selection because they don’t respectsecurity limits for balance (see Fig. 11) byconsidering 3º for safe and 0º for marginal limits.
Figure 10: Simulation results of the profile2.
Figure 11: Backdraft diagram of profiles 4, 6 and 10.
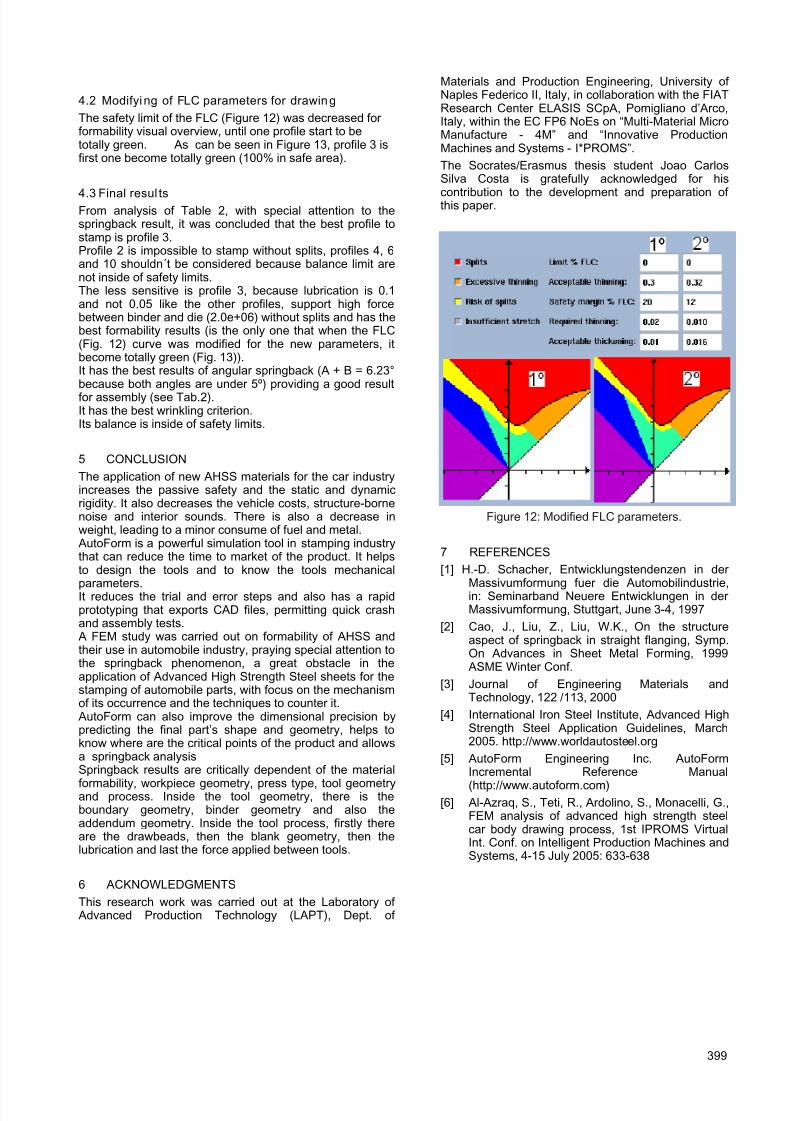
7/23/2019 Al Azraq Ingegneria Chimica Dei Materiali e Della Produzione
http://slidepdf.com/reader/full/al-azraq-ingegneria-chimica-dei-materiali-e-della-produzione 414/419
399
4.2 Modifying of FLC parameters for drawing
The safety limit of the FLC (Figure 12) was decreased forformability visual overview, until one profile start to betotally green. As can be seen in Figure 13, profile 3 isfirst one become totally green (100% in safe area).
4.3 Final resul tsFrom analysis of Table 2, with special attention to thespringback result, it was concluded that the best profile tostamp is profile 3.Profile 2 is impossible to stamp without splits, profiles 4, 6and 10 shouldn´t be considered because balance limit arenot inside of safety limits.The less sensitive is profile 3, because lubrication is 0.1and not 0.05 like the other profiles, support high forcebetween binder and die (2.0e+06) without splits and has thebest formability results (is the only one that when the FLC(Fig. 12) curve was modified for the new parameters, itbecome totally green (Fig. 13)).It has the best results of angular springback (A + B = 6.23°because both angles are under 5º) providing a good resultfor assembly (see Tab.2).It has the best wrinkling criterion.Its balance is inside of safety limits.
5 CONCLUSION
The application of new AHSS materials for the car industryincreases the passive safety and the static and dynamicrigidity. It also decreases the vehicle costs, structure-bornenoise and interior sounds. There is also a decrease inweight, leading to a minor consume of fuel and metal. AutoForm is a powerful simulation tool in stamping industrythat can reduce the time to market of the product. It helpsto design the tools and to know the tools mechanical
parameters.It reduces the trial and error steps and also has a rapidprototyping that exports CAD files, permitting quick crashand assembly tests. A FEM study was carried out on formability of AHSS andtheir use in automobile industry, praying special attention tothe springback phenomenon, a great obstacle in theapplication of Advanced High Strength Steel sheets for thestamping of automobile parts, with focus on the mechanismof its occurrence and the techniques to counter it. AutoForm can also improve the dimensional precision bypredicting the final part’s shape and geometry, helps toknow where are the critical points of the product and allowsa springback analysisSpringback results are critically dependent of the material
formability, workpiece geometry, press type, tool geometryand process. Inside the tool geometry, there is theboundary geometry, binder geometry and also theaddendum geometry. Inside the tool process, firstly thereare the drawbeads, then the blank geometry, then thelubrication and last the force applied between tools.
6 ACKNOWLEDGMENTS
This research work was carried out at the Laboratory of Advanced Production Technology (LAPT), Dept. of
Materials and Production Engineering, University ofNaples Federico II, Italy, in collaboration with the FIATResearch Center ELASIS SCpA, Pomigliano d’Arco,Italy, within the EC FP6 NoEs on “Multi-Material MicroManufacture - 4M” and “Innovative ProductionMachines and Systems - I*PROMS”.
The Socrates/Erasmus thesis student Joao CarlosSilva Costa is gratefully acknowledged for his
contribution to the development and preparation ofthis paper.
Figure 12: Modified FLC parameters.
7 REFERENCES
[1] H.-D. Schacher, Entwicklungstendenzen in der
Massivumformung fuer die Automobilindustrie,in: Seminarband Neuere Entwicklungen in derMassivumformung, Stuttgart, June 3-4, 1997
[2] Cao, J., Liu, Z., Liu, W.K., On the structureaspect of springback in straight flanging, Symp.On Advances in Sheet Metal Forming, 1999 ASME Winter Conf.
[3] Journal of Engineering Materials andTechnology, 122 /113, 2000
[4] International Iron Steel Institute, Advanced HighStrength Steel Application Guidelines, March2005. http://www.worldautosteel.org
[5] AutoForm Engineering Inc. AutoFormIncremental Reference Manual
(http://www.autoform.com)[6] Al-Azraq, S., Teti, R., Ardolino, S., Monacelli, G.,
FEM analysis of advanced high strength steelcar body drawing process, 1st IPROMS VirtualInt. Conf. on Intelligent Production Machines andSystems, 4-15 July 2005: 633-638

7/23/2019 Al Azraq Ingegneria Chimica Dei Materiali e Della Produzione
http://slidepdf.com/reader/full/al-azraq-ingegneria-chimica-dei-materiali-e-della-produzione 415/419
400
Figure 13: Formability results for new FLC parameters.
ThinningWrinklingCriterion
Plasticstrain SB [º] A+B
P1 M=-0,001 M=0,013 M=0,494 A=0,70 7,68
m=-0,273 m=0,000 m=0,006 B=6,98
P2 M=0,086 M=0,200 M=0,685 A=8,60 17,47
m=-0,325 m=0,000 m=0,000 B=8,87
P3 M=-0,010 M=0,004 M=0,402 A=1,98 6,23
m=0,289 m=0,000 m=0,011 B=4,25
P4 M=-0,008 M=0,010 M=0,446 A=3,23 6,69m=-0,272 m=0,000 m=0,014 B=3,46
P5 M=-0,006 M=0,012 M=0,472 A=1,90 8,89
m=-0,281 m=0,000 m=0,012 B=6,99
P6 M=-0,004 M=0,010 M=0,429 A=3,27 7,44
m=-0,283 m=0,000 m=0,009 B=4,17
P7 M=-0,005 M=0,009 M=0,383 A=3,26 8,03
m=-0,280 m=0,000 m=0,008 B=4,77
P8 M=0,004 M=0,010 M=0,423 A=3,97 10,51
m=-0,281 m=0,000 m=0,008 B=6,61
P9 M=-0,009 M=0,004 M=0,391 A=3,22 8,57
m=-0,280 m=0,000 m=0,011 B=5,35P10 M=0,003 M=0,013 M=0,512 A=0,75 6,03
m=-0,276 m=0,000 m=0,012 B=5,28
P11 M=-0,007 M=0,008 M=0,422 A=3,64 10,04
m=-0,279 m=0,000 m=0,008 B=6,76
Table 2: Output results table.
7/23/2019 Al Azraq Ingegneria Chimica Dei Materiali e Della Produzione
http://slidepdf.com/reader/full/al-azraq-ingegneria-chimica-dei-materiali-e-della-produzione 416/419
401
Table of Contents
Introduction………………………………………………………………………………….1Organisation of the Thesis……………………………………………………………..3 Acknowledgements
Section I Include :
I.A . Analysis and study types of materials.I.A .1. Introduction…………………………………………………………..5
I.A .1.1 Characteristics……………………………………………...5I.A .1.2 Contents of this charter………………………………….6
I.A .2. Steel Making ………………………………………………………….6I.A .3. Types and Chemistry of Steel………………………………….11I.A .4. Different Types of Classification………………………………12I.A .5. Advanced High Strength Steels (AHSS)……………………13
I.A .5.1 AHSS Nomenclature……………………………………..13I.A .5.2 Metallurgy of AHSS……………………………………..14I.A .5.3 Mechanical Properties of AHSS…………………….19I.A .5.4 Structural Steel Performance of AHSS……………25I.A .5.5 AHSS Processing ………………………………………..29
I.A .6. Comparative Cost and Mass I.A.6……………………………30I. A.7. Bibliography………………………………………………………….31
I.B . Plasic Deformation Process. I.B .1. Introduction………………………………………………………….33I.B .2. Manufacturing Processes………………………………………..35
I.B .2.1 Stamping …………………………………………………….35I.B .2.2 Roll Forming…………………………………………………36I.B .2.3 Hydroforming……………………………………………….37I.B .2.4 Hot Forming…………………………………………………38I.B .2.5 Incremental Forming…………………………………….39I.B .2.6 Extrusion……………………………………………………..39I.B .2.7 Forging………………………………………………………..40
I.B .3. Stamping Process………………………………………………….41I.B .3.1 A Simple Stamping………………………………………..41I.B .3.2 Description of Stamping Modes………………………43I.B .3.3 Interaction of Stamping Modes……………………….62I.B .3.4 Sequence of Operations…………………………………63I.B .3.5 Press and Tooling Descriptions……………………….67
I.B .4. Lubrication…………………………………………………………….71I.B .5. General Metal Deformation……………………………………..72
I.B .5.1 Failure Modes……………………………………………….72I.B .5.2 Material Formability Parameters……………………..74
I.B .5.3 Circle Grid Analysis………………………………………..75I.B .5.4 Forming Limit Diagram…………………………………..76I.B .6. Crash Management…………………………………………………79
7/23/2019 Al Azraq Ingegneria Chimica Dei Materiali e Della Produzione
http://slidepdf.com/reader/full/al-azraq-ingegneria-chimica-dei-materiali-e-della-produzione 417/419
402
I.B .7. Fatigue………………………………………………………………….80I.B .8. Bibliography…………………………………………………………..82
I.C . Springback phenomenon.I.C .1. Introduction…………………………………………………………..84
I.C .2. Origins of Springback……………………………………………..85I.C .3. Variables affecting Springback…………………………………86
I.C .3.1 Material’s Characteristics……………………………….88I.C .3.2 Forming Parameters………………………………………90
I.C .4. Types of Springback……………………………………………….92I.C .4.1 Angular Change…………………………………………...94I.C .4.2 Sidewall Change…………………………………………..95I.C .4.3 Twist……………………………………………………………98
I.C .5. Springback Correction for AHSS……………………………….99I.C .5.1 Part Design………………………………………………….99
I.C .5.2 Process Design…………………………………………….102I.C .6. Bibliography…………………………………………………………115
I.D . Finite Element Methods
I.D .1. General application of Finite element method………….117I.D .2. many analyses can be performed
With Finite Element Method………………………………..118I.D .2.1 Structural analysis……………………………………….118I.D .2.2 Analyzing Thermal Phenomena…………………….125I.D .2.3 Fluids Analysis……………………………………………125 I.D .2.4 Electromagnetic Field Analysis……………………126
I.D .3. Finite Element Codes……………………………………………129 I.D .4. Sheet Metal Forming Simulation…………………………….132I.D .5. Bibliography…………………………………………………………135
I.E . Simulation of Plastic Deformation Process. I.E .1. Introduction…………………………………………………………138I.E .2. Why the new technology for the Stamping……………..141I.E .3. New Requirements in Metal Forming Analysis………….147I.E .4 New Generation of Sheet Metal Forming Programs….150I.E .5. Springback Simulation…………………………………………..152I.E .6. Bibliography…………………………………………………………154
Section II : Numerical Simulation for two application usingthe ANSYS-LS DYNA Software.
II.A . Impact of sphere in steel into sheet metal II.A .1. FEM Analyses………………………………………………………157
II.A .1.1 Fundamental Concepts..................................157II.A .1.2 Methodology………………………………………………158II.A .1.3 ANSYS LS-DYNA…………………………………………158II.A .1.4 LS-DYNA……………………………………………………159II.A .1.5 Material Models and Contacts………………………159
II.A .2. CONTEXT..............................................................161
II.A .3. Description of the problem……………………………………161II.A .4. Aims of the simulation………………………………………….162II.A .5. Procedure of the simulation………………………………….162
7/23/2019 Al Azraq Ingegneria Chimica Dei Materiali e Della Produzione
http://slidepdf.com/reader/full/al-azraq-ingegneria-chimica-dei-materiali-e-della-produzione 418/419
403
II.A .5.1. Procedure of Simulation ……………………………162II.A .5.2. Decreasing of the calculation time……………....163 II.A .5.3. Choice of the element type………………………….163 II.A .5.4. Meshing…………………………………………………….164
II.A .5.5. Dynamical parameters ………………………………..165II.A .5.5.1 Contact’s definition……………………………165II.A .5.5.2 Initial velocity…………………………………..165II.A .5.5.3 Simulation time…………………………………165
II.A .6. Results………………………………………………………………166II.A .7. Graphics…………………………………………………………….167 II.A .8. InterprEtations- Conclusions………………………………..173II.A .9. Second results…………………………………………………..175II.A .10. Annexes…………………………………………………………..184I.A .11. Bibliography………………………………………………………..200
II.B .Impact of sphere in steel into sheet constituted by Glare.II.B .1. Introduction……………………………………………………….201II.B .2. What is glare ?.....................................................201II.B .3. Methodology of the work…………………………………….207II.B .4 Glare and Fiber metal laminates…………………………..207
II.B .4.1. GLARE…………………………………………………209II.B .4.2. ARALL………………………………………………….210II.B .4.3. CARE……………………………………………………211II.B .4.4. Titanium CARE or HTCL…………………………212
II.B .5. Simulation………………………………………………………...213
II.B .5.1. Problem simplifications………………………….213II.B .5.2. Element type………………………………………..214II.B .5.3. Material models…………………………………….215II.B .5.4. Meshing……………………………………………….216II.B .5.5. Contact parameters……………………………….217
II.B .6. Obtained results………………………………………………..219II.B .7. Analysis of the obtained results…………………………..220II.B .8. Results interpretation…………………………………………237II.B .9. Bibliography……………………………………………………..239
Section III . Numerical simulations of four applications usingthe AUTOFORM Software have been performed.
III.A . Forming Simulation of an automobile components.(Deck lid inner body panel).III.A .1. Introduction……………………………………………………...240III.A .2. Forming Analysis AutoForm Invremental………………241III.A .3. Synthetic Description of AutoForm Process Steps….243III.A .4 Description of the Procedure in AutoForm…………….246
III.A .4.1 Pre-Processing of Input Data………………..286III.A .4.2 Computational Analysis………………………..283III.A .4.3 Post-Processing of Results……………………284
III.A .5. Bibliography…………………………………………………296III.B . Simulation, Results and Evaluation of Lateral Longeron 199
(Fiat Stilo).
7/23/2019 Al Azraq Ingegneria Chimica Dei Materiali e Della Produzione
http://slidepdf.com/reader/full/al-azraq-ingegneria-chimica-dei-materiali-e-della-produzione 419/419
III.B .1. Introduction………………………………………………………297III.B .2. Simulations and Results Analysis………………………..298
of a Longeron 199III.B .2.1 Component Description………………………….298
III.B .2.2 Phases of study…………………………………….299III.B .2.3 Results Evaluation…………………………………311
III.C . A simple profile stamping simulation with angle variations
in the component vertical side walls using two different Advanced High Strength Steel (AHSS).
III.C .1. Introduction……………………………………………………..319III.C .2. Methodology in AutoForm………………………………….319III.C .3. Test Case…………………………………………………………320III.C .4 Synthetic Description of AutoForm Process Steps…321
III.C .4.1. Pre-Processing of Input Data ……………….322
III.C .4.2. Computational Analysis ……………………….341III.C .4.3. Post-Processing of Results …………………..343III.C .5. Final Comment…………………………………………………356
IV.D . Eleven different profiles with differing angular variationsrealizedwith DP600 material were considered.
III.D .1. Introduction…………………………………………………….357III.D .2. Description of the components………………………….357III.D .3. Limits……………………………………………………………..361III.D .4. Input results……………………………………………………362
III.D .4.1. Bilance……………………………………………..362III.D .4.2. Boundary………………………………….........363III.D .4.3. Binder………………………………………………363III.D .4.4. Addendum………………………………………..364III.D .4.5. Single action press…………………………….364III.D .4.6. Drawbeads……………………………………….365III.D .4.7. Blank geometry…………………………………365III.D .4.8. Lubrication……………………………………….366III.D .4.9. Process steps……………………………………366III.D .4.10. Table of input parameters………………..367
III.D .5. Output Result………………………………………………….368III.D .5.1. FLD results……………………………………….368