Embed Size (px)
Citation preview
Alternative Payment Models: Business and Physician Perspectives
Gregg Davis, MD MBA FAAFP Chief Medical Officer
Illinois Rural Community Care Organization [email protected]
IRCCO office: 815-875-2999
Cell: 815-878-3534
Clinical Office: 815-879-3212
1
Agenda
• Medical Economics
• Value-Based Payment Framework
• The Rise of ACOs
• MACRA, MIPS, and APMS
• Messages from CMS
• New Revenue Opportunities
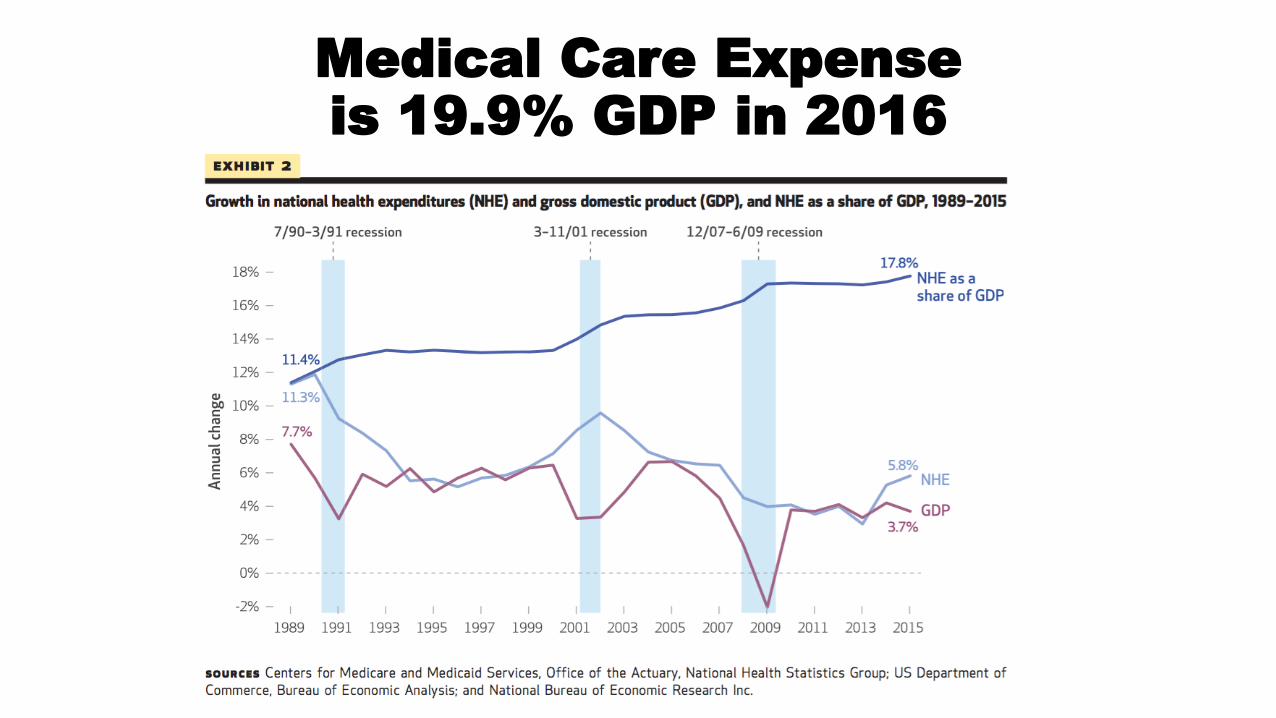
Medical Care Expense is 19.9% GDP in 2016
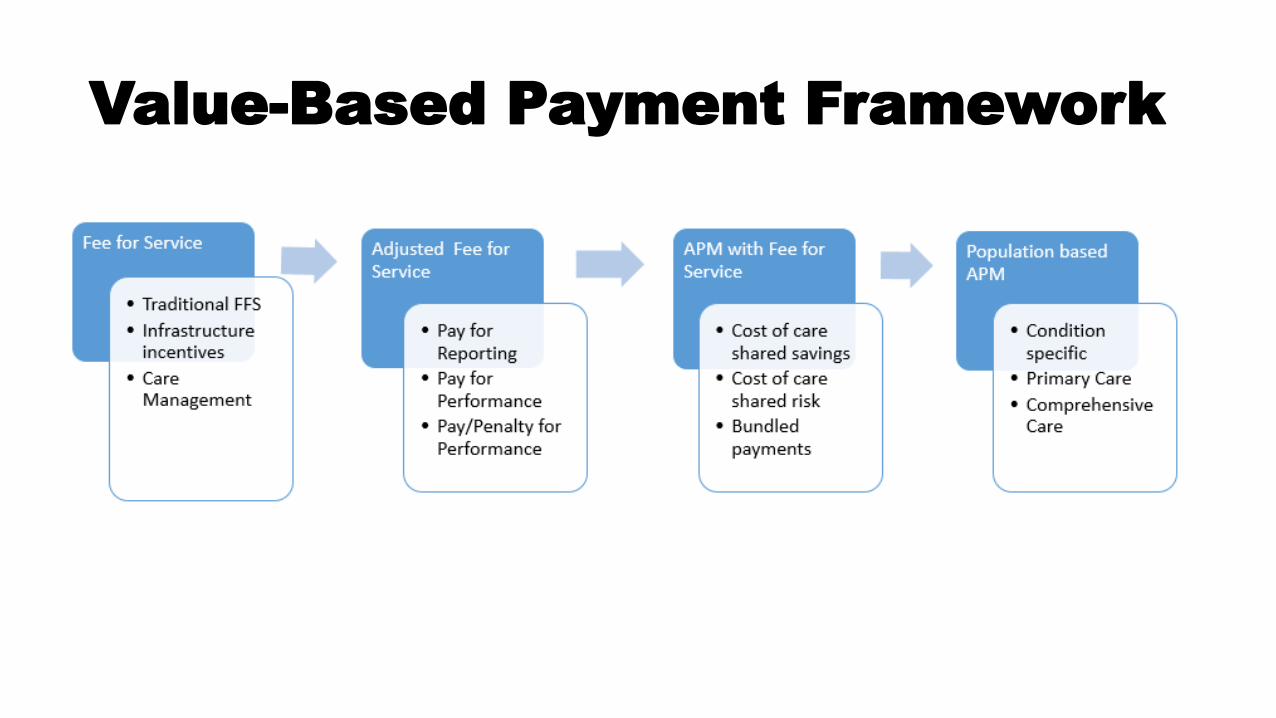
Value-Based Payment Framework
• Merit based Incentive Payment System (MIPS)• Alternative Payment
Models (APMs)• ADVANCED
• NOT ADVANCED (MIPS APM)
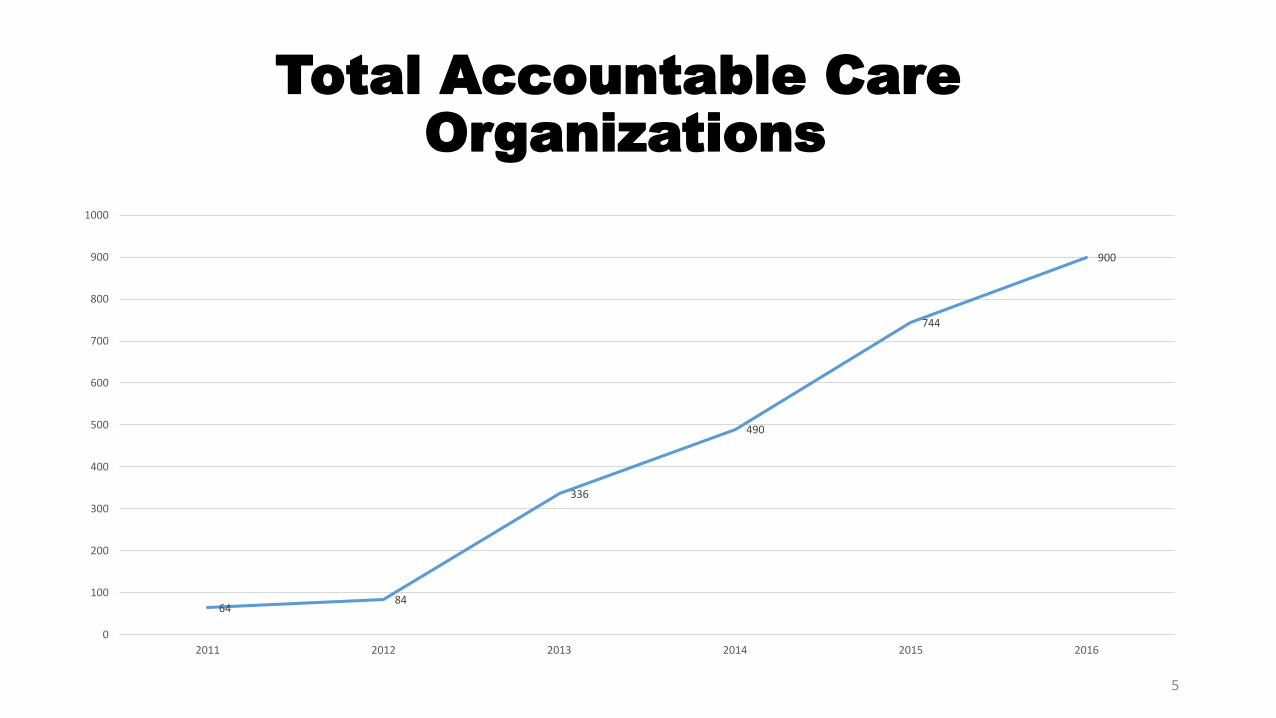
Total Accountable Care
Organizations2015 (MACRA)
1000
900 900
800
744
700
600
500 490
400
336 300
200
100 84
64
0
2011 2012 2013 2014 2015 2016
5
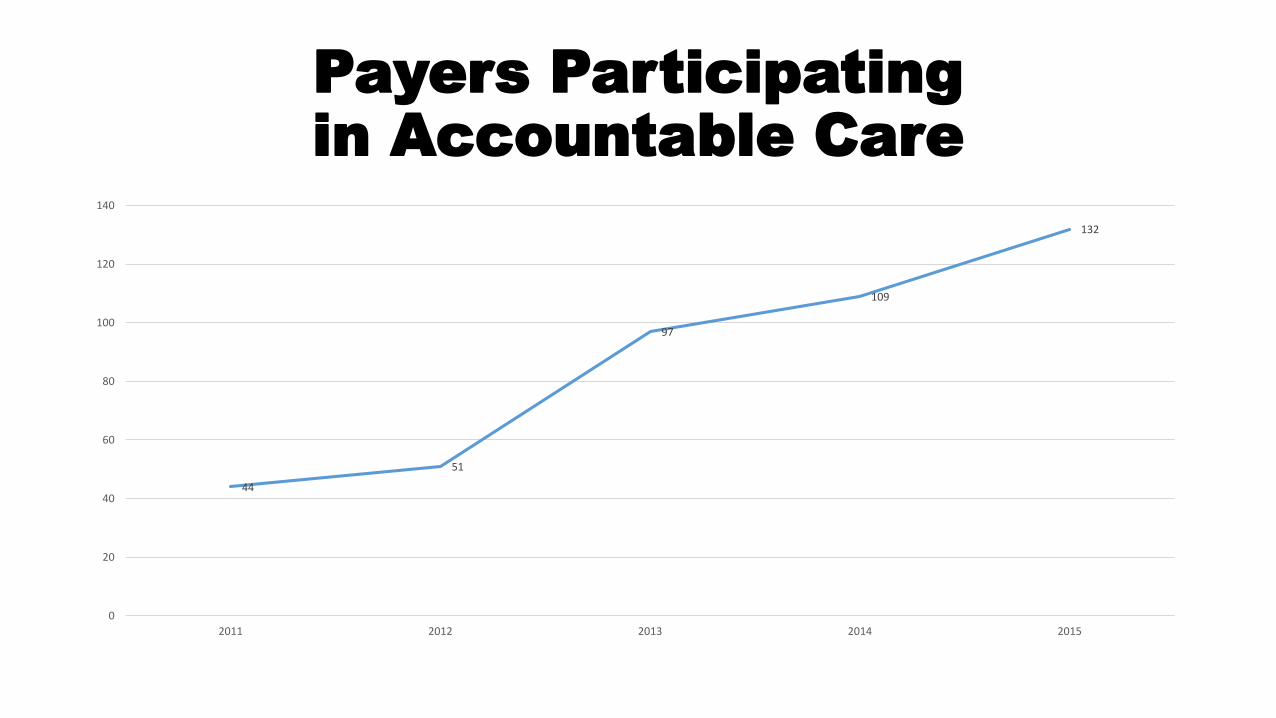
Payers Participating in Accountable Care
140
132
120
109
100 97
80
60
51
44 40
20
0
2011 2012 2013 2014 2015
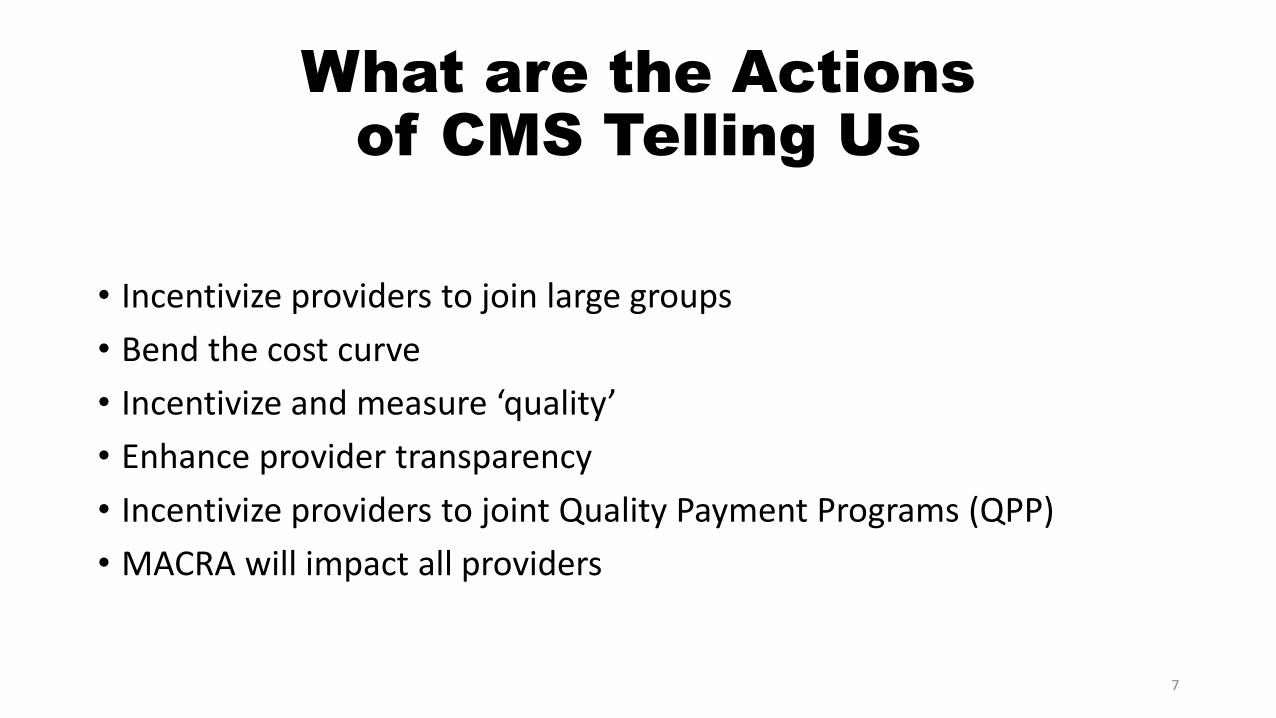
What are the Actions of CMS Telling Us
• Incentivize providers to join large groups
• Bend the cost curve
• Incentivize and measure ‘quality’
• Enhance provider transparency
• Incentivize providers to joint Quality Payment Programs (QPP)
• MACRA will impact all providers
7
Take Away Ideas
• ACOs are here to stay and are spreading to commercial payers
• Volume to value transition will continue
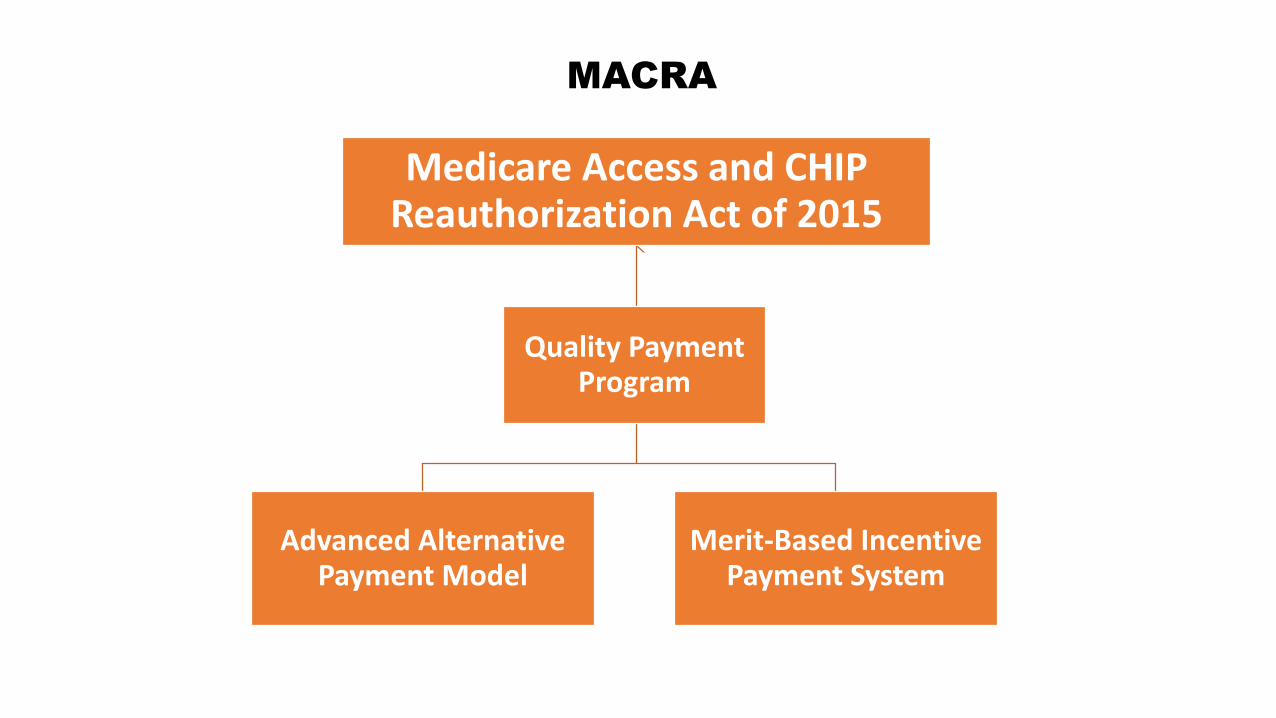
MACRA
Medicare Access and CHIP Reauthorization Act of 2015
Advanced Alternative Payment Model
Merit-Based Incentive Payment System
Quality Payment Program
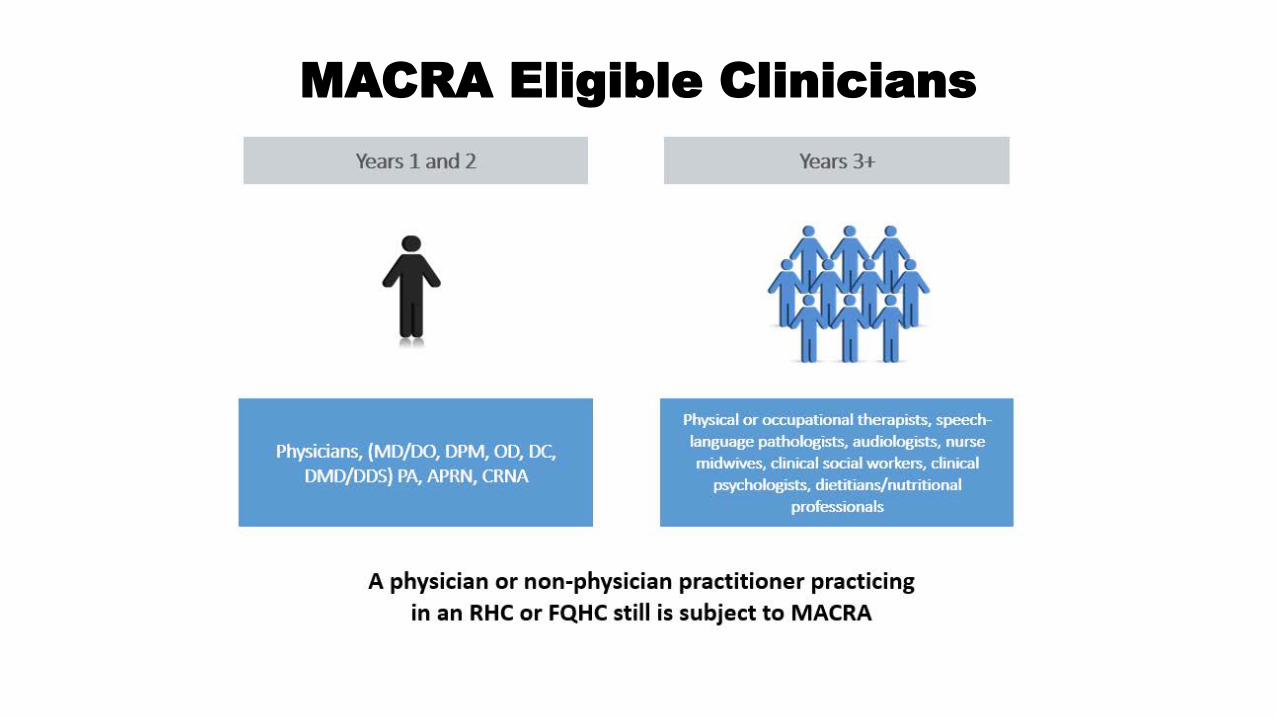
Years 1and2 Years 3+
Physical or occupational therapists, speechlanguage pathologists, audiologists, nurse midwives, clinical social workers, clinical
psychologists, dietitians/nutritional professionals
A physician or non-physician practitioner practicing
in an RHC or FQHC still is subject to MACRA
MACRA Eligible Clinicians
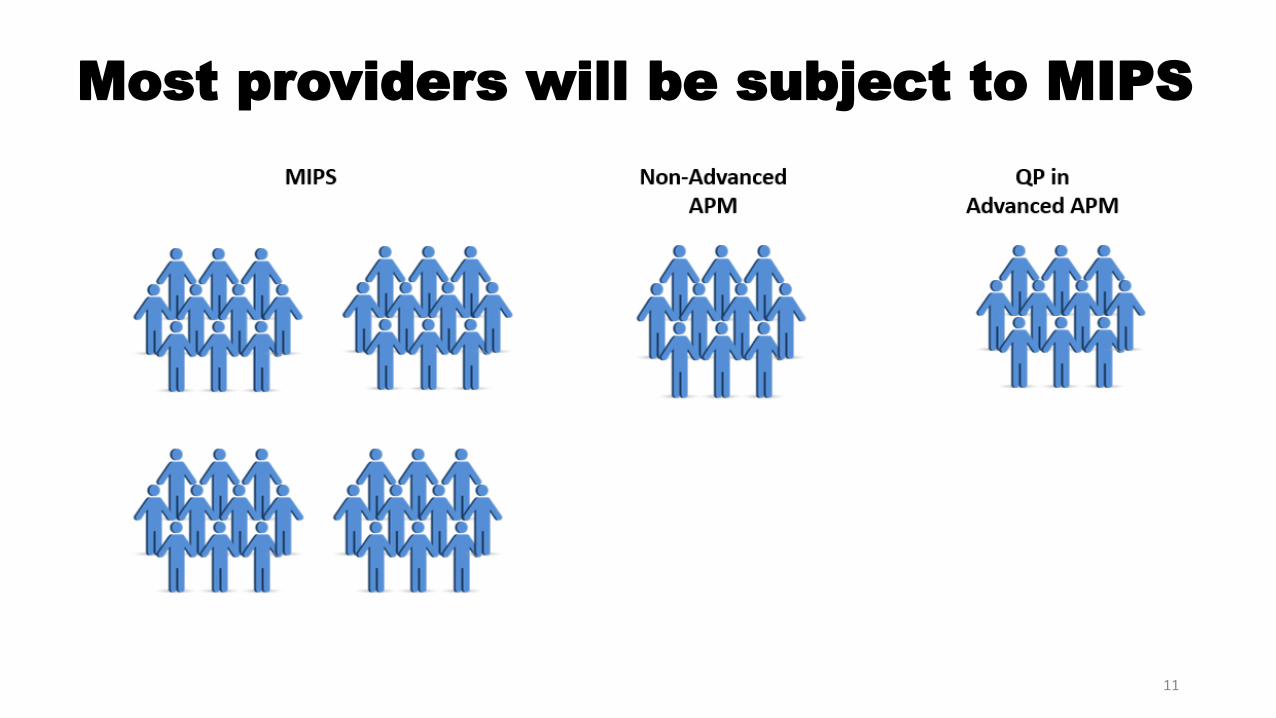
• Alternative Payment Models (APMs)• ADVANCED
• NOT ADVANCED (MIPS APM)
Most providers will be subject to MIPS
11
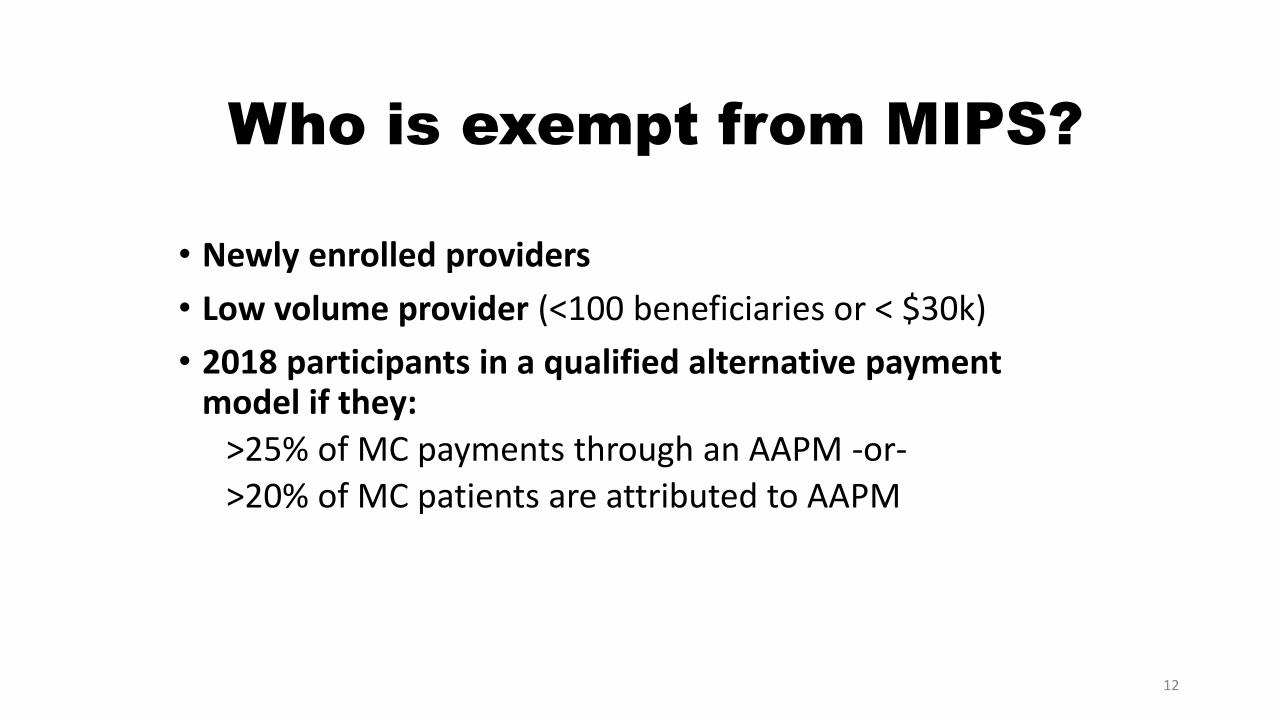
Who is exempt from MIPS?
• Newly enrolled providers
• Low volume provider (<100 beneficiaries or < $30k)
• 2018 participants in a qualified alternative payment model if they:
>25% of MC payments through an AAPM -or-
>20% of MC patients are attributed to AAPM
12
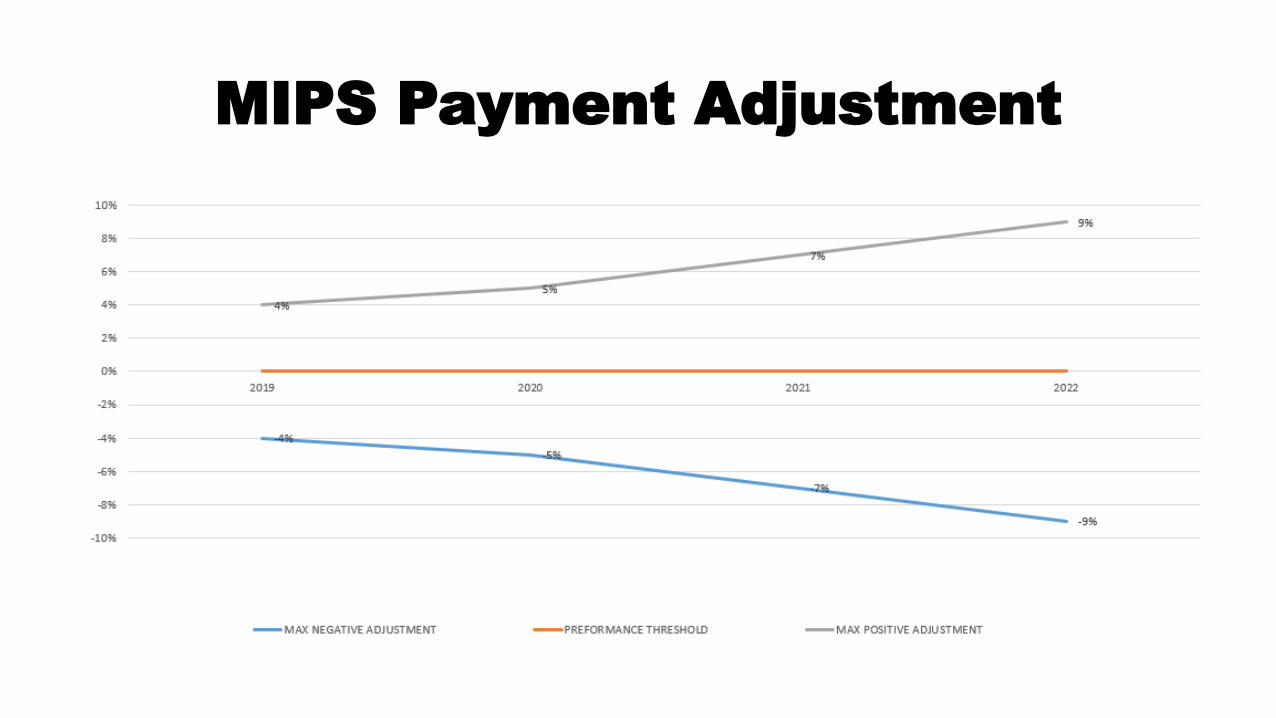
MIPS Payment Adjustment
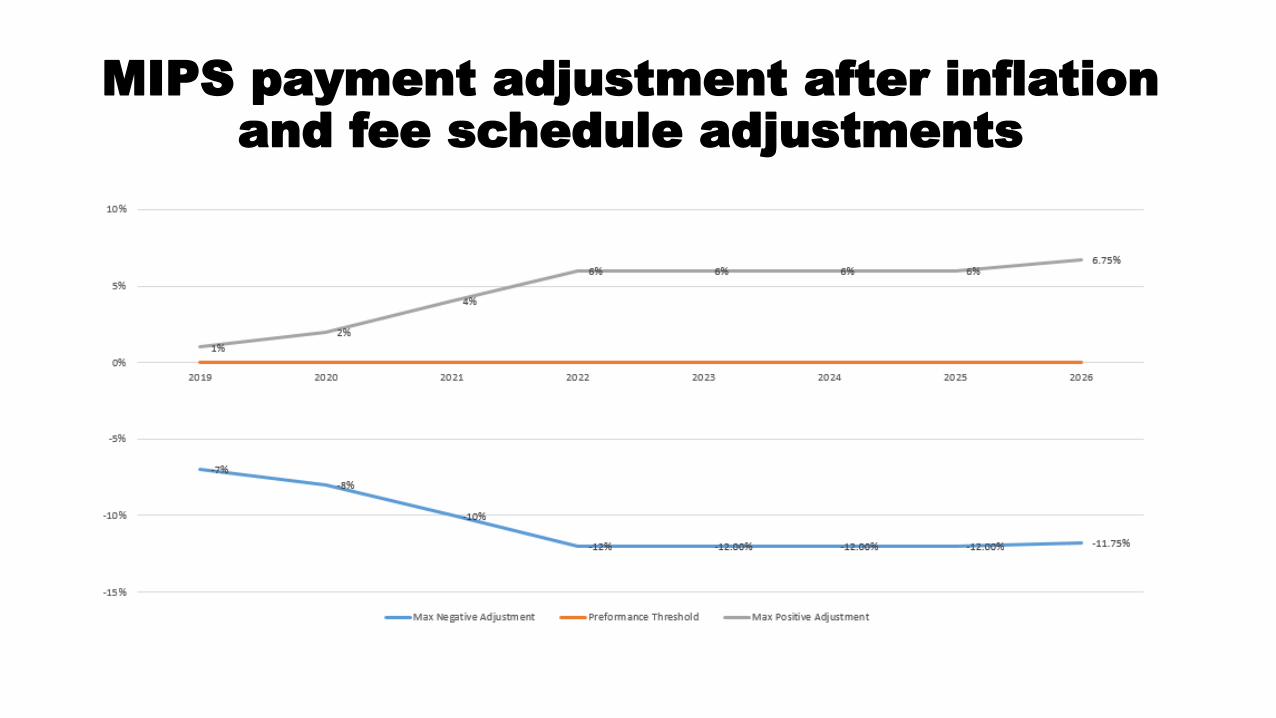
MIPS payment adjustment after inflation and fee schedule adjustments

Projected Impact of MIPS by Practice Size table 64: MIPS Proposed Rule Estimated Impact
Practice Size Percentage Eligible Clinicians with Negative Adjustment
Solo 87%
2-9 69.9%
10-24 59.4%
25-99 44.9%
100 or more 18.3%
Over all 45.5%
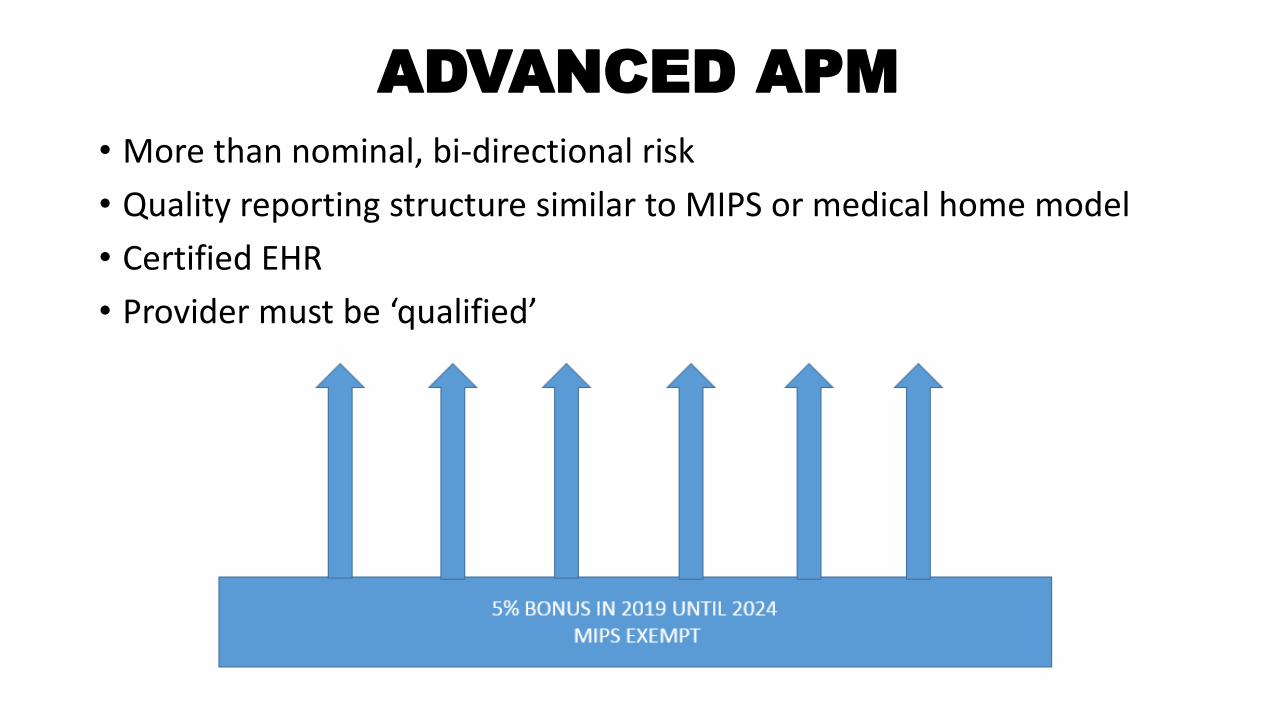
ADVANCED APM • More than nominal, bi-directional risk
• Quality reporting structure similar to MIPS or medical home model
• Certified EHR
• Provider must be ‘qualified’
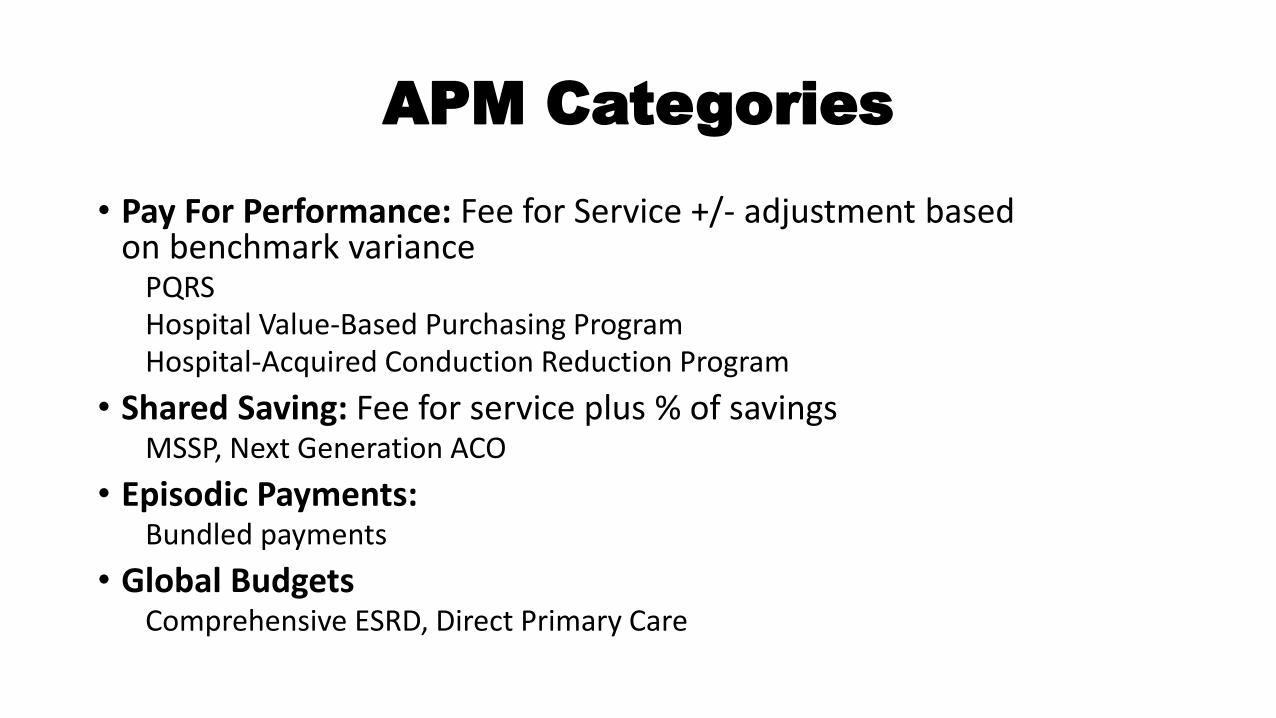
APM Categories
• Pay For Performance: Fee for Service +/- adjustment based on benchmark variance
PQRS Hospital Value-Based Purchasing Program Hospital-Acquired Conduction Reduction Program
• Shared Saving: Fee for service plus % of savings MSSP, Next Generation ACO
• Episodic Payments: Bundled payments
• Global Budgets Comprehensive ESRD, Direct Primary Care
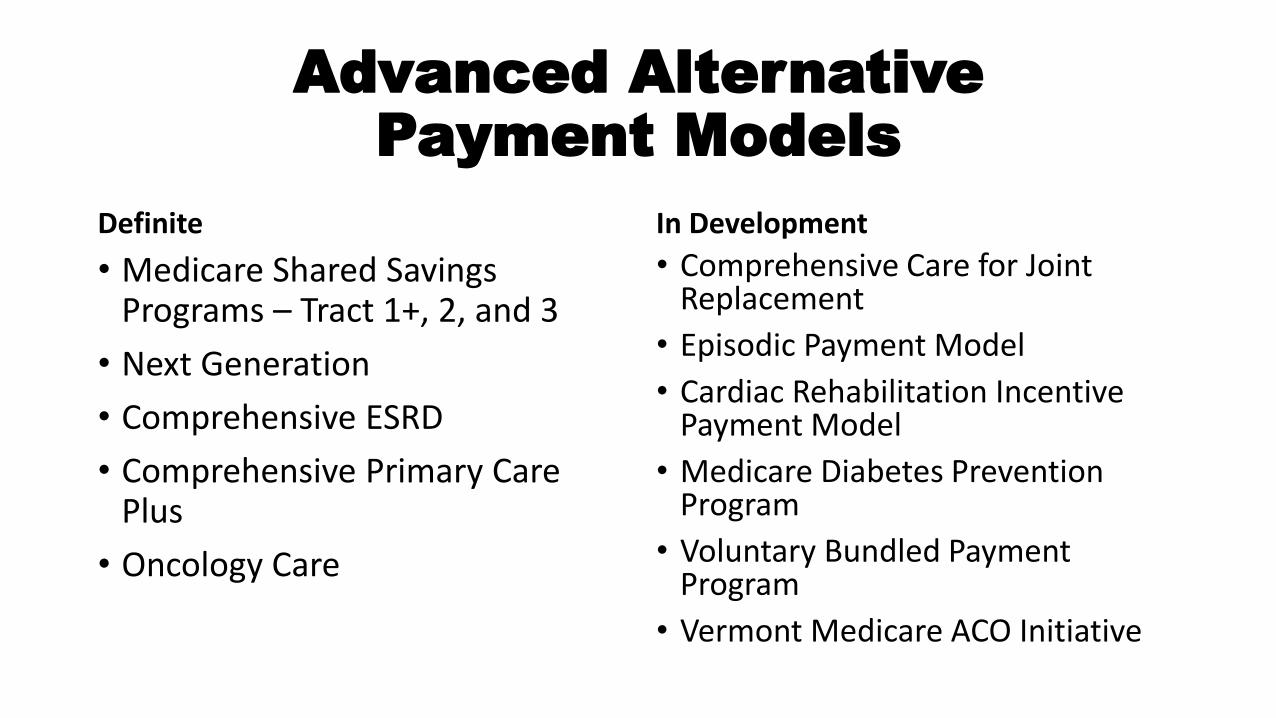
Advanced Alternative Payment Models
Definite
• Medicare Shared Savings Programs – Tract 1+, 2, and 3
• Next Generation
• Comprehensive ESRD
• Comprehensive Primary Care Plus
• Oncology Care
In Development
• Comprehensive Care for Joint Replacement
• Episodic Payment Model
• Cardiac Rehabilitation Incentive Payment Model
• Medicare Diabetes Prevention Program
• Voluntary Bundled Payment Program
• Vermont Medicare ACO Initiative
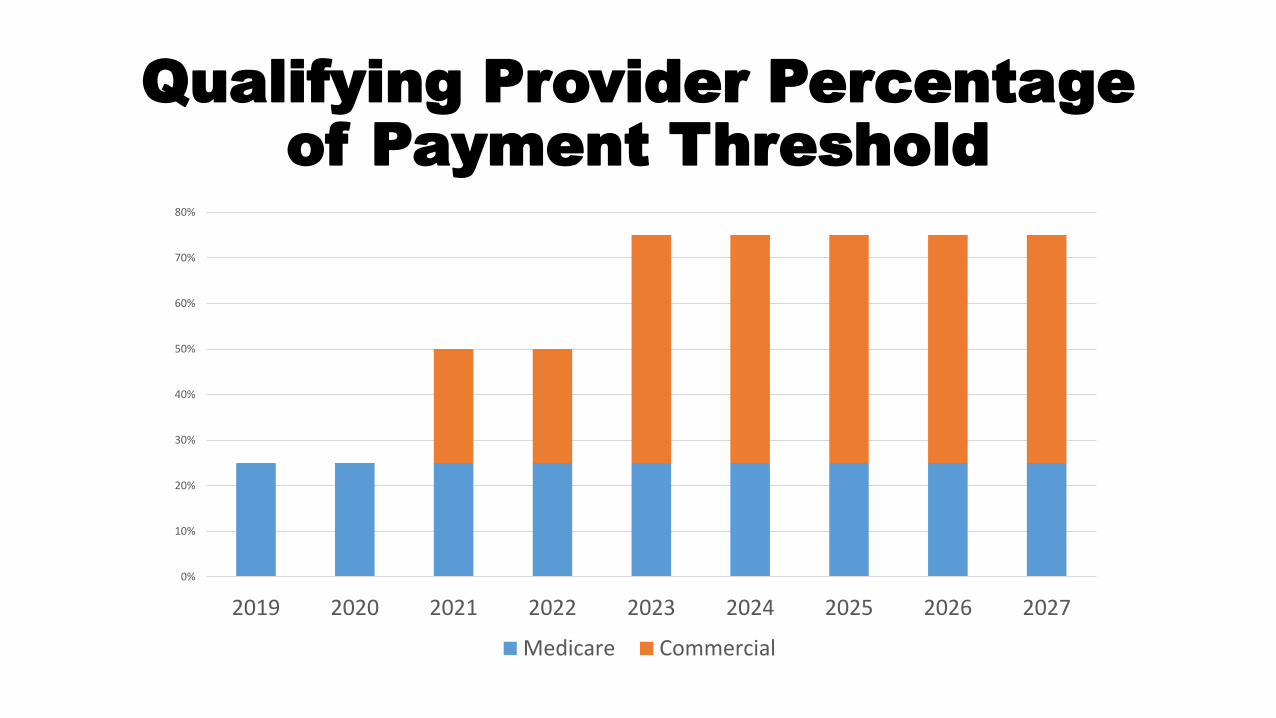
Qualifying Provider Percentage of Payment Threshold
80%
0%
10%
20%
30%
40%
50%
60%
70%
2019 2020 2021 2022 2023 2024 2025 2026 2027
Medicare Commercial
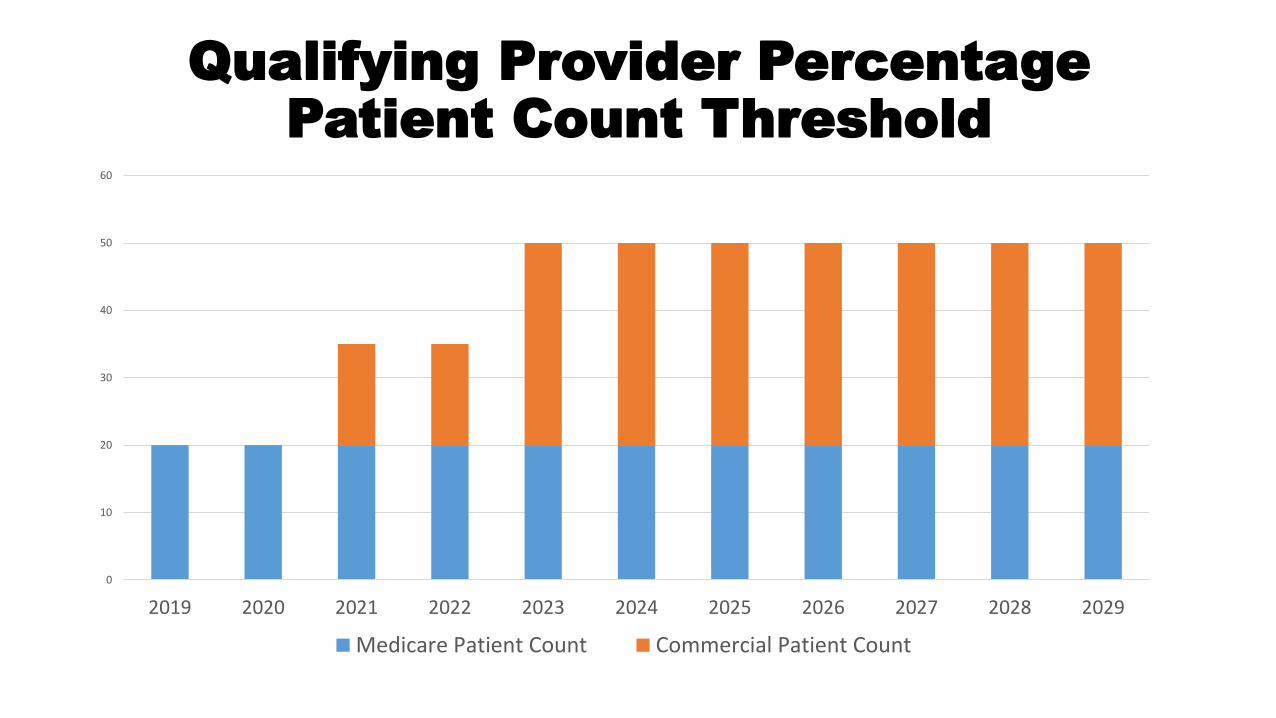
60
Qualifying Provider Percentage Patient Count Threshold
50
40
30
20
10
0
2019 2020 2021 2022 2023 2024 2025 2026 2027 2028 2029
Medicare Patient Count Commercial Patient Count
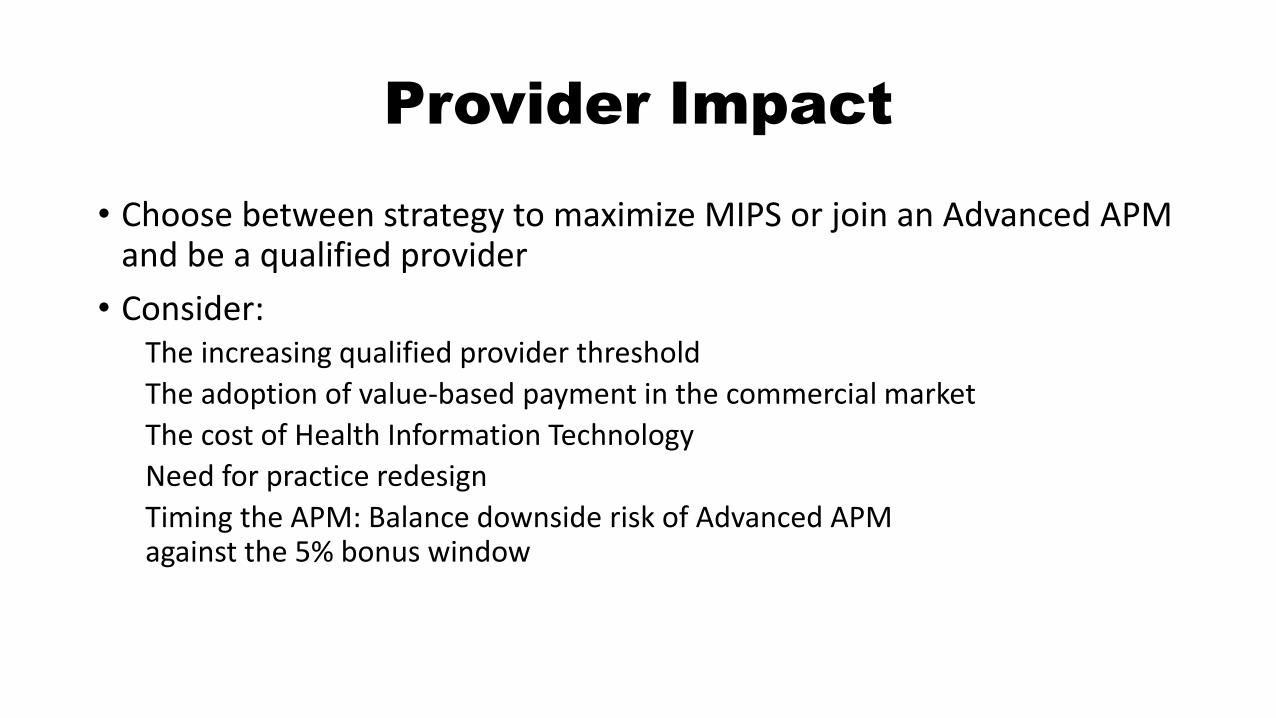
Provider Impact
• Choose between strategy to maximize MIPS or join an Advanced APM and be a qualified provider
• Consider: The increasing qualified provider threshold
The adoption of value-based payment in the commercial market
The cost of Health Information Technology
Need for practice redesign
Timing the APM: Balance downside risk of Advanced APM against the 5% bonus window
Provider Impact continued
• Focus on coordination among providers
• Technology and process will drive provider consolidation Mergers and large system
Virtual groups
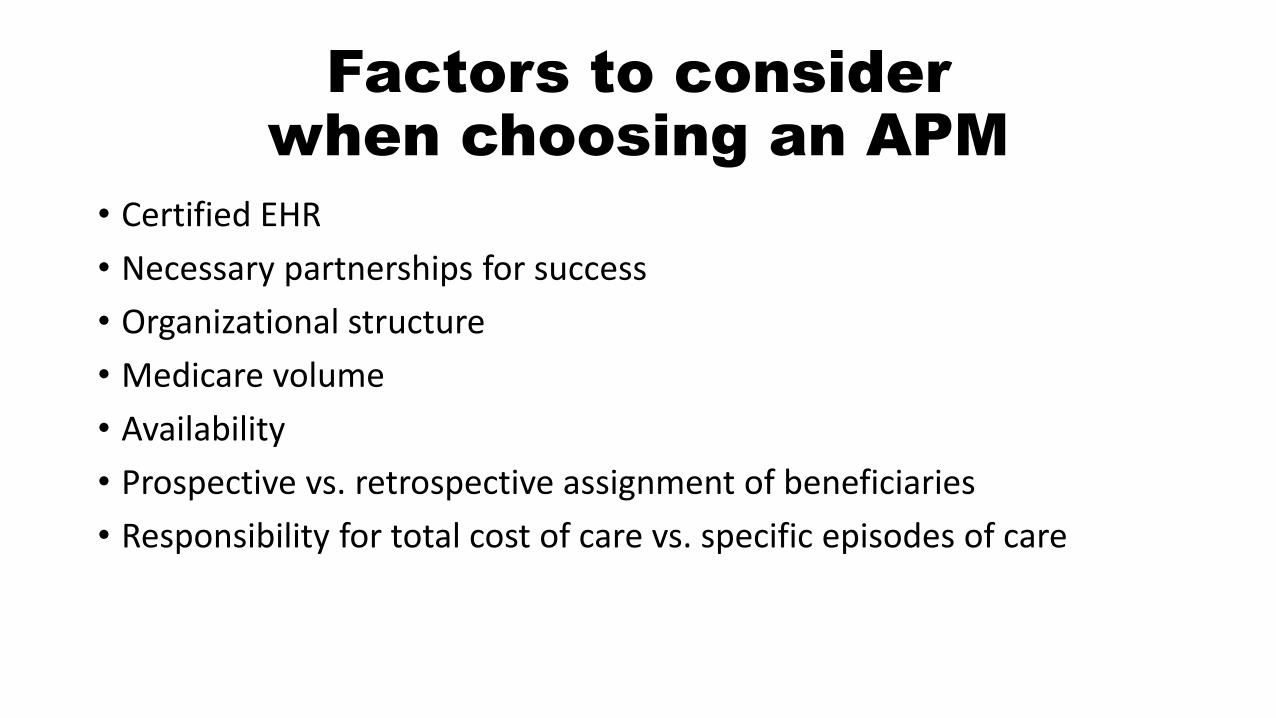
Factors to consider when choosing an APM
• Certified EHR
• Necessary partnerships for success
• Organizational structure
• Medicare volume
• Availability
• Prospective vs. retrospective assignment of beneficiaries
• Responsibility for total cost of care vs. specific episodes of care
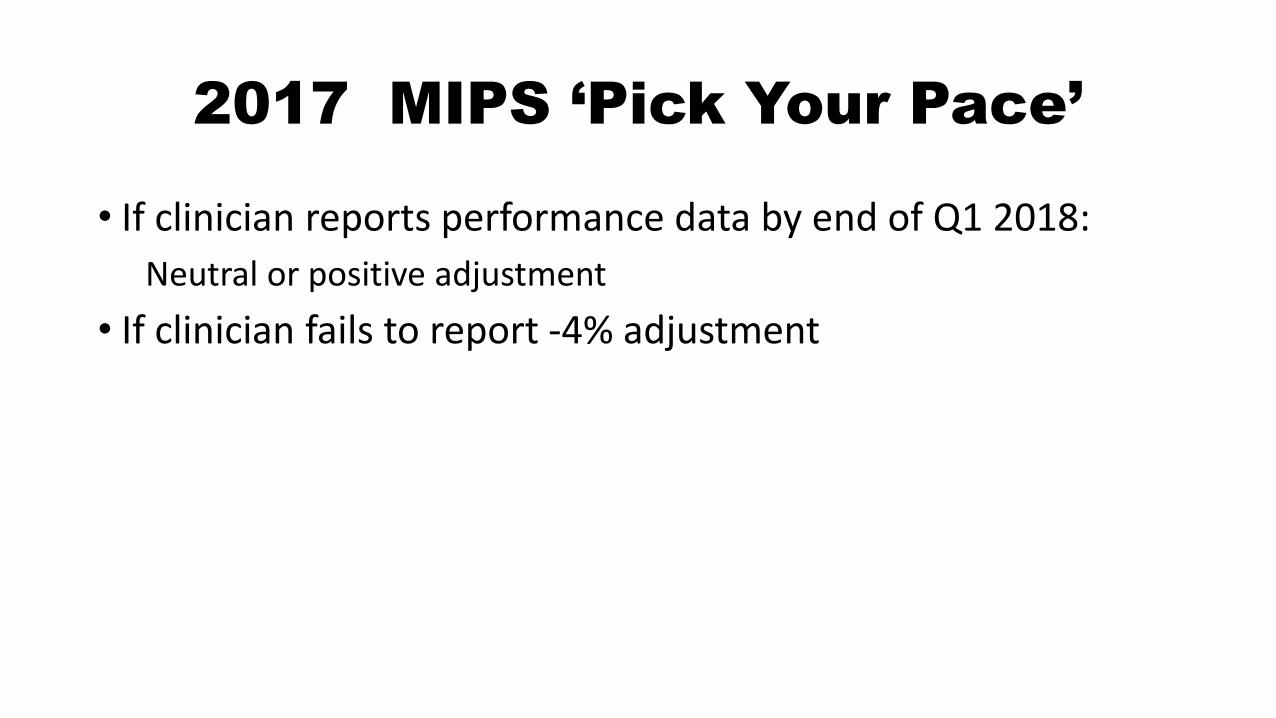
2017 MIPS ‘Pick Your Pace’
• If clinician reports performance data by end of Q1 2018:
Neutral or positive adjustment
• If clinician fails to report -4% adjustment

2017 Data Reporting Options
Don’t participate
-4%
Test – Submit something
0%
Partial Submission
90-day data submission
of two required measures
Small ?+%
Full year data submission
of all required measures
Possible moderated +%
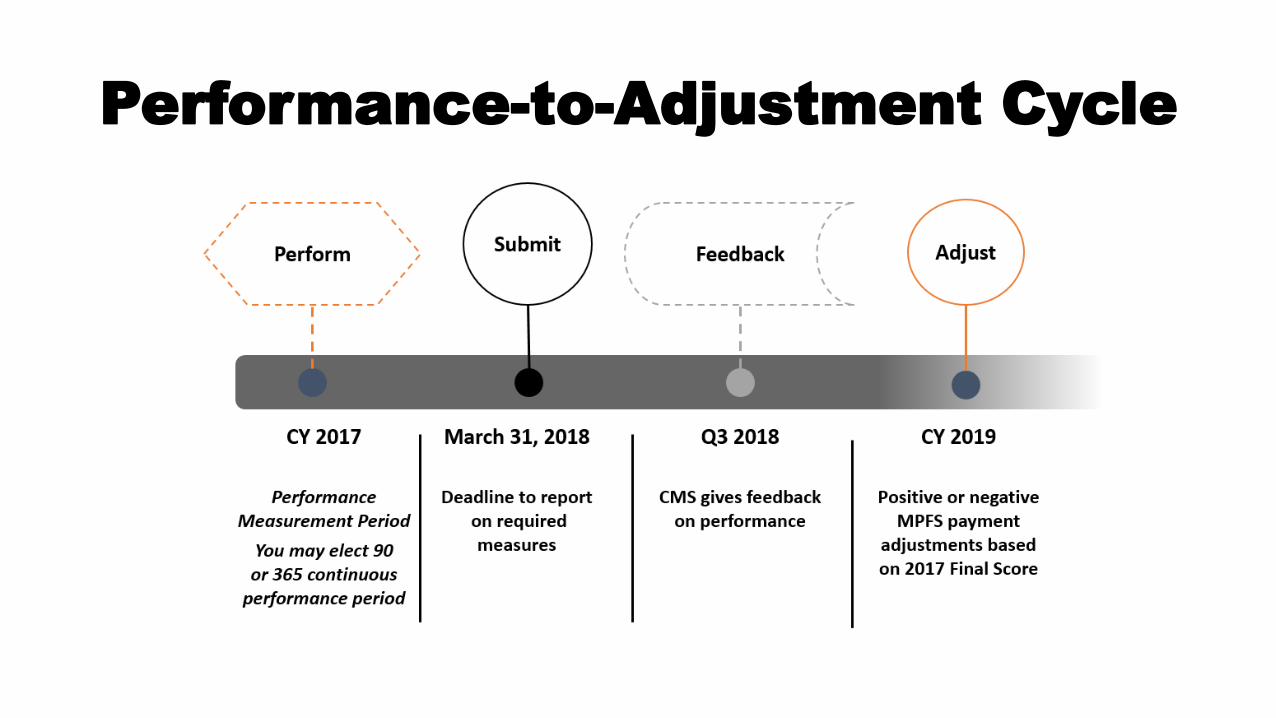
Performance-to-Adjustment Cycle
1
Take Away Ideas
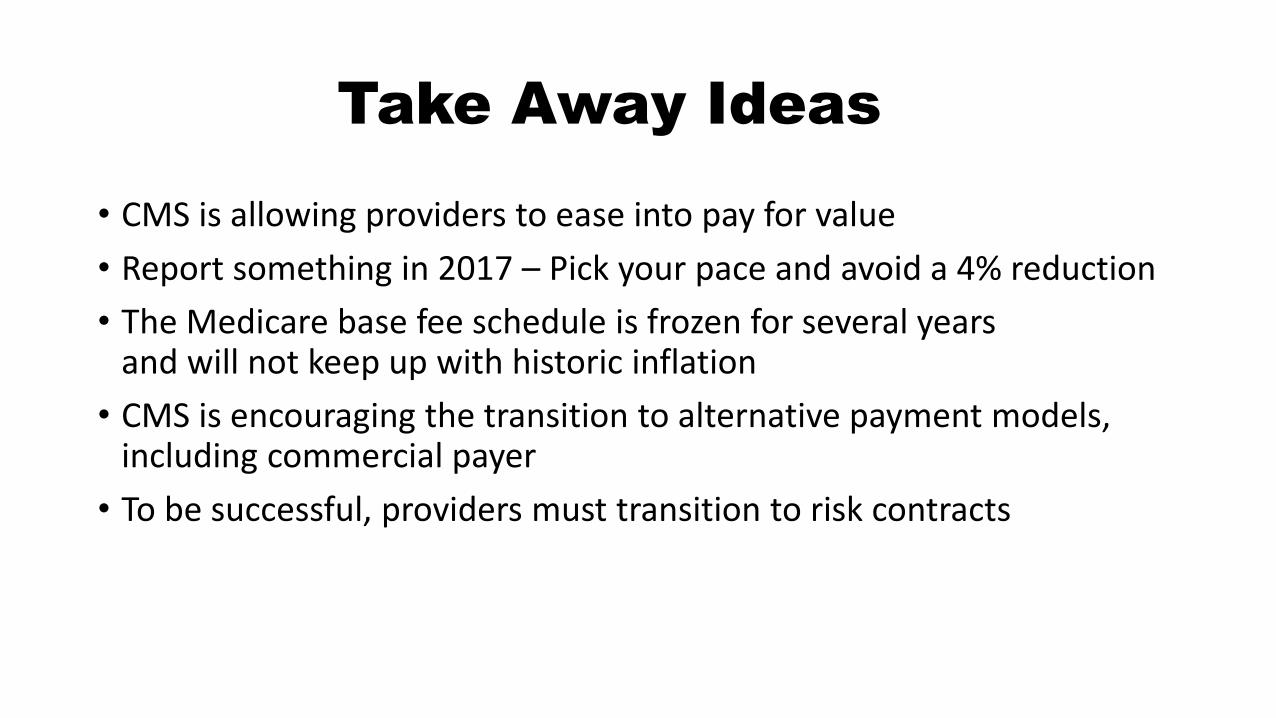
• CMS is allowing providers to ease into pay for value
• Report something in 2017 – Pick your pace and avoid a 4% reduction
• The Medicare base fee schedule is frozen for several years and will not keep up with historic inflation
• CMS is encouraging the transition to alternative payment models, including commercial payer
• To be successful, providers must transition to risk contracts
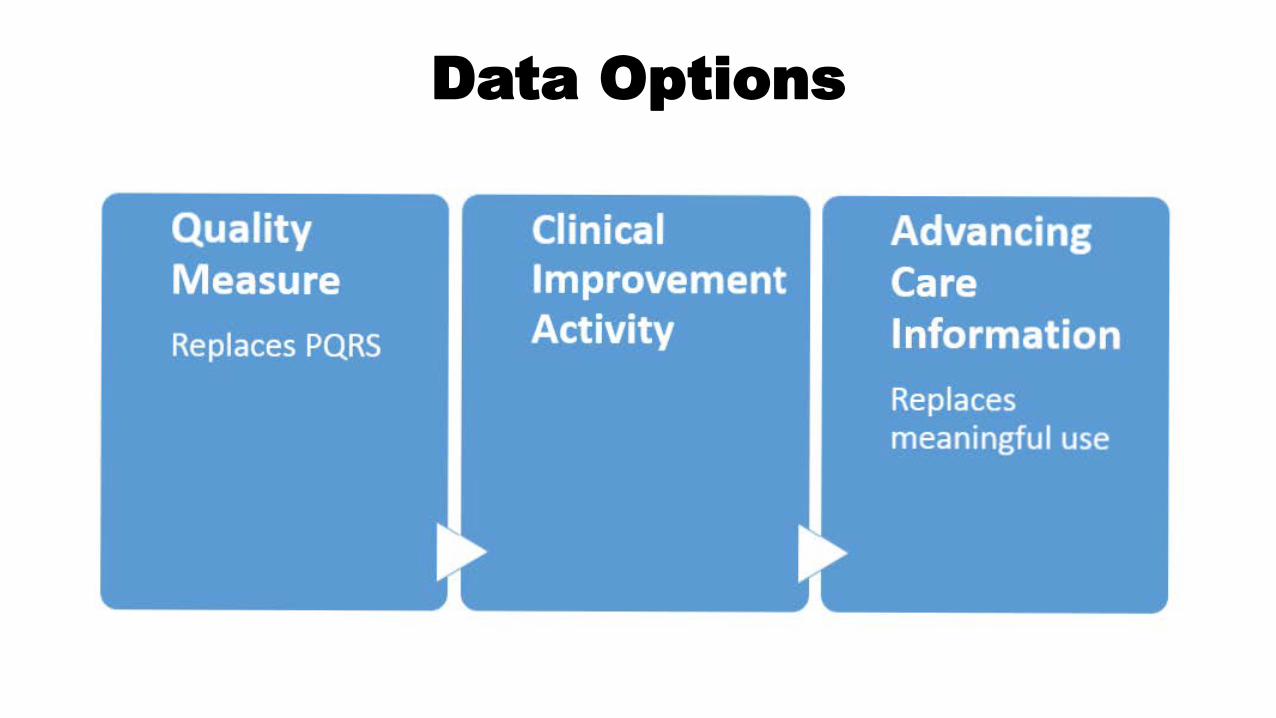
Data Options

New Opportunities for Revenue
• MIPS, Alternative Payment Models
• Commercial ACO
• Medicaid ACO
• Medicare Well Visits
• Care Gap Closures
• Transitional Care Management (TCM)
• Chronic Care Management (CCM)
• Better Utilization of Services 29
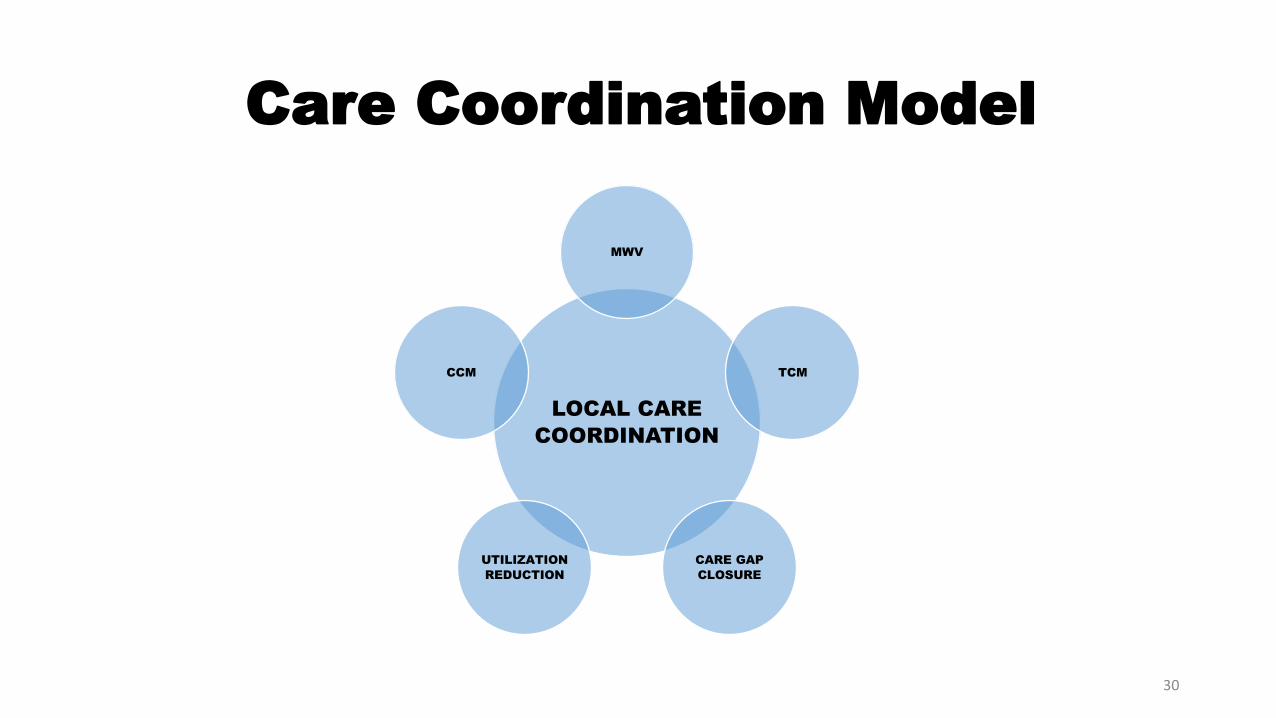
Care Coordination Model
LOCAL CARE
COORDINATION
MWV
TCM
CARE GAP
CLOSURE
UTILIZATION
REDUCTION
CCM
30
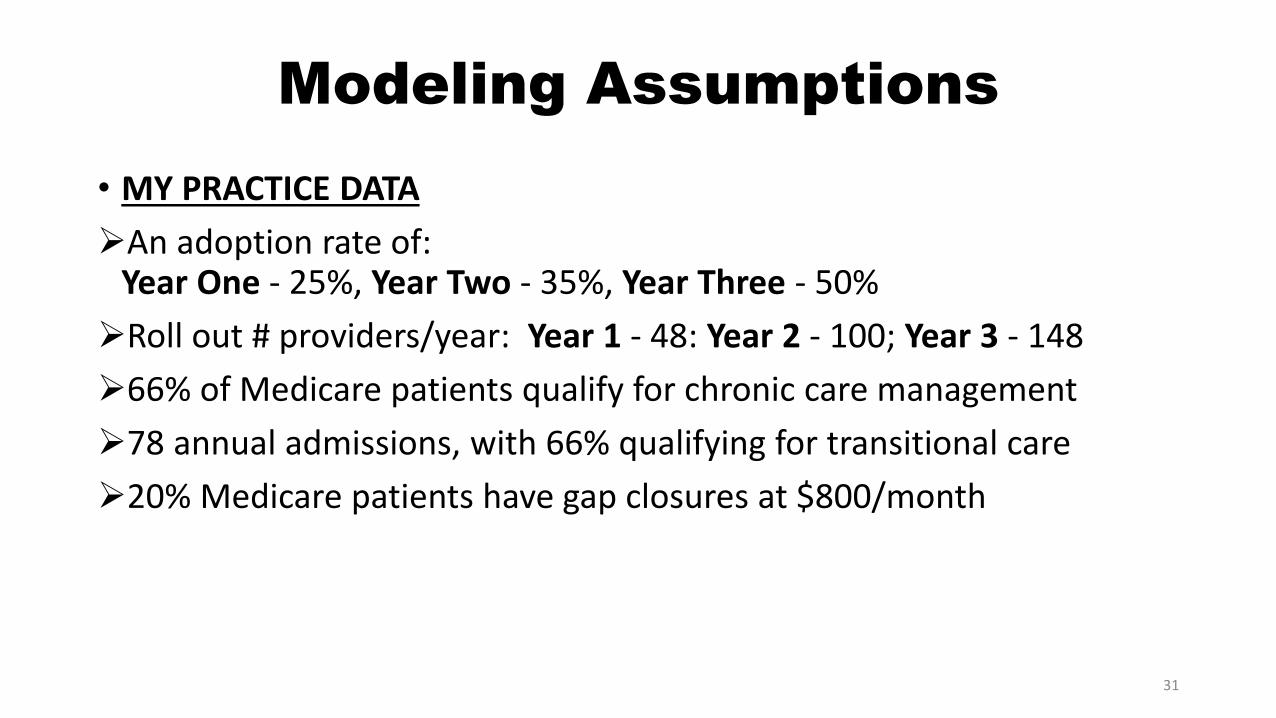
Modeling Assumptions
• MY PRACTICE DATA
An adoption rate of: Year One - 25%, Year Two - 35%, Year Three - 50%
Roll out # providers/year: Year 1 - 48: Year 2 - 100; Year 3 - 148
66% of Medicare patients qualify for chronic care management
78 annual admissions, with 66% qualifying for transitional care
20% Medicare patients have gap closures at $800/month
31
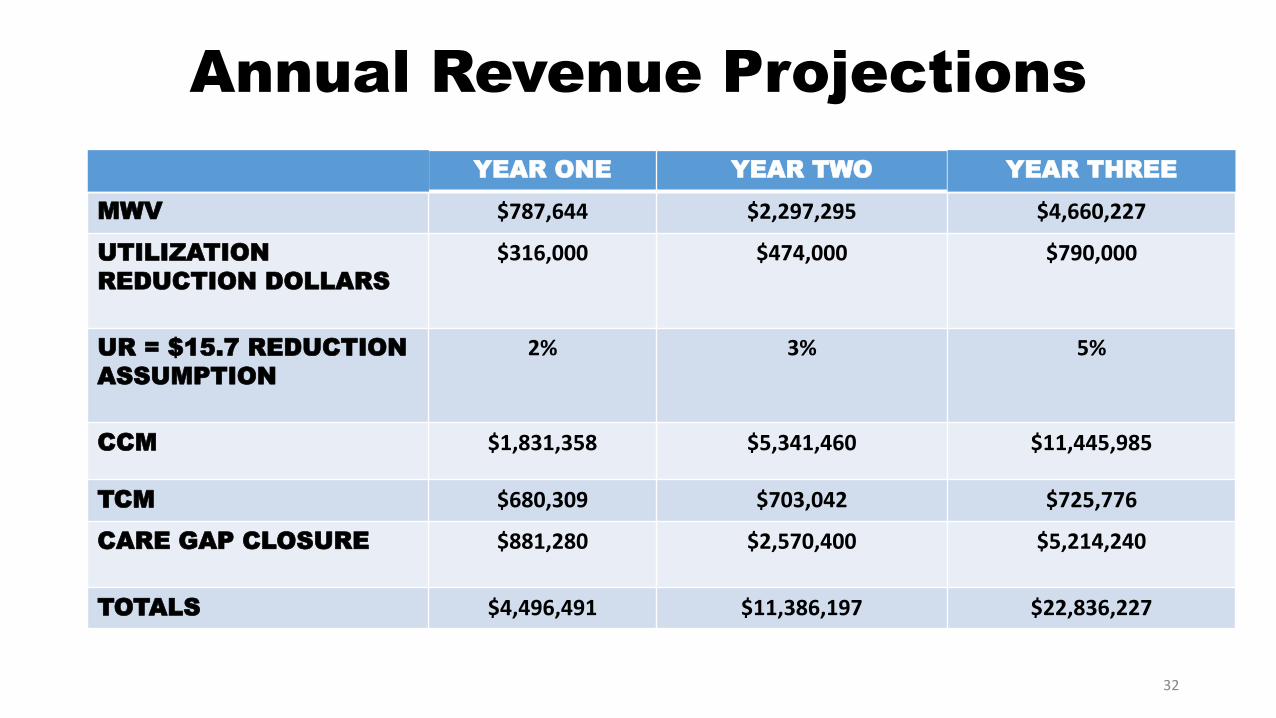
Annual Revenue Projections
YEAR ONE YEAR TWO YEAR THREE
$787,644 $2,297,295 $4,660,227MWV
$316,000 $474,000 $790,000UTILIZATION
REDUCTION DOLLARS
UR = $15.7 REDUCTION 2% 3% 5% ASSUMPTION
CCM $1,831,358 $5,341,460 $11,445,985
$680,309 $703,042 $725,776TCM
$881,280 $2,570,400 $5,214,240CARE GAP CLOSURE
$4,496,491 $11,386,197 $22,836,227TOTALS
32
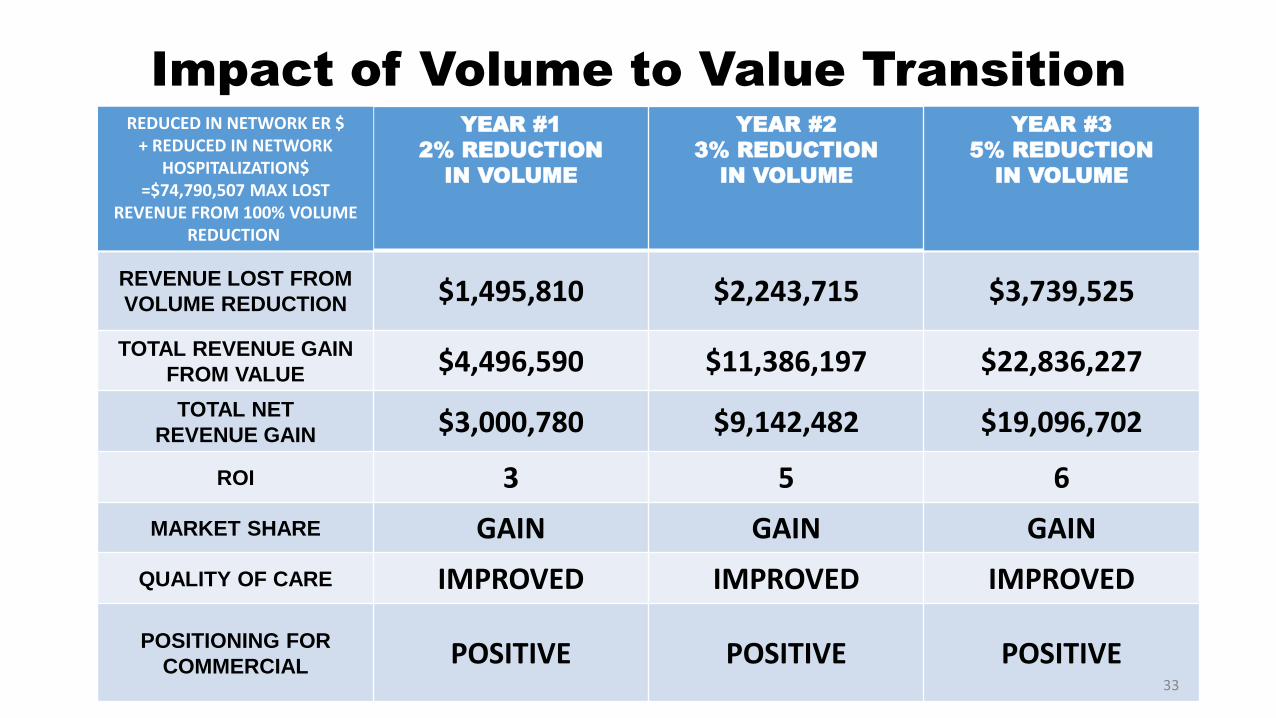
Impact of Volume to Value Transition REDUCED IN NETWORK ER $
+ REDUCED IN NETWORK HOSPITALIZATION$
=$74,790,507 MAX LOST REVENUE FROM 100% VOLUME
REDUCTION
YEAR #1
2% REDUCTION
IN VOLUME
YEAR #2
3% REDUCTION
IN VOLUME
YEAR #3
5% REDUCTION
IN VOLUME
REVENUE LOST FROM
VOLUME REDUCTION $1,495,810 $2,243,715 $3,739,525
TOTAL REVENUE GAIN
FROM VALUE $4,496,590 $11,386,197 $22,836,227
TOTAL NET
REVENUE GAIN $3,000,780 $9,142,482 $19,096,702
ROI 3 5 6
MARKET SHARE GAIN GAIN GAIN
QUALITY OF CARE IMPROVED IMPROVED IMPROVED
POSITIONING FOR
COMMERCIAL POSITIVE POSITIVE POSITIVE
33
2
Take Away Ideas
• To maintain or grow your revenue, you need to implement every new opportunity
• Results of a full care coordination program/ROI • The reduced revenue from lost volume
is replaced 6:1 by value-driven revenue at a 5% reduction in volume
34

Questions
35