Embed Size (px)
Citation preview
42
An Overview
UNIT 3 VALUATION OF SECURITIES Objectives
The objectives of this unit are to:
• explain the fundamentals of valuation as applied to securities
• discuss the relevance of the three-step valuation process as used traditionally
• familiarize you with the general approach to valuation as influenced by the rules of market and different classes of investors
• analyze the specifics of fixed-income securities valuation
• examine valuation methodologies generally employed by preference and equity investors
Structure
3.1 Introduction
3.2 The Three-step Valuation Process 3.2.1 Economy Analysis
3.2.2 Industry Analysis
3.2.3 Company Analysis
3.2.4 Empirical Support for the Valuation Sequence
3.3 The General Valuation Framework 3.3.1 The Basic Valuation Model
3.3.2 Value Price Relationship
3.3.3 The Cootner Hypothesis
3.3.4 The Dynamic Valuation Process
3.4 Valuation of Fixed-income Securities 3.4.1 Estimating Returns on Fixed Income Securities
3.5 Valuation of Preferences Shares
3.6 Valuation of Equity Shares 3.6.1 The Present Value of Expected Stream of Benefits from Equity Shares
3.6.2 Dividend Valuation Model
3.6.3 The P/E Approach to equity valuation
3.7 Summary
3.8 Key Words
3.9 Self-Assessment Questions/Exercises
3.10 Further Readings
3.1 INTRODUCTION
Investment is a commitment of funds for a period of time to derive a rate of return that would compensate the investors for the time during which the funds are not available for consumption, for the expected rate of inflation during the period of investment and for the uncertainty involved. Since the objective of the investment is to derive a rate of return, investors have to first specify the desired rate of return so that an investment decision can be made if the expected rate of return is equal to or greater than the desired or required rate of return. In the previous unit, it was explained that the required return increases along with an increase in the risk level of investment. Once the desired or required rate of return is
43
Valuation of Securities
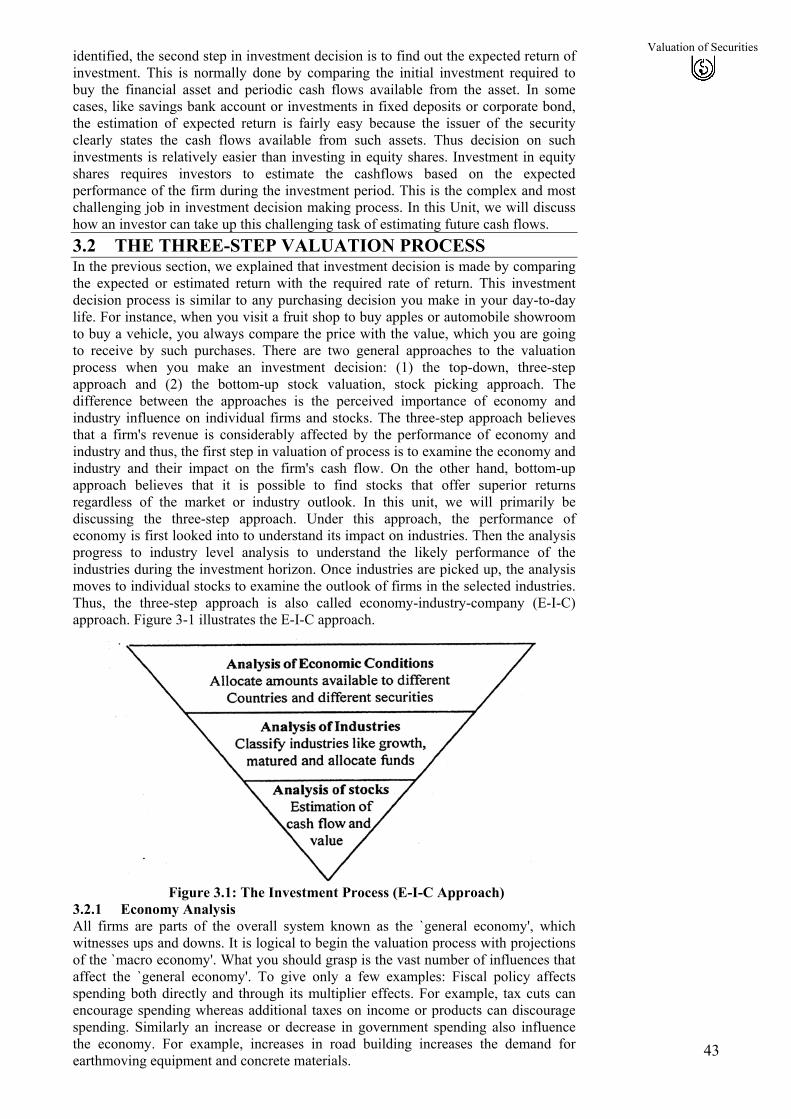
identified, the second step in investment decision is to find out the expected return of investment. This is normally done by comparing the initial investment required to buy the financial asset and periodic cash flows available from the asset. In some cases, like savings bank account or investments in fixed deposits or corporate bond, the estimation of expected return is fairly easy because the issuer of the security clearly states the cash flows available from such assets. Thus decision on such investments is relatively easier than investing in equity shares. Investment in equity shares requires investors to estimate the cashflows based on the expected performance of the firm during the investment period. This is the complex and most challenging job in investment decision making process. In this Unit, we will discuss how an investor can take up this challenging task of estimating future cash flows. 3.2 THE THREE-STEP VALUATION PROCESS In the previous section, we explained that investment decision is made by comparing the expected or estimated return with the required rate of return. This investment decision process is similar to any purchasing decision you make in your day-to-day life. For instance, when you visit a fruit shop to buy apples or automobile showroom to buy a vehicle, you always compare the price with the value, which you are going to receive by such purchases. There are two general approaches to the valuation process when you make an investment decision: (1) the top-down, three-step approach and (2) the bottom-up stock valuation, stock picking approach. The difference between the approaches is the perceived importance of economy and industry influence on individual firms and stocks. The three-step approach believes that a firm's revenue is considerably affected by the performance of economy and industry and thus, the first step in valuation of process is to examine the economy and industry and their impact on the firm's cash flow. On the other hand, bottom-up approach believes that it is possible to find stocks that offer superior returns regardless of the market or industry outlook. In this unit, we will primarily be discussing the three-step approach. Under this approach, the performance of economy is first looked into to understand its impact on industries. Then the analysis progress to industry level analysis to understand the likely performance of the industries during the investment horizon. Once industries are picked up, the analysis moves to individual stocks to examine the outlook of firms in the selected industries. Thus, the three-step approach is also called economy-industry-company (E-I-C) approach. Figure 3-1 illustrates the E-I-C approach.
Figure 3.1: The Investment Process (E-I-C Approach)
3.2.1 Economy Analysis All firms are parts of the overall system known as the `general economy', which witnesses ups and downs. It is logical to begin the valuation process with projections of the `macro economy'. What you should grasp is the vast number of influences that affect the `general economy'. To give only a few examples: Fiscal policy affects spending both directly and through its multiplier effects. For example, tax cuts can encourage spending whereas additional taxes on income or products can discourage spending. Similarly an increase or decrease in government spending also influence the economy. For example, increases in road building increases the demand for earthmoving equipment and concrete materials.
44
An Overview
Employment created in road construction, earthmoving equipment manufacturing and concrete materials manufacturing will in turn increase higher consumer spending. This multiplier effect increase overall economic activity and thus many investors and analysts consider government spending on plan expenditure is critical for industrial activity. Monetary policy affects the supply and cost of funds available to business units. For instance, a restrictive monetary policy reduces money supply and thus reduces the availability of working capital to business units. Such policy also increases interest rates and thus increases the cost of funds to business units and also increases required rate of return for the investors. Of course, it will also reduce inflation and thus reduces the required rate of return. Monetary policy therefore affects all segments of the economy and that economy's relationship with other economies. In addition to fiscal and monetary polices, political uncertainty, war, balance of payments crisis, exchange rates, monetary devaluations, world opinion, and several other international. factors affect the performance of the economy. It is difficult to conceive any industry or company that can avoid the impact of macroeconomic developments that affect the total economy. A well-informed investor will first attempt to project the future course of the economy. If his projections indicate conditions of boom, the investor should select industries most likely to benefit from the expected prosperity phase. On the other hand, if the outlook is not good or a recession is expected, investor should defer investments in stocks or identify industries, called defensive industry, which are less affected by the poor performance of the economy for investment in equities. Investment in fixed income securities, particularly government securities, is preferred in such scenario. Thus, the economic analysis helps investors first to allocate available surplus amount between different types of securities (like government bonds, corporate bonds and equities) and then select industries, which are expected to do well in a given economic condition. Investors, like Foreign Institutional Investors (FIIs) operating in several countries can use economic analysis to allocate funds to different countries based on the economic outlook. 3.2.2 Industry Analysis All industries are not influenced equally by changes in the economy nor they are affected by business cycles at just one single point of time. For example, in an international environment of peace-treaties and resolution of cold war, profits of defence-related industries would wane. The upturn in construction industry generally lags behind the economy. Similarly, a boom or expansion of the economy is not likely to benefit industries subject to foreign competition of product obsolescence. The equipment manufacturing industry will perform well towards the end of economic cycle because the buyer firms typically increase capital expenditure when they are operating at full capacity. On the other hand, cyclical industries such as steel and auto, typically do much better than aggregate economy during expansion but suffer more during contractions. In contrast, non-cyclical industries like food processing or drugs would show neither substantial increase nor substantial decline during economic expansion and contraction. In general, an industry's prospects within a global business environment will determine how well or poorly an individual firm will fare. Thus industry analysis should precede company analysis. A weak firm in booming industry might prove more rewarding than a leader in a weak or declining industry. Of course, the investor would continuously be through a search process so that the best firms in strong industries are identified, and narrow down the area of search for investment outlets. Industry analysis is also useful for investors to allocate funds for different industries taking into account the future potential and current valuation. 3.2.3 Company Analysis After determining that an industry's outlook is good, an investor can analyze and compare individual firms' performance within the entire industry. This involves examining the historical performance of the company, the firm's standing in the industry and future prospects. The last one is critical for estimation of cash flows and hence value. It should be noted that a good Stock or Bond for investment need not come from the best firm or market leader in the industry because the Stock or Bond of such firms may be fully valued or overvalued and hence there is no scope for earning additional return. Thus, investors always look for firms which
45
Valuation of Securities
are undervalued for investments than looking for firms, which are best in respective industries. 3.2.4 Empirical Support for the Valuation Sequence You may at this stage, ask a question: "Why should the `company-level' be the last stage in the valuation sequence?" The valuation sequence can be defended and your question aptly answered if it could be shown that earnings, rates of return, prices, and risk levels of a company bear relationships with the economy or with the market which is used as a substitute factor for the `general economy'. Many studies are available on the subject and it may not be out of place to provide an overview of their basic findings. Brown and Ball (1967): This study selected 316 firms belonging to different industries. Earnings of each firm were first related to earnings of all 316 firms (dummy for "economy") and then to earnings of each of the firm belonging to its respective industry for the 1947-1965 period. It was found that 30-40 per cent of variability of each firm's earnings was related to the variability of earnings of all firms, plus, 10-15 per cent of the firm's earnings variability was related to the earnings variability of the industry. Also, larger and more diversified firms were more closely related to the economy while the small and specialized firms showed greater independence. (For more details, you may see "Some preliminary findings on the Association between the Earnings of a Firm, Its Industry and the Economy," Empirical Research in Accounting; Selected Studies, 1967, Supplement to Vol. 5, Journal of Accounting Research, pp 55-57). King (1960): This study examined the firm, industry, and economy relationships using the rate of return as the base variable. The rate of return was defined as the monthly percentage change in price. The exercise covered 63 stocks representing six industries for 403 months from June 1927 through December 1960. Fifty-two per cent of the variation in stock prices was explained by variations in the prices of the whole market and another ten per cent by industry variability. Even though the influence of the market factor did decline over time, King's study confirms the valuation sequence being discussed in this section. (For more details, you may see Benjamin F. King, "Market and Industry Factors in Stock Price Behaviour," Journal of Business, Vol. 39 No.1, Part-2, January 1960, pp 139-190). Myers (1973): Using King's methodology, this study enlarged the sample by adding 5 stocks from each of the twelve industry groups and extended the sample period to December 1967. The market explained more than 55 per cent of the variance for individual prices prior to 1944 but its explanatory power declined to less than 35 per cent during the 1952-1967 period. The industry influence also weakened after 1952. The industry influence was very weak when the industry was heterogeneous. Overall, the market and industry need to be analyzed before looking at individual stocks. (For more details, you may see Stephen L. Myers, "A Re-Examination of Market and Industry Factors in Stock Price Behaviour," Journal of Finance, Vol 28, No. 3, June 1973, pp 695-705). Blume (1971): This study examined the influence of the market studying all the New York Stock Exchange (NYSE) stocks for the period July 1926 through June 1968. Systematic risk factor was computed with beta as the measure. The, influence of the market was found to decline but still it explained about 30 per cent of the variance in individual shares. (For more details, you may see Marshall E. Blume, "On the Assessment of Risks," Journal of Finance Vol 26, No. 1, March, 1971 pp 1-10). The results of these studies suggest strongly that a knowledgeable investor must first project the state of the economy in view of its close relationship with the stock market. And once an expansion is anticipated, serious common stock analysis would be imperative.
46
An Overview
Activity -1
I. Based on the last economic survey presented one-day before the presentation of Union Budget and last year Union Budget, how would you assess the economic outlook for the country in the forthcoming year? Give any five important reasons for you to believe that the economy will show good (or bad) performance in the next year?
1. .......................................................................................................................
2. ………………………………………………………………………………
3. ………………………………………………………………………………
4. ………………………………………………………………………………
5. ………………………………………………………………………………
II. On a three-point scale (1=Good; 2=Average; 3=Poor), how would you rate the outlook of the following industry for the coming one year.
(a) Cement Industry_____________________________________________
(b) Pharmaceutical Industry_______________________________________
(c) Machinery Manufacturing industry______________________________
(d) Software Industry____________________________________________
(e) Hotel Industry_______________________________________________
3.3 THE GENERAL VALUATION FRAMEWORK
Most investors look at price movements in securities markets. They perceive opportunities of capital gains in such movements. All would wish if they could successfully predict them and ensure their gains. Few, however, recognize that value determines price and both changes randomly. It would be useful for an intelligent investor to be aware of this process. The present section examines this process in detail. We first present a brief outline of the basic valuation model and then proceed to discuss the relationship of value with price via investor-market-action. We shall also recall active and passive investment strategies and finally figure out the dynamic valuation model.
3.3.1 The Basic Valuation Model
Value of an asset is equal to present value of its expected returns. This is true particularly when you expect that the asset you own, provides a stream of returns during the period of time. This definition of valuation also applies to value of security. To covert this estimated stream of return to value a security, you must discount the stream of cash flows at your required rate of return. This process of estimation of value requires (a) the estimated stream of expected cash flows and (b) the required rate of return on the investment. The required rate of return varies from security to security on account of differences in risk level associated with securities.
Given a risk-adjusted discount rate and the future expected earnings flow of a security in the form of interest, dividend earnings, or cash flow, you can always determine the present value as follows:
1 32 n2 3
CFCF CFCFPV= + + +-----+1+r (1+r) (1+r) (1+r)n
Where, PV = Present value
CF = Cash flow, interest, dividend, or earnings per time period upto `n' number of periods.
47
Valuation of Securities
r = risk-adjusted discount rate (generally the interest rate) Expressed in the above manner, the model looks simple. But practical difficulties do make the use of the model complicated. For instance, it may be quite difficult to assume that every investor in the market exactly measure the value of cash flows and risk adjusted required rate of return. Further, investors' expectation on compensation for risk may also different between different types of investors. A small change in these measures will also cause a change in the value. Thus, it may not be possible to generate a single value. You will realize that market operations would become tedious with a range of values. Secondly, return, risk, and value would tend to change over time. Thus, security prices may rise or fall with buying and selling pressures respectively (assuming supply of securities does not change) and this may affect capital gains and hence returns expected. Consequently, estimates of future income will have to be revised and values reworked. Similarly, the risk complexion of the security may change over time. The firm may over borrow (and face financial risk) or engage in a risky venture (and face operating risk). An increase in risk would raise the discount rate and lower value. It would then seem to be a continuous exercise. Every new information will affect values and the buying and selling pressures, which keep prices in continuous motion, would drive them continuously close to new values. The last part of this section portrays this dynamic valuation model with ever-changing information inputs. 3.3.2 Value-Price Relationship Present value, also known as intrinsic value or economic value, determines price. We have said this in the preceding section. But how does it happen? Again, a hint to the answer for this question has been stated in the foregoing paragraph. You should have noted the role of `buying and selling pressures' which make prices more toward value. Now, you would ask: `what these pressures are and how do they occur? You will briefly understand that `investor action' in the wake of revisions of values spurs such pressures. You would recall that investment strategies can be `passive' or `active'. Following this, investors and investment managers can also be broadly grouped in `passive' and `active' categories. You should note that buying and selling pressures dominantly originate with active investors. And they follow certain rules of the game which are outlined below: Rule 1: Buy when value is more than price. This underlines the fact that shares are underpriced and it would be a bargain to buy now and sell when prices move up toward value. Rule 2: Sell when value is less than price. In a situation like this, shares would be overpriced and it would be advantageous to sell them now and avoid less when price later moves down to the level of the value. Rule 3: Don't trade when value is equal to price. This is a state when the market price is in equilibrium and is not expected to change. 3.3.3 The Cootner Hypothesis Cootner adds one more dimension to the general view of investor action and buy-sell pressures. He classifies active investors further into two groups viz., `professional investors' and `unsophisticated investors’. The former are resourceful enough to discover news and develop estimates of intrinsic value even before the unsophisticated investors get the news. They will, therefore, be the first to commence market action the moment a value-price mismatch is discovered. `Unsophisticated investors' including hasty speculators who act on `hot tips' would not get any news other than public news and will not have the skill to interpret even such public news. They will however, act in the market but such an action would be incompatible with true changes in intrinsic value. For instance, some of them might have got retirement benefits and would desperately want to invest in shares and securities. And unfortunately, such an action may come up at a time when price is more than value. Likewise, some such investors may have to finance a marriage in the family and would have to sell shares held by them even if price is already ruling at a level lower than the intrinsic value. It is obvious that the action of unsophisticated investors would cut against the trading pressures needed to rectify the disequilibrium between value and price.
48
An Overview
It is only when their irrational action takes prices to substantial `highs' or `lows' that the professional investors re-enter the scene and pocket enormous profits even while attempting to realign the errant prices to intrinsic values.
Paul Samuelson has supplemented the Cootner formulation of the valuation model by stressing the state of continuous equilibrium. Such a situation would be formed when prices adjust at high speed to values. Instantaneously adjusting prices to `vibrating values' would be known as perfectly efficient prices, which would be assumed to reflect all information. A security with perfectly efficient prices would be in continuous equilibrium.
3.3.4 The Dynamic Valuation Process
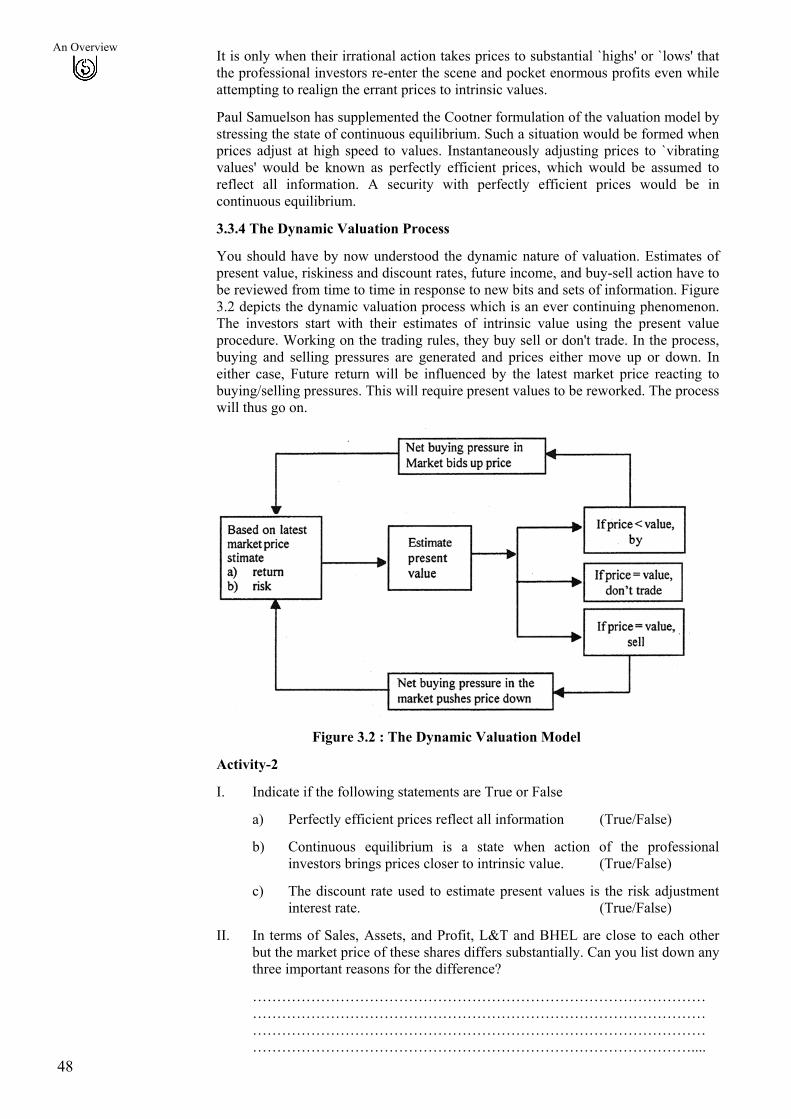
You should have by now understood the dynamic nature of valuation. Estimates of present value, riskiness and discount rates, future income, and buy-sell action have to be reviewed from time to time in response to new bits and sets of information. Figure 3.2 depicts the dynamic valuation process which is an ever continuing phenomenon. The investors start with their estimates of intrinsic value using the present value procedure. Working on the trading rules, they buy sell or don't trade. In the process, buying and selling pressures are generated and prices either move up or down. In either case, Future return will be influenced by the latest market price reacting to buying/selling pressures. This will require present values to be reworked. The process will thus go on.
Figure 3.2 : The Dynamic Valuation Model
Activity-2
I. Indicate if the following statements are True or False
a)
b)
c)
Perfectly efficient prices reflect all information (True/False)
Continuous equilibrium is a state when action of the professional investors brings prices closer to intrinsic value. (True/False)
The discount rate used to estimate present values is the risk adjustment interest rate. (True/False)
II. In terms of Sales, Assets, and Profit, L&T and BHEL are close to each other but the market price of these shares differs substantially. Can you list down any three important reasons for the difference?
………………………………………………………………………………………………………………………………………………………………………………………………………………………………………………………………………………………………………………………………………....
49
Valuation of Securities
3.4 VALUATION OF FIXED INCOME SECURITIES
Debt securities issued by governments, government and quasi-government organizations, and private business firms are fixed-income securities. Bonds and debentures are the most common examples.
The intrinsic value of a bond or debenture is equal to the present value of its expected cash flows. The coupon interest payments, and the principal repayment are known and the present value is determined by discounting these future payments from the issuer at an appropriate discount rate or market yield. The usual present value calculations are made with the help of the following equation:
n
1i=1
C TVPV = +(1+r) (1+r)∑ n (3.1)
Where PV = the present value of the security today (i.e., time period zero)
C = coupons or interest payments per time period `t'
TV = the terminal value repayable at maturity; this could be at part, premium, or even at discount (in extraordinary cases)
r = the appropriate discount rate or market yield
n = the number of years of maturity
The valuation methodology implicit in the above equation can be illustrated. Consider a bond (Bond-A) with a face value of Rs. 1,000 was issued with a maturity of five years at par to yield 10%. Interest is paid annually and the bond is newly issued. The value of the bond would be as follows:
A 2 3 4 5
Rs.100 Rs.100 Rs.100 Rs.100 Rs.100 + Rs.1000PV = + + + +1+.10 (1+.10) (1+.10) (1+.10) (1+.10)
=100×.9091+100×.8264+100×.7513+100×.6830+1100×.6209 =90.91+82.64+75.13+68.30+682.99 = 999.97 or Rs. 1,000 approx.
You should recognize that the present value of the bond viz. Rs. 1,000 estimated above is equal to the issue price because the bond has just been sold at par of Rs. 1,000.
Now, consider another bond (Bond-B) with a face value of Rs. 1,000 issued five years ago at a coupon of 6%. The bond had a maturity period of ten years and as of today, therefore, five more years are left for final repayment at par. The current discount rate is 10 per cent as before. All other characteristics of bond-B are identical with bond-A.
It is obvious that the present value of bond-B will not be Rs. 1,000 because investors will not pay this price and agree to receive Rs. 60 per year as interest for the next five years when bond-A with similar characteristics provides annual interest payments of Rs. 100 for the next five years. The present value of bond-B will be determined as follows:
B 2 3 4 5
Rs.60 Rs.60 Rs.60 Rs.60 Rs.60 + Rs.1000PV = + + + +1+.10 (1+.10) (1+.10) (1+.10) (1+.10)
=60×.9091+60×.8264+60×.7513+60×.6830+1060×.6209 =54.55+48.59+45.08+40.98+658.15 = Rs. 847.35
50
An Overview
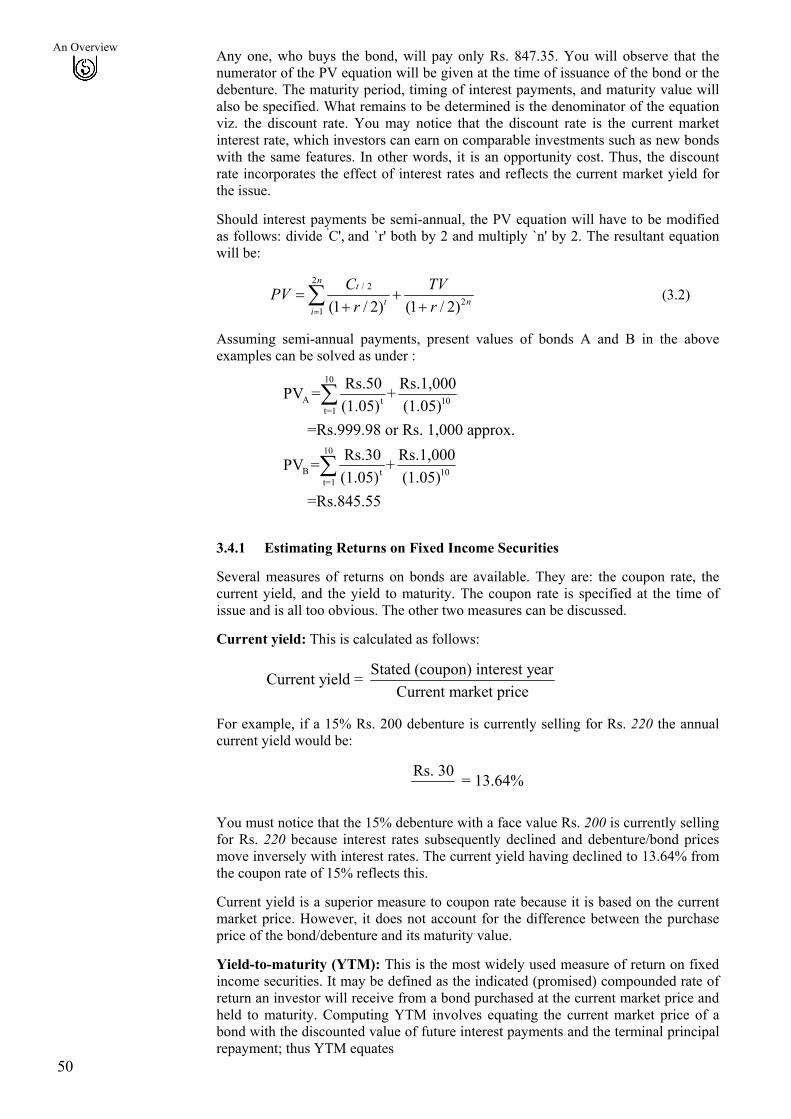
Any one, who buys the bond, will pay only Rs. 847.35. You will observe that the numerator of the PV equation will be given at the time of issuance of the bond or the debenture. The maturity period, timing of interest payments, and maturity value will also be specified. What remains to be determined is the denominator of the equation viz. the discount rate. You may notice that the discount rate is the current market interest rate, which investors can earn on comparable investments such as new bonds with the same features. In other words, it is an opportunity cost. Thus, the discount rate incorporates the effect of interest rates and reflects the current market yield for the issue.
Should interest payments be semi-annual, the PV equation will have to be modified as follows: divide 'C', and `r' both by 2 and multiply `n' by 2. The resultant equation will be:
2
/ 2
21 (1 / 2) (1 / 2)
nt
ti
C TVPVr r=
= ++ +∑ n (3.2)
Assuming semi-annual payments, present values of bonds A and B in the above examples can be solved as under :
10
A t 10t=1
10
B t 10t=1
Rs.50 Rs.1,000PV = +(1.05) (1.05)
=Rs.999.98 or Rs. 1,000 approx.Rs.30 Rs.1,000PV = +(1.05) (1.05)
=Rs.845.55
∑
∑
3.4.1 Estimating Returns on Fixed Income Securities
Several measures of returns on bonds are available. They are: the coupon rate, the current yield, and the yield to maturity. The coupon rate is specified at the time of issue and is all too obvious. The other two measures can be discussed.
Current yield: This is calculated as follows:
Stated (coupon) interest yearCurrent yield = Current market price
For example, if a 15% Rs. 200 debenture is currently selling for Rs. 220 the annual current yield would be:
Rs. 30 = 13.64%
You must notice that the 15% debenture with a face value Rs. 200 is currently selling for Rs. 220 because interest rates subsequently declined and debenture/bond prices move inversely with interest rates. The current yield having declined to 13.64% from the coupon rate of 15% reflects this.
Current yield is a superior measure to coupon rate because it is based on the current market price. However, it does not account for the difference between the purchase price of the bond/debenture and its maturity value.
Yield-to-maturity (YTM): This is the most widely used measure of return on fixed income securities. It may be defined as the indicated (promised) compounded rate of return an investor will receive from a bond purchased at the current market price and held to maturity. Computing YTM involves equating the current market price of a bond with the discounted value of future interest payments and the terminal principal repayment; thus YTM equates
51
Valuation of Securities
the two values, viz., the market price and the present value of future payments including the principal repayment. You may note that the compounding intervals may be annual, semi-annual or quarterly. Equations 3(1) or 3(2), the latter being modified for compounding intervals more frequent than one year, are generally used. If you are familiar with concept called internal rate of return discussed in MS-4 course, the YTM is IRR of initial investment (market price) and periodic payments including principal amount received at the end of the period.
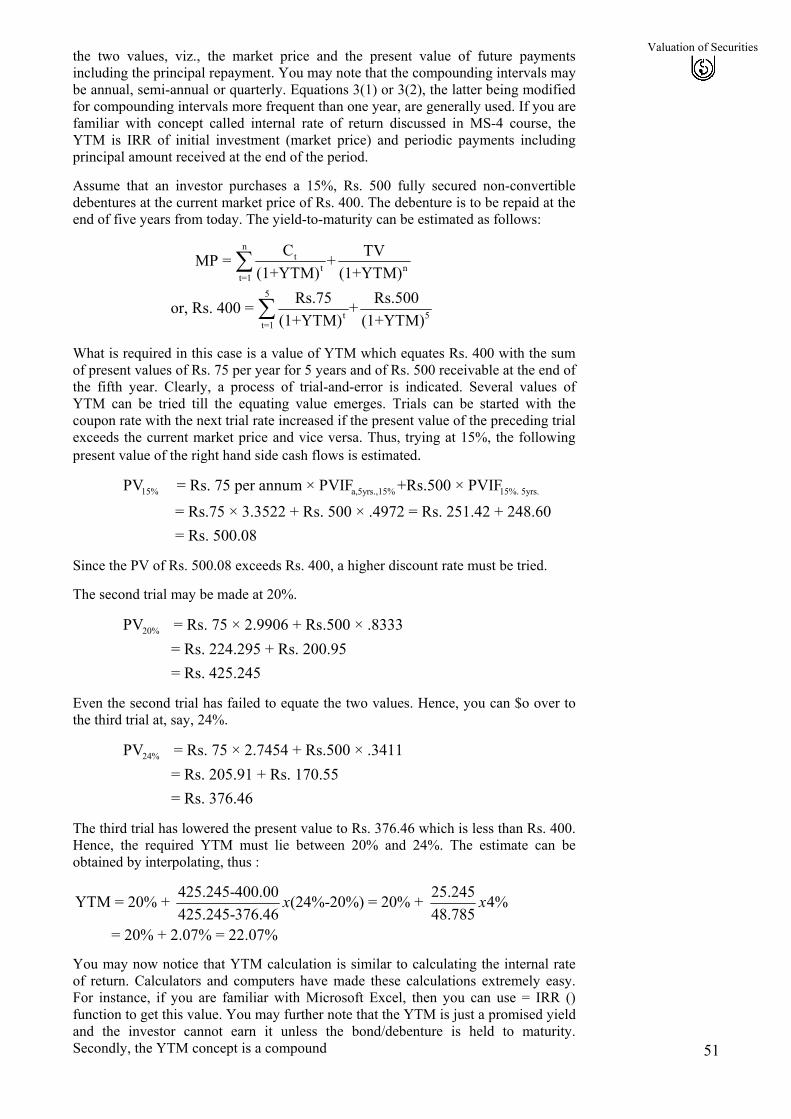
Assume that an investor purchases a 15%, Rs. 500 fully secured non-convertible debentures at the current market price of Rs. 400. The debenture is to be repaid at the end of five years from today. The yield-to-maturity can be estimated as follows:
nt
t nt=1
5
t 5t=1
C TV MP = +(1+YTM) (1+YTM)
Rs.75 Rs.500or, Rs. 400 = +(1+YTM) (1+YTM)
∑
∑
What is required in this case is a value of YTM which equates Rs. 400 with the sum of present values of Rs. 75 per year for 5 years and of Rs. 500 receivable at the end of the fifth year. Clearly, a process of trial-and-error is indicated. Several values of YTM can be tried till the equating value emerges. Trials can be started with the coupon rate with the next trial rate increased if the present value of the preceding trial exceeds the current market price and vice versa. Thus, trying at 15%, the following present value of the right hand side cash flows is estimated.
15% a,5yrs.,15% 15%. 5yrs.PV = Rs. 75 per annum × PVIF +Rs.500 × PVIF
= Rs.75 × 3.3522 + Rs. 500 × .4972 = Rs. 251.42 + 248.60 = Rs. 500.08
Since the PV of Rs. 500.08 exceeds Rs. 400, a higher discount rate must be tried.
The second trial may be made at 20%.
20%PV = Rs. 75 × 2.9906 + Rs.500 × .8333 = Rs. 224.295 + Rs. 200.95 = Rs. 425.245
Even the second trial has failed to equate the two values. Hence, you can $o over to the third trial at, say, 24%.
24%PV = Rs. 75 × 2.7454 + Rs.500 × .3411
= Rs. 205.91 + Rs. 170.55 = Rs. 376.46
The third trial has lowered the present value to Rs. 376.46 which is less than Rs. 400. Hence, the required YTM must lie between 20% and 24%. The estimate can be obtained by interpolating, thus :
425.245-400.00 25.245YTM = 20% + (24%-20%) = 20% + 4%425.245-376.46 48.785
= 20% + 2.07% = 22.07%
x x
You may now notice that YTM calculation is similar to calculating the internal rate of return. Calculators and computers have made these calculations extremely easy. For instance, if you are familiar with Microsoft Excel, then you can use = IRR () function to get this value. You may further note that the YTM is just a promised yield and the investor cannot earn it unless the bond/debenture is held to maturity. Secondly, the YTM concept is a compound
52
An Overview
interest concept with the investor earning interest-on-interest at YTM throughout the holding period till maturity. You should understand that if intermediate cash flows are not reinvested at YTM, the realized yield actually earned will differ from the promised YTM. For instance after the purchase of the above bond, if the interest rates decline in the market, then the interest received at the end of each year (Rs.75) can be invested only at a lower rate and thus affect the YTM, which you have just now calculated under the assumption that all interest received can be reinvested at the same rate of YTM. At the same time, you may note that investors may not lose much because the value of bond (market price) will increase and the bond will be attractive for investment as it carries more interest rate than current interest rate available.
Investors must make specific assumption about future re-investment rates in order to gain ideas about realized returns. Zero coupon bonds eliminate the reinvestment rate risk because investors know at the time of purchase itself the YTM that will be realized when the bond is held to maturity.
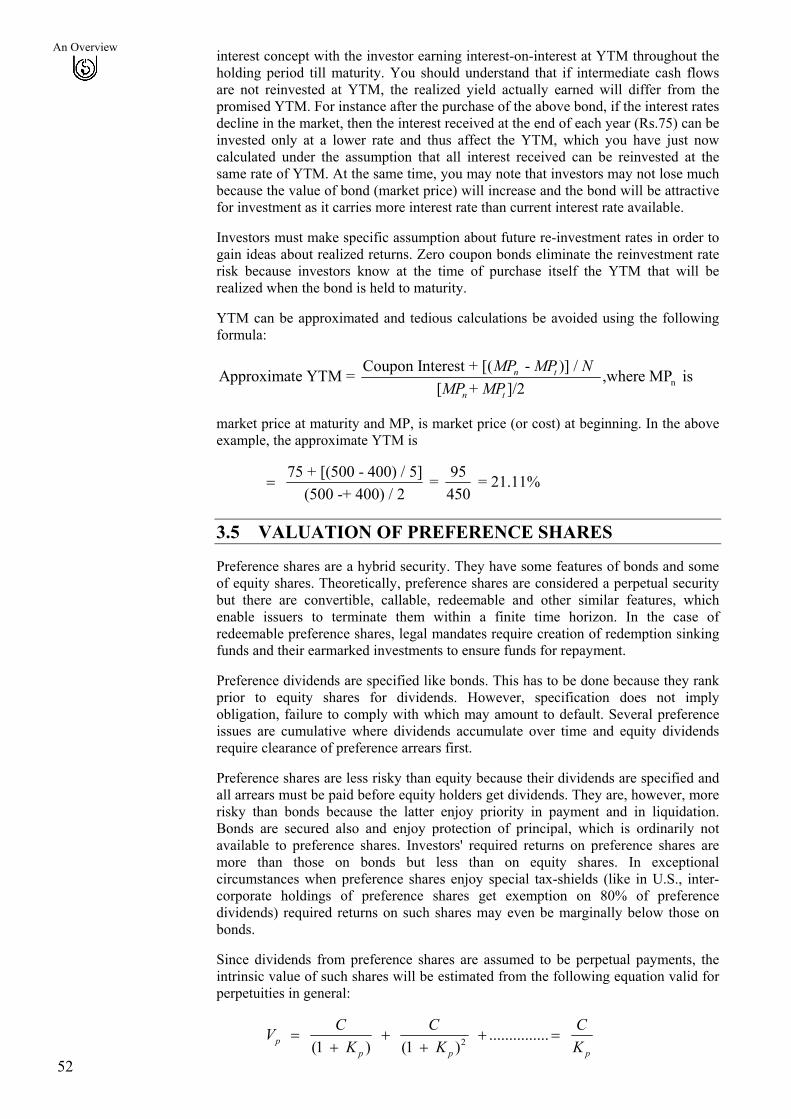
YTM can be approximated and tedious calculations be avoided using the following formula:
nCoupon Interest + [( - )] / Approximate YTM = ,where MP is
[ + ]/2n t
n t
MP MP NMP MP
market price at maturity and MP, is market price (or cost) at beginning. In the above example, the approximate YTM is
75 + [(500 - 400) / 5] 95 = = 21.11%(500 -+ 400) / 2 450
=
3.5 VALUATION OF PREFERENCE SHARES
Preference shares are a hybrid security. They have some features of bonds and some of equity shares. Theoretically, preference shares are considered a perpetual security but there are convertible, callable, redeemable and other similar features, which enable issuers to terminate them within a finite time horizon. In the case of redeemable preference shares, legal mandates require creation of redemption sinking funds and their earmarked investments to ensure funds for repayment.
Preference dividends are specified like bonds. This has to be done because they rank prior to equity shares for dividends. However, specification does not imply obligation, failure to comply with which may amount to default. Several preference issues are cumulative where dividends accumulate over time and equity dividends require clearance of preference arrears first.
Preference shares are less risky than equity because their dividends are specified and all arrears must be paid before equity holders get dividends. They are, however, more risky than bonds because the latter enjoy priority in payment and in liquidation. Bonds are secured also and enjoy protection of principal, which is ordinarily not available to preference shares. Investors' required returns on preference shares are more than those on bonds but less than on equity shares. In exceptional circumstances when preference shares enjoy special tax-shields (like in U.S., inter-corporate holdings of preference shares get exemption on 80% of preference dividends) required returns on such shares may even be marginally below those on bonds.
Since dividends from preference shares are assumed to be perpetual payments, the intrinsic value of such shares will be estimated from the following equation valid for perpetuities in general:
2 ............... (1 ) (1 )p
p p
C CVK K
= + + =+ + p
CK
53
Valuation of Securities
Where Vp = the value of a perpetuity today
C = the constant annual payment to be received
KP = the required rate of return appropriate for the perpetuity.
You have only to substitute preference dividend (D) for `C' and the appropriate required return (KPs) for 'KP' and obtain the following equation for valuing preference shares:
psV ps
DK
=
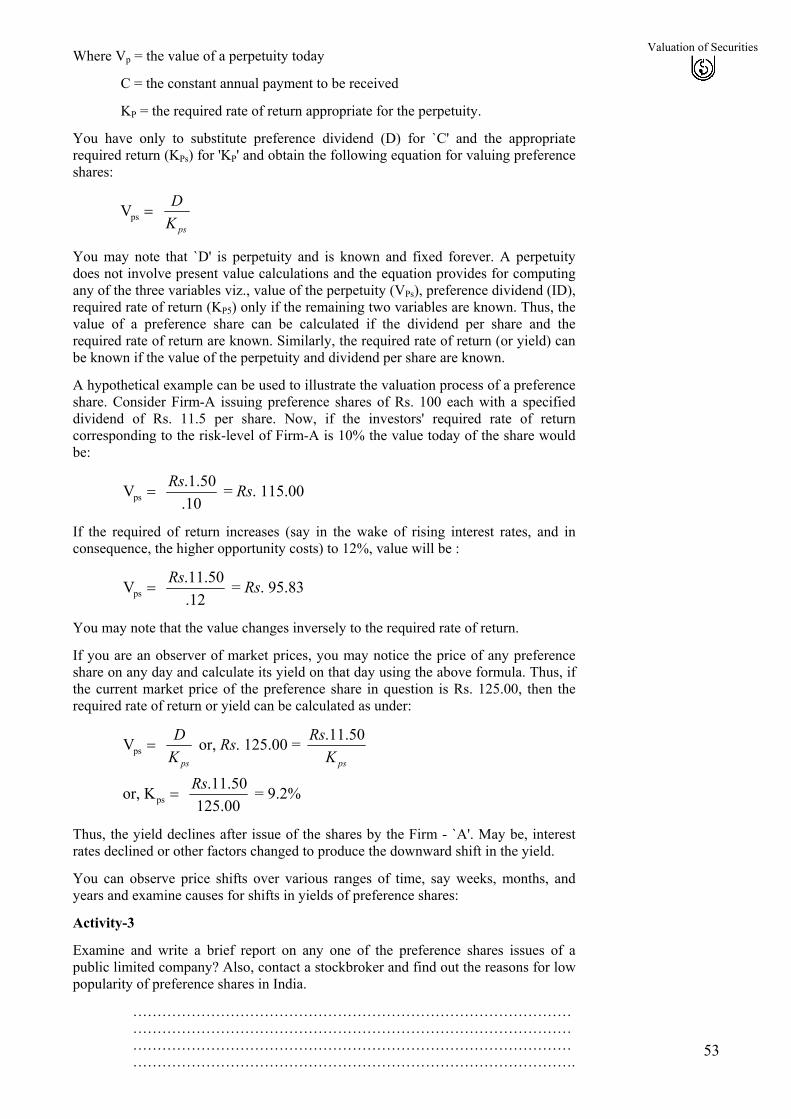
You may note that `D' is perpetuity and is known and fixed forever. A perpetuity does not involve present value calculations and the equation provides for computing any of the three variables viz., value of the perpetuity (VPs), preference dividend (ID), required rate of return (KP5) only if the remaining two variables are known. Thus, the value of a preference share can be calculated if the dividend per share and the required rate of return are known. Similarly, the required rate of return (or yield) can be known if the value of the perpetuity and dividend per share are known.
A hypothetical example can be used to illustrate the valuation process of a preference share. Consider Firm-A issuing preference shares of Rs. 100 each with a specified dividend of Rs. 11.5 per share. Now, if the investors' required rate of return corresponding to the risk-level of Firm-A is 10% the value today of the share would be:
ps.1.50V = . 115.00.10
Rs Rs=
If the required of return increases (say in the wake of rising interest rates, and in consequence, the higher opportunity costs) to 12%, value will be :
ps.11.50V = . 95.83.12
Rs Rs=
You may note that the value changes inversely to the required rate of return.
If you are an observer of market prices, you may notice the price of any preference share on any day and calculate its yield on that day using the above formula. Thus, if the current market price of the preference share in question is Rs. 125.00, then the required rate of return or yield can be calculated as under:
ps
ps
.11.50V or, . 125.00 =
.11.50or, K = 9.2%125.00
ps ps
D RRsK K
Rs
=
=
s
Thus, the yield declines after issue of the shares by the Firm - `A'. May be, interest rates declined or other factors changed to produce the downward shift in the yield.
You can observe price shifts over various ranges of time, say weeks, months, and years and examine causes for shifts in yields of preference shares:
Activity-3
Examine and write a brief report on any one of the preference shares issues of a public limited company? Also, contact a stockbroker and find out the reasons for low popularity of preference shares in India.
……………………………………………………………………………………………………………………………………………………………………………………………………………………………………………………………………………………………………………………………….
54
An Overview
3.6 VALUATION OF EQUITY SHARES You have known the basic features of equity shares in Unit 1. Unit 2 introduced the risk-return complexion of such securities. Calculating total return for the holding period on equity shares was also explained and illustrated in Unit 2. Factors affecting the riskiness of equity shares and other securities were also discussed in Unit 2. This section of the present unit will confine attention to valuation of equity shares using present value principles. The three broad approaches to valuation viz., efficient market, technical, and fundamental will be examined in detail in Block 3. However, much of what would be said and analyzed here would relate to `fundamental approach to valuation of equity shares'.
3.6.1 The Present Value of Expected Stream of Benefits from Equity Shares
Fundamental analysis is centred on presented value, which is computed as the discounted value of future stream of benefits. In the case of equity shares, the future stream of earnings poses two problems. One, it is neither specified (as in the case of preference shares) nor perfectly known in advance as an obligation (as in the case of bonds and debentures). Consequently, future benefits and their timing have both to be estimated in a probabilistic framework. Two, there are at least three other variables which are used as alternative measures of such benefits viz., dividends, cash flows, and earnings.
Solution to the first problem is offered by past data, which is appropriately modified for future projections. Of course, investors need to modify the past data by taking into account the current reality and then measure the growth rate.
The second problem can also be viewed as a case of the three alternatives not really conflicting with each other. The real question is: which cash flows are appropriate in the valuation of equity shares? Now, if you buy equity shares and place them all in a trust fund for your and your heir's perpetual benefit, what cash flows will be received in the trust fund? The answer is `dividends' because this is the only cash distribution, which a company makes to its shareholders. Even though earnings per share in any year do belong to the shareholders, companies do not distribute them all.
Does it mean we should ignore earnings in valuation? Probably, No. All dividends are paid out of earnings. Moreover, a popular approach to valuation of equity shares known as P/E ratio uses earnings as its basis. Hence, earnings are important. Now, if all earnings are paid out as dividends, they will be accounted for as dividends. In the event of a part of earnings being retained and reinvested, the effect will be to increase future earnings and finally future dividends also. Present value analysis should not count earnings reinvested currently and paid later as dividends. It will lead to double counting. In fact, the two can be properly defined and separated in which case the two variables viz., earnings and dividends would produce the same results. Thus, it is always correct to use dividends as the numerator of the present value equation used to estimate the intrinsic value of equity shares. The present value model, which uses dividends as its variable representing the cash flow stream, is known as the dividend valuation model. This model is discussed below and is followed by a discussion of the P/E approach to equity shares valuation.
3.6.2 Dividend Valuation Model
Under dividend valuation model, future dividends are discounted at the required rate to get the value of share. There are three possible situations on future dividend.
a)
b)
c)
Dividends do not grow in future i.e., the constant or zero growth assumption,
Dividends grow at a constant rate in future, i.e., the constant-growth assumption,
Dividends grow at varying rates in future time periods i.e., multiple-growth assumption.
The dividend valuation model is now discussed under the above three situations
a) The zero-growth Case : The growth rate of dividend D at time `t' will be known by solving for `g' in the following:
55
Valuation of Securities
t …….(3.3)
-1 = D (1 + g )t tD
-1
-1
D D = gD
t tt
t
or − ........(3.4)
You can easily see that when gt = 0, equation 3.3 will yield Dt = Dt-1 which means all future dividends would be equal to be current dividend (i.e., the dividend of the immediately preceding period available as one date). Now, the present value of dividends for an infinite future period would be:
t t t2 3
D D DV = + + + ...........1 + K (1 + K) (1 + K)
∞ …(3.5)
1 (1 K)
tt
t
D∞
= +=∑
Since, Do = D1 = D2 = D3, under the zero-growth assumption, the numerator Dt in equation 3.5 is replaced by Do to get
0
1V
(1 K)tt
D∞
=
=+∑
Taking the uniform `Do' out of summation, we obtain:
0 tt=1
1V=D(1 + K)
∞ ∑ ……..(3.6)
You will appreciate that discounting cash flows over a very distant long future period would, be meaningless. And mathematics tells us that if K>0 then the value of an infinite series like
the one in equation (3.6) is reduced to ` 1K
' so that equation (3.6) results in the
following :
00
0
D1 = KK
V=D ……..(3.7)
and since Do = D1, equation 3.7 can also be written as
tDV= K
……..(3.8)
You may recall that equation 3.8 was used for the valuation of preference shares. This is one case for the application of the zero-growth assumption. The calculation underlying the zero-growth model can be illustrated. Consider a preference share on which the company expects to pay a cash dividend of Rs. 9 per share for an indefinite future period. The required rate of return is 10% and the current market price is Rs. 80.00. Would you buy the share at its current price? This is zero-growth case because the dividend per share remains Rs. 9 for all future time periods. You may find the intrinsic value of the share using equation 3.7 or 3.8 as follows:
Rs.9.00V = = Rs..90
.10
Since the intrinsic value of Rs. 90 is more than the market price of Rs. 80, you would consider buying the share. b) The Constant Growth Case : When dividends grow in all future periods at a uniform rate ‘g’,
tt 0D D (1 + g)= ……(3.9)
56
An Overview
Substituting ‘D0’ in equation 3.5 by the value of Dt in equation 3.9, we get
t
0t
t=0
D (1 + g)(1 + K)
∞
∑V= …….(3.10)
Being a constant amount, `D0' can be written out of summation to obtain the
following equation :
t
0 tt=0
(1 + g)V=D(1 + K)
∞ ∑ …….(3.11)
Using the mathematical properties of infinite series, if K>g, then it can be shown that
t
tt=1
(1 + g) 1 + g = (1 + K) K - g
∞
∑ …..(3.12)
Substituting equation 3.12 into equation 3.11 yields the valuation formula for the constant growth situation as follows:
01 + V = D
- g
K g
…….(3.13)
Equation 3.13 can be re-written as follows:
0D (1 + ) DV = = - K - g
gK g
t …….(3.14)
Example
Alfa Ltd., paid a dividend of Rs.2.00 per share for the year ending March 31, 2002. A constant growth of 10% per annum has been forecast for an indefinite future period. Investors required rate of return has been estimated to be 15%. You want to buy the share at a market price of Rs. 60 quoted on July 1, 2002. What would be your decision?
Solution
This is a case of constant-growth-rate situation. Equation 3.14 can be used to find out the intrinsic value of the equity share as under :
1 . 2(1.10) .2.20V .44.00 - .15 - .10 .05D Rs Rs Rs
K g= = = =
The intrinsic value of Rs. 44 is less than the market price of Rs.60.00. Hence, the share is overvalued and you would think before investing in the stock.
c) The Multiple-Growth Case : The multiple-growth assumption has to be made in a vast number of practical situations. The infinite future time-period is viewed as divisible into two or more different growth segments. The investor must forecast the time `T' upto which growth would be variable and after which only the growth rate would show a pattern and would be constant. This would mean that present value calculations will have to be spread over two phases viz., one phase would last until time ‘T’and the other would begin after `T' to infinity.
The present value of all dividends forecast upto and including time `T' VT(i) would be: (3.15)
T
tT(i) t
t=1
DV = (1 + K)∑ …………(3.15)
The second phase present value is denoted by VT(2) and would be based on constant-growth dividends forecast after time `T'. The position of the investor at time `T' after which
57
Valuation of Securities
the second phase commences can be viewed as a point in time when he is forecasting a stream of dividends for time periods T+1, T+2, T+3, and so on which grow at a constant rate. The second phase dividends would be :
T+1 T
2T+2 T+1 T
3T+3 T+2 T
D = D (1 + g)
D = D (1 + g) = D (1 + g)
D = D (1 + g) = D (1 + g)And so on. The present value of the second phase stream of dividends can, therefore, be estimated using equation 3.14 at time 'T':
T T+11V = D
K - g
…………(3.16)
You may note that `VT' given by equation 3.16 is the present value at time `T' of all future expected dividends. Hence, when this value has to be viewed at time `zero', it must be discounted to provide the present value at `zero' time for the second phase present value. The latter can also be viewed at time `zero' as a series of cash dividends that grow a constant rate as already stated. The resulting second phase value VT(2) will be given by the following equation:
T(2) T1V V
(1 )
TK
= +
T+1T
D = (K - g)(1 + K)
………….(3.17)
Now, the two present values of phase 1 and phase 2 can be added to estimate the intrinsic value of an equity share that will pass through a multiple growth situation. The following describes the summation procedure of the two phases:
0 T(1) T(2)V = V + V
T
t T+1t
t=1
D D= + (1 + K) (K - g)(1 + K)∑ T ……(3.18)
Example Cronecom Ltd., paid dividends amounting to Rs.0.75 per share during the last year. The company is expected to pay Rs. 2.00 per share during the next year. Investors forecast a dividend of Rs. 3.00 per share in the year after that. At this time, the forecast is that dividends will grow at 10% per year into an indefinite future. Would you buy/sell the share if the current price is Rs. 50.00? The required rate of return is 15%. Solution This is a case of multiple growth. The values VT(1) and VT(2) can be calculated as follows:
T(1) 1 2
T(2) 2
Rs. 2.0 Rs. 3.0V = + = Rs. 4.10(1 + .15) (1 + .15)
Rs. 3.30V = = Rs. 49.91(.15 - .10)(1 + .15)
Since Vo = VT(1) + VT(2) , the two values can be summed to find the intrinsic value of a Cromecon equity share at the time `zero'. This is given below: Vo = Rs. 4.01 + Rs. 49.91 = Rs. 53.92 At the current price of Rs. 50.00, the share is under-priced and hence you will buy the stock.
58
An Overview
3.6.3 The P/E Approach to Equity Valuation
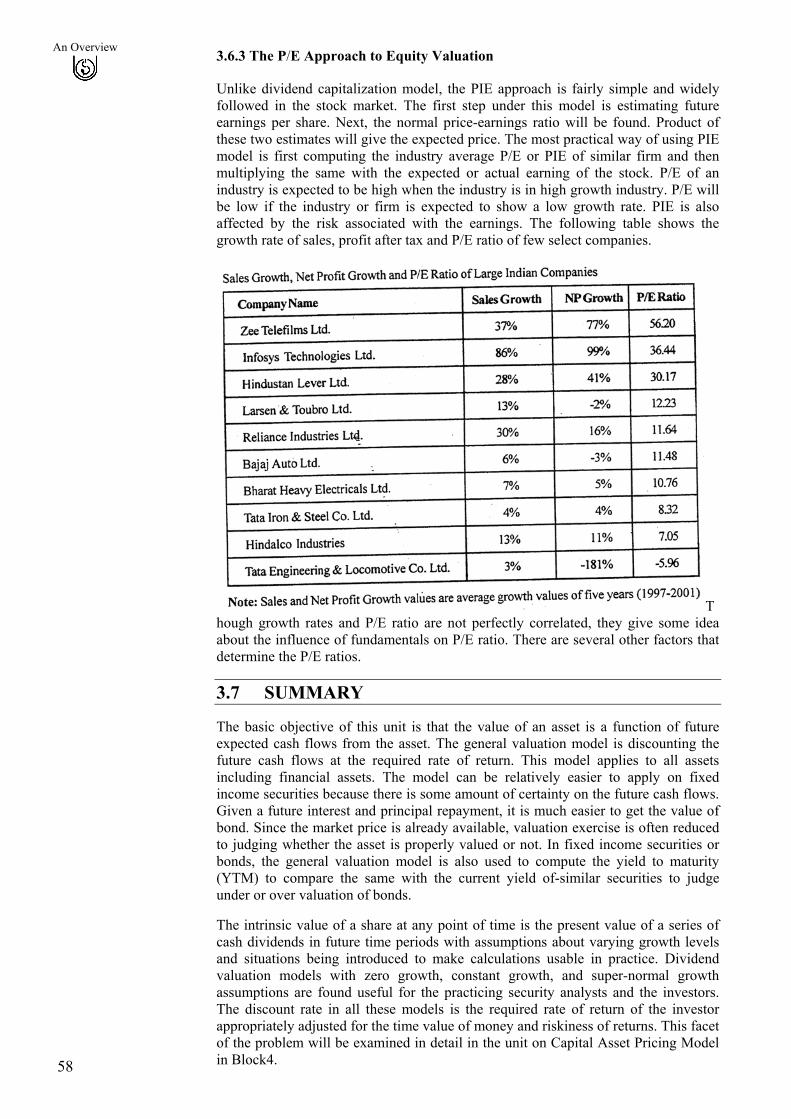
Unlike dividend capitalization model, the PIE approach is fairly simple and widely followed in the stock market. The first step under this model is estimating future earnings per share. Next, the normal price-earnings ratio will be found. Product of these two estimates will give the expected price. The most practical way of using PIE model is first computing the industry average P/E or PIE of similar firm and then multiplying the same with the expected or actual earning of the stock. P/E of an industry is expected to be high when the industry is in high growth industry. P/E will be low if the industry or firm is expected to show a low growth rate. PIE is also affected by the risk associated with the earnings. The following table shows the growth rate of sales, profit after tax and P/E ratio of few select companies.
Though growth rates and P/E ratio are not perfectly correlated, they give some idea about the influence of fundamentals on P/E ratio. There are several other factors that determine the P/E ratios.
3.7 SUMMARY
The basic objective of this unit is that the value of an asset is a function of future expected cash flows from the asset. The general valuation model is discounting the future cash flows at the required rate of return. This model applies to all assets including financial assets. The model can be relatively easier to apply on fixed income securities because there is some amount of certainty on the future cash flows. Given a future interest and principal repayment, it is much easier to get the value of bond. Since the market price is already available, valuation exercise is often reduced to judging whether the asset is properly valued or not. In fixed income securities or bonds, the general valuation model is also used to compute the yield to maturity (YTM) to compare the same with the current yield of-similar securities to judge under or over valuation of bonds.
The intrinsic value of a share at any point of time is the present value of a series of cash dividends in future time periods with assumptions about varying growth levels and situations being introduced to make calculations usable in practice. Dividend valuation models with zero growth, constant growth, and super-normal growth assumptions are found useful for the practicing security analysts and the investors. The discount rate in all these models is the required rate of return of the investor appropriately adjusted for the time value of money and riskiness of returns. This facet of the problem will be examined in detail in the unit on Capital Asset Pricing Model in Block4.
59
Valuation of Securities
A much simplified and practical valuation model is price-earnings model. Under this model, the stock price is the product of expected earnings and normal P/E ratio of the stock. The normal PIE ratio is either the average of the industry or P/E ratio of similar company in the market. Of course, the analysts can't use the P/E model and for that matter even theoretically richer dividend discount model blindly because there are several other factors which determine the value of the stock.
3.8 KEY WORDS Active Investment Strategy : A form of investment management which involves buying and selling financial assets with the objective of earning positive risk-adjusted returns.
Constant Growth Model : A version of the dividend valuation model which assumes that dividends are expected to grow at a constant rate overtime. It can be used to solve the current price of a share.
Current Yield : The yield on a security1resulting from dividing interest payments or dividends by the current market price of the security.
Dividend Valuation Model : A widely used model to value equity shares. The model states that the current price of a share is equal to the discounted value of all future dividends.
Earnings Multiplier : The P/E approach which states that the price of a share is equal to the product of its earnings and a multiplier.
Expected Return : The ex ante return expected by investors over some future holding period. The expected return often differs from the realised return.
Fundamental Analysis : A form of security analysis which seeks to determine the intrinsic value of securities based on underlying economic factors. These intrinsic values are compared to current market prices to estimate current levels of mispricing.
Holding Period Return : The total return from an investment for a given period of time, including both yield and capital gain or loss.
Interest Rate Risk : The uncertainty in the return on a fixed-income security caused by unanticipated fluctuations in the value of the asset due to changes in interest rates.
Multiple Growth Model : A type of dividend valuation model in which dividends are assumed to grow at different rates over specifically defined time periods.
P/E Ratio : The ratio of share price to earnings using historical, current or estimated data. This ratio is also referred to as multiplier.
Passive Investment Strategy: A strategy whereby investors do not actively seek out trading possibilities in an attempt to out perform the market.
Promised Yield-to-Maturity: The yield-to-maturity on a bond calculated assuming that all promised cash flows are received on a full and timely basis.
Security Analysis: A component of the investment process that involves determining the prospective future benefits of a security, the conditions under which such benefits will be received, and the likelihood of such conditions occurring.
Timing: An aspect of security analysis which entails forecasting the price movements of asset classes relative to each other.
Top-down Forecasting: The valuation sequence in security which entails first making forecasts for the economy, then for industries and finally for individual companies. Each level of forecast is conditional on the previous level of forecasts made.
Valuation Sequence : Same as top-down forecasting.
Yield-to-Maturity: The indicated (promised) compounded rate of return that an investor will receive from a bond purchased at the current market price and held to maturity.
60
An Overview
3.9 SELF-ASSESSMENT QUESTIONS/EXERCISES 1) Arun is considering investment in the equity shares of the industry leader,
TISCO, and has performed detailed analysis and research into the history and performance of the company. To be on sound wickets, what other information should be obtained before taking the final decision ?
2) A 5% Rs.1000 bond has 25 years remaining to maturity. What would be the intrinsic value of the bond today if the current market yield is 6.5%. Interest is payable on the bond semi-annually.
3) A 5% Rs. 1000 bond paying interest at annual intervals and having 25 years to maturity is currently selling for Rs. 816. It is anticipated that the market yield is likely to decline 5.5%. Estimate the intrinsic value of the bond two years hence.
4) Indicate the correct alternative in the following :
a) The value of a security :
i)
ii)
iii)
i)
ii)
iii)
ii)
iii)
i)
ii)
iii)
i)
iii)
is synonymous with its price
depends on the assessed value of the firm's physical assets
equals the discounted present value of its future income.
b) An investor would be taking a rational decision if :
he buys when price is greater than value
he does not trade when price is less than value
he buys when price is less than value.
c) The Cootner hypothesis states that : prices and values both fluctuate
prices fluctuate within upper and lower reflecting barriers that bracket the consensus value estimate
all of the above
d) The erratic price changes in securities markets are caused by :
the supply and demand conditions of primary issues
the continuous arrival of new information
the size of trading volume in the security
e) A perfectly efficient securities market is one where :
prices and values fluctuate
ii) prices equal values in a continuous equilibrium and they vibrate together randomly
all of the above
5) Match the following words and phrases with their correct definitions :
Word or Phrase Definition or Description
1) Price per share A) Present value of an equity share based on all future dividends that grow at different rates.
2) Passive investment Strategy B) Promised yield on a bond purchased at current market price and held to maturity.
3) Intrinsic value per share C) The correct decision when it is under priced
61
Valuation of Securities
4) Continuous equilibrium D) A value determined by market processes that can sometimes be irrational
5) Buy a security E) A buy-and-hold strategy with no trading
6) Yield-to-maturity F) A value estimated by an informed analyst
7) Multiple growth dividend valuation G) The value and price fluctuate randomly together.
6)
a)
b)
c)
The equity share of Manjit Textiles Ltd., is currently selling at Rs. 55.00. Earnings per share and dividends per share of the company over the past year were Rs. 3.00 and Rs. 0.75 respectively. Fundamental analysts have worked out the following forecasts of dividends, earnings, growth rates, and payout ratios for the next two years.
Year1
D1 = Rs. 2.00 ; El = Rs. 5.00 ; gel = 67%; p1 =40%
Year 2
D2 = Rs. 3.00 ; E2= Rs. 6.00 ; ge2 = 20% ; p2 = 50%
It has been further forecast that earnings and dividend are expected to grow at a constant rate of 10% after year 2. Consequently, the data for year 3 would be as follows:
Year 3
D3= Rs. 3.30; E3 = Rs. 6.60; ge3 =10%; p = 50%
You are required to estimate the normal price-earnings ratio of Manjit Textiles if the required rate of returns is 15%. Do you think that the Manjit Textiles equity share is fairly valued?
7) Indicate if the following statements are True or False:
If the economic outlook suggests a recession that will have an impact on all industries and all companies, investors would be advised to maintain high portfolio liquidity.
Cyclical industries typically do much better than the aggregate economy during downturns, but suffer more during upturns.
It is not really necessary to know the time pattern of returns from an investment so that the income stream can be properly valued relative to alternative investments.
d) Results of a study by King showed that about 62 per cent of the security's price changes were explained by a combination of market and industry components.
e) A bond promises interest payments every six months equal to one-half the coupon rate times the face value of the bond and the payment of the principal at its maturity.
3.10 FURTHER READINGS Fuller, Russel J., and Farrell, Jr., James L. 1987, Modern vestments and Security Analysis, New York : McGraw-Hill Book Company.
Gordon, Myron J., 1962, The Investment, Financing & Valuation of the Corporation, Homewood III .: Irwin.

62
An Overview
Graham, Bengamin, 1973, The Intelligent Investor, Harper & Row, New York. (5th ed.)
Juttle, Donald L., ed., 1983, The Revolution in Techniques for Mar,; Bing Bond Portfolios, The Institute of Chartered Financial Analysis, Chulottesville.
Gup, Benton E., 1987, The Basics of Investing, John Wiley, 3'd ed., New York.
Lorie, James H., and Hamilton, Mar7y T., 1973, The Stock Market : T-aories a; iEvidence, Homewood III : Richard D. Irwin.
Fischer, Donald E., and Jordan, Ronald J., 1990, Security Analysis and Portfolio Management; 41" ed., Prentice Hall of India Private Ltd.