Embed Size (px)
Citation preview
AnnuAl RepoRt 2015

32015 Annual Report
Key Financial Indicators
Executive Overview
At a Glance
Business Review• Gas Arm• EPC Arm• Power Arm• Oil Marketing Arm
Renewable Energy
Corporate Social Responsibility
Corporate Governance
Capital Expenditure and Investment
Financial Highlights• Financial Review• Consolidated Income Statement• Financial Results• Revenue & Gross Profit
Auditor’s report • Consolidated Financial Position• Consolidated Statement of Income• Consolidated Statement of Changes in Shareholder’s Equity• Consolidated Statement of Cash Flows• Summarize notes to the Consolidated Financial Statements
4
6
8
1012162024
28
30
32
34
3839404243
4412356-27
A world of energy
COntEntS

2.3Bn In Investments
3.4thousand employees
23 CompaniesEstablished and Incorporated
Key FInAnCIAl IndICAtoRs
TAQA Arabia is the largest standing private sector energy distribution company in Egypt. With over 18 years of experience, TAQA offers diversified sources of energy, investing and operating energy infrastructure including gas transmission and distribution, power generation and distribution, and marketing of all petroleum products.
“Business does not operate as usual in this diverse region, where cultural norms often dictate the way businesses develop and impact their potential for growth. Longstanding relationships with key players in the public and private sectors have given tAQA Arabia the knowledge base and experience to know what partnerships to develop, when to invest, and which projects to add to our successful portfolio.”
700thousand Customers
Connected to natural Gas
43 oil & Gas Stations in Different Parts of Egypt
6 CountriesAcross the Middle East and Africa
Key Financial Indicators A WORLD OF ENERGY
powerGenerated & Distributed over the past 5 years
1000 Mkwhr
more than
4 tAQA Arabia 52015 Annual Report

exeCutIve oveRvIew
eneRGy FoR the people
Energy is all around us; it is a fundamental factor of everyday life. Spanning over nearly two decades of operation, we have learned that not only can energy enhance prosperity, but it can also solely eradicate poverty.
“ tAQA Arabia emerged from a vision to meet the region’s diverse energy needs and become the top-ranking diversified energy distribution company in Egypt. Our strategy is based on capitalizing on the vast, untapped energy opportunities in Egypt as well as the Middle East and Africa. We seek to meet the region’s increasing demand for energy, which is the result of rapid industrial development. We have undergone strategic expansion that has extended our operation to six different countries in the region. ”
Eng. Khaled Abu BakrTAQA Arabia Executive Chairman
MovInG Into the FutuRe
TAQA is constantly striving to reach the next stage of success.
Our management is founded through a core of wide-ranging knowledge of the region and a caliber of leadership which exceeds that of our competitors. this positions tAQA Arabia to take advantage of markets in which it operates in four ways:
1. A key component of our tactical approach is our commitment to market innovation, which is an integral part of our medium- and long-term strategies. Innovation allows us to stay ahead of the competition and continually open new markets.
2. the ever increasing demand for energy across the Middle East and Africa, coupled with historical lack of investment in energy infrastructure, tactically positions TAQA Arabia to fulfill the region’s needs.
3. As regional governments promote more private initiatives, TAQA Arabia, with its firm history of strong historical performance and long-term contracts, has the first-move advantage to capitalize on these opportunities, thus upholding our leading position in the market.
4. Supported by solid financials, we are ideally positioned to capitalize on market opportunities while withstanding economic volatility.
solutIon-BAsed stRAteGy
Energy is the foundation of life as we know it. It allows everything from minor biological cells to thriving massive factories to grow and flourish. It is the key factor contributing to human advancement, assisting us in achieving consistent greatness. The passion to discover new, innovative ways to harness this power and turn our dreams into realities is the root of our endeavor to make energy accessible to all.
Global trends have been consciously shifting towards renewable energy sources such as wind, solar, and bio-fuels. By entering the market of renewable energy development, tAQA has given companies and residents access to cleaner, more sustainable sources of power.
28%GROWtH InREvEnuES
2.3BIllIon EGP
REvEnuES
160MIllIon EGP
PROFItS
2.6BIllIon EGP
tOtAL ASSEtS
Executive Overview
6 tAQA Arabia
A WORLD OF ENERGY
72015 Annual Report

A WORLD OF ENERGY At a Glance
At A GlAnCe
tAQA Gas
tAQA Gas handles all downstream activity aspects, ranging from the development to the operation of natural gas distribution networks in residential cities and industrial zones, via its four subsidiaries: City Gas, Repco Gas, trans Gas, and nile valley Gas.
It distributes to a total of more than 700,000 customers in over 14 governorates. tAQA Gas also specializes in the technical assessment of projects prior to installation.
tAQA epC
Operating in Egypt, Qatar, Iraq, and the uAE, tAQA EPC is the company’s engineering, procurement, and construction arm. It is responsible for designing and building pipeline connections as well as connecting customers and clients to the national grid.
the construction division offers innovative energy and infrastructure solutions to a roster of over one million domestic and international customers. tAQA EPC operates House Gas, the largest private gas construction company in Egypt.
tAQA EPC’s engineering, design, and technical studies division is known as the Engineering Gulf of Suez Company (EGuSCO). EGuSCO is considered one of the leading engineering consultants in the Middle East & Africa for natural gas and liquefied-petroleum gas. It is the only private sector engineering solutions provider that caters to both public and private third-party clients.
tAQA power
tAQA Power’s backbone is Global Energy, a company established in 1999 and acquired by TAQA in 2006. The firm’s scope of activities is an extensive one, encompassing engineering as well as electricity generation and distribution. It’s clients range from industrial, residential, commercial, oil and gas to tourism firms all across Egypt.
tAQA Power’s electricity generation solutions are tailored to meet our client’s specific needs and provide efficient power management, emergency power supplies, and distributed power transformation.
On the distribution end, tAQA Power exploits its immense engineering strength, which includes construction, management, operation, and maintenance of medium (11, 22, and 33 kv) and low-voltage electricity distribution networks.
the company’s customized distribution networks ensure that clients have the safe and reliable electricity solutions that we strive to offer. In addition, this arm implements strategic planning and capital expenditure calculations for project infrastructure, covering services such as electricity, diesel, water, wastewater treatment, natural gas, district cooling, and provision of utilities for medium to large-scale development projects.
tAQA oil Marketing
2015 marks the seventh operating year for tAQA Oil Marketing in the Egyptian market. this year also saw increased political stability in the country, which put the wheels of the economy in motion following a period of stagnation caused by the unrest and turmoil of the preceding few years. Despite these setbacks, tAQA Oil Marketing owns and operates 43 full service stations in Egypt.
tAQA for Marketing Oil Products S.A.E. was established in 2008 as the first privately owned Egyptian company licensed to market petroleum products, including fuels and lubricants through a retail network of service stations under the tAQA brand name and is Egypt’s sole distributor of Castrol product and the leading global lubricants manufacturer.
tAQA Oil Marketing began local production of select Castrol products in the fourth quarter of 2009. Castrol products in the Egyptian market fulfill the demands of motorists across all classes and passionate bikers through an extensive range of automotive engine oils, manual and automatic transmission fluids, chain lubricants, and brake fluids in addition to a range of commercial diesel engine oils to cover the needs of fleets, owner operators and B2B segments.
Compressed natural Gas
tAQA Oil Marketing offers natural gas conversions for vehicles through its affiliate Master Gas, which has been converting approximately 2,000 cars every year via six conversion centres nationwide.
In response to the growing demand for energy and the extensive resources in the Middle East and Africa, TAQA Arabia was established in 2006 to exploit the available resources and generate sufficient energy for under-served markets. Since its launch, tAQA has become the largest private energy distribution company in Egypt. With investments amounting to *insert
new figures here* through four distinct business arms; gas, EPC, power, and oil marketing.
These four arms allow us to be a one-stop destination for energy distribution. The gas arm handles concessions, distribution and sales; the EPC arm covers engineering, procurement and construction; the power arm oversees electricity generation and renewable energy; and the oil marketing arm controls gas and conversion stations. this comprehensive coverage of multiple sectors of the energy industry has streamlined our operations, increased our efficiency, and yielded impressive returns for our shareholders, partners, customers, and governments.
8 tAQA Arabia
tAQA Gas
tAQA epC
tAQA power
tAQA oilMarketing
tAQA Arabia
92015 Annual Report

A WORLD OF ENERGY
1110 TAQA Arabia 2015 Annual Report
Business Review
TAQA OIL MARKETINGTAQA POWERTAQA EPC TAQA GAS
BusIness RevIew

A WORLD OF ENERGY
1312 TAQA Arabia 2015 Annual Report
Business Review
Consequently, tAQA Arabia has invested heavily in its gas arm, allowing it to become Egypt’s market leader in gas distribution. the arm distributes natural gas to a notable number of residential and industrial clients through its four subsidiaries, City Gas, Repco Gas, trans Gas, and nile valley Gas concessions.
Despite political and economic unrest in the region, tAQA Gas has consistently managed to increase the number of residential and industrial clients it serves.
GAs ARM
CustoMeRs
725thousand
CuBIC MeteRs AnnuAlly
2.89billion
TAQA GasThe growing demand for natural gas for residential and industrial projects has made TAQA Gas the fastest growing sector of the global energy market.
oveR

A WORLD OF ENERGY Business Review
GAs ARM
TAQA Gas’ four subsidiaries specialize in all downstream activity aspects, including development, operation, and maintenance of gas networks in residential cities and industrial zones.
seRvICes tAQA Gas’ four subsidiaries specialize in all downstream activity aspects, including development, operation, and maintenance of gas networks in residential cities and industrial zones. they handle concession and maintenance operations, pressure reduction stations, high-pressure transmission pipelines, medium and low-pressure distribution networks, technical assistance, customer service, customer invoicing, gas marketing, and 24-hour emergency services. these operations include more than 530 pressure reduction stations, regulators with capacities of up to 210,000 cubic meters per hour, and a network of pipes stretching more than four million meters in length and ranging from two to 32 inches in diameter.
tAQA Gas also specializes in technical assessment of projects, analyzing design, performing qualitative risk analysis, and determining techno-economic feasibility and environmental impact.
dIstRIButIontAQA Gas distributes over 2.89 billion cubic meters of natural gas annually to a vast array of customers in more than 11 governorates. the arm’s focal work is to build, operate, and maintain substation through which it distributes gas to surrounding localities. Currently, the company performs collections, operations, and maintenance for over 725,000 customers. the number of industrial users reached 182, including three fertilizer factories, three power stations, 14 CnG stations, and more than 70 touristic compounds and hotels.
2015 hIGhlIGhtsDue to the shortage in gas availability, sales to industrial clients saw a decrease from previous years. However, the gas arm succeeded in diversifying its income sources and offset the hit by increasing domestic connections and customer services activities.
• Residential customers increased by over 12.5% in 2015, reaching 725 thousand
• Industrial customers escalated to 182, a growth of 10.5% over the previous year
Gas Business historical Results
Gas sales volume BCM
0
1
2
3
4
5
no.of Industrial Customers
150
160
170
180
190
no.of Residintial Customers
2014 2015 2014 2015
740K
720K
700K
680K
600K
620K
660K
640K
2014 2015
14 tAQA Arabia
2014 2015
Gas Sales volume BCM 3.7 2.89
no. of Operated Residential Customers 644307 724570
no. Of industrials Customers 165 182
152015 Annual Report
the 26th woRld GAs ConFeRenCe Is the largest and most prestigious conference in the global gas industry calendar gathering thousands of leading energy players and decision maker. the conference takes place every 3 years and brings together thousands of professionals from 600 organizations and 100 countries who come to network, share knowledge and conduct business. It has become one of the most comprehensive and well-researched programs in the world, encompassing 70 topics spanning across the global oil and gas value chain. tAQA Gas has made sure to be a part of this event dating back many years ago and is the only Egyptian company to date attending the prestigious

A WORLD OF ENERGY
1716 TAQA Arabia 2015 Annual Report
Business Review
the construction division alone offers energy and infrastructure solutions to over one million domestic and international, loyal customers. the largest private gas construction company in Egypt; House Gas is operated by tAQA EPC. Our engineering, design, and technical studies division is known as the Engineering Gulf of Suez Company (EGuSCO) which is considered to be one of the leading engineering consultants in the Middle East & Africa for natural gas and liquefied-petroleum gas. It is the only private sector engineering solutions provider that caters to both public and private third-party clients.
tAQA EPC is the company’s leading lever for engineering, procurement and construction, guaranteeing a scope of fully-fledged services to incoming markets and clients. Our multi-faceted facilities enable
our engineers to offer clients proficient construction progress on site at the most competitive prices in the market. the work produced by tAQA EPC has molded it into one of the leading engineering consulting firms in the Middle East and Africa for natural gas and liquefied petroleum gas pipelines. tAQA EPC is a subcontractor for the group’s Qatari, Iraqi, and Emirati operations, acting as a feeding industry to the remaining arms. Furthermore, it is the Middle East and Africa’s pimary expert in gas and utility solutions. We plan to expand our investments in industrial projects, all the while maintaining quality services to domestic customers. tAQA EPC has successfully met its targets to reduce the costs, risks, and obligations associated with domestic conversions.
epC ARM
ResIdentIAl CustoMeRs
55 thousand
IndustRIAl CustoMeRs
139
Operating in Egypt, Qatar, Iraq, and the UAE, TAQA EPC is the company’s engineering, procurement, and construction arm. It is solely responsible for designing and building pipeline connections as well as connecting clienteles and consumers to the national grid.
TAQA EPC

A WORLD OF ENERGY Business Review
epC ARM
TAQA EPC is the company’s leading lever for engineering, procurement and construction, guaranteeing a scope of fully-fledged services to incoming markets and clients.
ConstRuCtIon seRvICes the construction division offers energy and infrastructure solutions to over one million domestic and international customers including public and private companies. Examples of companies we have extended our reach to is RMG Donkin, Emesons, Akfel Grou, EDF Power, Group Suez, and EBIC Fertilizer Group.
We also offer an array of construction services ranging from gas and electricity connections, water sanitation, duel fuel supplies, water networks, pipelines, sewer construction, and telecom duct works.
Our turnover record in the delivery of turnkey projects is admirable, and we provide a wide range of construction services due to our multi-accredited, unmatched teams.
tAQA EPC expanded its electromechanical activities to be included in the new power plants in Egypt as well as being awarded contracts with the General Petroleum Company.
enGIneeRInG And desIGn seRvICestAQA EPC’s engineering, design, and technical studies division is known as the Engineering Gulf of Suez Company (EGuSCO) which is considered to be one of the leading engineering consultants in the Middle east & Africa for natural gas and liquefied-petroleum gas.
Its engineering and consultancy services cover gas pipeline engineering, route selection, optimization of pipeline systems, coating and protection standards, process design, contracting philosophy, execution plan, project schedule, security framework, strategic planning, cost forecasting, and draft tender packages. It also covers feasibility, marketing, planning studies, and business plan development, such as technical and economic audits and natural gas utilization consulting services.
2015 hIGhlIGhts
Construction Highlights - Potential Projects Budget 2015
tAQA EPC expanded its electromechanical activities to be included in the new power plants in Egypt as well as being awarded contracts with the General Petroleum Company.
description 2014 2015
total Connected Residential Customers 54,846 55,010
Residential Customers Revenue 73,355 77,460
number Of Industrial Customers 128 139
Industrial Customers Revenue 37,629 44,881
epC Business historical Results
total Connected Residential Customers
0 0 0
30 30 30
60 60 60
90 90 90
120 120 120
150 150 150
Residential Customers Revenue no. of Industrial Customers
2014 2015
0
30
60
90
120
150
Industrial Customers Revenue
2014 2015
2014 2015 2014 2015
18 tAQA Arabia 192015 Annual Report

A WORLD OF ENERGY
2120 TAQA Arabia 2015 Annual Report
Business Review
Recently, tAQA proudly signed a Joint Development Agreement with Edison to develop and build a 180 MW combined cycle utilizing natural Gas. this project will be the first IPP project of its kind in Egypt to be completely independent using the Egyptian Electricity Unified Grid for power transmissions exclusively to tAQA Power clients.
In the last quarter of 2015, TAQA Power certificates were audited by external tuv auditors who recommenced the ongoing validity of the ISO certification for ISO 9001:2008, ISO 14001:2004, and OHSAS 18001:2007.
the Egyptian Electricity Regulatory Licenses also renewed tAQA’s electricity generation and distribution licenses, including defined geographical zones for tAQA Power projects.
poweR ARM
ResIdentIAl And IndustRIAl CustoMeRs
TAQA PowerTAQA Power operates in Egypt and across the Middle East and Africa, providing a certain level of excellence that has proven to be global.
1,023ELECtRICIty GEnERAtIOn AnD DIStRIButIOn vOLuMES In 2015
KW/H
4,674

A WORLD OF ENERGY Business Review
poweR ARM
TAQA Power operates in Egypt and across the Middle East and Africa, providing a consistent level of excellence.
2015 hIGhlIGhts Business Growth:
• TAQA Power grew its residential/commercial segment to reach 4,674 customers in 2015, jumping by 46 % from 3,193 in 2014.
• TAQA Power also flourished its industrial/touristic segment to reach 207 customers in 2015, jumping by 19% from 174 in 2014.
• Electricity volumes jumped by 23%, amounting 1,023 GWH in 2015 versus 833 GWH in 2014.
• Revenues rocketed by 32%, amounting 513 MEGP in 2015 versus 389 MEGP in 2014.
• Gross profit jumped by 17%, amounting 148 MEGP in 2015 versus 126 MEGP in 2014.
Business Excellence- An external auditor from tuv had
audited TAQA Power certificates in December 2015, tuv recommenced the ongoing validity of the ISO certification for ISO 9001: 2008, ISO 14001:2004, and OHSAS 18001:2007.
Egyptian Electricity Regulatory Licenses
- Annual renewal of electricity generation and distribution licenses, including defined geographical zones for tAQA Power projects.
- Obtained the interim license for the Pv project in the Feed-In tariff- Program for tAQA Arabia Solar SPv.
- Obtained the interim license for the Pv project in the Feed-In tariff- Program for tAQA Solar Reserve Solar SPv.
poweR GeneRAtIon hIGhlIGhts:• Joint Development Agreement signed
with Edison on July 2015, to develop and build a 180 MW combined cycle utilizing natural Gas. the project will be the first IPP project in Egypt completely independent, and will use the Egyptian Electricity Unified Grid for power transmissions to tAQA Power clients.
TAQA Power successfully continued providing 24/7 power supply for the following- Several touristic hotels in Marsa Alam,
Red Sea, Egypt (Hilton, Habeyeba,…etc)by light-fuel-oil-fired power plants with capacity of 8 MW.
- Scimitar Oil Production Co., Red Sea, Egypt by Natural Gas fired power plant with capacity of 6.4 MW.
- ASEC Menya 1&2, Cement factory in Menya Governorate, upper Egypt with
total capacity of 19.9 MW.
- “GCF” Greater Cairo Foundries, Manufactural (pipes) with capacity of 4.8 MW.
- the Egyptian Polystyrene Production Co “E-Styrenics”, Dekhila port, Alexandria by Natural Gas fired power plant of 11 MW.
- tAQA Power secured approvals for exporting the extra available power from E-Styrenics plant, through the Egyptian Electricity Unified Grid, and commercial exportation is expected to start during March 2016.
Feed-In tariff program
TAQA Power has engaged in the Feed-In Tariff project, and in 2015, TAQA established two prominent new companies- tAQA Arabia Solar S.A.E – 50 MW Pv in
Benban (Aswan)
- tAQA SolareReserve S.A.E – 50 MW Pv in Zaafranaa (Red Sea)
Both projects are under development now, the EPC contract has been awarded and financial closure is expected before August 2016.
Alongside these projects and under the FIT program TAQA is developing a 50 MW wind project- Kom Ombo 200 MW PV Project
- TAQA Power, prequalified consortium with the leading French developer neoen, is in the development phase of Kom Ombo project, Egyptian Electricity transmission Company “EEtC” issued the draft RFP, and submission date is expected in Q4, 2016.
poweR dIstRIButIon hIGhlIGhts:6th of October Industrial Parks Substation Project
- tAQA Power successfully completed and energized the medium voltage side of the substation.
Nabq, Sharm El-Sheikh Electricity Distribution Project
- tAQA Power signed power purchase agreement with Amer Group, for Porto Sharm Project
General:
• TAQA Power successfully continued the operation of nabq Substation (66/22Kv). With a capacity of 120 MvA, in Sharm El-Sheikh. This is the first privately owned Station providing energy via its own power facilities
• TAQA Power is smoothly operating the Futtaim- Cairo Festival City Mall, the biggest mixed used retail / commercial / residential complex in Egypt.
• TAQA Power is efficiently managing the distribution and metering system in Emaar-up town Cairo reputable project in heart of Cairo at Mokattam.
• TAQA Power supervised / endorsed internal distribution networks for Industrial Park in 6th October, Emaar-up town Cairo, Futtaim - Cairo Festival City, City Stars nabq, nakhil new Cairo Concession (Porto Cairo Mall, Marina City & Emeralds Mall).
TAQA Power successfully continued providing 24/7 power supply for
- 104 hotels and touristic residential projects in nabq touristic center, Sharm El Sheikh, Red Sea, Egypt with capacity of 100 MW, over an area of 27 Million sqm.
- 9 hotels in taba Golden Coast touristic center, taba Gulf of Aqaba, Red Sea, Egypt with capacity of 11.6 MW, over an area of 4 Million sqm.
- 94 factories in 6th of October city, Egypt new 9 Million sqm Industrial Park established by the Industrial Development Authority.
- 4,674 residential / commercial customers in new Cairo Concessions, over an area of 8 Million sqm as follows:
1. 3,605 Customer in nakhil
2. 346 Customers in Kattameya Residence
3. 186 Customers in Swan Lake
4. 9 Customers in Porto Cairo
5. 5 Customers in Cairo Festival City
6. 319 End-users in Cairo Festival City Mall
7. 12 Customers in Porto Cairo Mall
8. 26 Customers in Emeralds Mall
9. 21 Customers in Maxim
10. 52 Customers in Marina City
• Wady Degla and Smash, schools, institutes in new Cairo.
• 98 Residential Customers Emaar-Up town, Mokattam, Cairo, over an area of 4 Million sqm.
power Business historical Results
sold electricity-Million Kwhr
0
200
400
600
800
1200
1000
no. of touristic/Industrial Customers
0 0
50 1000
100 2000
150 3000
250
200
5000
4000
2014 2015 2014 2015 2014 2015
2014 2015 Growth % (15 vs.14)
Sold Electricity - Million Gwhr 833 1023 23%
no. of touristic / Industrial Customers 174 207 19%
no. of Residential / Commercial Customers 3193 4674 46%
Contracted Capacity MW 948.7 970 2%
0
900
920
940
980
960
2014 2015
Contracted Capacity Mw
no. of Residential/ Commercial Customers
22 tAQA Arabia 232015 Annual Report

A WORLD OF ENERGY
2524 TAQA Arabia 2015 Annual Report
Business Review
TAQA Oil Marketing is the first privately owned Egyptian company licensed to market petroleum products, including fuels and lubricants, through a retail network of service stations under the tAQA brand name. the company focuses on service rural areas across Egypt, where the need for such stations is more pronounced. the arm continues to invest in expanding its retail network despite ongoing challenges.
the arm continues to invest in expanding its retail network despite ongoing challenges. It has successfully inaugurated six additional stations with a total investment of EGP 21.7 million, bringing the total number of outlets to 43 stations spanning 14 governorates.
oIlMARKetInGARM
2,000
TAQA Marketing
CARS EvERy yEAR
SPAnnInG 14 GOvERnORAtES
43stAtIons
ConveRtInG AppRoxIMAtely

A WORLD OF ENERGY Business Review
oIlMARKetInGARMTAQA Oil Marketing is the first privately owned Egyptian company licensed to market petroleum products, including fuels and lubricants.
tAQA Marketing Results 2015 alone marks the seventh operating year for tAQA Oil Marketing in the Egyptian market. this year also saw increased political stability in the country, which puts the wheels of the economy in motion following a period of stagnation caused by the unrest and turmoil of the preceding few years.
Established in 2008, tAQA Oil Marketing is Egypt’s sole distributor of Castrol products, the leading global lubricant manufacturer. the products include an extensive range of automotive lubricants, manual & automatic transmission fluids and brake fluids.
Castrol products in the Egyptian market fulfill the demands of motorists across all classes and passionate bikers through an extensive range of automotive engine oils, manual and automatic transmission fluids, and brake fluids in addition to a range of commercial diesel engine oils to cover the needs of fleets, owner operators and B2B segments.
TAQA Suez Fuels Terminal- the terminal continued during 2015
to support the company’s sales and financial results following the successful 2014 performance and achievements.
- During 2015, the terminal serviced around 38 tAQA customers and 7 major oil marketing companies including COOP, nPCO (Wataneya), nile Petroleum, Libya Oil and Emarat Misr.
- Compared to 2014, during which the terminal achieved a total annual throughput of 718 M liters representing a monthly average of 60 M Liters, the year 2015 was even more successful as the terminal achieved an annual throughput of 782 M Liters representing a monthly average of 65 M Liters, which shows an increase of 9 % in the total annual throughput between 2014 and 2015.
Compressed Natural Gas
- tAQA Gas offers natural gas conversions for vehicles through its subsidiary Master Gas, which has been converting approximately 2,000 cars every year via six conversion centers nationwide.
- As the approved compressed natural gas (CnG) provider for several car manufacturers, Master Gas operates seven stations selling more than 22 million cubic meters of CnG. Converting vehicles reduces their emissions by up to 90%, improves engine life, lowers maintenance costs and reduces fuel costs by 60%, which has prompted private and government-owned companies and organizations to convert their vehicles fleets to natural gas.
2015 hIGhlIGhts• Net Profit of EGP 25.14 million with an
incremental 6.8% against budget
• EGP 1276.3 million of gross sales revenues, increasing revenues by almost 31.9 % compared by 2014 revenues “EGP 967.3 Million”
• Inaugurating six additional stations with a total investment of EGP 21.7 million
tAQA oil Marketing Results 2015
Gas oil / million liters
0
100
200
300
400
500
Gasoline / million liters lubricants / tons
0 0.0
50 1,000.00
100 2,000.00
150 3,000.00
200 4,000.00
2014 2015 2014 2015 2014 2015
unit 2014 2015 2015 vs.2014
number of Stations 30 36 20.00%
Gas Oil Million liters 433.6 463.6 6.92%
Gasoline Million liters 144.9 192.01 32.51%
Lubricants tons tons 2,190 3,463 58.13%
Refined Products Sales Growth KBD 9.97 11.2 12.34%
Refined Products SalesGrowth / KdB
26 tAQA Arabia
0
5
10
15
20
2014 2015
272015 Annual Report

2928 TAQA Arabia 2015 Annual Report
Feed-In tARIFF pRojeCts(pv & wInd)TAQA Arabia has been qualified to develop a 50Mw project and an spv was established for that purpose under the name of tAQA Arabia solar.
In September 2014, the cabinet of ministers approved in itssession #11 the issuance of the feed in tariff for electricityprojects produced from renewable energy resources (SolarPV & Wind) with a target for the first regulatory period(2015-2017) to connect 4,300MW of both Pv and Wind energy.
the electricity transmission company (EEtC) & distributioncompanies are committed to purchase the produced electricity from RE power plants at the prices announcedby the Cabinet of Ministers through Power Purchase Agreements (PPA) for 25 years for Pv projects and 20 yearsfor wind projects.
Earlier in April 2015, TAQA Arabia has been qualified to develop a 50MW project and an SPv was established for that purpose under the name of tAQA Arabia Solar. A plot of land has been allocated for the project in Benban Area (near Aswan). Later an interim License was issued and a cost sharing agreement was signed with the Egyptian Electricity and transmission company as well as with the new and Renewable energy authority for that purpose.
TAQA Arabia has been qualified in a consortium with solarReserve to develop a 50Mw project in Zaafarana.
Later in May 2015, TAQA Arabia was also qualified in aconsortium with SolarReserve; an American based international market player (based on 50% - 50% basis) to develop another 50 MW project. Another SPv was established under the name of tAQASolar Reserve, along with another plot of land allocated for a project in Zaafarana.
An interim license was also issued and a cost sharing agreement has been signed with the Egyptian Electricity and transmission company as well as with the new and Renewable energy authority.
tAQA Arabia has appointed Dnv an international consultant for the project consultancy and pre-feasibility studies, and has since then been the first company to install the metrological station required for readings of solar radiation and various aspects in Benban area, making tAQA Arabia a step ahead of other developers. Another metrological station has been installed and is already acquiring important reading and analysis in Zaafarana.
Within the Feed-in Tariff, TAQA Arabia has also been qualified todevelop a 50 MW Wind project in Gulf of Suez area.
RenewABle Boo pRojeCts
tAQA Arabia with solarReserve have been qualified for a 200 MW PV project and a 100 Mw Csp project, both in the west of the nile area under a Boo scheme.
• 200 MW BOO, West of Nile PV Project
• 100 MW BOO, West of Nile CSP project
tAQA Arabia & the French neon has been qualified among other local & international bidders to bid for the upcoming Boo projects.
• 200 MW BOO, Kom Ombo PV Project
BOO projects are in the tendering phase and expected to be signed by Q4, 2016.
RenewABle eneRGy
“TAQA Arabia is leading the waybeing the first company to install the metrological station required for readings of solar radiation both in BenBan and Zaafarana”
Renewable Energy A WORLD OF ENERGY
CoRpoRAte soCIAl ResponsIBIlIty
TAQA Arabia is exclusively committed to community endeavors as part of its corporate social responsibility program. Our work includes building power stations, offering low-cost electricity for impoverished neighborhoods, and providing jobs and on the clock training. We highly value the significance of giving back and enriching the environment and communities in which we live.
In 2012, we upheld this tradition by contributing to Habitat for Humanity Egypt through a fruitful American Chamber of Commerce fundraising event. the main goal of Habitat’s work in Egypt is to build and renovate countless homes for 10% of Egypt’s impoverished citizens by 2023. to this day, the foundation has successfully built more than 20,000 homes for over 100,000 people who would otherwise find themselves homeless.
tAQA Arabia’s helping hand doesn’t stop there. We also contributed to Dar Al Orman foundation; an organization that improves living conditions and development in villages struggling with extreme poverty issues. We also continue to provide gas to mosques and churches and residential customers at a reduced rate, and sometimes completely free of charge.
In addition, we have also funded the building and equipping of an eye clinic in Suez that provides constant medical care to the entire community as a means of boosting the public health initiative.
TAQA Arabia is also a cooperative partner with Injaz; a non-profit organization that encourages entrepreneurship in Egypt. the organization helps young people achieve their goals through their Master Class Program which assists them in gaining the necessary entrepreneurial skills to start their own businesses. Coupled with our Injaz partnership we also contributed to the work of the Salesian Don Bosco Institute which provides technical and professional training to thousand of youth to give them the skills needed to find the ideal employment situation for them and therefore develop Egypt’s capital.
Auditor’s report A WORLD OF ENERGY
30 tAQA Arabia 312015 Annual Report

CoRpoRAte GoveRnAnCe
TAQA Arabia places a strong emphasis on strong corporate governance and is constantly seeking to create resourceful, streamlined processes from the top down.
to us, our employees are one of the most essential pillars in achieving any of our goals and making sure we meet our challenges as the company strives to move forward. In 2011, the Corporate Governance Department was established in order to recognize and implement global standards and paramount practices to grow the company’s unmatched market leadership around the world.
heAlth, sAFety And the envIRonMent
Part of our investment is targeted to safeguard the health of our valuable employees and customers while minimizing the effect of thus activities on the environment. Our QHSE departments ensure the utmost compliance with health, safety and environmental standards while maintaining our view of achieving a zero percent rate of defective operations, accidents, and zero environmental hostility.
huMAn ResouRCe developMent
Human resources are our strongest and most valuable assets, and the development of these assets is an extremely vital step towards the success of our company. Despite a challenging and ever-changing investment climate on our hands, we have not laid off any employees in 2011. On the contrary, we focused on training programs in effective crisis management and related fields and continued to uphold our commitment to technical training across each of our business arms. tAQA Arabia also sponsored countless summer trips for more than 285 employees in 2011, covering an estimated 80 to 90% of their expenses in order to help them enjoy some time off with their families.
A WORLD OF ENERGY Corporate Governance
32 tAQA Arabia 332015 Annual Report

CApItAl expendItuRe And InvestMent
TAQA Arabia has acquired and incorporated 23 companies, many of which had more than 30 years of market experience.
tAQA GAs Despite difficult operating conditions, the gas arm alone was able to increase the number of residential connections to reach 83,000 with an increase of 10,000 residents compared to the previous year. this brings the total number of customers being provided top quality operation and maintenance services up to 727,000. tAQA Gas’ target is to reach 1,000,000 resident connections by the year 2018, proving it’s powerful presence in the Egyptian market.
tAQA epCtAQA EPC acts as a feeding industry to the remaining arms and is responsible for designing and building pipeline connections as well as connecting customers and clients to the national grid. Currently the EPC arm is negotiating several transactions in various industries to provide exclusive EPC services for the utilities connections and infrastructure.
tAQA poweRWith the attempt of the Egyptian government to support the electricity generation market to cover the market gaps, it is currently executing a 14.4 GW of fossil power generation based on combined cycle configuration on fast track basis over two phases: phase 1 for up to 4.4 GW in an open cycle configuration by the end of 2016; and phase 2 for up to 14.4 GW in a combined
cycle configuration by mid-2018, which will enhance the electricity power generation of the country.
under the Fit Program, tAQA Arabia is currently developing a 2 x 50 MW solar project, and was able to secure to plots; one in BenBan fully owned by tAQA and the other in Zaafara with a uS partner. the construction of the project is expected to be in Q3 2016 and the commercial operation date is set to be in Q2 2017.
TAQA was able to mandate the IFC and OPIC for debt financing of both projects.
tAQA MARKetInGtAQA Marketing currently operates in full within the Suez terminal, with a capacity reaching up to 14 million liters and a maximum annual throughout equaling 2,100 million liters.
Over the course of 2015, tAQA Marketing brought on stream five new service stations, bringing its total up to 42 stations across 14 different governorates.
tAQA Marketing is planning to fully invest in an additional terminal in Alexandria to hedge its risk against supply shocks.
During 2015, the government took important steps to address and overcome Egypt’s energy challenges. Several new exploration agreements were announced in addition to an agreement to import liquefied natural gas to meet the growing demand of the Egyptian electricity market. the government also signed contracts to connect 2.4 million households to natural gas over the coming three years. Later in 2015, a huge gas discovery was made in the east Mediterranean in the Zohr field explored by the Italian EnI. this discovery estimated at 30 trillion cubic feet that would reshape the energy outlook of the whole region while transforming Egypt from an energy importer to an important gas exporter.
As for local oil consumption, a plan for full oil price liberalization over the coming five years has already been set and is gradually being implemented. the electricity sector has also witnessed important changes, including a prime ministerial decree that set the prices up to 2019 and the launch of the Feed- In-tariff Program aiming to add 4.3 GW of solar and wind capacity by the private sector.
With a clearer vision in place, the energy sector is set to attract further private investments in the coming years. Despite any challenges present in Egypt, tAQA Arabia has continuously managed to maintain a steadfast commitment to pursuing investments, thereby guaranteeing predictable returns to its shareholders.
While the company is seeking lucrative small and medium opportunities in the market, we are also undertaking various mega-projects. The past years, TAQA Power was pre-qualified to develop 150 MW of solar and wind projects under the Feed-In-tariff Program, as well as the 200 MW Kom Ombo BOO solar. Another pre-qualification has also been appointed to develop a 200MW Pv project in the west of nile area and a 100MW CSP project also under the BOO scheme.
tAQA Gas
tAQA Gas signed an agreement with Egas to connect 308,000 new domestic clients in the upcoming years
tAQA epC
Major expansions in industrial projects’ investments, with projected revenues of eGp 70 million
tAQA power
tAQA Power secured ERA’s Board of Directors’ decision to build its 220/22Kv substation
tAQA Marketing
Inaugurating four additional stations with a total investment of eGp 8.9 million
34 tAQA Arabia
Capital Expenditure and Investment A WORLD OF ENERGY
352015 Annual Report
Egypt

A WORLD OF ENERGY
3736 TAQA Arabia 2015 Annual Report
Executive Management team
hesham wagdyTAQA Power
Mohamed nafeaTAQA Oil Marketing
peter MofeedChief Financial Officer
Pakinam KafafiChief Executive Officer
Khaled Abu Bakr
Executive Chairman
Pakinam Kafafi built her career at
EFG-Hermes, where she rose to the
position of vice President of EFG-
Hermes Investment Banking, and became
a member of EFG-Hermes Group. In
2003, she held the position of Strategy
and Investment General Manager at
Gas & Energy Group (Genco). In 2006,
Kafafi joined TAQA Arabia at the capacity
of Investment Director to be soon
promoted as the CEO, bringing to the
company over 22 years of experience in
the investment field. As the CEO, Kafafi
oversees the strategic direction of the
company and leads the operations.
Ms. Kafafi is an active and highly-
respected member of the local business
community and was the Co-Chair of the
“Women in Business Committee” at the
American Chamber of Commerce.
Eng. Abu Bakr, is a veteran entrepreneur
of the energy industry, played a key
role in the development of the gas
and power private sector in Egypt and
the region. Over the past 30 years he
was instrumental in helping grow the
sustainable role of the public and private
sector in the Egyptian gas and energy
sector. Eng. Abu Bakr, is the Co-founder
of tAQA Arabia. Eng. Abu Bakr is the
regional coordinator for Middle East
and Africa in the international gas
union, and chairman of the Egyptaian
gas association, as well as being a
board member of several business
organizations in the field of industry’s
power, gas, and oil.
Privileged to build his professional
career with the strongest players
in the FMCG and Power Systems
fields, Hesham Abdel Dayem is
an influential leader, possessing a
wealth of diversified experience
from the top multinational, domestic
and semi-governmental sectors.
Before joining tAQA Arabia, Eng.
Abdel Dayem was the Executive
Director and Board Member of
Industrial Modernization Centre
(IMC), in addition to being a
board member in a number of
institutions and key committees
related to the ministry of trade and
Industry. As a believer in human
capital, Abdel Dayem transforms
organizations through utilizing
modern management practices to
create positive and results oriented
working environments.
throughout his 21 years of
professional practice in oil
marketing, Mohamed nafea held
various positions in Mobil Oil Egypt,
Mobil Oil Morocco, and Exxon
Mobil Egypt. Relying on a broad
experience, nafea was appointed
as President and Fuels Marketing
Manager of Mobil Oil Morocco
and Retail Marketing Manager of
Exxon Mobil Egypt, where he led
the marketing and sales of fuels,
convenience products and other
back court offers through a retail
chain of 409 outlets.
Peter Mofeed benefits from a vast
experience in the finance and
investments, he held a multitude of
positions in prestigious organizations,
such as the Commercial International
Bank (CIB) where he moved between
the corporate and investment banking
departments and finally was assigned the
role of vice President of CI Investment
Banking, an advisory firm established
by CIB. He also headed the finance
department in Ezz Steel. Mofeed joined
tAQA Arabia in 2010 as the Chief
Financial Officer, his focus is to evaluate
new projects and arrange the necessary
financing for the Group’s subsidiaries.
exeCutIve MAnAGeMent teAM
Arms Managing directors
tarek el hawaryTAQA Gas
With a strong technical
background dating back to
1985, tarek El Hawary started
his career as a Site Engineer at
Egypt Gas Co., he then moved to
House Gas as a Project Manager,
where he worked on network
construction and customer
conversions. In 2005, El Hawary
joined City Gas, a subsidiary of
tAQA Arabia, as a Deputy MD
and then Managing Director for
technical Affairs. In this capacity,
he supervised the work crew,
resolved technical difficulties
and made sure that quality and
productivity were kept up to par.
Amr Abu BakrTAQA EPC
With over twenty years of
impressive success in the natural
gas sector, running operational
functions and leading large-scale
projects, from inception to
successful completion, Amr Abu
Bakr escalated through various
positions in a number of reputable
companies such as Misr Hotels,
Egypta Gas Co., EuGESCO and
nile valley, until being appointed as
the technical Managing Director
of tAQA EPC in 2013. Abu
Bakr utilizes strong successful
managerial experience in corporate
operations, establishes quality,
safety and financial operational
standards to produce positive
impact on overall performance of
the organization.

A WORLD OF ENERGY
392015 Annual Report
Financial Highlights
Due to the lack of natural gas, TAQA Gas volume decreased by 20% versus 2013, recording a total of 3.7 billion cubic meters, however, the number of customers increased by 13% in 2014. In terms of revenues, TAQA Gas recorded a 5% growth year over year achieving EGP 439 million and contributed again with the highest profits, generating EGP 85 million, 66% from the consolidated profits.
In 2014, TAQA EPC’s focus was on expanding the engineering and designing capabilities in response to the growing scope of projects. Sales revenues dropped by 42% versus 2013, reaching EGP 110,983, while customers’ base decreased by 8% to be 54,974 residential and industrial customers.
2014 witnessed a boost on many levels for TAQA Power, from volume and clients’ base to revenues and profits generation. The number of clients escalated by 41% to be 3,193 residential and 174 industrial customers, volumes grew by 21% amounting to 590 GW/H, revenues increased by 45% realizing EGP 389 million and profits augmented by 23% attaining EGP 31 million, 24% from the consolidated profits.
Generating more than 50% from the total consolidated revenues, TAQA Oil Marketing realized EGP 967 million, 79% growth year over year and 20% above budget. The Profits amounted to EGP 13.5 million, 10% from the consolidated profits and 69% above budget.
FinancialHigHligHts
Financial Review
TAQA Arabia consolidated statement recorded a solid 17% profits growth year over year, realizing EGP 105.5 million of net profits in 2014. Minority Interests also have recorded an increase of 44%. TAQA Arabia’s consolidated revenues increased by 46% versus 2013, registering EGP 1.495 billion, whereas sales costs augmented by 54% versus previous year, realizing EGP 301 million gross profit in 2014. The number of converted clients amplified with a difference of over 20,000 new clients, reaching a total of 73,222 converted clients in 2014.
gas
Oil Marketing
Power
E.P.c
TAQA Arabia consolidated statement recorded a solid 17% profits growth year over year
2015 Annual Report 3938 TAQA Arabia

A WORLD OF ENERGY
40 TAQA Arabia 412015 Annual Report
Financial Highlights
in Million EgPlocal gas Regional
gas
total taqa Others
taqa cons.
EC LDC Total Gas Power Marketing
Sales 134.3 337.6 471.9 39.8 511.7 513.3 1,276.3 2,299.9
Cost of sales (110.5) (207.5) (318.0) (32.7) (350.7) (365.4) (1,231.5) (6.9) (1,953.1)
Gross profit 23.8 130.0 153.8 7.2 161.0 147.9 44.8 (6.9) 346.8
Administrative Expenses (11.4) (30.3) (41.7) (5.0) (46.7) (26.7) (3.4) (17.0) (93.8)
Provisions 0.0 0.0 (9.5) (9.5) (3.3) 0.0 (12.8)
Non recurring items 1.4 0.3 1.6 0.9 2.5 (1.8) (0.8) (0.1)
EBitDa 13.8 100.0 113.8 (6.5) 107.3 116.2 41.3 (24.7) 240.2
Non Operating items 0.1 (11.6) (11.6) (17.0) (28.6) (0.1) (0.5) (1.4) (30.5)
Depreciation and Amortization (1.7) (5.7) (7.3) (0.4) (7.7) (23.5) (8.5) (0.7) (40.5)
EBit 12.2 82.6 94.9 (23.9) 71.0 92.7 32.3 (26.7) 169.2
Interest Income / (Expense) 0.4 38.7 39.1 (0.1) 39.0 (5.0) 0.2 27.9 62.0
Profit Before Tax 12.6 121.4 133.9 (24.0) 109.9 87.6 32.5 1.1 231.2
Deferred and income tax expense (2.9) (31.3) (34.2) (34.2) (18.7) (7.3) (4.9) (65.1)
Profit From Continuing Operation
9.7 90.1 99.7 (24.0) 75.8 68.9 25.1 (3.7) 166.1
Minority Interest (0.8) (0.8) (1.2) (2.0) (4.1) 0.0 (6.1)
Profit for the period 9.7 89.3 98.9 (25.2) 73.8 64.8 25.1 (3.7) 160.0
incOME statEMEnt REPORtingtaQa cOnsOliDatED
act.2014 act.2013 vs 2013 % of Growth
Local Gas Volume BCM 3.1 3.9 (0.8) -20%
Converted Customers 82,455 73,020 9,435 13%
Local Volume KW - Hr 730.9 589.9 140.9 24%
Sales 2,299.9 1,796.1 503.8 28%
Cost of sales (1,953.1) (1,494.8) (458.3) 31%
Gross profit 346.8 301.3 45.5 15%
Gross Profit/Sales 15% 17% -2% -10%
Administrative Expenses (93.8) (96.1) 2.3 -2%
Provisions (12.8) (21.7) 9.0 -41%
Non recurring items (0.1) (7.9) 7.8 -99%
EBitDa 240.2 175.5 64.6 37%
Non Operating items (30.5) (4.2) (26.2) N/A
Depreciation and Amortization (40.5) (35.5) (5.0) 14%
EBit 169.2 135.8 33.4 25%
Interest Income / (Expense) 62.0 34.0 28.0 82%
Profit Before Tax 231.2 169.8 61.4 36%
Deferred and income tax expense (65.1) (62.2) (2.9) 5%
Profit From Continuing Operation 166.1 107.6 58.5 54%
Minority Interest (6.1) (2.1) (4.0) 186%
Profit for the period 160.0 105.5 54.6 52%
Net Profit / Sales 7% 6% 1% 19%
incOME statEMEnt REPORtingtaQa cOnsOliDatED

A WORLD OF ENERGY
42 TAQA Arabia 432015 Annual Report
Financial Highlights
Revenue % Gross profit %
LDC 337.6 15% 130.0 37%
EC 134.3 6% 23.8 7%
Power 513.3 22% 147.9 42%
Regional 39.8 2% 7.2 2%
Oil 1,276.3 55% 44.8 13%
Gross profit 2,301.3 353.6
REvEnuE & gROss PROFit
gROss PROFit 1,796.1 M gP EgP 306.3 M
LCD LCDEC ECPower PowerRegional RegionalOil Oil
55%
15%
6%
22%
2%
42%
2%
12%
37%
7%
2013 2014 2015
Revenue 1,227.6 1,796.1 2,299.9
% Growth 46% 28%
Gross Profit 255.7 301.3 346.8
% Growth 18% 15%
EBITDA 139.6 175.5 240.2
% Growth 26% 37%
niat 90.2 105.5 160.0
% Growth 17% 52%
Financial REsults
2013 2014
2013 2014 2013 2014
2013 2014
REvEnuE
EBitDa niat
gROss PROFit
400.0
0.0 0.0
200.0
800.0
50.050.0
1200.0
100.0
100.0
250.0
1600.0
150.0
150.0
300.02,000.0
200.0
200.0
350.0
2,400.0
250.0
2,800.0
3,200.0
1,227.6
139.690.2
255.7
1,796.1
2,999.9
175.5
105.5
240.2160.0
301.3
346.8
3,600.0
300.0
400.0
2015
2015 2015
2015

Auditor’s report A WORLD OF ENERGY
44 TAQA Arabia 452015 Annual Report
Auditor’s report
Consolidated statement of financial position
Consolidated statement of income
Consolidated statement of changes in equity
Consolidated statement of cash flows
Notes to the consolidated financial statements
1
2
3
4
5-22
taQa arabia company (an Egyptian Joint stock company)
Consolidated financial statements for the financial year ended 31 December 2015
and auditor’s report

Auditor’s report A WORLD OF ENERGY
1 TAQA Arabia 22015 Annual Report
In Egyptian Pound note no. 31/12/2015 31/12/2014
Non-current assets
Property, plant and equipment (5) 502 247 786 464 277 975
Projects under construction (6) 9 585 737 31 376 355
Intangible assets (7) 12 969 131 9 226 979
Goodwill (8) 393 100 684 393 100 684
Trade receivables and other debit balances (10) 34 319 306 30 035 450
Other investments (11) 2 316 541 2 316 541
Deferred tax assets (23) 546 711 26 903
Total non-current assets 955 085 896 930 360 887
Current assets
Inventories (9) 121 059 979 93 219 164
Trade receivables and other debit balances (10) 486 331 545 412 603 296
Due from related parties (12) 46 214 173 31 539 433
Loan - notes receivables (13) 321 684 205 213 680 773
Cash and cash equivalents (14) 719 235 890 600 538 288
Assets held for sale (19) - 5 053 364
Total current assets 1 694 525 792 1 356 634 318
Current liabilities
Bank facilities (15) 41 975 020 89 946 418
Loans and borrowings (16) 61 888 971 36 659 664
Trade payables & other credit balances (17) 844 494 570 755 576 508
Due to related parties (12) 8 960 725 -
Provisions (18) 64 422 117 26 531 824
Total current liabilities 1 021 741 403 908 714 414
Working capital 672 784 389 447 919 904
total investments 1 627 870 285 1 378 280 791
These investments are financed as follows:
Equity
Share capital (20) 676 176 900 676 176 900
Share premium 6 501 700 6 501 700
Reserves (21) 58 212 646 52 658 354
Retained earnings 474 410 251 373 851 518
Interim dividends (27 991 685) -
Equity attributable to owners of the company 1 187 309 812 1 109 188 472
Minority interest 37 012 129 31 920 938
Total equity 1 224 321 941 1 141 109 410
Non-current liabilities
Loans and borrowings (16) 220 588 035 66 274 004
Long term liabilities (22) 132 857 442 120 457 453
Deferred tax liabilities (23) 50 102 867 50 439 924
Total non-current liabilities 403 548 344 237 171 381
Total equity and non-current liabilities 1 627 870 285 1 378 280 791
TAQA Arabia Company (An Egyptian Joint Stock Company)
1. cOnsOliDatED statEMEnt OF Financial POsitiOn As Of 31 December 2015
Report on the consolidated financial statements
We have audited the accompanying consolidated financial statements of Taqa Arabia Company S.A.E, which comprise the consolidated statement of financial position as of 31 December 2015, and the consolidated statements of income, change in equity and cash flows for the financial year then ended, and a summary of significant accounting policies and other explanatory notes.
Management’s responsibility for the consolidated financial statements
These consolidated financial statements are the responsibility of the Company’s management. The management is responsible for the preparation and fair presentation of these consolidated financial statements in accordance with the Egyptian Accounting Standards and in the light of the prevailing Egyptian laws, management responsibility includes, designing, implementing and maintaining internal control relevant to the preparation and fair presentation of consolidated financial statements that are free from material misstatement, whether due to fraud or error; management responsibility also includes selecting and applying appropriate accounting policies; and making accounting estimates that are reasonable in the circumstances.
Auditor’s responsibility
Our responsibility is to express an opinion on these consolidated financial statements based on our audit. We conducted our audit in accordance with the Egyptian Standards on Auditing and in the light of the prevailing Egyptian laws. Those standards require that we comply with ethical requirements and plan and perform the audit to obtain reasonable assurance whether the consolidated financial statements are free from material misstatement.
An audit involves performing procedures to obtain audit evidence about the amounts and disclosures in the consolidated financial statements. The procedures selected depend on the auditor’s judgment, including the assessment of the risks of material misstatement of the financial statements, whether due to fraud or error. In making those risk assessments, the auditor considers internal control relevant to the entity’s preparation and fair presentation of the consolidated financial statements in order to design audit procedures that are appropriate in the circumstances, but not for the purpose of expressing an opinion on the effectiveness of the entity’s internal control. An audit also includes evaluating the appropriateness of accounting policies used and the reasonableness of accounting estimates made by management, as well as evaluating the overall presentation of the financial statements.
We believe that the audit evidence we have obtained is sufficient and appropriate to provide a basis for our audit opinion on the consolidated financial statements.
Opinion
In our opinion, the consolidated financial statements referred to above present fairly, in all material respects, the consolidated financial position of Taqa Arabia Company as of 31 December 2015 and its consolidated financial performance and its consolidated cash flows for the year then ended in accordance with the Egyptian Accounting Standards and the Egyptian laws and regulations relating to the preparation of these consolidated financial statements.
KPMG Hazem HassanCairo, 1 February 2015
To: The Shareholders of Taqa Arabia Company (An Egyptian Joint Stock Company)
* The notes on pages (5) to (22) are an integral part of these consolidated financial statements. ** Auditor’s report “attached”.
Mr. Ahmed El-Rouby Deputy Chief
Financial Officer
Mr. Peter MofeedChief Financial Officer
Mrs. Pakinam Kafafi Managing Director
AUDITOR’S REPORT

Auditor’s report A WORLD OF ENERGY
3 TAQA Arabia 42015 Annual Report
In Egyptian Pound note no. 2015 2014
Revenue (24) 2 299 875 898 1 796 070 296
Cost of revenue (25) (1 989 774 455) (1 525 599 128)
Gross profit 310 101 443 270 471 168
Other income 4 133 596 5 379 016
Administrative expenses (26) (89 055 293) (89 551 380)
Other expenses (27) (62 743 556) (54 685 585)
Finance income (28) 93 691 161 59 131 735
Finance costs (29) (31 710 080) (25 168 459)
Net foreign exchange 6 796 731 4 207 646
Profit before tax 231 214 002 169 784 141
Tax expense (30) (65 952 132) (55 880 752)
Deferred tax 856 864 (6 313 548)
Profit for the year 166 118 734 107 589 841
Profit attributable to:
Owners of the Company 160 047 548 105 468 754
Minority interest 6 071 186 2 121 087
Profit for the year 166 118 734 107 589 841
TAQA Arabia Company (An Egyptian Joint Stock Company)
2. cOnsOliDatED statEMEnt OF incOME FOR tHE Financial YEaR EnDED 31 DEcEMBER 2015
* The notes on pages (5) to (22) are an integral part of these consolidated financial statements.

Auditor’s report A WORLD OF ENERGY
5 TAQA Arabia 62015 Annual Report
1. COMPANy’S BACkGROUND
• TAQA Arabia Company S.A.E “the Company” established under the provisions of Law No. 159 of 1981 and its executive regulations.
• The registered office of the company is 2 Kasr El Dobara Sq., Garden City, Cairo, Egypt.
• These consolidated financial statements comprise the Company and its subsidiaries (together referred to as the “Group”).
• The group is primarily involved in:
• Construct, manage, operate and maintain natural gas transmission and distribution lines.
• Construct, manage, operate and maintain power plants, electricity transformers and distribution networks.
• Construct, manage, operate and maintain water desalination stations, refineries, water purification, distribution networks, transmission lines, as well as pumping stations, processing and purification, sewage and industrial drainage grid.
• Distribute electricity, natural gas and water to the company or to third parties, subject to the provision of laws, regulations and decrees applicable licensing condition for the exercise of such activities.
• The ultimate parent company for the group is Qalaa Holding Company.
2. list OF suBsiDiaRiEs
Set out below is a list of subsidiaries under direct control of the company:
TAQA Arabia Company (An Egyptian Joint Stock Company)
5. nOtEs tO tHE cOnsOliDatED Financial statEMEnts FOR tHE Financial YEaR EnDED 31 DEcEMBER 2015
company name Country Ownership interest
2015 2014
Gas and Energy Company (Taqa Gas) - SAE Egypt 100 % 100 %
Taqa for Electricity, Water and Cooling - SAE Egypt 100 % 100 %
Taqa for Marketing Petroleum Products - SAE Egypt 100 % 100 %
Gas and Energy Group Limited – LLC B.V.I 100 % 100 %
Genco for Mechanical and Electricity Work- LLC Qatar 100 % 100 %
Qatar Gas Group Limited - LLC Qatar 45 % * 45 % *
Arab Company for Gas Services – LLC Libya 49 % * 49 % *
Arabian Libyan Company for Energy – LLC Libya 65 % 65 %
Taqa Arabia Solar - SAE Egypt 100 % -
Taqa Solar Reserve - SAE Egypt 75 % -
* TAQA Arabia Company has an effective control over these companies in accordance with the agreement with other shareholders
In Egyptian Pound note no. 2015 2014
Profit for the year 166 118 734 107 589 841
Adjustments for:
Depreciation 39 676 918 27 024 994
Amortization 751 848 676 430
Provision formed 40 196 006 17 030 166
Loan – notes receivables revenues (40 424 205) -
Reversal of impairment in property, plant and equipment - (2 242 363)
206 319 301 150 079 068
Changes in:
Inventories (27 840 815) (7 428 654)
Trade and other receivables (78 012 105) 38 750 239
Related parties (19 674 740) 94 490 669
Provision used and reclassification (2 305 713) ( 669 572)
Trade and other payables 92 093 619 (4 940 411)
Board of directors and employees profit share (12 797 131) (25 838 040)
Net cash from operating activities 157 782 416 244 443 299
Cash flows from investing activities
Payments for purchase of property ,plant and equipment and projects under construction
(52 083 382) (38 682 089)
Payments for intangible assets (4 494 000) -
Loan - notes receivables (62 579 227) (213 680 773)
Disposals of property, plant and equipment 1 362 880 677 382
Net cash used in investing activities (117 793 729) (251 685 480)
Cash flows from financing activities
Loans and borrowing 179 543 338 (46 965 834)
Change in bank facilities (47 971 398) 8 285 413
Dividends (55 367 804) (89 321 040)
Minority share in capital increase in subsidiary - 12 000 000
Net cash provided by / (used in) financing activities (76 204 136) (116 001 461)
Changes in cumulative translation difference 2 504 779 (3 515 415)
Cash and cash equivalents at the beginning of the year 600 538 288 727 297 345
Net changes in cash and cash equivalents 116 192 823 (123 243 642)
Cash and cash equivalents (14) 719 235 890 600 538 288
TAQA Arabia Company (An Egyptian Joint Stock Company)
4. cOnsOliDatED statEMEnt OF casH FlOWs FOR tHE Financial YEaR EnDED 31 DEcEMBER 2015
* The notes on pages (5) to (22) are an integral part of these consolidated financial statements.
Auditor’s report A WORLD OF ENERGY
7 TAQA Arabia 82015 Annual Report
4. signiFicant accOunting POliciEs
The accounting policies set out below have been applied consistently to all periods presented in these financial statements.
4.1 Basis of consolidation
Subsidiaries
Subsidiaries are entities controlled by the group. Control exists when the group has the power, directly or indirectly, to govern the financial and operating policies of an entity so as to obtain benefits from its activities. In assessing control, the group takes into consideration potential voting rights that currently are exercisable. The financial statements of subsidiaries are included in the consolidated Financial Statements from the date that control commences until the date that control ceases.
Minority interest
Minority interests, in the equity and results of the subsidiaries is shown as a separate item in equity in the consolidated financial statements and calculated as the minority proportion of the carrying amounts of the assets, liabilities and equity of the subsidiaries.
Changes in a parent’s ownership interest in a subsidiary that do not result in a loss of control are accounted for within equity.
Loss of control
Upon the loss of control, the group derecognizes the assets and liabilities of the subsidiary, any minority interests and the other components of equity related to the subsidiary. Any surplus or deficit arising on the loss of control is recognized in profit or loss.
transaction eliminated on consolidation
Intra-group balances and transactions, and any unrealized income and expenses arising from intra-group transactions, are eliminated in preparing the consolidated financial statements. Unrealized gains arising from transactions with equity-accounted investees are eliminated against the investment to the extent of the group’s interest in the investee. Unrealized losses are eliminated in the same way as unrealized gains, but only to the extent that there is no evidence of impairment.
3. Basis OF PREPaRatiOn
i) statement of compliance
These consolidated financial statements have been prepared in accordance with Egyptian Accounting Standards (“EAS”) and relevant Egyptian laws and regulations.
ii) Basis of measurement
The consolidated financial statements have been prepared on historical cost basis except for certain financial instruments, which are measured at fair value.
iii) Functional and presentation currency
The consolidated financial statements are presented in Egyptian Pound referred to as “Egyptian Pound” or “EGP”, which is the group’s functional currency.
iv) Use of estimates and judgments
The preparation of the consolidated financial statements in conformity with Egyptian Accounting Standards requires management to make judgments, estimates and assumptions that affect the application of accounting policies and the reported amounts of assets and liabilities, income and expenses. Actual results may differ from these estimates.
Estimates and underlying assumptions are reviewed on an ongoing basis. Revisions to accounting estimates are recognized in the period in which the estimate is revised and in any future periods affected.

Auditor’s report A WORLD OF ENERGY
9 TAQA Arabia 102015 Annual Report
4.7 trade payables & other credit balances
Trade payables and other credit balances are stated at cost.
4.8 loans and borrowings
• Interested – bearing borrowings are recognized initially at fair value less attributable costs.
• Subsequent to initial recognition, interest – bearing borrowings are stated at amortized cost with any difference between cost and redemption value being recognized in the consolidated income statement over the period of the borrowings on the effective interest basis.
4.9 Property, plant and equipment
i) Recognition and measurement
Items of property, plant and equipment are measured at cost less accumulated depreciation and accumulated impairment losses.
Any gain or loss on disposal of an item of property, plant and equipment is recognized in profit or loss.
ii) Subsequent costs
The cost of replacing a component of an item of property, plant and equipment is recognized in the carrying amount of the item if it is probable that the future economic benefits embodied within the component will flow to the group, and its cost can be measured reliably. The carrying amount of the replaced component is derecognized. The costs of the day-to-day servicing of property, plant and equipment are recognized in income statement as incurred.
iii) Depreciation
Depreciation is based on the cost of an asset less its residual value. Depreciation is recognized in income statement on a straight-line basis over the estimated useful lives of each component of an item of property, plant and equipment. Land is not depreciated. The estimated useful lives as follows:
asset Estimated useful lives in years
Buildings 20 -50
Buildings on lands leased from others Contract period
Machinery & equipment 3 -5
Motor vehicles 3 -5
Furniture, office equipment & software 4 -10
Pipelines & stations equipment 15
Generators 20
Networks 25
Leasehold improvements 3-5
4.2 Foreign currency
i. Foreign currency translation
Transactions in foreign currencies are translated into the respective functional currencies of the Group entities at the exchange rates at the date of the transaction. Monetary assets and liabilities denominated in foreign currencies are retranslated at the reporting date to the functional currencies at the exchange rate at that date. Non-monetary items that are measured in terms of historical cost in foreign currency are translated using the exchange rate at that date of the transaction. Foreign currency differences arising on retranslation are recognized in income statement.
ii. Foreign operations
The financial statements of the Group entities are translated into the presentation currency as follows:
• The assets and liabilities of foreign operations, including goodwill and fair value adjustments arising on acquisition, are translated to Egyptian Pound at exchange rates at the reporting date.
• The income and expenses of foreign operations are translated to Egyptian Pound at average rates for the period.
Foreign currency differences are recognized in equity, and presented in the foreign currency translation reserve (translation reserve) in equity. However, if the foreign operation is non-wholly owned subsidiary, then the relevant portion of the translation difference is allocated to minority interests.
4.3 Financial assets at fair value through profit or loss
A financial asset is classified at fair value through profit or loss if it is classified as held for trading or is designated as such on initial recognition. Financial assets at fair value through profit or loss are measured at fair value, and changes therein are recognized in income statement.
4.4 Cash and cash equivalents
Cash and cash equivalents comprise cash at banks & cash on hand, call deposits, highly liquid investments that are readily convertible to known amounts of cash and which are subject to an insignificant risk of changes in value and bank overdrafts that are repayable on demand.
4.5 Available-for-sale financial assets
These assets are initially measured at fair value plus any directly attributable transaction costs .Subsequent to initial recognition, they are measured at fair value and changes therein, other than impairment losses and foreign currency differences on debt instruments, are recognized directly in equity and presented in the fair value reserve in equity. When an investment is derecognized, the gain or loss accumulated in equity is reclassified to income statement .If the fair value cannot be measured reliable should be subsequently measured at its cost, in this case the financial assets subject to impairment testing.
4.6 trade receivables and other debit balances
Debtors are recorded at their nominal value net of any irrecoverable amounts. An estimate of doubtful debts is made when collections of the full amount is no longer probable. Bad debts are written off when identified. Other debit balances are stated at cost less impairment losses.
Auditor’s report A WORLD OF ENERGY
11 TAQA Arabia 122015 Annual Report
4.12 impairment
a) Financial assets
A financial asset is considered to be impaired if objective evidence indicates that one or more events have had a negative effect on the estimated future cash flows of that asset.
An impairment loss in respect of a financial asset calculated as the difference between its carrying amount, and the present value of the estimated future cash flows discounted at the original effective interest rate. An impairment loss in respect of an available-for-sale financial asset is calculated by reference to its current fair value.
Individually significant financial assets are tested for impairment on an individual basis. The remaining financial assets are assessed collectively in groups that share similar credit risk characteristics.
All impairment losses are recognized in income statement. Any cumulative loss in respect of an available-for-sale financial asset recognized previously in equity is transferred to income statement.
An impairment loss is reversed if the reversal can be related objectively to an event occurring after the impairment loss was recognized. For financial assets measured at amortized cost and financial assets that are debt securities, the reversal is recognized in income statement. For available-for-sale financial assets that are equity securities, the reversal is recognized directly in equity.
b) Non-financial assets
The carrying amounts of the group’s non-financial assets, other than inventories and deferred tax assets, are reviewed at each reporting date to determine whether there is any indication of impairment.
An impairment loss is recognized if the carrying amount of an asset or its cash-generating unit exceeds its recoverable amount. A cash-generating unit is the smallest identifiable asset group that generates cash flows that are largely independent from other assets and groups. Impairment losses are recognized in the income statement.
The recoverable amount of an asset or cash-generating unit is the greater of its value in use and its fair value less costs to sell.
Impairment losses recognized in prior periods are assessed at each reporting date for any indications that the loss has decreased or no longer exists. An impairment loss is reversed only to the extent that the asset’s carrying amount does not exceed the carrying amount that would have been determined, net of depreciation or amortization, if no impairment loss had been recognized.
4.13 Provisions
A provision is recognized if, as a result of a past event, the group has a present legal or constructive obligation, and it is probable that an outflow of economic benefits will be required to settle the obligation. Provisions are determined by discounting the expected future cash flows at a pre-tax rate that reflects current market assessment of the time value of money and the risks specific to the liability. The unwinding of the discount is recognized as finance cost.
4.10 intangible assets and goodwill
a) goodwill
Goodwill arising on the acquisition of subsidiaries is measured at cost less accumulated impairment losses.
b) Other intangible assets
Other intangible assets that are acquired by the Group and have finite useful lives are measured at cost less accumulated amortization and accumulated impairment losses.
Subsequent expenditure
Subsequent expenditure is capitalized when it increases the future economic benefits embodied in the specific asset to which it relates. All other expenditure, including expenditure on internally generated goodwill and brands, is recognized in profit or loss as incurred.
Amortization
Amortization is recognized in profit or loss using the straight-line method over the estimated useful lives of intangible assets. Goodwill is not amortized.
4.11 inventories
Inventories are measured at the lower of cost and net realizable value. The cost of inventories is based on the moving average principle. In the case of manufactured inventories and work in progress, cost includes an appropriate share of overheads based on the normal operating capacity.

Auditor’s report A WORLD OF ENERGY
13 TAQA Arabia 142015 Annual Report
4.16 Income tax
Income tax expense comprises current and deferred tax. Income tax is recognized in the income statement except to the extent that it relates to items recognized directly in equity.
Current tax is the expected tax payable on the taxable income for the year, using tax rates enacted at the balance sheet date, and any adjustment to tax payable in respect of previous years.
Deferred tax is recognized for temporary differences between the carrying amounts of assets and liabilities for financial reporting purposes and the amounts used for taxation purposes. The amount of deferred tax provided is measured using tax rates enacted or substantively enacted at the balance sheet date.
A deferred tax asset is recognized only to the extent that it is probable that future taxable profits will be available against which the asset can be utilized. Deferred tax assets are reduced to the extent that it is no longer probable that the related tax benefit will be realized.
4.17 New Issues and Amendments issued to the Egyptian Accounting Standards (EAS) but not adopted yet
During the year 2015, a modified version of the Egyptian Accounting Standards (EAS) was issued including some of the new accounting standards and the amendments to some existing standards provided that they shall come into force for the financial periods that start after January 1, 2016, while taking into consideration that the early implementation of these standards is not permissible.
In the following table, we shall review the most prominent amendments on the Egyptian Accounting Standards (EAS) that may have a significant impact on the financial statements of the company at the beginning of the implementation thereof:
new or amended standards
Summary of the Most Significant Amendments
Possible impact on the Financial statements
Eas (1) Presentation of Financial Statements
Financial Position statement• The Standard does not require presenting the working capital
presentation. The reference financial statements that was included in 2006 Standards was excluded; which presented the working capital presentation.
• A statement shall be added to the statement of financial position including balances of the beginning of the first presented comparative period in case of retrospective implementation or change in an accounting policy or reclassification carried out by the entity. Income Statement (Profit or Loss)/Statement of Comprehensive Income The entity shall disclose all recognized income and expense captions during the financial period in two separate statements; one of them presents the profit or loss components (Income Statement) and the other one starts with the profit or loss and presents the other comprehensive income items (Statement of Comprehensive Income).
• Re-presenting all the presented financial statements, disclosures and their accompanying notes including the comparative figures to be in conformity with the required amendments to the Standard.
• Adding a new statement, Statement of Comprehensive Income, for the current and comparative period.
Eas (10) Property, Plant and Equipment (PPE)
• The financial shall disclose a reconciliation of the carrying amount – movement of the PPE and its depreciations- in the notes accompanying the financial statements at the beginning and the end of the current period and the comparable period.
Re-presenting the comparative figures related to the PPE in the notes accompanying the financial statements to be in conformity with the required amendments on the standard.
Egyptian standard no. (45)Fair Value Measurement
The new Egyptian Accounting Standard No. (45) “Fair Value Measurement” was issued and shall be applied when another Standard requires or allows measurement or disclosure to be made at fair value. This Standard aims the following:(a) Defining the fair value and laying down a framework to measure the fair value in one Standard and(b) Identifying the disclosure required for the fair value measurements.
Currently, the management is assessing the potential impacts on its financial statements resulting from application of the standard.
4.14 Revenues
Revenue are measured at the fair value of the consideration received or receivable and is recognized when it is probable that the economic benefits associated with the transaction will flow to the entities and the amount of the revenue can be measured reliably.
Construction contracts
Revenue from construction contracts is recognized in the income statement according to the percentage of completion through calculating what is actually accomplished from the clauses of the contract.
The contract costs are measured through calculating what is spent from the clauses of contract for the stage in which the revenue is recognized. The contract costs include all direct costs from materials, labor, subcontractors and overheads related to the execution of contract clauses like indirect labor and maintenance expenses as it also includes the general and administrative expenses spent directly on the contracting works.
The provision for estimated losses according to the construction contracts in progress is formed - if any- in the financial period during which those losses are assessed.
Minimum commission
Minimum Commission is recognized in the income statement when it accrues at the higher of the actual commission or minimum commission guaranteed by EGPC.
Gas sales revenues
For actual gas sales, the company remits the funds it collects to EGPC net of its actual commission, which is calculated as a percentage of gas consumption.
Cars conversion revenues
Revenue is recognized upon the completion of preparing cars to function using natural gas instead of Benzene upon issuing the invoice to the client.
Natural gas revenues
Revenues is recognized when supplying cars with natural gas.
Refined oil and lubes revenues
Revenues is recognized when refined oil products and lubes products are delivered to the customers.
Power service revenues
Revenues of services is recognized when the conditions of the signed contracts are fulfilled with others on accrual basis and according to the specified period in the contracts.
Interest income
Interest income is recognized when incurred on accrual basis.
4.15 Employees’ compulsory government social insurance share
The company contributes to the government social insurance share for the benefit of its personnel in accordance with the social insurance law. Under this law, the employees and the employers contribute into the system on a fixed percentage-of-salaries basis. The group’s liability is confined to the amount of its contribution. Contributions are charged to income statement using the accrual basis of accounting.

Auditor’s report A WORLD OF ENERGY
15 TAQA Arabia 162015 Annual Report
6. PROJEcts unDER cOnstRuctiOn
7. intangiBlE assEts
Intangible assets represented in the cost of software, licenses, and usufruct.
8. gOODWill
Goodwill arising on the acquisition of the following companies:
In Egyptian Pound 31/12/2015 31/12/2014
Power stations 438 595 23 841 213
Gas and oil stations 9 147 142 7 535 142
9 585 737 31 376 355
In Egyptian Pound 31/12/2015
Beginning balance 9 226 979
Addition 4 494 000
Amortization (751 848)
Ending balance 12 969 131
In Egyptian Pound costimpairment loss
net book value
Gas and Energy Company (Taqa Gas) 197 610 943 - 197 610 943
House Gas (Subsidiary of Taqa Gas) 673 508 - 673 508
Master Gas (Subsidiary of Taqa Gas) 566 471 - 566 471
City Gas Company (Subsidiary of Taqa Gas)
12 364 500 - 12 364 500
Nile Valley Gas (Subsidiary of Taqa Gas) 98 690 816 - 98 690 816
Trans Gas (Subsidiary of Taqa Gas) 19 330 295 (13 681 532) 5 648 763
Repco Gas (Subsidiary of Taqa Gas) 5 982 761 - 5 982 761
Global Energy Company (Subsidiary of Taqa Electricity, Water and Cooling)
56 073 463 - 56 073 463
Qatar Gas Group 15 489 459 - 15 489 459
406 782 216 (13 681 532) 393 100 684
in E
gyp
tian
Po
un
d C
ost
lan
d &
bu
ild
ings
Mac
hin
ry &
eq
uip
me
nts
Mo
tor
veh
icle
sF
urn
itu
re &
offi
ce e
qu
ipm
en
t&
co
mp
ute
r
ge
ne
rato
rs&
ne
two
rks
&p
ipe
lin
e &
sta
tio
ne
qu
ipm
en
t
le
ase
ho
ldim
pro
vem
en
tst
ota
l
Bal
an
ce a
s o
f 31 D
ece
mb
er
2014
115 7
48 8
80
10
5 7
34
89
01
9 1
13
09
43
5 4
25
73
43
73
02
8 0
74
5 2
21
53
16
54
27
2 2
03
Add
ition
s 20
021
433
19 4
58 2
621
340
390
3 04
8 80
229
923
120
40
239
73
83
2 2
46
Tran
sfer
from
ass
ets
held
for
sale
40
995
560
725
-
428
724
5 60
9 62
8-
6 6
40
07
2
Dis
posa
ls
-(4
81 2
65)
(
160
000)
( 30
2 88
6)(1
736
792
)-
(2 6
80
94
3)
Cum
ulat
ive
tran
slat
ion
diffe
renc
e-
133
417
30
089
75
512
--
23
9 0
18
Bal
an
ce a
s o
f 31 D
ece
mb
er
2015
135 8
11 3
08
12
5 4
06
02
92
0 3
23
57
33
8 6
75
88
64
06
82
4 0
30
5 2
61
77
07
32
30
2 5
96
Acc
um
ula
ted
de
pre
ciat
ion
an
d i
mp
air
me
nt
Bal
an
ce a
s o
f 31 D
ece
mb
er
2014
18 1
13 0
08
49
42
4 0
58
15
20
5 1
49
27
49
9 7
71
75
68
8 0
53
4 0
64
18
91
89
99
4 2
28
Dep
reci
atio
n 6
102
212
5 93
5 02
31
579
736
2 69
7 62
622
890
018
472
303
39
67
6 9
18
Tran
sfer
from
ass
ets
held
for
sale
40
995
70
783
- 4
01 2
461
073
684
-1
58
6 7
08
Acc
umul
ated
dep
reci
atio
n of
dis
posa
ls-
( 48
1 26
5)(
160
000)
( 30
1 53
9)(
375
259)
-(1
31
8 0
63
)
Cum
ulat
ive
tran
slat
ion
diffe
renc
e-
34
030
26
780
54
209
--
11
5 0
19
Bal
an
ce a
s o
f 31 D
ece
mb
er
2015
24 2
56 2
15
54
98
2 6
29
16
65
1 6
65
30
35
1 3
13
99
27
6 4
96
4 5
36
49
22
30
05
4 8
10
Ne
t ca
rryin
g am
ou
nt
Bal
an
ce a
s o
f 31 D
ece
mb
er
2015
111 5
55 0
93
70
42
3 4
00
3 6
71
90
88
32
4 5
73
30
7 5
47
53
4 7
25
27
85
02
24
7 7
86
Bal
an
ce a
s o
f 31 D
ece
mb
er
2014
97 6
35 8
72
56
31
0 8
32
3 9
07
94
57
92
5 9
63
29
7 3
40
02
11
15
7 3
42
46
4 2
77
97
5
TAQ
A Ar
abia
Com
pany
(An
Egy
ptia
n Jo
int S
tock
Com
pany
)
5. P
RO
PE
Rt
Y,
Pl
an
t a
nD
EQ
uiP
ME
nt
N
ote
s to
th
e c
on
soli
dat
ed
fin
an
cial
sta
tem
en
ts F
or
the
fin
an
cial
ye
ar
en
de
d 3
1 D
ece
mb
er
20
15

Auditor’s report A WORLD OF ENERGY
17 TAQA Arabia 182015 Annual Report
11. OtHER invEstMEnts
12. RElatED PaRtiEs
In Egyptian Pound 31/12/2015 31/12/2014
Available for sale financial assets 2 316 541 2 316 541
2 316 541 2 316 541
In Egyptian Pound 31/12/2015 31/12/2014
Silverstone Capital Investments Ltd. (Parent company) (8 960 725) 5 000 000
Mashreq Petroleum Company (*) 10 073 838 -
ASEC Company (*) 33 730 120 24 063 567
Simitar Egypt Company (*) 2 410 215 2 475 866
Due from related parties 46 214 173 31 539 433
Due to related parties (8 960 725) -
(*) Balances with subsidiaries to the ultimate parent company
transactions with related parties
• Transactions with Silverstone Capital Ltd. represented in dividends distribution amounted to EGP 51.5 Million.
• Transactions with Mashreq Petroleum Company represented in short-term loan granted from Taqa Arabia Company. The loan contract was approved by General Assembly meeting of Taqa Arabia Company’s dated 8 July 2015. The annual interest rate for this contract is 10% due at the end of the loan maturity date.
This short term loan amounted to EGP 9 572 735 equivalent to USD 1 250 000. Accrued interest as of 31 December 2015 amounted to EGP 496 120.
• Transactions with ASEC Company represented in electricity supplies revenue.
• Transactions with Simitar Egypt Company represented in electricity supplies revenue.
9. invEntORiEs
10. tRaDE REcEivaBlEs anD OtHER DEBit BalancEs
a) Non-current
In Egyptian Pound 31/12/2015 31/12/2014
Raw materials 102 029 122 75 929 035
Oil-finished goods 15 492 502 15 314 491
Spare parts 11 295 237 9 763 266
Goods in transit 72 825 96 711
128 889 686 101 103 503
less :Inventories write-down (7 829 707) (7 884 339)
121 059 979 93 219 164
In Egyptian Pound 31/12/2015 31/12/2014
Trade receivables 6 852 617 11 718 165
Prepaid expenses 5 337 869 1 903 196
Deposits with others 22 128 820 16 414 089
34 319 306 30 035 450
In Egyptian Pound 31/12/2015 31/12/2014
Trade receivables and notes receivables 391 724 510 279 344 904
Staff loans 6 766 453 5 305 497
Deposits with other 18 226 531 12 539 057
Prepayments and advance to suppliers 45 082 312 28 532 178
Other receivables 47 466 987 107 368 775
509 266 793 433 090 411
Less (22 935 248) (20 487 115)
impairment 486 331 545 412 603 296
b) Current

Auditor’s report A WORLD OF ENERGY
19 TAQA Arabia 202015 Annual Report
16. lOans anD BORROWings
This note provides information about the contractual terms of the group interest-bearing loans and borrowings.
a) short term
In Egyptian Pound Bank Currencyyear of maturity
31/12/2015 31/12/2014
Taqa Arabia HSBC EGP 2016 25 000 000 -
Global Energy HSBC EGP 2016 24 350 000 25 350 000
Global Energy Arab Bank USD 2014 - 1 656 752
Taqa Marketing HSBC EGP 2016 8 929 288 6 571 154
Taqa Marketing Cairo bank EGP 2016 3 081 758 3 081 758
Taqa Marketing NBE bank EGP 2016 527 925 -
total 61 888 971 36 659 664
In Egyptian Pound Bank Currencyyear of maturity
31/12/2015 31/12/2014
Taqa Arabia HSBC EGP 2017/2020 175 000 000 -
Global Energy HSBC EGP 2017 /2018 15 652 000 40 002 000
Taqa Marketing HSBC EGP 2017/2020 16 333 688 13 306 590
Taqa Marketing Cairo bank EGP 2017/2020 9 883 586 12 965 414
Taqa Marketing NBE bank EGP 2017/2022 3 718 761 -
total 220 588 035 66 274 004
B) long term
The main Terms and conditions of outstanding loans are as follows:
global Energy
• Maintain certain financial ratios as stated in the contract.• Not to change capital structure without written permission from the bank.
taqa Marketing
• Maintain certain financial ratios as stated in the contract• No dividends shall be distributed for TAQA Marketing Company unless all due amounts and its interest are paid
taqa arabia
• Mortgage on the shares invested in Nile Valley and City Gas Company.• A pledge to transfer the profits of the subsidiaries companies to the HSBC bank account of TAQA Arabia Company.
The amount transferred shall cover 1.25 from the annual payments.• A pledge for not selling the shares of the subsidiaries companies.• No dividends shall be distributed for TAQA Arabia Company when prejudice occurs with percentage of debt
service ratio or the delay of payments for any of the financial liabilities due to the bank.• Maintain certain financial ratios as stated in the contract
13. lOan – nOtEs REcEivaBlEs
The General assembly meeting dated 20 January 2015 approved the investment in the financial instruments offered by Citadel Capital for International Investment Ltd. “subsidiary of the ultimate parent company” with an amount not exceeding EGP 350 million. The company get the loan instruments certificates from Citadel Capital for International Investments Ltd dated 9 October 2014 and 15 February 2015 amounted
EGP 213 680 773 and EGP 67 579 227 respectively. The company has subscribed for an amount of EGP 281 260 000 till the financial statement date. The note bears an interest on quarterly basis on its outstanding principal amount at a rate equal to the Mid-Corridor rate announced by the Central Bank of Egypt plus 3.25% per annum. This interest shall be received on the final maturity date.
The loans balance at financial statement date as follow:
14. casH anD casH EQuivalEnts
15. BANk FACILITIES
In Egyptian Pound 31/12/2015
Beginning balance 213 680 773
Additions 67 579 227
Interest recognized during the financial year 40 424 205
321 684 205
In Egyptian Pound 31/12/2015 31/12/2014
Cash on hand and at banks 193 643 255 228 048 595
Treasury bills 420 189 260 226 496 515
Time deposit 73 477 710 72 781 261
Investment funds 31 925 665 73 211 917
719 235 890 600 538 288
In Egyptian Pound 31/12/2015 31/12/2014
Taqa Gas Group 34 245 722 73 703 024
Global for Energy 7 681 272 15 015 002
Taqa Marketing - 1 212 812
Qatar Gas Group 48 026 15 580
41 975 020 89 946 418
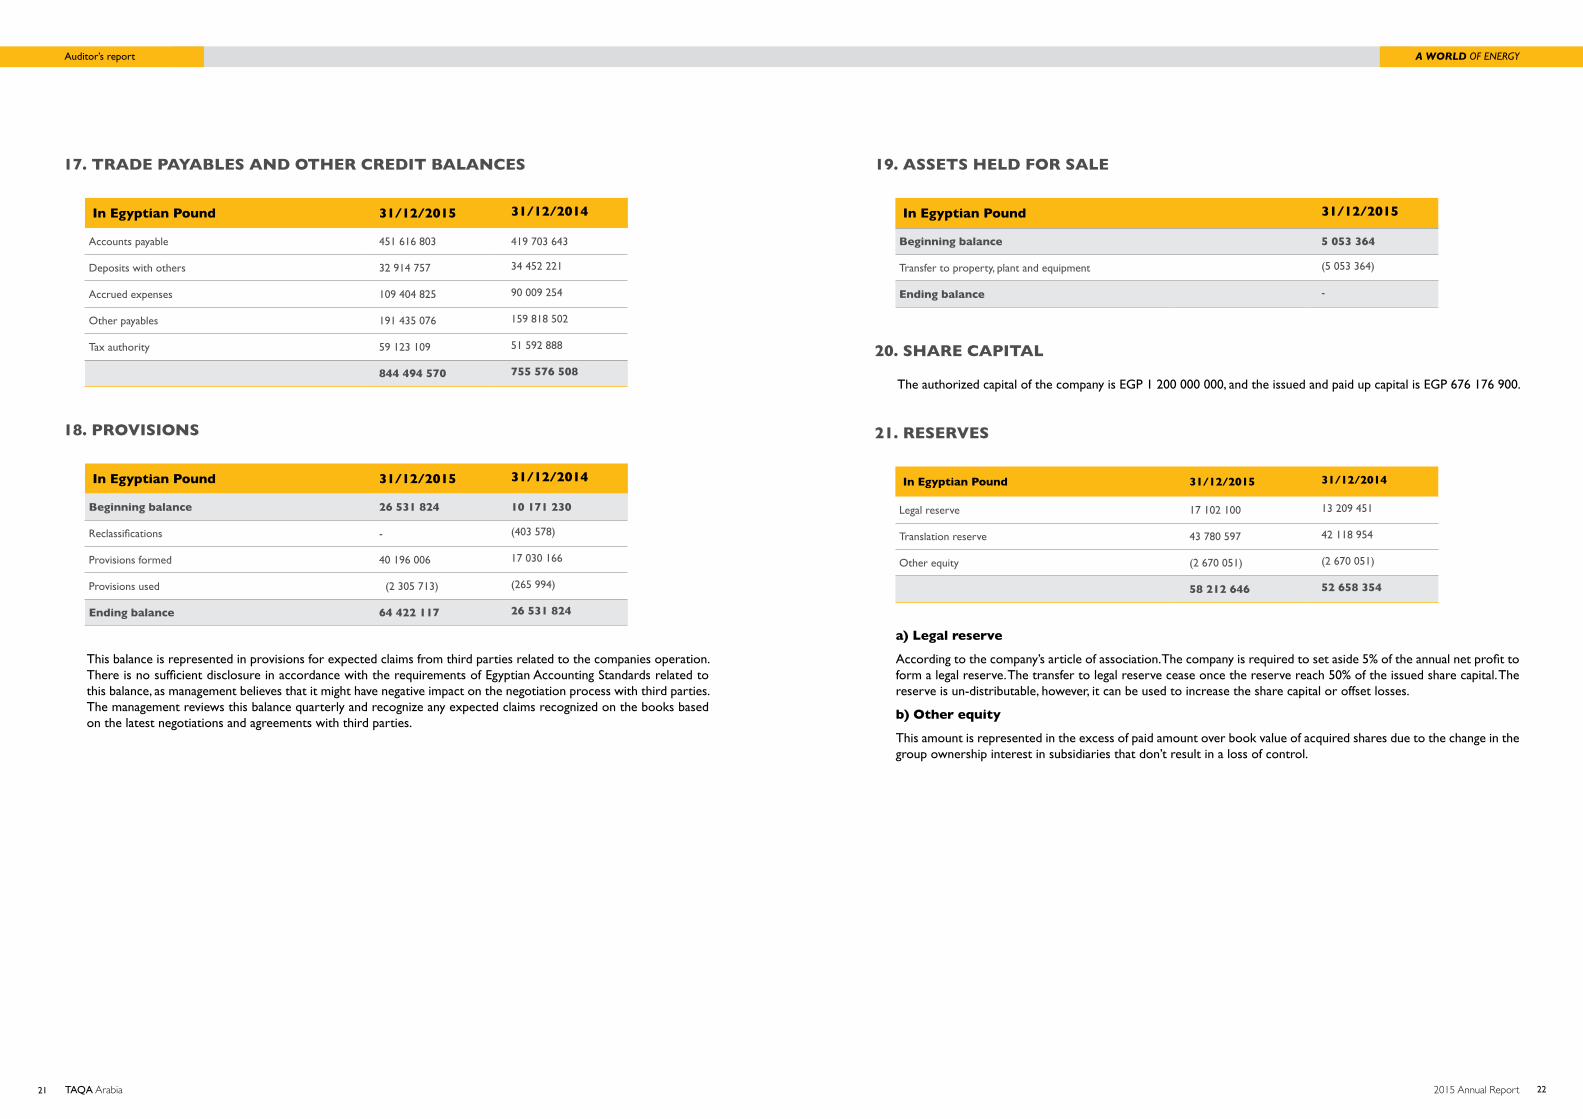
Auditor’s report A WORLD OF ENERGY
21 TAQA Arabia 222015 Annual Report
19. assEts HElD FOR salE
21. REsERvEs
20. sHaRE caPital
In Egyptian Pound 31/12/2015
Beginning balance 5 053 364
Transfer to property, plant and equipment (5 053 364)
Ending balance -
In Egyptian Pound 31/12/2015 31/12/2014
Legal reserve 17 102 100 13 209 451
Translation reserve 43 780 597 42 118 954
Other equity (2 670 051) (2 670 051)
58 212 646 52 658 354
The authorized capital of the company is EGP 1 200 000 000, and the issued and paid up capital is EGP 676 176 900.
a) legal reserve
According to the company’s article of association. The company is required to set aside 5% of the annual net profit to form a legal reserve. The transfer to legal reserve cease once the reserve reach 50% of the issued share capital. The reserve is un-distributable, however, it can be used to increase the share capital or offset losses.
b) Other equity
This amount is represented in the excess of paid amount over book value of acquired shares due to the change in the group ownership interest in subsidiaries that don’t result in a loss of control.
17. tRaDE PaYaBlEs anD OtHER cREDit BalancEs
18. PROvisiOns
In Egyptian Pound 31/12/2015 31/12/2014
Accounts payable 451 616 803 419 703 643
Deposits with others 32 914 757 34 452 221
Accrued expenses 109 404 825 90 009 254
Other payables 191 435 076 159 818 502
Tax authority 59 123 109 51 592 888
844 494 570 755 576 508
In Egyptian Pound 31/12/2015 31/12/2014
Beginning balance 26 531 824 10 171 230
Reclassifications - (403 578)
Provisions formed 40 196 006 17 030 166
Provisions used (2 305 713) (265 994)
Ending balance 64 422 117 26 531 824
This balance is represented in provisions for expected claims from third parties related to the companies operation. There is no sufficient disclosure in accordance with the requirements of Egyptian Accounting Standards related to this balance, as management believes that it might have negative impact on the negotiation process with third parties. The management reviews this balance quarterly and recognize any expected claims recognized on the books based on the latest negotiations and agreements with third parties.

Auditor’s report A WORLD OF ENERGY
23 TAQA Arabia 242015 Annual Report
26. aDMinistRativE ExPEnsEs
28. FinancE incOME
27. OtHER ExPEnsEs
25. cOst OF REvEnuE
In Egyptian Pound 2015 2014
Salaries and wages 60 704 981 64 155 173
Depreciation 3 789 090 4 678 405
Other 24 561 222 20 717 802
89 055 293 89 551 380
In Egyptian Pound 2015 2014
Loan – notes receivables revenue 40 424 205 -
Treasury bill investment funds and interest revenues 52 770 836 59 131 735
Interest loan revenue 496 120 -
93 691 161 59 131 735
In Egyptian Pound 2015 2014
Provision and impairment 44 429 146 27 168 926
Other 18 314 410 27 516 659
62 743 556 54 685 585
In Egyptian Pound 2015 2014
Fuel and oil sales cost 1 225 834 013 923 352 904
Electricity supplies cost 347 265 994 245 895 804
Gas networks construction cost 232 202 240 177 141 750
Salaries and wages 99 249 333 86 170 549
Gas cars conversion and gas sales cost 9 707 640 8 746 405
Other 75 515 235 84 291 716
1 989 774 455 1 525 599 128
22. lOng tERM liaBilitiEs
24. REvEnuE
23. DEFERRED
In Egyptian Pound 31/12/2015 31/12/2014
Gas consumption and meter deposits 111 971 723 103 587 328
Power consumption deposits 20 885 719 16 251 933
Other - 618 192
132 857 442 120 457 453
In Egyptian Pound 2015 2014
Fuel and oil revenue 1 276 291 071 967 395 255
Electricity supplies revenue 513 309 498 365 757 764
Gas networks construction revenue 303 832 288 262 816 709
Sales commission 146 077 240 139 029 813
Gas cars conversion and gas sales revenue 16 044 814 14 726 294
Other 44 320 987 463 444 61
2 299 875 898 1 796 070 296
assets liabilities
In Egyptian Pound 31/12/2015 31/12/2014 31/12/2015 31/12/2014
Fixed assets 546 711 26 903 50 102 867 50 439 924
546 711 26 903 50 102 867 50 439 924

Auditor’s report A WORLD OF ENERGY
25 TAQA Arabia 262015 Annual Report
29. FinancE cOsts
30. tax ExPEnsE
In Egyptian Pound 31/12/2015 31/12/2014
Interest expenses 31 710 080 25 168 459
31 710 080 459 168 25
In Egyptian Pound 31/12/2015 31/12/2014
Income tax 60 591 405 55 806 417
Dividends tax 5 360 727 74 335
65 952 132 55 880 752
31. taxatiOn
Corporate income tax
The company submits its tax return on the due dates.
Payroll tax
The company submits its tax return on the due dates .The Company was submitted to inspection covering the period from inception until the end of 2008. The inspection has not resulted in any tax differences.
32. R
EP
OR
ta
Bl
E s
Eg
ME
nt
The
follo
win
g su
mm
ary
desc
ribe
s th
e op
erat
ions
in e
ach
of t
he g
roup
’s re
port
able
seg
men
ts:
Th
e f
oll
ow
ing
geo
gra
ph
ical
se
gme
nts
hav
e b
ee
n i
de
nti
fie
d:
in E
gyp
tian
M
illi
on
Po
un
ds
gas
se
cto
rP
ow
er
sect
or
Oil
se
cto
rF
in E
ng
ta
Qa
st
and
alo
ne
tot
al o
ther
oper
atio
n se
ctor
sE
lim
inat
ion
st
ota
l
2015
2014
2015
2014
2015
2014
2015
2014
2015
2014
2015
2014
2015
2014
2015
2014
Rev
enue
511.
69
439.
39
513.
31
389.
29
1276
.29
967.
40
11.9
6 9.
26
0.00
0.
00
11.9
6 9.
26
(13.
37)
(9.2
6)22
99.8
8 17
96.0
7
Gro
ss p
rofit
155.
09
141.
28
125.
44
107.
90
36.4
4 26
.74
3.30
3.
17
0.00
0.
00
3.30
3.
17
(10.
17)
(8.6
2)31
0.10
27
0.47
Fina
nce
inco
me
44.3
9 55
.58
2.55
0.
29
4.94
2.
42
0.00
0.
00
41.8
1 0.
85
41.8
1 0.
85
--
93.6
9 59
.13
Fina
nce
expe
nses
(5.5
0)(9
.05)
(7.5
5)(1
0.80
)(4
.75)
(4.7
9)0.
00
0.00
(1
3.91
)(0
.51)
(13.
91)
(0.5
1)-
-(3
1.71
)(2
5.16
)
Profi
t be
fore
inco
me
tax
109.
95
120.
93
87.6
3 53
.19
32.4
9 18
.42
0.00
0.
00
38.4
0 35
.02
38.4
0 35
.02
(37.
25)
(57.
78)
231.
21
169.
78
Net
pro
fit a
ttri
bute
d to
ow
ners
of t
he c
ompa
ny73
.79
84.4
8 64
.84
30.7
3 25
.15
13.4
6 0.
39
0.13
35
.56
35.0
2 35
.95
35.1
5 (3
9.68
)(5
8.35
)16
0.05
10
5.47
Tota
l seg
men
t as
sets
1328
.88
1237
.39
806.
81
770.
65
188.
48
148.
12
15.3
1 11
.61
1095
.38
927.
86
1110
.68
939.
47
(785
.25)
(808
.63)
2649
.61
2287
.00
Tota
l seg
men
t lia
bilit
ies
798.
46
773.
76
290.
10
288.
99
111.
82
97.2
8 11
.72
9.17
39
4.43
19
1.58
40
6.15
20
0.74
(1
81.2
4)(2
14.8
9)14
25.2
9 11
45.8
9
Goo
dwill
33
8.67
33
8.67
56
.07
56.0
7 -
--
--
--
-(1
.64)
(1.6
4)39
3.10
39
3.10
Gro
ss r
eve
nu
es
to
tal
asse
ts
2015
2014
20
15
20
14
Loca
l22
60.0
5 17
65.9
5 26
27.4
1 22
73.5
0
Reg
ion
39.8
3 30
.12
22.2
0 13
.5

Auditor’s report A WORLD OF ENERGY
27 TAQA Arabia 282015 Annual Report
33. FINANCIAL RISk MANAGEMENT
The financial instruments represented in cash and cash equivalent, trade receivables and other debit balances, related parties balances, loans and borrowings and trade payables and other credit balances.
The Company’s Board of Directors has overall responsibility for the establishment and oversight of the group’s risk management framework.
The Group has exposure to the following risks arising from its financial instruments:
a) credit risk
Credit risk is the risk that one party to a financial instrument will fail to discharge an obligation and cause the other party to incur financial loss. This risk is mainly resulting from the group’s trade and other receivables .The group’s exposure to credit risk is influenced mainly by the individual characteristics of each customer. The group establishes an allowance for impairment that represents its estimate of incurred losses in respect of trade and other receivables.
The carrying amount of financial assets represents the maximum credit exposure.
b) Liquidity risk
Liquidity risk is the risk that the group will not be able to meet its financial obligations as they fall due. The group’s approach to managing liquidity is to ensure, as far as possible, that it will always have sufficient liquidity to meet its liabilities when due. The group ensures that the sufficient cash on demand to meet expected operational expenses for a suitable period, including the service of financial obligations.
c) Market risk
Market risk is the risk that changes in market prices, such as foreign exchange rates, and interest rates .The objective of market risk management is to manage and control market risk exposures within acceptable parameters while optimizing the return.
34. FaiR valuEs FOR Financial instRuMEnts
The fair value is the amount for which an asset could be exchanged or a liability settled between knowledgeable willing parties on an arm’s length basis. The carrying value of the company’s financial instruments approximates their fair values.
35. cOMPaRativE FiguREs
Some comparative figures were reclassified to conform with the presentation of the financial statements for this year.

www.taqa.com.eg