Embed Size (px)
Citation preview
2 0 1 2 A N N U A L R E P O R TOPNET Technologies, Inc.
OPNET Technologies, Inc. 2012 Annual Report
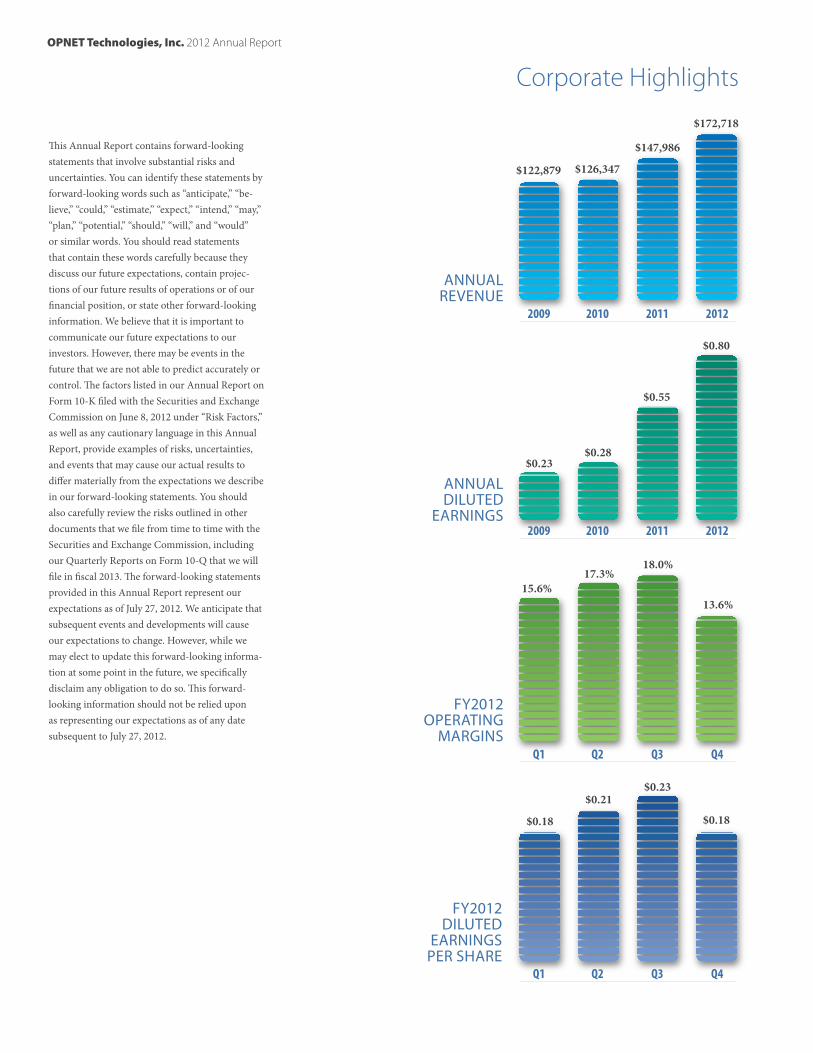
This Annual Report contains forward-looking statements that involve substantial risks and uncertainties. You can identify these statements by forward-looking words such as “anticipate,” “be-lieve,” “could,” “estimate,” “expect,” “intend,” “may,” “plan,” “potential,” “should,” “will,” and “would” or similar words. You should read statements that contain these words carefully because they discuss our future expectations, contain projec-tions of our future results of operations or of our financial position, or state other forward-looking information. We believe that it is important to communicate our future expectations to our investors. However, there may be events in the future that we are not able to predict accurately or control. The factors listed in our Annual Report on Form 10-K filed with the Securities and Exchange Commission on June 8, 2012 under “Risk Factors,” as well as any cautionary language in this Annual Report, provide examples of risks, uncertainties, and events that may cause our actual results to differ materially from the expectations we describe in our forward-looking statements. You should also carefully review the risks outlined in other documents that we file from time to time with the Securities and Exchange Commission, including our Quarterly Reports on Form 10-Q that we will file in fiscal 2013. The forward-looking statements provided in this Annual Report represent our expectations as of July 27, 2012. We anticipate that subsequent events and developments will cause our expectations to change. However, while we may elect to update this forward-looking informa-tion at some point in the future, we specifically disclaim any obligation to do so. This forward-looking information should not be relied upon as representing our expectations as of any date subsequent to July 27, 2012.
Corporate Highlights
2009 2010 2011 2012
2009 2010 2011 2012
Q1 Q2 Q3 Q4
Q1 Q2 Q3 Q4
$122,879 $126,347
$147,986
$172,718
$0.23
$0.18
$0.21$0.23
$0.18
15.6%17.3%
18.0%
13.6%
$0.28
$0.55
$0.80
ANNUALREVENUE
ANNUALDILUTED
EARNINGS
FY2012 OPERATING
MARGINS
FY2012 DILUTED
EARNINGS PER SHARE
OPNET Technologies, Inc. 2012 Annual Report
1
Letter to Shareholders
Dear Shareholders,
Fiscal 2012 was a year of growth for OPNET. We achieved record revenue of approximately $173 million, up by approxi-mately 17% relative to the prior fiscal year. We also increased product revenue by 18.5% to $85.8 million, grew operating in-come by 48% to $27.9 million, and increased deferred revenue to $54.9 million. We accomplished this with only a 7% increase in headcount.
Due to OPNET’s strong cash position and ability to generate positive cash flow from operations, we increased our dividend distribution to $0.12 per share for each of the four quarters in fiscal 2012. Additionally, we paid a one-time special dividend of $0.85 per share. Notwithstanding these dividend distributions, OPNET ended fiscal 2012 with a cash position of $111.3 million.
In fiscal 2012, OPNET continued to expand its portfolio of products, which spans Application Performance Management; Network Performance Management; Network Engineering, Operations, and Planning; and Network R&D. OPNET has introduced revolutionary new capabilities in IT Performance Management. One of these capabilities applies Big Data tech-nology to store and efficiently search across billions of transac-tions that are monitored for running applications. This capa-bility is extremely valuable for understanding and improving application performance throughout the application lifecycle, including development, testing, and production.
OPNET also continues to be a thought leader with its “High Definition APM”– a philosophy that promotes both breadth and depth in monitoring, as well as use of analytics to extract the information that IT needs to better manage application performance.
As a result of OPNET’s innovative technology, increased market share, and visibility, we were pleased to be recog-nized by multiple key industry analysts as a leader in APM. We believe that OPNET can achieve deeper market penetration in this large and growing space, and we
have significantly expanded our marketing programs in order to achieve this goal.
We believe that our results in fiscal 2012 demonstrate that our strategy to grow our market recognition and our sales momen-tum is working. In fiscal 2012, OPNET continued to expand its network of sales partners and independent resellers, both in the US and overseas. Our channel program now generates over 25% of new product sales. In fiscal 2012, APM sales increased by 32% relative to the prior fiscal year–the third consecutive year of strong double-digit growth. During fiscal 2012, APM represented nearly 76% of product bookings.
During fiscal 2012, we generated cash flow from operations of $27.2 million, maintained a strong balance sheet with no debt, and invested 22% of our total revenue into research and devel-opment. Despite the soft economy, we grew operating margin to 16.2% from 12.7% in fiscal 2011. We believe our expanded presence in the APM sector has positioned OPNET for long-term growth in revenue and profitability.
During fiscal 2012, OPNET filed 14 new patent applications, further building on our base of intellectual property.
In summary, fiscal 2012 was a year of significant accomplish-ments for OPNET. We believe that we are well positioned to be
a leading global provider of IT Service Management solutions in a market where growth is driven by increased dependence on applications, more rapid application development and deploy-ment cycles, increasing infrastructure complexity, more stringent performance demands, and a need for greater automa-tion in order to drive down costs.
None of this would have been possible without the dedication and hard work of our staff and their successful track record of continuous innovation. We would like to thank all the employees of OPNET, our customers, and our shareholders for their commitment to our solutions and belief in our vision
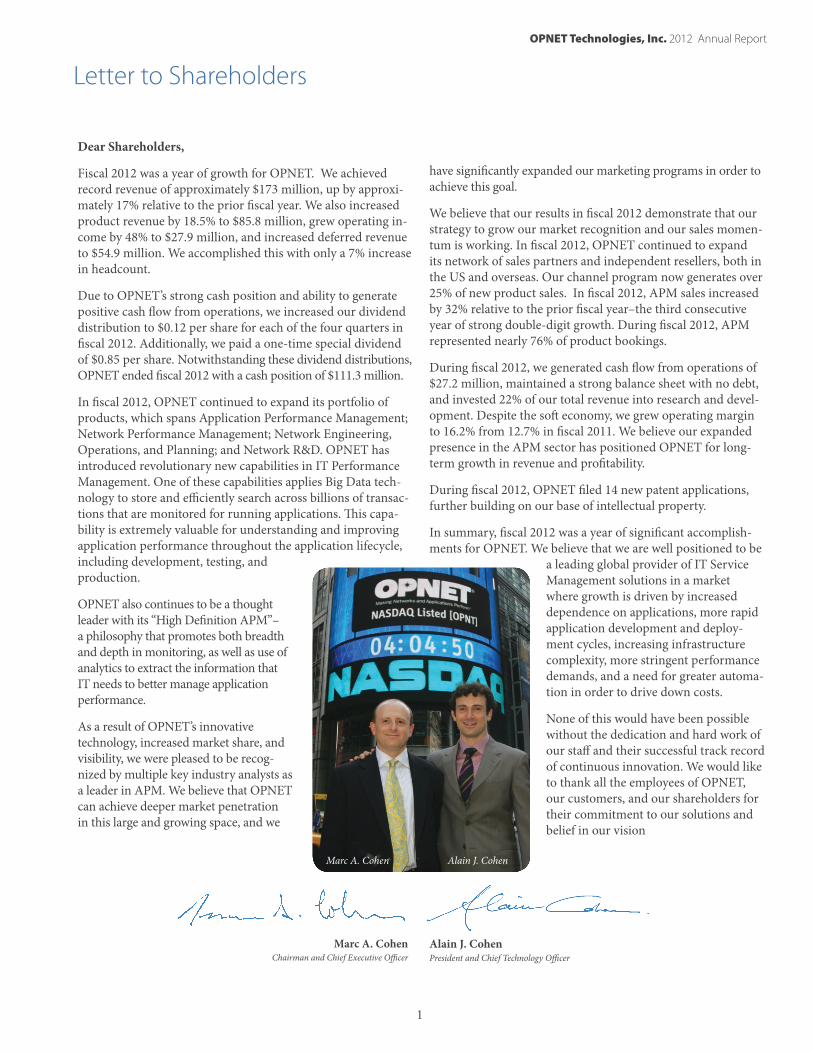
Alain J. Cohen President and Chief Technology Officer
Marc A. Cohen Chairman and Chief Executive Officer
Marc A. Cohen Alain J. Cohen
OPNET Technologies, Inc. 2012 Annual Report
2
OPNET Technologies, Inc. is a leading provider of solutions for application and network performance management. Ap-plications are utilized by the enterprise to conduct business, both internally and externally. Due to the many facets of their operations, most organizations have a large number of applica-tions, including dozens or more that are considered “mission critical.” There are also other essential IT services, such as telephony, Internet access, video-conferencing, file sharing, etc. It is indisputable that today’s large organizations, and even many medium sized entities, have evolved a business model that is heavily dependent upon the services provided by IT. The IT organization’s primary objective is to ensure that these ser-vices are provided with the level of reliability and performance required to satisfy the enterprise.
Within this rapidly evolving, complex environment, traditional approaches to managing the performance of IT services are no longer sufficient for IT to provide the requisite level of service to the enterprise. These approaches provide the ability to moni-tor, record, and alert on basic health and status metrics of the individual elements that constitute the service delivery infra-structure. This “silo-based monitoring” paradigm falls short for two fundamental reasons: the information that is gathered is insufficiently fine-grained; and there is an absence of analyti-cal tools needed to combine and correlate the many sources of information to deliver actionable information.
OPNET is uniquely positioned to deliver solutions that excel at addressing the most critical challenges associated with IT Performance Management.
• OPNET was among the first to recognize that beyond simply covering a broad scope of technology domains, management solutions should also enable organizations to bridge the gaps between domains.
• OPNET introduced new thinking about the respective roles of performance and forensic data, and an analytics frame-work that combines these data sets across its APM suite for greater insight into application behavior.
•OPNET is a leader in addressing the critical dependency of applications on the network, particularly with the emerg-ing prominence of cloud computing, virtualization, Service Oriented Architecture, and other models wherein the application is significantly more susceptible to network performance issues.
•OPNET was an early promoter of Performance Engineer-ing as a discipline, with methodologies and solutions for pre-deployment performance assurance.
•OPNET was a leader in introducing licensing models that address dynamic environments inherent in virtualization and cloud computing.
OPNET continues to extend its technology leadership, as dem-onstrated by its substantial portfolio of intellectual property. OPNET’s software solutions are designed for a broad customer base, including corporate enterprises, government agencies, network service providers, defense agencies, and network equipment manufacturers. These organizations rely on OPNET software to improve operational effectiveness through higher
availability and performance, reduce mean time to reso-lution of incidents, accelerate the deployment of
strategic services, reduce IT operating and capital costs, manage risk associated
with growth and change, and increase productivity.
Corporate Profile
OPNET Technologies, Inc. 2012 Annual Report
3
To enable this vital activity, OPNET has been delivering pioneering APM capabilities for more than twelve years, and has emerged as a leading provider of solutions in this rapidly growing market. By implementing a comprehensive APM solution, enterprises can realize the following benefits:
• Monitor the experience of real users and alert on service level agreement violations.
• Trend historical performance of applications to detect degradation or improvement in user experience.
• Accelerate troubleshooting and remediation.
• Eliminate “finger-pointing” among IT teams, promoting cooperative approaches to solving problems.
• Detect early warnings signs of application performance problems and take preventive action.
• Understand the dependencies among applications and infrastructure components.
• Reduce the risk of delay or failure by verifying application readiness prior to deployment.
APM XPERT™ SOLUTION SUITE
AppResponse Xpert® is an appliance-based solution that monitors and analyzes end-user experience. It also supports in-depth monitoring and analysis of the underlying network, a domain that is vital to comprehensive APM. AppResponse Xpert leverages the central role of the network in transport-ing transaction data to obtain vital information about rela-tionships among clients and servers, and among server tiers. On-board analytics extract transactions from application flows and break down application response time, identifying which parts of the infrastructure are contributing most to delays. AppResponse Xpert offers add-on modules specialized in: monitoring of unified communications (voice and video); SQL database monitoring; monitoring of CITRIX-hosted applica-tions; and NetFlow collection and analysis.
AppInternals Xpert™ delves into the complex software frameworks and operating systems of modern servers to extract vast amounts of performance and forensic (trace) data to support all aspects of APM from the server perspective. AppInternals Xpert can provide analysis for any type of ap-plication, and has specialized support for Java, .NET, and PHP. AppInternals Xpert includes Transaction Trace Warehouse, a unique capability that allows customers to capture cross-tier traces of every transaction of an application, including code-level execution. Transaction Trace Warehouse uses a Big Data approach to store billions of transaction traces enabling powerful search and analytical functions.
AppMapper Xpert™ automatically produces a run-time ap-plication map, identifying the underlying application compo-nents and infrastructure components that enable a production application. This model of the application, captured at the time of execution, is essential for most APM activities, including: troubleshooting application performance problems, configu-ration and change management, impact analysis, migration to cloud-based delivery, and data center virtualization and consolidation.
AppSQL Xpert® provides deep visibility into database per-formance through real-time monitoring of a broad range of metrics and drilldowns to fine-grained database transaction data for troubleshooting. It performs detailed tracking of data-base usage for trending and performance optimization. It also detects database policy violations, such as unauthorized access and suspicious usage patterns. AppSQL Xpert provides high definition analysis of database performance while offering an agentless approach that imposes zero overhead on database operation.
AppTransaction Xpert™ is a powerful tool for detailed analy-sis of individual transactions. In today’s complex application architectures, a single transaction can involve many tiers and require thousands of messages to traverse the network. Ap-pTransaction Xpert makes extensive use of patented visualiza-tion and analytics to accelerate troubleshooting in production. In pre-deployment, AppTransaction Xpert is used proactively to predict application performance, and is the industry-lead-ing solution for application network readiness testing.
AppSensor Xpert™ uses remote instrumentation interfaces to enrich the data set used for APM analytics. In addition, AppSensor Xpert is able to capture performance information from infrastructure components that may otherwise be dif-ficult to monitor, including servers, application components, network devices, and vendor-specific management systems. AppSensor Xpert supplies this data to the rest of the APM Xpert suite for a more complete picture of end-to-end applica-tion performance.
Unified Communications Xpert™ (UC Xpert) provides end-to-end service management for Unified Communications, including Cisco IP Telephony and Telepresence, during new deployments, upgrades, and ongoing operations. UC Xpert maximizes performance and availability through automated proactive testing, performance monitoring, configuration management, and business intelligence reporting.
Application Performance Management
OPNET Technologies, Inc. 2012 Annual Report
4
Network management teams who plan, engineer, and oper-ate complex and constantly changing networks are respon-sible for the infrastructure that supports business-critical services and applications. OPNET’s customers rely on our solutions to ensure high performance and availability. Key capabilities include the ability to:
• Validate network configuration changes prior to deployment.
• Enhance security and reliability with scheduled network audits.
• Optimize network performance through traffic engineering.
• Minimize costs through capacity planning.
• Ensure network survivability by simulating failures.
• Accelerate new service deployments and data center con-solidations.
• Visualize the network in logical and physical views, includ-ing live overlays of infrastructure and traffic.
• Automate troubleshooting procedures.
• Automatically produce up-to-date network diagrams for regulatory compliance, faster troubleshooting, and engineering changes.
NETONE™ SOLUTIONS SUITE
IT NetMapper® and SP NetMapper® automatically produce engineering-quality network diagrams, which are comprehen-sive, and up-to-date. NetMapper generates network docu-mentation in the popular Microsoft Visio® format as well as HTML for web-based delivery. The solution eliminates the burdensome effort associated with manually representing the network, thereby improving timeliness, accuracy, and useful-ness of information. NetMapper is the only solution on the market capable of generating logical and physical diagrams with a level of detail and graphical quality that rivals diagrams network engineers create by hand. NetMapper takes diagram-ming one step further by leveraging OPNET’s rich repository of discovered network data to enhance diagrams with detailed configuration information.
IT Sentinel® and SP Sentinel® ensure compliance, correct network operation, performance, resiliency, and security for enterprises and service providers. Sentinel performs auto-mated, systematic, network-wide configuration audits of the production network, identifying errors and misconfigurations that can impact network compliance, availability, performance,
and security. Sentinel detects unexposed problems, and proactively notifies staff of critical errors. Sentinel leverages OPNET’s rich repository of discovered network data, includ-ing device configuration and connectivity, in order to provide the most advanced network verification capability available today. For example, Sentinel is unique in its ability to verify configuration consistency across groups of devices, based on its understanding of network connectivity and inter-device relationships.
OPNET nCompass for Enterprises™ and OPNET nCom-pass for Service Providers™ provide a unified, real-time, graphical visualization of large, heterogeneous production networks, including devices, their connectivity and status, and live traffic. nCompass unifies data from a wide range of sources, providing consolidated views for more intuitive and productive navigation and analysis. Third-party products can be launched from its console for deeper drill-down and assisted troubleshooting.
IT Guru Network Planner™ automates analysis and plan-ning of enterprise networks, with respect to capacity, cost-ef-fectiveness, routing efficiency, survivability, and performance. Organizations can accurately plan for growth, consolidation, technology migration, and new application deployments, including Voice-Over-IP (VoIP), Virtual Private Networks (VPNs), and IPv6. Exclusive OPNET algorithms automati-cally suggest optimizations for the network.
SP Guru Network Planner™ provides additional network planning and design capabilities to meet the unique re-quirements of network service providers, enabling them to accelerate new service deployment and maximize return on network investments. SP Guru Network Planner automati-cally performs traffic engineering for Multi-Protocol Label Switching (MPLS) networks, optimizes Quality of Service (QoS) for offerings such as VoIP, and provides unique analy-sis and optimization of BGP peering relationships.
SP Guru Transport Planner™ enables service providers and network equipment manufacturers to design resilient, cost effective optical and SONET networks. It performs “what if ” analyses for a wide variety of transport network architec-tures, technologies, and design scenarios, featuring unique multi-layer network presentation and optimization and design capabilities. SP Guru Transport Planner integrates with SP Guru Network Planner to provide an unmatched capability for optimization of capacity and survivability that spans both the optical transport network and the IP/MPLS network.
Network Engineering, Operations, and Planning
5
Network R&D organizations rely on OPNET software to boost productivity, improve product performance and quality, and accelerate time-to-market for wireless and fixed communication technologies. Key capabilities include the ability to:
• Optimize proprietary protocols and technologies.
• Test and demonstrate technology designs in realistic sce-narios before production.
• Increase network R&D productivity and accelerate time-to-market.
OPNET MODELER® SOLUTIONS SUITE
OPNET Modeler® accelerates the R&D process for analyzing and designing communication networks, devices, protocols, and applications. Users can analyze simulated networks to compare the impact of different technology designs on end-to-end behavior. Modeler incorporates a broad library of proto-cols and technologies, and includes a development environ-ment to enable modeling of all network types and technologies.
Modeler Wireless Suite provides high fidelity modeling, simulation, and analysis of a wide range of wireless networks. Technology developers leverage advanced simulation capabili-ties and rich protocol model suites to design and optimize proprietary wireless protocols, such as access control, schedul-ing, and power control algorithms. Simulations incorporate motion in mobile networks, including vehicles, aircraft, and satellite systems. Modeler Wireless Suite supports any network with mobile devices, including cellular, mobile ad hoc net-works, wireless LAN, and satellite. The product also optionally offers the industry’s most comprehensive models of standard protocols, such as WiMAX, LTE, and UMTS.
Modeler Wireless Suite for Defense supports the unique R&D requirements of the defense community, including re-search and development of network protocols and architectures crucial to Network-Centric Warfare implementations. Three-dimensional displays of network simulations incorporate to-pology, node relationships, and performance statistics, overlaid on realistically rendered terrain. Modeler Wireless Suite for Defense enables analysis and prediction of communications ef-fects in the theater of operations. Interaction of simulated and real systems is also supported, using OPNET’s System In The Loop module.
Network R&D Financial Statements
6 Selected Consolidated Financial Data
7 Management’s Discussion and Analysis of Financial Condition and Results of Operations
8 Summary of our Fiscal 2012 Financial Performance
22 Quantitative and Qualitative Disclosures About Market Risk
23 Management’s Report on Internal Control Over Financial Reporting
24 Report of Independent Registered Public Accounting Firm
25 Report of Independent Registered Public Accounting Firm
26 Consolidated Balance Sheets
27 Consolidated Statements of Operations
28 Consolidated Statements of Changes in Stockholders’ Equity
29 Consolidated Statements of Cash Flows
30 Notes to Consolidated Financial Statements
OPNET Technologies, Inc. 2012 Annual Report
OPNET Technologies, Inc. 2012 Annual Report
6
SELECTED CONSOLIDATED FINANCIAL DATA
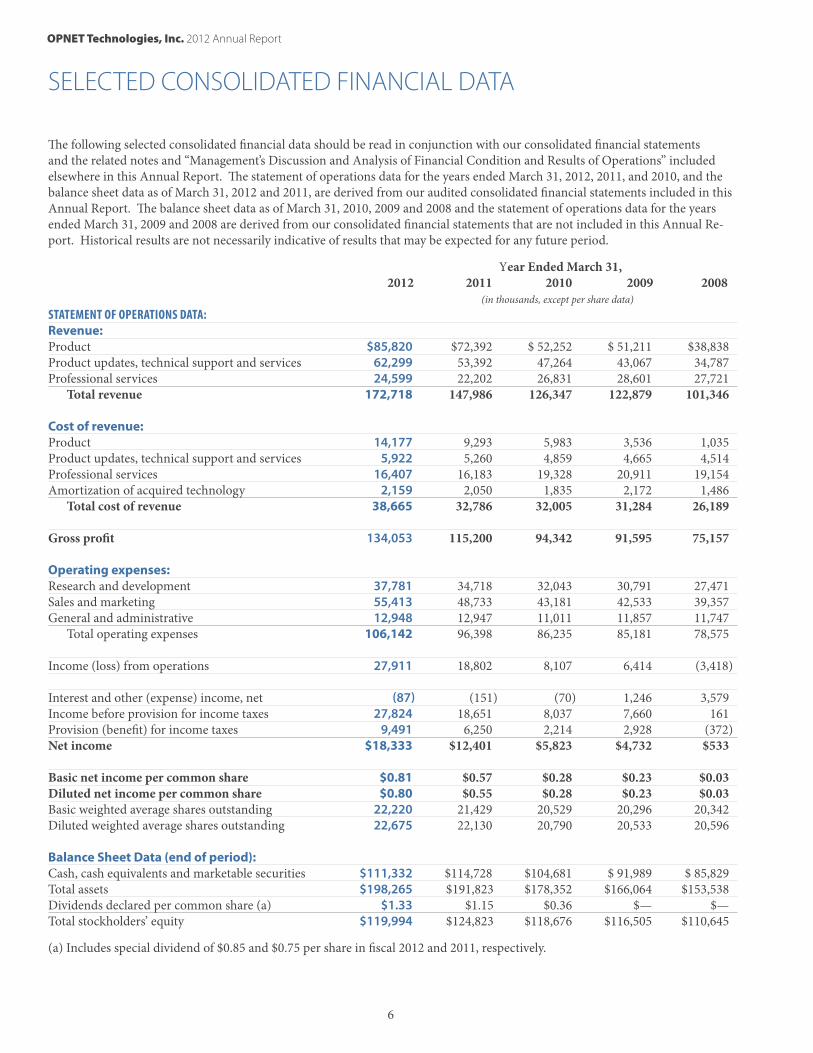
The following selected consolidated financial data should be read in conjunction with our consolidated financial statements and the related notes and ‘‘Management’s Discussion and Analysis of Financial Condition and Results of Operations’’ included elsewhere in this Annual Report. The statement of operations data for the years ended March 31, 2012, 2011, and 2010, and the balance sheet data as of March 31, 2012 and 2011, are derived from our audited consolidated financial statements included in this Annual Report. The balance sheet data as of March 31, 2010, 2009 and 2008 and the statement of operations data for the years ended March 31, 2009 and 2008 are derived from our consolidated financial statements that are not included in this Annual Re-port. Historical results are not necessarily indicative of results that may be expected for any future period.
Year Ended March 31, 2012 2011 2010 2009 2008 (in thousands, except per share data)STATEMENT OF OPERATIONS DATA: Revenue: Product $85,820 $72,392 $ 52,252 $ 51,211 $38,838Product updates, technical support and services 62,299 53,392 47,264 43,067 34,787Professional services 24,599 22,202 26,831 28,601 27,721 Total revenue 172,718 147,986 126,347 122,879 101,346 Cost of revenue: Product 14,177 9,293 5,983 3,536 1,035Product updates, technical support and services 5,922 5,260 4,859 4,665 4,514Professional services 16,407 16,183 19,328 20,911 19,154Amortization of acquired technology 2,159 2,050 1,835 2,172 1,486 Total cost of revenue 38,665 32,786 32,005 31,284 26,189 Gross profit 134,053 115,200 94,342 91,595 75,157 Operating expenses: Research and development 37,781 34,718 32,043 30,791 27,471Sales and marketing 55,413 48,733 43,181 42,533 39,357General and administrative 12,948 12,947 11,011 11,857 11,747 Total operating expenses 106,142 96,398 86,235 85,181 78,575 Income (loss) from operations 27,911 18,802 8,107 6,414 (3,418) Interest and other (expense) income, net (87) (151) (70) 1,246 3,579Income before provision for income taxes 27,824 18,651 8,037 7,660 161Provision (benefit) for income taxes 9,491 6,250 2,214 2,928 (372)Net income $18,333 $12,401 $5,823 $4,732 $533 Basic net income per common share $0.81 $0.57 $0.28 $0.23 $0.03Diluted net income per common share $0.80 $0.55 $0.28 $0.23 $0.03Basic weighted average shares outstanding 22,220 21,429 20,529 20,296 20,342Diluted weighted average shares outstanding 22,675 22,130 20,790 20,533 20,596 Balance Sheet Data (end of period): Cash, cash equivalents and marketable securities $111,332 $114,728 $104,681 $ 91,989 $ 85,829Total assets $198,265 $191,823 $178,352 $166,064 $153,538Dividends declared per common share (a) $1.33 $1.15 $0.36 $— $—Total stockholders’ equity $119,994 $124,823 $118,676 $116,505 $110,645
(a) Includes special dividend of $0.85 and $0.75 per share in fiscal 2012 and 2011, respectively.
OPNET Technologies, Inc. 2012 Annual Report
7
You should read the following discussion and analysis in con-junction with our consolidated financial statements and the re-lated notes included elsewhere in this Annual Report on Form 10-K. This discussion and analysis contains forward-looking statements that involve risks, uncertainties, and assumptions. Our actual results may differ materially from those anticipated in these forward-looking statements as a result of certain fac-tors, including, but not limited to, those set forth under ‘‘Item 1A. Risk Factors’’ and elsewhere in this Annual Report on Form 10-K.
OVERVIEW OPNET Technologies, Inc. is a provider of application perfor-mance management, or APM, and network performance man-agement solutions. Our software products address application performance management, network operations, capacity man-agement, and network research and development. Our cus-tomers include corporate enterprises, government and defense agencies, network service providers, and network equipment manufacturers. Our software products and related services are designed to help our customers make better use of resources, reduce operational problems and improve competitiveness.
We operate in one reportable industry segment, the develop-ment and sale of computer software products and related services. Our operations are principally in the United States, and we have subsidiaries in Belgium, France, Germany, the United Kingdom, Singapore, China and Australia. We primar-ily depend upon our direct sales force to generate revenue in the United States. Sales outside the United States are made through our international sales team as well as third-party dis-tributors and value-added resellers, who generally are respon-sible for providing technical support and service to customers within their territory.
Our revenue is derived from three primary sources: (1) product revenue, (2) product updates, technical support and services revenue, and (3) professional services revenue, which include consulting and training services for customers without current maintenance agreements. Product revenue represents all fees earned from granting customers licenses to use our soft-ware and fees associated with hardware necessary to run our software, and excludes revenue derived from product updates, which are included in product updates, technical support, and services revenue. Our software master license agreement pro-vides our customers with the right to use our software either perpetually, which we refer to as perpetual licenses, or during
MANAGEMENT’S DISCUSSION AND ANALYSIS OF FINANCIAL CONDITION AND RESULTS OF OPERATIONS
a defined term, generally for one to four years, which we refer to as term licenses. For the years ended March 31, 2012, 2011, and 2010, perpetual licenses represented approximately 96%, 91%, and 92% of product revenue, respectively. Substantially all of our product arrangements include both product licenses and product updates, technical support, and services. Prod-uct updates, technical support, and services revenue represent fees associated with the sale of unspecified product updates, technical support and when-and-if available training under our maintenance agreements. We offer professional services, under both time-and-material and fixed-price agreements, primarily to facilitate the adoption of our software products.
We consider our consulting services to be an integral part of our business model as they are centered on our software product offerings. Because our consulting services facilitate the adoption of our software product offerings, we believe that they ultimately generate additional sales of product licenses.
The key strategies of our business plan include increasing sales to existing customers, increasing deal size by selling modules and introducing new software products, improving our sales and marketing execution, establishing alliances to extend our market reach, increasing our international presence and increasing profitability. We have focused our sales, marketing, and other efforts on corporate enterprise and United States government opportunities, and to a much lesser extent, service provider and network equipment manufacturer opportuni-ties. Our focus and strategies are designed to increase revenue and profitability. Because of the uncertainty surrounding the amount and timing of revenue growth, we expect to need to closely control the increases in our total expenses as we imple-ment these strategies.
In March 2008, we launched an initiative to extend our do-mestic market reach by establishing sales alliances with third parties called the Synergy program. The Synergy program is designed to increase the penetration of our software products, particularly into mid-sized organizations. The Synergy pro-gram’s primary focus is on selling our application performance management software products domestically, including Ap-pResponse Xpert, a product that provides end-user experience monitoring and real-time application performance analytics, as we believe these software products are particularly well-suited for indirect channel distribution. As of March 31, 2012, there were 215 third parties participating in our Synergy program.
OPNET Technologies, Inc. 2012 Annual Report
8
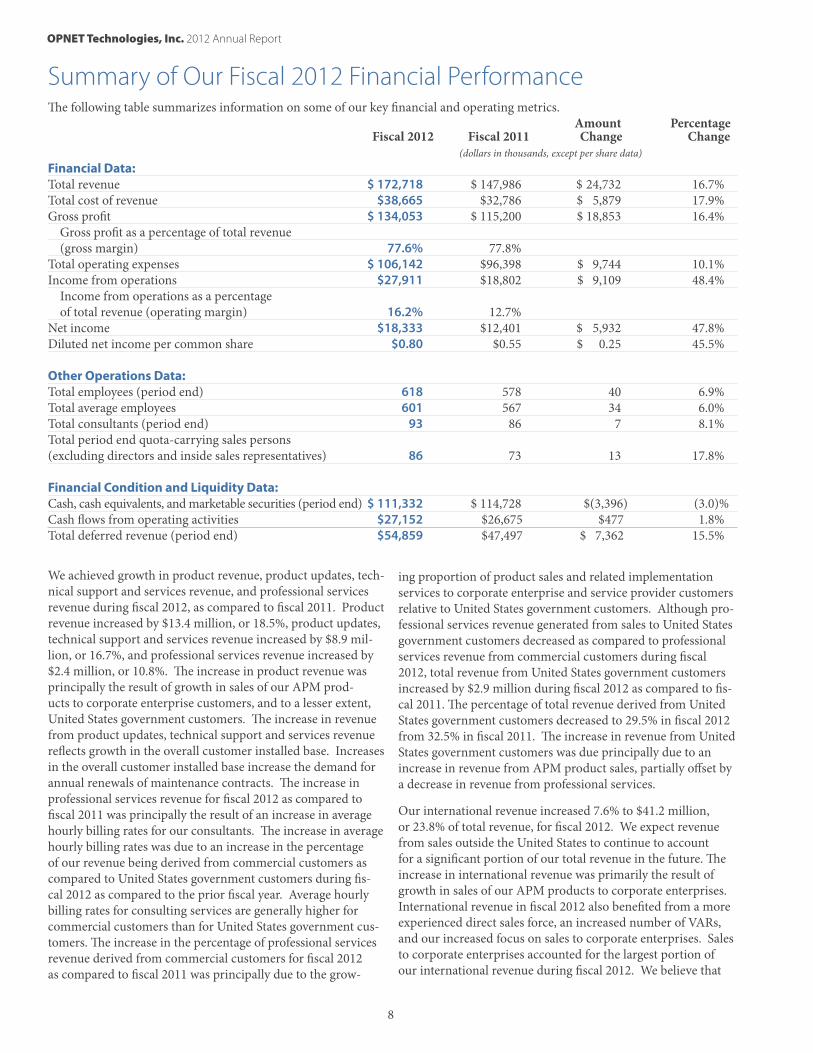
Summary of Our Fiscal 2012 Financial PerformanceThe following table summarizes information on some of our key financial and operating metrics. Amount Percentage Fiscal 2012 Fiscal 2011 Change Change (dollars in thousands, except per share data)Financial Data: Total revenue $ 172,718 $ 147,986 $ 24,732 16.7%Total cost of revenue $38,665 $32,786 $ 5,879 17.9%Gross profit $ 134,053 $ 115,200 $ 18,853 16.4% Gross profit as a percentage of total revenue (gross margin) 77.6% 77.8% Total operating expenses $ 106,142 $96,398 $ 9,744 10.1%Income from operations $27,911 $18,802 $ 9,109 48.4% Income from operations as a percentage of total revenue (operating margin) 16.2% 12.7% Net income $18,333 $12,401 $ 5,932 47.8%Diluted net income per common share $0.80 $0.55 $ 0.25 45.5%
Other Operations Data: Total employees (period end) 618 578 40 6.9%Total average employees 601 567 34 6.0%Total consultants (period end) 93 86 7 8.1%Total period end quota-carrying sales persons (excluding directors and inside sales representatives) 86 73 13 17.8% Financial Condition and Liquidity Data: Cash, cash equivalents, and marketable securities (period end) $ 111,332 $ 114,728 $(3,396) (3.0)%Cash flows from operating activities $27,152 $26,675 $477 1.8%Total deferred revenue (period end) $54,859 $47,497 $ 7,362 15.5%
We achieved growth in product revenue, product updates, tech-nical support and services revenue, and professional services revenue during fiscal 2012, as compared to fiscal 2011. Product revenue increased by $13.4 million, or 18.5%, product updates, technical support and services revenue increased by $8.9 mil-lion, or 16.7%, and professional services revenue increased by $2.4 million, or 10.8%. The increase in product revenue was principally the result of growth in sales of our APM prod-ucts to corporate enterprise customers, and to a lesser extent, United States government customers. The increase in revenue from product updates, technical support and services revenue reflects growth in the overall customer installed base. Increases in the overall customer installed base increase the demand for annual renewals of maintenance contracts. The increase in professional services revenue for fiscal 2012 as compared to fiscal 2011 was principally the result of an increase in average hourly billing rates for our consultants. The increase in average hourly billing rates was due to an increase in the percentage of our revenue being derived from commercial customers as compared to United States government customers during fis-cal 2012 as compared to the prior fiscal year. Average hourly billing rates for consulting services are generally higher for commercial customers than for United States government cus-tomers. The increase in the percentage of professional services revenue derived from commercial customers for fiscal 2012 as compared to fiscal 2011 was principally due to the grow-
ing proportion of product sales and related implementation services to corporate enterprise and service provider customers relative to United States government customers. Although pro-fessional services revenue generated from sales to United States government customers decreased as compared to professional services revenue from commercial customers during fiscal 2012, total revenue from United States government customers increased by $2.9 million during fiscal 2012 as compared to fis-cal 2011. The percentage of total revenue derived from United States government customers decreased to 29.5% in fiscal 2012 from 32.5% in fiscal 2011. The increase in revenue from United States government customers was due principally due to an increase in revenue from APM product sales, partially offset by a decrease in revenue from professional services.
Our international revenue increased 7.6% to $41.2 million, or 23.8% of total revenue, for fiscal 2012. We expect revenue from sales outside the United States to continue to account for a significant portion of our total revenue in the future. The increase in international revenue was primarily the result of growth in sales of our APM products to corporate enterprises. International revenue in fiscal 2012 also benefited from a more experienced direct sales force, an increased number of VARs, and our increased focus on sales to corporate enterprises. Sales to corporate enterprises accounted for the largest portion of our international revenue during fiscal 2012. We believe that
OPNET Technologies, Inc. 2012 Annual Report
9
continued growth and profitability will require further expan-sion of our sales, marketing and customer service functions in international markets.
During fiscal 2012, gross profit increased 16.4% to $134.1 mil-lion. The increase in our gross profit was primarily due to an increase in product revenue of $13.4 million and an increase in our product updates, technical support and services revenue of $8.9 million during fiscal 2012 as compared to fiscal 2011. Our gross margin decreased to 77.6% for fiscal 2012 from 77.8% in fiscal 2011 and our gross margin on product revenue during fiscal 2012 was 83.5% compared to 87.2% in fiscal 2011. The decrease in our gross margin and our gross margin on product revenue was due to an increase in costs related to hard-ware platforms used to deliver our AppResponse Xpert soft-ware products and other hardware used in connection with our AppResponse Xpert software products. The increase in costs was principally due to an increase in the proportion of AppRe-sponse Xpert products sales during fiscal 2012 as compared to fiscal 2011. Our AppResponse Xpert products are generally the only products we sell that are delivered on hardware platforms.
During fiscal 2012, operating income increased to $27.9 million from $18.8 million during fiscal 2011. The increase in operating income was largely the result of an increase in revenue of 16.7%, while increasing our operating expense by only 10.1%.
At the end of fiscal 2012, our deferred revenue was $54.9 mil-lion, an increase of $7.4 million compared to deferred revenue of $47.5 million at the end of fiscal 2011. The increase in deferred revenue was principally due to strong sales of new and renewal software maintenance contracts during the year.
SeasonalityOur product revenue tends to be seasonal. Product revenue from corporate enterprise customers, which represents the largest portion of our product revenue, has historically been the highest in the quarter ending December 31, our third fiscal quarter. Corporate enterprise customers typically operate on a calendar year end. As a result, it has been our experience that they often spend the remaining portion of their budgets in the December quarter.
In addition, European buying patterns have historically resulted in a decline in product sales in the summer months followed by increased product sales in our third fiscal quarter, reflecting European vacation practices and the resulting delay in product purchase activities until the conclusion of the summer vacation season.
Product revenue from United States government customers has historically been highest in the quarter ending September 30, which coincides with the United States government fiscal year-end, and reflects higher demand for product purchases prior to the end of their fiscal year. United States government product purchases typically decline in the quarter ending December 31. The increase in product revenue from corporate enterprise customers and European customers in the quarter ending December 31 has historically more than offset the sequential
decline in product sales to the United States government during the same quarter.
While we expect these historical trends to continue, they could be affected by a number of factors, including the relative pro-portions of our business conducted with government compared to commercial customers and domestic compared to European customers, a decline in general economic conditions, changes in the timing or amounts of United States government spend-ing resulting from budget constraints or other factors, and our continued expansion into international markets.
Trends that May Affect Our Business and Future ResultsWe anticipate the following trends and patterns over the next several quarters:
Total Revenue. We believe the current overall economic environment is showing signs of improvement but parts of the world economy, including countries comprising the European Union, appear to be declining. Our ability to generate increased revenue domestically and internationally will depend largely upon continued improvement in overall economic condi-tions. We expect future growth opportunities in product revenue and product updates, technical support and services revenue to come from sales to corporate enterprise customers and the United States government, as we believe our products offer competitive advantages in these markets. Our ability to generate increased revenue from United States government customers will be impacted by the length and severity of budget constraints. We expect product revenue and product updates, technical support and services revenue from sales to service providers and network equipment manufacturers to fluctu-ate from quarter to quarter with the potential for periods of declining revenue. Our ability to increase professional services revenue will depend in part on our ability to attract and retain additional qualified consultants, including those with security clearances. We believe that continued increases in the propor-tion of sales of our APM products, as compared to our other products, could cause the percentage of our total revenue at-tributable to professional services revenue to decline and might also cause an absolute decline in professional services revenue because our APM products generally require less consulting time to implement. As a result of these factors, we believe that we will likely experience fluctuations in quarterly revenue.
Gross Profit Margin. Our overall gross profit margin will con-tinue to be affected by the proportion of total revenue gener-ated from products and product updates, technical support and services, as revenue from these sources has substantially higher gross margins than the gross margin on revenue from profes-sional services. Our overall gross profit margin will also be af-fected by the proportion of our product revenue that is derived from products delivered on hardware platforms, the amount of fees paid to indirect channel partners and the profitability of in-dividual consulting engagements. Amortization of technology associated with acquisitions of technology that we may make in future periods may also affect our gross profit margin.
OPNET Technologies, Inc. 2012 Annual Report
10
Research and Development Expense. We believe that continued investment in research and development will be required to maintain our competitive position and broaden our software product lines, as well as enhance the features and functionality of our current software products, especially our APM products. We believe there is more competition in the markets served by our APM products as compared to the mar-kets for our other products. We made personnel investments in research and development during fiscal 2011 and 2012, and we plan to continue making investments in additional person-nel during the next several quarters. We expect that the abso-lute dollar amount of these expenses will grow in fiscal 2013 as compared to fiscal 2012.
Sales and Marketing Expense. We depend upon our direct sales model to generate revenue and believe that increasing the size of our quota-carrying sales team is essential for long-term growth. During fiscal 2012, we focused on improving the productivity of our existing sales force and made investments in additional direct sales personnel. We plan to continue to increase the number of quota-carrying salespeople in order to address what we believe is a large and growing market for our products. We also plan to increase expenditures in areas we believe will enhance the visibility of our products in the marketplace, especially our APM products. We expect that the absolute dollar amount of sales and marketing expense will increase in fiscal 2013 as compared to fiscal 2012.
General and Administrative Expense. We expect the dollar amount of general and administrative expenses to increase as we continue to expand our operations but generally decrease as a percentage of total revenue in future periods.
Operating Margin. Our operating margin increased to 16.2% during fiscal 2012 from 12.7% during fiscal 2011. Since a significant portion of our product arrangements close in the latter part of each quarter, we may not be able to adjust our cost structure in the short-term to respond to lower than expected revenue, which would adversely impact our operating margin and earnings. We remain committed to increasing profitability and generating long-term growth. As the econ-omy improves, we plan to strategically increase research and development and sales and marketing expenditures in order to maintain our products’ competitive advantages and increase market share. While we intend to strategically increase expen-ditures in certain areas to grow revenue, we intend to closely monitor and control overall operating expense in order to maximize our operating margin.
Critical Accounting Policies and Use of EstimatesThe accompanying discussion and analysis of our financial condition and results of operations are based upon our audited consolidated financial statements, which have been prepared in accordance with accounting principles generally accepted in the United States of America, or GAAP. The preparation of these financial statements requires that we make estimates and
judgments that affect the reported amounts of assets, liabilities, revenue and expenses, and related disclosure of contingent as-sets and liabilities. We base our estimates on historical experi-ence and on various other assumptions that we believe to be reasonable under the circumstances, the results of which form the basis for making judgments about the carrying values of assets and liabilities that are not readily apparent from other sources. Actual results could differ from the estimates made by management with respect to these and other items that require management’s estimates.
We have identified the accounting policies that are critical to understanding our historical and future performance, as these policies affect the reported amounts of revenue and the more significant areas involving management’s judgments and estimates. These critical accounting policies relate to revenue recognition and deferred revenue, stock based compensation, allowance for doubt-ful accounts, valuation of long-lived assets, including intangible assets and impairment review of goodwill, software development costs, and income taxes. These policies, and our procedures related to these policies, are described in detail below. In addition, please refer to Note 1 to our consolidated financial statements included elsewhere in this Annual Report on Form 10-K for further discus-sion of our accounting policies.
Revenue Recognition. We derive revenue from three primary sources: (1) product revenue, (2) product updates, technical support and services revenue, which include product updates, certain training provided and offered on a when-and-if avail-able basis to customers, and technical support, and (3) profes-sional services revenue, which include consulting and custom training services for customers without a current maintenance agreement. We recognize revenue based on the provisions of Accounting Standards Codification 605-985 Revenue Recogni-tion - Software, or ASC 605-985.
PRODUCT REVENUE
Product revenue represents all fees earned from granting cus-tomers perpetual and term licenses to use our software as well as the hardware that we use to deliver our AppResponse Xpert software products. It excludes revenue derived from product updates, which is included in product updates, technical sup-port and services revenue. For the years ended March 31, 2012, 2011, and 2010, perpetual licenses represented approximately 96%, 91%, and 92% of product revenue, respectively. Product revenue is recognized when the following four criteria are met: (i) persuasive evidence of an arrangement exists, (ii) delivery of the product has occurred, (iii) the product fee is fixed or deter-minable, and (iv) collectibility is probable. We analyze each of these four criteria as follows:
•Persuasive evidence of an arrangement exists. For license arrangements with end-users, it is our customary practice to have a written software license agreement, which is signed by both the end user and us, and a purchase order or equivalent. A written contract can be executed based on the customer-specific format or on the standard “shrink wrap” software master license agreement. For those end
OPNET Technologies, Inc. 2012 Annual Report
11
users who have previously negotiated a software license agreement with us, the initial software license agreement is used as evidence of a written contract. Sales to distributors, resellers, and value-added resellers, which we collectively refer to as resellers, are evidenced by a master reseller agreement governing the relationship, which is signed by both the reseller and us, together with a purchase order on a transaction-by-transaction basis. To further evidence an arrangement, our master reseller agreement requires that the reseller provide us copies of the end user’s executed software master license agreements.
•Delivery has occurred. Physical delivery of our software products to end users or resellers, which are collectively referred to as customers, is generally considered to have oc-curred upon the transfer of media containing our software products to a common carrier, usually FOB shipping point based on standard agreement terms. Software licenses may also be delivered electronically to end users. Electronic delivery is deemed to occur after end users have been provided with access codes that allow them to take immedi-ate possession of the software. If a software arrangement includes undelivered software products or services that are essential to the functionality of delivered software products, delivery is not considered to have occurred until these soft-ware products or services are delivered.
•The fee is fixed or determinable. It is our policy to not provide customers the right to any adjustments or refund of any portion of their license fees paid, acceptance provisions, cancellation privileges, or rights of return. Our normal pay-ment terms for our software products and services currently range from net 30 days to net 90 days and primarily vary based on the country in which an agreement is executed. Payments that extend beyond our normal payment terms from the contract date but that are due within six months have generally been deemed to be fixed or determinable based on our successful collection history on such arrange-ments, and thereby satisfy the required criteria for revenue recognition. Arrangements with payment terms extending beyond six months are recognized as payments become due and payable, as the Company is unable to demonstrate a history of collecting under similar payment terms with similar arrangements.
•Collectibility is probable. Collectibility is assessed on a customer-by-customer basis. We typically sell to customers for whom there is a history of successful collection. New customers are subject to a credit review process that evalu-ates the customer’s ability to pay. If we determine from the outset of an arrangement that collectibility is not probable, revenue is recognized as cash is collected.
In instances when any of the four criteria are not met, we defer recognition of product revenue until the criteria are met. When the sale of the software product requires us to make significant enhancements, customization or modifications to the software that are essential to its functionality, product revenue and consulting fees are recognized using contract accounting under
ASC 605-35, Revenue Recognition–Construction-Type and Production. We estimate the percentage-of-completion, under ASC 605-35, based on our estimate of total hours to complete the project as a percentage of total hours incurred and the estimated hours to complete as we have a history of accurately estimating project hours.
All fees billed to clients for shipping and handling are classi-fied as product revenue. All costs associated with shipping and handling are classified as cost of product revenue.
PRODUCT UPDATES, TECHNICAL SUPPORT AND SERVICES REVENUEProduct updates, technical support and services revenue repre-sents fees associated with the sale of product updates, training, and technical support, all except technical support provided on a when-and-if-available basis under our maintenance agree-ment. Payments for product updates, technical support and services on initial order or on renewal are generally made in advance and are nonrefundable. Product updates consist of the right to unspecified software updates on a when-and-if-available basis and are typically entered into in connection with the initial product purchase. Product updates, technical support and services may be renewed upon expiration of the term. Cus-tomers can purchase product updates separately from technical support and services. Revenue from product updates, technical support and services is deferred and recognized as revenue on a straight-line basis over the term of the maintenance agreement.
We allocate revenue under multiple-element arrangements, which typically include product, consulting services, training and maintenance agreements sold together, to each element in the arrangement primarily using the residual method based upon the fair value of the undelivered elements, which is spe-cific to our vendor-specific objective evidence of fair value, or VSOE. This means that we defer revenue from the arrangement fee equivalent to the fair value of the undelivered elements. We apply discounts, if any, to the delivered elements, usually product, under the residual method. For periodic unspecified product updates and technical support agreements, VSOE is based upon either the renewal rate specified in each contract or the price charged when sold separately. For consulting services and training for customers without a current maintenance agreement, VSOE is based upon the rates charged for these services when sold separately.
If we are unable to establish VSOE for an undelivered post con-tract support, or PCS, element, for example, in a two-year term license where the license term and PCS are coterminous and no PCS renewal period exists, all revenue is recognized ratably over the contract period. For income statement classification purposes, our allocation methodology is based on VSOE of fair value for our professional services which is determined by the price charged when sold separately, and the contractually stated renewal rates for our PCS, generally 18% to 21% of the license fee paid on perpetual licenses. We use the residual method to allocate any remaining arrangement fee to product revenue.
OPNET Technologies, Inc. 2012 Annual Report
12
PROFESSIONAL SERVICES REVENUEProfessional services revenue consists of fees from consult-ing services and training for customers without a current maintenance agreement and is recognized as the services are performed. Although not typical, if we enter into consulting service arrangements that include significant modifications to the software that are essential to the customer’s use and the arrangement is bundled with software, we recognize revenue under the entire arrangement under the percentage-of-com-pletion method. For income statement classification purposes, we have developed a revenue allocation methodology for these arrangements that is consistent with the residual method used, and described under ASC 605-985, when services are not essential to the functionality of the software. In these circum-stances, we allocate revenue to the various elements of the arrangement based on our VSOE of fair value and the residual amount is allocated to product revenue.
We sell product, product updates, technical support and ser-vices agreements to distributors at predetermined prices. Sales to distributors are not contingent upon resale of the software to the end user. In most cases, we provide product updates, technical support and services agreements directly to distribu-tors and the distributors provide support to the end customer. We record revenue from sales to distributors at the amounts charged to the distributor and in the same manner as product, product updates, technical support and services sales sold through our direct sales force. We classify amounts received in advance of revenue recognition as deferred revenue.
Sales taxes and other taxes collected from customers and remit-ted to governmental authorities are presented on a net basis and, as such, are excluded from revenues.
Income Taxes. We account for income taxes in accordance with ASC 740, Income Taxes. The income tax provision includes income taxes currently payable plus the net change during the year in deferred tax assets or liabilities. Under ASC 740, deferred tax assets and liabilities reflect the differences between the carrying value under GAAP and the tax basis of assets and liabilities using enacted statutory tax rates in effect for the period in which the differences are expected to reverse. Judgments and estimates are required in the calculation of the deferred tax assets, valuation allowance, research and develop-ment tax credits, and foreign tax credits.
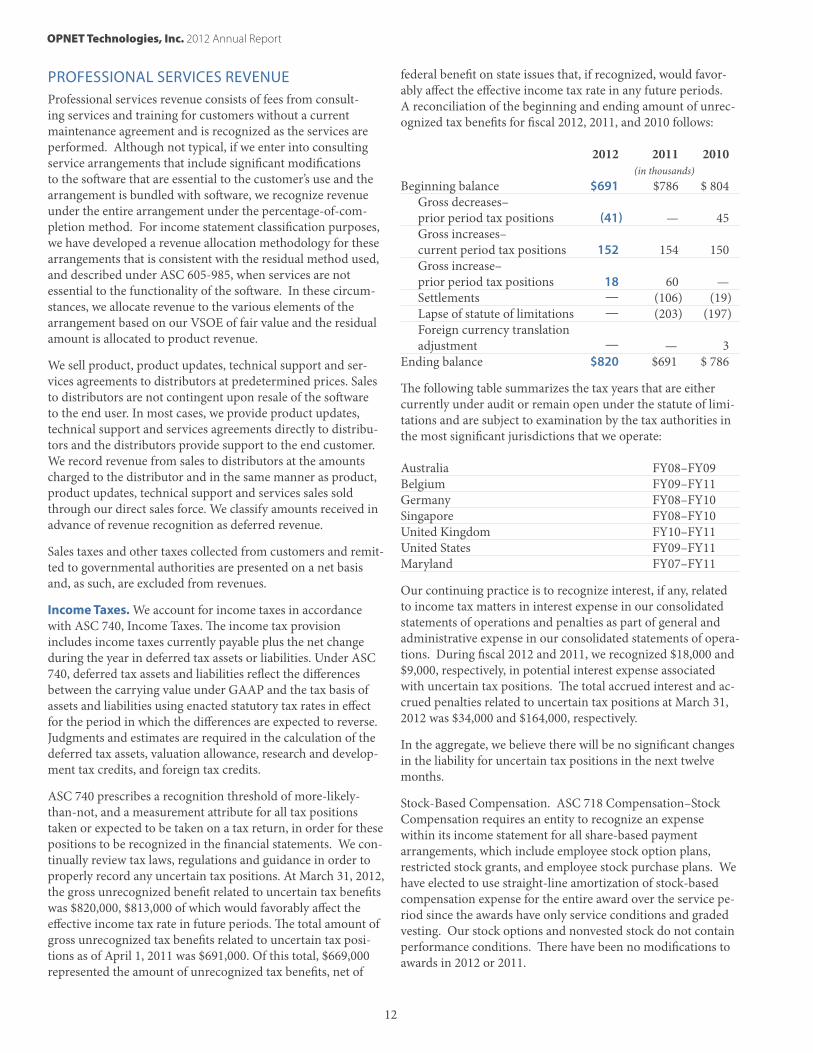
ASC 740 prescribes a recognition threshold of more-likely-than-not, and a measurement attribute for all tax positions taken or expected to be taken on a tax return, in order for these positions to be recognized in the financial statements. We con-tinually review tax laws, regulations and guidance in order to properly record any uncertain tax positions. At March 31, 2012, the gross unrecognized benefit related to uncertain tax benefits was $820,000, $813,000 of which would favorably affect the effective income tax rate in future periods. The total amount of gross unrecognized tax benefits related to uncertain tax posi-tions as of April 1, 2011 was $691,000. Of this total, $669,000 represented the amount of unrecognized tax benefits, net of
federal benefit on state issues that, if recognized, would favor-ably affect the effective income tax rate in any future periods. A reconciliation of the beginning and ending amount of unrec-ognized tax benefits for fiscal 2012, 2011, and 2010 follows:
2012 2011 2010 (in thousands)Beginning balance $691 $786 $ 804 Gross decreases– prior period tax positions (41) — 45 Gross increases– current period tax positions 152 154 150 Gross increase– prior period tax positions 18 60 — Settlements — (106) (19) Lapse of statute of limitations — (203) (197) Foreign currency translation adjustment — — 3Ending balance $820 $691 $ 786
The following table summarizes the tax years that are either currently under audit or remain open under the statute of limi-tations and are subject to examination by the tax authorities in the most significant jurisdictions that we operate:
Australia FY08–FY09Belgium FY09–FY11Germany FY08–FY10 Singapore FY08–FY10United Kingdom FY10–FY11United States FY09–FY11Maryland FY07–FY11
Our continuing practice is to recognize interest, if any, related to income tax matters in interest expense in our consolidated statements of operations and penalties as part of general and administrative expense in our consolidated statements of opera-tions. During fiscal 2012 and 2011, we recognized $18,000 and $9,000, respectively, in potential interest expense associated with uncertain tax positions. The total accrued interest and ac-crued penalties related to uncertain tax positions at March 31, 2012 was $34,000 and $164,000, respectively.
In the aggregate, we believe there will be no significant changes in the liability for uncertain tax positions in the next twelve months.
Stock-Based Compensation. ASC 718 Compensation–Stock Compensation requires an entity to recognize an expense within its income statement for all share-based payment arrangements, which include employee stock option plans, restricted stock grants, and employee stock purchase plans. We have elected to use straight-line amortization of stock-based compensation expense for the entire award over the service pe-riod since the awards have only service conditions and graded vesting. Our stock options and nonvested stock do not contain performance conditions. There have been no modifications to awards in 2012 or 2011.
OPNET Technologies, Inc. 2012 Annual Report
13
Our stock option grants are accounted for as equity awards. The expense is based on the grant-date fair value of the options granted, which we recognize over the requisite service period.
To estimate the grant-date fair value of our stock options, we used the Black-Scholes option-pricing model. The Black-Scholes model estimates the per share fair value of an option on its date of grant based on the following: the option’s exercise price; the price of the underlying stock on the date of grant; the estimated dividend yield; a “risk-free” interest rate; the estimat-ed option term; and the expected volatility. For the “risk-free” interest rate, we used a U.S. Treasury bond due in a number of years equal to the option’s expected term. To estimate expected volatility, we analyzed the historic volatility of our common stock. We did not grant any stock options during fiscal 2012. As of March 31, 2012, nonvested stock-based deferred com-pensation associated with the stock options totaled $504,000, which we expect to recognize over a weighted average period of 2 years.
We recognize compensation cost for stock option grants on a straight-line basis over the requisite service period for the entire award from the date of grant through the period of the last separately vesting portion of the grant. We recognize compen-sation cost within the income statement in the same expense line as the cash compensation paid to the respective employees. ASC 718 also requires us to estimate forfeitures in calculating the expense related to stock-based compensation. We have concluded that our historical forfeiture rate is the best measure to estimate future forfeitures of granted stock options. We will recognize the impact on compensation cost due to changes in the expected forfeiture rate of 10% in the period that they become known. We do not apply a forfeiture rate to the options granted to certain key executives or directors. We have con-cluded that historically certain key executives and directors will perform the requisite service to vest in the award.
We account for our restricted stock grants as equity awards. The expense is based on the price of our common stock, and is recognized on a straight-line basis over the requisite service period. The restricted stock agreements do not contain any post-vesting restrictions. We have concluded that our historical forfeiture rate is the best measure to estimate future forfeitures of granted restricted stock. We will recognize the impact on compensation cost due to changes in the expected forfeiture rate of 10% in the period that they become known. We do not apply a forfeiture rate to the restricted stock granted to certain key executives or directors. As of March 31, 2012, nonvested stock-based deferred compensation associated with restricted stock totaled $3.4 million, which we expect to recognize over a weighted average period of 1 year.
Our 2000 Employee Stock Purchase Plan, or ESPP, provides for all eligible employees to collectively purchase up to a total of 3,070,000 shares of our common stock. An employee may au-thorize a payroll deduction up to a maximum of 10% of his or her compensation during the plan period. The purchase price for each share purchased is the lesser of 85% of the closing price of the common stock on the first or last day of the plan period.
The plan period for the ESPP ends on the last day of January and July of each year. To estimate the fair value of shares issued under our ESPP, we use the Black-Scholes option-pricing mod-el. The Black-Scholes model estimates the per share fair value of an ESPP share at the beginning of the plan period based on the following: the price of the underlying stock on the first day of the plan period; the estimated dividend yield; a “risk-free” interest rate; the term of the plan period, which is six months; and the expected volatility. For the “risk-free” interest rate, we use a U.S. Treasury Bond due in six months. To determine expected volatility, we analyze the historical volatility of our stock over the 6 months prior to the first day of the plan period. We calculate the expense based on the difference between the fair market value of the shares purchased at the close of each plan period and the discounted price paid by the employee, and we recognize that expense on a straight-line basis over the plan period. As of March 31, 2012, nonvested stock-based deferred compensation associated with the ESPP totaled $324,000, which we expect to recognize over a weighted average period of 4 months.
Cash, Cash Equivalents, and Marketable Securities. We mea-sure our cash and cash equivalents using the fair value mea-surement principles of ASC 820 Fair Value Measurements and Disclosures, or ASC 820, which requires that fair value be based on the assumptions that market participants would use when pricing an asset or liability. ASC 820 requires disclosures re-garding the manner in which fair value is determined for assets and liabilities and establishes a three-tiered value hierarchy into which these assets and liabilities must be grouped, based upon significant levels of inputs as follows:
•Level 1–Quoted prices (unadjusted) in active markets for identical assets or liabilities.
•Level 2–Observable inputs, other than Level 1 prices, such as quoted prices in active markets for similar as-sets and liabilities in markets that are not active, or other inputs that are observable or can be corroborated by observ-able inputs.
•Level 3–Unobservable inputs that are supported by little or no market activity and that are significant to the fair value of the assets or liabilities. This includes certain pricing models, discounted cash flow methodologies and similar techniques that use significant unobservable inputs.
The lowest level of significant input determines the placement of the entire fair value measurement in the hierarchy. We view money market funds as Level 1 assets.
OPNET Technologies, Inc. 2012 Annual Report
14
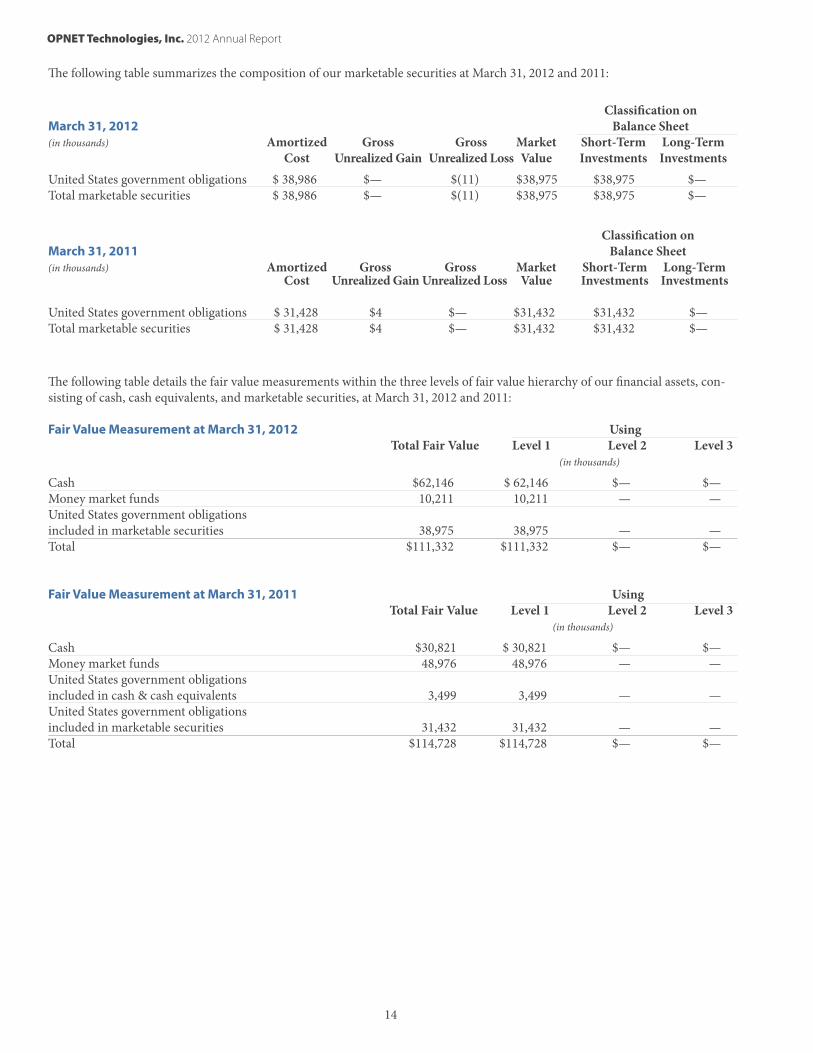
The following table summarizes the composition of our marketable securities at March 31, 2012 and 2011:
Classification on March 31, 2012 Balance Sheet(in thousands) Amortized Gross Gross Market Short-Term Long-Term Cost Unrealized Gain Unrealized Loss Value Investments Investments
United States government obligations $ 38,986 $— $(11) $38,975 $38,975 $—Total marketable securities $ 38,986 $— $(11) $38,975 $38,975 $— Classification on March 31, 2011 Balance Sheet(in thousands) Amortized Gross Gross Market Short-Term Long-Term Cost Unrealized Gain Unrealized Loss Value Investments Investments United States government obligations $ 31,428 $4 $— $31,432 $31,432 $—Total marketable securities $ 31,428 $4 $— $31,432 $31,432 $—
The following table details the fair value measurements within the three levels of fair value hierarchy of our financial assets, con-sisting of cash, cash equivalents, and marketable securities, at March 31, 2012 and 2011: Fair Value Measurement at March 31, 2012 Using Total Fair Value Level 1 Level 2 Level 3 (in thousands)
Cash $62,146 $ 62,146 $— $—Money market funds 10,211 10,211 — —United States government obligations included in marketable securities 38,975 38,975 — —Total $111,332 $111,332 $— $—
Fair Value Measurement at March 31, 2011 Using Total Fair Value Level 1 Level 2 Level 3 (in thousands)
Cash $30,821 $ 30,821 $— $—Money market funds 48,976 48,976 — —United States government obligations included in cash & cash equivalents 3,499 3,499 — —United States government obligations included in marketable securities 31,432 31,432 — —Total $114,728 $114,728 $— $—
OPNET Technologies, Inc. 2012 Annual Report
15
At March 31, 2012 and 2011, we valued money market funds and United States government obligations using a Level 1 valuation because market prices in active markets for identical assets were readily available. The per-share net asset value of our money market funds has remained at a constant amount of $1.00 per share. Also, as of March 31, 2012 and 2011, there were no withdrawal limits on redemptions for any of the money market funds that we hold. We did not group any financial assets using Level 2 or Level 3 valuations at March 31, 2012 or 2011.
Valuation of Intangible Assets and Goodwill. We account for our goodwill and intangible assets in accordance with ASC 805, Business Combinations and ASC 350, Intangibles–Goodwill and Other. Our intangible assets consist of acquired technology related to our acquisitions of a software product for modeling voice communications in December 2003, Altaworks in October 2004, technology we purchased from RadView Soft-ware, Ltd. in December 2005, SQMworks, Inc. in April 2006, Network Physics, Inc. in October 2007, and substantially all of the assets of Embarcadero Technologies, Inc. in August 2010. Our intangible assets also consist of customer relationships and acquired workforce assets we purchased from Network Phys-ics, Inc. related to the purchase of specified assets of Network Physics in October 2007 and trade names, trademark, customer relationships, and non-compete agreements we acquired from Embarcadero, Inc. related to the acquisition of substantially all the assets associated with the DSAuditor product line in August 2010. The acquired and purchased technologies are stated at the lower of unamortized cost or net realizable value and are amortized on a straight-line basis over their expected useful lives of three to five years. We amortize our customer relationship and workforce intangible assets we purchased from Network Physics, Inc. on an accelerated depreciation basis over their expected useful lives of four and one half years and five years, respectively. We amortize our trade names, trade-mark, customer relationships, and non-compete agreements we acquired from Embarcadero, Inc. on a straight-line basis over the expected useful lives. The trade names, trademark and customer relationships have useful lives of five years. The non-compete agreements have a useful life of one year.
We use the projected discounted cash flow method in valuing our acquired technology and purchased customer relation-ships using certain assumptions including revenue growth, cost levels, present value discount rate, and working capital requirements. We use the lower of the amount of cash paid or the present value of projected discounted cash flows to value purchased technology. We valued the workforce asset associ-ated with the purchase of specified assets of Network Physics, Inc. on a replacement cost basis. We valued the developed technology (now our DSAuditor product line) associated with the acquisition of substantially all of the assets of Embarcadero, Inc. using an income approach known as the Relief-From-Roy-alty Method. While we believe the assumptions used to value our acquired technology and developed technology related to acquisitions are reasonable, actual results will likely differ from those assumptions. Future cash flows are subject to change for
a variety of internal and external factors. We will periodically review the value of acquired technology, developed technology, and purchased intangible assets for impairment in accordance with ASC 360, Property, Plant and Equipment. If changes in our assumptions at the time of future periodic reviews indi-cate that the carrying value of our acquired technology and purchased intangible assets exceeds their fair value and we determine that carrying amounts cannot be recovered, it would result in impairment losses. As of March 31, 2012 and 2011, intangible assets totaled $3.0 million and $4.5 million, net of accumulated amortization of $14.1 million and $11.9 million, respectively. We have not recorded any impairment losses to date.
We record goodwill when the consideration paid for acquisi-tions exceeds the fair value of net tangible and intangible assets acquired. Goodwill is not amortized. We perform an an-nual review in the fourth quarter of each fiscal year, or more frequently if conditions dictate, to identify any facts or circum-stances that indicate the carrying value of goodwill is impaired. The review is based on various analyses including cash flow and profitability projections and the market capitalization of our common stock. Impairment, if any, is based on the excess of the carrying amount of goodwill over its fair value. We performed our annual impairment test of goodwill as of March 31, 2012 and 2011 and concluded that the fair value substan-tially exceeded the carrying value; therefore, we did not record any impairment. As of March 31, 2012 and 2011, goodwill was $15.4 million, respectively. No impairment losses have been recorded to date.
Accounting for Software Development Costs. We ex-pense costs incurred in the research and development of new software products as incurred until technological feasibility is established. Development costs are capitalized beginning when a product’s technological feasibility has been established and ending when the product is available for general release to our customers. Technological feasibility is reached when the prod-uct reaches the working model stage. To date, products and enhancements have generally reached technological feasibility and have been released for sale at substantially the same time, thus all research and development costs have been expensed. Consequently, we did not capitalize any research and develop-ment costs in fiscal 2012, 2011 or 2010.
OPNET Technologies, Inc. 2012 Annual Report
16
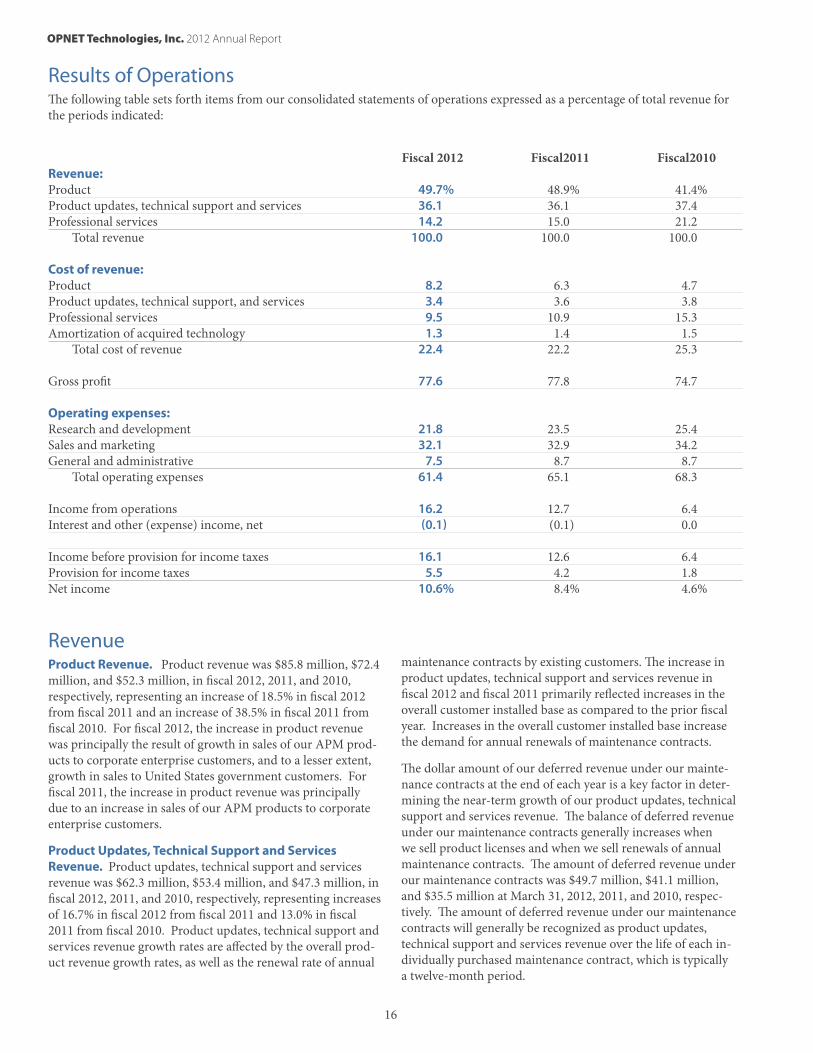
Results of Operations The following table sets forth items from our consolidated statements of operations expressed as a percentage of total revenue for the periods indicated:
Fiscal 2012 Fiscal2011 Fiscal2010 Revenue: Product 49.7% 48.9% 41.4%Product updates, technical support and services 36.1 36.1 37.4 Professional services 14.2 15.0 21.2 Total revenue 100.0 100.0 100.0 Cost of revenue: Product 8.2 6.3 4.7 Product updates, technical support, and services 3.4 3.6 3.8 Professional services 9.5 10.9 15.3 Amortization of acquired technology 1.3 1.4 1.5 Total cost of revenue 22.4 22.2 25.3 Gross profit 77.6 77.8 74.7 Operating expenses: Research and development 21.8 23.5 25.4 Sales and marketing 32.1 32.9 34.2 General and administrative 7.5 8.7 8.7 Total operating expenses 61.4 65.1 68.3 Income from operations 16.2 12.7 6.4 Interest and other (expense) income, net (0.1) (0.1) 0.0 Income before provision for income taxes 16.1 12.6 6.4 Provision for income taxes 5.5 4.2 1.8 Net income 10.6% 8.4% 4.6%
Revenue Product Revenue. Product revenue was $85.8 million, $72.4 million, and $52.3 million, in fiscal 2012, 2011, and 2010, respectively, representing an increase of 18.5% in fiscal 2012 from fiscal 2011 and an increase of 38.5% in fiscal 2011 from fiscal 2010. For fiscal 2012, the increase in product revenue was principally the result of growth in sales of our APM prod-ucts to corporate enterprise customers, and to a lesser extent, growth in sales to United States government customers. For fiscal 2011, the increase in product revenue was principally due to an increase in sales of our APM products to corporate enterprise customers.
Product Updates, Technical Support and Services Revenue. Product updates, technical support and services revenue was $62.3 million, $53.4 million, and $47.3 million, in fiscal 2012, 2011, and 2010, respectively, representing increases of 16.7% in fiscal 2012 from fiscal 2011 and 13.0% in fiscal 2011 from fiscal 2010. Product updates, technical support and services revenue growth rates are affected by the overall prod-uct revenue growth rates, as well as the renewal rate of annual
maintenance contracts by existing customers. The increase in product updates, technical support and services revenue in fiscal 2012 and fiscal 2011 primarily reflected increases in the overall customer installed base as compared to the prior fiscal year. Increases in the overall customer installed base increase the demand for annual renewals of maintenance contracts.
The dollar amount of our deferred revenue under our mainte-nance contracts at the end of each year is a key factor in deter-mining the near-term growth of our product updates, technical support and services revenue. The balance of deferred revenue under our maintenance contracts generally increases when we sell product licenses and when we sell renewals of annual maintenance contracts. The amount of deferred revenue under our maintenance contracts was $49.7 million, $41.1 million, and $35.5 million at March 31, 2012, 2011, and 2010, respec-tively. The amount of deferred revenue under our maintenance contracts will generally be recognized as product updates, technical support and services revenue over the life of each in-dividually purchased maintenance contract, which is typically a twelve-month period.
OPNET Technologies, Inc. 2012 Annual Report
17
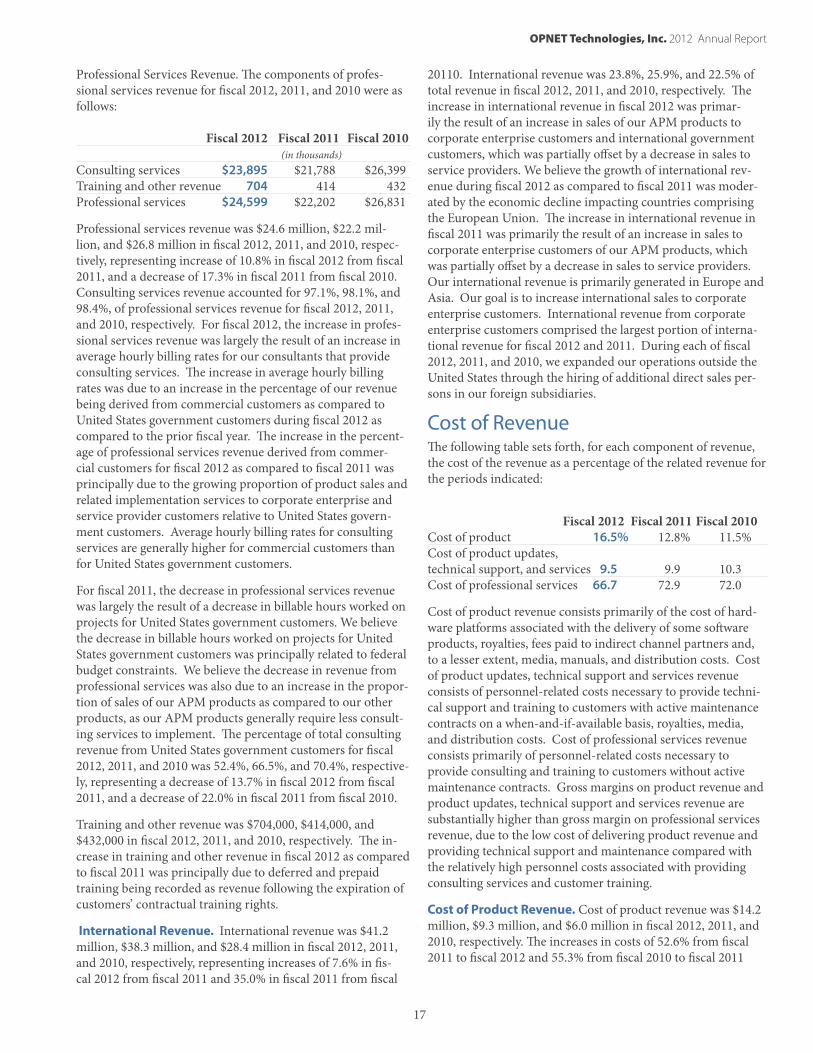
Professional Services Revenue. The components of profes-sional services revenue for fiscal 2012, 2011, and 2010 were as follows:
Fiscal 2012 Fiscal 2011 Fiscal 2010 (in thousands)Consulting services $23,895 $21,788 $26,399 Training and other revenue 704 414 432Professional services $24,599 $22,202 $26,831
Professional services revenue was $24.6 million, $22.2 mil-lion, and $26.8 million in fiscal 2012, 2011, and 2010, respec-tively, representing increase of 10.8% in fiscal 2012 from fiscal 2011, and a decrease of 17.3% in fiscal 2011 from fiscal 2010. Consulting services revenue accounted for 97.1%, 98.1%, and 98.4%, of professional services revenue for fiscal 2012, 2011, and 2010, respectively. For fiscal 2012, the increase in profes-sional services revenue was largely the result of an increase in average hourly billing rates for our consultants that provide consulting services. The increase in average hourly billing rates was due to an increase in the percentage of our revenue being derived from commercial customers as compared to United States government customers during fiscal 2012 as compared to the prior fiscal year. The increase in the percent-age of professional services revenue derived from commer-cial customers for fiscal 2012 as compared to fiscal 2011 was principally due to the growing proportion of product sales and related implementation services to corporate enterprise and service provider customers relative to United States govern-ment customers. Average hourly billing rates for consulting services are generally higher for commercial customers than for United States government customers.
For fiscal 2011, the decrease in professional services revenue was largely the result of a decrease in billable hours worked on projects for United States government customers. We believe the decrease in billable hours worked on projects for United States government customers was principally related to federal budget constraints. We believe the decrease in revenue from professional services was also due to an increase in the propor-tion of sales of our APM products as compared to our other products, as our APM products generally require less consult-ing services to implement. The percentage of total consulting revenue from United States government customers for fiscal 2012, 2011, and 2010 was 52.4%, 66.5%, and 70.4%, respective-ly, representing a decrease of 13.7% in fiscal 2012 from fiscal 2011, and a decrease of 22.0% in fiscal 2011 from fiscal 2010.
Training and other revenue was $704,000, $414,000, and $432,000 in fiscal 2012, 2011, and 2010, respectively. The in-crease in training and other revenue in fiscal 2012 as compared to fiscal 2011 was principally due to deferred and prepaid training being recorded as revenue following the expiration of customers’ contractual training rights.
International Revenue. International revenue was $41.2 million, $38.3 million, and $28.4 million in fiscal 2012, 2011, and 2010, respectively, representing increases of 7.6% in fis-cal 2012 from fiscal 2011 and 35.0% in fiscal 2011 from fiscal
20110. International revenue was 23.8%, 25.9%, and 22.5% of total revenue in fiscal 2012, 2011, and 2010, respectively. The increase in international revenue in fiscal 2012 was primar-ily the result of an increase in sales of our APM products to corporate enterprise customers and international government customers, which was partially offset by a decrease in sales to service providers. We believe the growth of international rev-enue during fiscal 2012 as compared to fiscal 2011 was moder-ated by the economic decline impacting countries comprising the European Union. The increase in international revenue in fiscal 2011 was primarily the result of an increase in sales to corporate enterprise customers of our APM products, which was partially offset by a decrease in sales to service providers. Our international revenue is primarily generated in Europe and Asia. Our goal is to increase international sales to corporate enterprise customers. International revenue from corporate enterprise customers comprised the largest portion of interna-tional revenue for fiscal 2012 and 2011. During each of fiscal 2012, 2011, and 2010, we expanded our operations outside the United States through the hiring of additional direct sales per-sons in our foreign subsidiaries.
Cost of Revenue
The following table sets forth, for each component of revenue, the cost of the revenue as a percentage of the related revenue for the periods indicated:
Fiscal 2012 Fiscal 2011 Fiscal 2010Cost of product 16.5% 12.8% 11.5%Cost of product updates, technical support, and services 9.5 9.9 10.3 Cost of professional services 66.7 72.9 72.0
Cost of product revenue consists primarily of the cost of hard-ware platforms associated with the delivery of some software products, royalties, fees paid to indirect channel partners and, to a lesser extent, media, manuals, and distribution costs. Cost of product updates, technical support and services revenue consists of personnel-related costs necessary to provide techni-cal support and training to customers with active maintenance contracts on a when-and-if-available basis, royalties, media, and distribution costs. Cost of professional services revenue consists primarily of personnel-related costs necessary to provide consulting and training to customers without active maintenance contracts. Gross margins on product revenue and product updates, technical support and services revenue are substantially higher than gross margin on professional services revenue, due to the low cost of delivering product revenue and providing technical support and maintenance compared with the relatively high personnel costs associated with providing consulting services and customer training.
Cost of Product Revenue. Cost of product revenue was $14.2 million, $9.3 million, and $6.0 million in fiscal 2012, 2011, and 2010, respectively. The increases in costs of 52.6% from fiscal 2011 to fiscal 2012 and 55.3% from fiscal 2010 to fiscal 2011
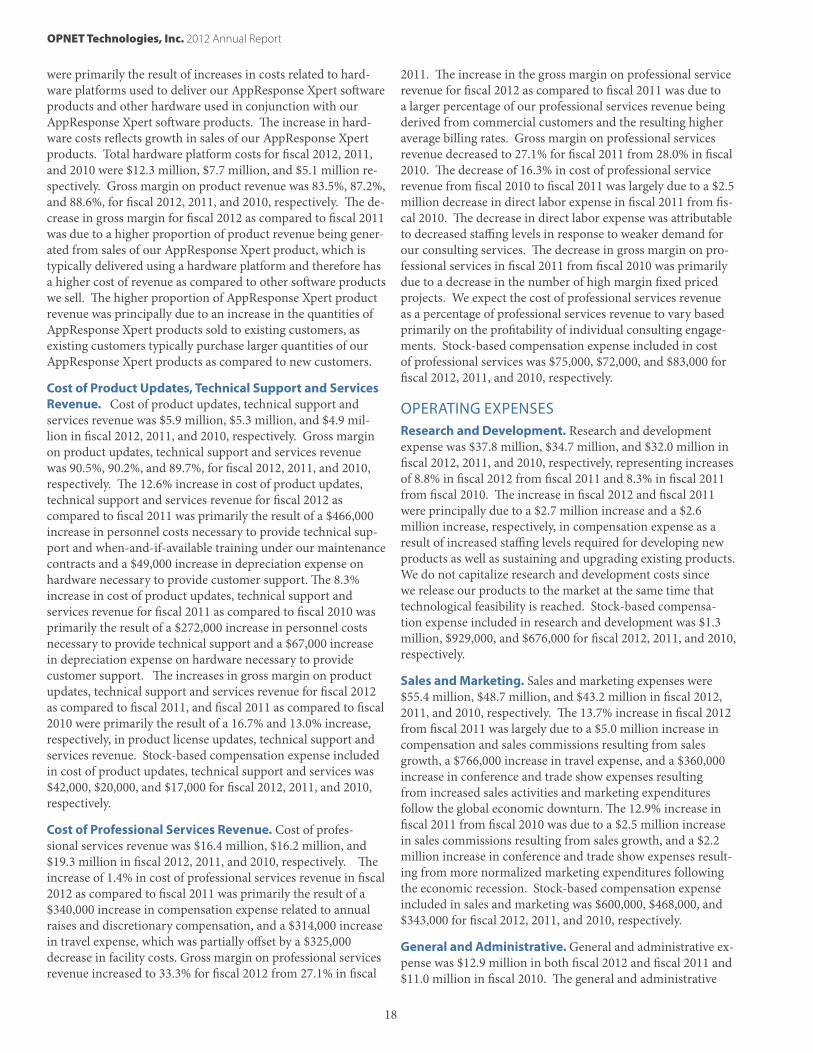
OPNET Technologies, Inc. 2012 Annual Report
18
were primarily the result of increases in costs related to hard-ware platforms used to deliver our AppResponse Xpert software products and other hardware used in conjunction with our AppResponse Xpert software products. The increase in hard-ware costs reflects growth in sales of our AppResponse Xpert products. Total hardware platform costs for fiscal 2012, 2011, and 2010 were $12.3 million, $7.7 million, and $5.1 million re-spectively. Gross margin on product revenue was 83.5%, 87.2%, and 88.6%, for fiscal 2012, 2011, and 2010, respectively. The de-crease in gross margin for fiscal 2012 as compared to fiscal 2011 was due to a higher proportion of product revenue being gener-ated from sales of our AppResponse Xpert product, which is typically delivered using a hardware platform and therefore has a higher cost of revenue as compared to other software products we sell. The higher proportion of AppResponse Xpert product revenue was principally due to an increase in the quantities of AppResponse Xpert products sold to existing customers, as existing customers typically purchase larger quantities of our AppResponse Xpert products as compared to new customers.
Cost of Product Updates, Technical Support and Services Revenue. Cost of product updates, technical support and services revenue was $5.9 million, $5.3 million, and $4.9 mil-lion in fiscal 2012, 2011, and 2010, respectively. Gross margin on product updates, technical support and services revenue was 90.5%, 90.2%, and 89.7%, for fiscal 2012, 2011, and 2010, respectively. The 12.6% increase in cost of product updates, technical support and services revenue for fiscal 2012 as compared to fiscal 2011 was primarily the result of a $466,000 increase in personnel costs necessary to provide technical sup-port and when-and-if-available training under our maintenance contracts and a $49,000 increase in depreciation expense on hardware necessary to provide customer support. The 8.3% increase in cost of product updates, technical support and services revenue for fiscal 2011 as compared to fiscal 2010 was primarily the result of a $272,000 increase in personnel costs necessary to provide technical support and a $67,000 increase in depreciation expense on hardware necessary to provide customer support. The increases in gross margin on product updates, technical support and services revenue for fiscal 2012 as compared to fiscal 2011, and fiscal 2011 as compared to fiscal 2010 were primarily the result of a 16.7% and 13.0% increase, respectively, in product license updates, technical support and services revenue. Stock-based compensation expense included in cost of product updates, technical support and services was $42,000, $20,000, and $17,000 for fiscal 2012, 2011, and 2010, respectively.
Cost of Professional Services Revenue. Cost of profes-sional services revenue was $16.4 million, $16.2 million, and $19.3 million in fiscal 2012, 2011, and 2010, respectively. The increase of 1.4% in cost of professional services revenue in fiscal 2012 as compared to fiscal 2011 was primarily the result of a $340,000 increase in compensation expense related to annual raises and discretionary compensation, and a $314,000 increase in travel expense, which was partially offset by a $325,000 decrease in facility costs. Gross margin on professional services revenue increased to 33.3% for fiscal 2012 from 27.1% in fiscal
2011. The increase in the gross margin on professional service revenue for fiscal 2012 as compared to fiscal 2011 was due to a larger percentage of our professional services revenue being derived from commercial customers and the resulting higher average billing rates. Gross margin on professional services revenue decreased to 27.1% for fiscal 2011 from 28.0% in fiscal 2010. The decrease of 16.3% in cost of professional service revenue from fiscal 2010 to fiscal 2011 was largely due to a $2.5 million decrease in direct labor expense in fiscal 2011 from fis-cal 2010. The decrease in direct labor expense was attributable to decreased staffing levels in response to weaker demand for our consulting services. The decrease in gross margin on pro-fessional services in fiscal 2011 from fiscal 2010 was primarily due to a decrease in the number of high margin fixed priced projects. We expect the cost of professional services revenue as a percentage of professional services revenue to vary based primarily on the profitability of individual consulting engage-ments. Stock-based compensation expense included in cost of professional services was $75,000, $72,000, and $83,000 for fiscal 2012, 2011, and 2010, respectively.
OPERATING EXPENSES Research and Development. Research and development expense was $37.8 million, $34.7 million, and $32.0 million in fiscal 2012, 2011, and 2010, respectively, representing increases of 8.8% in fiscal 2012 from fiscal 2011 and 8.3% in fiscal 2011 from fiscal 2010. The increase in fiscal 2012 and fiscal 2011 were principally due to a $2.7 million increase and a $2.6 million increase, respectively, in compensation expense as a result of increased staffing levels required for developing new products as well as sustaining and upgrading existing products. We do not capitalize research and development costs since we release our products to the market at the same time that technological feasibility is reached. Stock-based compensa-tion expense included in research and development was $1.3 million, $929,000, and $676,000 for fiscal 2012, 2011, and 2010, respectively.
Sales and Marketing. Sales and marketing expenses were $55.4 million, $48.7 million, and $43.2 million in fiscal 2012, 2011, and 2010, respectively. The 13.7% increase in fiscal 2012 from fiscal 2011 was largely due to a $5.0 million increase in compensation and sales commissions resulting from sales growth, a $766,000 increase in travel expense, and a $360,000 increase in conference and trade show expenses resulting from increased sales activities and marketing expenditures follow the global economic downturn. The 12.9% increase in fiscal 2011 from fiscal 2010 was due to a $2.5 million increase in sales commissions resulting from sales growth, and a $2.2 million increase in conference and trade show expenses result-ing from more normalized marketing expenditures following the economic recession. Stock-based compensation expense included in sales and marketing was $600,000, $468,000, and $343,000 for fiscal 2012, 2011, and 2010, respectively.
General and Administrative. General and administrative ex-pense was $12.9 million in both fiscal 2012 and fiscal 2011 and $11.0 million in fiscal 2010. The general and administrative
OPNET Technologies, Inc. 2012 Annual Report
19
expense remained flat in fiscal 2012 as compared to fiscal 2011 primarily due to a $1.3 million decrease in executive perfor-mance-based compensation expense and a $419,000 decrease in bad debt expense, which were offset by a $629,000 increase in compensation expense, a $514,000 increase in facility costs, a $378,000 increase in accounting and tax services, and an $81,000 increase non-capitalized hardware and software costs. The 17.6% increase in fiscal 2011 from fiscal 2010 was largely due to a $1.3 million increase in executive performance-based compensation expense, a $288,000 increase in accounting and tax services, and a $274,000 increase in bad debt expense. The increase in accounting and tax services included costs associ-ated with outside tax advisors working to address the audit of our fiscal 2007 federal tax returns, which was completed by the Internal Revenue Service, or IRS, in July 2010. Stock-based compensation expense included in general and administrative was $634,000, $495,000, and $440,000 for fiscal 2012, 2011, and 2010, respectively.
Interest and Other (Expense) Income, net. Interest and other (expense) income, net was an expense of $87,000, an expense of $151,000, and an expense of $70,000 for fiscal 2012, fiscal 2011, and fiscal 2010, respectively. The 42.4% decrease in expense in fiscal 2012 from fiscal 2011 was primarily the result of realized foreign currency gains, partially offset by a decrease in interest income. The 115.7% increase in expense in fiscal 2011 from fiscal 2010 was primarily the result of realized for-eign currency losses, which were partially offset by an increase in interest income.
Provision for Income Taxes. Our effective tax rate was 34.1%, 33.5%, and 27.5%, for fiscal 2012, 2011, and 2010, respectively. For fiscal 2012, 2011, and 2010, the effective tax rate differed from the statutory tax rate principally due to state income taxes, the difference between the U.S. and foreign tax rates, research and development credits, the domestic production activities deduction, and compensation expense booked under our ESPP which is not deductible for tax purposes. The increase in our effective tax rate in fiscal 2012 from fiscal 2011 and in fis-cal 2011 from fiscal 2010 was primarily due to a decrease in tax credits as a percentage of pre-tax net income. Future provisions for taxes will depend on, among other things, the mix and amount of worldwide income, the tax rates in effect for various tax jurisdic-tions and the amount of research and development tax credits, foreign tax credits and other items for which we are eligible.
Liquidity and Capital Resources As of March 31, 2012 and 2011, we had cash, cash equivalents and short-term marketable securities totaling $111.3 million and $114.7 million, respectively.
Cash provided by operating activities was $27.2 million, $26.7 million, and $21.8 million for fiscal 2012, 2011, and 2010, respectively. Cash provided by operating activities is primarily derived from net income, as adjusted for non-cash items such as depreciation and amortization expense, tax benefits from the exercise of employee stock options, and changes in oper-ating assets and liabilities. The increase in cash provided by
operating activities in fiscal 2012 from fiscal 2011 was primarily attributable to increases in net income and deferred revenue, which was partially offset by increase in accounts receivable and inventory. The increase in cash provided by operating activities in fiscal 2011 from fiscal 2010 was primarily attributable to in-creases in net income, deferred revenue and accrued liabilities.
Net cash used in investing activities was $13.2 million, $37.1 million and $2.6 million in fiscal 2012, fiscal 2011 and fis-cal 2010, respectively. Investing activities include the pur-chase, sale or maturity of marketable securities, acquisition of property and equipment, and net expenditures for business combinations and technology acquisitions. For fiscal 2012, we used funds of $61.5 million to purchase short-term marketable securities, and funds of $5.5 million to purchase property and equipment. We received proceeds of $53.9 million from the maturity of investments. For fiscal 2011, we used funds of $50.6 million to purchase short-term marketable securities, funds of $3.4 million to purchase property and equipment, and funds of $2.2 million to acquire substantially all the assets associated with the DSAuditor product line from Embarcadero Technolo-gies, Inc., a privately held software company headquartered in San Francisco, California. For fiscal 2010, we used funds of $3.1 million to purchase property and equipment, and funds of $433,000 to acquire technology. We received proceeds of $1.0 million from the maturity of investments.
Cash used in financing activities was $24.6 million, $11.3 million, $5.7 million in fiscal 2012, fiscal 2011, and fiscal 2010, respectively. We used $29.9 million during fiscal 2012 to pay a quarterly cash dividend of $0.12 per share to stockholders of re-cord on June 15, 2011, September 15, 2011, December 14, 2011, and March 14, 2012, and a special dividend of $0.85 per share to stockholders of record on December 1, 2011. We used $25.0 million during fiscal 2011 to pay a quarterly cash dividend of $0.10 per share to stockholders of record on June 15, 2010, Sep-tember 14, 2010, December 7, 2010, and March 16, 2011, and a special dividend of $0.75 per share to stockholders of record on November 14, 2010. We used $7.5 million during fiscal 2010 to pay a quarterly cash dividend of $0.09 per share to stockhold-ers of record on June 15, 2009, September 15, 2009, December 15, 2009, and March 15, 2010. We used cash of $1.1 million, $3.6 million, and $2.3 million to acquire 29,704, 223,399, and 186,550 shares of our common stock pursuant to our stock repurchase program during fiscal 2012, fiscal 2011, and fiscal 2010, respectively. During fiscal 2012, fiscal 2011, and fiscal 2010, 16,643, 27,261 and 26,352 shares, respectively, were with-held from employees to satisfy the minimum statutory tax with-holding obligations with respect to the income recognized by these employees upon the vesting of their restricted stock shares during the applicable period, during fiscal 2012, 13,061 shares were withheld in connection with net settlements of exercised stock options, and the remainder were purchased under our ongoing stock repurchase plan. Cash provided by financing ac-tivities reflects the proceeds received from the exercise of stock options and the sale of common stock under our employee stock purchase plan. During fiscal 2012, 2011, and 2010, we received proceeds of approximately $1.6 million, $14.2 million,
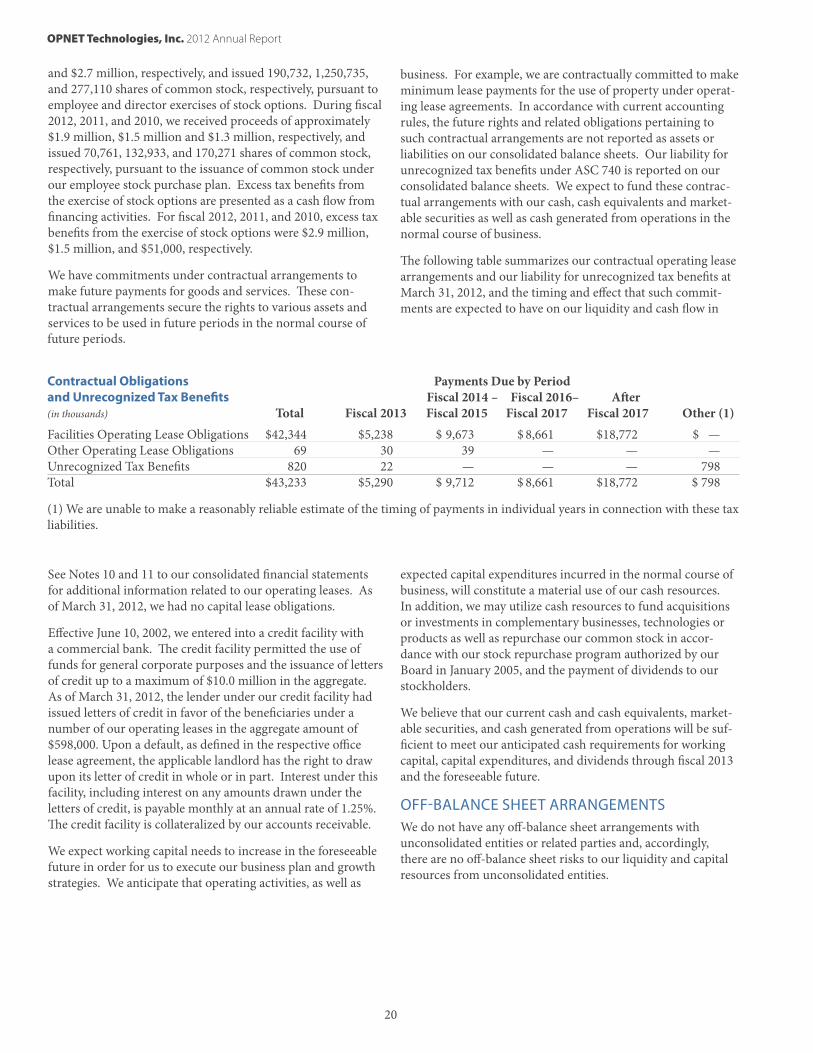
OPNET Technologies, Inc. 2012 Annual Report
20
and $2.7 million, respectively, and issued 190,732, 1,250,735, and 277,110 shares of common stock, respectively, pursuant to employee and director exercises of stock options. During fiscal 2012, 2011, and 2010, we received proceeds of approximately $1.9 million, $1.5 million and $1.3 million, respectively, and issued 70,761, 132,933, and 170,271 shares of common stock, respectively, pursuant to the issuance of common stock under our employee stock purchase plan. Excess tax benefits from the exercise of stock options are presented as a cash flow from financing activities. For fiscal 2012, 2011, and 2010, excess tax benefits from the exercise of stock options were $2.9 million, $1.5 million, and $51,000, respectively.
We have commitments under contractual arrangements to make future payments for goods and services. These con-tractual arrangements secure the rights to various assets and services to be used in future periods in the normal course of
business. For example, we are contractually committed to make minimum lease payments for the use of property under operat-ing lease agreements. In accordance with current accounting rules, the future rights and related obligations pertaining to such contractual arrangements are not reported as assets or liabilities on our consolidated balance sheets. Our liability for unrecognized tax benefits under ASC 740 is reported on our consolidated balance sheets. We expect to fund these contrac-tual arrangements with our cash, cash equivalents and market-able securities as well as cash generated from operations in the normal course of business.
The following table summarizes our contractual operating lease arrangements and our liability for unrecognized tax benefits at March 31, 2012, and the timing and effect that such commit-ments are expected to have on our liquidity and cash flow in
future periods.
Contractual Obligations Payments Due by Period and Unrecognized Tax Benefits Fiscal 2014 – Fiscal 2016– After(in thousands) Total Fiscal 2013 Fiscal 2015 Fiscal 2017 Fiscal 2017 Other (1)
Facilities Operating Lease Obligations $42,344 $5,238 $ 9,673 $ 8,661 $18,772 $ —Other Operating Lease Obligations 69 30 39 — — —Unrecognized Tax Benefits 820 22 — — — 798Total $43,233 $5,290 $ 9,712 $ 8,661 $18,772 $ 798
(1) We are unable to make a reasonably reliable estimate of the timing of payments in individual years in connection with these tax liabilities.
See Notes 10 and 11 to our consolidated financial statements for additional information related to our operating leases. As of March 31, 2012, we had no capital lease obligations.
Effective June 10, 2002, we entered into a credit facility with a commercial bank. The credit facility permitted the use of funds for general corporate purposes and the issuance of letters of credit up to a maximum of $10.0 million in the aggregate. As of March 31, 2012, the lender under our credit facility had issued letters of credit in favor of the beneficiaries under a number of our operating leases in the aggregate amount of $598,000. Upon a default, as defined in the respective office lease agreement, the applicable landlord has the right to draw upon its letter of credit in whole or in part. Interest under this facility, including interest on any amounts drawn under the letters of credit, is payable monthly at an annual rate of 1.25%. The credit facility is collateralized by our accounts receivable.
We expect working capital needs to increase in the foreseeable future in order for us to execute our business plan and growth strategies. We anticipate that operating activities, as well as
expected capital expenditures incurred in the normal course of business, will constitute a material use of our cash resources. In addition, we may utilize cash resources to fund acquisitions or investments in complementary businesses, technologies or products as well as repurchase our common stock in accor-dance with our stock repurchase program authorized by our Board in January 2005, and the payment of dividends to our stockholders.
We believe that our current cash and cash equivalents, market-able securities, and cash generated from operations will be suf-ficient to meet our anticipated cash requirements for working capital, capital expenditures, and dividends through fiscal 2013 and the foreseeable future.
OFF-BALANCE SHEET ARRANGEMENTSWe do not have any off-balance sheet arrangements with unconsolidated entities or related parties and, accordingly, there are no off-balance sheet risks to our liquidity and capital resources from unconsolidated entities.
OPNET Technologies, Inc. 2012 Annual Report
21
Recently Issued Accounting Pronouncements In December 2010, the FASB issued ASU 2010-29, “Disclo-sure of Supplementary Pro Forma Information for Business Combinations (as codified in ASC 805 “Business Combina-tions”). The objective of ASU 2010-29 is to address diversity in practice about the interpretation of the pro forma revenue and earnings disclosure requirements for business combina-tions. The amendments in this update specify that if a public entity presents comparative financial statements, the entity should disclose revenue and earnings of the combined entity as though the business combination that occurred during the year had occurred as of the beginning of the comparable prior annual reporting period only. The amendments also expand the supplemental pro forma disclosures under Topic 805 “Business Combinations” to include a description of the nature and amount of material, nonrecurring pro forma adjustments directly attributable to the business combination included in the reported pro forma revenue and earnings. ASU 2010-29 was effective for us prospectively for business combinations for which the acquisition date is on or after April 1, 2011. We will be impacted by ASU 2010-29 if it makes an acquisition that is accounted for as a business combination.
In May 2011, the FASB issued ASU 2011-04, “Fair Value Measurement: Amendments to Achieve Common Fair Value Measurement and Disclosure Requirements in U.S. GAAP and IFRSs”. ASU 2011-04 is mainly the result of the joint efforts by the FASB and the International Accounting Standards Board to develop a single, converged fair value framework on how to measure fair value and common disclosure requirements for fair value measurements. ASU 2011-04 amends various fair value guidance, such as specifying that the concept of high-est and best use and the concept of valuation premise in a fair value measurement are relevant only when measuring the fair value of nonfinancial assets. This guidance also prohibits the use of blockage factors and control premiums when measur-ing fair value. In addition, ASU 2011-04 expands disclosure requirements particularly for Level 3 inputs and requires disclosure of the level in the fair value hierarchy of items that are not measured at fair value in the statement of financial position but whose fair value must be disclosed. For many of the requirements, the FASB does not intend for the amend-ments in this Update to result in a change in the application of the requirements in ASC 820-10. Certain amendments change a particular principle or requirement for measuring fair value or for disclosing information about fair value measurements. ASU 2011-04 is effective prospectively for interim and annual periods beginning after December 15, 2011. The adoption of ASU 2011-04 did not impact our results of operations or finan-cial condition.
In June 2011, the FASB issued ASU 2011-05: Presentation of Comprehensive Income (ASU 2011-05). ASU 2011-05 amends current presentation guidance by eliminating the option for an entity to present the components of comprehensive income as part of the statement of changes in stockholder’s equity and requires presentation of comprehensive income in a single con-tinuous financial statement or in two separate but consecutive financial statements. The amendments in ASU 2011-05 do not change the items that must be reported in other comprehensive income or when an item of other comprehensive income must be reclassified to net income. In December 2011, the FASB issued ASU 2011-12, Comprehensive Income (Topic 220), Deferral of the Effective Date for Amendments to the Presenta-tion of Reclassifications of Items Out of Accumulated Other Comprehensive Income in ASU 2011-05, to defer the effective date of the specific requirement to present items that are reclas-sified out of accumulated other comprehensive income to net income alongside their respective components of net income and other comprehensive income. All other provisions of this update are effective for first annual reporting period beginning after December 15, 2011, which will be the reporting period beginning April 1, 2012 for us. We will adopt ASU 2011-05 in our first quarter fiscal 2013 financials. We do not expect the adoption of ASU 2011-05 to have a material impact on our con-solidated financial statements, but we do expect the adoption to change our presentation of other comprehensive income in the financial statements.
In September 2011, the FASB issued ASU 2011-08, “Testing Goodwill for Impairment”, which allows, but does not require, an entity when performing its annual goodwill impairment test the option to first do an initial assessment of qualitative factors to determine whether it is more likely than not that the fair value of a reporting unit is less than its carrying amount for purposes of determining whether it is even necessary to perform the first step of the two-step goodwill impairment test. Accordingly, based on the option created in ASU 2011-08 the calculation of a reporting unit’s fair value is not required unless, as a result of the qualitative assessment, it is more likely than not that fair value of the reporting unit is less than its carrying amount. In this case, the quantitative impairment test is required. ASU 2011-08 also provides for new qualita-tive indicators to replace those currently used. Prior to ASU 2011-08, entities were required to test goodwill for impairment on at least an annual basis, by first comparing the fair value of a reporting unit with its carrying amount (Step 1). If the fair value of a reporting unit is less than its carrying amount, then the second step of the test is performed to measure the amount of impairment loss, if any. ASU 2011-08 is effective for annual and interim goodwill impairment tests performed for fiscal years beginning after December 15, 2011, with early adoption permitted. The adoption of ASU 2011-08 will not impact our results of operations or financial condition.
OPNET Technologies, Inc. 2012 Annual Report
22
We consider all highly liquid investments purchased with an original maturity of three months or less to be cash equivalents, and those with maturities greater than three months are con-sidered to be marketable securities. Our cash equivalents and short-term marketable securities consist primarily of United States backed money market funds, United States Treasury bills, and United States Treasury notes with original maturities greater than three months and less than one year. We currently do not hedge interest rate exposure, but do not believe that an increase in interest rates would have a material effect on the value of our cash equivalents or marketable securities.
At March 31, 2012, we had $111.3 million in cash, cash equiva-lents, and marketable securities. As of March 31, 2011, we had $114.7 million in cash, cash equivalents, and marketable securi-ties. Based on our cash, cash equivalents, and marketable secu-rities as of March 31, 2012, a one percentage point increase or decrease in interest rates would increase or decrease our annual interest income and cash flows by approximately $1.1 million.
At March 31, 2012, $10.2 million of our $72.4 million in cash and cash equivalents was held in money market funds. The money market funds are predominately backed by United States government securities. The per-share net asset value of our money market funds has remained at a constant amount of $1.00 per share. Also, as of March 31, 2012, there were no withdrawal limits on redemptions for any of the money market funds that we hold.
Our consolidated financial statements are denominated in United States dollars and, accordingly, changes in the exchange rate between foreign currencies and the United States dollar will affect the translation of our subsidiaries’ financial results into United States dollars for purposes of reporting our consolidated
financial results. The accumulated currency translation adjust-ment, recorded as a separate component of stockholder’s equity, was a loss of $995,000 and a loss of $649,000 at March 31, 2012 and 2011, respectively. A majority of our revenue transactions outside the United States are denominated in local currencies and the majority of operating expenses associated with our for-eign subsidiaries are denominated in local currencies; therefore, our results of operations and financial condition are subject to fluctuations due to changes in foreign currency exchange rates, particularly changes in the British pound and the European Union euro. We currently do not hedge foreign exchange rate risk. Approximately 23.8%, 25.9%, and 22.5% of our total reve-nue for fiscal 2012, fiscal 2011, and fiscal 2010, respectively, was generated from outside of the United States. Due to the limited nature of our foreign operations, we do not believe that a 10% change in exchange rates would have a material effect on our business, financial condition, or results of operations. Based on our revenue and operating expenses denominated in foreign currencies during fiscal 2012, fiscal 2011, and fiscal 2010, a 10% increase or decrease in exchange rates would increase or de-crease our consolidated net income by approximately $272,000, $43,000, and $56,000, respectively.
At March 31, 2012, we had cumulative undistributed earnings of foreign subsidiaries, for which no United States income or foreign withholding taxes have been recorded, of approximately $7.1 million, which have been reinvested indefinitely. Deter-mination of the amount of unrecognized deferred tax liability with respect to such earnings is not practicable. The additional taxes on the earnings of foreign subsidiaries, if remitted, would be partially offset by United States tax credits for foreign taxes already paid.
QUANTITATIVE AND QUALITATIVE DISCLOSURES ABOUT MARKET RISK
OPNET Technologies, Inc. 2012 Annual Report
23
Management of OPNET Technologies, Inc. and its subsidiaries (the “Company”) is responsible for establishing and maintaining adequate internal control over financial reporting. Internal control over financial reporting is defined in Rule 13a-15(f) or 15d-15(f) promulgated under the Securities Exchange Act of 1934 as a process designed by, or under the supervision of, the com-pany’s principal executive and principal financial officers and effected by the Company’s Board of Directors, management and other personnel, to provide reasonable assurance regarding the reliability of financial reporting and the preparation of financial statements for external purposes in accordance with generally accepted accounting principles and includes those policies and procedures that:
(i) pertain to the maintenance of records that, in reasonable detail, accurately and fairly reflect the transactions and dispositions of the assets of the company;
(ii) provide reasonable assurance that transactions are recorded as necessary to permit preparation of financial statements in ac-cordance with generally accepted accounting principles, and that receipts and expenditures of the Company are being made only in accordance with authorization of management and directors of the Company; and
(iii) provide reasonable assurance regarding prevention or timely detection of unauthorized acquisition, use or disposition of our assets that could have a material effect on the financial statements.
Because of its inherent limitations, internal control over financial reporting may not prevent or detect misstatements. Also, pro-jections of any evaluation of effectiveness to future periods are subject to the risk that controls may become inadequate because of changes in conditions, or that the degree of compliance with the policies or procedures may deteriorate.
Our management assessed the effectiveness of our internal control over financial reporting as of March 31, 2012. In making this assessment, our management used the criteria set forth by the Committee of Sponsoring Organizations of the Treadway Com-mission (COSO) in Internal Control-Integrated Framework. Based on our assessment and those criteria, management concluded that the Company’s internal control over financial reporting was effective as of March 31, 2012.
Deloitte & Touche LLP has issued an attestation report on our internal control over financial reporting as of March 31, 2012. This report is included in the Report of Independent Registered Public Accounting Firm herein.
OPNET Technologies, Inc. June 7, 2012
MANAGEMENT’S REPORT ON INTERNAL CONTROL OVER FINANCIAL REPORTING
OPNET Technologies, Inc. 2012 Annual Report
24
To the Audit Committee and Stockholders of OPNET Technologies, Inc. Bethesda, Maryland
We have audited the internal control over financial reporting of OPNET Technologies, Inc., and its subsidiaries (the “Company”) as of March 31, 2012, based on the criteria established in Internal Control— Integrated Framework issued by the Committee of Sponsoring Organizations of the Treadway Commission. The Company’s management is responsible for maintaining effective internal control over financial reporting and for its assessment of the effectiveness of internal control over financial reporting, in-cluded in the accompanying Management’s Report on Internal Control Over Financial Reporting. Our responsibility is to express an opinion on the Company’s internal control over financial reporting based on our audit.
We conducted our audit in accordance with the standards of the Public Company Accounting Oversight Board (United States). Those standards require that we plan and perform the audit to obtain reasonable assurance about whether effective internal control over financial reporting was maintained in all material respects. Our audit included obtaining an understanding of internal control over financial reporting, assessing the risk that a material weakness exists, testing and evaluating the design and operating effec-tiveness of internal control based on the assessed risk, and performing such other procedures as we considered necessary in the circumstances. We believe that our audit provides a reasonable basis for our opinion.
A company’s internal control over financial reporting is a process designed by, or under the supervision of, the company’s principal executive and principal financial officers, or persons performing similar functions, and effected by the company’s board of direc-tors, management, and other personnel to provide reasonable assurance regarding the reliability of financial reporting and the preparation of financial statements for external purposes in accordance with generally accepted accounting principles. A compa-ny’s internal control over financial reporting includes those policies and procedures that (1) pertain to the maintenance of records that, in reasonable detail, accurately and fairly reflect the transactions and dispositions of the assets of the company; (2) provide reasonable assurance that transactions are recorded as necessary to permit preparation of financial statements in accordance with generally accepted accounting principles, and that receipts and expenditures of the company are being made only in accordance with authorizations of management and directors of the company; and (3) provide reasonable assurance regarding prevention or timely detection of unauthorized acquisition, use, or disposition of the company’s assets that could have a material effect on the financial statements.
Because of the inherent limitations of internal control over financial reporting, including the possibility of collusion or improper management override of controls, material misstatements due to error or fraud may not be prevented or detected on a timely basis. Also, projections of any evaluation of the effectiveness of the internal control over financial reporting to future periods are subject to the risk that the controls may become inadequate because of changes in conditions, or that the degree of compliance with the policies or procedures may deteriorate.
In our opinion, the Company maintained, in all material respects, effective internal control over financial reporting as of March 31, 2012, based on the criteria established in Internal Control— Integrated Framework issued by the Committee of Sponsoring Organizations of the Treadway Commission.
We have also audited, in accordance with the standards of the Public Company Accounting Oversight Board (United States), the consolidated financial statements as of and for the year ended March 31, 2012, of the Company and our report dated June 7, 2012, expressed an unqualified opinion on those consolidated financial statements.
DELOITTE & TOUCHE LLP McLean, Virginia June 7, 2012
REPORT OF INDEPENDENT REGISTERED PUBLIC ACCOUNTING FIRM

OPNET Technologies, Inc. 2012 Annual Report
25
To the Audit Committee and Stockholders of OPNET Technologies, Inc. Bethesda, Maryland
We have audited the accompanying consolidated balance sheets of OPNET Technologies, Inc., and its subsidiaries (the “Com-pany”) as of March 31, 2012 and 2011, and the related consolidated statements of operations, changes in stockholders’ equity, and cash flows for each of the three years in the period ended March 31, 2012. These consolidated financial statements are the respon-sibility of the Company’s management. Our responsibility is to express an opinion on these consolidated financial statements based on our audits.
We conducted our audits in accordance with the standards of the Public Company Accounting Oversight Board (United States). Those standards require that we plan and perform the audit to obtain reasonable assurance about whether the financial statements are free of material misstatement. An audit includes examining, on a test basis, evidence supporting the amounts and disclosures in the financial statements. An audit also includes assessing the accounting principles used and significant estimates made by man-agement, as well as evaluating the overall financial statement presentation. We believe that our audits provide a reasonable basis for our opinion.
In our opinion, such consolidated financial statements present fairly, in all material respects, the financial position of OPNET Technologies, Inc. and its subsidiaries as of March 31, 2012 and 2011, and the results of its operations and its cash flows for each of the three years in the period ended March 31, 2012, in conformity with accounting principles generally accepted in the United States of America.
We have also audited, in accordance with the standards of the Public Company Accounting Oversight Board (United States), the Company’s internal control over financial reporting as of March 31, 2012, based on the criteria established in Internal Control— Integrated Framework issued by the Committee of Sponsoring Organizations of the Treadway Commission and our report dated June 7, 2012, expressed an unqualified opinion on the effectiveness of the Company’s internal control over financial reporting.
DELOITTE & TOUCHE LLP McLean, Virginia June 7, 2012
REPORT OF INDEPENDENT REGISTERED PUBLIC ACCOUNTING FIRM
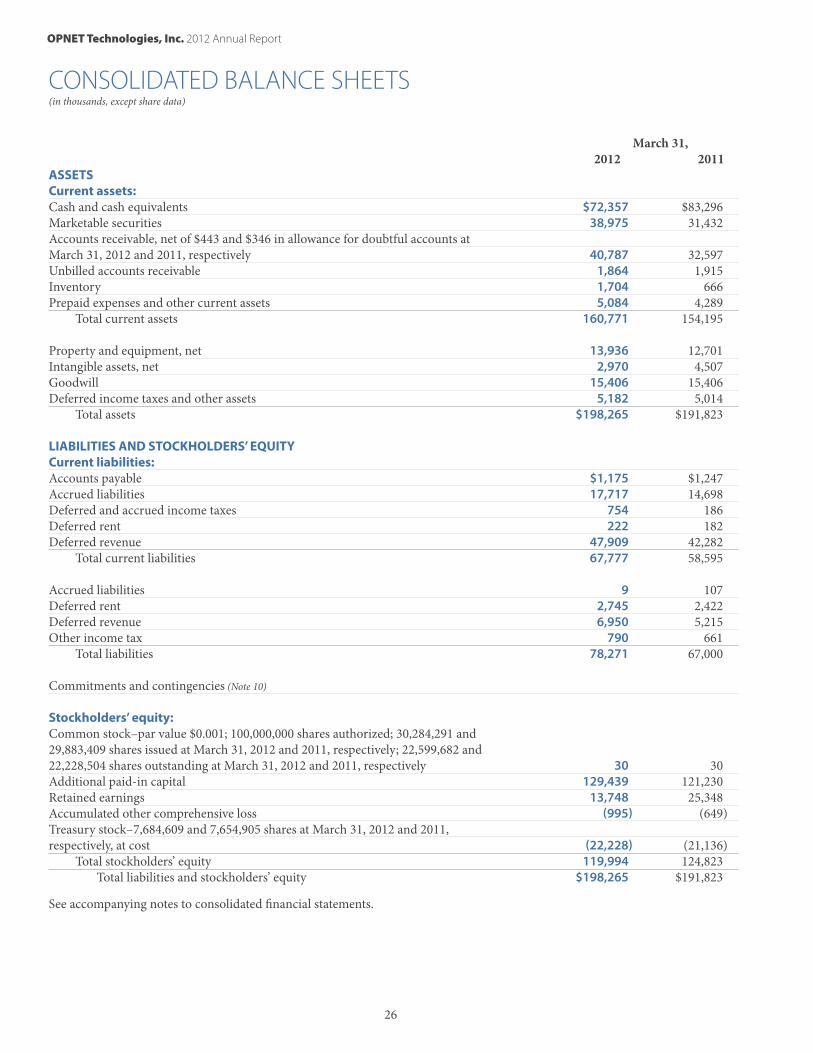
OPNET Technologies, Inc. 2012 Annual Report
26
CONSOLIDATED BALANCE SHEETS (in thousands, except share data)
March 31, 2012 2011ASSETS Current assets: Cash and cash equivalents $72,357 $83,296Marketable securities 38,975 31,432Accounts receivable, net of $443 and $346 in allowance for doubtful accounts at March 31, 2012 and 2011, respectively 40,787 32,597Unbilled accounts receivable 1,864 1,915Inventory 1,704 666Prepaid expenses and other current assets 5,084 4,289 Total current assets 160,771 154,195 Property and equipment, net 13,936 12,701Intangible assets, net 2,970 4,507Goodwill 15,406 15,406Deferred income taxes and other assets 5,182 5,014 Total assets $198,265 $191,823 LIABILITIES AND STOCKHOLDERS’ EQUITY Current liabilities: Accounts payable $1,175 $1,247Accrued liabilities 17,717 14,698Deferred and accrued income taxes 754 186Deferred rent 222 182Deferred revenue 47,909 42,282 Total current liabilities 67,777 58,595 Accrued liabilities 9 107Deferred rent 2,745 2,422Deferred revenue 6,950 5,215Other income tax 790 661 Total liabilities 78,271 67,000 Commitments and contingencies (Note 10) Stockholders’ equity: Common stock–par value $0.001; 100,000,000 shares authorized; 30,284,291 and 29,883,409 shares issued at March 31, 2012 and 2011, respectively; 22,599,682 and 22,228,504 shares outstanding at March 31, 2012 and 2011, respectively 30 30Additional paid-in capital 129,439 121,230Retained earnings 13,748 25,348Accumulated other comprehensive loss (995) (649)Treasury stock–7,684,609 and 7,654,905 shares at March 31, 2012 and 2011, respectively, at cost (22,228) (21,136) Total stockholders’ equity 119,994 124,823 Total liabilities and stockholders’ equity $198,265 $191,823
See accompanying notes to consolidated financial statements.
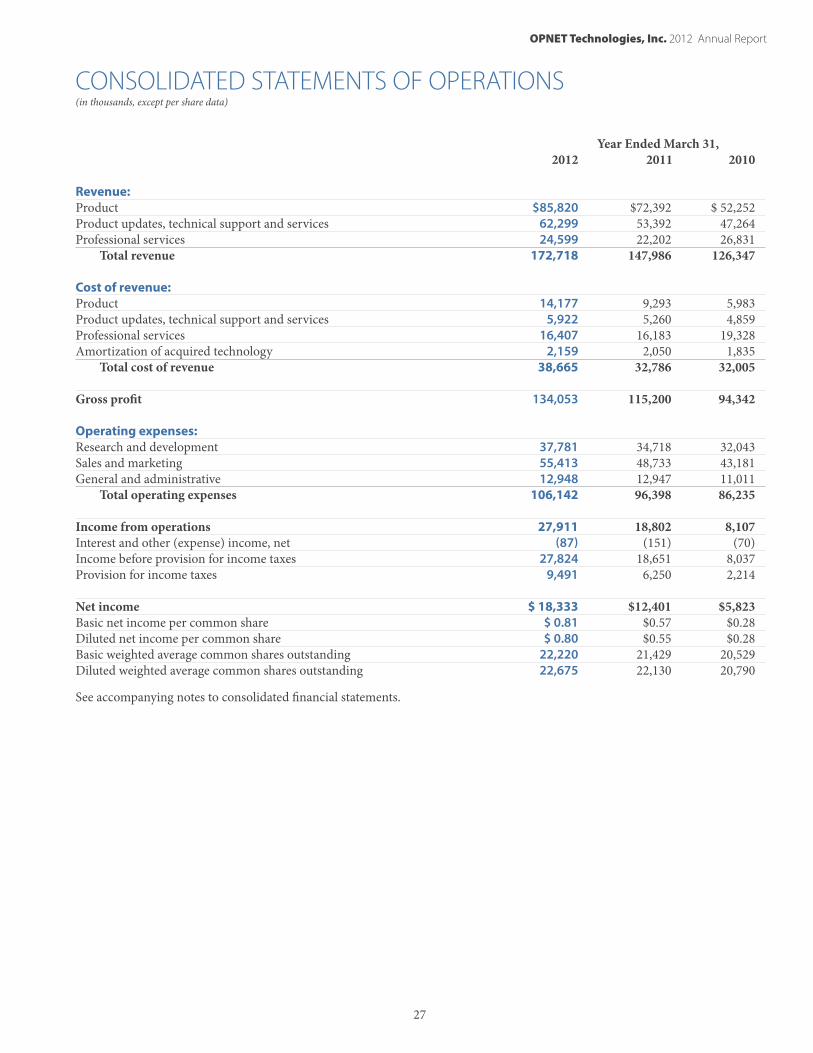
OPNET Technologies, Inc. 2012 Annual Report
27
CONSOLIDATED STATEMENTS OF OPERATIONS (in thousands, except per share data)
Year Ended March 31, 2012 2011 2010 Revenue: Product $85,820 $72,392 $ 52,252Product updates, technical support and services 62,299 53,392 47,264Professional services 24,599 22,202 26,831 Total revenue 172,718 147,986 126,347 Cost of revenue: Product 14,177 9,293 5,983Product updates, technical support and services 5,922 5,260 4,859Professional services 16,407 16,183 19,328Amortization of acquired technology 2,159 2,050 1,835 Total cost of revenue 38,665 32,786 32,005
Gross profit 134,053 115,200 94,342 Operating expenses: Research and development 37,781 34,718 32,043Sales and marketing 55,413 48,733 43,181General and administrative 12,948 12,947 11,011 Total operating expenses 106,142 96,398 86,235 Income from operations 27,911 18,802 8,107Interest and other (expense) income, net (87) (151) (70)Income before provision for income taxes 27,824 18,651 8,037Provision for income taxes 9,491 6,250 2,214 Net income $ 18,333 $12,401 $5,823Basic net income per common share $ 0.81 $0.57 $0.28Diluted net income per common share $ 0.80 $0.55 $0.28Basic weighted average common shares outstanding 22,220 21,429 20,529Diluted weighted average common shares outstanding 22,675 22,130 20,790
See accompanying notes to consolidated financial statements.
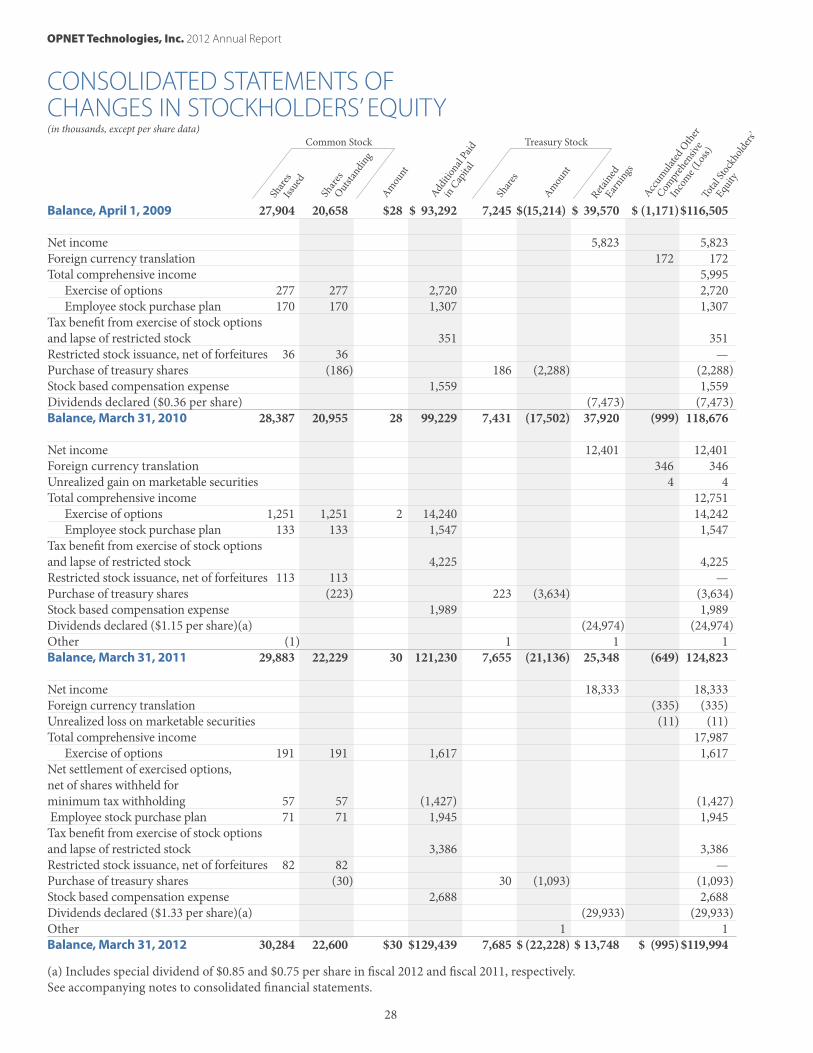
OPNET Technologies, Inc. 2012 Annual Report
28
CONSOLIDATED STATEMENTS OF CHANGES IN STOCKHOLDERS’ EQUITY (in thousands, except per share data)
Balance, April 1, 2009 27,904 20,658 $28 $ 93,292 7,245 $(15,214) $ 39,570 $ (1,171) $116,505 Net income 5,823 5,823Foreign currency translation 172 172Total comprehensive income 5,995 Exercise of options 277 277 2,720 2,720 Employee stock purchase plan 170 170 1,307 1,307Tax benefit from exercise of stock options and lapse of restricted stock 351 351Restricted stock issuance, net of forfeitures 36 36 —Purchase of treasury shares (186) 186 (2,288) (2,288)Stock based compensation expense 1,559 1,559Dividends declared ($0.36 per share) (7,473) (7,473)Balance, March 31, 2010 28,387 20,955 28 99,229 7,431 (17,502) 37,920 (999) 118,676 Net income 12,401 12,401Foreign currency translation 346 346Unrealized gain on marketable securities 4 4Total comprehensive income 12,751 Exercise of options 1,251 1,251 2 14,240 14,242 Employee stock purchase plan 133 133 1,547 1,547Tax benefit from exercise of stock options and lapse of restricted stock 4,225 4,225Restricted stock issuance, net of forfeitures 113 113 —Purchase of treasury shares (223) 223 (3,634) (3,634)Stock based compensation expense 1,989 1,989Dividends declared ($1.15 per share)(a) (24,974) (24,974)Other (1) 1 1 1Balance, March 31, 2011 29,883 22,229 30 121,230 7,655 (21,136) 25,348 (649) 124,823 Net income 18,333 18,333Foreign currency translation (335) (335)Unrealized loss on marketable securities (11) (11)Total comprehensive income 17,987 Exercise of options 191 191 1,617 1,617Net settlement of exercised options, net of shares withheld for minimum tax withholding 57 57 (1,427) (1,427) Employee stock purchase plan 71 71 1,945 1,945Tax benefit from exercise of stock options and lapse of restricted stock 3,386 3,386Restricted stock issuance, net of forfeitures 82 82 —Purchase of treasury shares (30) 30 (1,093) (1,093)Stock based compensation expense 2,688 2,688Dividends declared ($1.33 per share)(a) (29,933) (29,933)Other 1 1Balance, March 31, 2012 30,284 22,600 $30 $129,439 7,685 $ (22,228) $ 13,748 $ (995) $119,994
(a) Includes special dividend of $0.85 and $0.75 per share in fiscal 2012 and fiscal 2011, respectively. See accompanying notes to consolidated financial statements.
Share
s Iss
ued
Shar
es Out
stand
ing
Amou
nt
Share
s
Amou
nt
Additi
onal
Paid
in C
apita
l
Retain
ed
Earning
s
Accum
ulated
Oth
er
Compr
ehen
sive
Inco
me (
Loss)
Total
Stoc
khold
ers’
Equity
Common Stock Treasury Stock
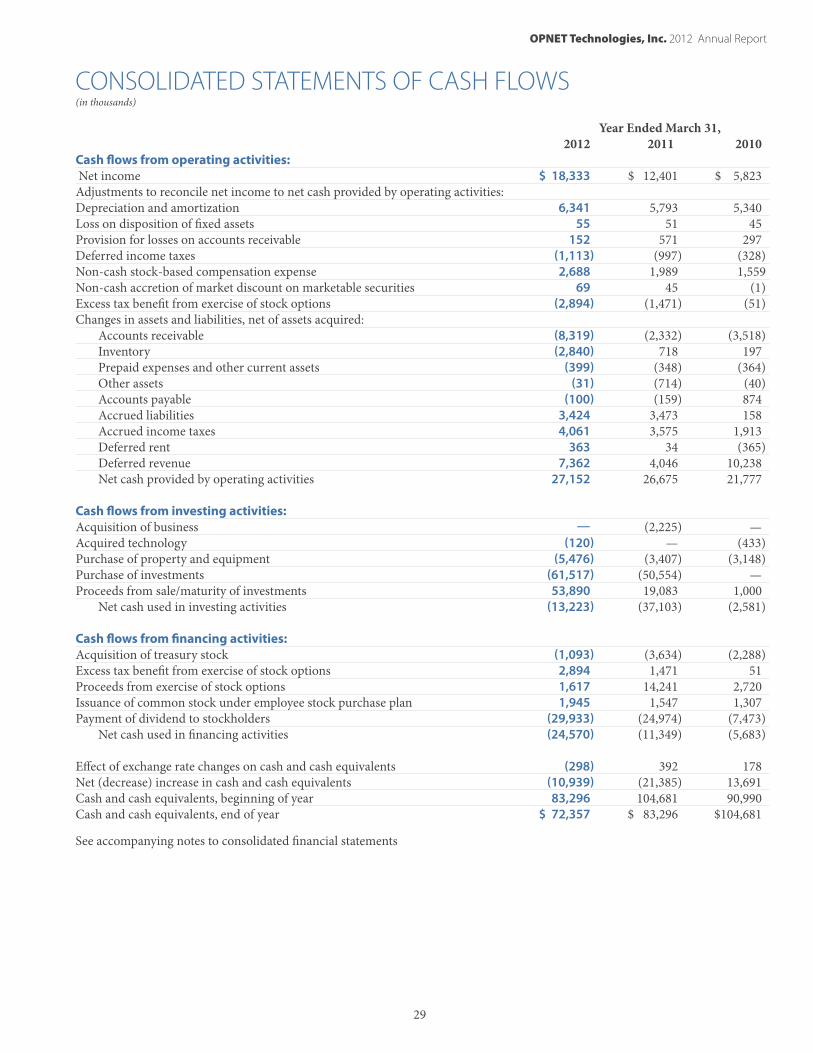
OPNET Technologies, Inc. 2012 Annual Report
29
Share
s Iss
ued
Shar
es Out
stand
ing
Amou
nt
Share
s
Amou
nt
CONSOLIDATED STATEMENTS OF CASH FLOWS (in thousands)
Year Ended March 31, 2012 2011 2010Cash flows from operating activities: Net income $ 18,333 $ 12,401 $ 5,823Adjustments to reconcile net income to net cash provided by operating activities: Depreciation and amortization 6,341 5,793 5,340Loss on disposition of fixed assets 55 51 45Provision for losses on accounts receivable 152 571 297Deferred income taxes (1,113) (997) (328)Non-cash stock-based compensation expense 2,688 1,989 1,559Non-cash accretion of market discount on marketable securities 69 45 (1)Excess tax benefit from exercise of stock options (2,894) (1,471) (51)Changes in assets and liabilities, net of assets acquired: Accounts receivable (8,319) (2,332) (3,518) Inventory (2,840) 718 197 Prepaid expenses and other current assets (399) (348) (364) Other assets (31) (714) (40) Accounts payable (100) (159) 874 Accrued liabilities 3,424 3,473 158 Accrued income taxes 4,061 3,575 1,913 Deferred rent 363 34 (365) Deferred revenue 7,362 4,046 10,238 Net cash provided by operating activities 27,152 26,675 21,777 Cash flows from investing activities: Acquisition of business — (2,225) —Acquired technology (120) — (433)Purchase of property and equipment (5,476) (3,407) (3,148)Purchase of investments (61,517) (50,554) —Proceeds from sale/maturity of investments 53,890 19,083 1,000 Net cash used in investing activities (13,223) (37,103) (2,581) Cash flows from financing activities: Acquisition of treasury stock (1,093) (3,634) (2,288)Excess tax benefit from exercise of stock options 2,894 1,471 51Proceeds from exercise of stock options 1,617 14,241 2,720Issuance of common stock under employee stock purchase plan 1,945 1,547 1,307Payment of dividend to stockholders (29,933) (24,974) (7,473) Net cash used in financing activities (24,570) (11,349) (5,683) Effect of exchange rate changes on cash and cash equivalents (298) 392 178 Net (decrease) increase in cash and cash equivalents (10,939) (21,385) 13,691Cash and cash equivalents, beginning of year 83,296 104,681 90,990Cash and cash equivalents, end of year $ 72,357 $ 83,296 $104,681
See accompanying notes to consolidated financial statements
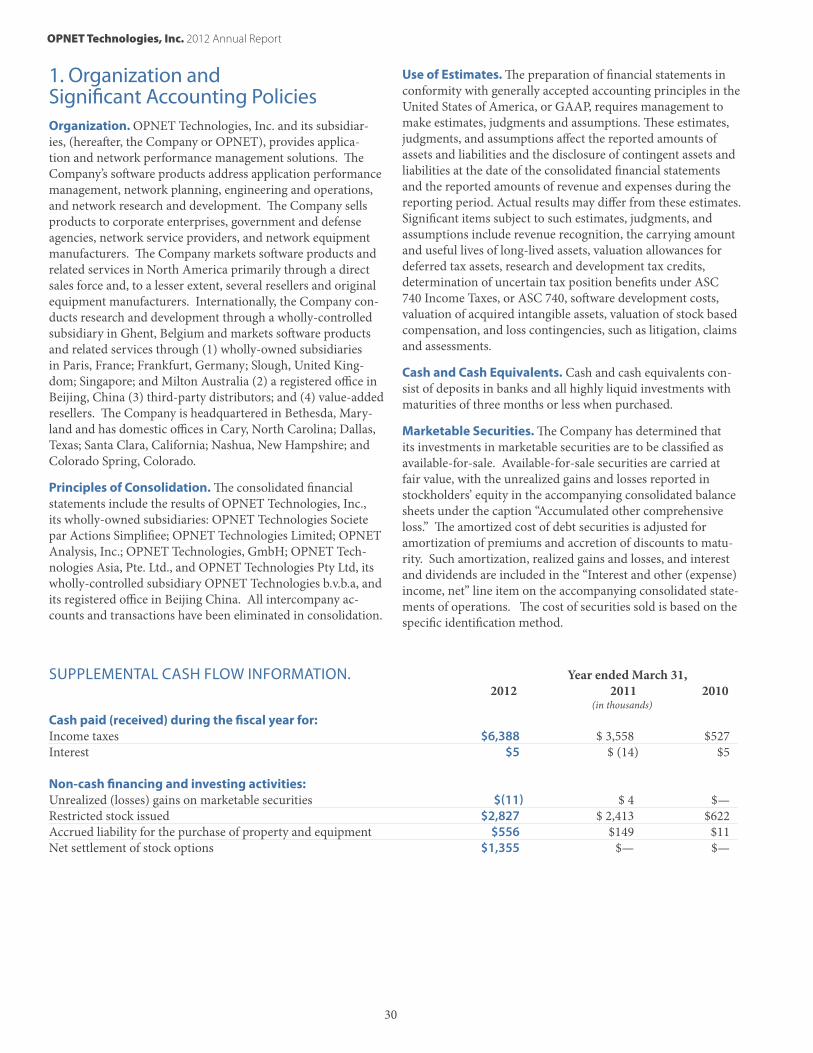
OPNET Technologies, Inc. 2012 Annual Report
30
1. Organization and Significant Accounting Policies Organization. OPNET Technologies, Inc. and its subsidiar-ies, (hereafter, the Company or OPNET), provides applica-tion and network performance management solutions. The Company’s software products address application performance management, network planning, engineering and operations, and network research and development. The Company sells products to corporate enterprises, government and defense agencies, network service providers, and network equipment manufacturers. The Company markets software products and related services in North America primarily through a direct sales force and, to a lesser extent, several resellers and original equipment manufacturers. Internationally, the Company con-ducts research and development through a wholly-controlled subsidiary in Ghent, Belgium and markets software products and related services through (1) wholly-owned subsidiaries in Paris, France; Frankfurt, Germany; Slough, United King-dom; Singapore; and Milton Australia (2) a registered office in Beijing, China (3) third-party distributors; and (4) value-added resellers. The Company is headquartered in Bethesda, Mary-land and has domestic offices in Cary, North Carolina; Dallas, Texas; Santa Clara, California; Nashua, New Hampshire; and Colorado Spring, Colorado.
Principles of Consolidation. The consolidated financial statements include the results of OPNET Technologies, Inc., its wholly-owned subsidiaries: OPNET Technologies Societe par Actions Simplifiee; OPNET Technologies Limited; OPNET Analysis, Inc.; OPNET Technologies, GmbH; OPNET Tech-nologies Asia, Pte. Ltd., and OPNET Technologies Pty Ltd, its wholly-controlled subsidiary OPNET Technologies b.v.b.a, and its registered office in Beijing China. All intercompany ac-counts and transactions have been eliminated in consolidation.
Use of Estimates. The preparation of financial statements in conformity with generally accepted accounting principles in the United States of America, or GAAP, requires management to make estimates, judgments and assumptions. These estimates, judgments, and assumptions affect the reported amounts of assets and liabilities and the disclosure of contingent assets and liabilities at the date of the consolidated financial statements and the reported amounts of revenue and expenses during the reporting period. Actual results may differ from these estimates. Significant items subject to such estimates, judgments, and assumptions include revenue recognition, the carrying amount and useful lives of long-lived assets, valuation allowances for deferred tax assets, research and development tax credits, determination of uncertain tax position benefits under ASC 740 Income Taxes, or ASC 740, software development costs, valuation of acquired intangible assets, valuation of stock based compensation, and loss contingencies, such as litigation, claims and assessments.
Cash and Cash Equivalents. Cash and cash equivalents con-sist of deposits in banks and all highly liquid investments with maturities of three months or less when purchased.
Marketable Securities. The Company has determined that its investments in marketable securities are to be classified as available-for-sale. Available-for-sale securities are carried at fair value, with the unrealized gains and losses reported in stockholders’ equity in the accompanying consolidated balance sheets under the caption “Accumulated other comprehensive loss.” The amortized cost of debt securities is adjusted for amortization of premiums and accretion of discounts to matu-rity. Such amortization, realized gains and losses, and interest and dividends are included in the “Interest and other (expense) income, net” line item on the accompanying consolidated state-ments of operations. The cost of securities sold is based on the specific identification method.
SUPPLEMENTAL CASH FLOW INFORMATION. Year ended March 31, 2012 2011 2010 (in thousands)Cash paid (received) during the fiscal year for: Income taxes $6,388 $ 3,558 $527 Interest $5 $ (14) $5
Non-cash financing and investing activities: Unrealized (losses) gains on marketable securities $(11) $ 4 $—Restricted stock issued $2,827 $ 2,413 $622Accrued liability for the purchase of property and equipment $556 $149 $11Net settlement of stock options $1,355 $— $—
OPNET Technologies, Inc. 2012 Annual Report
31
Advertising Expense. Advertising costs are expensed when incurred. Advertising expense for fiscal 2012, 2011, and 2010 was $752,000, $556,000, and $497,000, respectively.
Concentration of Credit Risk. Financial instruments that potentially subject the Company to a concentration of credit risk consist principally of cash, cash equivalents, marketable securities and accounts receivable. The Company generally does not require collateral on accounts receivable, as the majority of its customers are large, well-established companies or govern-ment entities.
The Company maintains its cash balances at several financial institutions. The Federal Deposit Insurance Corporation fully insures the non-interest bearing bank accounts and interest bearing accounts up to $250,000. Although the Company’s in-terest bearing balances exceed $250,000, the Company has not experienced any losses in such accounts and believes it is not exposed to any significant credit risk related to cash.
The Company’s cash equivalents and short-term marketable securities consist primarily of United States backed money market funds and securities with short-term maturities. The per-share net asset value of the Company’s money market funds has remained at a constant amount of $1.00 per share. Also, as of March 31, 2012 and 2011, there were no withdrawal limits on redemptions for any of the money market funds that the Company held. Accordingly, the Company has no quantitative information concerning the market risks and believes that the risk is minimal.
Fair Value of Financial Instruments. The fair value of the Company’s accounts receivable, accounts payable, and accrued expenses approximates their respective carrying amounts.
The Company measures its cash equivalents and marketable se-curities using the fair value measurement principles of ASC 820 Fair Value Measurements and Disclosures, or ASC 820, which requires that fair value be based on the assumptions that market participants would use when pricing an asset or liability.
ASC 820 requires disclosures regarding the manner in which fair value is determined for assets and liabilities and establishes a three-tiered fair value hierarchy into which these assets and liabilities must be grouped, based upon significant levels of inputs as follows:
•Level 1–Quoted prices (unadjusted) in active markets for identical assets or liabilities.
•Level 2–Observable inputs, other than Level 1 prices, such as quoted prices in active markets for similar as-sets and liabilities in markets that are not active, or other inputs that are observable or can be corroborated by observ-able inputs.
•Level 3–Unobservable inputs that are supported by little or no market activity and that are significant to the fair value of the assets or liabilities. This includes certain pricing models, discounted cash flow methodologies and similar techniques that use significant unobservable inputs.
The lowest level of significant input determines the placement of the entire fair value measurement in the hierarchy.
Software Development Costs. Development costs incurred in the research and development of new software products and enhancements to existing software products are expensed as incurred until technological feasibility has been established. The Company considers technological feasibility to be established when all planning, designing, coding, and testing has been completed according to design specifications. After techno-logical feasibility has been established, any additional costs are capitalized in accordance with ASC 985 Software, or ASC 985. Through March 31, 2012, software development has been substantially completed concurrently with the establishment of technological feasibility and, accordingly, no costs have been capitalized to date.
Property and Equipment. Property and equipment are stated at cost. Depreciation on property and equipment is computed using the straight-line method over the estimated useful lives of the assets, of five to seven years. Leasehold improvements are depreciated over the shorter of the estimated useful life of the assets, the non-cancelable term of the related lease, or the non-cancelable lease term plus all periods for which executive management believes that the failure to renew the lease imposes a penalty in an amount such that the renewal appears, at the inception of the lease, to be reasonably assured. Repairs and maintenance are expensed as incurred.
Intangible Assets. The Company accounts for its goodwill and intangible assets in accordance with ASC 805 Business Combi-nations, or ASC 805, and ASC 350 Intangibles–Goodwill and Other, or ASC 350. The acquired and purchased technology are stated at the lower of unamortized cost or net realizable value and are amortized on a straight-line basis over their expected useful lives of three to five years. The Company’s customer relationship and workforce intangible assets are amortized on an accelerated basis over their expected useful lives of four and one-half years and five years, respectively. The Company uses the projected discounted cash flow method in valuing its ac-quired technology and purchased customer relationships using certain assumptions including revenue growth, cost levels, pres-ent value discount rate, and working capital requirements. The Company uses the lower of the amount of cash paid or the pres-ent value of projected discounted cash flows to value purchased technology. The workforce asset was valued on a replacement cost basis. While the Company believes the assumptions used to value its acquired technology related to acquisitions are rea-sonable, actual results will likely differ from those assumptions. Future cash flows are subject to change for a variety of internal and external factors. The Company periodically reviews the value of acquired technology and purchased intangible assets for impairment in accordance with ASC 360 Property, Plant and Equipment, or ASC 360. If changes in the Company’s as-sumptions at the time of future periodic reviews indicate that the carrying value of its acquired technology and purchased intangible assets exceeds their fair value and it determines that carrying amounts cannot be recovered, it would result in impairment losses. As of March 31, 2012 and 2011, intangible
OPNET Technologies, Inc. 2012 Annual Report
32
assets totaled $3.0 million and $4.5 million, net of accumulated amortization of $14.1 million and $11.9 million, respectively. There has been no impairment as of March 31, 2012 or 2011.
Goodwill. In accordance with ASC 350, goodwill is not amor-tized but is tested for impairment annually during the Compa-ny’s fourth quarter and whenever events and circumstances oc-cur indicating that the asset might be impaired. The Company performed its annual impairment test of goodwill as of March 31, 2012 and 2011 and concluded that the fair value exceeded the carrying value; therefore, it did not record any impairment. The Company has not recorded a goodwill impairment since it first recorded goodwill in fiscal 2001.
Valuation of Long-Lived Assets. In accordance with ASC 360, the Company reviews its long-lived assets, including property and equipment, for impairment whenever events or changes in circumstances indicate that the carrying amounts of the assets may not be fully recoverable. If the total of the expected undiscounted future net cash flows is less than the carrying amount of the asset, a loss is recognized for the differ-ence between the fair value and carrying amount of the asset. There has been no impairment as of March 31, 2012 or 2011.
Revenue Recognition. The Company derives revenue from three primary sources: (1) product revenue, (2) product up-dates, technical support and services revenue, which include product updates, training services on a when-and-if-available basis, and technical support, and (3) professional services rev-enue, which include consulting and custom training services for customers without a current maintenance agreement. The Company recognizes revenue based on the provisions of ASC 605-985 Software Revenue Recognition, or ASC 605-985.
PRODUCT REVENUEProduct revenue represents all fees earned from granting cus-tomers perpetual and term licenses to use the Company’s soft-ware as well as the hardware that it uses to deliver its AppRe-sponse Xpert software products. It excludes revenue derived from product updates, which are included in product updates, technical support and services revenue. For the years ended March 31, 2012, 2011, and 2010, perpetual licenses represented approximately 96%, 91%, and 92% of product revenue, respec-tively. Product revenue is recognized when the following four criteria are met: (i) persuasive evidence of an arrangement ex-ists, (ii) delivery of the software has occurred, (iii) the product fee is fixed or determinable, and (iv) collectibility is probable. The Company defines each of these four criteria as follows:
•Persuasive evidence of an arrangement exists. For license arrangements with end-users, it is the Company’s customary practice to have a written software license agreement, which is signed by both the end user and the Company, and a purchase order or equivalent. A written contract can be executed based on the customer-specific format or on the standard “shrink wrap” software master license agreement. For those end users who have previously negotiated a software license agreement with the Company, the initial software license agreement is used as evidence
of a written contract. Sales to distributors, resellers, and value-added resellers, which the Company collectively refers to as resellers, are evidenced by a master reseller agreement governing the relationship, which is signed by both the reseller and the Company, together with a purchase order on a transaction-by-transaction basis. To further evidence an arrangement, the Company’s master reseller agreement requires that the reseller provide the Company copies of the end user’s executed software master license agreements.
•Delivery has occurred. Physical delivery of the Company’s software products to end users or resellers, which are col-lectively referred to as customers, is generally considered to have occurred upon the transfer of media containing the Company’s software products to a common carrier (usually FOB shipping point based on standard agreement terms). Software licenses may also be delivered electronically to end users. Electronic delivery is deemed to occur after end users have been provided with access codes that allow them to take immediate possession of the software. If a software arrangement includes undelivered software products or ser-vices that are essential to the functionality of delivered soft-ware products, delivery is not considered to have occurred until these software products or services are delivered.
•The fee is fixed or determinable. It is the Company’s pol-icy to not provide customers the right to any adjustments or refund of any portion of their license fees paid, acceptance provisions, cancellation privileges, or rights of return. The Company’s normal payment terms for its software products and services currently range from net 30 days to net 90 days and primarily vary based on the country in which an agree-ment is executed. Payments that extend beyond the Compa-ny’s normal payment terms from the contract date but that are due within six months have generally been deemed to be fixed or determinable based on the Company’s successful collection history on such arrangements, and thereby satisfy the required criteria for revenue recognition. Arrange-ments with payment terms extending beyond six months are recognized as payments become due and payable, as the Company is unable to demonstrate a history of collecting under similar payment terms with similar arrangements.
•Collectibility is probable. Collectibility is assessed on a customer-by-customer basis. The Company typically sells to customers for whom there is a history of successful col-lection. New customers are subject to a credit review process that evaluates the customer’s ability to pay. If the Company determines from the outset of an arrangement that collectibility is not probable, revenue is recognized as cash is collected.
In instances when any of the four criteria are not met, the Com-pany defers recognition of product revenue until the criteria are met. When the sale of the software product requires the Company to make significant enhancements, customization or modifications to the software that are essential to its func-tionality, product revenue and consulting fees are recognized using contract accounting under ASC 605-35 Revenue Rec-ognition–Construction-Type and Production, or ASC 605-35.
OPNET Technologies, Inc. 2012 Annual Report
33
The Company estimates the percentage-of-completion, under ASC 605-35, based on its estimate of total hours to complete the project as a percentage of total hours incurred and the estimated hours to complete as the Company has a history of accurately estimating project hours.
All fees billed to clients for shipping and handling are classi-fied as product revenue. All costs associated with shipping and handling are classified as cost of product revenue.
PRODUCT UPDATE, TECHNICAL SUPPORT, AND SERVICES REVENUEProduct updates, technical support and services revenue repre-sents fees associated with the sale of product updates, training, and technical support, all provided on a when-and-if-available basis (except for technical support) under the Company’s main-tenance agreement. Payments for product updates, technical support and services on initial order or on renewal are generally made in advance and are nonrefundable. Product updates con-sist of the right to unspecified software updates on a when-and-if-available basis and are typically entered into in connection with the initial software product purchase. Product updates, technical support and services may be renewed upon expira-tion of the term. Customers can purchase product updates separately from technical support and services. Revenue from product updates, technical support and services is deferred and recognized as revenue on a straight-line basis over the term of the maintenance agreement.
Revenue under multiple-element arrangements, which typically include product, consulting services, training and maintenance agreements sold together, are allocated to each element in the arrangement primarily using the residual method based upon the fair value of the undelivered elements, which is specific to the Company vendor-specific objective evidence of fair value, or VSOE. This means that the Company defers revenue from the arrangement fee equivalent to the fair value of the undeliv-ered elements. Discounts, if any, are applied to the delivered elements, usually product, under the residual method. For periodic unspecified product updates and technical support agreements, VSOE is based upon either the renewal rate speci-fied in each contract or the price charged when sold separately. For consulting services and training for customers without a current maintenance agreement, VSOE is based upon the rates charged for these services when sold separately.
If the Company is unable to establish VSOE for an undelivered post-contract customer support, or PCS, element, for example, in a two-year term license where the license term and PCS are coterminous and no PCS renewal period exists, all revenue is recognized ratably over the contract period. For income state-ment classification purposes, the Company’s allocation method-ology is based on VSOE of fair value for its professional services which is determined by the price charged when sold separately, and the contractually stated renewal rates for its PCS, generally 18% to 21% of the license fee paid, on perpetual licenses. The Company uses the residual method to allocate any remaining arrangement fee to product revenue.
PROFESSIONAL SERVICES REVENUEProfessional services revenue consists of fees from consult-ing services and training for customers without a current maintenance agreement and is recognized as the services are performed. Although not typical, if the Company enters into consulting service arrangements that include significant modi-fications to the software that are essential to the customer’s use and the arrangement is bundled with software, revenue under the entire arrangement is recognized under the percentage-of-completion method. For income statement classification purposes, the Company has developed a revenue allocation methodology for these arrangements that is consistent with the residual method used, and described under ASC 605-985, when services are not essential to the functionality of the software. In these circumstances, revenue is allocated to the various ele-ments of the arrangement based on the Company’s VSOE of fair value and the residual amount is allocated to product revenue.
The Company sells product, product updates, technical support and services agreements to distributors at predetermined prices. Sales to distributors are not contingent upon resale of the software to the end user. In most cases, the Company provides product updates, technical support and services agreements di-rectly to distributors and the distributors provide support to the end customer. Revenue from sales to distributors is recorded at the amounts charged to the distributor and in the same manner as product, product updates, technical support and services sales sold through the Company’s direct sales force. Amounts received in advance of revenue recognition are classified as deferred revenue.
Sales taxes and other taxes collected from customers and remit-ted to governmental authorities are presented on a net basis, and as such, are excluded from revenues.
Allowance for Doubtful Accounts. The Company maintains an allowance for doubtful accounts receivable for estimated losses resulting from the inability of its customers to make required payments and for the limited circumstances when the customer disputes the amounts due the Company. The Com-pany’s methodology for determining this allowance requires significant estimates. In estimating the allowance, the Company considers the age of the receivable, the creditworthiness of the customer, the economic conditions of the customer’s industry and general economic conditions.
Income Taxes. Income taxes are accounted for in accordance with ASC 740. The income tax provision includes income taxes currently payable plus the net change during the year in deferred tax assets or liabilities. Under ASC 740, deferred tax assets and liabilities reflect the differences between the carrying value under GAAP and the tax basis of assets and liabilities us-ing enacted statutory tax rates in effect for the period in which the differences are expected to reverse. Judgments and esti-mates are required in the calculation of the deferred tax assets, valuation allowance, research and development tax credits, and foreign tax credits.
OPNET Technologies, Inc. 2012 Annual Report
34
ASC 740 prescribes a recognition threshold of more-likely-than-not, and a measurement attribute for all tax positions taken or expected to be taken on a tax return, in order for these positions to be recognized in the financial statements. The Company continually reviews tax laws, regulations and guid-ance in order to properly record any uncertain tax positions.
Foreign Currency Transactions. Gains or losses on foreign exchange transactions are reported in the consolidated state-ments of operations.
Foreign Currency Translation. The results of operations for the Company’s international subsidiaries are translated from the designated functional currencies into United States dollars using average exchange rates during each period. Assets and liabilities are translated using exchange rates at the end of each period. Translation gains and losses are reported as a compo-nent of accumulated other comprehensive loss in stockholders’ equity.
Comprehensive Income. Certain revenues, expenses, gains and losses are recognized in comprehensive income but ex-cluded from net income. Comprehensive income includes net income, foreign currency translation adjustments, and unreal-ized gains and losses on marketable securities.
Earnings per Share. The Company accounts for earnings per share, or EPS, in accordance with ASC 260 Earnings per Share, or ASC 260. ASC 260 states that unvested share-based pay-ment awards that contain nonforfeitable rights to dividends or dividend equivalents (whether paid or unpaid) are participat-ing securities and shall be included in the computation of EPS pursuant to the two-class method. FSP EITF 03-6-1, “Deter-mining Whether Instruments Granted in Share-Based Payment Transactions are Participating Securities” (as codified in ASC 260) is effective for fiscal years beginning after December 15, 2008. The Company applied the provisions of FSP EITF 03-6-1 in fiscal 2010. The Company’s participating securities include nonvested restricted stock.
Stock-Based Compensation. The Company accounts for stock-based compensation given to employees in accordance with ASC 718 Compensation–Stock Compensation, or ASC 718. ASC 718 requires all share-based payments and nonvested shares (restricted stock) issued to employees, including grants of employee stock options, to be valued at fair value on the date of grant, and to be expensed over the applicable vesting period.
RECENTLY ISSUED ACCOUNTING PRONOUNCEMENTSIn December 2010, the Financial Accounting Standards Board, or FASB, issued Accounting Standards Update, or ASU 2010-29, “Disclosure of Supplementary Pro Forma Information for Business Combinations. The objective of ASU 2010-29 is to address diversity in practice about the interpretation of the pro forma revenue and earnings disclosure requirements for busi-ness combinations. The amendments in this update specify that if a public entity presents comparative financial statements, the entity should disclose revenue and earnings of the combined
entity as though the business combination that occurred during the year had occurred as of the beginning of the comparable prior annual reporting period only. The amendments also ex-pand the supplemental pro forma disclosures under Topic 805 “Business Combinations” to include a description of the nature and amount of material, nonrecurring pro forma adjustments directly attributable to the business combination included in the reported pro forma revenue and earnings. ASU 2010-29 was effective for the company prospectively for business combina-tions for which the acquisition date is on or after April 1, 2011. The Company will be impacted by ASU 2010-29 if it makes an acquisition that is accounted for as a business combination.
In June 2011, the FASB issued ASU 2011-05, “Presentation of Comprehensive Income”. ASU 2011-05 amends current presentation guidance by eliminating the option for an entity to present the components of comprehensive income as part of the statement of changes in stockholder’s equity and requires presentation of comprehensive income in a single continuous financial statement or in two separate but consecutive financial statements. The amendments in ASU 2011-05 do not change the items that must be reported in other comprehensive income or when an item of other comprehensive income must be reclassified to net income. In December 2011, the FASB issued ASU 2011-12, Comprehensive Income (Topic 220), Deferral of the Effective Date for Amendments to the Presentation of Reclassifications of Items Out of Accumulated Other Compre-hensive Income in ASU 2011-05, to defer the effective date of the specific requirement to present items that are reclassified out of accumulated other comprehensive income to net income alongside their respective components of net income and other comprehensive income. All other provisions of this update are effective for first annual reporting period beginning after December 15, 2011. The Company will adopt ASU 2011-05 in its first quarter fiscal 2013 financials. The Company does not expect the adoption of ASU 2011-05 to have a material impact on its consolidated financial statements, but does expect the adoption to change the Company’s presentation of other com-prehensive income in the financial statements.
In September 2011, the FASB issued ASU 2011-08, “Testing Goodwill for Impairment”, which allows, but does not require, an entity when performing its annual goodwill impairment test the option to first do an initial assessment of qualitative factors to determine whether it is more likely than not that the fair value of a reporting unit is less than its carrying amount for purposes of determining whether it is even necessary to perform the first step of the two-step goodwill impairment test. Accordingly, based on the option created in ASU 2011-08 the calculation of a reporting unit’s fair value is not required unless, as a result of the qualitative assessment, it is more likely than not that fair value of the reporting unit is less than its carrying amount. In this case, the quantitative impairment test is required. ASU 2011-08 also provides for new qualita-tive indicators to replace those currently used. Prior to ASU 2011-08, entities were required to test goodwill for impairment on at least an annual basis, by first comparing the fair value of a reporting unit with its carrying amount (Step 1). If the fair
OPNET Technologies, Inc. 2012 Annual Report
35
value of a reporting unit is less than its carrying amount, then the second step of the test is performed to measure the amount of impairment loss, if any. ASU 2011-08 is effective for annual and interim goodwill impairment tests performed for fiscal years beginning after December 15, 2011, with early adoption permitted. The adoption of ASU 2011-08 will not impact the Company’s results of operations or financial condition.
RECENTLY ADOPTED ACCOUNTING PRONOUNCEMENTSIn October 2009, the FASB, issued ASU 2009-14, “Certain Rev-enue Arrangement That Include Software Elements,” and ASU 2009-13, “Multiple Deliverable Revenue Arrangements,” which amends Emerging Issues Task Force Issue No. 08-1, “Revenue Arrangements With Multiple Deliverables”. ASU 2009-14 amends the scoping guidance for software arrangements to exclude tangible products that contain software elements and nonsoftware elements that function together to interde-pendently deliver the product’s essential functionality. ASU 2009-13 amends the current guidance on arrangements with multiple elements to (1) eliminate the separation criterion that requires entities to establish objective and reliable evidence of fair value for undelivered elements, (2) establish a selling price hierarchy to help entities allocate arrangement consideration to the separate units of account, (3) require the relative selling price allocation method for all arrangements (i.e., eliminate the residual method), and (4) significantly expand required disclo-sures. ASU 2009-14 and ASU 2009-13 were effective for the first annual reporting period beginning on or after June 15, 2010, and the Company adopted both standards on April 1, 2011. The adoption of ASU 2009-14 and ASU 2009-13 did not have a ma-terial impact on its results of operations or financial condition.
In January 2010, the FASB issued ASU 2010-06, “Improving Disclosures about Fair Value Measurements”, which requires new disclosures concerning transfers into and out of Level 1 and Level 2 of the fair value measurement hierarchy and a roll forward of the activity of assets and liabilities measured in Level 3 of the hierarchy. In addition, ASU 2010-06 clarifies existing disclosure requirements to require fair value measurement disclosures for each class of assets and liabilities and disclosure regarding the valuation techniques and inputs used to measure Level 2 or Level 3 fair value measurements on a recurring and nonrecurring basis. ASU 2010-06 is effective for interim and annual reporting periods beginning after December 15, 2009 except for the roll forward of activity for Level 3 fair value measurements, which was effective for fiscal years beginning after December 15, 2010. The adoption of ASU 2010-06 did not have a material impact on the Company’s consolidated financial statements.
In December 2010, the FASB issued ASU 2010-28, “Intangi-bles—Goodwill and Other (Topic 350): When to Perform Step 2 of the Goodwill Impairment Test for Reporting Units with Zero or Negative Carrying Amounts”, which addresses how to apply Step 1 of the goodwill impairment test when a reporting unit has a zero or negative carrying amount. ASU 2010-28 re-quires for those reporting units with a zero or negative carrying
amount to perform Step 2 of the impairment test if qualitative factors indicate that it is more likely than not that an impair-ment of goodwill exists. ASU 2010-28 is effective for annual and interim periods beginning after December 15, 2010. The adoption of ASU 2010-28 did not have a material impact on the Company’s consolidated financial statements.
In May 2011, the FASB issued ASU 2011-04, “Fair Value Measurement: Amendments to Achieve Common Fair Value Measurement and Disclosure Requirements in U.S. GAAP and IFRSs”. ASU 2011-04 is mainly the result of the joint efforts by the FASB and the International Accounting Standards Board to develop a single, converged fair value framework on how to measure fair value and common disclosure requirements for fair value measurements. ASU 2011-04 amends various fair value guidance, such as specifying that the concept of highest and best use and the concept of valuation premise in a fair value measurement are relevant only when measuring the fair value of nonfinancial assets. This guidance also prohibits the use of blockage factors and control premiums when measuring fair value. In addition, ASU 2011-04 expands disclosure require-ments particularly for Level 3 inputs and requires disclosure of the level in the fair value hierarchy of items that are not measured at fair value in the statement of financial position but whose fair value must be disclosed. For many of the require-ments, the FASB does not intend for the amendments in this Update to result in a change in the application of the require-ments in ASC 820-10. Certain amendments change a particular principle or requirement for measuring fair value or for disclos-ing information about fair value measurements. ASU 2011-04 is effective prospectively for interim and annual periods begin-ning after December 15, 2011. The adoption of ASU 2011-04 did not impact the Company’s results of operations or financial condition.
2. Stock-Based CompensationIn September 2009, the Company’s stockholders approved the adoption of the 2010 Stock Incentive Plan, or the 2010 Plan, in response to the pending expiration of the Company’s Amended and Restated 2000 Stock Incentive Plan, or the 2000 Plan. The 2010 Plan provides for the granting of stock options, restricted stock and other stock-based awards to employees, officers, directors, consultants and advisors. Subject to speci-fied adjustments, the number of shares initially set aside and reserved for issuance under the 2010 Plan was 2,150,000 shares, which approximated the number of shares available for issuance under the 2000 Plan as of January 1, 2010, the effective date of the 2010 Plan. The Board approved a resolution to make no further grants for options or stock awards under the 2000 Plan upon approval of the 2010 Plan.
The number of shares available for issuance under the 2010 Plan will automatically increase from time to time by a number equal to (i) in the event any outstanding stock option granted under the 2000 Plan should for any reason expire or otherwise terminate, in whole or in part, without having been exercised in full, the number of shares that are not acquired under such stock option and (ii) in the event stock that has been issued
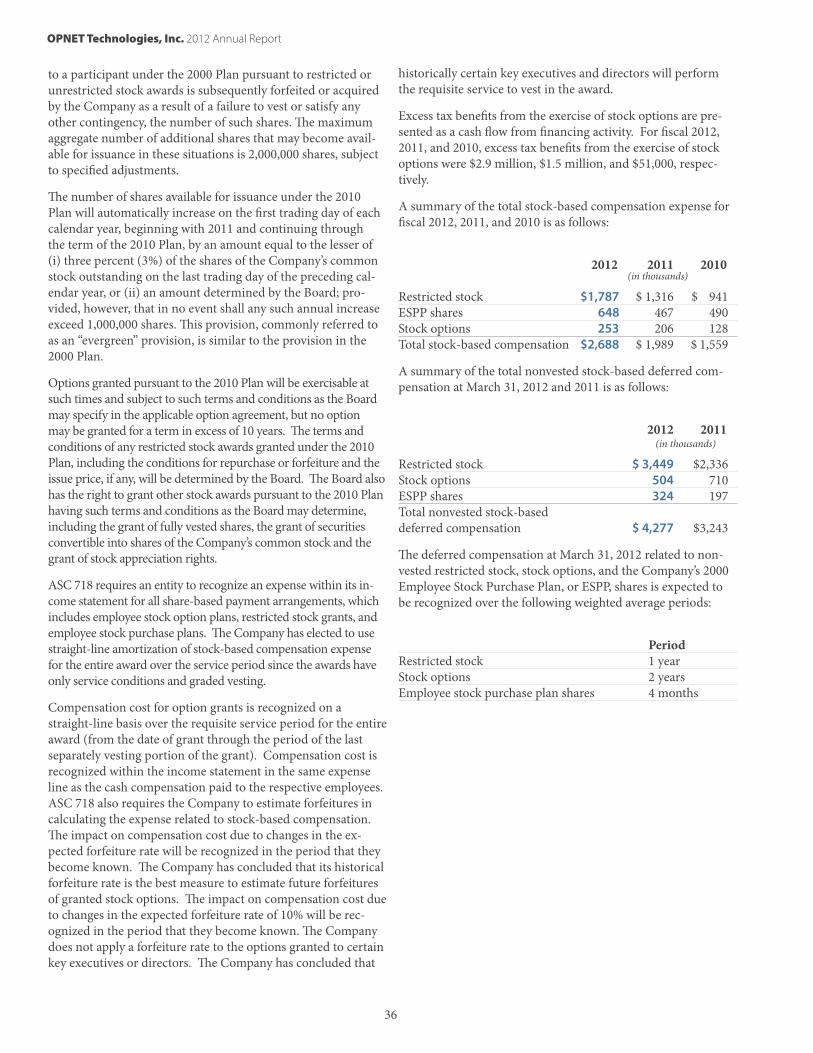
OPNET Technologies, Inc. 2012 Annual Report
36
to a participant under the 2000 Plan pursuant to restricted or unrestricted stock awards is subsequently forfeited or acquired by the Company as a result of a failure to vest or satisfy any other contingency, the number of such shares. The maximum aggregate number of additional shares that may become avail-able for issuance in these situations is 2,000,000 shares, subject to specified adjustments.
The number of shares available for issuance under the 2010 Plan will automatically increase on the first trading day of each calendar year, beginning with 2011 and continuing through the term of the 2010 Plan, by an amount equal to the lesser of (i) three percent (3%) of the shares of the Company’s common stock outstanding on the last trading day of the preceding cal-endar year, or (ii) an amount determined by the Board; pro-vided, however, that in no event shall any such annual increase exceed 1,000,000 shares. This provision, commonly referred to as an “evergreen” provision, is similar to the provision in the 2000 Plan.
Options granted pursuant to the 2010 Plan will be exercisable at such times and subject to such terms and conditions as the Board may specify in the applicable option agreement, but no option may be granted for a term in excess of 10 years. The terms and conditions of any restricted stock awards granted under the 2010 Plan, including the conditions for repurchase or forfeiture and the issue price, if any, will be determined by the Board. The Board also has the right to grant other stock awards pursuant to the 2010 Plan having such terms and conditions as the Board may determine, including the grant of fully vested shares, the grant of securities convertible into shares of the Company’s common stock and the grant of stock appreciation rights.
ASC 718 requires an entity to recognize an expense within its in-come statement for all share-based payment arrangements, which includes employee stock option plans, restricted stock grants, and employee stock purchase plans. The Company has elected to use straight-line amortization of stock-based compensation expense for the entire award over the service period since the awards have only service conditions and graded vesting.
Compensation cost for option grants is recognized on a straight-line basis over the requisite service period for the entire award (from the date of grant through the period of the last separately vesting portion of the grant). Compensation cost is recognized within the income statement in the same expense line as the cash compensation paid to the respective employees. ASC 718 also requires the Company to estimate forfeitures in calculating the expense related to stock-based compensation. The impact on compensation cost due to changes in the ex-pected forfeiture rate will be recognized in the period that they become known. The Company has concluded that its historical forfeiture rate is the best measure to estimate future forfeitures of granted stock options. The impact on compensation cost due to changes in the expected forfeiture rate of 10% will be rec-ognized in the period that they become known. The Company does not apply a forfeiture rate to the options granted to certain key executives or directors. The Company has concluded that
historically certain key executives and directors will perform the requisite service to vest in the award.
Excess tax benefits from the exercise of stock options are pre-sented as a cash flow from financing activity. For fiscal 2012, 2011, and 2010, excess tax benefits from the exercise of stock options were $2.9 million, $1.5 million, and $51,000, respec-tively.
A summary of the total stock-based compensation expense for fiscal 2012, 2011, and 2010 is as follows:
2012 2011 2010 (in thousands)
Restricted stock $1,787 $ 1,316 $ 941ESPP shares 648 467 490Stock options 253 206 128 Total stock-based compensation $2,688 $ 1,989 $ 1,559
A summary of the total nonvested stock-based deferred com-pensation at March 31, 2012 and 2011 is as follows:
2012 2011 (in thousands)
Restricted stock $ 3,449 $2,336Stock options 504 710 ESPP shares 324 197Total nonvested stock-based deferred compensation $ 4,277 $3,243
The deferred compensation at March 31, 2012 related to non-vested restricted stock, stock options, and the Company’s 2000 Employee Stock Purchase Plan, or ESPP, shares is expected to be recognized over the following weighted average periods:
PeriodRestricted stock 1 yearStock options 2 yearsEmployee stock purchase plan shares 4 months
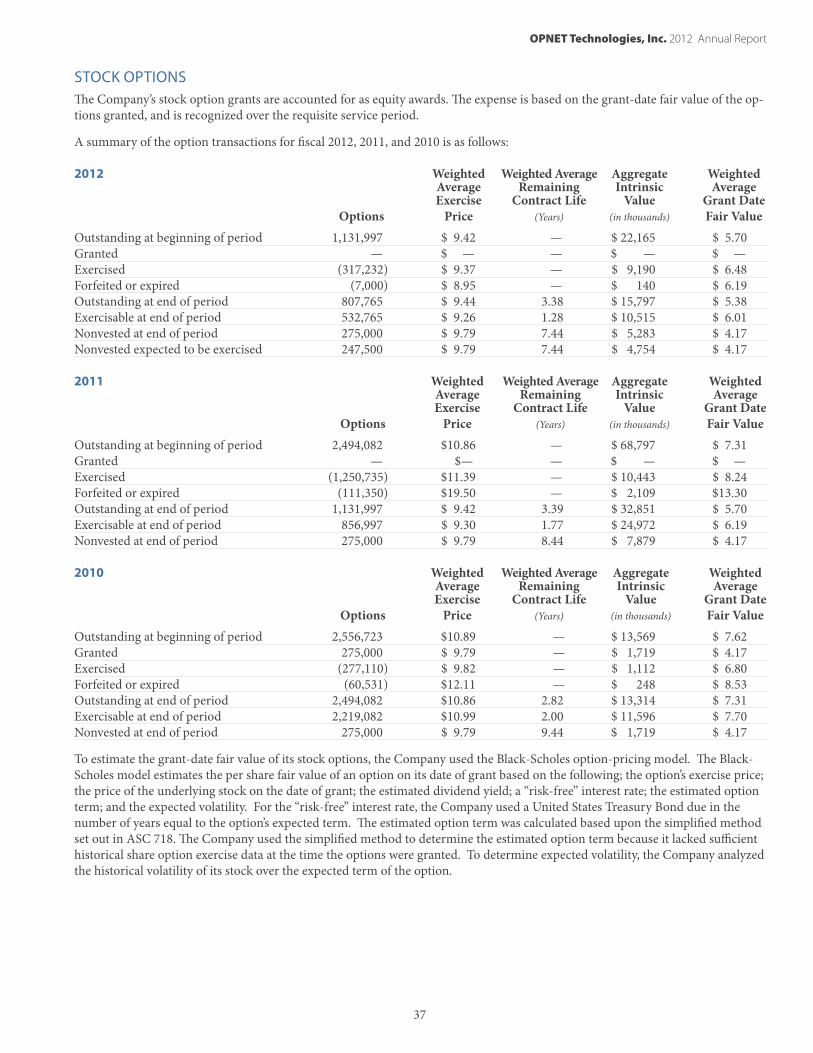
OPNET Technologies, Inc. 2012 Annual Report
37
STOCK OPTIONSThe Company’s stock option grants are accounted for as equity awards. The expense is based on the grant-date fair value of the op-tions granted, and is recognized over the requisite service period.
A summary of the option transactions for fiscal 2012, 2011, and 2010 is as follows:
2012 Weighted Weighted Average Aggregate Weighted Average Remaining Intrinsic Average Exercise Contract Life Value Grant Date Options Price (Years) (in thousands) Fair Value
Outstanding at beginning of period 1,131,997 $ 9.42 — $ 22,165 $ 5.70Granted — $ — — $ — $ —Exercised (317,232) $ 9.37 — $ 9,190 $ 6.48Forfeited or expired (7,000) $ 8.95 — $ 140 $ 6.19Outstanding at end of period 807,765 $ 9.44 3.38 $ 15,797 $ 5.38Exercisable at end of period 532,765 $ 9.26 1.28 $ 10,515 $ 6.01Nonvested at end of period 275,000 $ 9.79 7.44 $ 5,283 $ 4.17Nonvested expected to be exercised 247,500 $ 9.79 7.44 $ 4,754 $ 4.17
2011 Weighted Weighted Average Aggregate Weighted Average Remaining Intrinsic Average Exercise Contract Life Value Grant Date Options Price (Years) (in thousands) Fair Value
Outstanding at beginning of period 2,494,082 $10.86 — $ 68,797 $ 7.31 Granted — $— — $ — $ — Exercised (1,250,735) $11.39 — $ 10,443 $ 8.24 Forfeited or expired (111,350) $19.50 — $ 2,109 $13.30 Outstanding at end of period 1,131,997 $ 9.42 3.39 $ 32,851 $ 5.70 Exercisable at end of period 856,997 $ 9.30 1.77 $ 24,972 $ 6.19 Nonvested at end of period 275,000 $ 9.79 8.44 $ 7,879 $ 4.17
2010 Weighted Weighted Average Aggregate Weighted Average Remaining Intrinsic Average Exercise Contract Life Value Grant Date Options Price (Years) (in thousands) Fair Value
Outstanding at beginning of period 2,556,723 $10.89 — $ 13,569 $ 7.62Granted 275,000 $ 9.79 — $ 1,719 $ 4.17Exercised (277,110) $ 9.82 — $ 1,112 $ 6.80Forfeited or expired (60,531) $12.11 — $ 248 $ 8.53Outstanding at end of period 2,494,082 $10.86 2.82 $ 13,314 $ 7.31Exercisable at end of period 2,219,082 $10.99 2.00 $ 11,596 $ 7.70Nonvested at end of period 275,000 $ 9.79 9.44 $ 1,719 $ 4.17
To estimate the grant-date fair value of its stock options, the Company used the Black-Scholes option-pricing model. The Black-Scholes model estimates the per share fair value of an option on its date of grant based on the following; the option’s exercise price; the price of the underlying stock on the date of grant; the estimated dividend yield; a “risk-free” interest rate; the estimated option term; and the expected volatility. For the “risk-free” interest rate, the Company used a United States Treasury Bond due in the number of years equal to the option’s expected term. The estimated option term was calculated based upon the simplified method set out in ASC 718. The Company used the simplified method to determine the estimated option term because it lacked sufficient historical share option exercise data at the time the options were granted. To determine expected volatility, the Company analyzed the historical volatility of its stock over the expected term of the option.
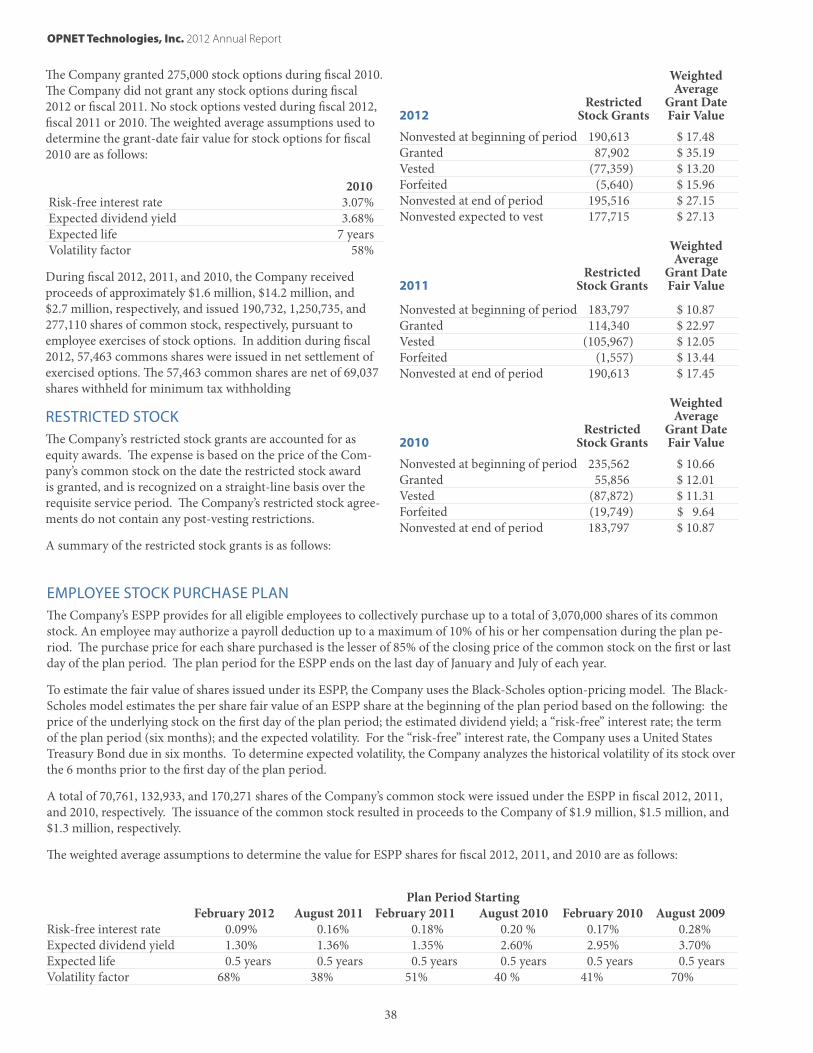
OPNET Technologies, Inc. 2012 Annual Report
38
The Company granted 275,000 stock options during fiscal 2010. The Company did not grant any stock options during fiscal 2012 or fiscal 2011. No stock options vested during fiscal 2012, fiscal 2011 or 2010. The weighted average assumptions used to determine the grant-date fair value for stock options for fiscal 2010 are as follows:
2010 Risk-free interest rate 3.07% Expected dividend yield 3.68% Expected life 7 years Volatility factor 58%
During fiscal 2012, 2011, and 2010, the Company received proceeds of approximately $1.6 million, $14.2 million, and $2.7 million, respectively, and issued 190,732, 1,250,735, and 277,110 shares of common stock, respectively, pursuant to employee exercises of stock options. In addition during fiscal 2012, 57,463 commons shares were issued in net settlement of exercised options. The 57,463 common shares are net of 69,037 shares withheld for minimum tax withholding
RESTRICTED STOCKThe Company’s restricted stock grants are accounted for as equity awards. The expense is based on the price of the Com-pany’s common stock on the date the restricted stock award is granted, and is recognized on a straight-line basis over the requisite service period. The Company’s restricted stock agree-ments do not contain any post-vesting restrictions.
A summary of the restricted stock grants is as follows:
Weighted Average Restricted Grant Date 2012 Stock Grants Fair Value
Nonvested at beginning of period 190,613 $ 17.48 Granted 87,902 $ 35.19 Vested (77,359) $ 13.20 Forfeited (5,640) $ 15.96 Nonvested at end of period 195,516 $ 27.15 Nonvested expected to vest 177,715 $ 27.13 Weighted Average Restricted Grant Date 2011 Stock Grants Fair Value
Nonvested at beginning of period 183,797 $ 10.87 Granted 114,340 $ 22.97 Vested (105,967) $ 12.05 Forfeited (1,557) $ 13.44 Nonvested at end of period 190,613 $ 17.45 Weighted Average Restricted Grant Date 2010 Stock Grants Fair Value
Nonvested at beginning of period 235,562 $ 10.66Granted 55,856 $ 12.01Vested (87,872) $ 11.31 Forfeited (19,749) $ 9.64 Nonvested at end of period 183,797 $ 10.87
EMPLOYEE STOCK PURCHASE PLANThe Company’s ESPP provides for all eligible employees to collectively purchase up to a total of 3,070,000 shares of its common stock. An employee may authorize a payroll deduction up to a maximum of 10% of his or her compensation during the plan pe-riod. The purchase price for each share purchased is the lesser of 85% of the closing price of the common stock on the first or last day of the plan period. The plan period for the ESPP ends on the last day of January and July of each year.
To estimate the fair value of shares issued under its ESPP, the Company uses the Black-Scholes option-pricing model. The Black-Scholes model estimates the per share fair value of an ESPP share at the beginning of the plan period based on the following: the price of the underlying stock on the first day of the plan period; the estimated dividend yield; a “risk-free” interest rate; the term of the plan period (six months); and the expected volatility. For the “risk-free” interest rate, the Company uses a United States Treasury Bond due in six months. To determine expected volatility, the Company analyzes the historical volatility of its stock over the 6 months prior to the first day of the plan period.
A total of 70,761, 132,933, and 170,271 shares of the Company’s common stock were issued under the ESPP in fiscal 2012, 2011, and 2010, respectively. The issuance of the common stock resulted in proceeds to the Company of $1.9 million, $1.5 million, and $1.3 million, respectively.
The weighted average assumptions to determine the value for ESPP shares for fiscal 2012, 2011, and 2010 are as follows:
Plan Period Starting February 2012 August 2011 February 2011 August 2010 February 2010 August 2009Risk-free interest rate 0.09% 0.16% 0.18% 0.20 % 0.17% 0.28%Expected dividend yield 1.30% 1.36% 1.35% 2.60% 2.95% 3.70%Expected life 0.5 years 0.5 years 0.5 years 0.5 years 0.5 years 0.5 yearsVolatility factor 68% 38% 51% 40 % 41% 70%
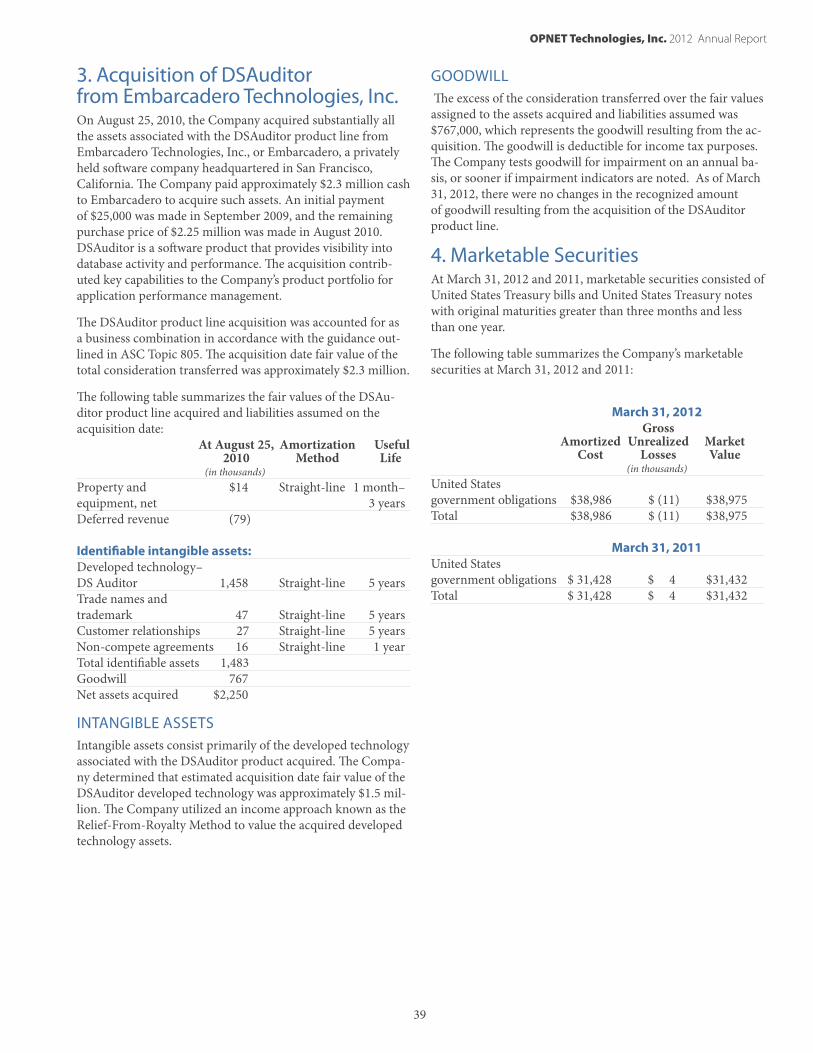
OPNET Technologies, Inc. 2012 Annual Report
39
3. Acquisition of DSAuditor from Embarcadero Technologies, Inc. On August 25, 2010, the Company acquired substantially all the assets associated with the DSAuditor product line from Embarcadero Technologies, Inc., or Embarcadero, a privately held software company headquartered in San Francisco, California. The Company paid approximately $2.3 million cash to Embarcadero to acquire such assets. An initial payment of $25,000 was made in September 2009, and the remaining purchase price of $2.25 million was made in August 2010. DSAuditor is a software product that provides visibility into database activity and performance. The acquisition contrib-uted key capabilities to the Company’s product portfolio for application performance management.
The DSAuditor product line acquisition was accounted for as a business combination in accordance with the guidance out-lined in ASC Topic 805. The acquisition date fair value of the total consideration transferred was approximately $2.3 million.
The following table summarizes the fair values of the DSAu-ditor product line acquired and liabilities assumed on the acquisition date: At August 25, Amortization Useful 2010 Method Life (in thousands) Property and $14 Straight-line 1 month– equipment, net 3 yearsDeferred revenue (79)
Identifiable intangible assets: Developed technology– DS Auditor 1,458 Straight-line 5 yearsTrade names and trademark 47 Straight-line 5 yearsCustomer relationships 27 Straight-line 5 yearsNon-compete agreements 16 Straight-line 1 yearTotal identifiable assets 1,483 Goodwill 767 Net assets acquired $2,250
INTANGIBLE ASSETS Intangible assets consist primarily of the developed technology associated with the DSAuditor product acquired. The Compa-ny determined that estimated acquisition date fair value of the DSAuditor developed technology was approximately $1.5 mil-lion. The Company utilized an income approach known as the Relief-From-Royalty Method to value the acquired developed technology assets.
GOODWILL The excess of the consideration transferred over the fair values assigned to the assets acquired and liabilities assumed was $767,000, which represents the goodwill resulting from the ac-quisition. The goodwill is deductible for income tax purposes. The Company tests goodwill for impairment on an annual ba-sis, or sooner if impairment indicators are noted. As of March 31, 2012, there were no changes in the recognized amount of goodwill resulting from the acquisition of the DSAuditor product line.
4. Marketable SecuritiesAt March 31, 2012 and 2011, marketable securities consisted of United States Treasury bills and United States Treasury notes with original maturities greater than three months and less than one year.
The following table summarizes the Company’s marketable securities at March 31, 2012 and 2011:
March 31, 2012 Gross Amortized Unrealized Market Cost Losses Value (in thousands)United States government obligations $38,986 $ (11) $38,975Total $38,986 $ (11) $38,975 March 31, 2011United States government obligations $ 31,428 $ 4 $31,432Total $ 31,428 $ 4 $31,432
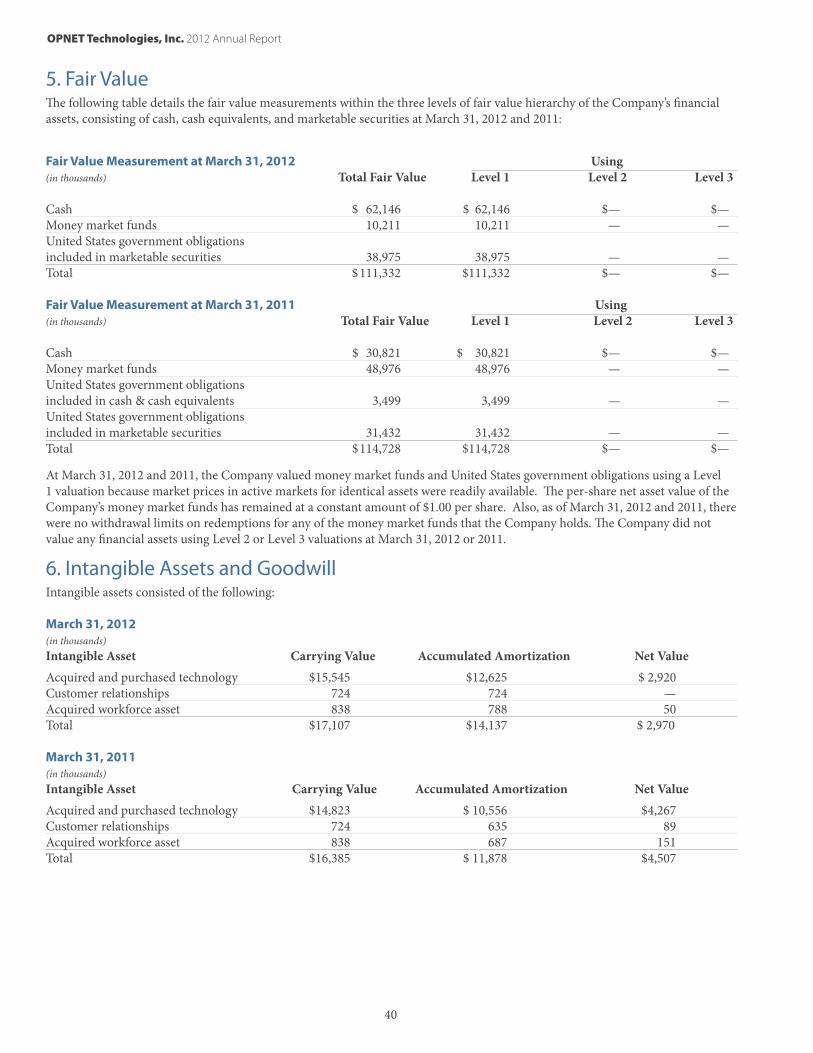
OPNET Technologies, Inc. 2012 Annual Report
40
5. Fair ValueThe following table details the fair value measurements within the three levels of fair value hierarchy of the Company’s financial assets, consisting of cash, cash equivalents, and marketable securities at March 31, 2012 and 2011:
Fair Value Measurement at March 31, 2012 Using(in thousands) Total Fair Value Level 1 Level 2 Level 3
Cash $ 62,146 $ 62,146 $— $—Money market funds 10,211 10,211 — —United States government obligations included in marketable securities 38,975 38,975 — —Total $ 111,332 $111,332 $— $—
Fair Value Measurement at March 31, 2011 Using(in thousands) Total Fair Value Level 1 Level 2 Level 3
Cash $ 30,821 $ 30,821 $— $—Money market funds 48,976 48,976 — —United States government obligations included in cash & cash equivalents 3,499 3,499 — —United States government obligations included in marketable securities 31,432 31,432 — —Total $ 114,728 $114,728 $— $—
At March 31, 2012 and 2011, the Company valued money market funds and United States government obligations using a Level 1 valuation because market prices in active markets for identical assets were readily available. The per-share net asset value of the Company’s money market funds has remained at a constant amount of $1.00 per share. Also, as of March 31, 2012 and 2011, there were no withdrawal limits on redemptions for any of the money market funds that the Company holds. The Company did not value any financial assets using Level 2 or Level 3 valuations at March 31, 2012 or 2011.
6. Intangible Assets and GoodwillIntangible assets consisted of the following:
March 31, 2012(in thousands)Intangible Asset Carrying Value Accumulated Amortization Net Value
Acquired and purchased technology $15,545 $12,625 $ 2,920Customer relationships 724 724 —Acquired workforce asset 838 788 50Total $17,107 $14,137 $ 2,970
March 31, 2011(in thousands)Intangible Asset Carrying Value Accumulated Amortization Net Value
Acquired and purchased technology $14,823 $ 10,556 $4,267Customer relationships 724 635 89Acquired workforce asset 838 687 151Total $16,385 $ 11,878 $4,507
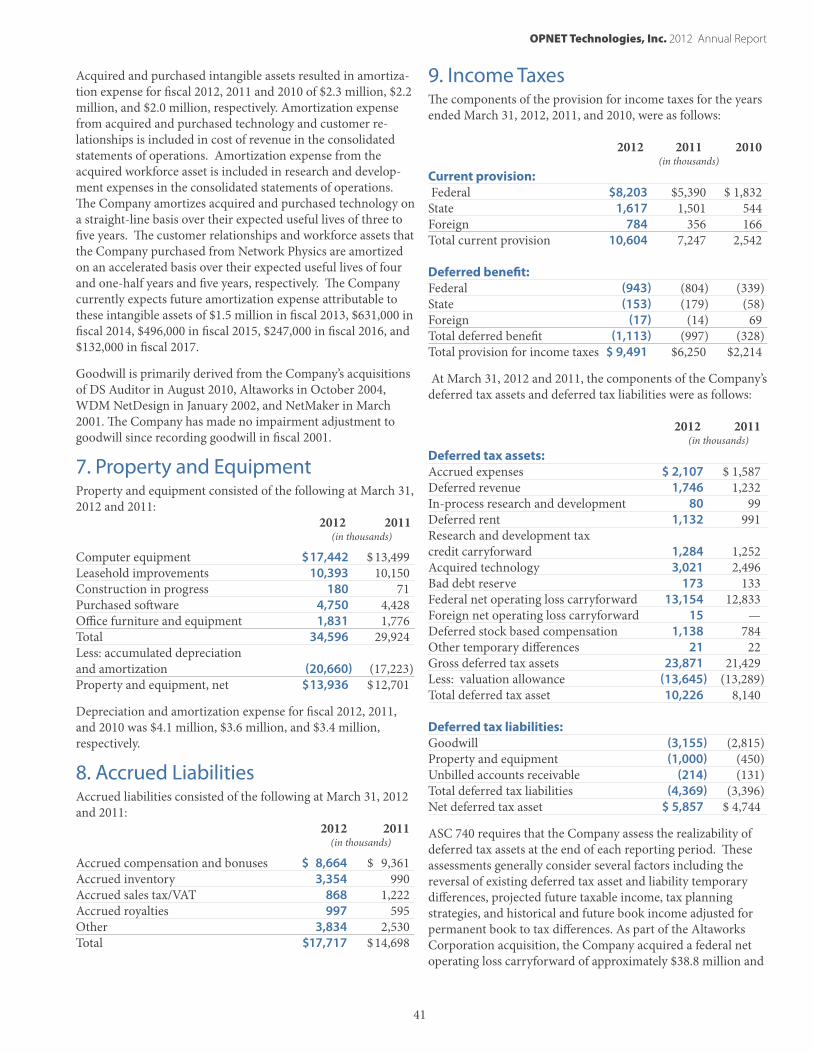
OPNET Technologies, Inc. 2012 Annual Report
41
Acquired and purchased intangible assets resulted in amortiza-tion expense for fiscal 2012, 2011 and 2010 of $2.3 million, $2.2 million, and $2.0 million, respectively. Amortization expense from acquired and purchased technology and customer re-lationships is included in cost of revenue in the consolidated statements of operations. Amortization expense from the acquired workforce asset is included in research and develop-ment expenses in the consolidated statements of operations. The Company amortizes acquired and purchased technology on a straight-line basis over their expected useful lives of three to five years. The customer relationships and workforce assets that the Company purchased from Network Physics are amortized on an accelerated basis over their expected useful lives of four and one-half years and five years, respectively. The Company currently expects future amortization expense attributable to these intangible assets of $1.5 million in fiscal 2013, $631,000 in fiscal 2014, $496,000 in fiscal 2015, $247,000 in fiscal 2016, and $132,000 in fiscal 2017.
Goodwill is primarily derived from the Company’s acquisitions of DS Auditor in August 2010, Altaworks in October 2004, WDM NetDesign in January 2002, and NetMaker in March 2001. The Company has made no impairment adjustment to goodwill since recording goodwill in fiscal 2001.
7. Property and Equipment Property and equipment consisted of the following at March 31, 2012 and 2011: 2012 2011 (in thousands)
Computer equipment $17,442 $ 13,499 Leasehold improvements 10,393 10,150 Construction in progress 180 71 Purchased software 4,750 4,428Office furniture and equipment 1,831 1,776Total 34,596 29,924Less: accumulated depreciation and amortization (20,660) (17,223)Property and equipment, net $13,936 $12,701
Depreciation and amortization expense for fiscal 2012, 2011, and 2010 was $4.1 million, $3.6 million, and $3.4 million, respectively.
8. Accrued Liabilities Accrued liabilities consisted of the following at March 31, 2012 and 2011: 2012 2011 (in thousands)
Accrued compensation and bonuses $ 8,664 $ 9,361 Accrued inventory 3,354 990Accrued sales tax/VAT 868 1,222 Accrued royalties 997 595Other 3,834 2,530Total $17,717 $ 14,698
9. Income Taxes The components of the provision for income taxes for the years ended March 31, 2012, 2011, and 2010, were as follows:
2012 2011 2010 (in thousands)Current provision: Federal $8,203 $5,390 $ 1,832State 1,617 1,501 544Foreign 784 356 166 Total current provision 10,604 7,247 2,542 Deferred benefit: Federal (943) (804) (339)State (153) (179) (58) Foreign (17) (14) 69 Total deferred benefit (1,113) (997) (328) Total provision for income taxes $ 9,491 $6,250 $2,214
At March 31, 2012 and 2011, the components of the Company’s deferred tax assets and deferred tax liabilities were as follows:
2012 2011 (in thousands)Deferred tax assets: Accrued expenses $ 2,107 $ 1,587Deferred revenue 1,746 1,232In-process research and development 80 99Deferred rent 1,132 991Research and development tax credit carryforward 1,284 1,252Acquired technology 3,021 2,496Bad debt reserve 173 133Federal net operating loss carryforward 13,154 12,833Foreign net operating loss carryforward 15 —Deferred stock based compensation 1,138 784 Other temporary differences 21 22 Gross deferred tax assets 23,871 21,429Less: valuation allowance (13,645) (13,289)Total deferred tax asset 10,226 8,140 Deferred tax liabilities: Goodwill (3,155) (2,815)Property and equipment (1,000) (450) Unbilled accounts receivable (214) (131)Total deferred tax liabilities (4,369) (3,396)Net deferred tax asset $ 5,857 $ 4,744
ASC 740 requires that the Company assess the realizability of deferred tax assets at the end of each reporting period. These assessments generally consider several factors including the reversal of existing deferred tax asset and liability temporary differences, projected future taxable income, tax planning strategies, and historical and future book income adjusted for permanent book to tax differences. As part of the Altaworks Corporation acquisition, the Company acquired a federal net operating loss carryforward of approximately $38.8 million and
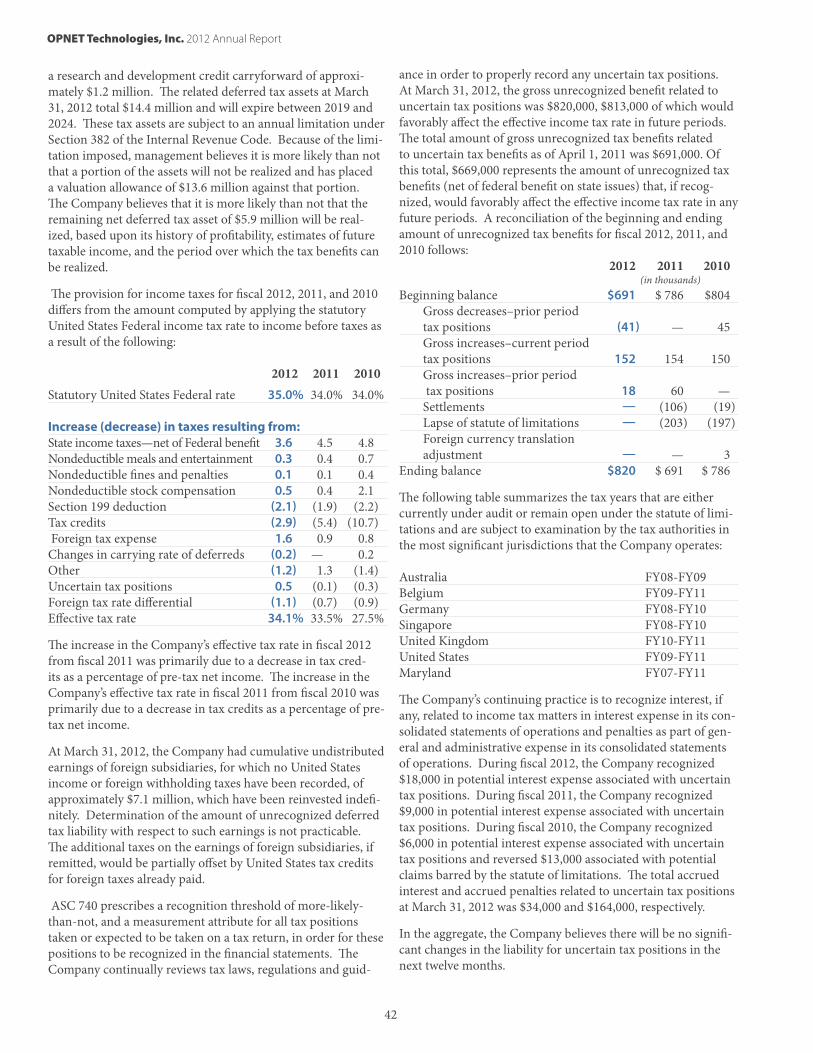
OPNET Technologies, Inc. 2012 Annual Report
42
a research and development credit carryforward of approxi-mately $1.2 million. The related deferred tax assets at March 31, 2012 total $14.4 million and will expire between 2019 and 2024. These tax assets are subject to an annual limitation under Section 382 of the Internal Revenue Code. Because of the limi-tation imposed, management believes it is more likely than not that a portion of the assets will not be realized and has placed a valuation allowance of $13.6 million against that portion. The Company believes that it is more likely than not that the remaining net deferred tax asset of $5.9 million will be real-ized, based upon its history of profitability, estimates of future taxable income, and the period over which the tax benefits can be realized.
The provision for income taxes for fiscal 2012, 2011, and 2010 differs from the amount computed by applying the statutory United States Federal income tax rate to income before taxes as a result of the following: 2012 2011 2010
Statutory United States Federal rate 35.0% 34.0% 34.0%
Increase (decrease) in taxes resulting from: State income taxes—net of Federal benefit 3.6 4.5 4.8 Nondeductible meals and entertainment 0.3 0.4 0.7 Nondeductible fines and penalties 0.1 0.1 0.4 Nondeductible stock compensation 0.5 0.4 2.1 Section 199 deduction (2.1) (1.9) (2.2)Tax credits (2.9) (5.4) (10.7) Foreign tax expense 1.6 0.9 0.8 Changes in carrying rate of deferreds (0.2) — 0.2 Other (1.2) 1.3 (1.4)Uncertain tax positions 0.5 (0.1) (0.3)Foreign tax rate differential (1.1) (0.7) (0.9)Effective tax rate 34.1% 33.5% 27.5%
The increase in the Company’s effective tax rate in fiscal 2012 from fiscal 2011 was primarily due to a decrease in tax cred-its as a percentage of pre-tax net income. The increase in the Company’s effective tax rate in fiscal 2011 from fiscal 2010 was primarily due to a decrease in tax credits as a percentage of pre-tax net income.
At March 31, 2012, the Company had cumulative undistributed earnings of foreign subsidiaries, for which no United States income or foreign withholding taxes have been recorded, of approximately $7.1 million, which have been reinvested indefi-nitely. Determination of the amount of unrecognized deferred tax liability with respect to such earnings is not practicable. The additional taxes on the earnings of foreign subsidiaries, if remitted, would be partially offset by United States tax credits for foreign taxes already paid.
ASC 740 prescribes a recognition threshold of more-likely-than-not, and a measurement attribute for all tax positions taken or expected to be taken on a tax return, in order for these positions to be recognized in the financial statements. The Company continually reviews tax laws, regulations and guid-
ance in order to properly record any uncertain tax positions. At March 31, 2012, the gross unrecognized benefit related to uncertain tax positions was $820,000, $813,000 of which would favorably affect the effective income tax rate in future periods. The total amount of gross unrecognized tax benefits related to uncertain tax benefits as of April 1, 2011 was $691,000. Of this total, $669,000 represents the amount of unrecognized tax benefits (net of federal benefit on state issues) that, if recog-nized, would favorably affect the effective income tax rate in any future periods. A reconciliation of the beginning and ending amount of unrecognized tax benefits for fiscal 2012, 2011, and 2010 follows: 2012 2011 2010 (in thousands)Beginning balance $691 $ 786 $804 Gross decreases–prior period tax positions (41) — 45 Gross increases–current period tax positions 152 154 150 Gross increases–prior period tax positions 18 60 — Settlements — (106) (19) Lapse of statute of limitations — (203) (197) Foreign currency translation adjustment — — 3Ending balance $820 $ 691 $ 786
The following table summarizes the tax years that are either currently under audit or remain open under the statute of limi-tations and are subject to examination by the tax authorities in the most significant jurisdictions that the Company operates:
Australia FY08-FY09Belgium FY09-FY11Germany FY08-FY10 Singapore FY08-FY10United Kingdom FY10-FY11United States FY09-FY11Maryland FY07-FY11
The Company’s continuing practice is to recognize interest, if any, related to income tax matters in interest expense in its con-solidated statements of operations and penalties as part of gen-eral and administrative expense in its consolidated statements of operations. During fiscal 2012, the Company recognized $18,000 in potential interest expense associated with uncertain tax positions. During fiscal 2011, the Company recognized $9,000 in potential interest expense associated with uncertain tax positions. During fiscal 2010, the Company recognized $6,000 in potential interest expense associated with uncertain tax positions and reversed $13,000 associated with potential claims barred by the statute of limitations. The total accrued interest and accrued penalties related to uncertain tax positions at March 31, 2012 was $34,000 and $164,000, respectively.
In the aggregate, the Company believes there will be no signifi-cant changes in the liability for uncertain tax positions in the next twelve months.
OPNET Technologies, Inc. 2012 Annual Report
43
10. Commitments and Contingencies The Company’s corporate office and principal facilities are located in Bethesda, Maryland and consist of approximately 82,000 square feet of office space held under two leases. The lease for 60,000 square feet expires on January 31, 2021, ex-clusive of renewal options, and the lease for 22,000 square feet expires on January 31, 2016, exclusive of renewal options. The lease for 60,000 square feet provides for one renewal option (at the option of the landlord) for not less than three and one half years and not more than ten years. The lease also provides for a short-term extension at January 31, 2021 (at the option of the tenant) of three months. The monthly rent for the first lease year is $201,000, and is subject to escalation of 3.75% each year. The lease also requires the Company to maintain a security deposit of approximately $471,000 in the form of a bank letter of credit.
In addition, the Company leases additional office space under non-cancelable operating leases. The leases for office space con-tain escalation clauses that provide for increased rentals based primarily on increases in real estate taxes, operating expenses, or the consumer price index. Total rent expense under all leases for fiscal 2012, 2011, and 2010 was $5.5 million, $5.2 mil-lion, and $5.1 million, respectively. At March 31, 2012, future minimum lease payments required under non-cancelable leases were as follows (in thousands):
Year ending March 31, 2013 $5,238 2014 4,835 2015 4,838 2016 4,790 2017 3,871Thereafter 18,772Total minimum lease payments $42,344
The Company accounts for guarantees in accordance with ASC 460 Guarantees, or ASC 460. ASC 460 elaborates on the disclo-sures required in financial statements concerning obligations under certain guarantees. It also clarifies the requirements re-lated to the recognition of liabilities by a guarantor at the incep-tion of certain guarantees. The provisions related to recognizing a liability at inception of the guarantee do not apply to product warranties or indemnification provisions in the Company’s software license agreements.
Under the terms of substantially all of the Company’s license agreements, it has agreed to defend and pay any final judgment against its customers arising from claims against such custom-ers that the Company’s software products infringe the intellec-tual property rights of a third party. To date: i) the Company has not received any notice that any customer is subject to an infringement claim arising from the use of its software prod-ucts, ii) the Company has not received any request to defend any customers from infringement claims arising from the use of its software products, and iii) the Company has not paid any final judgment on behalf of any customer related to an in-fringement claim arising from the use of its software products.
Because the outcome of infringement disputes are related to the specific facts in each case, and given the lack of previous or current indemnification claims, the Company cannot estimate the maximum amount of potential future payments, if any, related to its indemnification provisions. However, the Com-pany reasonably believes these indemnification provisions will not have a material adverse effect on its operating performance or financial condition. As of March 31, 2012, the Company has not recorded any liabilities related to these indemnifications.
The Company’s standard license agreement includes a war-ranty provision for software products. The Company generally warrants for the first ninety days after delivery that the software shall operate substantially as stated in the then current docu-mentation provided that the software is used in a supported computer system. The Company provides for the estimated cost of product warranties based on specific warranty claims, pro-vided that it is probable that a liability exists and provided the amount can be reasonably estimated. To date, the Company has not had any material costs associated with these warranties.
The Company is involved in other claims and legal proceedings arising from its normal operations. The Company does not expect these matters, individually or in the aggregate, to have a material effect on its financial condition, results of operations, or cash flows.
11. Credit Agreements and Notes PayableEffective June 10, 2002, the Company entered into a credit facil-ity with a commercial bank. The credit facility permitted the use of funds for general corporate purposes and the issuance of letters of credit up to a maximum of $10.0 million in the aggre-gate. As of March 31, 2012, the lender under our credit facility had issued letters of credit in favor of the beneficiaries under a number of our operating leases in the aggregate amount of $598,000. Upon a default, as defined in the respective office lease agreement, the applicable landlord has the right to draw upon its letter of credit in whole or in part. Interest under this facility, including interest on any amounts drawn under the letters of credit, is payable monthly at an annual rate of 1.25%. The credit facility is collateralized by the Company’s accounts receivable.
12. Employee Benefits PlanEffective August 1, 1993, the Company established a 401(k) retirement plan, or the Plan, covering all eligible employees, as defined. Eligible employees who are at least 21 years old may participate. Under the terms of the Plan, participants may defer a portion of their salaries as employee contributions. The Com-pany makes matching contributions and may make discretion-ary contributions. Employee contributions and discretionary contributions made by the Company are 100% vested imme-diately. In general, the Company’s matching and discretionary contributions vest ratably over a five-year period. The Compa-ny’s expense under this Plan for fiscal 2012, 2011, and 2010 was $1.4 million, $1.3 million, and $1.1 million, respectively.
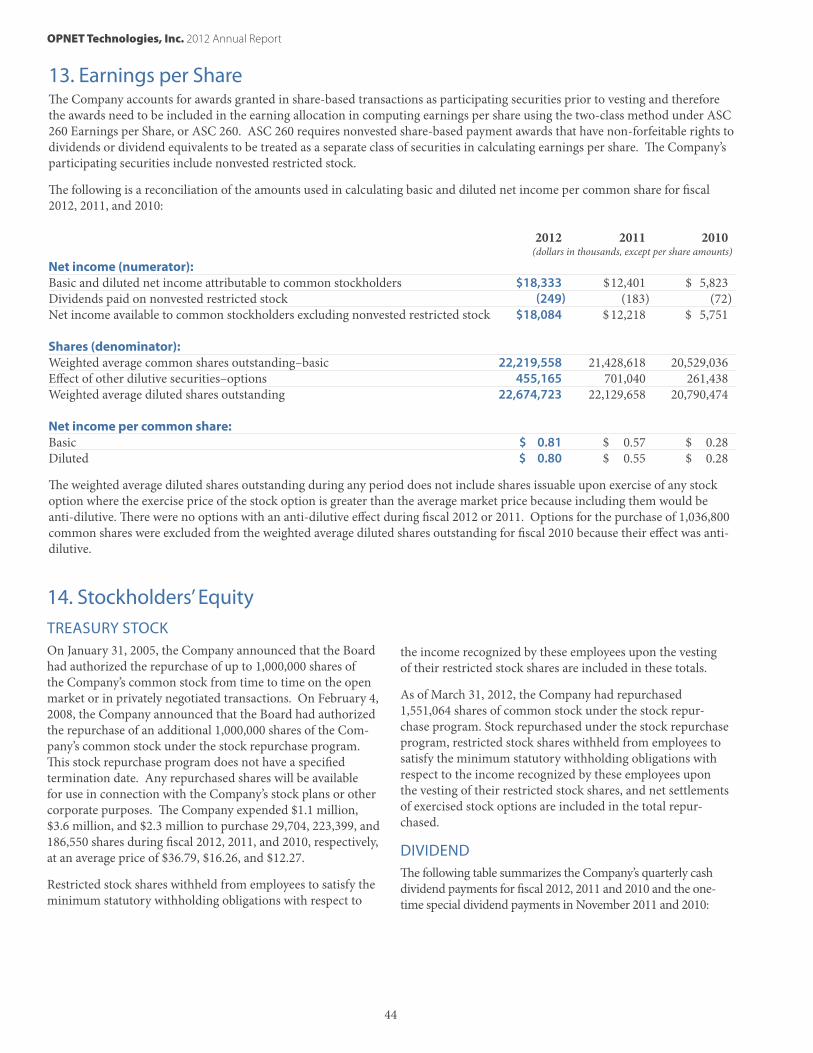
OPNET Technologies, Inc. 2012 Annual Report
44
13. Earnings per Share
The Company accounts for awards granted in share-based transactions as participating securities prior to vesting and therefore the awards need to be included in the earning allocation in computing earnings per share using the two-class method under ASC 260 Earnings per Share, or ASC 260. ASC 260 requires nonvested share-based payment awards that have non-forfeitable rights to dividends or dividend equivalents to be treated as a separate class of securities in calculating earnings per share. The Company’s participating securities include nonvested restricted stock.
The following is a reconciliation of the amounts used in calculating basic and diluted net income per common share for fiscal 2012, 2011, and 2010:
2012 2011 2010 (dollars in thousands, except per share amounts)Net income (numerator): Basic and diluted net income attributable to common stockholders $18,333 $12,401 $ 5,823Dividends paid on nonvested restricted stock (249) (183) (72)Net income available to common stockholders excluding nonvested restricted stock $18,084 $ 12,218 $ 5,751 Shares (denominator): Weighted average common shares outstanding–basic 22,219,558 21,428,618 20,529,036Effect of other dilutive securities–options 455,165 701,040 261,438Weighted average diluted shares outstanding 22,674,723 22,129,658 20,790,474 Net income per common share: Basic $ 0.81 $ 0.57 $ 0.28 Diluted $ 0.80 $ 0.55 $ 0.28
The weighted average diluted shares outstanding during any period does not include shares issuable upon exercise of any stock option where the exercise price of the stock option is greater than the average market price because including them would be anti-dilutive. There were no options with an anti-dilutive effect during fiscal 2012 or 2011. Options for the purchase of 1,036,800 common shares were excluded from the weighted average diluted shares outstanding for fiscal 2010 because their effect was anti-dilutive.
14. Stockholders’ EquityTREASURY STOCKOn January 31, 2005, the Company announced that the Board had authorized the repurchase of up to 1,000,000 shares of the Company’s common stock from time to time on the open market or in privately negotiated transactions. On February 4, 2008, the Company announced that the Board had authorized the repurchase of an additional 1,000,000 shares of the Com-pany’s common stock under the stock repurchase program. This stock repurchase program does not have a specified termination date. Any repurchased shares will be available for use in connection with the Company’s stock plans or other corporate purposes. The Company expended $1.1 million, $3.6 million, and $2.3 million to purchase 29,704, 223,399, and 186,550 shares during fiscal 2012, 2011, and 2010, respectively, at an average price of $36.79, $16.26, and $12.27.
Restricted stock shares withheld from employees to satisfy the minimum statutory withholding obligations with respect to
the income recognized by these employees upon the vesting of their restricted stock shares are included in these totals.
As of March 31, 2012, the Company had repurchased 1,551,064 shares of common stock under the stock repur-chase program. Stock repurchased under the stock repurchase program, restricted stock shares withheld from employees to satisfy the minimum statutory withholding obligations with respect to the income recognized by these employees upon the vesting of their restricted stock shares, and net settlements of exercised stock options are included in the total repur-chased.
DIVIDENDThe following table summarizes the Company’s quarterly cash dividend payments for fiscal 2012, 2011 and 2010 and the one-time special dividend payments in November 2011 and 2010:
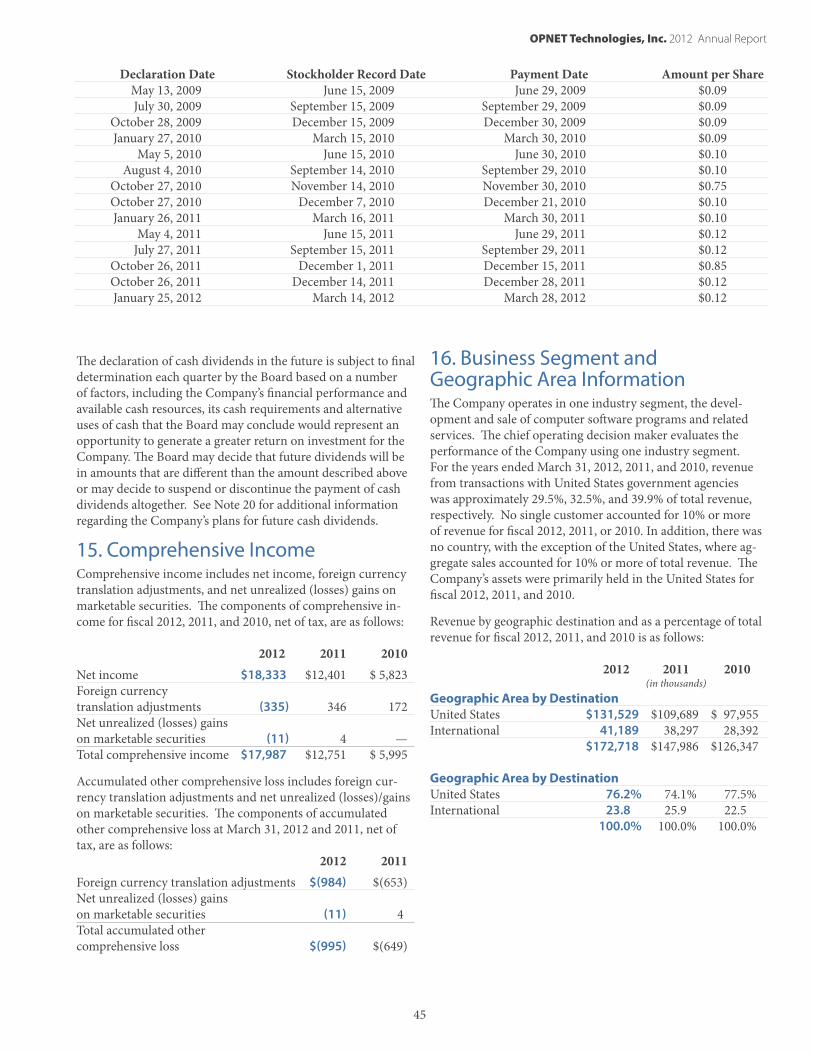
OPNET Technologies, Inc. 2012 Annual Report
45
Declaration Date Stockholder Record Date Payment Date Amount per Share May 13, 2009 June 15, 2009 June 29, 2009 $0.09 July 30, 2009 September 15, 2009 September 29, 2009 $0.09 October 28, 2009 December 15, 2009 December 30, 2009 $0.09 January 27, 2010 March 15, 2010 March 30, 2010 $0.09 May 5, 2010 June 15, 2010 June 30, 2010 $0.10 August 4, 2010 September 14, 2010 September 29, 2010 $0.10 October 27, 2010 November 14, 2010 November 30, 2010 $0.75 October 27, 2010 December 7, 2010 December 21, 2010 $0.10 January 26, 2011 March 16, 2011 March 30, 2011 $0.10 May 4, 2011 June 15, 2011 June 29, 2011 $0.12 July 27, 2011 September 15, 2011 September 29, 2011 $0.12 October 26, 2011 December 1, 2011 December 15, 2011 $0.85 October 26, 2011 December 14, 2011 December 28, 2011 $0.12 January 25, 2012 March 14, 2012 March 28, 2012 $0.12
The declaration of cash dividends in the future is subject to final determination each quarter by the Board based on a number of factors, including the Company’s financial performance and available cash resources, its cash requirements and alternative uses of cash that the Board may conclude would represent an opportunity to generate a greater return on investment for the Company. The Board may decide that future dividends will be in amounts that are different than the amount described above or may decide to suspend or discontinue the payment of cash dividends altogether. See Note 20 for additional information regarding the Company’s plans for future cash dividends.
15. Comprehensive IncomeComprehensive income includes net income, foreign currency translation adjustments, and net unrealized (losses) gains on marketable securities. The components of comprehensive in-come for fiscal 2012, 2011, and 2010, net of tax, are as follows:
2012 2011 2010
Net income $18,333 $12,401 $ 5,823 Foreign currency translation adjustments (335) 346 172 Net unrealized (losses) gains on marketable securities (11) 4 — Total comprehensive income $17,987 $12,751 $ 5,995
Accumulated other comprehensive loss includes foreign cur-rency translation adjustments and net unrealized (losses)/gains on marketable securities. The components of accumulated other comprehensive loss at March 31, 2012 and 2011, net of tax, are as follows: 2012 2011
Foreign currency translation adjustments $(984) $(653) Net unrealized (losses) gains on marketable securities (11) 4 Total accumulated other comprehensive loss $(995) $(649)
16. Business Segment and Geographic Area Information The Company operates in one industry segment, the devel-opment and sale of computer software programs and related services. The chief operating decision maker evaluates the performance of the Company using one industry segment. For the years ended March 31, 2012, 2011, and 2010, revenue from transactions with United States government agencies was approximately 29.5%, 32.5%, and 39.9% of total revenue, respectively. No single customer accounted for 10% or more of revenue for fiscal 2012, 2011, or 2010. In addition, there was no country, with the exception of the United States, where ag-gregate sales accounted for 10% or more of total revenue. The Company’s assets were primarily held in the United States for fiscal 2012, 2011, and 2010.
Revenue by geographic destination and as a percentage of total revenue for fiscal 2012, 2011, and 2010 is as follows:
2012 2011 2010 (in thousands)Geographic Area by Destination United States $131,529 $109,689 $ 97,955 International 41,189 38,297 28,392 $172,718 $147,986 $126,347 Geographic Area by Destination United States 76.2% 74.1% 77.5%International 23.8 25.9 22.5 100.0% 100.0% 100.0%
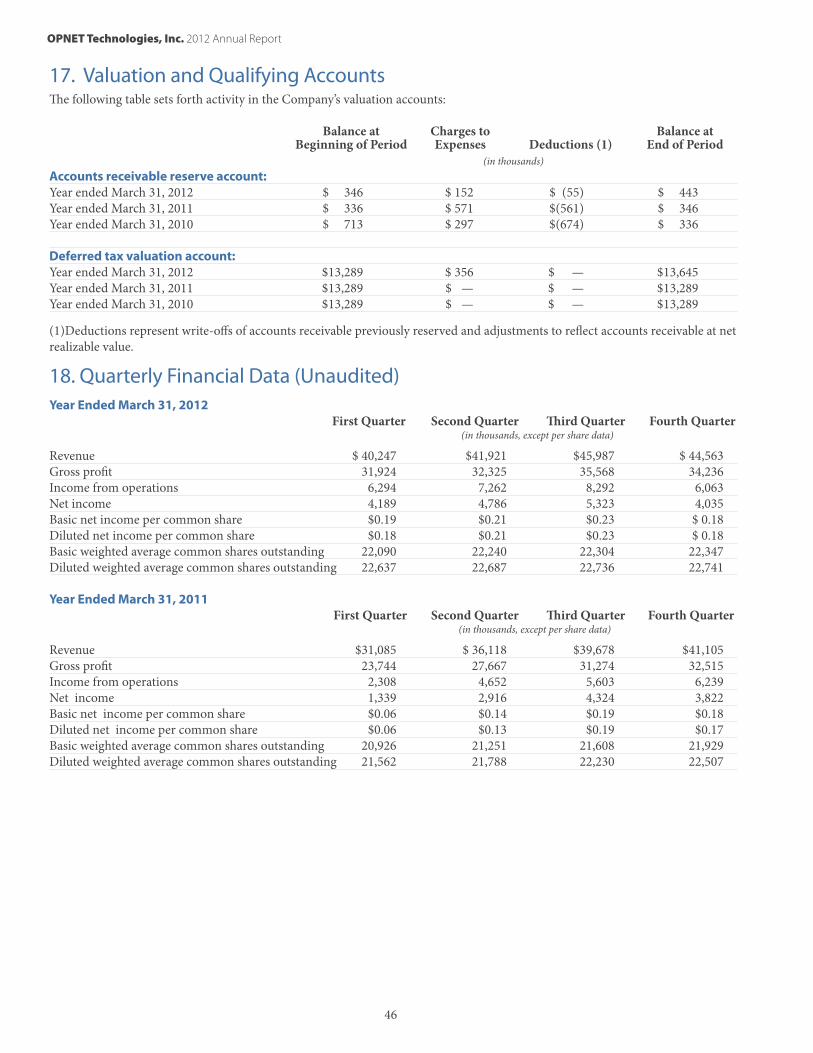
OPNET Technologies, Inc. 2012 Annual Report
46
17. Valuation and Qualifying Accounts The following table sets forth activity in the Company’s valuation accounts:
Balance at Charges to Balance at Beginning of Period Expenses Deductions (1) End of Period (in thousands)Accounts receivable reserve account: Year ended March 31, 2012 $ 346 $ 152 $ (55) $ 443Year ended March 31, 2011 $ 336 $ 571 $(561) $ 346 Year ended March 31, 2010 $ 713 $ 297 $(674) $ 336 Deferred tax valuation account: Year ended March 31, 2012 $13,289 $ 356 $ — $13,645Year ended March 31, 2011 $13,289 $ — $ — $13,289Year ended March 31, 2010 $13,289 $ — $ — $13,289
(1)Deductions represent write-offs of accounts receivable previously reserved and adjustments to reflect accounts receivable at net realizable value.
18. Quarterly Financial Data (Unaudited) Year Ended March 31, 2012 First Quarter Second Quarter Third Quarter Fourth Quarter (in thousands, except per share data)
Revenue $ 40,247 $41,921 $45,987 $ 44,563Gross profit 31,924 32,325 35,568 34,236Income from operations 6,294 7,262 8,292 6,063Net income 4,189 4,786 5,323 4,035Basic net income per common share $0.19 $0.21 $0.23 $ 0.18Diluted net income per common share $0.18 $0.21 $0.23 $ 0.18Basic weighted average common shares outstanding 22,090 22,240 22,304 22,347Diluted weighted average common shares outstanding 22,637 22,687 22,736 22,741
Year Ended March 31, 2011 First Quarter Second Quarter Third Quarter Fourth Quarter (in thousands, except per share data)
Revenue $31,085 $ 36,118 $39,678 $41,105 Gross profit 23,744 27,667 31,274 32,515Income from operations 2,308 4,652 5,603 6,239Net income 1,339 2,916 4,324 3,822 Basic net income per common share $0.06 $0.14 $0.19 $0.18Diluted net income per common share $0.06 $0.13 $0.19 $0.17Basic weighted average common shares outstanding 20,926 21,251 21,608 21,929Diluted weighted average common shares outstanding 21,562 21,788 22,230 22,507
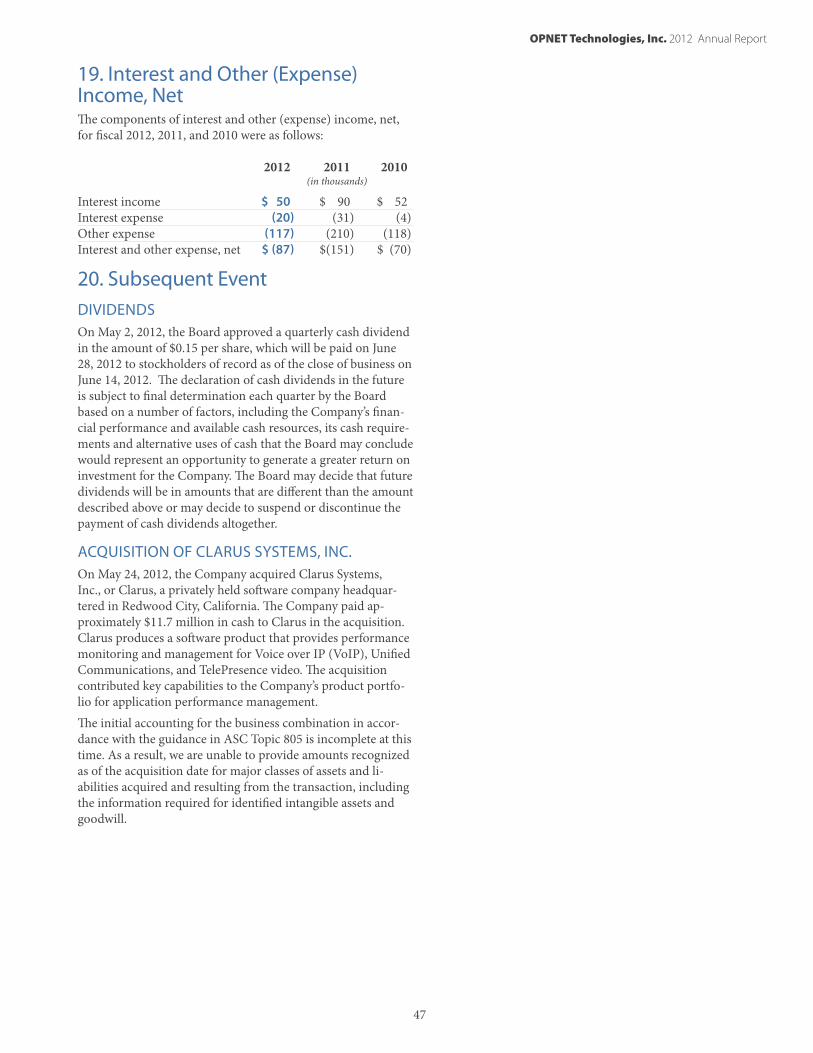
OPNET Technologies, Inc. 2012 Annual Report
47
19. Interest and Other (Expense) Income, NetThe components of interest and other (expense) income, net, for fiscal 2012, 2011, and 2010 were as follows:
2012 2011 2010 (in thousands)
Interest income $ 50 $ 90 $ 52Interest expense (20) (31) (4)Other expense (117) (210) (118)Interest and other expense, net $ (87) $(151) $ (70)
20. Subsequent EventDIVIDENDSOn May 2, 2012, the Board approved a quarterly cash dividend in the amount of $0.15 per share, which will be paid on June 28, 2012 to stockholders of record as of the close of business on June 14, 2012. The declaration of cash dividends in the future is subject to final determination each quarter by the Board based on a number of factors, including the Company’s finan-cial performance and available cash resources, its cash require-ments and alternative uses of cash that the Board may conclude would represent an opportunity to generate a greater return on investment for the Company. The Board may decide that future dividends will be in amounts that are different than the amount described above or may decide to suspend or discontinue the payment of cash dividends altogether.
ACQUISITION OF CLARUS SYSTEMS, INC.On May 24, 2012, the Company acquired Clarus Systems, Inc., or Clarus, a privately held software company headquar-tered in Redwood City, California. The Company paid ap-proximately $11.7 million in cash to Clarus in the acquisition. Clarus produces a software product that provides performance monitoring and management for Voice over IP (VoIP), Unified Communications, and TelePresence video. The acquisition contributed key capabilities to the Company’s product portfo-lio for application performance management.
The initial accounting for the business combination in accor-dance with the guidance in ASC Topic 805 is incomplete at this time. As a result, we are unable to provide amounts recognized as of the acquisition date for major classes of assets and li-abilities acquired and resulting from the transaction, including the information required for identified intangible assets and goodwill.
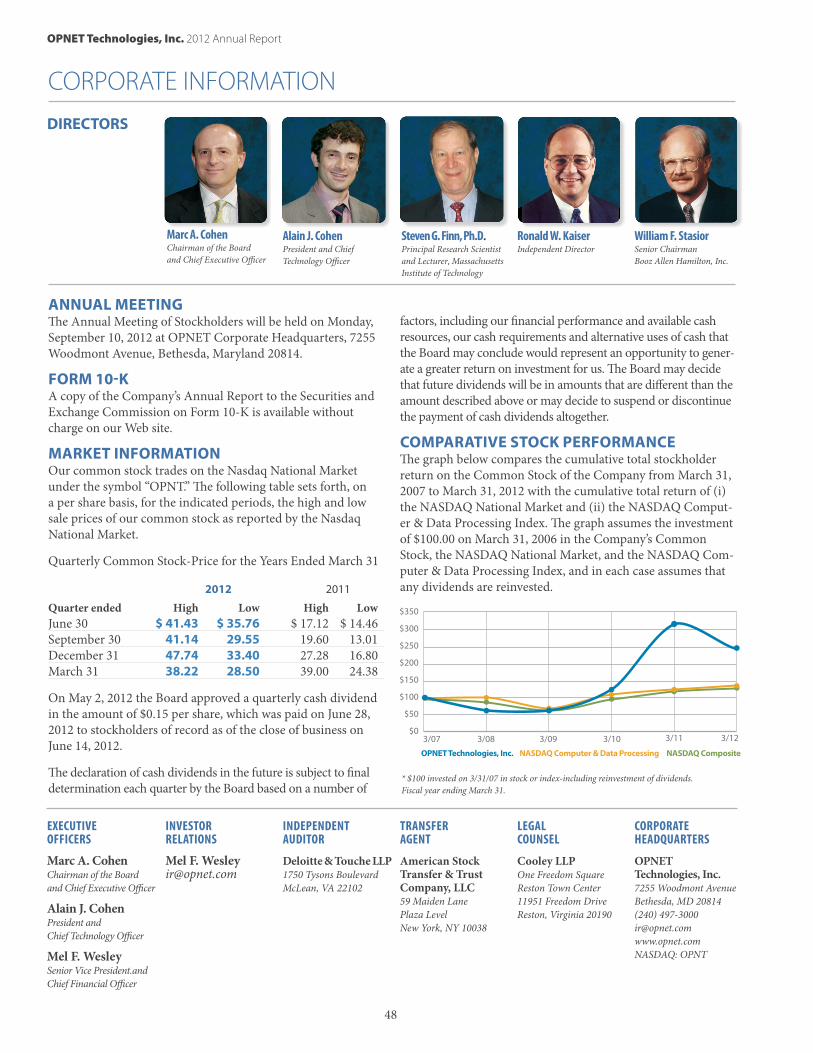
OPNET Technologies, Inc. 2012 Annual Report
48
ANNUAL MEETING The Annual Meeting of Stockholders will be held on Monday, September 10, 2012 at OPNET Corporate Headquarters, 7255 Woodmont Avenue, Bethesda, Maryland 20814.
FORM 10-K A copy of the Company’s Annual Report to the Securities and Exchange Commission on Form 10-K is available without charge on our Web site.
MARKET INFORMATION Our common stock trades on the Nasdaq National Market under the symbol “OPNT.” The following table sets forth, on a per share basis, for the indicated periods, the high and low sale prices of our common stock as reported by the Nasdaq National Market.
Quarterly Common Stock-Price for the Years Ended March 31
2012 2011
Quarter ended High Low High LowJune 30 $ 41.43 $ 35.76 $ 17.12 $ 14.46 September 30 41.14 29.55 19.60 13.01December 31 47.74 33.40 27.28 16.80March 31 38.22 28.50 39.00 24.38
On May 2, 2012 the Board approved a quarterly cash dividend in the amount of $0.15 per share, which was paid on June 28, 2012 to stockholders of record as of the close of business on June 14, 2012.
The declaration of cash dividends in the future is subject to final determination each quarter by the Board based on a number of
EXECUTIVE OFFICERS
Marc A. Cohen Chairman of the Board and Chief Executive Officer
Alain J. Cohen President and Chief Technology Officer
Mel F. Wesley Senior Vice President.and Chief Financial Officer
CORPORATE INFORMATION
3/07
$100
$50
$150
$0
$200
$250
$300
$350
3/08 3/09 3/10 3/11 3/12
NASDAQ Composite
NASDAQ Composite
NASDAQ Computer & Data Processing
NASDAQ Computer & Data Processing
OPNET Technologies, Inc.
OPNET Technologies, Inc.
* $100 invested on 3/31/07 in stock or index-including reinvestment of dividends. Fiscal year ending March 31.
DIRECTORS
INVESTOR RELATIONS
Mel F. Wesley [email protected]
INDEPENDENT AUDITOR
Deloitte & Touche LLP 1750 Tysons Boulevard McLean, VA 22102
TRANSFER AGENT
American Stock Transfer & Trust Company, LLC 59 Maiden Lane Plaza Level New York, NY 10038
LEGAL COUNSEL
Cooley LLP One Freedom Square Reston Town Center 11951 Freedom Drive Reston, Virginia 20190
CORPORATE HEADQUARTERS
OPNET Technologies, Inc. 7255 Woodmont Avenue Bethesda, MD 20814 (240) 497-3000 [email protected] www.opnet.com NASDAQ: OPNT
factors, including our financial performance and available cash resources, our cash requirements and alternative uses of cash that the Board may conclude would represent an opportunity to gener-ate a greater return on investment for us. The Board may decide that future dividends will be in amounts that are different than the amount described above or may decide to suspend or discontinue the payment of cash dividends altogether.
COMPARATIVE STOCK PERFORMANCE The graph below compares the cumulative total stockholder return on the Common Stock of the Company from March 31, 2007 to March 31, 2012 with the cumulative total return of (i) the NASDAQ National Market and (ii) the NASDAQ Comput-er & Data Processing Index. The graph assumes the investment of $100.00 on March 31, 2006 in the Company’s Common Stock, the NASDAQ National Market, and the NASDAQ Com-puter & Data Processing Index, and in each case assumes that any dividends are reinvested.
Marc A. Cohen Chairman of the Board and Chief Executive Officer
Alain J. Cohen President and Chief Technology Officer
Steven G. Finn, Ph.D. Principal Research Scientist and Lecturer, Massachusetts Institute of Technology
Ronald W. Kaiser Independent Director
William F. Stasior Senior Chairman Booz Allen Hamilton, Inc.


OPNET Technologies, Inc.
7255 Woodmont Avenue
Bethesda, Maryland 20814, USA
phone: (240) 497-3000
email: [email protected]
Investor Relations: [email protected]
www.opnet.com
ALL TRADEMARKS ARE THE PROPERTY OF THEIR RESPECTIVE OWNERS. © 2012 OPNET Technologies, Inc. All rights reserved.