Embed Size (px)
Citation preview
MARKET POWER IN INTERNATIONAL COMMODITY TRADE:THE CASE OF COFFEE∗
MITSURU IGAMI†
February 26, 2014
This paper studies the impact of market power on international commodity prices.I use a standard oligopoly model and exploit historical variations in the structure ofthe international coffee bean market to assess the impact of a cartel treaty on coffeeprices and its global welfare consequences. The results suggest the International CoffeeAgreement (ICA, 1965–89) raised its price by 75% above the Cournot-competitive level,annually transferring approximately $12 billion from consumers to exporting countries,and its lapse in 1989 explains four-fifths of the subsequent price decline, that is, the‘coffee crisis.’
I. INTRODUCTION
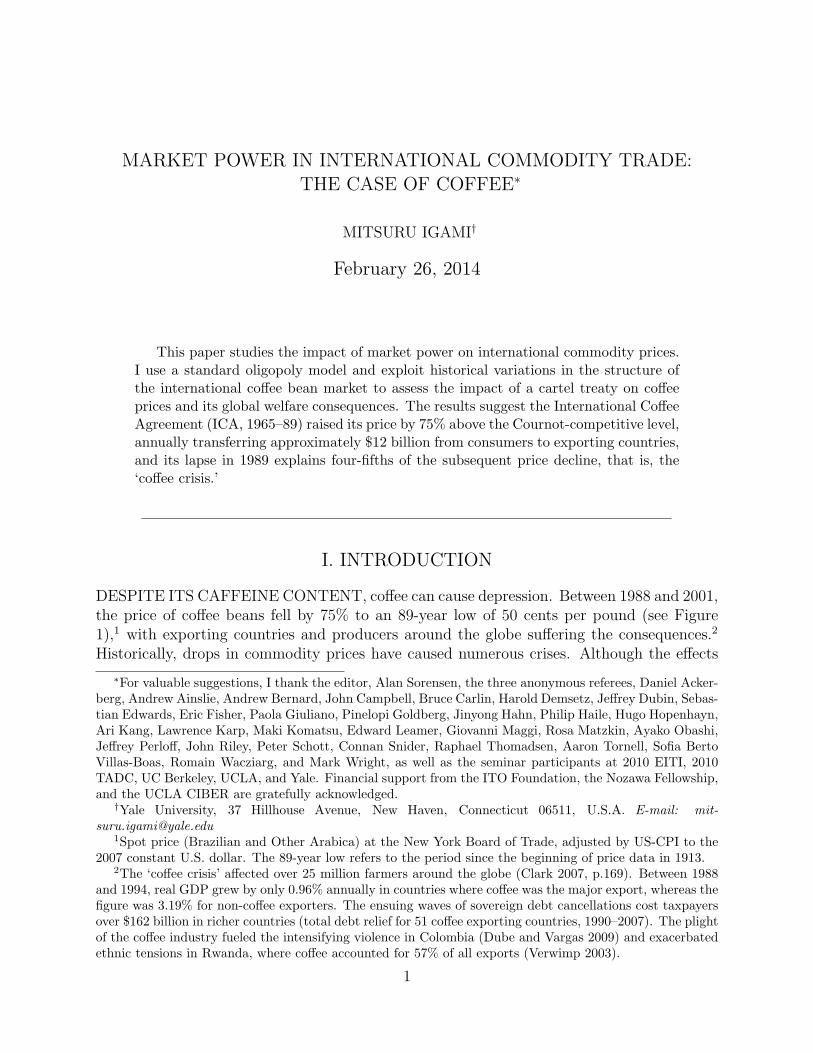
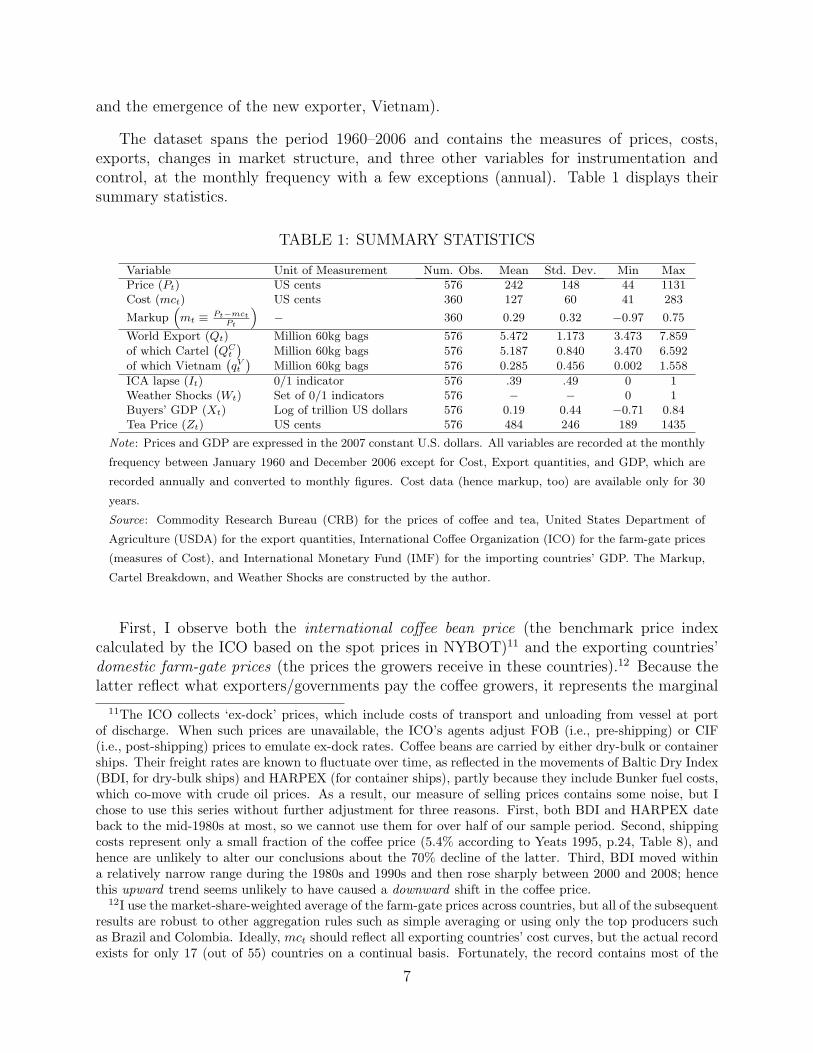
DESPITE ITS CAFFEINE CONTENT, coffee can cause depression. Between 1988 and 2001,the price of coffee beans fell by 75% to an 89-year low of 50 cents per pound (see Figure1),1 with exporting countries and producers around the globe suffering the consequences.2
Historically, drops in commodity prices have caused numerous crises. Although the effects
∗For valuable suggestions, I thank the editor, Alan Sorensen, the three anonymous referees, Daniel Acker-berg, Andrew Ainslie, Andrew Bernard, John Campbell, Bruce Carlin, Harold Demsetz, Jeffrey Dubin, Sebas-tian Edwards, Eric Fisher, Paola Giuliano, Pinelopi Goldberg, Jinyong Hahn, Philip Haile, Hugo Hopenhayn,Ari Kang, Lawrence Karp, Maki Komatsu, Edward Leamer, Giovanni Maggi, Rosa Matzkin, Ayako Obashi,Jeffrey Perloff, John Riley, Peter Schott, Connan Snider, Raphael Thomadsen, Aaron Tornell, Sofia BertoVillas-Boas, Romain Wacziarg, and Mark Wright, as well as the seminar participants at 2010 EITI, 2010TADC, UC Berkeley, UCLA, and Yale. Financial support from the ITO Foundation, the Nozawa Fellowship,and the UCLA CIBER are gratefully acknowledged.
†Yale University, 37 Hillhouse Avenue, New Haven, Connecticut 06511, U.S.A. E-mail: [email protected]
1Spot price (Brazilian and Other Arabica) at the New York Board of Trade, adjusted by US-CPI to the2007 constant U.S. dollar. The 89-year low refers to the period since the beginning of price data in 1913.
2The ‘coffee crisis’ affected over 25 million farmers around the globe (Clark 2007, p.169). Between 1988and 1994, real GDP grew by only 0.96% annually in countries where coffee was the major export, whereas thefigure was 3.19% for non-coffee exporters. The ensuing waves of sovereign debt cancellations cost taxpayersover $162 billion in richer countries (total debt relief for 51 coffee exporting countries, 1990–2007). The plightof the coffee industry fueled the intensifying violence in Colombia (Dube and Vargas 2009) and exacerbatedethnic tensions in Rwanda, where coffee accounted for 57% of all exports (Verwimp 2003).
1
of these crises are often documented, few studies have analyzed their causes.3 This paperempirically investigates the causal mechanism of commodity price fluctuations.
0
100
200
300
400
1960 1970 1980 1990 2000
Unadjusted Price
Adjusted for Weather Shocks
(cents/lb)
Note: The prices are in the 2007 constant US dollar. The Adjusted price plots the residual from regressing the
original Unadjusted price on the weather shock variable, which is explained in section 3.
Source: Commodity Research Bureau (CRB), Bureau of Labor Statistics (BLS), United States Department of
Agriculture (USDA), and author’s calculations.
Figure 1: Real Price of Coffee Beans
International commodity markets determine the prices of basic inputs to our economiessuch as food and energy. Their price fluctuations affect the well-being of consumers inthe importing countries as well as developing countries’ macroeconomic performance, whichtypically depends on commodity export revenues. Little is known, however, about their pricedetermination mechanisms, aside from a few statistical properties of commodity price timeseries (c.f., Deaton 1999, Deaton and Laroque 2003). The common belief is that commodityprices are unpredictable, and, because commodity markets are often cited as a textbookexample of perfect competition, few analysts suspect market power as an explanation ofprice movements.4 However, a closer look at the supply side and the institutional features ofthese markets reveals the prevalence of cartels and oligopolies. For example, Slade and Thille(2006) documented cartel arrangements in the base metals markets (aluminum, copper, lead,nickel, tin, and zinc). Even when individual producers at the sub-national level are atomistic,exporting institutions and international agreements often create a virtual oligopoly of severalnations at the international level, as Gilbert (1996) demonstrated in his historical assessmentof the international commodity agreements of cocoa, coffee, rubber, sugar, and tin.5 To better
3Researchers have investigated the welfare consequences of commodity price movements for nationaleconomies (e.g., Catao and Sutton 2002) as well as rural households (e.g., Varangis et al 2003), but fewstudies have analyzed the determinants of commodity prices.
4Researchers tend to assume perfect competition, taking price fluctuations as random shocks (e.g.,Akiyama and Varangis 1990, Mehta and Chavas 2008).
5Other examples include OPEC, which controls a sizable proportion of the world’s crude oil exports.
2
understand the role of market power in commodity price fluctuations, this paper studies thecase of coffee beans and shows changes in market power caused one of the largest commoditycrises in history, the ‘coffee crisis.’ Further, the paper shows changes in market power werethemselves the outcomes of international politics.
The purpose of this research is threefold: (1) to measure market power embodied bythe International Coffee Agreement (ICA, 1965–89), an international cartel treaty; (2) toevaluate its welfare impact on both exporting and importing countries; and (3) to assessthe extent to which the change in international trade regimes can explain the coffee crisisapart from other factors such as the emergence of a fringe exporter country (Vietnam) andweather shocks (frosts in Brazil). I approach this empirical problem by exploiting historicalvariations in the structure of the international coffee bean market and estimating a standardmodel of demand and oligopolistic competition. The results suggest the ICA raised pricesby 75% above the Cournot-competitive level that would have prevailed in the absence of thecartel treaty, annually transferring approximately $12 billion from importing to exportingcountries, and its lapse in 1989 can explain four-fifths of the subsequent price decline, thatis, the coffee crisis.
With trading volume second only to crude oil and 55 exporting countries, which accountfor 42% of all developing countries and 59% of highly indebted poor countries (HIPCs), thecoffee bean market represents a relevant economic context for investigating the causes of pricefluctuations, which policymakers need to understand in order to alleviate the consequences.The coffee bean market is therefore interesting and important in itself, but focusing on thiscommodity has other merits. First, of all price movements within primary commodities, thatof the coffee bean is one of the most sensitive to the economic fundamentals of short-runsupply and demand. By contrast, commodities such as crude oil and metals are storableand require a decade-long technological extraction process that entails much uncertainty.Second, the coffee cartel was simple in that it was based on an export quota system. Thisfeature allowed my analysis to focus on price, cost, and export quantities. Other interna-tional commodity agreements, in contrast, often employ more complex rules such as bufferstock inventories, which would materially complicate the analysis without adding signifi-cant insight.6 Finally, some producing countries rely on coffee beans for more than half oftheir entire export revenues (e.g., El Salvador and Uganda). Hence the coffee price could becalled their ‘real exchange rate,’ fluctuations of which are tantamount to true macroeconomicshocks. These features render the study of the coffee bean industry particularly fruitful, interms of both analytical clarity and substantive interests.
The two common challenges for empirical studies of collusion and market power, such asthis paper, are the identification of changes in cooperative regimes and the identification ofmarket power apart from marginal costs. The institutional context of the coffee bean marketameliorates the first problem because, curiously, the government of the United States, thelargest importing country, offered crucial supports for the proper functioning of the explicit
De Beers exercised monopoly power over the diamond market to the extent that no open, public marketexisted. Spar (1994) analyzes international cartels in the markets for diamonds, uranium, gold, and silver.Stocking and Watkins (1946) document the prevalence of cartels in the markets of sugar, rubber, nitrogen,steel, aluminum, magnesium, and various chemical products in the first half of the 20th century.
6Deaton and Laroque (1992 and 1996) found that storage and speculative inventories did not appear toexplain important features of commodity prices.
3

cartel treaty among the exporting countries, and because U.S. foreign policy exhibited clearchanges in its attitude toward this international treaty, which the U.S. government used asa tool of foreign aid to countries in the south, under an umbrella geopolitical strategy of‘fight against communism.’ Thus, by focusing on an explicit cartel treaty and exploiting theexogenous changes in the U.S. foreign policy regime, this paper departs from the traditionalfocus on tacit collusion in the literature (e.g., Porter 1983, Bresnahan 1987, and Ellison 1994)and shares the spirit of Asker (2010) in examining situations in which external evidence existson the internal functioning of cartels. In the context of international trade, this paper alsoshares the emphasis of Bagwell and Staiger (2002) on country-level strategic interactions intrade agreements.
I solve the second empirical challenge of estimating market power separately frommarginal costs by using data on the marginal costs of exporting coffee beans (i.e., domesticfarm-gate prices in exporting countries), which, combined with the international commodityprice data, allow us to directly measure market power in the form of markup or Lerner index.Hence my empirical strategy is closer to Genesove and Mullin’s (1998), who also observedthe marginal costs of processing sugar, than that of Bresnahan (1982), who proposed anapproach to estimate marginal costs and market power simultaneously.
I have organized the rest of the paper as follows. Section II summarizes the institutionaland historical background of the international coffee bean market. Section III explains thedataset and shows the preliminary data analysis. Section IV describes the model of thecoffee export market. Section V reports the estimation results. Section VI presents welfareanalysis of the cartel treaty, and decomposition of the ‘coffee crisis.’ Section VII concludes.
II. THE INTERNATIONAL COFFEE BEAN MARKET
This section provides the institutional background of the international coffee bean market.First I describe the profiles of coffee importers and exporters, as well as product charac-teristics. Then I explain the historical context of the cartel treaty and fringe competitor,which is crucial for understanding the geopolitical nature of the changes in market structure.Specifically, I argue that both the rise and fall of the international cartel agreement, as wellas the expansion of Vietnamese exports, were out-of-the-blue shocks to the export market,thus providing the econometrician with rich exogenous variations in data. The variationswere direct reflections of U.S. foreign policies and Vietnam’s rural development projects.
Americans drink, on average, 1.76 cups of coffee a day, whereas Europeans down 2.04cups. Even the green-tea-loving Japanese enjoy 1.42 cups of coffee.7 Together, the capitalist‘first world’ imported over 90% of the global coffee bean harvest in the sample period (1960–2006). Most of these countries (except for New Zealand and Israel) were ‘importing members’of the ICA. Their customs officials ensured shipping carried the ICA’s stamp of approval,thereby monitoring and enforcing the exporters’ quota allocation. In essence, the ICA wasa form of development assistance from the ‘first world’ (see section II(ii) for details).
7Calculation based on the International Coffee Organization’s 2005 survey. I follow America’s NationalCoffee Association to equate an annual consumption of 1 kilogram with 0.42 cup per day (6.5 grams percup).
4
The socialist ‘second world,’ or ‘non-member market,’ imported approximately 5% ofall coffee beans. This market was composed of fringe buyers and formed the unregulated‘black’ market. Transactions in this market were not systematically recorded, but evidencesuggests black-market prices were 30% to 40% lower than in the regulated market. This pricelevel was roughly equal to the domestic farm-gate/wholesale prices in exporting countries.This finding implies marginal cost pricing by exporting countries, which is not surprising,because they customarily dumped excess harvest (supply above quota) to the socialist bloc.Thus the ‘second world’ played the role of the buyer of last resort, or a safety valve, for the‘third-world’ farmers.
To satisfy these peoples in the ‘North,’ the ‘South’ exports over $10 billion worth (or 80million 60kg bags) of green coffee beans every year. Coffee cultivation requires tropical high-lands, thereby determining the producing regions. No significant entry or exit has occurredsince the 1960s, aside from the rise of Vietnam. Fifty-five countries across Africa, Asia, andLatin America, with many small farms within each nation, export coffee beans.
Government bodies in these countries, such as national coffee marketing boards, regu-lated the industry and worked as a domestic planning/coordination agency. Because theinternational cartel agreement (an export quota system) worked at the supra-national level,my analysis focuses on nation states as the export decision makers, and particularly on theircollective behavior in the global market.
Green beans (coffee’s raw material form before roasting, grinding, and brewing) arecommonly classified into the following four categories in the world’s commodity exchanges:Colombian Mild Arabica, Other Mild Arabica, Brazilian Natural Arabica, and Robusta, butthe cartel’s operation was based on the single indicator price (the weighted average of thefour different coffee prices). Thus, to maintain consistency with the cartel’s practice andto focus on the measurement of its market power, I followed previous studies (Karp andPerloff 1993, Nakamura and Zerom 2010) in characterizing green coffee beans traded oninternational commodity exchanges as homogeneous goods.
The ICA was kept in place between 1965 and 1989 for the purpose of maintaining high cof-fee prices. Its primary mechanism was export quotas, which were allocated across countriesin proportion to their historical market share.8 These quotas were then revised up or downacross the board in response to the movements of the indicator price. The decision-makingat the International Coffee Organization (ICO), the ICA’s administrative body, relied onvoting by both the exporting and importing member countries. All major decisions requireda two-thirds majority. The votes were also allocated proportional to countries’ trade shares,so the largest exporters (notably Brazil and Colombia) as well as the United States held vetopower.
Despite some shortfalls, the ICA was widely considered one of the most successful com-modity agreements in history. Cooperation among producers remained problematic, butthe crucial support came from the importing members in the form of the monitoring andenforcement of quotas. The fact that the United States used its other aid programs to offerinducements and sanctions also helped. As Bates (1997) documents, ‘The U.S. governmentwas intensely aware that the success of its broader development assistance programs in Latin
8See Bates (1997), ch. 6 for the details of the ICA’s functioning.
5

America would be strongly affected by the success of the International Coffee Agreement.’(p.146)
But the honeymoon between the first and third worlds ended abruptly in 1989, when thesecond world imploded. The collapse of its Cold War enemy, and with it the rationale forhurting American consumers through high prices under the ICA, led the United States towithdraw its support. The ICA ended on July 4, 1989.9 Without American policing, noneof the subsequent resuscitation efforts proved fruitful, which reinforces our view of the ICAas an American foreign policy instrument.
The growth of Vietnam’s coffee bean production was primarily driven by the geographicalexpansion of Doi Moi policies, on the back of foreign aid and large-scale ethnic migrationschemes. These policies, in turn, stemmed from the geopolitical concerns of the post-warcentral planners. Such historical developments do not necessarily preclude the importanceof economic incentives. Certainly, the goal of Doi Moi was the gradual transition fromcentral planning to a market-based economy. The planners promoted coffee because Vietnamcould produce it cheaply for profitable export. For the purpose of subsequent econometricanalyses, however, the crucial aspect of Vietnam’s modern history is that the growth ofcoffee production occurred for those idiosyncratic reasons in a series of five-year plans, andmostly in isolation from the year-to-year price fluctuations in the global market.10 By thelate 1990s, Vietnam had dethroned Colombia as the world’s second-largest exporter (withBrazil still the largest), putting further downward pressure on the price of coffee beans. Theoverall process of production growth would be best characterized as a (rare) success story ofa developmental ‘big push.’
In summary, the international coffee bean market consists of the developed countries(as importers) and developing countries (as exporters). The latter enjoyed market powerunder the ICA (1965–89), the rise and fall of which were driven by the U.S. government’sCold War concerns. The socialist bloc played the role of fringe importers, representing asmall, unregulated market for exporters. The breakdown of the coffee cartel coincided withthe emergence of Vietnam as a fringe exporter urged along by foreign aid, government-ledmigration, and market-oriented reforms. Thus both the cartel’s breakdown and Vietnam’sexpanded exportation represent changes in market structure that are exogenous to the year-by-year price fluctuations in the global market. See Appendix A for further institutionaldetails.
III. DATA
This section describes the dataset. In Appendix B, I report the preliminary data analysis,regressing the coffee price on changes in the market structure (i.e., the cartel’s breakdown
9During the late 1980s, Secretary of State George Shultz demanded all international commodity treatiesbe reviewed by the State Department’s Division of Economic Affairs, staffed with economists from Chicago,who subsequently recommended the withdrawal from these treaties. See Bates (1997, ch.7) and Clark (2007,ch.6) for the details of this political process.
10The Vietnamese government had not entered coffee trade negotiations before reaching its geographicallimit of production in 2001. Vietnam finally became a member of the International Coffee Organization(ICO) on May 7, 2002, and of the World Trade Organization on January 11, 2007.
6
and the emergence of the new exporter, Vietnam).
The dataset spans the period 1960–2006 and contains the measures of prices, costs,exports, changes in market structure, and three other variables for instrumentation andcontrol, at the monthly frequency with a few exceptions (annual). Table 1 displays theirsummary statistics.
TABLE 1: SUMMARY STATISTICS
Variable Unit of Measurement Num. Obs. Mean Std. Dev. Min MaxPrice (Pt) US cents 576 242 148 44 1131Cost (mct) US cents 360 127 60 41 283
Markup(mt ≡ Pt−mct
Pt
)− 360 0.29 0.32 −0.97 0.75
World Export (Qt) Million 60kg bags 576 5.472 1.173 3.473 7.859of which Cartel
(QC
t
)Million 60kg bags 576 5.187 0.840 3.470 6.592
of which Vietnam(qVt
)Million 60kg bags 576 0.285 0.456 0.002 1.558
ICA lapse (It) 0/1 indicator 576 .39 .49 0 1Weather Shocks (Wt) Set of 0/1 indicators 576 − − 0 1Buyers’ GDP (Xt) Log of trillion US dollars 576 0.19 0.44 −0.71 0.84Tea Price (Zt) US cents 576 484 246 189 1435
Note: Prices and GDP are expressed in the 2007 constant U.S. dollars. All variables are recorded at the monthly
frequency between January 1960 and December 2006 except for Cost, Export quantities, and GDP, which are
recorded annually and converted to monthly figures. Cost data (hence markup, too) are available only for 30
years.
Source: Commodity Research Bureau (CRB) for the prices of coffee and tea, United States Department of
Agriculture (USDA) for the export quantities, International Coffee Organization (ICO) for the farm-gate prices
(measures of Cost), and International Monetary Fund (IMF) for the importing countries’ GDP. The Markup,
Cartel Breakdown, and Weather Shocks are constructed by the author.
First, I observe both the international coffee bean price (the benchmark price indexcalculated by the ICO based on the spot prices in NYBOT)11 and the exporting countries’domestic farm-gate prices (the prices the growers receive in these countries).12 Because thelatter reflect what exporters/governments pay the coffee growers, it represents the marginal
11The ICO collects ‘ex-dock’ prices, which include costs of transport and unloading from vessel at portof discharge. When such prices are unavailable, the ICO’s agents adjust FOB (i.e., pre-shipping) or CIF(i.e., post-shipping) prices to emulate ex-dock rates. Coffee beans are carried by either dry-bulk or containerships. Their freight rates are known to fluctuate over time, as reflected in the movements of Baltic Dry Index(BDI, for dry-bulk ships) and HARPEX (for container ships), partly because they include Bunker fuel costs,which co-move with crude oil prices. As a result, our measure of selling prices contains some noise, but Ichose to use this series without further adjustment for three reasons. First, both BDI and HARPEX dateback to the mid-1980s at most, so we cannot use them for over half of our sample period. Second, shippingcosts represent only a small fraction of the coffee price (5.4% according to Yeats 1995, p.24, Table 8), andhence are unlikely to alter our conclusions about the 70% decline of the latter. Third, BDI moved withina relatively narrow range during the 1980s and 1990s and then rose sharply between 2000 and 2008; hencethis upward trend seems unlikely to have caused a downward shift in the coffee price.
12I use the market-share-weighted average of the farm-gate prices across countries, but all of the subsequentresults are robust to other aggregation rules such as simple averaging or using only the top producers suchas Brazil and Colombia. Ideally, mct should reflect all exporting countries’ cost curves, but the actual recordexists for only 17 (out of 55) countries on a continual basis. Fortunately, the record contains most of the
7
cost of exporting.13 Studies on the international ‘black’ market (see section II) suggest theprevailing price in that unregulated, perfectly competitive market equals those farm-gateprices in exporting countries. This is yet another way in which the farm-gate price (≈ theblack-market price) reflects the opportunity cost (marginal cost) for a country to export tothe ICA-member (i.e., regulated) market. Given these data, I was able to measure exporters’market power by markup (price-cost margin, or the Lerner index): mt ≡ Pt−mct
Pt.
Second, I examined the exports of coffee by country. Three quantities are particularlyimportant for the subsequent analyses: world exports, cartel members’ collective exports, andVietnam’s export (denoted by Qt, Q
Ct , and qVt , respectively). This qVt reflects the sudden
acceleration of the Vietnamese production, a government-led ‘big push’ (see section II(iii) forthe institutional background). Together with qVt , the ICA lapse dummy (which equals zerobefore July 1989 and one since then) represents the shift in the U.S. foreign policy regimetoward the end of the Cold War, and the change in market power induced by the ICA’s lapse(see section II(ii) for details).
Another important variable is weather shocks, Wt, because ‘weather-driven quantityshocks are the archetypical driving forces for models of agricultural prices.’14 In the spirit ofRoll’s (1984) analysis of orange juice and weather, I use weather shocks as an instrument forthe price in demand estimation (see section V). The trade publication The CRB CommodityYearbook contains news on events that influence commodity prices, from which I collectedthe record of major frosts and droughts in producing countries, most importantly Brazil, aswell as Central America, East Africa, and South East Asia. These records were then cross-checked with the ICO’s record of major frosts and droughts. Because damaged coffee treesusually take two years to recover, I coded each of the 24 months (since each of the weathershocks) as a time dummy variable.15 When multiple shocks overlap within 24 months ofeach other’s occurrence, I code the second and (at most) third shocks in separate sets oftime dummies because each additional shock affects price at least as much as the first one.
Other shocks on the demand side will serve as control variables. Rich countries’ aggregatereal GDP, Xt, embodies both population and per-capita income of the importing countries.Because the world coffee demand grew roughly proportional to the size of population, thisvariable effectively detrends the demand. Finally, the real price of tea, Zt, would controlfor a potential substitution of tea for coffee. The inclusion of these variables is informed byKarp and Perloff’s (1993) and Nakamura and Zerom’s (2010) studies of coffee demand.
Because mct, Xt, and export quantities are recorded only at the annual frequency, Iconvert them into monthly series by repeating each year’s observation (or a twelfth of it)
important exporters, as well as smaller players of diverse regions, with the combined total market share of66%.
13I abstract from political economy at the sub-national level, because this paper’s main subject is interna-tional competition/cooperation and market power. At least three models of an exporting country’s domesticeconomy can support this interpretation: (1) the domestic wholesale coffee bean market is competitive; (2)the government/exporter acts as a benevolent social planner for the entire domestic economy; and/or (3)the government/exporter acts as the representative of the coffee producers by first paying them the marginalcost of production and then transferring the export surplus to the producers as well. See Bohman, Jarvis,and Barichello (1996) for the details of these models of exporting countries’ domestic market structure.
14Deaton and Laroque (2003, p.290).15The estimation results are robust to changes in the way I code the weather variable, including different
treatments of the instances of multiple frost/drought shocks.
8
for 12 months. This conversion would create a potential measurement error problem inregressions, which I will address with the monthly series of weather IVs in section V.
IV. MODEL
The preliminary regressions in Appendix B suggest the likely price impacts of ICA, the carteltreaty, and the emergence of Vietnam (a fringe exporter). In this section, I proceed to developan estimable model of the international coffee bean market for three reasons. First, a largebody of economic theory is relevant to the analysis of commodity price determination (i.e.,models of agricultural commodity demand and imperfect competition in homogeneous goodsmarkets), which, combined with the institutional knowledge of the coffee market, wouldclarify our thoughts about how prices and quantities would respond to demand, weathershocks, Vietnam’s exports, and the cartel’s market power. Second, an oligopoly modelwould facilitate our intuitive interpretation of, and hypothesis testing about, the cartel’smarket power. Third, public policies and economic events of this magnitude (i.e., ICA andcoffee crisis) should be assessed quantitatively to inform policy design in the future. Welfareanalysis requires a model of demand, and the construction of benchmark counterfactualsfurther necessitates supply-side modeling. Thus some structure and assumptions are neededto analyze price elasticity of demand, the cartel’s market power, and welfare impacts.
IV(i). Demand and the Timing of the Game
World demand, Qt = f (Pt, Xt, Zt, εt), determines the relationship between world exports,Qt, and price, Pt. Its empirical specifications in section V(i) will also incorporateXt (the levelof world income), as is standard in the analysis of commodities (c.f., Deaton and Laroque2003), as well as Zt (tea price) and εt (unobserved variation in consumers’ preferences), butI suppress these notations in this section. Let P (Qt) represent the inverse demand function.Vietnam is a new, fringe exporter. To consistently measure the coordination among all of theother exporters (the cartel treaty members), one should subtract Vietnamese exports fromglobal demand to calculate the net demand curve that cartel exporters face. More formally,the setup is as follows:
1. Every month t, the world demands coffee beans. The (inverse) demand schedule,P (Qt), is common knowledge. The aggregate supply, Qt, consists of the Vietnameseexport qVt and those from the other 54 countries collectively called ‘the cartel’ QC
t :Qt = qVt +QC
t .
2. The new, fringe producer, Vietnam, exports its entire harvest, qVt . This qVt is theresult of government-led ethnic migration, the Doi Moi policy, and foreign aid, andwas therefore determined independently (see section II and Appendix A for details).16
16In principle, Vietnam can be alternatively modeled as a strategic first mover (i.e., qVt depends on P (Qt)and QC
t ), although this assumption would be inconsistent with the historical facts. The final results donot change significantly even under this alternative assumption. I have chosen the baseline assumption ofnonstrategic Vietnam because of the country’s unique institutional context and because I can then maintainthe time-consistent interpretation of the cartel’s market power over time.
9
3. Given P (Qt) and qVt , that is, given the demand curve net of fringe supply, the 54 cartelmembers decide their collective exports, QC
t . This choice of quantity is described below.
Thus, the framework contains the first and the second movers, but the first mover (Viet-nam) represents a geopolitical shock rather than an active, strategic player as in the Stack-elberg game. The setup also has a Cournot component in the sense that the second moveris not a single decision maker but a collection of export quantity-setting competitors, whosecoordination may not be perfect in practice.
IV(ii). Exporting Countries as Cournot Competitors
We do not need an oligopoly model to estimate the cartel’s market power because we candirectly measure it by observing markup in data. However, a simple Cournot model will stillbe useful as a benchmark to facilitate our interpretation, hypothesis testing, and counterfac-tual analyses. Consider a Cournot model with N countries shipping coffee beans. Countryi in month t chooses export, qit, to maximize its profit:
πit = P(QC
t , qVt
)qit − C (qit,Wit) , (1)
where P (·) is the inverse demand function, QCt is the sum of exports from all countries
excluding Vietnam (i.e.,∑
i6=V qit), and C (·) is the cost function. The cost shifter Wit affectsthe marginal cost mcit = ∂C (qit,Wit) /∂qit. The first-order condition of country i’s profitmaximization is
Pt +∂P
∂Qqit = mcit. (2)
V. ESTIMATION AND RESULTS
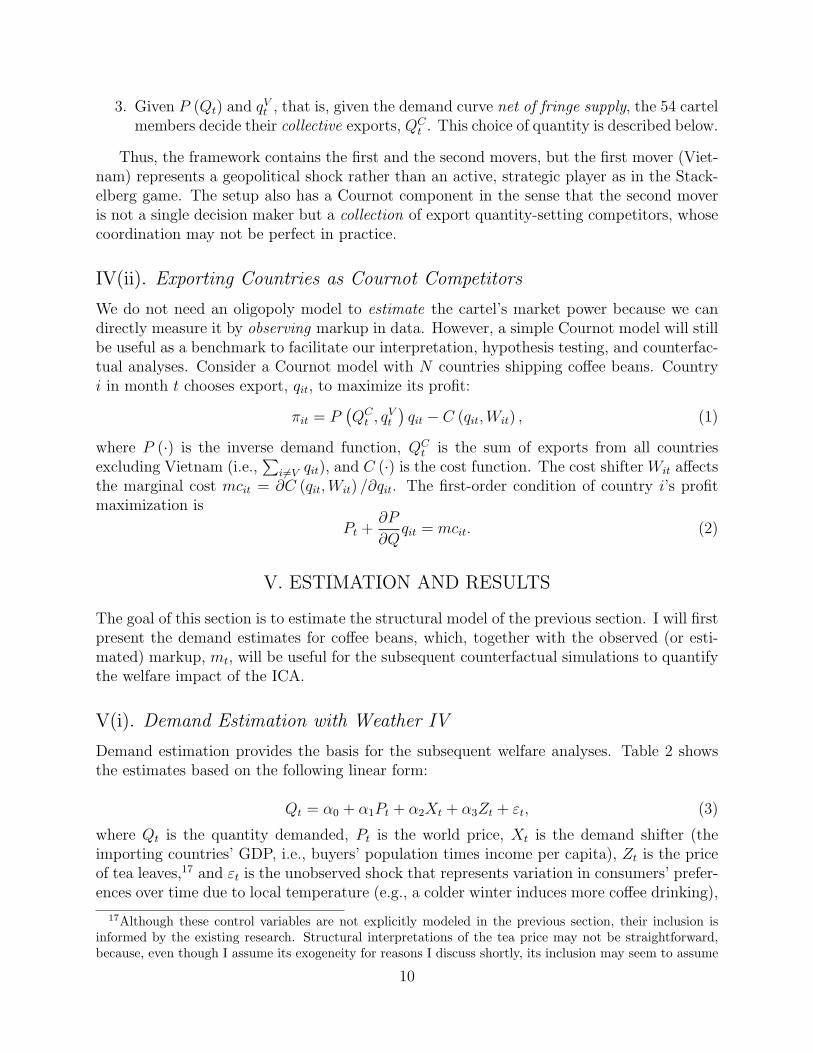
The goal of this section is to estimate the structural model of the previous section. I will firstpresent the demand estimates for coffee beans, which, together with the observed (or esti-mated) markup, mt, will be useful for the subsequent counterfactual simulations to quantifythe welfare impact of the ICA.
V(i). Demand Estimation with Weather IV
Demand estimation provides the basis for the subsequent welfare analyses. Table 2 showsthe estimates based on the following linear form:
Qt = α0 + α1Pt + α2Xt + α3Zt + εt, (3)
where Qt is the quantity demanded, Pt is the world price, Xt is the demand shifter (theimporting countries’ GDP, i.e., buyers’ population times income per capita), Zt is the priceof tea leaves,17 and εt is the unobserved shock that represents variation in consumers’ prefer-ences over time due to local temperature (e.g., a colder winter induces more coffee drinking),
17Although these control variables are not explicitly modeled in the previous section, their inclusion isinformed by the existing research. Structural interpretations of the tea price may not be straightforward,because, even though I assume its exogeneity for reasons I discuss shortly, its inclusion may seem to assume
10
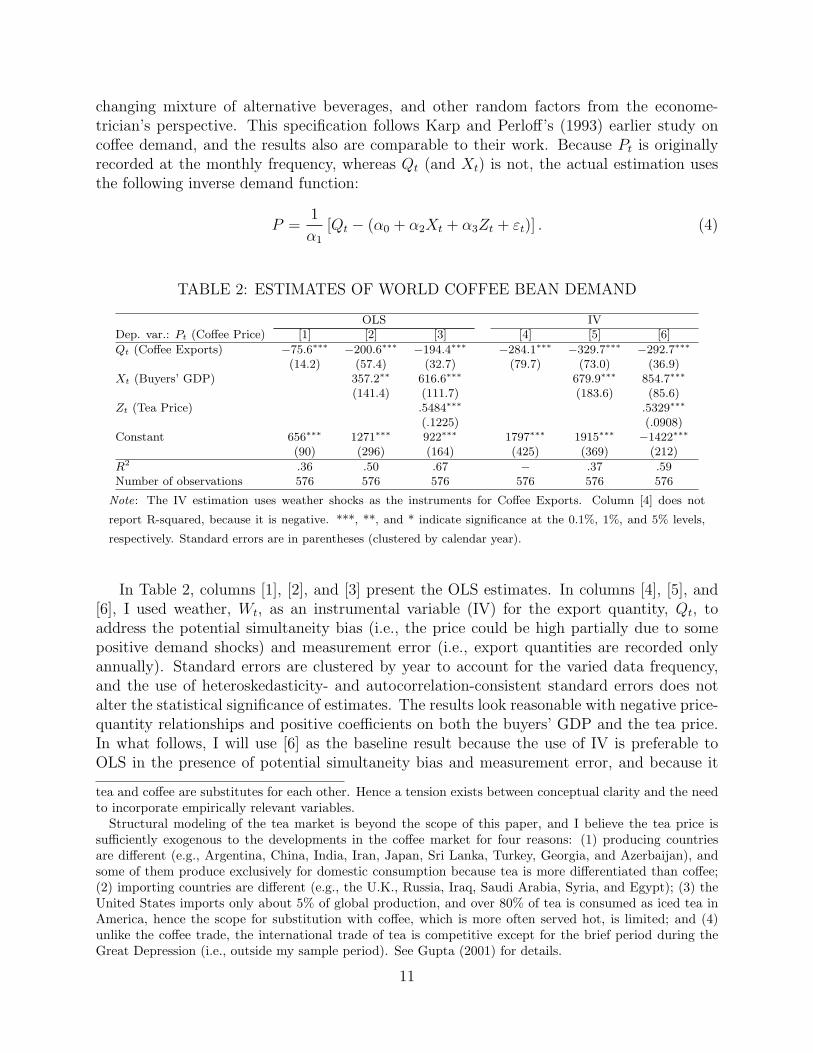
changing mixture of alternative beverages, and other random factors from the econome-trician’s perspective. This specification follows Karp and Perloff’s (1993) earlier study oncoffee demand, and the results also are comparable to their work. Because Pt is originallyrecorded at the monthly frequency, whereas Qt (and Xt) is not, the actual estimation usesthe following inverse demand function:
P =1
α1
[Qt − (α0 + α2Xt + α3Zt + εt)] . (4)
TABLE 2: ESTIMATES OF WORLD COFFEE BEAN DEMAND
OLS IVDep. var.: Pt (Coffee Price) [1] [2] [3] [4] [5] [6]
Qt (Coffee Exports) −75.6∗∗∗ −200.6∗∗∗ −194.4∗∗∗ −284.1∗∗∗ −329.7∗∗∗ −292.7∗∗∗
(14.2) (57.4) (32.7) (79.7) (73.0) (36.9)Xt (Buyers’ GDP) 357.2∗∗ 616.6∗∗∗ 679.9∗∗∗ 854.7∗∗∗
(141.4) (111.7) (183.6) (85.6)Zt (Tea Price) .5484∗∗∗ .5329∗∗∗
(.1225) (.0908)Constant 656∗∗∗ 1271∗∗∗ 922∗∗∗ 1797∗∗∗ 1915∗∗∗ −1422∗∗∗
(90) (296) (164) (425) (369) (212)
R2 .36 .50 .67 − .37 .59Number of observations 576 576 576 576 576 576
Note: The IV estimation uses weather shocks as the instruments for Coffee Exports. Column [4] does not
report R-squared, because it is negative. ***, **, and * indicate significance at the 0.1%, 1%, and 5% levels,
respectively. Standard errors are in parentheses (clustered by calendar year).
In Table 2, columns [1], [2], and [3] present the OLS estimates. In columns [4], [5], and[6], I used weather, Wt, as an instrumental variable (IV) for the export quantity, Qt, toaddress the potential simultaneity bias (i.e., the price could be high partially due to somepositive demand shocks) and measurement error (i.e., export quantities are recorded onlyannually). Standard errors are clustered by year to account for the varied data frequency,and the use of heteroskedasticity- and autocorrelation-consistent standard errors does notalter the statistical significance of estimates. The results look reasonable with negative price-quantity relationships and positive coefficients on both the buyers’ GDP and the tea price.In what follows, I will use [6] as the baseline result because the use of IV is preferable toOLS in the presence of potential simultaneity bias and measurement error, and because it
tea and coffee are substitutes for each other. Hence a tension exists between conceptual clarity and the needto incorporate empirically relevant variables.Structural modeling of the tea market is beyond the scope of this paper, and I believe the tea price is
sufficiently exogenous to the developments in the coffee market for four reasons: (1) producing countriesare different (e.g., Argentina, China, India, Iran, Japan, Sri Lanka, Turkey, Georgia, and Azerbaijan), andsome of them produce exclusively for domestic consumption because tea is more differentiated than coffee;(2) importing countries are different (e.g., the U.K., Russia, Iraq, Saudi Arabia, Syria, and Egypt); (3) theUnited States imports only about 5% of global production, and over 80% of tea is consumed as iced tea inAmerica, hence the scope for substitution with coffee, which is more often served hot, is limited; and (4)unlike the coffee trade, the international trade of tea is competitive except for the brief period during theGreat Depression (i.e., outside my sample period). See Gupta (2001) for details.
11
employs a full set of controls. In Appendix C, I report the first-stage regressions, as well assimilar results of demand estimation based on the annualized data frequency and log-linearspecifications.
Because the price (quantity) coefficient, α1, will be the key input for all of the subsequentanalyses, it deserves closer attention. First, compared with the OLS estimates, the IVestimates are more stable and pronounced in magnitude, which is an intuitive result becausewe would expect the weather IV to isolate both the unobserved demand-side shocks and thenoises due to measurement error. Second, although the inclusion of the tea price reflects acompromise between conceptual cleanliness and practicality, finding similar α1 in columns[5] and [6], that is, with and without the tea price, is reassuring. Third, the α1 in column [6](preferred specification) implies the price elasticity of 0.15 at the mean price and quantity.The existing research also reported rather low estimates around 0.2.18 This inelastic demandestimate, confronted by weather-driven supply shocks, agrees with the standard explanationfor the variability of commodity prices (Deaton and Laroquue 1992, Prebisch 1959, Singer1950).
Thus, I see desirable features in these demand estimates, which will in turn facilitateour market-power interpretation of observed markups (Appendix D) and enable us to assessthe welfare impact of the cartel treaty (section VI). The subsequent analyses will focusexclusively on the supply-side explanations of the price decline, but a plausible alternativehypothesis would come from the demand side as well. In Appendix C, I will discuss otherpossible explanations and report additional demand estimation results, which suggest onlythe supply-side mechanisms can explain the price decline.
V(ii). Country-specific Marginal Costs
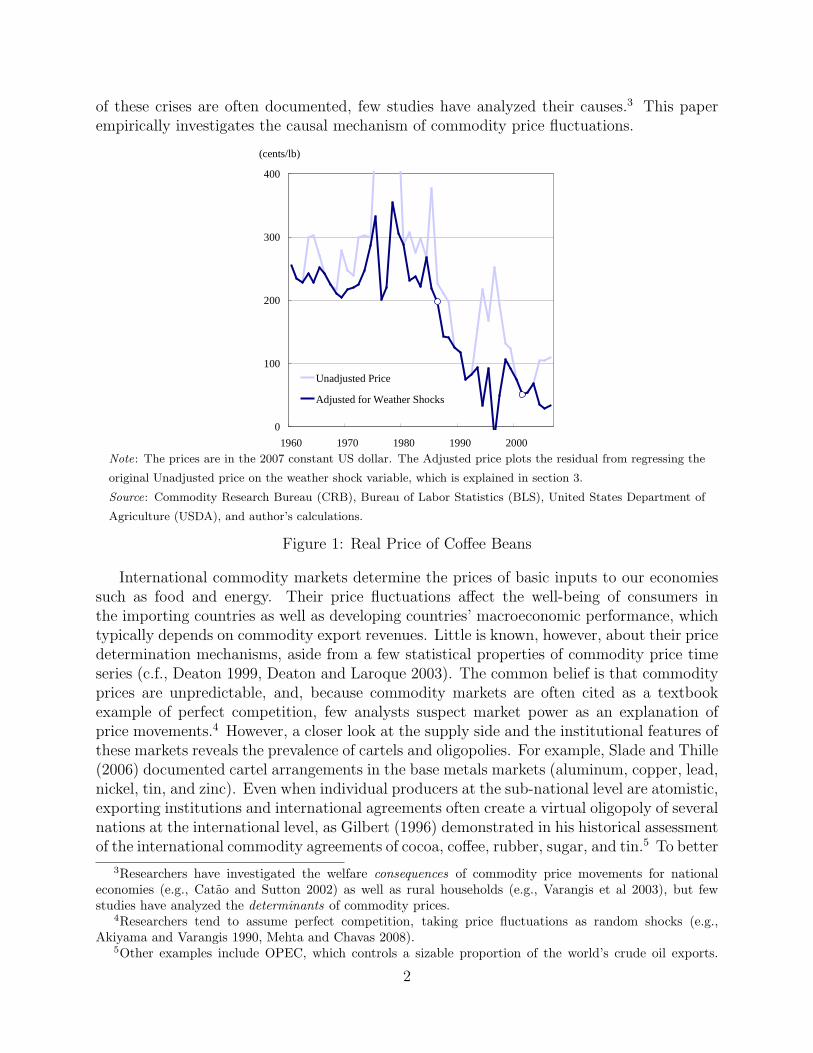
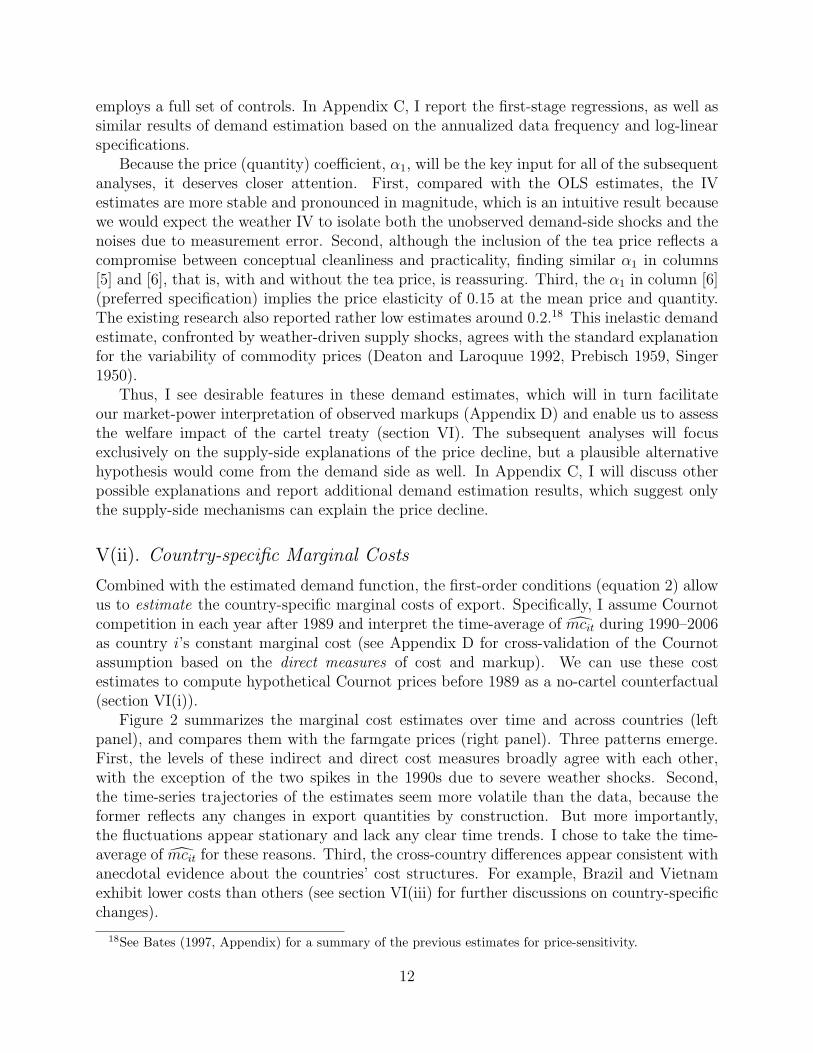
Combined with the estimated demand function, the first-order conditions (equation 2) allowus to estimate the country-specific marginal costs of export. Specifically, I assume Cournotcompetition in each year after 1989 and interpret the time-average of mcit during 1990–2006as country i’s constant marginal cost (see Appendix D for cross-validation of the Cournotassumption based on the direct measures of cost and markup). We can use these costestimates to compute hypothetical Cournot prices before 1989 as a no-cartel counterfactual(section VI(i)).
Figure 2 summarizes the marginal cost estimates over time and across countries (leftpanel), and compares them with the farmgate prices (right panel). Three patterns emerge.First, the levels of these indirect and direct cost measures broadly agree with each other,with the exception of the two spikes in the 1990s due to severe weather shocks. Second,the time-series trajectories of the estimates seem more volatile than the data, because theformer reflects any changes in export quantities by construction. But more importantly,the fluctuations appear stationary and lack any clear time trends. I chose to take the time-average of mcit for these reasons. Third, the cross-country differences appear consistent withanecdotal evidence about the countries’ cost structures. For example, Brazil and Vietnamexhibit lower costs than others (see section VI(iii) for further discussions on country-specificchanges).
18See Bates (1997, Appendix) for a summary of the previous estimates for price-sensitivity.
12
� �
�
0
100
200
300
400
500
1990 1995 2000 2005
Marginal Cost Estimates
75 percentile
50 percentile
25 percentile
(cents/lb)
0
100
200
300
400
500
1990 1995 2000 2005
Observed Farmgate Prices
75 percentile
50 percentile
25 percentile
(cents/lb)
Note: The figure compares the estimated (left) and observed (right) measures of marginal costs, by plotting
those of the countries at specific quartiles based on the 1990–2006 average.
Figure 2: Summary of Marginal Cost Estimates
VI. WELFARE ANALYSIS OF THE COFFEE CARTEL
In this section, we seek to understand the economic significance of the market power due tothe cartel treaty (ICA) by using counterfactual simulations to quantify its welfare impacts.See Appendix D for its statistical significance.
VI(i). Market Power as Foreign Aid: Wealth Transfer under the ICA (1979–1988)
Based on the estimated world demand and the country-specific costs, as well as the as-sumption of Cournot competition in the export market, we can calculate the pre-July 1989counterfactual prices and quantities that would have prevailed had the cartel agreementnever materialized (i.e., if the United States had not participated in the ICA). Table 3 com-pares the actual (column [A]) and counterfactual (column [B]) prices, exports, consumersurplus, producer surplus, and social welfare, and displays their differences (column [C]).This simulation will provide us with the benchmark economic outcomes against which tomeasure the welfare impact of the cartel treaty.
Without ICA, the coffee price would have been lower by 134.2 cents at 179.6 cents, andthe world exports higher by 6 million bags at 70 million bags.19 As a result of the ICA, theworld’s consumers gave up $11.8 billion every year,20 most of which was transferred to theproducing countries ($11.2 billion).
To put these numbers in context, we can compare them with the amount of foreign aid.Specifically, the annual Official Development Assistance (ODA) averaged at $64.9 billion (in2007 constant U.S. dollars, for the comparable period 1979–88), of which $14.8 billion camefrom the United States, followed by Japan ($9.3 billion), France ($7.8 billion), Germany
19I assume this 9% change in export does not alter the underlying cost structure. Specifically, my assump-tion of constant marginal cost relies on engineering estimates, which suggest simply varying the intensity offertilizer use can change harvest quantity in the order of 10–30% (Giovanucci et al 2004).
20The burden on American consumers was approximately $3.4 billion, based on the fact that the UnitedStates imported 29% of the world coffee exports (1979–88 average).
13

TABLE 3: WELFARE ANALYSIS OF THE INTERNATIONAL COFFEE AGREEMENT
Annualized 1979–88 average [A] Actual [B] Counterfactual [C] Difference(with Cartel) (without Cartel) ([A] – [B])
(1) Price (cents/lb) 313.8 179.6 134.2[169.8, 189.4] [144.0, 124.4]
(2) World Exports (million bags) 64.0 69.6 −5.5[70.0, 69.2] [−5.9,−5.1]
(3) Consumer Surplus (million $) 65, 472 77, 298 −11, 827[78199, 76404] [−12727,−10932]
(4) Producer Surplus (million $) 12, 937 1, 707 11, 230[810, 2594] [12126, 10343]
(5) Social Welfare = (3) + (4) 78, 409 79, 006 −597[79010, 78997] [−601,−589]
Note: The 95% confidence intervals are in brackets (based on those of the demand estimates). Prices
and surpluses are expressed in the 2007 constant U.S. dollars.
($7.3 billion), and the U.K. ($4.1 billion). Hence the effective wealth transfer of $11.8 billionunder the ICA mechanism amounted to as much as 18% of the world’s total ODA, or aboutas much as American ODA. Although treaties such as ICA are not officially counted asforeign aid, my estimates suggest they might have sizeable impacts in developing countries,nearly half of which export coffee beans.
These welfare estimates rely on my modeling assumptions and estimates of the primitivesin sections IV and V, including: (1) estimated demand, (2) estimated country-specific costs,and (3) Cournot competition in 1989–2006. As a means of cross-validation, my baselinestructural estimates of the ICA’s price impact (134.2 cents) roughly agrees with the reduced-form estimates (between 138.1 and 161.6 cents) in Appendix B. Moreover, similar estimates(131.7 cents) arise from an alternative empirical approach using the direct measure of costsand markups, as well as the assumption of symmetry across countries, in Appendix D.These three results seem to indicate the robustness of the paper’s main finding that theICA raised coffee prices by 75% above the Cournot-competitive level, annually transferringapproximately $12 billion from consumers to exporting countries.
VI(ii). Decomposing the Coffee Crisis (1989–2001)
The preceding welfare analysis focused on the cartel period using the no-cartel counterfac-tual. We can also simulate the post-cartel evolution of coffee price under hypothetical marketstructures (with/without the ICA and with/without Vietnam’s exports), if we are willing tofurther assume symmetry across countries and exploit the direct measure of marginal costs(see Appendix D for details).21 The goal is to quantify the likely price impacts of the car-tel’s breakdown and the emergence of Vietnam circa 2001, that is, the decomposition of the‘coffee crisis.’ Specifically, I parameterize the (hypothetical) continuation of the ICA after
21As a means of cross-validation, I find both the heterogeneous- and symmetric-country approaches gen-erated rather similar 1979–88 counterfactual prices (179.6 and 182.1 cents, respectively).
14
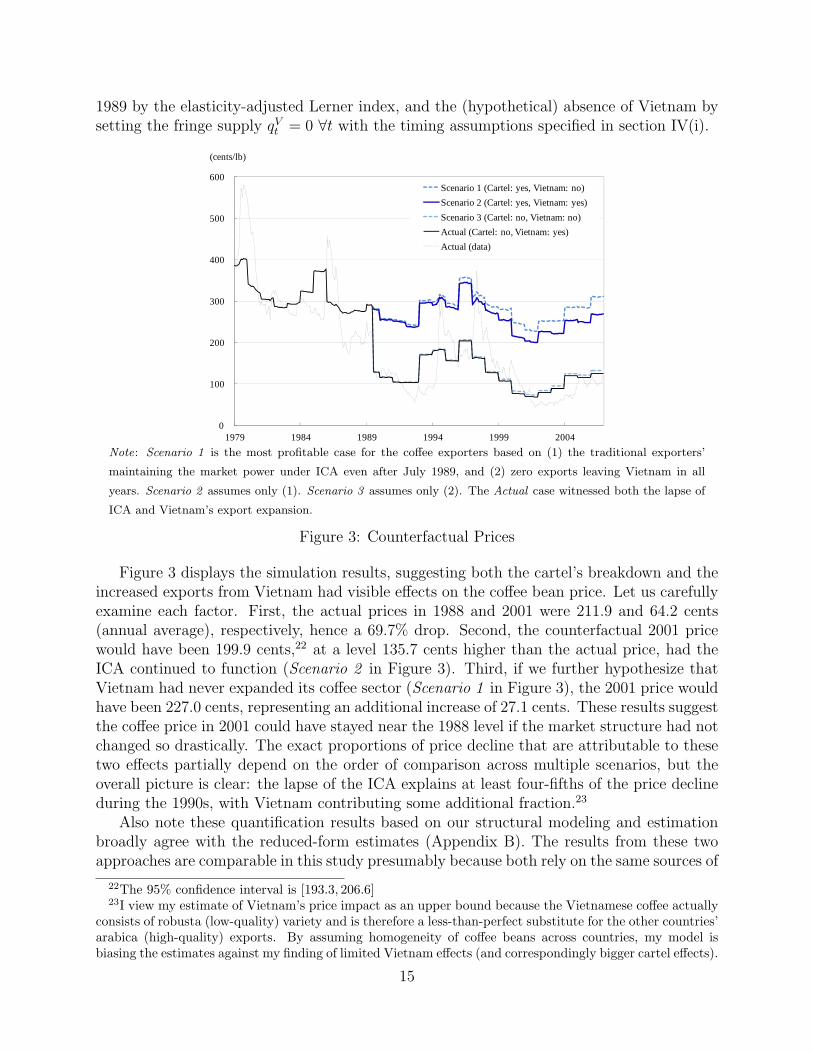
1989 by the elasticity-adjusted Lerner index, and the (hypothetical) absence of Vietnam bysetting the fringe supply qVt = 0 ∀t with the timing assumptions specified in section IV(i).
�
0
100
200
300
400
500
600
1979 1984 1989 1994 1999 2004
Scenario 1 (Cartel: yes, Vietnam: no)
Scenario 2 (Cartel: yes, Vietnam: yes)
Scenario 3 (Cartel: no, Vietnam: no)
Actual (Cartel: no, Vietnam: yes)
Actual (data)
(cents/lb)
Note: Scenario 1 is the most profitable case for the coffee exporters based on (1) the traditional exporters’
maintaining the market power under ICA even after July 1989, and (2) zero exports leaving Vietnam in all
years. Scenario 2 assumes only (1). Scenario 3 assumes only (2). The Actual case witnessed both the lapse of
ICA and Vietnam’s export expansion.
Figure 3: Counterfactual Prices
Figure 3 displays the simulation results, suggesting both the cartel’s breakdown and theincreased exports from Vietnam had visible effects on the coffee bean price. Let us carefullyexamine each factor. First, the actual prices in 1988 and 2001 were 211.9 and 64.2 cents(annual average), respectively, hence a 69.7% drop. Second, the counterfactual 2001 pricewould have been 199.9 cents,22 at a level 135.7 cents higher than the actual price, had theICA continued to function (Scenario 2 in Figure 3). Third, if we further hypothesize thatVietnam had never expanded its coffee sector (Scenario 1 in Figure 3), the 2001 price wouldhave been 227.0 cents, representing an additional increase of 27.1 cents. These results suggestthe coffee price in 2001 could have stayed near the 1988 level if the market structure had notchanged so drastically. The exact proportions of price decline that are attributable to thesetwo effects partially depend on the order of comparison across multiple scenarios, but theoverall picture is clear: the lapse of the ICA explains at least four-fifths of the price declineduring the 1990s, with Vietnam contributing some additional fraction.23
Also note these quantification results based on our structural modeling and estimationbroadly agree with the reduced-form estimates (Appendix B). The results from these twoapproaches are comparable in this study presumably because both rely on the same sources of
22The 95% confidence interval is [193.3, 206.6]23I view my estimate of Vietnam’s price impact as an upper bound because the Vietnamese coffee actually
consists of robusta (low-quality) variety and is therefore a less-than-perfect substitute for the other countries’arabica (high-quality) exports. By assuming homogeneity of coffee beans across countries, my model isbiasing the estimates against my finding of limited Vietnam effects (and correspondingly bigger cartel effects).
15
exogenous variation in market structure (i.e., the U.S. foreign policy toward the commoditytrade and the government-led coffee development in Vietnam). The additional leverage weearned from the structural estimation was the intuitive measurement of market power underthe cartel treaty and the policy evaluation based on welfare analysis.
VI(iii). Market Share Reallocation After the ICA
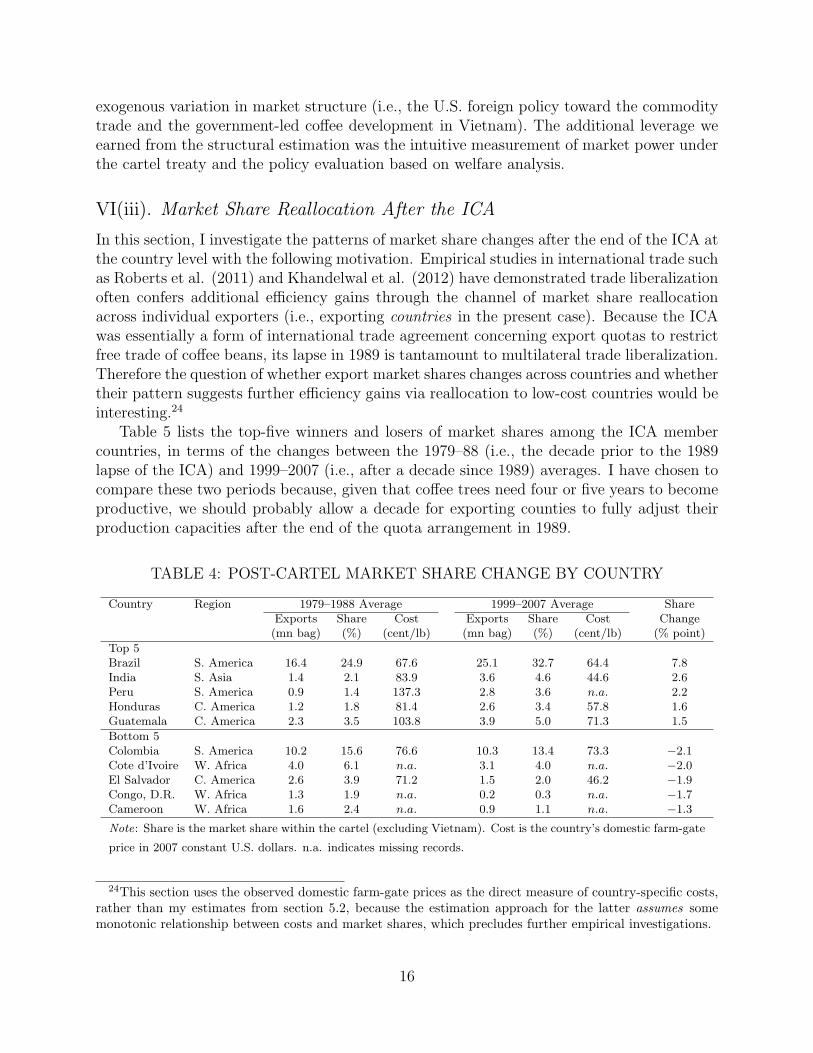
In this section, I investigate the patterns of market share changes after the end of the ICA atthe country level with the following motivation. Empirical studies in international trade suchas Roberts et al. (2011) and Khandelwal et al. (2012) have demonstrated trade liberalizationoften confers additional efficiency gains through the channel of market share reallocationacross individual exporters (i.e., exporting countries in the present case). Because the ICAwas essentially a form of international trade agreement concerning export quotas to restrictfree trade of coffee beans, its lapse in 1989 is tantamount to multilateral trade liberalization.Therefore the question of whether export market shares changes across countries and whethertheir pattern suggests further efficiency gains via reallocation to low-cost countries would beinteresting.24
Table 5 lists the top-five winners and losers of market shares among the ICA membercountries, in terms of the changes between the 1979–88 (i.e., the decade prior to the 1989lapse of the ICA) and 1999–2007 (i.e., after a decade since 1989) averages. I have chosen tocompare these two periods because, given that coffee trees need four or five years to becomeproductive, we should probably allow a decade for exporting counties to fully adjust theirproduction capacities after the end of the quota arrangement in 1989.
TABLE 4: POST-CARTEL MARKET SHARE CHANGE BY COUNTRY
Country Region 1979–1988 Average 1999–2007 Average ShareExports Share Cost Exports Share Cost Change(mn bag) (%) (cent/lb) (mn bag) (%) (cent/lb) (% point)
Top 5Brazil S. America 16.4 24.9 67.6 25.1 32.7 64.4 7.8India S. Asia 1.4 2.1 83.9 3.6 4.6 44.6 2.6Peru S. America 0.9 1.4 137.3 2.8 3.6 n.a. 2.2Honduras C. America 1.2 1.8 81.4 2.6 3.4 57.8 1.6Guatemala C. America 2.3 3.5 103.8 3.9 5.0 71.3 1.5
Bottom 5Colombia S. America 10.2 15.6 76.6 10.3 13.4 73.3 −2.1Cote d’Ivoire W. Africa 4.0 6.1 n.a. 3.1 4.0 n.a. −2.0El Salvador C. America 2.6 3.9 71.2 1.5 2.0 46.2 −1.9Congo, D.R. W. Africa 1.3 1.9 n.a. 0.2 0.3 n.a. −1.7Cameroon W. Africa 1.6 2.4 n.a. 0.9 1.1 n.a. −1.3
Note: Share is the market share within the cartel (excluding Vietnam). Cost is the country’s domestic farm-gate
price in 2007 constant U.S. dollars. n.a. indicates missing records.
24This section uses the observed domestic farm-gate prices as the direct measure of country-specific costs,rather than my estimates from section 5.2, because the estimation approach for the latter assumes somemonotonic relationship between costs and market shares, which precludes further empirical investigations.
16
The biggest winner is Brazil, which increased its (within-cartel) market share by 7.8 per-centage points, from 24.9% to 32.7%, whereas Colombia lost the most, with its share droppingfrom 15.6% to 13.4%. We can explain this contrast between the two largest exporters fromSouth America by their cost difference. Brazil is consistently a low-cost producer, with itsdomestic farm-gate price below 70 cents/lb, whereas the cost in Colombia is above thatlevel. Brazil also may have been restricting its production and exports from its full-capacitypotential during the cartel period disproportionately more than Colombia and other cartelmembers. As the largest exporting country, Brazil had the highest stake in sustaining theICA’s collective market power, and hence presumably the highest willingness to pay thecost of coordination (e.g., by giving out some extra quota allocation to disgruntled smallcountries). That is, Brazil might have been to the coffee cartel what Saudi Arabia is to thecrude oil cartel.25
Another piece of suggestive evidence is that only two out of the former top-ten exporters(ranked by the 1979–88 shares) increased their shares after the lapse of the ICA: Braziland Guatemala. By contrast, major winners in the post-cartel trade (aside from Brazil andGuatemala) were among those ranked somewhere between 10 and 20, including India (ranked13th, 2.6% point gain), Peru (ranked 17th, 2.2% point gain), Honduras (ranked 16th, 1.6%point gain), and Ethiopia (ranked 14th, 0.8% point gain). I interpret these tendencies asindicative of some sort of political or institutional rents embodied in quotas, which accruedto the top-share countries under the cartel regime, and which may have distorted the marketshare allocation from the efficient one.
The other countries’ market share changes are more difficult to rationalize because some(seemingly) high-cost exporters such as Peru and Guatemala are among the winners. In fact,when I explored the correlation between the countries’ market share changes and their exportcosts, no clear patterns emerged. My view is that except for a few important exporters forwhich the data are relatively clean, such as Brazil and Colombia, the measures of exportcosts (i.e., domestic farm-gate prices) could be quite noisy possibly due to the volatility of thecurrency exchange rates for smaller countries and/or their governments’ limited capabilityin data collection (e.g., the Democratic Republic of Congo).
These data quality issues limit our scope of inference regarding small countries. Never-theless, the diverging fates of Brazil (a low-cost winner) and Colombia (a high-cost loser),the countries with better data quality, seems suggestive of efficiency gains from share real-location. In terms of the overall quantitative impact, Brazil’s 53% export growth alone isprobably big enough to generate efficiency gains from share reallocation.
VII. CONCLUSION
This paper aims to advance the analysis of international commodity markets based on eco-nomic fundamentals. Three findings emerge. First, the International Coffee Agreement
25My no-cartel counterfactual (section 6.1) suggests Brazil was better off supporting the ICA, because itsprofits would have been 28% lower without the cartel treaty. To be precise, even though Brazil could haveincreased its export quantity by 31% (based on the observed post-cartel market share), such a unilateraldeviation (and the consequent breakdown of quota agreements) would have lowered the world coffee priceby 59% from the actual 1979–88 level, resulting in a net loss.
17

(ICA) raised price by 75% above the Cournot-competitive level, annually transferring ap-proximately $12 billion from consumers to exporting countries. Second, the lapse of ICAin 1989 explains four-fifths of the subsequent price decline, that is, the coffee crisis. Third,some suggestive evidence exists on further efficiency gains from the post-cartel market sharereallocation. These estimates indicate the ICA’s market power and its welfare impacts weresubstantial.
From a public-policy perspective, these results suggest market power could be generatedby a trade agreement and used as a substitute for foreign aid; this was indeed the intentionof the U.S. foreign policy during the Cold War era. Likewise, the coffee price declinedwhen the United States reversed this trade/aid policy and withdrew its support for the ICAregime in 1989. Although the falling bean price benefited coffee drinkers across the globeand was certainly an intended consequence from the perspective of the U.S. trade-policymakers, the potential magnitude of spillover effects (e.g., the exporting countries’ sovereigndebt cancellations and the intensifying violence in some areas) suggests a more gradualwithdrawal might have reduced the total cost of handling all such contingencies abroad.Moreover, the results point to the pitfalls of using market power as foreign aid, given theeventual reversal of such a policy entailed a severe commodity crisis, with large adjustmentcosts in the developing countries as well.
From a positivistic viewpoint, these results also reveal that contrary to the conventionalperception of commodity markets as purely speculative and highly unpredictable, economicfundamentals of demand and supply are useful for their analysis. Most importantly, despitethe textbook characterization of these markets as perfectly competitive, economic forcesof oligopoly are fully at play. In addition to the coffee market, the markets for crude oil,diamonds, base metals, and tropical agricultural, to name a few, also have a reputationfor cartels and imperfect competition. The markets for cocoa, rubber, sugar, and tin havehistorically operated under commodity trade agreements similar to the ICA as well. Thuseconomic analysis of internationally traded commodities would gain much from explicitlyincorporating market structure and unique institutional contexts.
18
APPENDIX A. INSTITUTIONAL BACKGROUND OF EXOGENEITYASSUMPTIONS
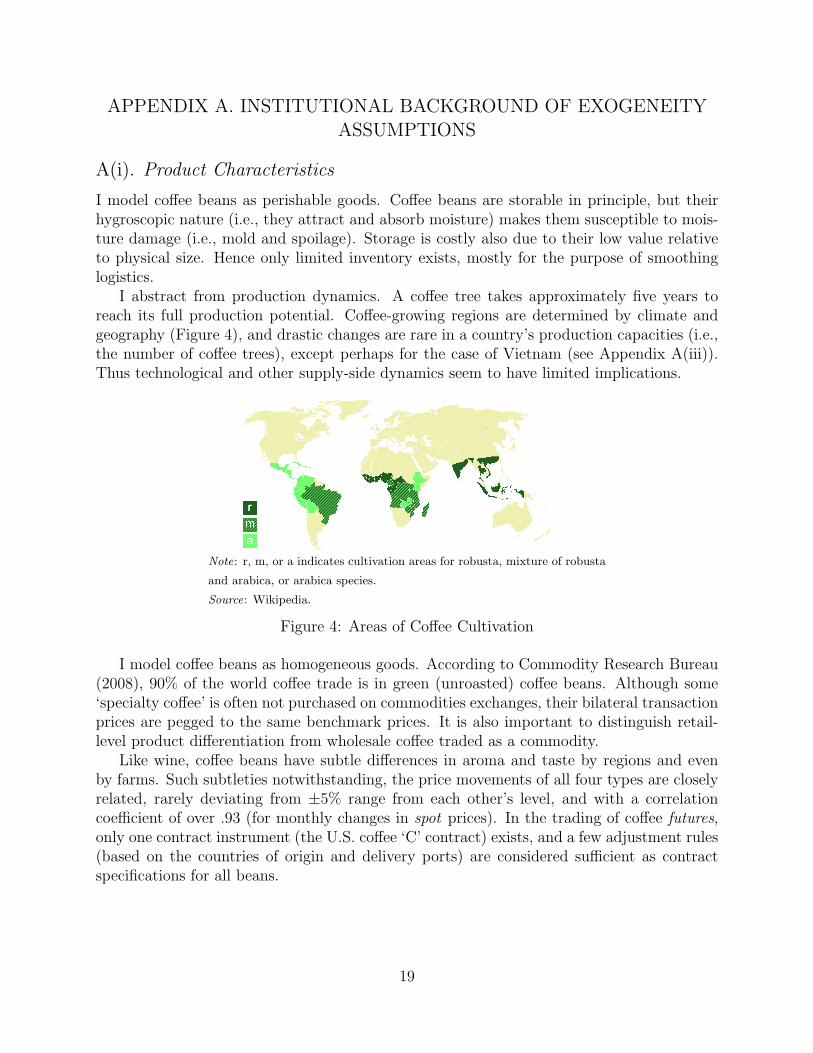
A(i). Product Characteristics
I model coffee beans as perishable goods. Coffee beans are storable in principle, but theirhygroscopic nature (i.e., they attract and absorb moisture) makes them susceptible to mois-ture damage (i.e., mold and spoilage). Storage is costly also due to their low value relativeto physical size. Hence only limited inventory exists, mostly for the purpose of smoothinglogistics.
I abstract from production dynamics. A coffee tree takes approximately five years toreach its full production potential. Coffee-growing regions are determined by climate andgeography (Figure 4), and drastic changes are rare in a country’s production capacities (i.e.,the number of coffee trees), except perhaps for the case of Vietnam (see Appendix A(iii)).Thus technological and other supply-side dynamics seem to have limited implications.
Note: r, m, or a indicates cultivation areas for robusta, mixture of robusta
and arabica, or arabica species.
Source: Wikipedia.
Figure 4: Areas of Coffee Cultivation
I model coffee beans as homogeneous goods. According to Commodity Research Bureau(2008), 90% of the world coffee trade is in green (unroasted) coffee beans. Although some‘specialty coffee’ is often not purchased on commodities exchanges, their bilateral transactionprices are pegged to the same benchmark prices. It is also important to distinguish retail-level product differentiation from wholesale coffee traded as a commodity.
Like wine, coffee beans have subtle differences in aroma and taste by regions and evenby farms. Such subtleties notwithstanding, the price movements of all four types are closelyrelated, rarely deviating from ±5% range from each other’s level, and with a correlationcoefficient of over .93 (for monthly changes in spot prices). In the trading of coffee futures,only one contract instrument (the U.S. coffee ‘C’ contract) exists, and a few adjustment rules(based on the countries of origin and delivery ports) are considered sufficient as contractspecifications for all beans.
19
A(ii). The Cartel and the Cold War: Why the Rise and Fall of the Interna-tional Coffee Agreement Are Exogenous
This section emphasizes the geopolitical nature of the cartel treaty, and extensively drawson Bates’s (1997) influential work on the international political economy of the coffee beanmarket in the 20th century.
Since the 1930s, coffee exporting countries had made many attempts to form a cartel-likearrangement, but none of those attempts survived. A successful quota scheme takes monitor-ing and enforcement, both of which were lacking. However, the situation changed after 1959,when Fidel Castro and his fellow guerrillas took power in Cuba: the Cuban Revolution.After frosty interactions with the United States, the revolutionary government turned tothe Eastern bloc.26 Cuba was a coffee-producing economy, and the revolutionary movementgained momentum from the countryside, just as Mao and Guevara had theorized and prac-ticed. Given this development in the United States’ backyard, the Kennedy administration’sforeign policy prioritized the ‘fight against communism.’
To foster a good relationship with coffee-growing countries, the United States used diplo-matic alliance as one tool. Sending monetary aid was another. In addition, the WhiteHouse decided to provide monitoring/enforcement for its southern neighbors’ long-soughtquota agreement. Thus the United States signed the ICA in 1962 and, after three years ofnegotiations in Washington, Congress approved the legislation for the customs inspection of‘certificate of origin’ (see below) in 1965.27 Other ‘Northern’ governments (including Japanbut not New Zealand or Israel) had already signed up.28 Thus the ICA quota regime wasmotivated not by protectionism in the usual sense but by political considerations outsidethe market, as was also the case in Khandelwal et al.’s (2012) study of the Chinese exportlicenses under the Multifiber Arrangement (MFA).
The ICA used ‘certificate of origin’ for the monitoring and enforcement of export quota.29
The importing members collected and returned these certificates to the ICO, so that allexports were publicly recorded. Penalties for excess shipments were imposed through thededuction of these shipments from the following year’s quota. Excess shipments in a secondyear were penalized by a doubling of the deductions in the next. A third violation wouldlead to the loss of voting rights and possible expulsion from the ICO.
In practice, the rules were leniently applied, and loopholes existed. For example, cer-tificates of origin were not required for either imports from non-member countries (e.g.,the socialist bloc, which comprised the perfectly competitive black market) or exports tothe so-called ‘new markets’ (i.e., countries in which coffee had not yet become a staple ofconsumption).30 The problem was that this ‘tourist’ coffee could be re-exported to the ‘tra-
26See Domınguez (1978) for the political economy of revolutionary Cuba.27Thus the early 1960s cannot be clearly characterized as either a non-cartel or cartel period. For this
reason, this paper does not intend to analyze the beginning of the ICA. See Bates (1997), ch.5. Other obsta-cles to the analysis of the coffee market’s earlier years include the changing identities of newly independentcolonies and the lack of detailed data.
28European governments had similar interests in stabilizing African economies.29Although the ICO statistics do not contain the full details of decision making, the ICO seemed to make
major decisions every three to five years with renewals.30The socialist-bloc countries were outside the ICA regime partly because they could not pay in hard
currencies. See Bohman and Jarvis (1990) for a detailed account of the non-member market.
20
ditional’ markets in the member countries. The ICA rules were gradually refined to preventmajor deviations, but room for small-scale cheating remained. Political conflicts were alsorampant. Because the details of data collection, monitoring, quota allocation, and the mea-sures to close those loopholes affected countries differently, almost every aspect of the ICA’soperation was controversial, which complicated its internal political processes.
A(iii). Geopolitics of Land, Labor, and Ethnicity: Why Vietnam’s ExpansionIs Exogenous
Although in 1989 the developed world scrapped the subsidies the ICA embodied, the Viet-namese government was expanding coffee bean production on the back of foreign aid. Afterthe U.S. exit from Saigon in 1975 and a fight against China in 1979, this war-torn countryhad received an investment from the Soviet bloc in the early 1980s to plant coffee trees. Thecommunist world needed beans available for purchase without hard currency.31
In a series of five-year plans, the central planners orchestrated widespread internal mi-gration that prepared land and labor for coffee production, but their motives were moregeopolitical than economic. From the perspective of the post-war strategists, Vietnam facedthree challenges. First, the new government needed to establish control over land aban-doned during wars and to secure border areas with China, Laos, and Cambodia. Second,the planners viewed ethnic minorities as internal political threats, most of whom lived inthe forested upland areas and had sided with the United States during the war. Third, thepeasantry-backed revolutionary government suspected their authority would be underminedby high and growing population densities in the urban areas of the Red and Mekong Deltas(Solem et al. 2010).
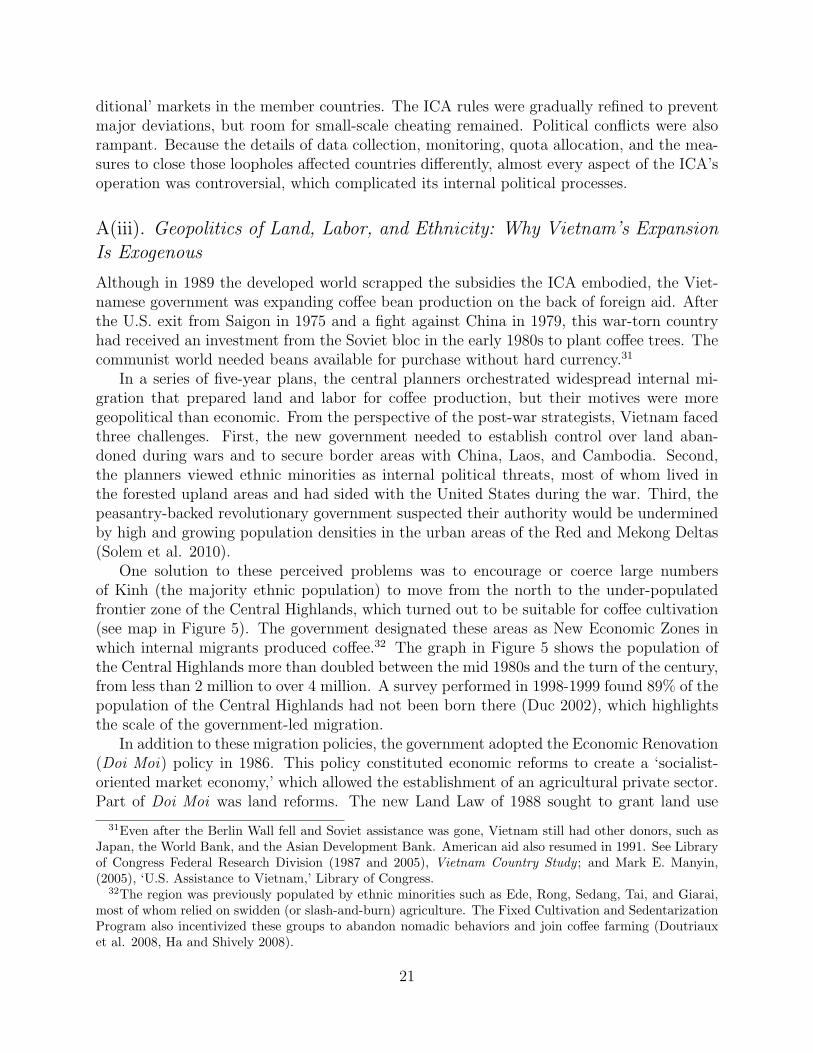
One solution to these perceived problems was to encourage or coerce large numbersof Kinh (the majority ethnic population) to move from the north to the under-populatedfrontier zone of the Central Highlands, which turned out to be suitable for coffee cultivation(see map in Figure 5). The government designated these areas as New Economic Zones inwhich internal migrants produced coffee.32 The graph in Figure 5 shows the population ofthe Central Highlands more than doubled between the mid 1980s and the turn of the century,from less than 2 million to over 4 million. A survey performed in 1998-1999 found 89% of thepopulation of the Central Highlands had not been born there (Duc 2002), which highlightsthe scale of the government-led migration.
In addition to these migration policies, the government adopted the Economic Renovation(Doi Moi) policy in 1986. This policy constituted economic reforms to create a ‘socialist-oriented market economy,’ which allowed the establishment of an agricultural private sector.Part of Doi Moi was land reforms. The new Land Law of 1988 sought to grant land use
31Even after the Berlin Wall fell and Soviet assistance was gone, Vietnam still had other donors, such asJapan, the World Bank, and the Asian Development Bank. American aid also resumed in 1991. See Libraryof Congress Federal Research Division (1987 and 2005), Vietnam Country Study ; and Mark E. Manyin,(2005), ‘U.S. Assistance to Vietnam,’ Library of Congress.
32The region was previously populated by ethnic minorities such as Ede, Rong, Sedang, Tai, and Giarai,most of whom relied on swidden (or slash-and-burn) agriculture. The Fixed Cultivation and SedentarizationProgram also incentivized these groups to abandon nomadic behaviors and join coffee farming (Doutriauxet al. 2008, Ha and Shively 2008).
21

0
1
2
3
4
5
0.0
0.1
0.2
0.3
0.4
0.5
1975 1980 1985 1990 1995 2000 2005
Popu
latio
n (m
illio
n pe
rson
s)
Net
Incr
ease
of P
opul
atio
n(m
illio
n pe
rson
s)
Population of Central Highlands
Net Increase Population
Note: The Central Highlands’ key attributes are apparent in the map - (1) landlocked, (2) far from the densely
populated Delta regions, and (3) bordering Laos and Cambodia. The region also belongs to the southern half
of the territory, implying the ease of access to its ethnic minorities from the American side during the war.
Source: The map is made by the author from Wikipedia’s material. The population data since 1995 are from
the General Statistics Office of Vietnam, and the rest are from Jan Lahmeyer’s populstat site (retrieved on July
7, 2011, from http://www.populstat.info/Asia/vietnamp.htm).
Figure 5: The Government-led Migration to the Central Highlands of Vietnam
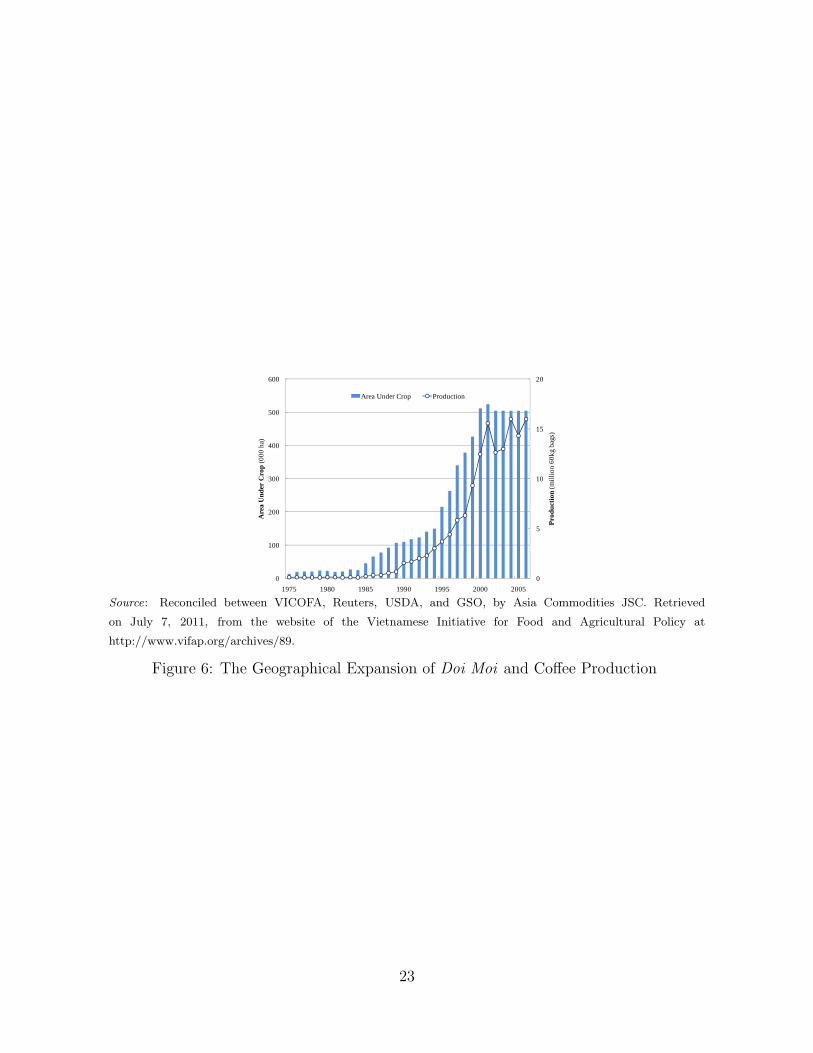
rights to households. All land technically remained under state ownership, but the secondLand Law of 1993 further permitted individuals to trade their land-use rights (Vuong 2001).The government promoted the expansion of coffee cultivation through subsidized land andloans, and it provided support for seedlings, fertilizer, irrigation, and agronomy (Giovannucciet al. 2004). As a result, coffee-production area grew five-fold in the 1990s (Figure 6), beforeit hit the geographical limit in the early 2000s.33
33The area under crop peaked in 2001 and slightly decreased thereafter. This drop reflects state farms’retreat from unsuitable lands. In official statistics, several provinces on the periphery of coffee cultivationappear and then disappear around that time (Ministry of Agriculture and Rural Development). See alsoICARD and Oxfam (2002).
22
0
5
10
15
20
0
100
200
300
400
500
600
1975 1980 1985 1990 1995 2000 2005
Prod
uctio
n (m
illio
n 60
kg b
ags)
Are
a U
nder
Cro
p (0
00 h
a)
Area Under Crop Production
Source: Reconciled between VICOFA, Reuters, USDA, and GSO, by Asia Commodities JSC. Retrieved
on July 7, 2011, from the website of the Vietnamese Initiative for Food and Agricultural Policy at
http://www.vifap.org/archives/89.
Figure 6: The Geographical Expansion of Doi Moi and Coffee Production
23

APPENDIX B. PRELIMINARY DATA ANALYSIS
The changes in the market structure reflect the geopolitical developments that are exogenousto the price fluctuations in the export market, so simple regressions could inform us aboutthe determination of the coffee price. Such regressions will also clarify the basic sources ofidentification for the subsequent structural analysis. Thus, as a preliminary data analysis, Iregress the coffee price, Pt, on those ‘shocks’ to the market structure and controls:34
Pt = b0 + b1It {ICA lapse}+ b2qVt + b3Wt + b4Xt + b5Zt + εt, (5)
where It {ICA lapse} is the indicator function that equals one from July 1989, qVt is theVietnamese exports, Wt is a set of time dummies representing weather shocks, Xt is the im-porting countries’ GDP (population times per-capita income), Zt is the price of tea (arguablyan important substitute for coffee), and εt is the unobserved shock representing variation inconsumers’ preferences, the international supply chains, and other random changes in thecommodity market.35
TABLE 5: REDUCED-FORM ANALYSIS OF COFFEE PRICE DETERMINATION
OLSDep. var.: Pt (Coffee Price) [1] [2] [3] [4] [5] [6]
It (ICA lapse) −194.4∗∗∗ −163.7∗∗∗ −138.1∗∗∗ −161.6∗∗∗ −156.9∗∗∗
(27.0) (32.3) (18.7) (29.4) (23.3)qVt (Vietnam’s Export) −175.9∗∗∗ −43.3∗ −29.4 −41.7∗ −69.8∗∗
(25.8) (19.3) (16.8) (18.6) (21.0)Xt (Buyers’ GDP) 42.9 218.8∗∗
(29.5) (72.0)Zt (Tea price) .3229∗∗
(.1061)Constant 317.2∗∗∗ 292.3∗∗∗ 317.6∗∗∗ 257.8∗∗∗ 264.2∗∗∗ 80.5
(23.8) (22.5) (23.8) (11.0) (14.0) (54.8)
Wt (Weather Shocks) No No No Yes Yes Yes
R2 .41 .29 .42 .85 .86 .89Number of observations 576 576 576 576 576 576
Note: ***, **, and * indicate significance at the 0.1%, 1%, and 5% levels, respectively. Standard errors are in
parentheses (clustered by calendar year).
Table 5 shows the results of these regressions. First, the cartel’s breakdown in 1989seems likely to be the primary cause of the coffee crisis, with big and measurable impactsexceeding 130 cents across all specifications. Second, the estimates of the Vietnamese exporteffect are also statistically significant and its likely magnitude ranges between 29.4 and 69.8cents. Third, weather shocks are important as a control variable, which is consistent withvarious industry reports’ emphasis. Their inclusion materially improves the fit (columns [4],[5], and [6]). Finally, the other control variables (rich countries’ income and population, andthe price of tea) carry expected (positive) signs.
34I also regressed the observed markup, mt, on these variables and obtained similar results (unreported).35I assume εt as i.i.d. in the baseline specification. I also computed the heteroskedasticity- and
autocorrelation-robust standard errors, but the results did not change materially.
24
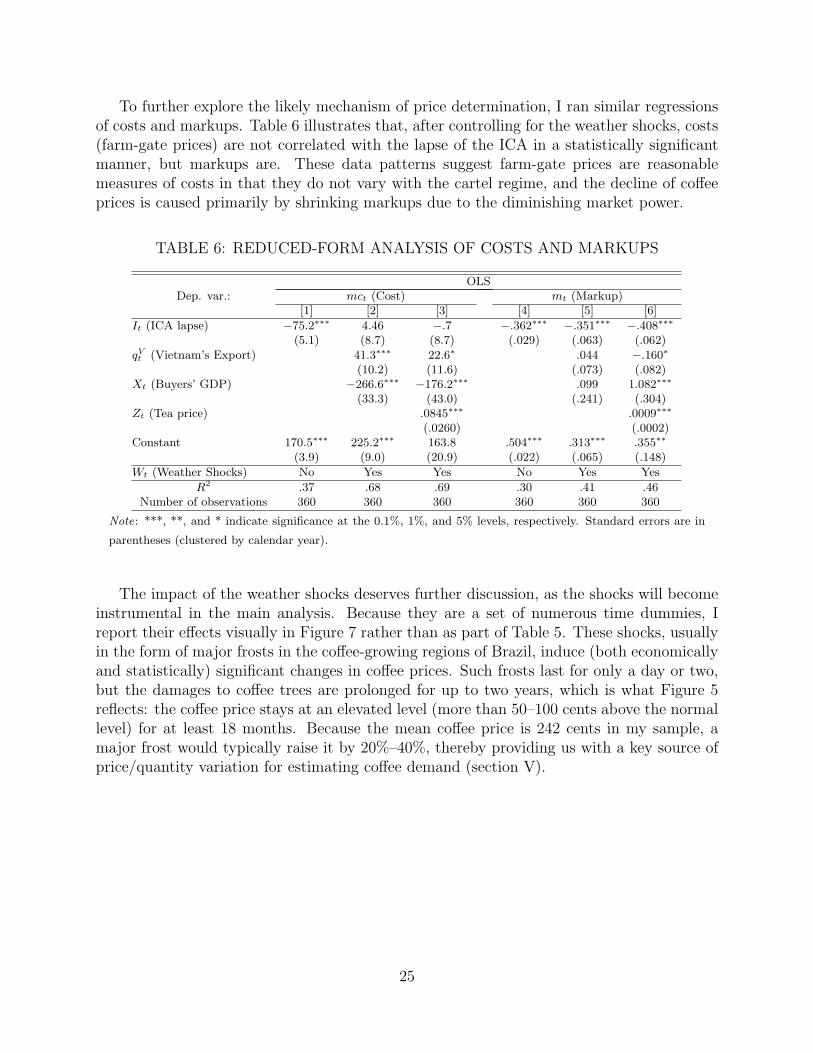
To further explore the likely mechanism of price determination, I ran similar regressionsof costs and markups. Table 6 illustrates that, after controlling for the weather shocks, costs(farm-gate prices) are not correlated with the lapse of the ICA in a statistically significantmanner, but markups are. These data patterns suggest farm-gate prices are reasonablemeasures of costs in that they do not vary with the cartel regime, and the decline of coffeeprices is caused primarily by shrinking markups due to the diminishing market power.
TABLE 6: REDUCED-FORM ANALYSIS OF COSTS AND MARKUPS
OLSDep. var.: mct (Cost) mt (Markup)
[1] [2] [3] [4] [5] [6]
It (ICA lapse) −75.2∗∗∗ 4.46 −.7 −.362∗∗∗ −.351∗∗∗ −.408∗∗∗
(5.1) (8.7) (8.7) (.029) (.063) (.062)qVt (Vietnam’s Export) 41.3∗∗∗ 22.6∗ .044 −.160∗
(10.2) (11.6) (.073) (.082)Xt (Buyers’ GDP) −266.6∗∗∗ −176.2∗∗∗ .099 1.082∗∗∗
(33.3) (43.0) (.241) (.304)Zt (Tea price) .0845∗∗∗ .0009∗∗∗
(.0260) (.0002)Constant 170.5∗∗∗ 225.2∗∗∗ 163.8 .504∗∗∗ .313∗∗∗ .355∗∗
(3.9) (9.0) (20.9) (.022) (.065) (.148)
Wt (Weather Shocks) No Yes Yes No Yes Yes
R2 .37 .68 .69 .30 .41 .46Number of observations 360 360 360 360 360 360
Note: ***, **, and * indicate significance at the 0.1%, 1%, and 5% levels, respectively. Standard errors are in
parentheses (clustered by calendar year).
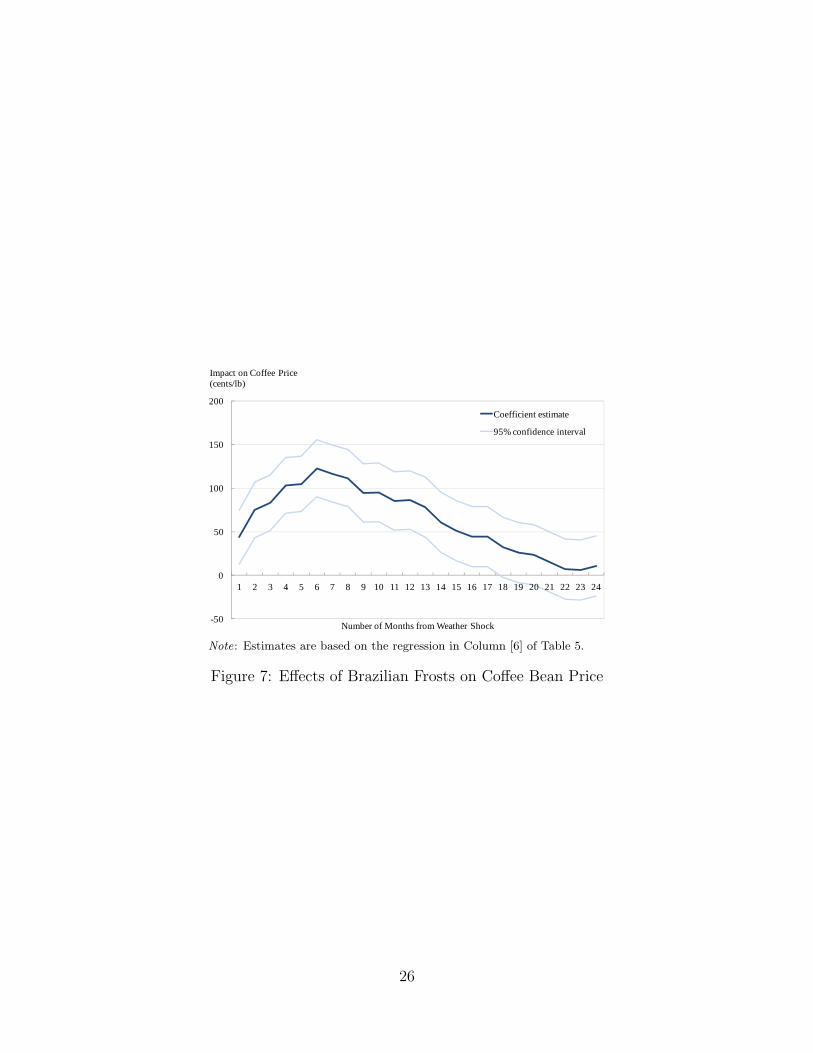
The impact of the weather shocks deserves further discussion, as the shocks will becomeinstrumental in the main analysis. Because they are a set of numerous time dummies, Ireport their effects visually in Figure 7 rather than as part of Table 5. These shocks, usuallyin the form of major frosts in the coffee-growing regions of Brazil, induce (both economicallyand statistically) significant changes in coffee prices. Such frosts last for only a day or two,but the damages to coffee trees are prolonged for up to two years, which is what Figure 5reflects: the coffee price stays at an elevated level (more than 50–100 cents above the normallevel) for at least 18 months. Because the mean coffee price is 242 cents in my sample, amajor frost would typically raise it by 20%–40%, thereby providing us with a key source ofprice/quantity variation for estimating coffee demand (section V).
25
-50
0
50
100
150
200
1 2 3 4 5 6 7 8 9 10 11 12 13 14 15 16 17 18 19 20 21 22 23 24
Number of Months from Weather Shock
Coefficient estimate
95% confidence interval
Impact on Coffee Price(cents/lb)
Note: Estimates are based on the regression in Column [6] of Table 5.
Figure 7: Effects of Brazilian Frosts on Coffee Bean Price
26
APPENDIX C. ALTERNATIVE EXPLANATIONS FOR THE COFFEECRISIS AND ROBUSTNESS CHECKS
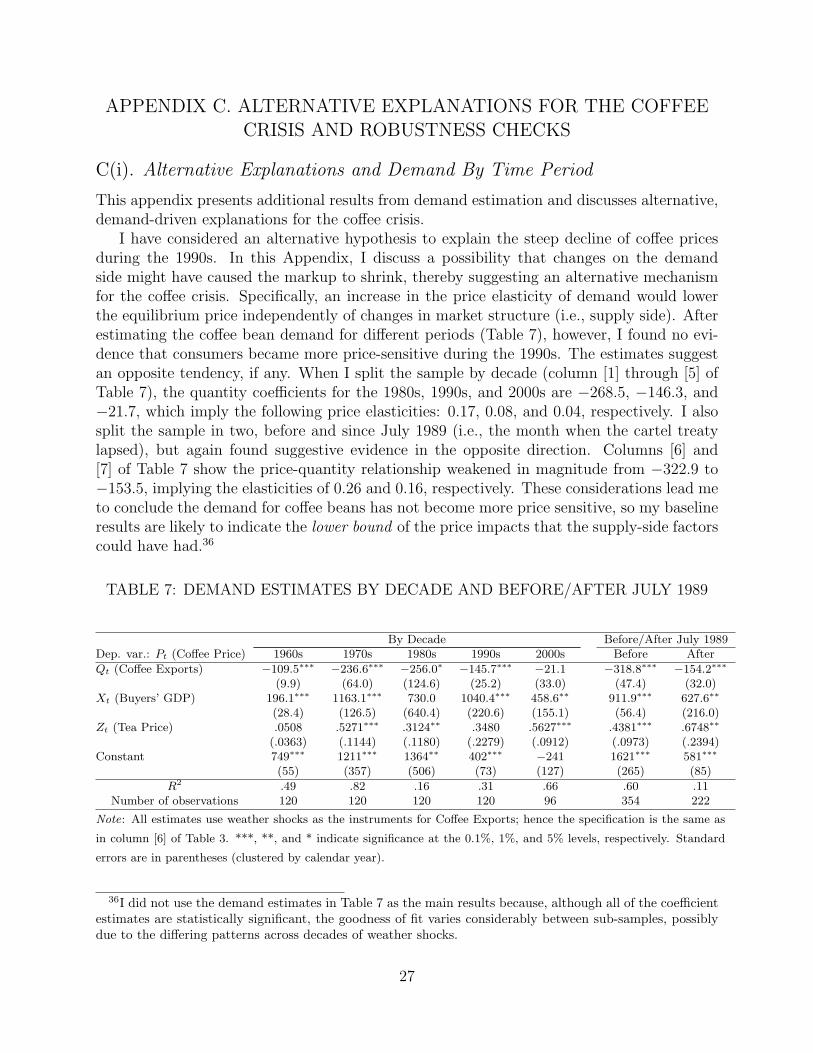
C(i). Alternative Explanations and Demand By Time Period
This appendix presents additional results from demand estimation and discusses alternative,demand-driven explanations for the coffee crisis.
I have considered an alternative hypothesis to explain the steep decline of coffee pricesduring the 1990s. In this Appendix, I discuss a possibility that changes on the demandside might have caused the markup to shrink, thereby suggesting an alternative mechanismfor the coffee crisis. Specifically, an increase in the price elasticity of demand would lowerthe equilibrium price independently of changes in market structure (i.e., supply side). Afterestimating the coffee bean demand for different periods (Table 7), however, I found no evi-dence that consumers became more price-sensitive during the 1990s. The estimates suggestan opposite tendency, if any. When I split the sample by decade (column [1] through [5] ofTable 7), the quantity coefficients for the 1980s, 1990s, and 2000s are −268.5, −146.3, and−21.7, which imply the following price elasticities: 0.17, 0.08, and 0.04, respectively. I alsosplit the sample in two, before and since July 1989 (i.e., the month when the cartel treatylapsed), but again found suggestive evidence in the opposite direction. Columns [6] and[7] of Table 7 show the price-quantity relationship weakened in magnitude from −322.9 to−153.5, implying the elasticities of 0.26 and 0.16, respectively. These considerations lead meto conclude the demand for coffee beans has not become more price sensitive, so my baselineresults are likely to indicate the lower bound of the price impacts that the supply-side factorscould have had.36
TABLE 7: DEMAND ESTIMATES BY DECADE AND BEFORE/AFTER JULY 1989
By Decade Before/After July 1989Dep. var.: Pt (Coffee Price) 1960s 1970s 1980s 1990s 2000s Before After
Qt (Coffee Exports) −109.5∗∗∗ −236.6∗∗∗ −256.0∗ −145.7∗∗∗ −21.1 −318.8∗∗∗ −154.2∗∗∗
(9.9) (64.0) (124.6) (25.2) (33.0) (47.4) (32.0)Xt (Buyers’ GDP) 196.1∗∗∗ 1163.1∗∗∗ 730.0 1040.4∗∗∗ 458.6∗∗ 911.9∗∗∗ 627.6∗∗
(28.4) (126.5) (640.4) (220.6) (155.1) (56.4) (216.0)Zt (Tea Price) .0508 .5271∗∗∗ .3124∗∗ .3480 .5627∗∗∗ .4381∗∗∗ .6748∗∗
(.0363) (.1144) (.1180) (.2279) (.0912) (.0973) (.2394)Constant 749∗∗∗ 1211∗∗∗ 1364∗∗ 402∗∗∗ −241 1621∗∗∗ 581∗∗∗
(55) (357) (506) (73) (127) (265) (85)
R2 .49 .82 .16 .31 .66 .60 .11Number of observations 120 120 120 120 96 354 222
Note: All estimates use weather shocks as the instruments for Coffee Exports; hence the specification is the same as
in column [6] of Table 3. ***, **, and * indicate significance at the 0.1%, 1%, and 5% levels, respectively. Standard
errors are in parentheses (clustered by calendar year).
36I did not use the demand estimates in Table 7 as the main results because, although all of the coefficientestimates are statistically significant, the goodness of fit varies considerably between sub-samples, possiblydue to the differing patterns across decades of weather shocks.
27

Why do changes in importing countries fail to make demand more price sensitive? First,the evolution of consumers’ tastes is not uniform or monotonic across the globe. According toAmerica’s National Coffee Association, per-capita consumption in the United States peakedin 1962 at 3.12 cups per day and dropped to 1.76 in 2005, but this decline has happened onlygradually over five decades.37 This development is likely more than offset by the populationgrowth during the same period, along with the increasing per-capita consumption in otherpopulous countries such as Japan and Germany, as well as the growth of emerging economies.
Second, corporate buyers of coffee beans have not accumulated monopsony (oligopsony)power to match the monopoly power of exporters.38 These buyers are manufacturing firmsthat process beans into roasted or ground coffee products. Despite occasional mergers andacquisitions, the roasting industry was still comprised of 219 companies in 1992, 215 in 1997,284 in 2003, and 253 in 2008 (IBISWorld 2008). Explaining the declining bean price by anincrease in the roasters’ oligopsony power is therefore difficult. Furthermore, because thegovernments of the importing countries policed the cartel agreement, the companies in thosecountries were unlikely to have influenced the exporting countries’ market power on theirown.
Finally, we have Starbucks Coffee, the largest coffee shop chain in the world. CouldStarbucks’ meteoric rise in the late 1990s and early 2000s somehow have increased the price-sensitivity of global coffee demand? Odds are against this explanation given the followingfacts. Even as late as 2007, Starbucks purchased less than 5% of the total global green-beanexports. This number alone would rule out the Starbucks hypothesis.39 In a broader context,coffee shops are a new channel of coffee retailing, but the overall per-capita consumption ofcoffee in the United States remained roughly constant between the late 1980s and 2000s.In other words, consumers merely switched from supermarkets to coffee shops as a pointof purchase, and only partially. Moreover, although new to America, coffee houses havebeen around for centuries in Europe and Japan. London’s coffee houses opened in the 17thcentury—at around the same time modern corporations were invented—and the first coffeeshop in Japan opened in 1878. Hence Starbucks Coffee and the emergence of coffee shops inthe United States are unlikely to have changed the global pattern of coffee bean demand, atleast not in time to explain the decline of coffee prices during the 1990s.
Thus, I believe a focus on the supply-side explanations such as the cartel’s collapse andextra coffee shipments from Vietnam is reasonable.
37Trade press suggests several underlying developments behind such long-run changes in demand: (1) theintroduction of substitutes such as bottled water and caffeinated energy drinks; (2) the price wars betweenCoca Cola and Pepsi that since the 1990s have lowered cola prices (arguably a close substitute for coffee);and (3) an increased ‘health-consciousness’ that somehow deterred many consumers from drinking coffee.
38I abstract from the multi-layered buyers. See Nakamura and Zerom (2010) for the analysis of verticalrelationships and incomplete pass-through at the wholesale and retail levels in the United States.
39This calculation is based on Starbucks Corporation’s Form 10-K for the fiscal year ending September30, 2007. As of September 30, 2007, the company had $324 million in fixed-price purchase commitments,$49 million in price-to-be-fixed contracts, and $339 million in unroasted bean inventories. Evaluated at theprevailing spot price of $1.35 per pound, the total amounts to 1.816 million 60-kg bags, which the companydeemed enough stock of green coffee through the fiscal year 2008. This number represents a mere 4.5% ofthe world export in 2007 (88.148 million 60-kg bags).
28
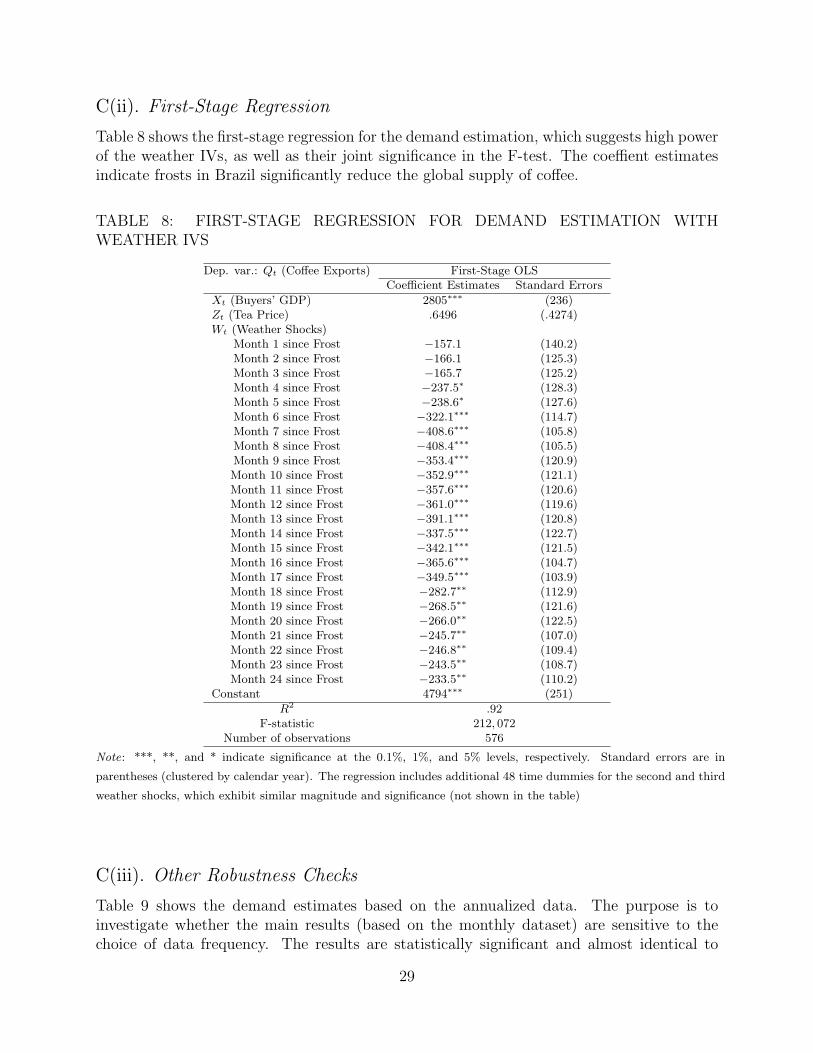
C(ii). First-Stage Regression
Table 8 shows the first-stage regression for the demand estimation, which suggests high powerof the weather IVs, as well as their joint significance in the F-test. The coeffient estimatesindicate frosts in Brazil significantly reduce the global supply of coffee.
TABLE 8: FIRST-STAGE REGRESSION FOR DEMAND ESTIMATION WITHWEATHER IVS
Dep. var.: Qt (Coffee Exports) First-Stage OLSCoefficient Estimates Standard Errors
Xt (Buyers’ GDP) 2805∗∗∗ (236)Zt (Tea Price) .6496 (.4274)Wt (Weather Shocks)
Month 1 since Frost −157.1 (140.2)Month 2 since Frost −166.1 (125.3)Month 3 since Frost −165.7 (125.2)Month 4 since Frost −237.5∗ (128.3)Month 5 since Frost −238.6∗ (127.6)Month 6 since Frost −322.1∗∗∗ (114.7)Month 7 since Frost −408.6∗∗∗ (105.8)Month 8 since Frost −408.4∗∗∗ (105.5)Month 9 since Frost −353.4∗∗∗ (120.9)Month 10 since Frost −352.9∗∗∗ (121.1)Month 11 since Frost −357.6∗∗∗ (120.6)Month 12 since Frost −361.0∗∗∗ (119.6)Month 13 since Frost −391.1∗∗∗ (120.8)Month 14 since Frost −337.5∗∗∗ (122.7)Month 15 since Frost −342.1∗∗∗ (121.5)Month 16 since Frost −365.6∗∗∗ (104.7)Month 17 since Frost −349.5∗∗∗ (103.9)Month 18 since Frost −282.7∗∗ (112.9)Month 19 since Frost −268.5∗∗ (121.6)Month 20 since Frost −266.0∗∗ (122.5)Month 21 since Frost −245.7∗∗ (107.0)Month 22 since Frost −246.8∗∗ (109.4)Month 23 since Frost −243.5∗∗ (108.7)Month 24 since Frost −233.5∗∗ (110.2)
Constant 4794∗∗∗ (251)
R2 .92F-statistic 212, 072
Number of observations 576
Note: ***, **, and * indicate significance at the 0.1%, 1%, and 5% levels, respectively. Standard errors are in
parentheses (clustered by calendar year). The regression includes additional 48 time dummies for the second and third
weather shocks, which exhibit similar magnitude and significance (not shown in the table)
C(iii). Other Robustness Checks
Table 9 shows the demand estimates based on the annualized data. The purpose is toinvestigate whether the main results (based on the monthly dataset) are sensitive to thechoice of data frequency. The results are statistically significant and almost identical to
29
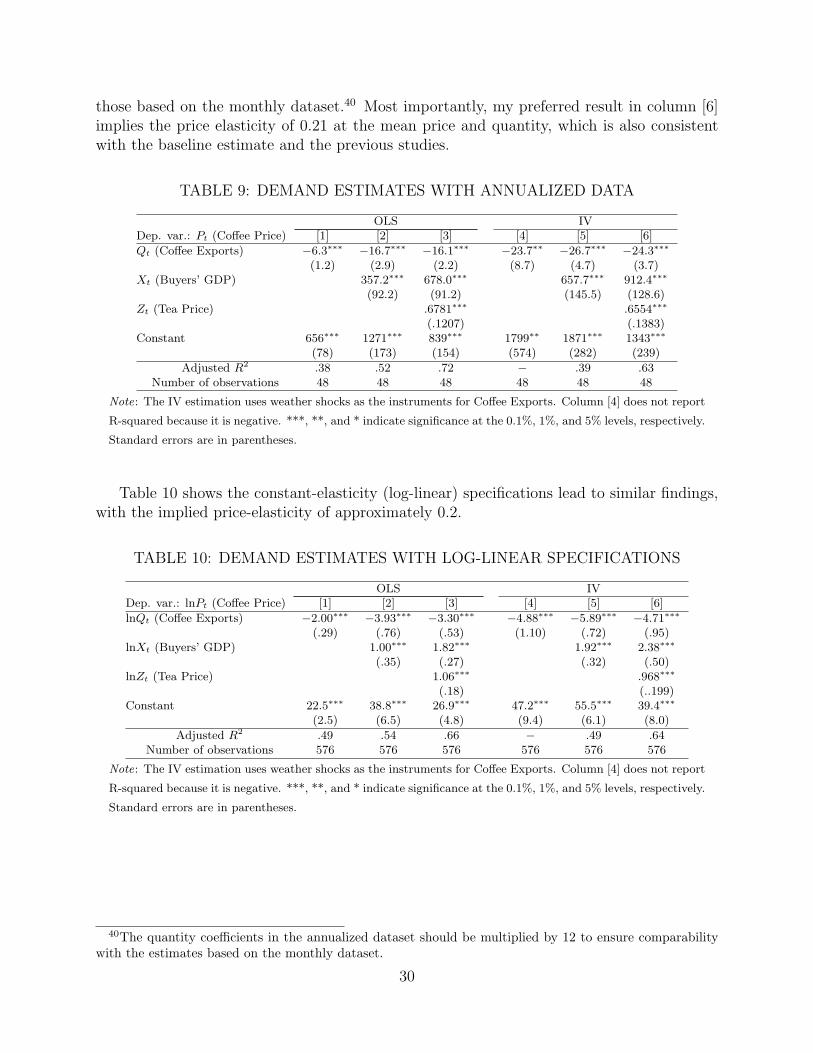
those based on the monthly dataset.40 Most importantly, my preferred result in column [6]implies the price elasticity of 0.21 at the mean price and quantity, which is also consistentwith the baseline estimate and the previous studies.
TABLE 9: DEMAND ESTIMATES WITH ANNUALIZED DATA
OLS IVDep. var.: Pt (Coffee Price) [1] [2] [3] [4] [5] [6]
Qt (Coffee Exports) −6.3∗∗∗ −16.7∗∗∗ −16.1∗∗∗ −23.7∗∗ −26.7∗∗∗ −24.3∗∗∗
(1.2) (2.9) (2.2) (8.7) (4.7) (3.7)Xt (Buyers’ GDP) 357.2∗∗∗ 678.0∗∗∗ 657.7∗∗∗ 912.4∗∗∗
(92.2) (91.2) (145.5) (128.6)Zt (Tea Price) .6781∗∗∗ .6554∗∗∗
(.1207) (.1383)Constant 656∗∗∗ 1271∗∗∗ 839∗∗∗ 1799∗∗ 1871∗∗∗ 1343∗∗∗
(78) (173) (154) (574) (282) (239)
Adjusted R2 .38 .52 .72 − .39 .63Number of observations 48 48 48 48 48 48
Note: The IV estimation uses weather shocks as the instruments for Coffee Exports. Column [4] does not report
R-squared because it is negative. ***, **, and * indicate significance at the 0.1%, 1%, and 5% levels, respectively.
Standard errors are in parentheses.
Table 10 shows the constant-elasticity (log-linear) specifications lead to similar findings,with the implied price-elasticity of approximately 0.2.
TABLE 10: DEMAND ESTIMATES WITH LOG-LINEAR SPECIFICATIONS
OLS IVDep. var.: lnPt (Coffee Price) [1] [2] [3] [4] [5] [6]
lnQt (Coffee Exports) −2.00∗∗∗ −3.93∗∗∗ −3.30∗∗∗ −4.88∗∗∗ −5.89∗∗∗ −4.71∗∗∗
(.29) (.76) (.53) (1.10) (.72) (.95)lnXt (Buyers’ GDP) 1.00∗∗∗ 1.82∗∗∗ 1.92∗∗∗ 2.38∗∗∗
(.35) (.27) (.32) (.50)lnZt (Tea Price) 1.06∗∗∗ .968∗∗∗
(.18) (..199)Constant 22.5∗∗∗ 38.8∗∗∗ 26.9∗∗∗ 47.2∗∗∗ 55.5∗∗∗ 39.4∗∗∗
(2.5) (6.5) (4.8) (9.4) (6.1) (8.0)
Adjusted R2 .49 .54 .66 − .49 .64Number of observations 576 576 576 576 576 576
Note: The IV estimation uses weather shocks as the instruments for Coffee Exports. Column [4] does not report
R-squared because it is negative. ***, **, and * indicate significance at the 0.1%, 1%, and 5% levels, respectively.
Standard errors are in parentheses.
40The quantity coefficients in the annualized dataset should be multiplied by 12 to ensure comparabilitywith the estimates based on the monthly dataset.
30
APPENDIX D. DIRECT MEASURE OF THE CARTEL’S MARKETPOWER UNDER SYMMETRY ASSUMPTION
The first-order condition of country i’s profit maximization (equation 2) implies
− (Pt −mcit)
(∂P
∂Q
)−1
= qit. (6)
Under the symmetric Cournot assumption, we can sum this equation across countries toobtain the relation
µt ≡ (Pt −mct)− (∂P/∂Q)−1
QCt
=1
N. (7)
This normalized markup, in turn, will facilitate the simulations of counterfactual marketstructures (section VI(ii)).41
This static measure of market power is a sufficient statistic for the purpose of this studybecause we can measure it directly from data. As an alternative modeling approach, con-sideration of a dynamic game within the ICA cartel, in the spirit of tacit collusion models,would be of interest. The ICA, however, is an explicit and legal collusion regime that is ex-ternally enforced by the importing countries such as the United States. Occasional episodesof cheating notwithstanding, an exporting country cannot deviate much from its allocatedquota, because the U.S. government and other importing countries monitored and enforcedthe quota agreement (see Appendix A(ii)). Moreover, quota is annual and stable over years.Hence the actual functioning of the ICA leaves little room for truly dynamic strategic inter-actions, either in the form of repeated game or in terms of production capacity dynamics.Thus, in the institutional context under study, the static notion of market power (directlyobserved as mt and µt) is sufficient for measuring the performance of the cartel treaty.
I measured the extent of market power among the cartel countries by observing themarkup and the net demand curve the countries face. One can normalize the price-costmargin by the price elasticity of demand:
(Pt −mct)− (∂P/∂Q)−1
QCt
=
(−α1
Pt
QCt
)mt, (8)
which is an empirical analog of µt in equation (7) and is expected to equal 1/N under theadditional assumption of symmetric Cournot competition (i.e., 0.0182 = 1/55 under 55-firmCournot, 0 under perfect competition, and 1 under monopoly).
Figure 8 contains three key messages about market power during and after the ICA.First, the t-test suggests the cartel-period average, µICA = 0.1016, is different from the post-cartel average, µPOST = 0.0163, at the statistical significance level of 1%.42 This differencereflects the lapse of ICA in July 1989 and implies the cartel exercised measurable market
41Although this paper focuses on evaluating the cartel’s overall market power and its global welfare conse-quences, in principle, one could also analyze markups at the individual country level rather than constructingan aggregate markup measure such as the above.
42Here I assume the level of µt during the ICA period is fixed by the developed countries’ foreign policies,and treat µt as constant within each of the two subsample periods.
31
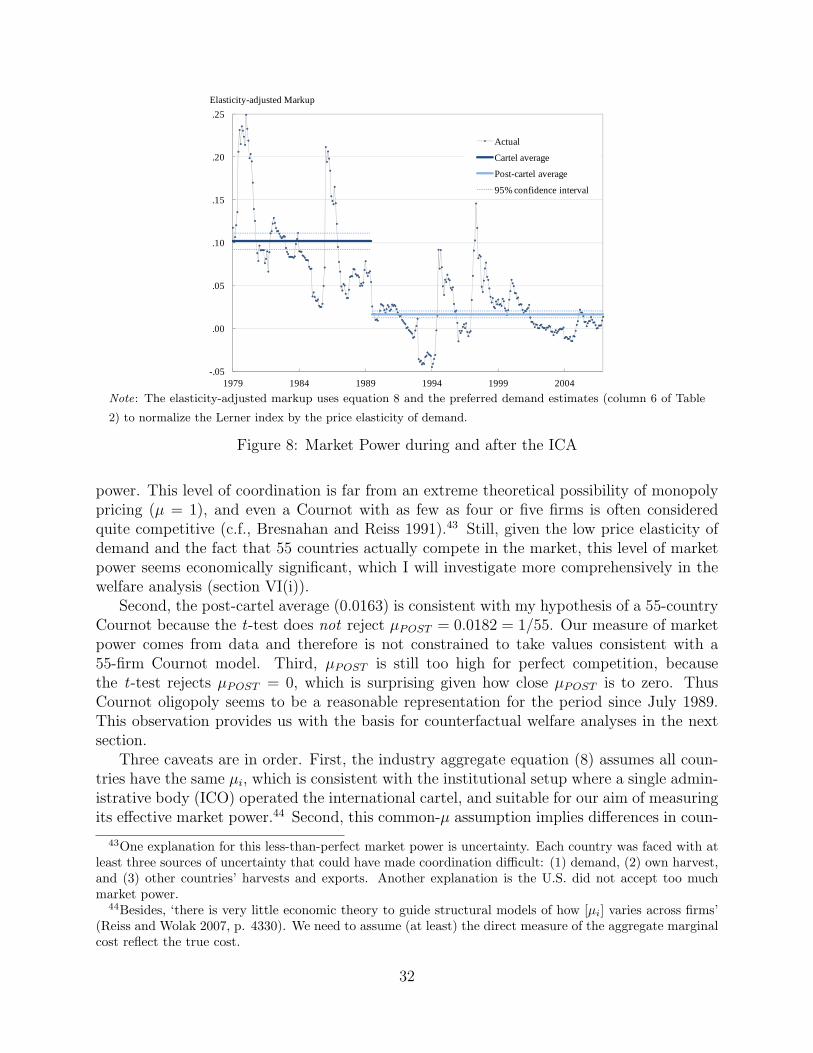
�
-.05
.00
.05
.10
.15
.20
.25
1979 1984 1989 1994 1999 2004
Actual
Cartel average
Post-cartel average
95% confidence interval
Elasticity-adjusted Markup
Note: The elasticity-adjusted markup uses equation 8 and the preferred demand estimates (column 6 of Table
2) to normalize the Lerner index by the price elasticity of demand.
Figure 8: Market Power during and after the ICA
power. This level of coordination is far from an extreme theoretical possibility of monopolypricing (µ = 1), and even a Cournot with as few as four or five firms is often consideredquite competitive (c.f., Bresnahan and Reiss 1991).43 Still, given the low price elasticity ofdemand and the fact that 55 countries actually compete in the market, this level of marketpower seems economically significant, which I will investigate more comprehensively in thewelfare analysis (section VI(i)).
Second, the post-cartel average (0.0163) is consistent with my hypothesis of a 55-countryCournot because the t-test does not reject µPOST = 0.0182 = 1/55. Our measure of marketpower comes from data and therefore is not constrained to take values consistent with a55-firm Cournot model. Third, µPOST is still too high for perfect competition, becausethe t-test rejects µPOST = 0, which is surprising given how close µPOST is to zero. ThusCournot oligopoly seems to be a reasonable representation for the period since July 1989.This observation provides us with the basis for counterfactual welfare analyses in the nextsection.
Three caveats are in order. First, the industry aggregate equation (8) assumes all coun-tries have the same µi, which is consistent with the institutional setup where a single admin-istrative body (ICO) operated the international cartel, and suitable for our aim of measuringits effective market power.44 Second, this common-µ assumption implies differences in coun-
43One explanation for this less-than-perfect market power is uncertainty. Each country was faced with atleast three sources of uncertainty that could have made coordination difficult: (1) demand, (2) own harvest,and (3) other countries’ harvests and exports. Another explanation is the U.S. did not accept too muchmarket power.
44Besides, ‘there is very little economic theory to guide structural models of how [µi] varies across firms’(Reiss and Wolak 2007, p. 4330). We need to assume (at least) the direct measure of the aggregate marginalcost reflect the true cost.
32

tries’ outputs are a function solely of differences in marginal costs, as Reiss and Wolak (2007)pointed out. My dataset contains suggestive evidence supporting this implication.45 Third,my measure of the cartel’s market power is robust to any actual functioning of the cartel andits individual members’ behavior (including dynamic game-theoretic interactions) becausethe identification of mt and µt in this paper uses data on mct rather than its estimates.
45I found a negative correlation (−.26) between the country rankings in qi and mci (1979–88 average). Weshould expect this inverse relationship if we assume marginal costs are increasing in output. Alternatively,we can also assume constant marginal costs up to capacity, which becomes binding only under severe weathershocks, as the experience of countries such as Brazil suggests.
33
REFERENCES
[1] Akiyama, T. and Varangis, P. N., 1990, ‘The Impact of the International Coffee Agree-ment on Producing Countries,’ The World Bank Economic Review, 4(2), pp. 157–173.
[2] Asker, J., 2010, ‘A Study of the Internal Organization of a Bidding Cartel,’ AmericanEconomic Review, 100(3), pp. 724–762.
[3] Bagwell, K. and Staiger, R. W., 2002, The Economics of the World Trading System(The MIT Press, Cambridge, Massachusetts, U.S.A.).
[4] Bates, R., 1997, Open-Economy Politics: The Political Economy of the World CoffeeTrade (Princeton University Press, Princeton, New Jewsey, U.S.A.).
[5] Bohman, M. and Jarvis, L., 1990, ‘The International Coffee Agreement: Economics ofthe Nonmember Market,’ European Review of Agricultural Economics, 17, pp. 99–118.
[6] Bohman, M., Jarvis, L. and Barichello, R., 1996, ‘Rent Seeking and InternationalCommodity Agreements: The Case of Coffee,’ Economic Development and CulturalChange, 44, pp. 379–404.
[7] Bresnahan, T. F., 1982, ‘The Oligopoly Solution Concept Is Identified,’ EconomicsLetters, 10, pp. 87–92.
[8] Bresnahan, T. F., 1987, ‘Competition and Collusion in the American Automobile In-dustry: The 1955 Price War,’ Journal of Industrial Economics, 35, pp. 457–482.
[9] Bresnahan, T. F. and Reiss, P. C., 1991, ‘Entry and Competition in ConcentratedMarkets,’ Journal of Political Economy, 99(5), pp. 977–1009.
[10] Catao, L. and Sutton, B., 2002, ‘Sovereign Defaults: the Role of Volatility,’ IMFWorking Paper, 02/149.
[11] Clark, T., 2007, Starbucked: A Double Tall Tale of Caffeine, Commerce, and Culture(Little, Brown and Company, New York, New York, U.S.A.).
[12] Deaton, A., 1999, ‘Commodity Prices and Growth in Africa,’ Journal of EconomicPerspectives, 13(3), pp. 23–40.
[13] Deaton, A. and Laroque, G., 1992, ‘On the Behaviour of Commodity Prices,’ Reviewof Economic Studies, 59(1), pp. 1–23.
[14] Deaton, A., 1996, ‘Competitive Storage and Commodity Price Dynamics,’ Journal ofPolitical Economy, 104(5), pp. 896–923.
[15] Deaton, A., 2003, ‘A model of commodity prices after Sir Arthur Lewis,’ Journal ofDevelopment Economics, 71, pp. 289–310.
[16] Domınguez, J. I., 1978, Cuba: Order and Revolution (Belknap Press of Harvard Uni-versity Press, Cambridge, Massachusetts, U.S.A.).
34
[17] Doutriaux, S., Geisler, C. and Shively, G., 2008, ‘Competing for Coffee Space:Development-Induced Displacement in the Central Highlands of Vietnam,’ Rural So-ciology, 73(4), pp. 528–554.
[18] Dube, O. and Vargas, J. F., 2013, ‘Commodity Price Shocks and Civil Conflict: Evi-dence from Colombia,’ Review of Economic Studies, 80, pp. 1384–1421.
[19] Duc, D. T. M., 2002, ‘Migration to the Central Highlands in the period of 1994–1999,’working paper, Hanoi National University of Education, Hanoi, Viet Nam.
[20] Ellison, G, 1994, ‘Theories of Cartel Stability and the Joint Executive Committee,’RAND Journal of Economics, 25(1), pp. 37–57.
[21] Genesove, D. and Mullin, W. P., 1998, ‘Testing Static Oligopoly Models: Conductand Cost in the Sugar Industry, 1890-1914,’ RAND Journal of Economics, 29(2), pp.355–377.
[22] Gilbert, C. L., 1996, ‘International Commodity Agreements: An Obituary Notice,’World Development, 24(1), pp. l–19.
[23] Giovannucci, D., Lewin, B., Swinkels, R. and Varangis, P., 2004, Vietnam Coffee SectorReport (World Bank, Washington, D.C., U.S.A.).
[24] Gupta, B., 2001, ‘The International Tea Cartel during the Great Depression, 1929–33,’Journal of Economic History, 61(1), pp. 144–159.
[25] Ha, D. T. and Shively, G., 2008, ‘Coffee Boom, Coffee Bust and Smallholder Responsein Vietnam’s Central Highlands,’ Review of Development Economics, 12(2), pp. 312–326.
[26] IBISWorld, 2008, ‘Coffee & Tea Production in the US,’ IBISWorld Industry Report,31192 (September 28).
[27] ICARD and Oxfam, 2002, The Impact of the Global Coffee Trade on Dak Lak Province,Viet Nam: Analysis and Policy Recommendations (Information Centre for Agriculturaland Rural Development, Oxfam Great Britain, and Oxfam Hong Kong, U.K.).
[28] Khandelwal, A. K., Schott, P.K. and Wei, S. J., 2013, ‘Trade Liberalization and Em-bedded Institutional Reform: Evidence from Chinese Exporters,’ American EconomicReview, 103(6), pp. 2169–2195.
[29] Karp, L. S. and Perloff, J. M., 1993, ‘A Dynamic Model of Oligopoly in the CoffeeExport Market,’ American Journal of Agricultural Economics, 75, pp. 448–457.
[30] Mehta, A. and Chavas, J. P., 2008, ‘Responding to the Coffee Crisis: What Can WeLearn from Price Dynamics?’ Journal of Development Economics, 85, pp. 282–311.
[31] Nakamura, E. and Zerom, D., 2010, ‘Accounting for Incomplete Pass-Through,’ Reviewof Economic Studies, 77(3), pp. 1192–1230.
35
[32] Porter, R. H., 1983, ‘A Study of Cartel Stability: The Joint Executive Committee,1880–1886,’ The Bell Journal of Economics, 14(2), pp. 301–314.
[33] Prebisch, R., 1959, ‘International trade and payments in an era of coexistence: com-mercial policy in the underdeveloped countries,’ American Economic Review (Papersand Proceedings), 49, pp. 251–273.
[34] Reiss, P. C. and Wolak, F. A., 2007, ‘Structural Econometric Modeling: Rationales andExamples from Industrial Organization,’ in J. Heckman and E. Leamer eds., Handbookof Econometrics, Volume 6A (Elsevier, Amsterdam, The Netherlands).
[35] Roberts, M. J., Xu, D. Y., Fan, X. and Zhang, S., 2011, ‘A Structural Model ofDemand, Cost, and Export Market Selection for Chinese Footwear Producers,’ workingpaper, Pennsylvania State University, State College, Pennsylvania, U.S.A.).
[36] Roll, R., 1984, ‘Orange Juice and Weather,’ American Economic Review, 74(5), pp.861–880.
[37] Singer, H.W., 1950, ‘US Foreign investment in underdeveloped areas: the distribu-tion of gains between investing and borrowing countries,’ American Economic Review(Papers and Proceedings), 40, pp. 473–485.
[38] Slade, M. E. and Thille, H., 2006, ‘Commodity Spot Prices: An Exploratory Assess-ment of Market Structure and Forward-Trading Effects,’ Economica, 73, pp. 229–256.
[39] Solem, M., Klein, P., Muniz-Solari, O. and Ray, W., 2010, ‘Population and NaturalResources: A module for the AAG Center for Global Geography Education,’ workingpaper, Association of American Geographers, Washington, D.C., U.S.A.
[40] Spar, D., 1994, The Cooperative Edge: The Internal Politics of International Cartels(Cornell University Press, Ithaca, New York, U.S.A.).
[41] Stocking, G. W. and Watkins, M. W., 1946, Cartels in Action: Case Studies in In-ternational Business Diplomacy (The Twentieth Century Fund, New York, New York,U.S.A.).
[42] Varangis, P., Siegel, P., Giovannucci, D. and Lewin, B., 2003, ‘Dealing with the CoffeeCrisis in Central America: Impacts and Strategies,’ Policy Research Working Paper2993, the World Bank, Washington, D.C., U.S.A.
[43] Verwimp, P., 2003, ‘The political economy of coffee, dictatorship, and genocide,’ Eu-ropean Journal of Political Economy, 19, pp. 161–181.
[44] Vuong, X. T., 2001, ‘Changing Land Policies and Its Impacts on Land Tenure ofEthnic Minorities in Vietnam,’ working paper presented at the 2001 workshop on Policyframeworks for enabling successful community-based resource management initiativesat East-West Center, Honolulu, Hawaii, U.S.A.
[45] Yeats, A. J., 1995, ‘Are partner-country statistics useful for estimating “missing” tradedata?’ World Bank Policy Research Working Paper No. 1501.
36