Embed Size (px)
Citation preview

7/26/2019 Ashokri_H.A
http://slidepdf.com/reader/full/ashokriha 1/19
MATTER: International Journal of Science and Technology
ISSN 2454-5880
© 2015 The author and GRDS Publishing. All rights reserved.Available Online at: http://grdspublishing.org/MATTER/matter.html
240
Ashokri, H.A and Rozainah, M.Z
Special Issue Vol.1 Issue 1, pp. 240-258
CARBON STOCK EVALUATION AND ITS POTENTIAL
CARBON MARKET VALUE IN CAREY ISLAND MANGROVEFOREST, SELANGOR, MALAYSIA
Ashokri, H.A Institute of Biological Sciences, Faculty of Sciences, University of Malaya,
50603 Kuala Lumpur, Malaysia, [email protected]
Rozainah, M.Z Institute of Ocean & Earth Sciences, Faculty of sciences, University of Malaya,
50603 Kuala Lumpur, Malaysia, n [email protected]
Abstract
This study was carried out to examine the total carbon stock and its potential carbon market
value at Carey Island mangrove forest, Selangor, Malaysia. Two sites were chosen: ODCC "by
the sea" and Kg. Melayu "riverine" as they represent the dominant mangrove tree species,
(Avicennia Alba, Rhizophora apiculata, Rhizophora mucronata and Xylocarpus granatum). Data
collection was done across three seasons: Intermediate, dry and wet for both sites in order to get
one year average. Sampled mangrove species were sorted out into leaves, stems, bark
(aboveground), roots (belowground) and litter; sediment samples were collected at 0-10, 10-20
and 20-30 cm deep. Carbon organic content was determined using furnace (LOI) followed by a
conversion factor of (1.724). Data obtained were utilized to compare the results between species,
tree partitioning, soil depth, seasons and different settings. Results showed that carbon was more
allocated in the dry season within the bark and 20-30 cm deep underground. In vegetations,
results have revealed that carbon allocation was very similar (bark > stem > leaf >root) even
though both sites represent different species. Litter carbon allocation was in the order of:
propagules > leaf > branch in ODCC and branch > propagules > leaf in Kg.Melayu. In
sediment, results brought to light that carbon allocation increases with soil depth. The total
carbon stock was estimated at 648.73 (t / ha / yr) in ODCC and (600.18) t / ha / yr in Kg.Melayu with
soil carbon stock representing 98% and 99% of the total carbon stock in ODCC and Kg. Melayu
respectively. The total coverage of mangrove forest is Carey Island was estimated 182.72 ha
7/26/2019 Ashokri_H.A
http://slidepdf.com/reader/full/ashokriha 2/19
MATTER: International Journal of Science and Technology
ISSN 2454-5880
© 2015 The author and GRDS Publishing. All rights reserved.Available Online at: http://grdspublishing.org/MATTER/matter.html
241
using Arc GIS 10.1. The potential carbon market value for Carey Island was in a range of USD
0.6 – 21.8 million.
Keywords
Mangrove, Carey Island, Biomass, Carbon Stock, Organic Carbon, Loss on Ignition, Carbon
Market Value
________________________________________________________________________
1. Introduction
As highlighted by Hemati et al., (2015) due to the accelerating growth of the economic
power in developing countries and the indifference of man due to his ignorance in terms of
mangrove functioning as key strategies to combat the global climatic changes, mangrove forests
end up disappearing at a scary rate around the whole world.
The estimated total area (ha) of mangrove forests worldwide as illustrated in Table (1) in
1980s was about 19.8 million ha and less than 15 million ha (Malaysia alone contributes about
4% of the total mangrove area worldwide) in 2000s as stated by Aizpuru et al., (2000) and
Alongi (2002), which means that the world has lost about 5 million ha of its mangrove coverage
in a period of 20 years. Logically, if this massive deforestation continued all of the mangrove
forests would be disappeared by the year 2060. It is known that about 90% 0f the mangrove areasare located in 26 developing countries and those areas are targeted to be deforested due to the
economical evolution. The importance of determining carbon stock in forest ecosystems comes
due to the direct proportion between the continued shrinkage of mangroves worldwide and
carbon stock declination. Not only that, but also only very few of those ecosystems are known
and well addressed regarding their carbon stocks.
Moreover, human activities have affected mangrove forests state worldwide, which have
led to an enormous increase in greenhouse gases (GHGs) in the atmosphere associated with
global climatic change. It was reported by (Houghton et al., 2001 Gullison et al., 2007; van der
Werf et al., 2009) that deforestation and forest degradation contribute 12-20% of the annual
GHGs emissions. The study objectives are:
To determine the total carbon stock in mangrove vegetation, litter, and sediment, on
Carey Island across three seasons.

7/26/2019 Ashokri_H.A
http://slidepdf.com/reader/full/ashokriha 3/19
MATTER: International Journal of Science and Technology
ISSN 2454-5880
© 2015 The author and GRDS Publishing. All rights reserved.Available Online at: http://grdspublishing.org/MATTER/matter.html
242
To determine the carbon market value of the ecosystem chosen.
Table 1: Current and Past Mangrove Extent by Region (1980-2005)
Region Most recentreliable estimates
(1980) (1990) (2000) (2005)
X 1000 ha Ref
year
1000 ha 1000 ha 1000 ha 1000 ha
Africa 3.243 1997 3,670 3.428 3,218 3,160
Asia 6,048 2002 7,769 6,741 6,163 5,858
North and Central America 2,358 2000 2,951 2,592 2,352 2,263
Oceania 2,019 2003 3,181 2,090 2,012 1,972
South America 2,038 1992 2,222 2,073 1,996 1,978
World 15,705 2000 19,794 16,925 15,740 15,231
Source: (Lang'at, 2013).
The biomass estimation of the study area was reported by Saraswathy et al., (2009) who
have pointed out that Avicennia Alba, Rhizophora apiculata, Rhizophora mucronata and
Xylocarpus granatum are the dominant species in Carey Island with the highest Importance
Value Indexes (IVI), which were: 15.57%, 8.01%, 14.03% and 10.02% respectively and the
highest total biomass. The first two species were present only in ODCC, while the other two
were present in Kg. Melayu. So, only the above four species was targeted when sampling.
The significant function of mangrove forests comes due to that the total organic carbon
(TOC) values in mangrove sediments were relatively similar to that of the mangrove vegetation
parts as reported by Bouillon et al., (2008). Terrestrial vegetation forms (litter) are one of the
major sources of carbon in soils and sediments, where they represent nearly 75% of carbon
stored in terrestrial ecosystems and approximately, 50% when carbon in soil is not excluded.
Schlesinger & Andrews (2000) has pointed out that about 40% of the carbon is annually
exchanged between the atmosphere and the terrestrial biosphere. Also Sitoe et al., (2014) has
found that around 73% of the soil content was a stored carbon. Lewis et al., (2009) has reported
that these processes are totally influenced by the climatic and the environmental changes. Hence,

7/26/2019 Ashokri_H.A
http://slidepdf.com/reader/full/ashokriha 4/19
MATTER: International Journal of Science and Technology
ISSN 2454-5880
© 2015 The author and GRDS Publishing. All rights reserved.Available Online at: http://grdspublishing.org/MATTER/matter.html
243
forest ecosystems play an important role in regulating carbon dioxide (CO₂) concentrations in the
atmosphere and mitigating the climate changes (Luyssaert et al, 2007).
According to Santilli et al., (2005) "The current annual rates of deforestation in Brazil
and Indonesia would equal four-fifths of the emission reductions gained by implementing the
Kyoto Protocol in the first commitment period, Jeopardizing the goal of Protocol to avoid
(dangerous anthropogenic interference) with the climate system" . Hereby, the several countries
that have signed the Protocol are currently trying to integrate CO₂ inventories by ecosystem and
region which is called emissions trading or carbon trading/value.
The formation of carbon market was a result of national and international attempts to
mitigate the concentration of GHGs emissions and to prove that the value of tropical and
subtropical forests extends beyond their economic value as commodities. The purpose of
establishing such a scheme is to reduce carbon emissions either by getting the permission to emit
certain amounts of GHGs (buying) or by the reduction of those emissions (selling) (Angelsen et
al., 2009; Ullman et al., 2013).
Globally, the total carbon market in 2008 was traded nearly 5 billion tones for GHGs
emission reductions in both regulated and voluntary markets and only 65 million tones of them
were traded voluntarily and it is advised not to rely on voluntary markets alone in order to make
progress in GHGs reduction (Bayon et al., 2012; Alekseev & Anger, 2015).
2. Methodology
2.1 Study Site Description
This study was conducted at Carey Island, Selangor that is the largest island among 8
islets of the west coast of Peninsular, Malaysia with an area of about 15,000 ha. About 78% of
the island is planted with oil palm and managed by Sime Darby Sdn. Bhd and also some private
holders. Carey Island is located about 70 km away from the south west of Kuala Lumpur, the
south of Port Klang and north of Banting town and separated from the Selangor coast bythe Langat River, connected by a bridge from Chodoi and Teluk Panglima Garang near Banting.
ODCC (02.49192° N, 101. 21285° E) and Kg.Melayu (02.49410° N, 101.21567° E) were the
two sites chosen owing to the availability of the targeted species and the easy accessibility.

7/26/2019 Ashokri_H.A
http://slidepdf.com/reader/full/ashokriha 5/19
MATTER: International Journal of Science and Technology
ISSN 2454-5880
© 2015 The author and GRDS Publishing. All rights reserved.Available Online at: http://grdspublishing.org/MATTER/matter.html
244
Figure 1: The location of the study area (Carey Island, Selangor, Malaysia).
2.2 Sampling Methods
2.2.1 Living Parts
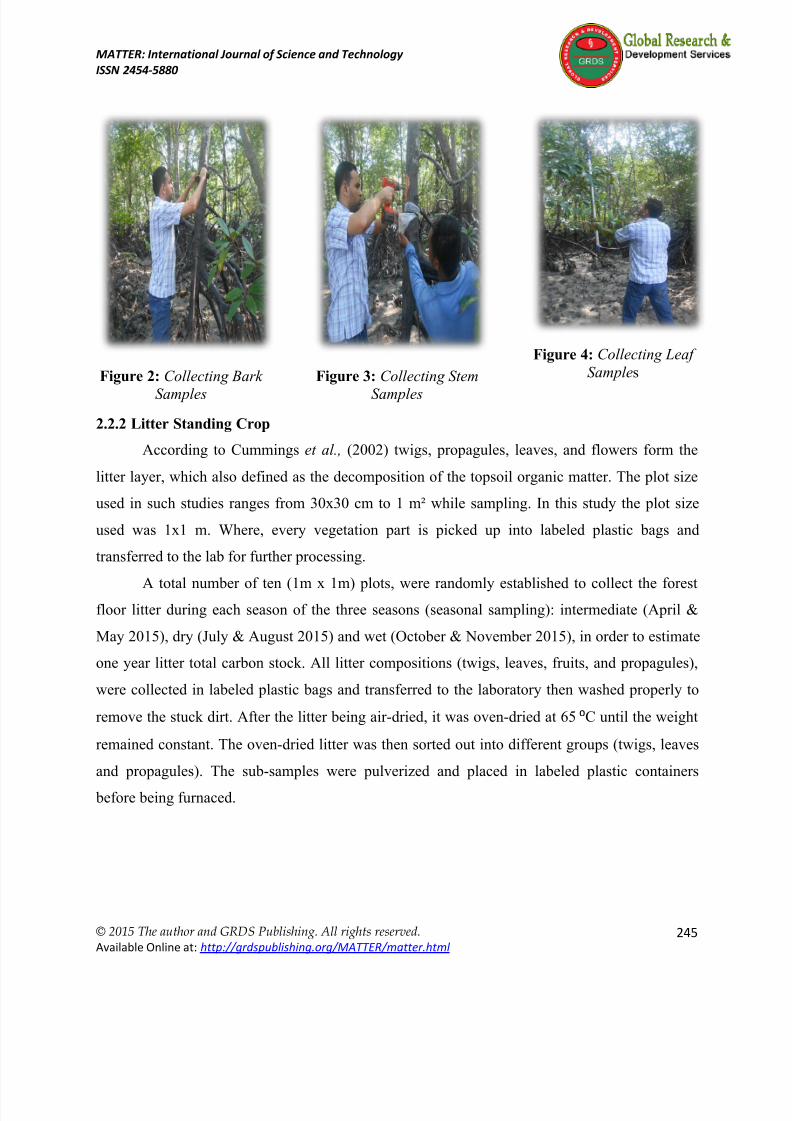
Four trees of each of the targeted species were chosen while sampling (bark, leaf, stem
and root) during the three seasons. The bark of the targeted trees was removed via a keen knife atabout 1.5 m height (Figure 2). Stem samples were collected by drilling the stem until the center
(Figure 3). Collection of the leaf samples was done using the leaf cutter (Corona TP 32-6)
(Figure 4). Roots were collected from living trees. All of the collected samples were put into
labeled plastic bags and weighed then oven-dried at 65 ⁰C until the weight remained constant.
All samples were pulverized using (A10 manufactured by 1 KA-Labortechnik) then kept in
labeled plastic containers before being furnaced.
7/26/2019 Ashokri_H.A
http://slidepdf.com/reader/full/ashokriha 6/19
MATTER: International Journal of Science and Technology
ISSN 2454-5880
© 2015 The author and GRDS Publishing. All rights reserved.Available Online at: http://grdspublishing.org/MATTER/matter.html
245
Figure 2: Collecting Bark
Samples
Figure 3: Collecting Stem
Samples
Figure 4: Collecting Leaf
Samples
2.2.2 Litter Standing Crop
According to Cummings et al., (2002) twigs, propagules, leaves, and flowers form the
litter layer, which also defined as the decomposition of the topsoil organic matter. The plot size
used in such studies ranges from 30x30 cm to 1 m² while sampling. In this study the plot size
used was 1x1 m. Where, every vegetation part is picked up into labeled plastic bags and
transferred to the lab for further processing.
A total number of ten (1m x 1m) plots, were randomly established to collect the forestfloor litter during each season of the three seasons (seasonal sampling): intermediate (April &
May 2015), dry (July & August 2015) and wet (October & November 2015), in order to estimate
one year litter total carbon stock. All litter compositions (twigs, leaves, fruits, and propagules),
were collected in labeled plastic bags and transferred to the laboratory then washed properly to
remove the stuck dirt. After the litter being air-dried, it was oven-dried at 65 ⁰C until the weight
remained constant. The oven-dried litter was then sorted out into different groups (twigs, leaves
and propagules). The sub-samples were pulverized and placed in labeled plastic containers
before being furnaced.

7/26/2019 Ashokri_H.A
http://slidepdf.com/reader/full/ashokriha 7/19
MATTER: International Journal of Science and Technology
ISSN 2454-5880
© 2015 The author and GRDS Publishing. All rights reserved.Available Online at: http://grdspublishing.org/MATTER/matter.html
246
Figure 5: Collection of the Standing Crop
2.2.3 Soil
Soil sampling was done through the three seasons, a total number of four samples were
randomly collected in each single fieldtrip using 5cm PVC pipe. The samples were collected
from three depths, which are: (0-10 cm), (10-20 cm) and (20-30 cm) due to that the variation of
carbon content is very little as the depth exceeds 30 cm (Kauffman et al., 2011).
After the samples were collected, they were transferred to the laboratory for further
processing. Soil samples were dried at room temperature for few days then sieved via 2mm sieve
and kept into labeled plastic containers before being furnaced (Bernard et al., 1995; Kauffman &
Donato, 2012). Soil carbon storage was estimated using the following formula:
(1)
Where, % C is the carbon concentration expressed as a whole number
2.3 Carbon Stock Evaluation
2.3.1 Vegetation Biomass and Carbon Pool
According to Kauffman and Donato (2012), the total carbon stock / pool of the vegetation
biomass can be calculated multiplying the mean organic carbon content of the highest two
vegetation parts in percentage (%) by the total biomass for each season as follows:

7/26/2019 Ashokri_H.A
http://slidepdf.com/reader/full/ashokriha 8/19
MATTER: International Journal of Science and Technology
ISSN 2454-5880
© 2015 The author and GRDS Publishing. All rights reserved.Available Online at: http://grdspublishing.org/MATTER/matter.html
247
(2)
2.3.2 Litter Carbon Stock
Litter total carbon stock can be determined by obtaining the mean carbon storage in
percentage (%) of the litter parts and multiply it by the oven-dry mass (Kauffman & Donato,
2012).
(3)
2.3.3 Soil Carbon Storage
Based on Kauffman & Donato (2012) carbon stored in soil can be estimated by obtaining
the mean total soil carbon storage for each season and then obtaining the average total soil
carbon storage (t/ha) for one year using equation (1).
2.3.4 Total Ecosystem Carbon StockBased on Howard et al., (2014) the total carbon can be obtained by summing up the mean
organic carbon content of the vegetation parts, litter and the average total soil carbon storage for
the targeted year expressed in (t/ha C yrˉ¹), then the total carbon stock (Blue Carbon) of the
investigated site (Mg) can be calculated as follows:
(4)
2.4 Converting to CO₂ Equivalents (Mg CO₂)
According to Howard et al., (2014) the total carbon stock of the ecosystem investigated
can be expressed into CO₂ equivalents as stated below:
7/26/2019 Ashokri_H.A
http://slidepdf.com/reader/full/ashokriha 9/19
MATTER: International Journal of Science and Technology
ISSN 2454-5880
© 2015 The author and GRDS Publishing. All rights reserved.Available Online at: http://grdspublishing.org/MATTER/matter.html
248
(5)
As greenhouse gas emissions (GHGs), are usually reported in carbon dioxide units CO ₂
equivalents or CO₂e simply since CO₂ is the most common form of carbon in the atmosphere.
Total carbon stock, can be converted to CO₂e by multiplying carbon stock of the ecosystem
investigated by a conversion factor of 3.67 (Kauffman & Donato, 2012).
2.5 Carbon Market Value
There are two essential market sources in terms of evaluating the emitted/stored carbon
which are: the regulated or certified emissions reductions (CERs) and the voluntary market or
voluntary emissions reductions (VERs). The difference between these two markets is that the
regulatory market is certified, traded on official markets such as: (EU ETS), and more organized,
unlike the voluntary market, which is traded freely among individuals and organizations (Tavoni
et al., 2007; Bayon et al., 2012; Ullman et al., 2013).
The total carbon stock in a forest ecosystem can be estimated by multiplying the total
carbon of the projected area (t/ha C yr ̄ ¹) by the size of the projected area (ha) which will provide
us with an estimation of the buried carbon content which will be multiplied by the price of
carbon unit to get its potential carbon market value.
2.6 Statistical Analysis
The results were expressed as the amount of organic carbon stored in the vegetative parts
and soil layers in both sites during the three seasons. ANOVA was used to determine the degree
of standard deviation and Statistical Package for the Social Sciences (SPSS) was utilized to
compare the results. Between species, tree partitioning, soil depth, and seasons.
3. Results and Discussion
3.1 Mangrove Forest Structure and Biomass of ODCC and Kg. Melayu
It is well known and of logic, that forest organic carbon density goes in parallel with
biomass growth and mangrove forest age (Wang et al., 2013). According to a case study in Kien

7/26/2019 Ashokri_H.A
http://slidepdf.com/reader/full/ashokriha 10/19
MATTER: International Journal of Science and Technology
ISSN 2454-5880
© 2015 The author and GRDS Publishing. All rights reserved.Available Online at: http://grdspublishing.org/MATTER/matter.html
249
Giang Province conducted by Wilson, (2010), tree size and density are the main determinant of
stand biomass and hence, wood density highly affects carbon content of the plant. In this study,
Avicennia alba and Rhizophora apiculata were the two dominant tree species in ODCC with a
total biomass of 3.40 t/ha and 5.99 t/ha respectively while Rhizophora mucronata and
Xylocarpus granatum were the two dominant tree species in Kg. Melayu with a total biomass of
12.45 t/ha and 9.40 t/ha respectively. According to the above values, the total biomass of
Kg.Melayu is approximately two times higher than it is in ODCC (Saraswathy et al., 2009).
3.2 Carbon Pools
Organic carbon allocation in the living parts (vegetative carbon) recorded the highest in
the bark recording 55.77% ± 2.77 in ODCC and 55.44% ± 3.86 in Kg. Melayu and the lowestwas recorded in the roots 49.16% ± 3.76 in ODCC and 48.52% ± 3.98 in Kg. Melayu in the order
of bark > stem > leaf > root (Figure 6). The average carbon content was equal to 52.68 ± 4.07
and 52.53 ± 4.27 in ODCC and Kg. Melayu consecutively. The order of carbon across seasons
was in the order of dry > intermediate > wet for both study sites. Similar trends can be seen in
studies conducted by Hemati et al., (2015); Mitra et al., (2011) and Rodrigues et al., (2015).
The total vegetation biomass was divided into aboveground and belowground and it was
in the order of aboveground > belowground (Figure 7). Total biomass carbon stock
(aboveground and belowground) in ODCC has recorded 5.03 (t/ha/yr) and 9.24 (t/ha/yr) in Kg.
Melayu which explained by that total biomass in Kg. Melayu is approximately twice as much as
it is in ODCC which similar to several publication's findings including findings reported by Chen
et al., (2012) and Hemati et al., (2015).

7/26/2019 Ashokri_H.A
http://slidepdf.com/reader/full/ashokriha 11/19
MATTER: International Journal of Science and Technology
ISSN 2454-5880
© 2015 The author and GRDS Publishing. All rights reserved.Available Online at: http://grdspublishing.org/MATTER/matter.html
250
Figure 6: Organic Carbon Distribution in
Mangrove Tree Parts
Figure 7: Distribution of Organic Carbon
Content in Tree Biomass
Litter standing crop was the second pool estimated and it has showed that the propagules
part has recorded the highest value in terms of carbon storage (53.13%) in ODCC in the order of
propagules > leaf > branch. In Kg. Melayu, branch part has recorded the highest amount of
carbon storage (53.31%) in the order of branch > propagules > leaf (Figure 9). Such trends could
be explained by that, different standing crop parts act differently to the biochemical activities
that take in place. The highest carbon storage in terms of seasons was in the dry season recording
55.41% and 54.90% in ODCC and Kg. Melayu respectively in the order of dry > intermediate >
wet. The total carbon stock in litter standing crop was valued to 0.77 (t/ha/yr) in ODCC and 1.06
(t/ha/yr) in Kg.Melayu, which is interpreted by that Kg. Melayu was higher than ODCC in terms
of tree biomass and that makes it higher in terms of litter standing crop production. Not only that,
but also ODCC is more exposed to tidal waves that wash standing crop away as it is by the sea
than Kg. Melayu that is more protected as it a riverine area.

7/26/2019 Ashokri_H.A
http://slidepdf.com/reader/full/ashokriha 12/19
MATTER: International Journal of Science and Technology
ISSN 2454-5880
© 2015 The author and GRDS Publishing. All rights reserved.Available Online at: http://grdspublishing.org/MATTER/matter.html
251
Figure 8: Organic Carbon in Litter Standing Crop at ODCC & Kg. Melayu
Soil Carbon stock is the highest ecosystem carbon pool contributing 50-90% of the total
ecosystem carbon stock as indicated by Donato et al., (2011). This study has found that about
99% and 98% of the total carbon stock in ODCC and Kg. Melayu was stored in the soil
regardless the health status in the forest as the biomass in both study sites is considered low as
highlighted by Saraswathy et al., (2009). The third layer (20-30 cm) has achieved the highest
carbon storage in both study sites in dry season, which has increased with the soil layer depth
which is a common trend in tropical forests (Orihuela et al., 2004) in the order of dry >
intermediate > wet (Figure 9). Soil carbon stock was equal to 642.93 (t /ha/yr) and 589.88
(t/ha/yr) in ODCC and Kg. Melayu respectively (Figure 10). Although, Kg. Melayu was slightly
higher in terms of soil carbon storage values but it has recorded lower total carbon stock as it has
lower bulk density (0.59 g/cm³) as soils that have low bulk density are richer in organic matter
and vice versa as reported by Huber et al., (2008).

7/26/2019 Ashokri_H.A
http://slidepdf.com/reader/full/ashokriha 13/19
MATTER: International Journal of Science and Technology
ISSN 2454-5880
© 2015 The author and GRDS Publishing. All rights reserved.Available Online at: http://grdspublishing.org/MATTER/matter.html
252
Figure 9: Organic Carbon Content (%) in Soil Sediment across Seasons
Figure 10: Ecosystem Carbon Stocks in ODCC and Kg.Melayu

7/26/2019 Ashokri_H.A
http://slidepdf.com/reader/full/ashokriha 14/19
MATTER: International Journal of Science and Technology
ISSN 2454-5880
© 2015 The author and GRDS Publishing. All rights reserved.Available Online at: http://grdspublishing.org/MATTER/matter.html
253
3.3 Carbon Stock Economic Evaluation and Carbon Dioxide Equivalents
As highlighted by Ullman et al., (2013) there are two market sources that put value on the
emitted carbon which are the voluntary market and the regulatory market. The voluntary market
is mainly for individuals, companies, and governments who are wishing to buy/sell their carbon
credits while the regulated market is more organized as it requires buyers to have implemented
policy before allowing them to participate. Not only that, but also regulated market provides
higher amounts which will have a positive reflection on global wetland conservation.
Potential carbon market value determination for an ecosystem can be conducted by
multiplying the total carbon stocks with the price of the market price. In Carey Island, the
potential carbon market value was in a range of 0.6 - 21.8 million USD (Table 2) as the buried
carbon content in Carey Island mangrove forest based on the mangrove coverage (182.72 ha)was 114,099.50 T C yrˉ¹.
Table 2: Estimated Price of Carbon Stocks in ODCC and Kg. Melayu Based on Different Global
Market Sources
Ecosystem
C Stocks
(Tg)
Market
→
Voluntary EU
ETS
CDM GHGs
initiative
Kyoto
assigned
allowance
Price/T
(USD)
→
6.00 191.80 15.68 9.69 13.95
ODCC
(648.73
t/ha/yr *
182.72 ha)
118,535.94 711,215.64 22.7
mil
1.8
mil
1.1 mil 1.6 mil
Kg.Melayu
(600.18
t/ha/yr *
182.72 ha)
109,664.88 657,989.28 21.0
mil
1.7
mil
1.0 mil 1.5 mil
7/26/2019 Ashokri_H.A
http://slidepdf.com/reader/full/ashokriha 15/19
MATTER: International Journal of Science and Technology
ISSN 2454-5880
© 2015 The author and GRDS Publishing. All rights reserved.Available Online at: http://grdspublishing.org/MATTER/matter.html
254
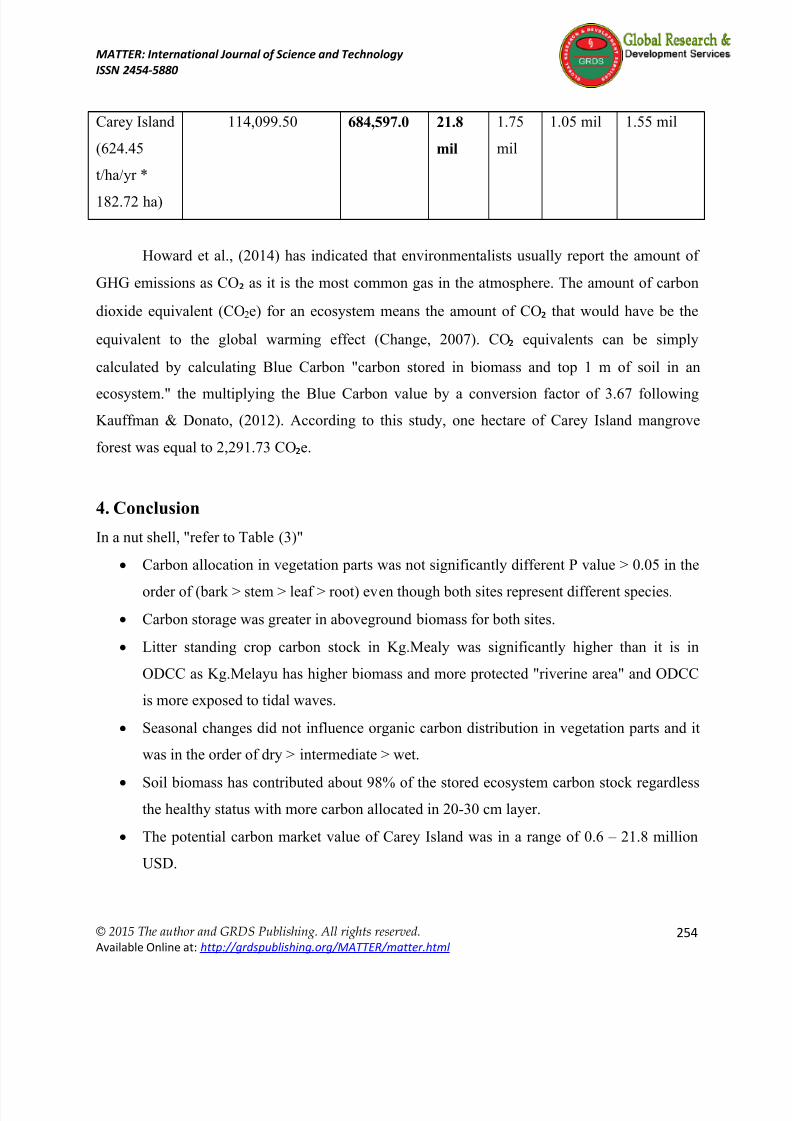
Carey Island
(624.45
t/ha/yr *
182.72 ha)
114,099.50 684,597.0 21.8
mil
1.75
mil
1.05 mil 1.55 mil
Howard et al., (2014) has indicated that environmentalists usually report the amount of
GHG emissions as CO₂ as it is the most common gas in the atmosphere. The amount of carbon
dioxide equivalent (CO2e) for an ecosystem means the amount of CO₂ that would have be the
equivalent to the global warming effect (Change, 2007). CO₂ equivalents can be simply
calculated by calculating Blue Carbon "carbon stored in biomass and top 1 m of soil in an
ecosystem." the multiplying the Blue Carbon value by a conversion factor of 3.67 following
Kauffman & Donato, (2012). According to this study, one hectare of Carey Island mangrove
forest was equal to 2,291.73 CO₂e.
4. Conclusion
In a nut shell, "refer to Table (3)"
Carbon allocation in vegetation parts was not significantly different P value > 0.05 in the
order of (bark > stem > leaf > root) even though both sites represent different species.
Carbon storage was greater in aboveground biomass for both sites.
Litter standing crop carbon stock in Kg.Mealy was significantly higher than it is in
ODCC as Kg.Melayu has higher biomass and more protected "riverine area" and ODCC
is more exposed to tidal waves.
Seasonal changes did not influence organic carbon distribution in vegetation parts and it
was in the order of dry > intermediate > wet.
Soil biomass has contributed about 98% of the stored ecosystem carbon stock regardlessthe healthy status with more carbon allocated in 20-30 cm layer.
The potential carbon market value of Carey Island was in a range of 0.6 – 21.8 million
USD.

7/26/2019 Ashokri_H.A
http://slidepdf.com/reader/full/ashokriha 16/19
MATTER: International Journal of Science and Technology
ISSN 2454-5880
© 2015 The author and GRDS Publishing. All rights reserved.Available Online at: http://grdspublishing.org/MATTER/matter.html
255
Table 3: Summary of carbon Content in Vegetation at both Study Sites
Vegetation ODCC Kg.Melayu
Average carbon
content (%)
52.68 ± 4.07 52.53 ± 4.27
Order of C (%) based
on species
A.alba > R.apiculata X.granatum > R.mucronata
Order of vegetation
tree parts
bark > stem > leaf > root bark > stem > leaf > root
Order of biomass
partitioning
Aboveground > belowground Aboveground > belowground
Order of seasonal
changes
Dry > intermediate > wet Dry > intermediate > wet
5. Acknowledgement
The authors would like to thank the University of Malaya (RP001M-13SUS) for funding
the study. Assistance from the staff of the Institute of Biological Sciences and Sime Darby
Company is highly appreciated.
REFERENCES
Aizpuru, M., Achard, F., & Blasco, F. (2000). Global assessment of cover change of the
mangrove forests using satellite imagery at medium to high resolution. EEC research
project (15017-1999), 05.
Alexeeva, V., & Anger, N. (2015). The globalization of the carbon market: Welfare and
competitiveness effects of linking emissions trading schemes. Mitigation and Adaptation
Strategies for Global Change, 1-26. http://dx.doi.org/10.1007/s11027-014-9631-y
Alongi, D. M. (2002). Present state and future of the world's mangrove forests. Environmental
conservation, 29(03), 331-349. http://dx.doi.org/10.1017/S0376892902000231
Angelsen, A., & Brockhaus, M. (2009). Realising REDD+: National strategy and policy options:
CIFOR.

7/26/2019 Ashokri_H.A
http://slidepdf.com/reader/full/ashokriha 17/19
MATTER: International Journal of Science and Technology
ISSN 2454-5880
© 2015 The author and GRDS Publishing. All rights reserved.Available Online at: http://grdspublishing.org/MATTER/matter.html
256
Bayon, R., Hawn, A., & Hamilton, K. (2012). Voluntary carbon markets: an international
business guide to what they are and how they work : Routledge.
Bernard, B. B., Bernard, H., & Brooks, J. M. (1995). Determination of total carbon, total organic
carbon and inorganic carbon in sediments. TDI-Brooks International/B&B Labratories
Inc. College Station, Texas, 1-5.
Bouillon, S., Borges, A. V., Castañeda‐Moya, E., Diele, K., Dittmar, T., Duke, N. C., Kristensen,
E., Lee, S. Y., Marchand, C., Middelburg, J. J. (2008). Mangrove production and carbon
sinks: a revision of global budget estimates. Global Biogeochemical Cycles, 22(2).
http://dx.doi.org/10.1029/2007GB003052
Change, I. C. (2007). Impacts, Adaptation and Vulnerability. Contribution of Working Group Ⅱ
to the Fourth Assessment Report of the Intergovernmental Panel on Climate Change. UK
and NEW YORK, USA: Cambridge University Press.
Chen, L., Zeng, X., Tam, N. F., Lu, W., Luo, Z., Du, X., & Wang, J. (2012). Comparing carbon
sequestration and stand structure of monoculture and mixed mangrove plantations of
Sonneratia caseolaris and S. apetala in Southern China. Forest Ecology and Management,
284, 222-229.http://dx.doi.org/10.1016/j.foreco.2012.06.058 http://dx.doi.org/ 10.1016/j.
foreco.2012.01.033
Cummings, D., Kauffman, J. B., Perry, D. A., & Hughes, R. F. (2002). Aboveground biomassand structure of rainforests in the southwestern Brazilian Amazon. Forest Ecology and
Management, 163(1), 293-307. http://dx.doi.org/10.1016/S0378-1127(01)00587-4
Donato, D. C., Kauffman, J. B., Murdiyarso, D., Kurnianto, S., Stidham, M., & Kanninen, M.
(2011). Mangroves among the most carbon-rich forests in the tropics. Nature geoscience,
4(5), 293-297. http://dx.doi.org/10.1038/ngeo1123
Gullison, R. E., Frumhoff, P. C., Canadell, J. G., Field, C. B., Nepstad, D. C., Hayhoe, K.,
Avissar, R., Curran, L. M., Friedlingstein, P., Jones, C. D. (2007). Tropical forests and
climate policy. SCIENCE-NEW YORK THEN WASHINGTON-, 316 (5827), 985.
http://dx.doi.org/10.1126/science.1136163
Hemati, Z., Hossain, M., Emenike, C. U., & Rozainah, M. Z. (2015). Rate of Carbon Storage in
Soil of Natural and Degraded Mangrove Forest in Peninsular Malaysia. CLEAN – Soil, Air,
Water, 43(4), 614-619. http://dx.doi.org/10.1002/clen.201400034

7/26/2019 Ashokri_H.A
http://slidepdf.com/reader/full/ashokriha 18/19
MATTER: International Journal of Science and Technology
ISSN 2454-5880
© 2015 The author and GRDS Publishing. All rights reserved.Available Online at: http://grdspublishing.org/MATTER/matter.html
257
Houghton, Y. D., Griggs, D., Mouguer, M., van der Linden, P., Dai, X., Maskell, K., & Johnson,
C. (2001). Climate Change 2001: Working Group I: The Scientific Basis: Cambridge
University Press, Cambridge, UK.
Howard, J., Hoyt, S., Isensee, K., Telszewski, M., & Pidgeon, E. (2014). Coastal blue carbon:
methods for assessing carbon stocks and emissions factors in mangroves, tidal salt
marshes, and seagrasses. Conservation International, Intergovernmental Oceanographic
Commission of UNESCO, International Union for Conservation of Nature, Arlington,
Virginia.
Huber, S., Prokop, G., Arrouays, D., Banko, G., Bispo, A., Jones, R., J. A., Kibblewhite, M. G.,
Lexer, W., Moller, A., Rickson, R. (2008). Environmental Assessment of Soil for
Monitoring: Volume I, Indicators & Criteria. Office for the Official Publications of the European Communities, Luxembourg .
Kauffman, J. B., & Donato, D. (2012). Protocols for the measurement, monitoring and reporting
of structure, biomass and carbon stocks in mangrove forests: Center for International
Forestry Research (CIFOR), Bogor, Indonesia.
Kauffman, J. B., Heider, C., Cole, T. G., Dwire, K. A., & Donato, D. C. (2011). Ecosystem
carbon stocks of Micronesian mangrove forests. Wetlands, 31(2), 343-352. http: //dx .doi.
org/10.1007/s13157-011-0148-9
Lang'at, J. K. S. (2013). Impacts of tree harvesting on the carbon balance and functioning in
mangrove forests. Edinburgh Napier University.
Lewis, S. L., Lopez-Gonzalez, G., Sonké, B., Affum-Baffoe, K., Baker, T. R., Ojo, L. O.,
Philips, O. L., Reitsma, J. L., White, L., Comiskey, J. A. (2009). Increasing carbon
storage in intact African tropical forests. Nature, 457 (7232), 1003-1006.
Luyssaert, S., Inglima, I., Jung, M., Richardson, A., Reichstein, M., Papale, D., Piao, S. L.,
Schulze, E. D., Wingate, L., Matteucci, G. (2007). CO2 balance of boreal, temperate, and
tropical forests derived from a global database. Global change biology, 13(12), 2509-
2537. http://dx.doi.org/10.1111/j.1365-2486.2007.01439.x
Mitra, A., Sengupta, K., & Banerjee, K. (2011). Standing biomass and carbon storage of above-
ground structures in dominant mangrove trees in the Sundarbans. Forest Ecology and
Management, 261(7), 1325-1335. http://dx.doi.org/10.1016/j.foreco.2011.01.012

7/26/2019 Ashokri_H.A
http://slidepdf.com/reader/full/ashokriha 19/19
MATTER: International Journal of Science and Technology
ISSN 2454-5880
© 2015 The author and GRDS Publishing. All rights reserved.Available Online at: http://grdspublishing.org/MATTER/matter.html
258
Orihuela, B., Tovilla, H., & Franciscus, M. y Alvarez, L. (2004). Matter flux in a mangrove
system in the coast of Chiapas, Mexico. Madera y Bosques, 2, 45-61.
Rodrigues, D. P., Hamacher, C., Estrada, G. C. D., & Soares, M. L. G. (2015). Variability of
carbon content in mangrove species: Effect of species, compartments and tidal frequency.
Aquatic Botany, 120, 346-351. http://dx.doi.org/10.1016/j.aquabot.2014.10.004
Santilli, M., Moutinho, P., Schwartzman, S., Nepstad, D., Curran, L., & Nobre, C. (2005).
Tropical deforestation and the Kyoto Protocol. Climatic Change, 71(3), 267-276.
http://dx.doi.org/10.1007/s10584-005-8074-6
Saraswathy, R., Rozainah, M., & Redzwan, G. (2009). Diversity and biomass estimation of
mangrove trees on carey Island, Malaysia. Ecology, Environment and Conservation,
15(2), 205-211.Schlesinger, W. H., & Andrews, J. A. (2000). Soil respiration and the global carbon cycle.
Biogeochemistry, 48(1), 7-20. http://dx.doi.org/10.1023/A:1006247623877
Sitoe, A. A., Mandlate, L. J. C., & Guedes, B. S. (2014). Biomass and carbon stocks of Sofala
Bay mangrove forests. Forests, 5(8), 1967-1981. http://dx.doi.org/10.3390/f5081967
Tavoni, M., Sohngen, B., & Bosetti, V. (2007). Forestry and the carbon market response to
stabilize climate. Energy Policy, 35(11), 5346-5353. http://dx.doi.org/10 .1016/j.en pol.2
006.01.036
Ullman, R., Bilbao-Bastida, V., & Grimsditch, G. (2013). Including blue carbon in climate
market mechanisms. Ocean & Coastal Management, 83, 15-18. http://dx.doi.org/ 10.
1016/j.ocecoaman.2012.02.009
Van der Werf, G. R., Morton, D. C., DeFries, R. S., Olivier, J. G., Kasibhatla, P. S., Jackson, R.
B., Collatz, G. J., Randerson, J. (2009). CO2 emissions from forest loss. Nature
geoscience, 2(11), 737-738. http://dx.doi.org/10.1038/ngeo671
Wang, G., Guan, D., Peart, M., Chen, Y., & Peng, Y. (2013). Ecosystem carbon stocks of
mangrove forest in Yingluo Bay, Guangdong Province of South China. Forest Ecology
and Management, 310, 539-546. http://dx.doi.org/10.1016/j.foreco.2013.08.045
Wilson, N. (2010). Biomass and Regeneration of Mangrove Vegetation in Kien Giang Province,
Vietnam. Report to GTZ , 53.


