Embed Size (px)
Citation preview

2J00533 Community Satisfaction Survey 2017 - Southern Grampians Shire Council
Background and objectives
Survey methodology and sampling
Further information
Key findings & recommendations
Summary of findings
Detailed findings
• Key core measure: Overall performance
• Key core measure: Customer service
• Key core measure: Council direction indicators
• Positives and areas for improvement
• Communications
• Individual service areas
• Detailed demographics
Appendix A: Detailed survey tabulations
Appendix B: Further project information
3J00533 Community Satisfaction Survey 2017 - Southern Grampians Shire Council
Welcome to the report of results and recommendations for the 2017 State-wide Local Government
Community Satisfaction Survey for Southern Grampians Shire Council.
Each year Local Government Victoria (LGV) coordinates and auspices this State-wide Local
Government Community Satisfaction Survey throughout Victorian local government areas. This
coordinated approach allows for far more cost effective surveying than would be possible if councils
commissioned surveys individually.
Participation in the State-wide Local Government Community Satisfaction Survey is optional.
Participating councils have various choices as to the content of the questionnaire and the sample size
to be surveyed, depending on their individual strategic, financial and other considerations.
The main objectives of the survey are to assess the performance of Southern Grampians Shire Council
across a range of measures and to seek insight into ways to provide improved or more effective service
delivery. The survey also provides councils with a means to fulfil some of their statutory reporting
requirements as well as acting as a feedback mechanism to LGV.
4J00533 Community Satisfaction Survey 2017 - Southern Grampians Shire Council
This survey was conducted by Computer Assisted Telephone Interviewing (CATI) as a representative
random probability survey of residents aged 18+ years in Southern Grampians Shire Council.
Survey sample matched to the demographic profile of Southern Grampians Shire Council as
determined by the most recent ABS population estimates was purchased from an accredited supplier
of publicly available phone records, including up to 10% mobile phone numbers to cater to the
diversity of residents within Southern Grampians Shire Council, particularly younger people.
A total of n=400 completed interviews were achieved in Southern Grampians Shire Council. Survey
fieldwork was conducted in the period of 1st February – 30th March, 2017.
The 2017 results are compared with previous years, as detailed below:
Minimum quotas of gender within age groups were applied during the fieldwork phase. Post-survey
weighting was then conducted to ensure accurate representation of the age and gender profile of the
Southern Grampians Shire Council area.
Any variation of +/-1% between individual results and net scores in this report or the detailed survey
tabulations is due to rounding. In reporting, ‘—’ denotes not mentioned and ‘0%’ denotes mentioned by
less than 1% of respondents. ‘Net’ scores refer to two or more response categories being combined
into one category for simplicity of reporting.
• 2016, n=400 completed interviews, conducted in the period of 1st February – 30th March.
• 2015, n=400 completed interviews, conducted in the period of 1st February – 30th March.
• 2014, n=400 completed interviews, conducted in the period of 31st January – 11th March.
• 2013, n=400 completed interviews, conducted in the period of 1st February – 24th March.
• 2012, n=401 completed interviews, conducted in the period of 18th May – 30th June.

5J00533 Community Satisfaction Survey 2017 - Southern Grampians Shire Council
Within tables and index score charts throughout this report, statistically significant differences at the
95% confidence level are represented by upward directing blue and downward directing red arrows.
Significance when noted indicates a significantly higher or lower result for the analysis group in
comparison to the ‘Total’ result for the council for that survey question for that year. Therefore in the
example below:
• The state-wide result is significantly higher than the overall result for the council.
• The result among 50-64 year olds is significantly lower than for the overall result for the council.
Further, results shown in blue and red indicate significantly higher or lower results than in 2016.
Therefore in the example below:
• The result among 35-49 year olds in the council is significantly higher than the result achieved
among this group in 2016.
• The result among 18-34 year olds in the council is significantly lower than the result achieved
among this group in 2016.
54
57
58
60
67
66
50-64
35-49
Large Rural
Southern Grampians
18-34
State-wide
Overall Performance – Index Scores (example extract only)
Note: Details on the calculations used to determine statistically significant differences
may be found in Appendix B.
6J00533 Community Satisfaction Survey 2017 - Southern Grampians Shire Council
Further information about the report and explanations about the State-wide Local Government
Community Satisfaction Survey can be found in Appendix B, including:
Background and objectives
Margins of error
Analysis and reporting
Glossary of terms
Contacts
For further queries about the conduct and reporting of the 2017 State-wide Local Government
Community Satisfaction Survey, please contact JWS Research on (03) 8685 8555.
8J00533 Community Satisfaction Survey 2017 - Southern Grampians Shire Council
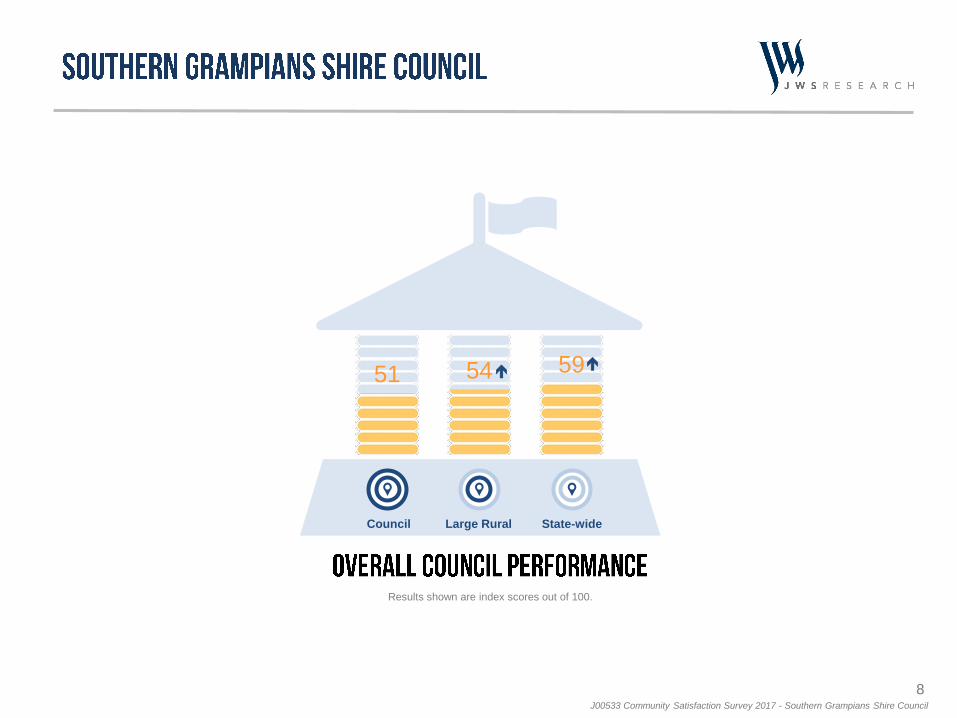
Council Large Rural State-wide
51 54 59
Results shown are index scores out of 100.
9J00533 Community Satisfaction Survey 2017 - Southern Grampians Shire Council
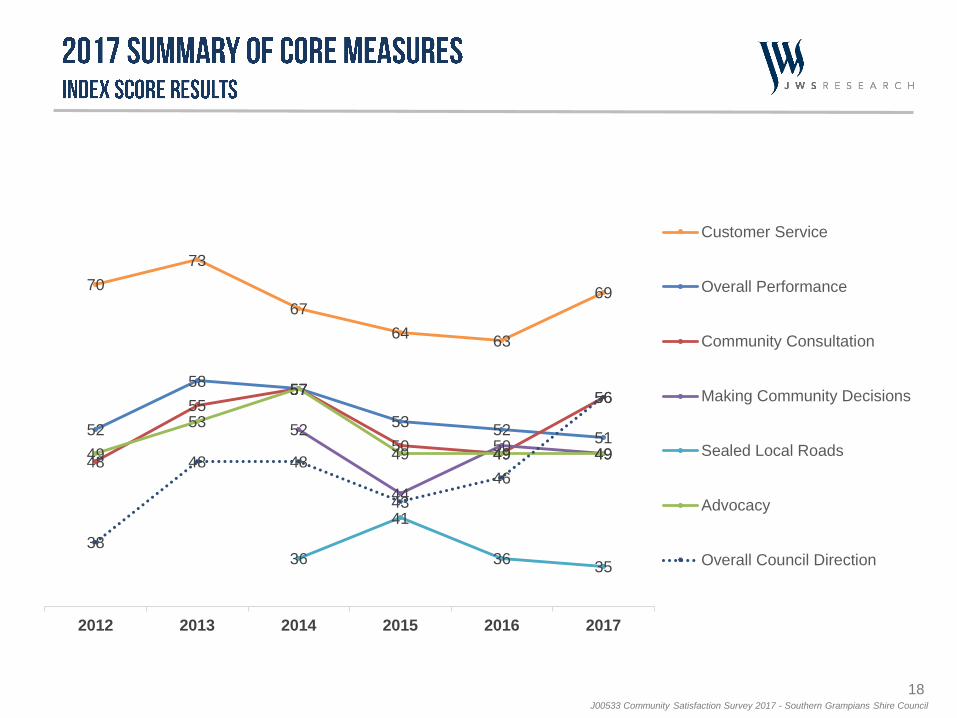
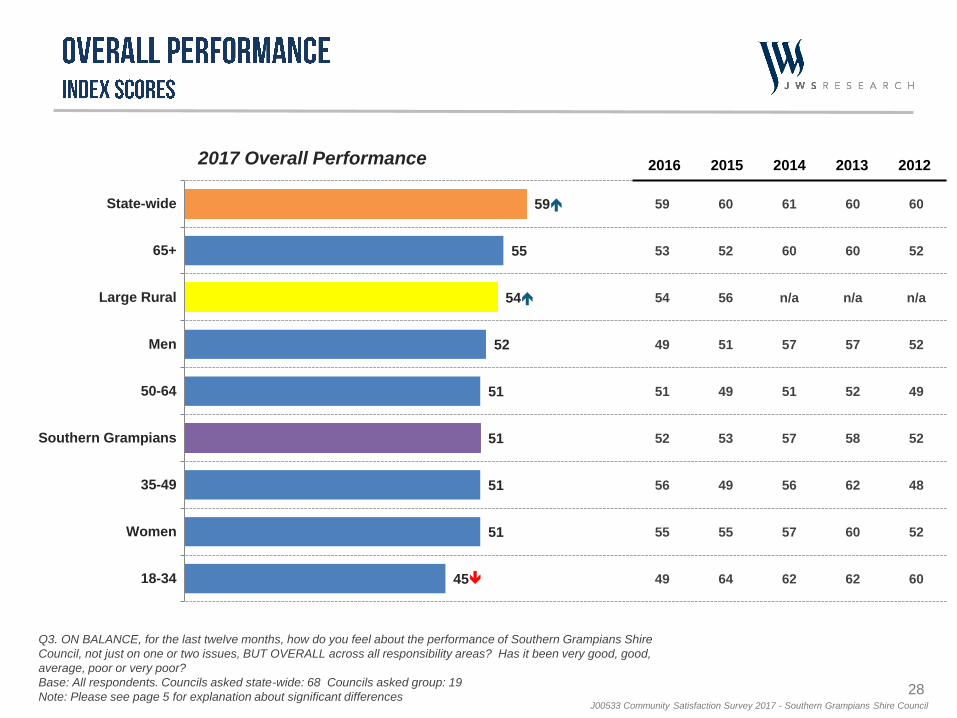
The overall performance index score of 51 for Southern Grampians Shire Council represents a one
point decline on the 2016 result. After a significant gain in overall performance in 2013 (index score of
58, a six point increase from 2012), Council’s overall performance rating has been trending
downwards since.
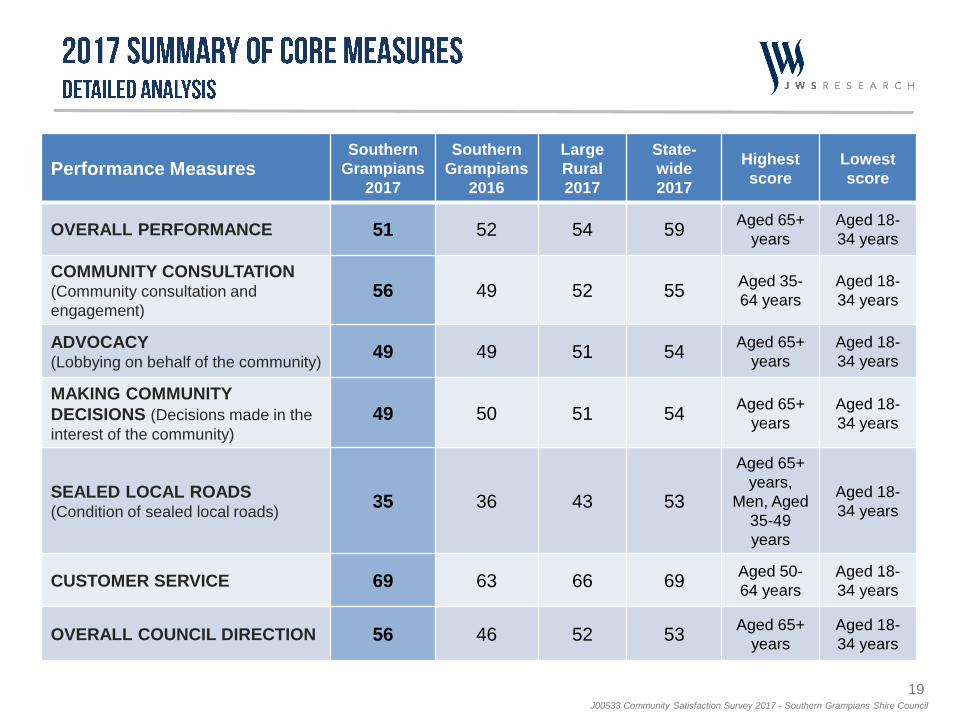
Southern Grampians Shire Council’s overall performance is rated statistically significantly lower
(at the 95% confidence interval) than the average rating for councils State-wide and in the
Large Rural group (index scores of 59 and 54 respectively).
Residents aged 18 to 34 years (index score of 45) are significantly less favourable in their
view of Council’s overall performance.
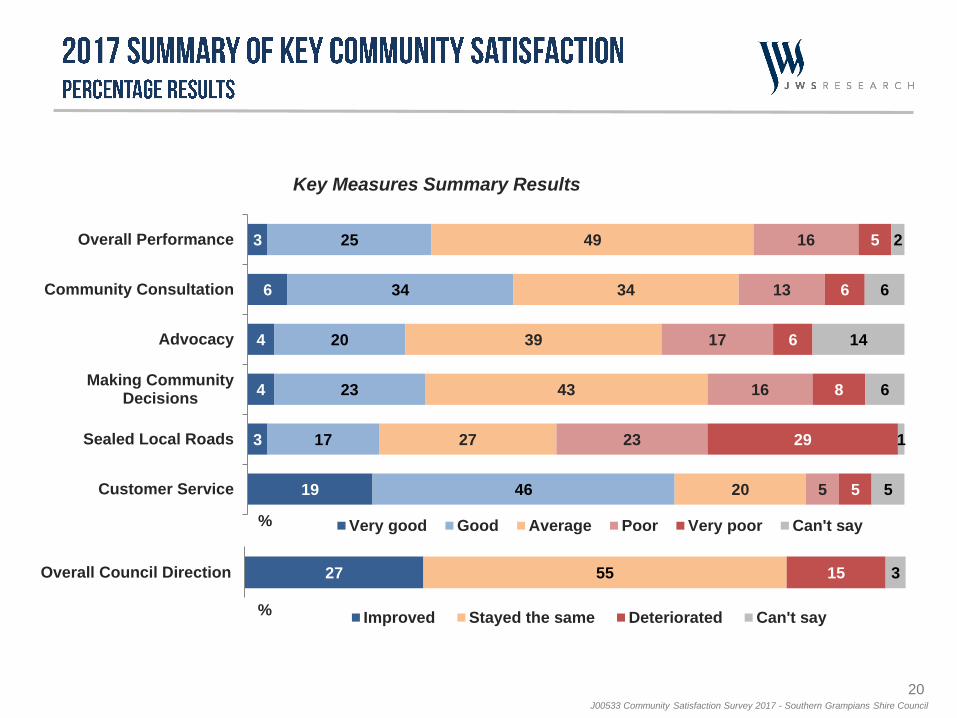
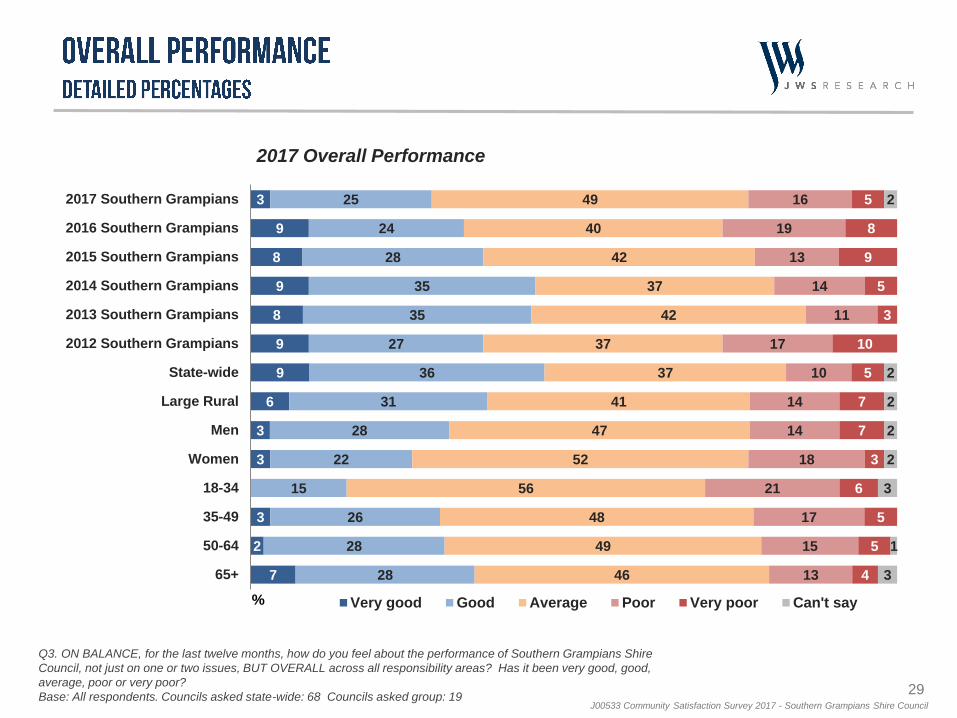
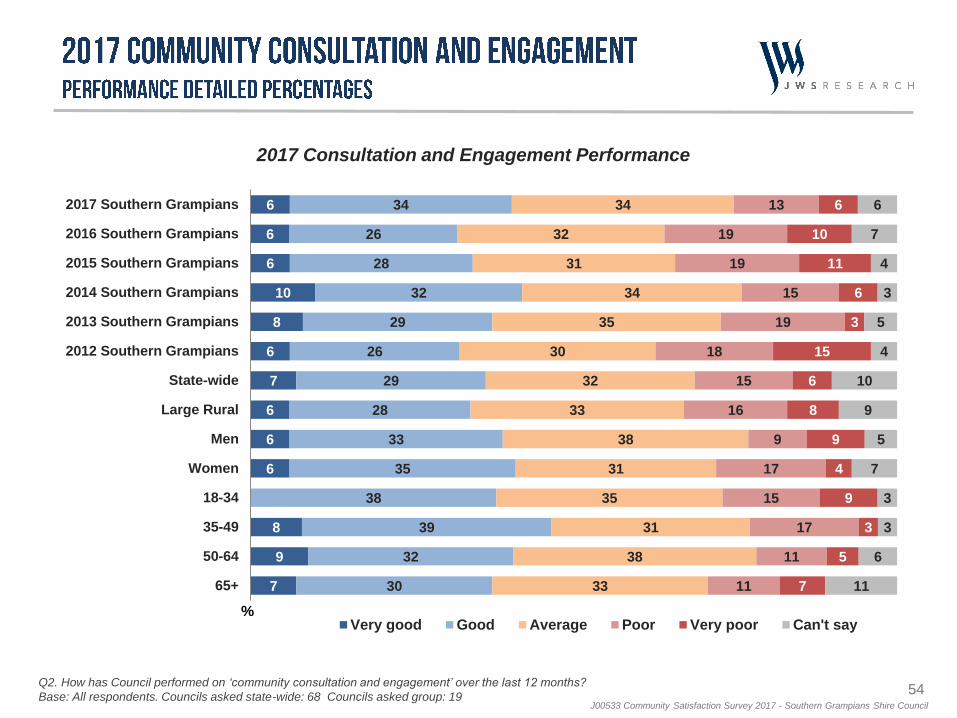
Most residents (49%) have ‘average’ impressions of Council’s overall performance, while more rate
Council’s overall performance as ‘very good’ or ‘good’ (28%) as they do ‘very poor’ or ‘poor’ (21%).
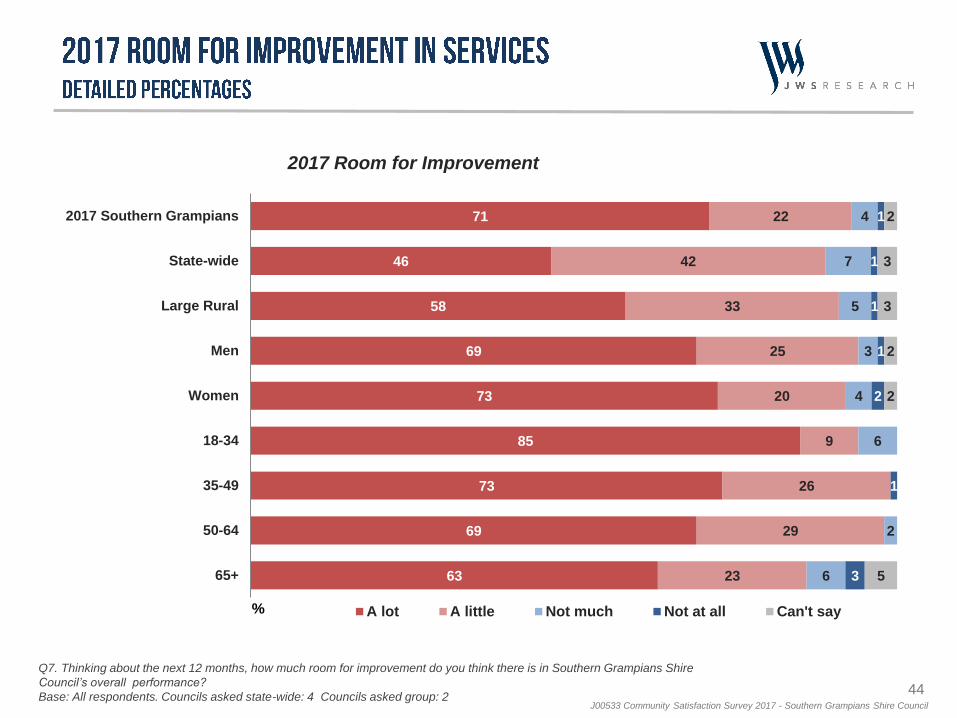
Notwithstanding this, almost all residents (93%) believe there is room for improvement in Council
performance, including 71% who believe there is ‘a lot’ of room for improvement.
10J00533 Community Satisfaction Survey 2017 - Southern Grampians Shire Council
Review of the core performance measures (as shown on page 19) shows that Southern Grampians
Shire Council’s performance was either stable or improved compared to Council’s own results in
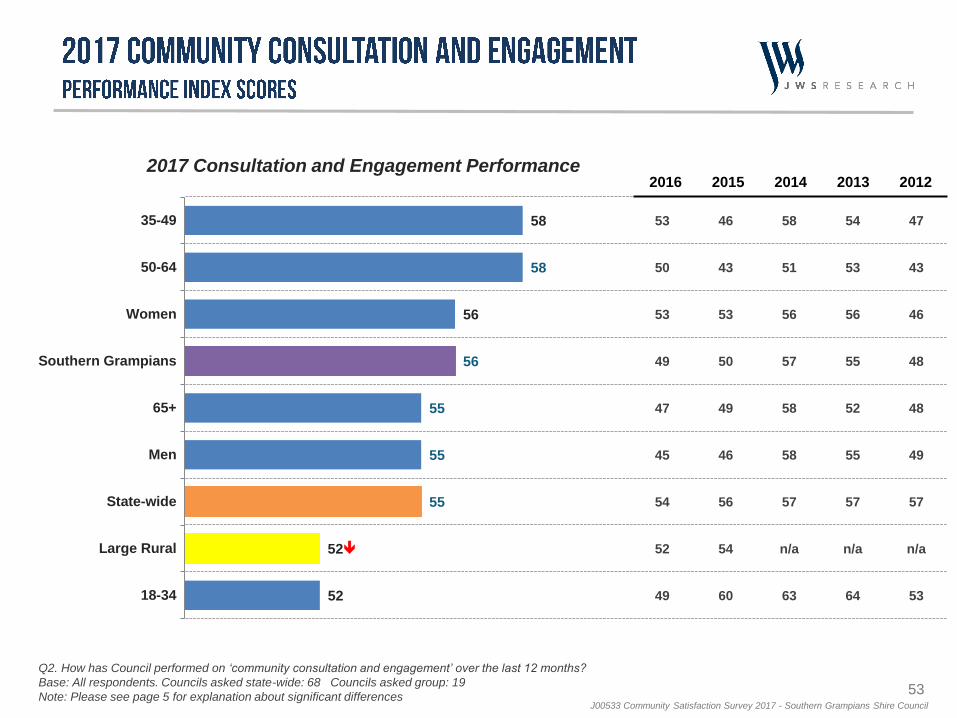
2016. Council’s ratings improved significantly in the areas of consultation and engagement (index
score of 56, seven points higher than 2016), customer service (index score of 69, six points higher
than 2016), and overall council direction (index score of 56, 10 points higher than 2016).
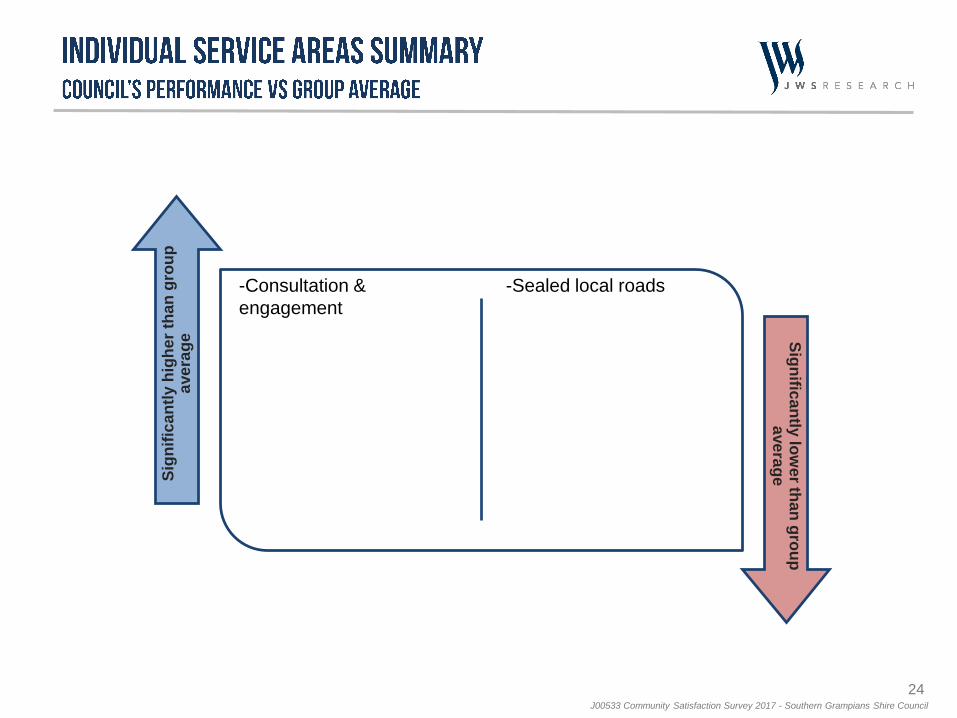
Council rates significantly higher than Large Rural group averages on the measures of
consultation and engagement and overall council direction, but significantly lower than the group
average in the area of sealed local roads.
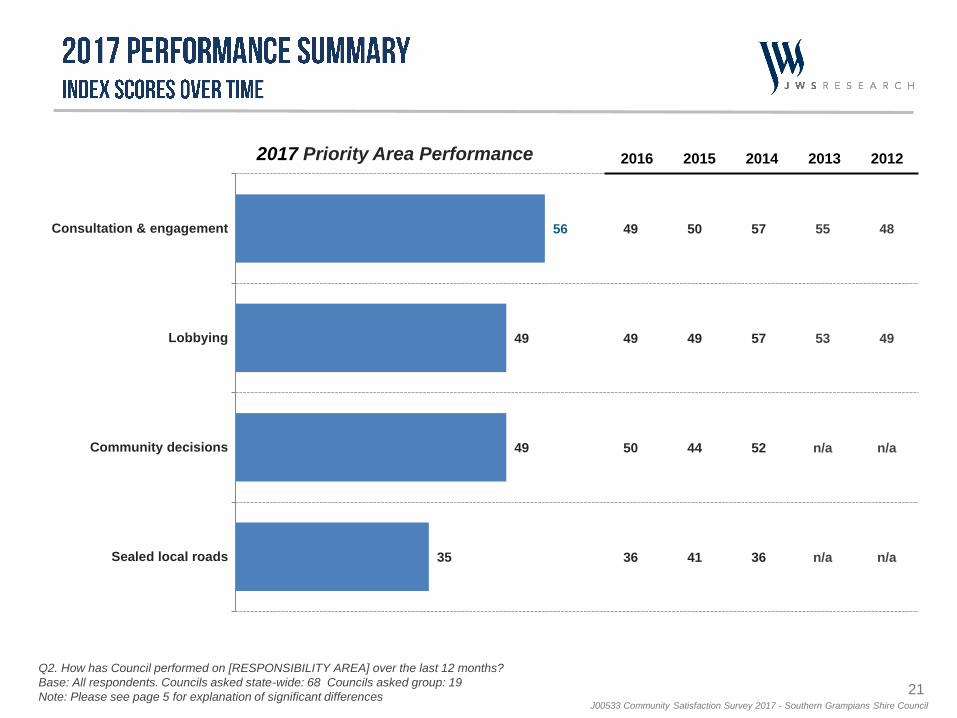
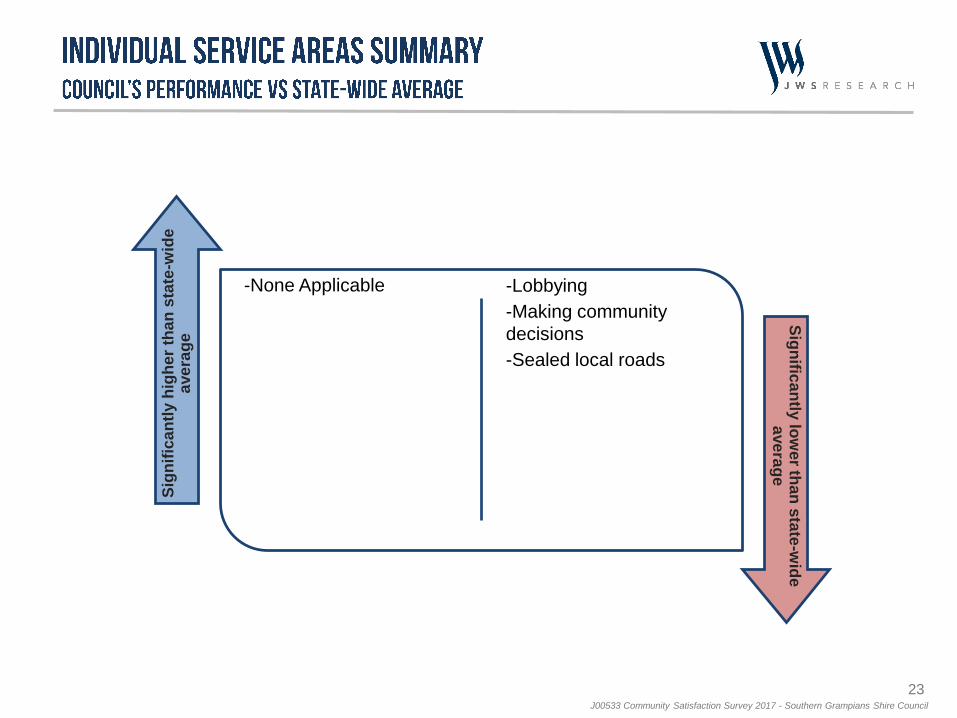
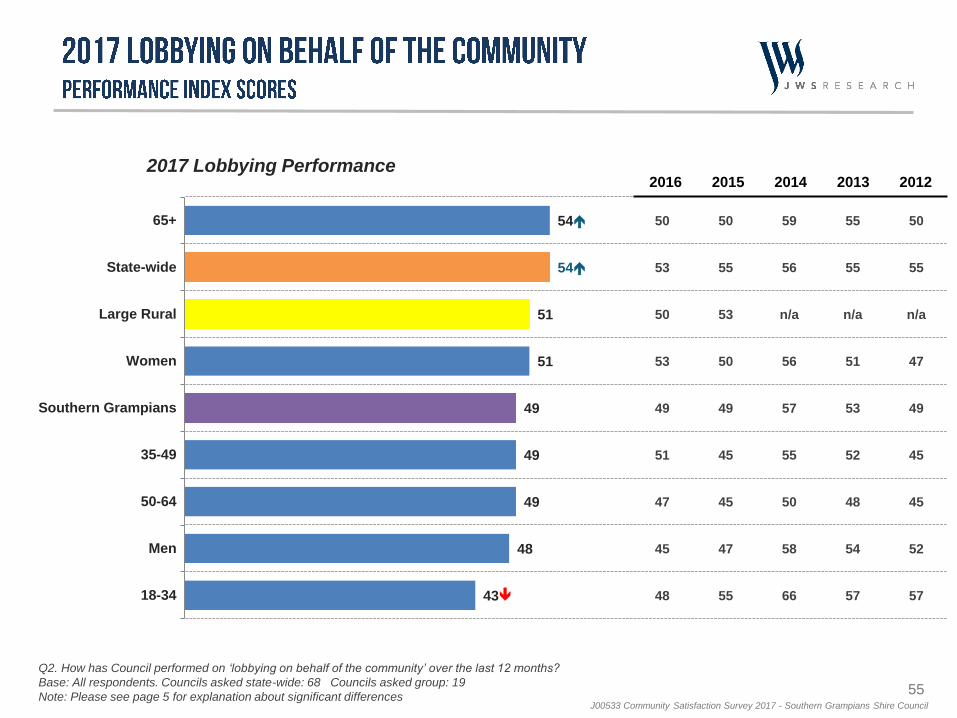
Council’s performance in the areas of lobbying, making community decisions and sealed
local roads rates significantly lower than the State-wide average for all councils.
Overall council direction (index score of 56) ratings are at their highest level, having increased by
18 index points since 2012. Almost every demographic group increased significantly in their
impression of council direction in the past year.
Residents aged 65+ years (index score of 63) have the most positive impressions of council
direction, rating council direction significantly higher than residents overall.
Residents are almost twice as likely to believe Council’s performance has improved in the past
twelve months (27%) than they were just one year ago (15% in 2016).
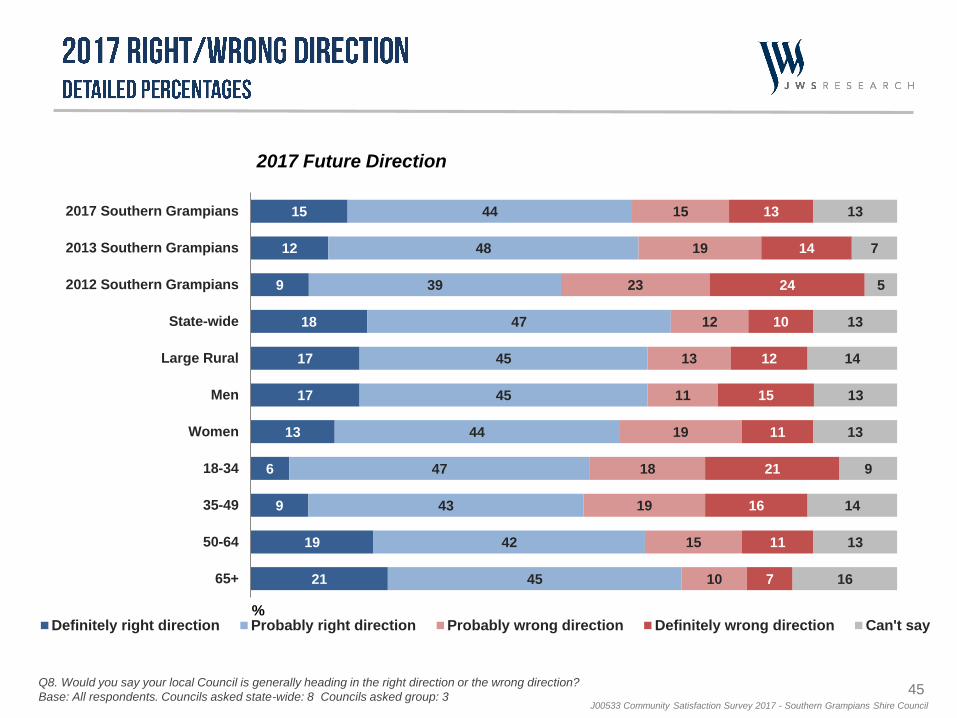
In addition, three in five (59%) believe Council is ‘definitely’ or ‘probably’ heading in the right
direction. Conversely, 28% believe Council is headed in the wrong direction and another 13%
‘can’t say’.
11J00533 Community Satisfaction Survey 2017 - Southern Grampians Shire Council
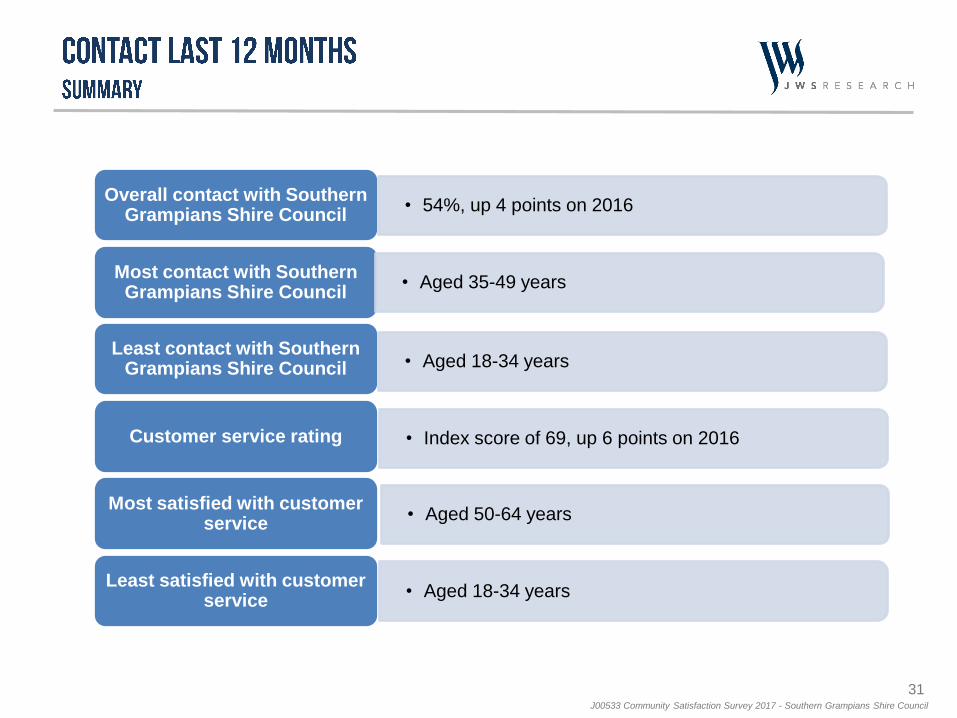
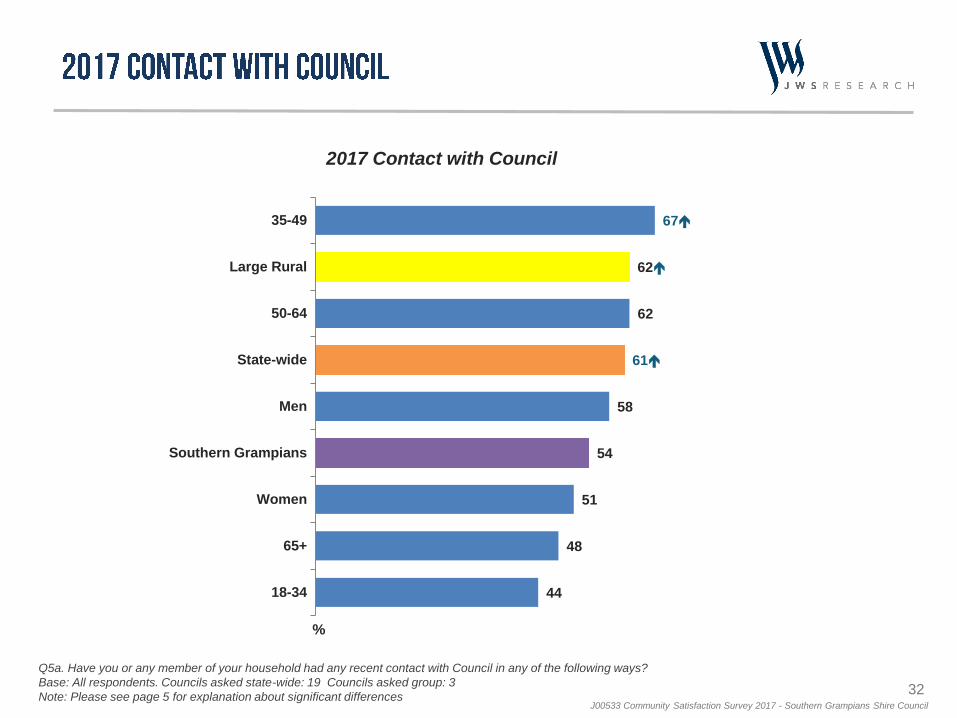
More than half (54%) of Southern Grampians Shire Council residents have had recent contact
with Council. Residents aged 35 to 49 years are significantly more likely to have contacted Council
(67%).
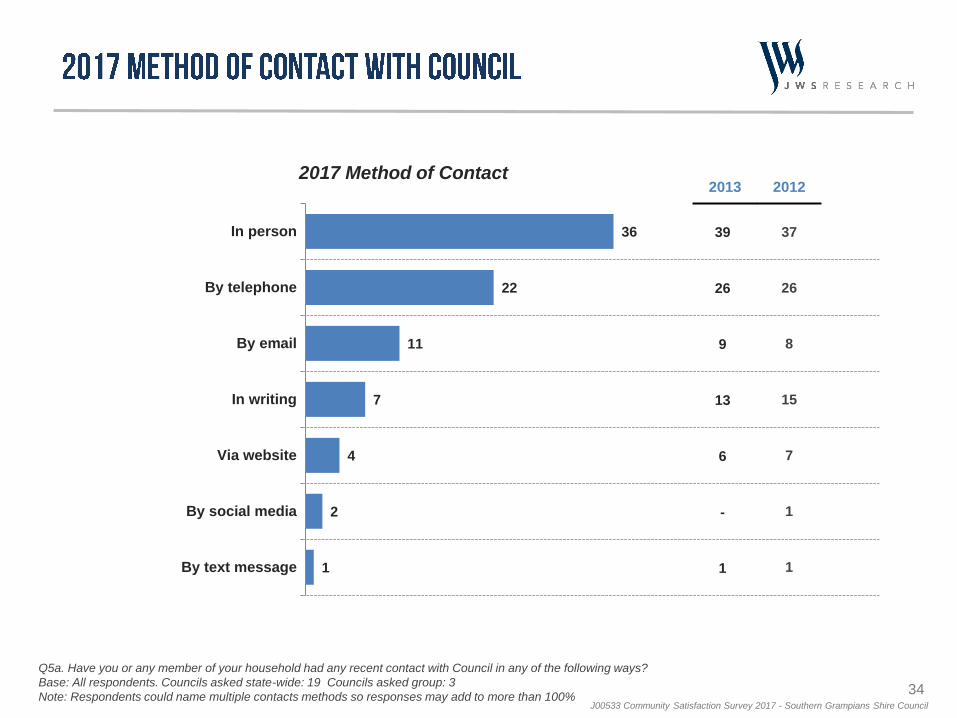
The main method of contacting Council is in person or by telephone (36% and 22%
respectively).
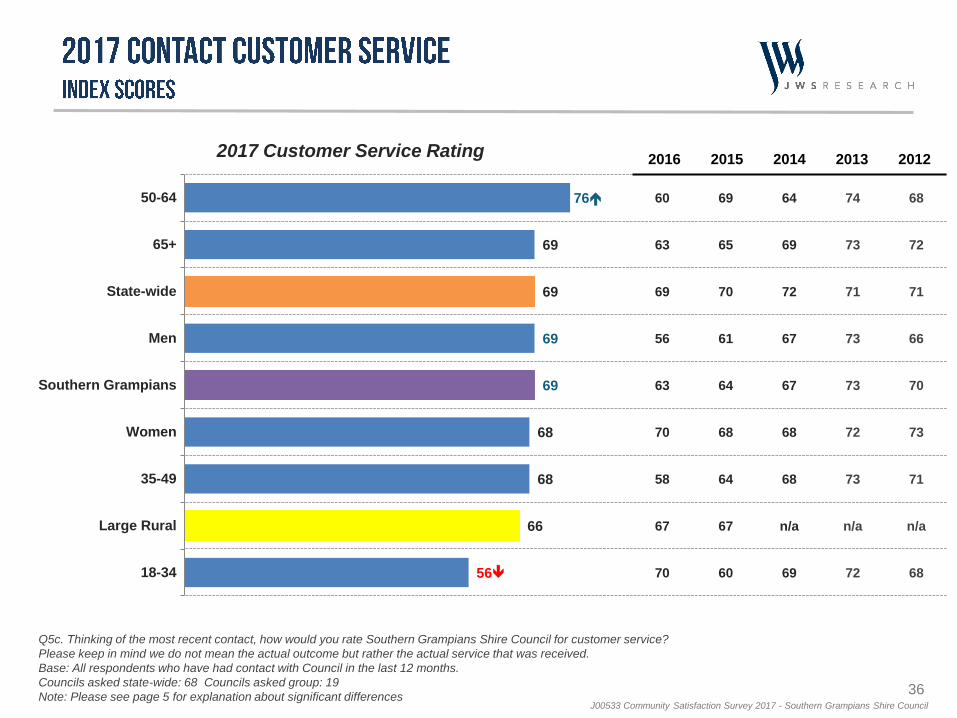
In the area of customer service (index score of 69), Southern Grampians Shire Council is similar to
the State-wide council and Large Rural group averages (index scores of 69 and 66 respectively).
This is Council’s strongest area of performance. Again, Council improved significantly – by six index
points – on this measure since 2016, bringing ratings back in line with pre-2014 results.
Two-thirds (65%) of residents rate Council’s Customer Service as ‘very good’ or ‘good’.
Residents aged 50 to 64 years (index score of 76) have significantly more favourable
impressions of customer service interactions than residents overall, while residents aged 18 to
34 years (56) have significantly less favourable impressions, as well as declining significantly
(by 14 points) in the past year.
Newsletters, sent via mail (29%) or email (22%) or as inserts into a local newspaper (22%), are the
preferred way for Council to inform residents about news, information and upcoming events.
Preferences differ according to age, with residents aged under 50 years twice as likely as their
older counterparts to prefer to receive a newsletter via email (30% and 15% respectively), while
residents aged 50+ years are more likely than younger residents to prefer the newsletter as an
insert in a local newspaper (26% and 17% respectively).
12J00533 Community Satisfaction Survey 2017 - Southern Grampians Shire Council
The area that stands out as being most in need of Council attention is sealed local roads. With a
performance index score of 35, this is the service area where Council is performing least well and is
significantly lower than the State-wide and Large Rural group averages (performance index scores of 53
and 43 respectively).
Three in ten residents (29%) rate Council performance in this service area as ‘very poor’. Another
23% rate it as ‘poor’.
Ratings for sealed local roads are consistent across demographic sub-groups, with no significant
differences evident compared to Council’s average rating.
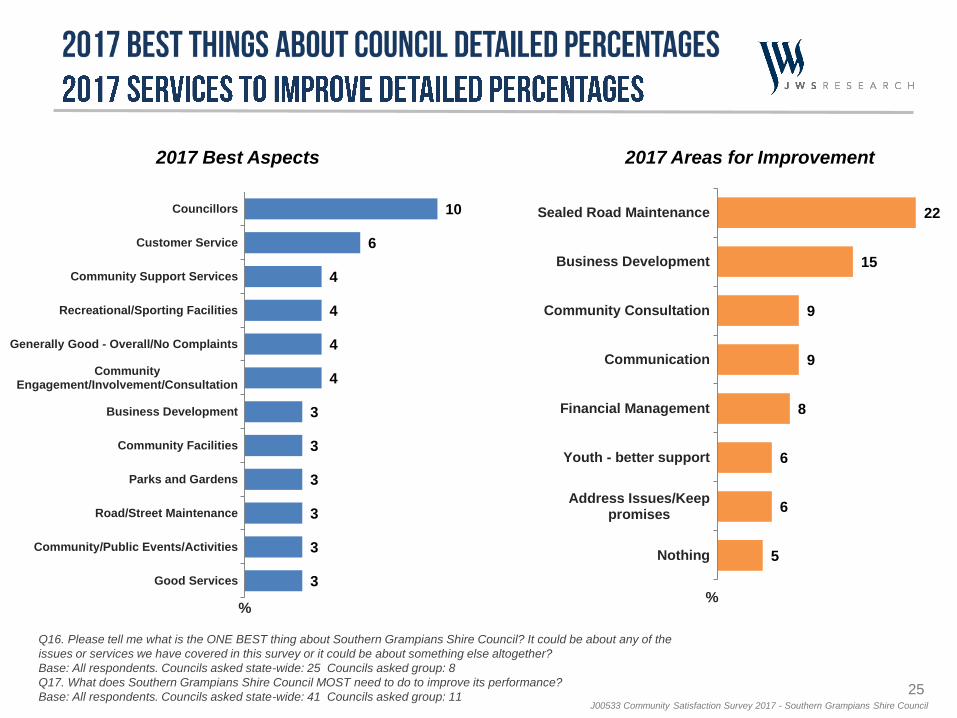
Feedback from residents on what they consider Council most needs to do to improve its
performance in the next 12 months supports this finding, with sealed road maintenance mentioned
by 22% of residents.
Despite significant ratings gains on several measures and increasing optimism among residents, ratings
for sealed local roads (index score of 35), lobbying and community decisions (index scores of 49
each) have remained stagnant. These are also council’s lowest performing areas.
Council should focus on these areas moving forward if it is to return to previously achieved highs on
these measures.
13J00533 Community Satisfaction Survey 2017 - Southern Grampians Shire Council
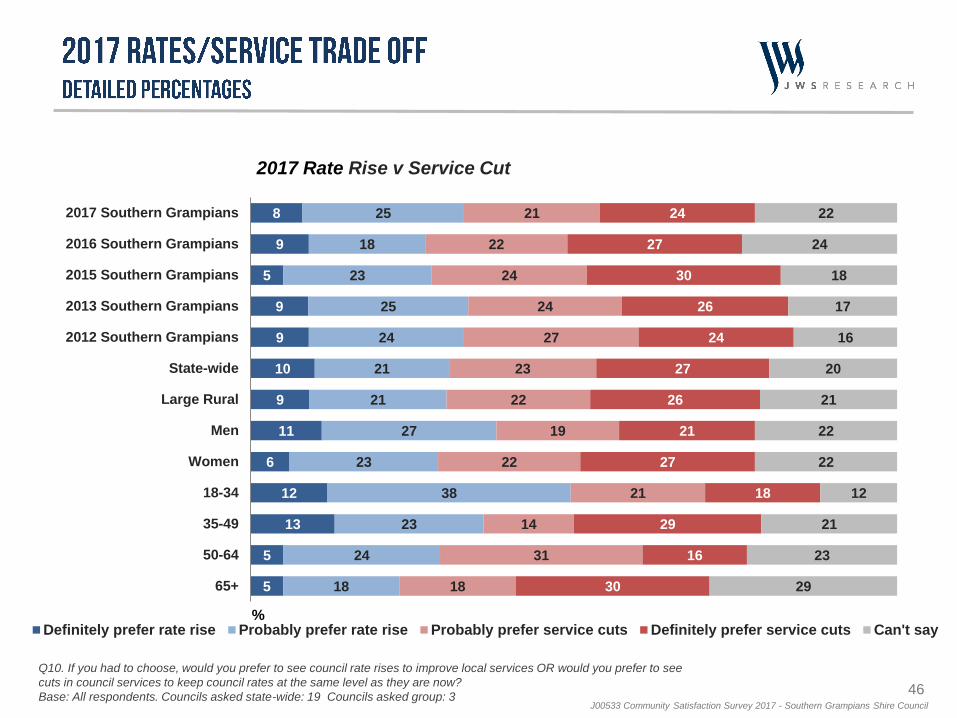
When it comes to the trade-off between a rise in rates and cuts to services, more Southern Grampians
Shire Council residents (45%) indicate they would prefer cuts in Council services to keep Council
rates at the same level as they are now compared to rates rises to improve local services
(33%).
Those ‘definitely’ preferring service cuts (24%) far outweighs those who ‘definitely’ prefer rate
rises (8%).
Just over one in 10 residents (13%) are unable to choose.
The preference for rates rises has been consistent over time, aside from a decline in 2016, where
fewer residents preferred rates rises (27%) but the current result is a return to the 2012 level
(33%).
The preference for service cuts over rate increases is consistent across all demographic sub-
groups with the exception of residents aged 18 to 34 years, who would prefer to see rates rise
(50%) over cuts in Council services (39%).
14J00533 Community Satisfaction Survey 2017 - Southern Grampians Shire Council
For the coming 12 months, Southern Grampians Shire Council should focus on service areas where
performance is lowest. Key priorities, as discussed previously, include sealed local roads, lobbying
and making community decisions.
Consideration should also be given to Southern Grampians Shire Council residents aged 18 to 34
years, who appear to be most driving negative opinion in 2017.
On the positive side, Council should aim to maintain its gains and relatively strong performance in
the areas of customer service and community consultation and engagement.
It is also important not to ignore, and to learn from, what is working amongst other groups,
especially residents aged 65+ years, and use these lessons to build performance experience and
perceptions in other areas.
15J00533 Community Satisfaction Survey 2017 - Southern Grampians Shire Council
An approach we recommend is to further mine the survey data to better understand the profile of these
over and under-performing demographic groups. This can be achieved via additional consultation and
data interrogation, self-mining the SPSS data provided, or via the dashboard portal available to the
council.
Please note that the category descriptions for the coded open ended responses are generic
summaries only. We recommend further analysis of the detailed cross tabulations and the actual
verbatim responses, with a view to understanding the responses of the key gender and age groups,
especially any target groups identified as requiring attention.
A personal briefing by senior JWS Research representatives is also available to assist in
providing both explanation and interpretation of the results. Please contact JWS Research on
03 8685 8555.
16J00533 Community Satisfaction Survey 2017 - Southern Grampians Shire Council
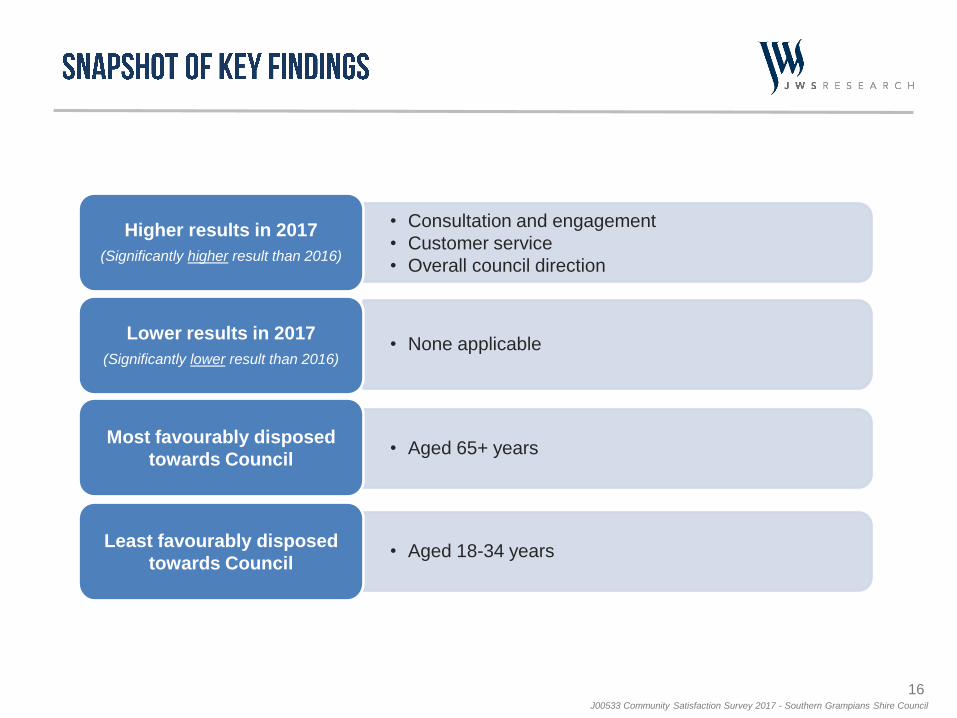
• Consultation and engagement
• Customer service
• Overall council direction
Higher results in 2017
(Significantly higher result than 2016)
• None applicableLower results in 2017
(Significantly lower result than 2016)
• Aged 65+ yearsMost favourably disposed
towards Council
• Aged 18-34 yearsLeast favourably disposed
towards Council
18J00533 Community Satisfaction Survey 2017 - Southern Grampians Shire Council
70
73
67
6463
69
52
5857
5352
51
48
5557
5049
56
52
44
5049
36
41
3635
49
53
57
49 49 49
38
48 48
43
46
56
2012 2013 2014 2015 2016 2017
Customer Service
Overall Performance
Community Consultation
Making Community Decisions
Sealed Local Roads
Advocacy
Overall Council Direction
19J00533 Community Satisfaction Survey 2017 - Southern Grampians Shire Council
Performance MeasuresSouthern
Grampians
2017
Southern
Grampians
2016
Large
Rural
2017
State-
wide
2017
Highest
score
Lowest
score
OVERALL PERFORMANCE 51 52 54 59Aged 65+
years
Aged 18-
34 years
COMMUNITY CONSULTATION(Community consultation and
engagement)
56 49 52 55Aged 35-
64 years
Aged 18-
34 years
ADVOCACY(Lobbying on behalf of the community)
49 49 51 54Aged 65+
years
Aged 18-
34 years
MAKING COMMUNITY
DECISIONS (Decisions made in the
interest of the community)
49 50 51 54Aged 65+
years
Aged 18-
34 years
SEALED LOCAL ROADS (Condition of sealed local roads)
35 36 43 53
Aged 65+
years,
Men, Aged
35-49
years
Aged 18-
34 years
CUSTOMER SERVICE 69 63 66 69Aged 50-
64 years
Aged 18-
34 years
OVERALL COUNCIL DIRECTION 56 46 52 53Aged 65+
years
Aged 18-
34 years
20J00533 Community Satisfaction Survey 2017 - Southern Grampians Shire Council
3
6
4
4
3
19
25
34
20
23
17
46
49
34
39
43
27
20
16
13
17
16
23
5
5
6
6
8
29
5
2
6
14
6
1
5
Overall Performance
Community Consultation
Advocacy
Making CommunityDecisions
Sealed Local Roads
Customer Service
% Very good Good Average Poor Very poor Can't say
Key Measures Summary Results
27 55 15 3Overall Council Direction
%Improved Stayed the same Deteriorated Can't say
21J00533 Community Satisfaction Survey 2017 - Southern Grampians Shire Council
49
49
50
36
50
49
44
41
57
57
52
36
55
53
n/a
n/a
48
49
n/a
n/a
56
49
49
35
Consultation & engagement
Lobbying
Community decisions
Sealed local roads
2017 Priority Area Performance 2016 2015 2014 2013 2012
Q2. How has Council performed on [RESPONSIBILITY AREA] over the last 12 months?
Base: All respondents. Councils asked state-wide: 68 Councils asked group: 19
Note: Please see page 5 for explanation of significant differences
22J00533 Community Satisfaction Survey 2017 - Southern Grampians Shire Council
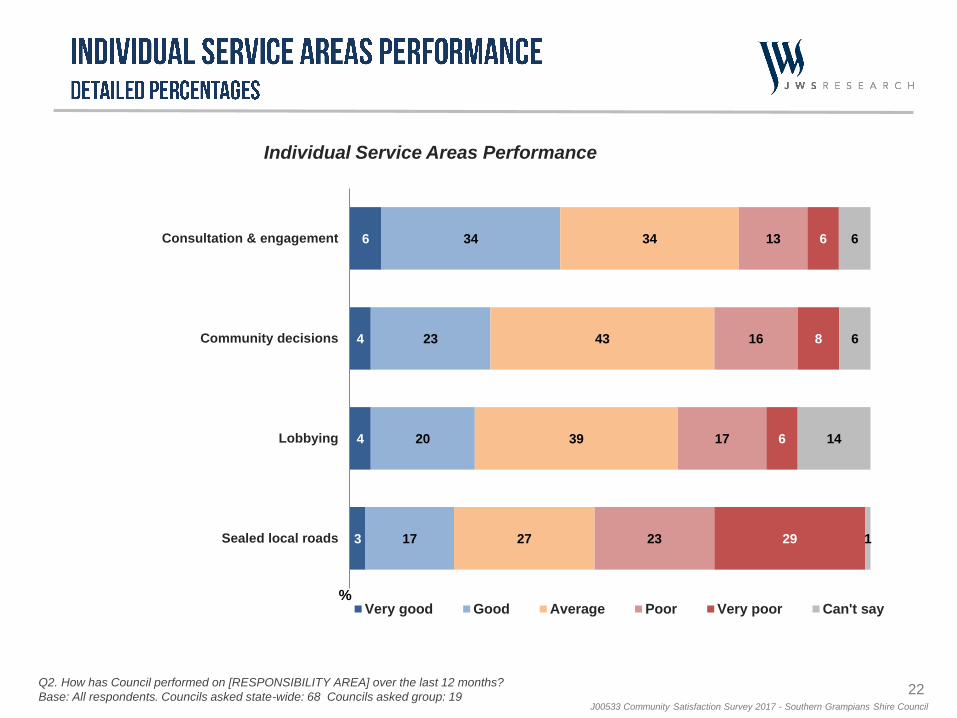
Individual Service Areas Performance
6
4
4
3
34
23
20
17
34
43
39
27
13
16
17
23
6
8
6
29
6
6
14
1
Consultation & engagement
Community decisions
Lobbying
Sealed local roads
%Very good Good Average Poor Very poor Can't say
Q2. How has Council performed on [RESPONSIBILITY AREA] over the last 12 months?
Base: All respondents. Councils asked state-wide: 68 Councils asked group: 19
23J00533 Community Satisfaction Survey 2017 - Southern Grampians Shire Council
Sig
nif
ica
ntl
y h
igh
er
tha
n s
tate
-wid
e
ave
rag
e
Sig
nific
an
tly lo
we
r tha
n s
tate
-wid
e
ave
rag
e
-None Applicable -Lobbying
-Making community
decisions
-Sealed local roads
24J00533 Community Satisfaction Survey 2017 - Southern Grampians Shire Council
Sig
nif
ica
ntl
y h
igh
er
tha
n g
rou
p
ave
rag
e Sig
nific
an
tly lo
we
r tha
n g
rou
p
ave
rag
e
-Consultation &
engagement
-Sealed local roads
25J00533 Community Satisfaction Survey 2017 - Southern Grampians Shire Council
22
15
9
9
8
6
6
5
Sealed Road Maintenance
Business Development
Community Consultation
Communication
Financial Management
Youth - better support
Address Issues/Keeppromises
Nothing
10
6
4
4
4
4
3
3
3
3
3
3
Councillors
Customer Service
Community Support Services
Recreational/Sporting Facilities
Generally Good - Overall/No Complaints
CommunityEngagement/Involvement/Consultation
Business Development
Community Facilities
Parks and Gardens
Road/Street Maintenance
Community/Public Events/Activities
Good Services
2017 Best Aspects 2017 Areas for Improvement
%%
Q16. Please tell me what is the ONE BEST thing about Southern Grampians Shire Council? It could be about any of the
issues or services we have covered in this survey or it could be about something else altogether?
Base: All respondents. Councils asked state-wide: 25 Councils asked group: 8
Q17. What does Southern Grampians Shire Council MOST need to do to improve its performance?
Base: All respondents. Councils asked state-wide: 41 Councils asked group: 11
28J00533 Community Satisfaction Survey 2017 - Southern Grampians Shire Council
59
55
54
52
51
51
51
51
45
State-wide
65+
Large Rural
Men
50-64
Southern Grampians
35-49
Women
18-34
59
53
54
49
51
52
56
55
49
60
52
56
51
49
53
49
55
64
61
60
n/a
57
51
57
56
57
62
60
60
n/a
57
52
58
62
60
62
60
52
n/a
52
49
52
48
52
60
2017 Overall Performance 2016 2015 2014 2013 2012
Q3. ON BALANCE, for the last twelve months, how do you feel about the performance of Southern Grampians Shire
Council, not just on one or two issues, BUT OVERALL across all responsibility areas? Has it been very good, good,
average, poor or very poor?
Base: All respondents. Councils asked state-wide: 68 Councils asked group: 19
Note: Please see page 5 for explanation about significant differences
29J00533 Community Satisfaction Survey 2017 - Southern Grampians Shire Council
2017 Overall Performance
3
9
8
9
8
9
9
6
3
3
3
2
7
25
24
28
35
35
27
36
31
28
22
15
26
28
28
49
40
42
37
42
37
37
41
47
52
56
48
49
46
16
19
13
14
11
17
10
14
14
18
21
17
15
13
5
8
9
5
3
10
5
7
7
3
6
5
5
4
2
2
2
2
2
3
1
3
2017 Southern Grampians
2016 Southern Grampians
2015 Southern Grampians
2014 Southern Grampians
2013 Southern Grampians
2012 Southern Grampians
State-wide
Large Rural
Men
Women
18-34
35-49
50-64
65+
% Very good Good Average Poor Very poor Can't say
Q3. ON BALANCE, for the last twelve months, how do you feel about the performance of Southern Grampians Shire
Council, not just on one or two issues, BUT OVERALL across all responsibility areas? Has it been very good, good,
average, poor or very poor?
Base: All respondents. Councils asked state-wide: 68 Councils asked group: 19
31J00533 Community Satisfaction Survey 2017 - Southern Grampians Shire Council
Overall contact with Southern Grampians Shire Council
Most contact with Southern Grampians Shire Council
Least contact with Southern Grampians Shire Council
Customer service rating
Most satisfied with customer service
Least satisfied with customer service
• Aged 18-34 years
• Aged 50-64 years
• Index score of 69, up 6 points on 2016
• Aged 18-34 years
• Aged 35-49 years
• 54%, up 4 points on 2016
32J00533 Community Satisfaction Survey 2017 - Southern Grampians Shire Council
67
62
62
61
58
54
51
48
44
35-49
Large Rural
50-64
State-wide
Men
Southern Grampians
Women
65+
18-34
2017 Contact with Council
%
Q5a. Have you or any member of your household had any recent contact with Council in any of the following ways?
Base: All respondents. Councils asked state-wide: 19 Councils asked group: 3
Note: Please see page 5 for explanation about significant differences
33J00533 Community Satisfaction Survey 2017 - Southern Grampians Shire Council
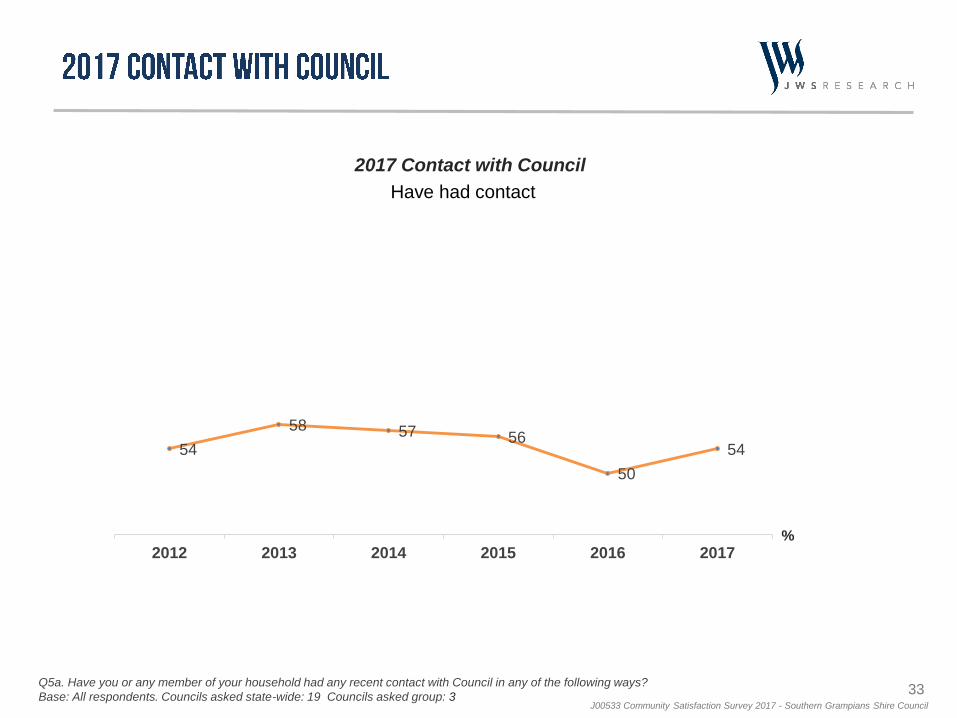
2017 Contact with Council
54
58 57 56
50
54
2012 2013 2014 2015 2016 2017
Have had contact
%
Q5a. Have you or any member of your household had any recent contact with Council in any of the following ways?
Base: All respondents. Councils asked state-wide: 19 Councils asked group: 3
34J00533 Community Satisfaction Survey 2017 - Southern Grampians Shire Council
2017 Method of Contact
Q5a. Have you or any member of your household had any recent contact with Council in any of the following ways?
Base: All respondents. Councils asked state-wide: 19 Councils asked group: 3
Note: Respondents could name multiple contacts methods so responses may add to more than 100%
2013
36
22
11
7
4
2
1
In person
By telephone
By email
In writing
Via website
By social media
By text message
2012
39
26
9
13
6
-
1
37
26
8
15
7
1
1
35J00533 Community Satisfaction Survey 2017 - Southern Grampians Shire Council
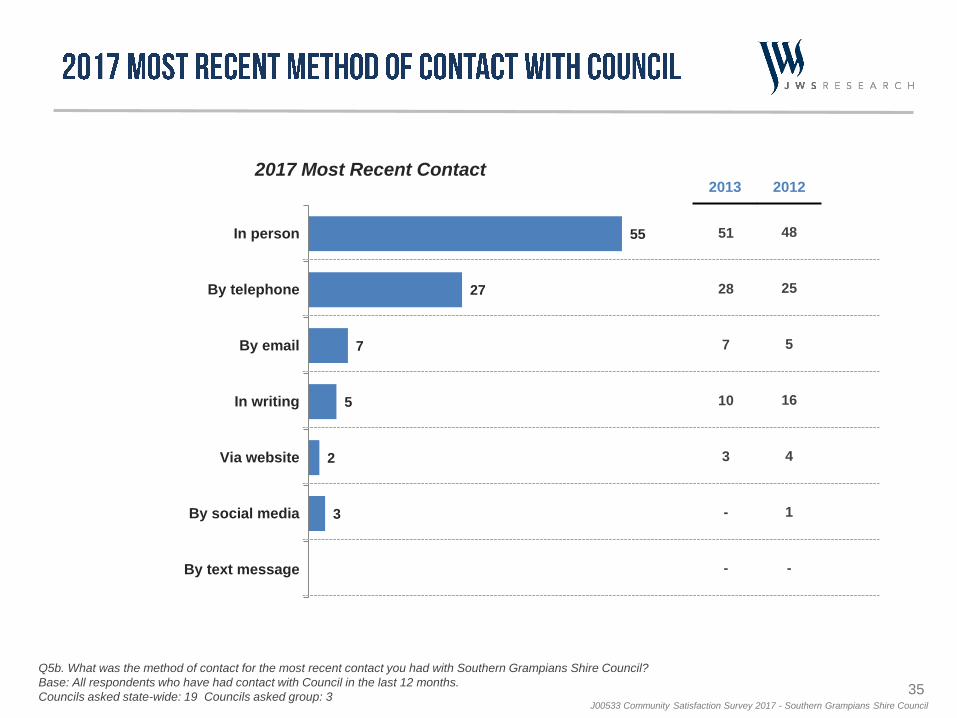
2017 Most Recent Contact
Q5b. What was the method of contact for the most recent contact you had with Southern Grampians Shire Council?
Base: All respondents who have had contact with Council in the last 12 months.
Councils asked state-wide: 19 Councils asked group: 3
2013
55
27
7
5
2
3
In person
By telephone
By email
In writing
Via website
By social media
By text message
2012
48
25
5
16
4
1
-
51
28
7
10
3
-
-
36J00533 Community Satisfaction Survey 2017 - Southern Grampians Shire Council
76
69
69
69
69
68
68
66
56
50-64
65+
State-wide
Men
Southern Grampians
Women
35-49
Large Rural
18-34
60
63
69
56
63
70
58
67
70
69
65
70
61
64
68
64
67
60
64
69
72
67
67
68
68
n/a
69
74
73
71
73
73
72
73
n/a
72
68
72
71
66
70
73
71
n/a
68
2017 Customer Service Rating2016 2015 2014 2013 2012
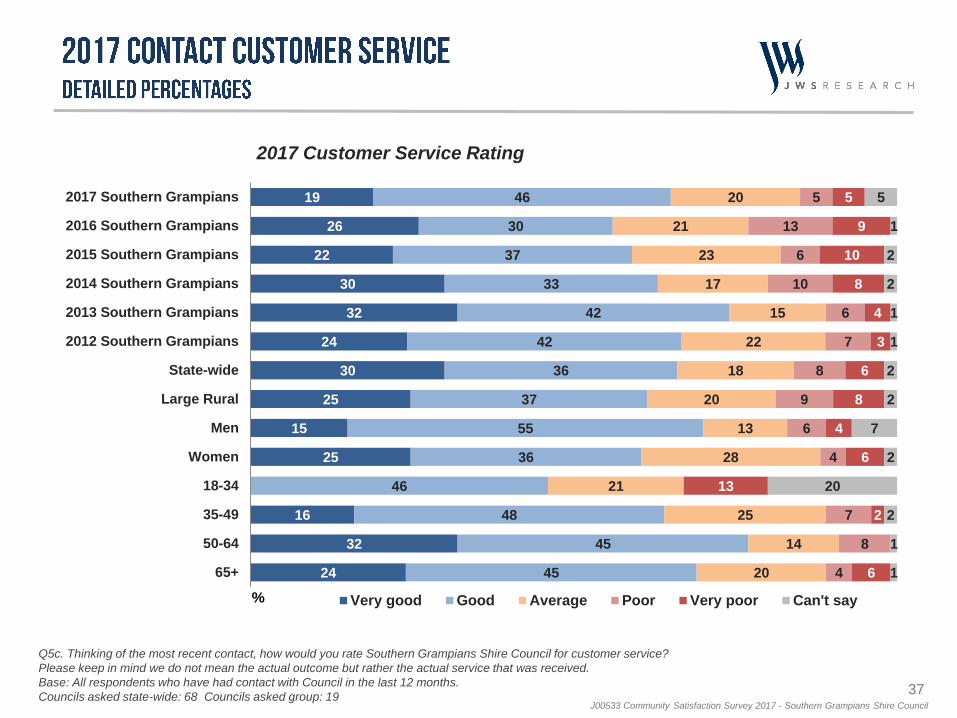
Q5c. Thinking of the most recent contact, how would you rate Southern Grampians Shire Council for customer service?
Please keep in mind we do not mean the actual outcome but rather the actual service that was received.
Base: All respondents who have had contact with Council in the last 12 months.
Councils asked state-wide: 68 Councils asked group: 19
Note: Please see page 5 for explanation about significant differences
37J00533 Community Satisfaction Survey 2017 - Southern Grampians Shire Council
19
26
22
30
32
24
30
25
15
25
16
32
24
46
30
37
33
42
42
36
37
55
36
46
48
45
45
20
21
23
17
15
22
18
20
13
28
21
25
14
20
5
13
6
10
6
7
8
9
6
4
7
8
4
5
9
10
8
4
3
6
8
4
6
13
2
6
5
1
2
2
1
1
2
2
7
2
20
2
1
1
2017 Southern Grampians
2016 Southern Grampians
2015 Southern Grampians
2014 Southern Grampians
2013 Southern Grampians
2012 Southern Grampians
State-wide
Large Rural
Men
Women
18-34
35-49
50-64
65+
% Very good Good Average Poor Very poor Can't say
2017 Customer Service Rating
Q5c. Thinking of the most recent contact, how would you rate Southern Grampians Shire Council for customer service?
Please keep in mind we do not mean the actual outcome but rather the actual service that was received.
Base: All respondents who have had contact with Council in the last 12 months.
Councils asked state-wide: 68 Councils asked group: 19
38J00533 Community Satisfaction Survey 2017 - Southern Grampians Shire Council
75*
75*
74
68
57*
44*
41*
Via website
By text message
In person
By telephone
By email
By social media
In writing
n/a
n/a
n/a
n/a
n/a
n/a
n/a
n/a
n/a
n/a
n/a
n/a
n/a
n/a
n/a
n/a
n/a
n/a
n/a
n/a
n/a
75
45
76
73
77
n/a
68
63
39
71
74
75
43
63
2017 Customer Service Rating2016 2015 2014 2013 2012
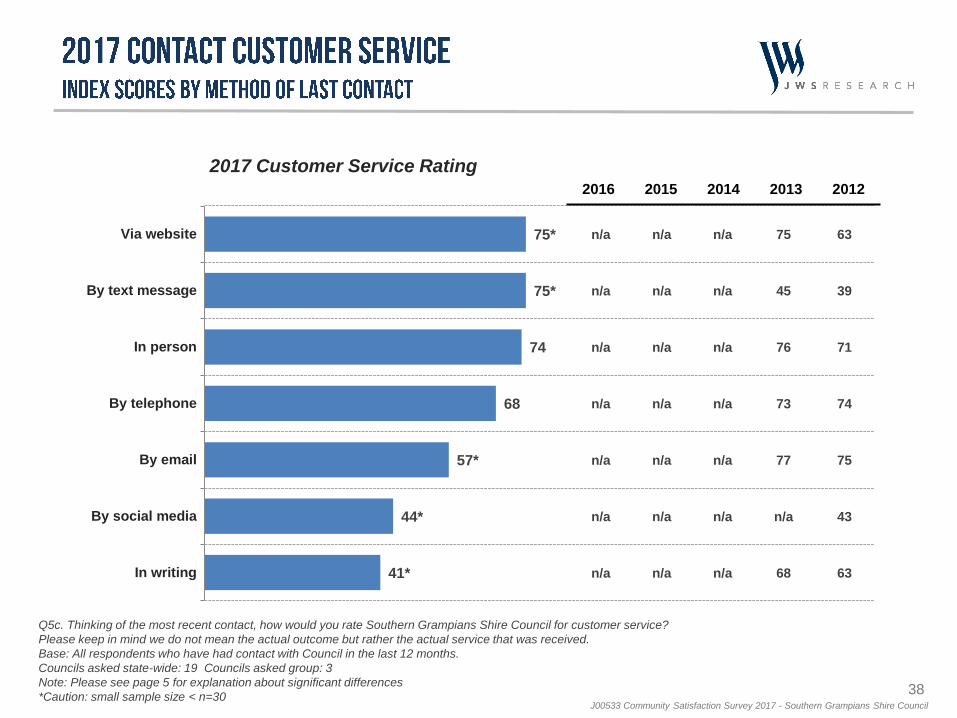
Q5c. Thinking of the most recent contact, how would you rate Southern Grampians Shire Council for customer service?
Please keep in mind we do not mean the actual outcome but rather the actual service that was received.
Base: All respondents who have had contact with Council in the last 12 months.
Councils asked state-wide: 19 Councils asked group: 3
Note: Please see page 5 for explanation about significant differences
*Caution: small sample size < n=30
39J00533 Community Satisfaction Survey 2017 - Southern Grampians Shire Council
26
15
4
18
100
100
44
50
42
22
35
21
17
32
18
20
3
6
9
20
1
4
7
41
25
4
8
5
Via website*
By text message*
In person
By telephone
By email*
By social media*
In writing*
% Very good Good Average Poor Very poor Can't say
2017 Customer Service Rating
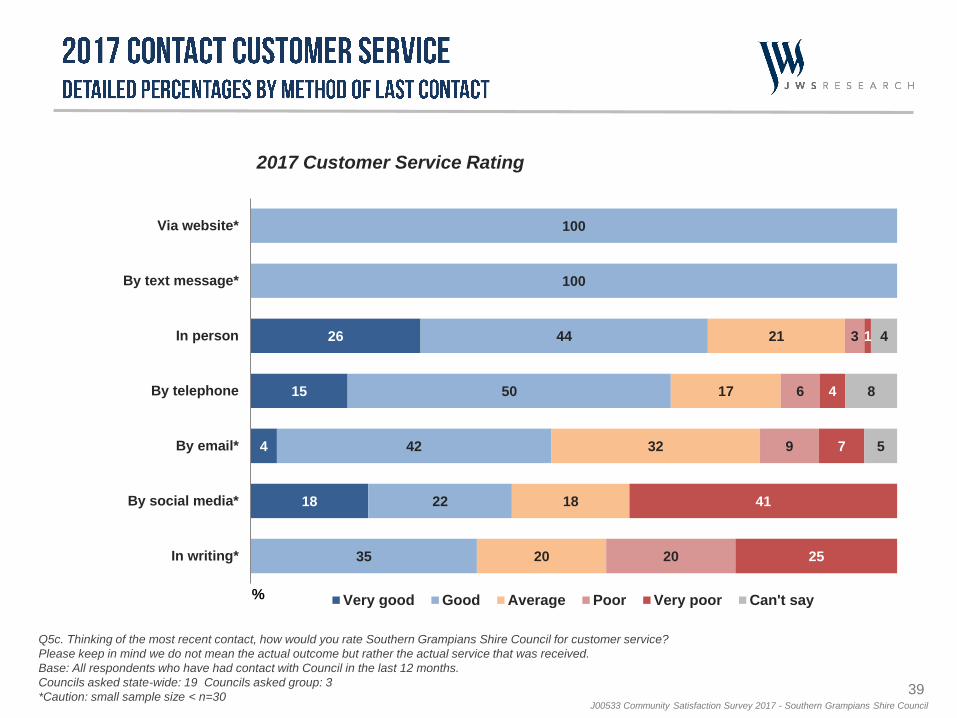
Q5c. Thinking of the most recent contact, how would you rate Southern Grampians Shire Council for customer service?
Please keep in mind we do not mean the actual outcome but rather the actual service that was received.
Base: All respondents who have had contact with Council in the last 12 months.
Councils asked state-wide: 19 Councils asked group: 3
*Caution: small sample size < n=30
41J00533 Community Satisfaction Survey 2017 - Southern Grampians Shire Council
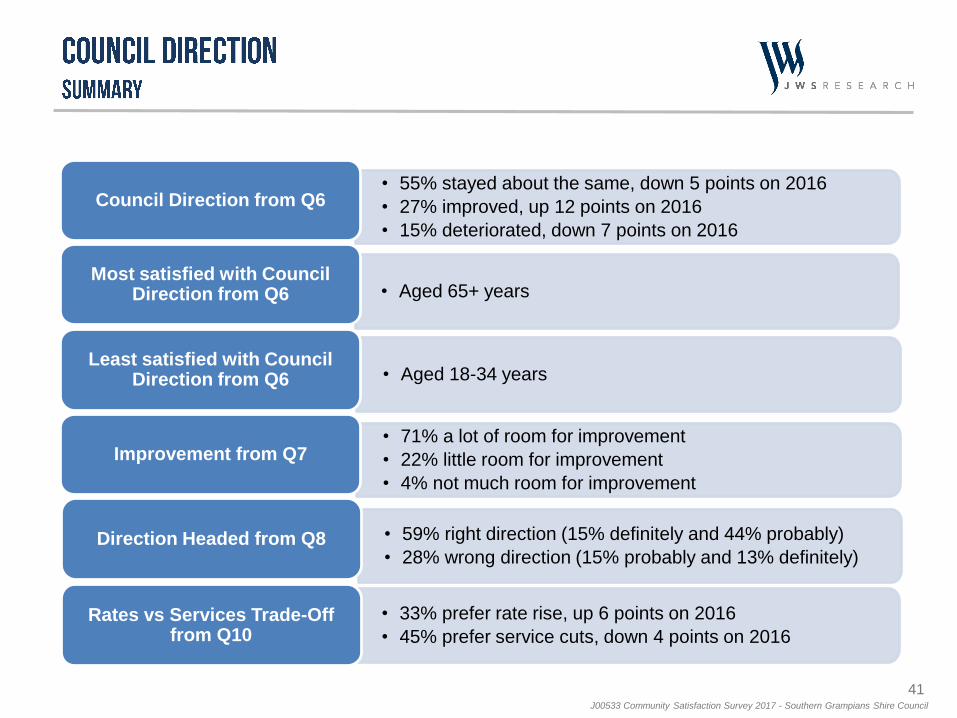
• 33% prefer rate rise, up 6 points on 2016
• 45% prefer service cuts, down 4 points on 2016
• 59% right direction (15% definitely and 44% probably)
• 28% wrong direction (15% probably and 13% definitely)
• 71% a lot of room for improvement
• 22% little room for improvement
• 4% not much room for improvement
• Aged 18-34 years
• Aged 65+ years
• 55% stayed about the same, down 5 points on 2016
• 27% improved, up 12 points on 2016
• 15% deteriorated, down 7 points on 2016
Rates vs Services Trade-Off from Q10
Direction Headed from Q8
Improvement from Q7
Least satisfied with Council Direction from Q6
Most satisfied with Council Direction from Q6
Council Direction from Q6
42J00533 Community Satisfaction Survey 2017 - Southern Grampians Shire Council
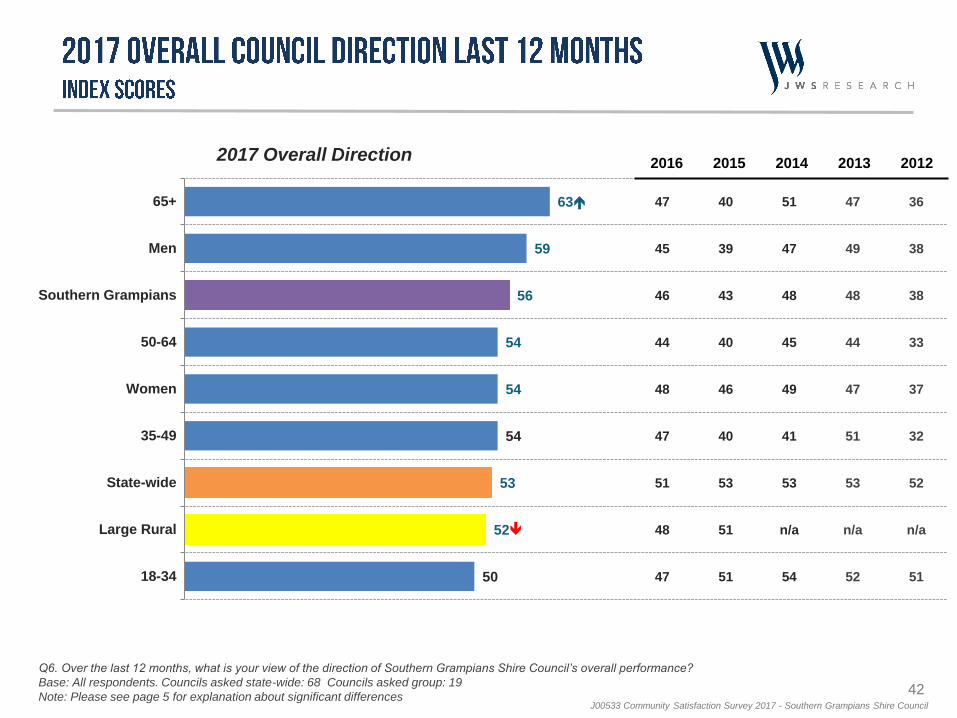
63
59
56
54
54
54
53
52
50
65+
Men
Southern Grampians
50-64
Women
35-49
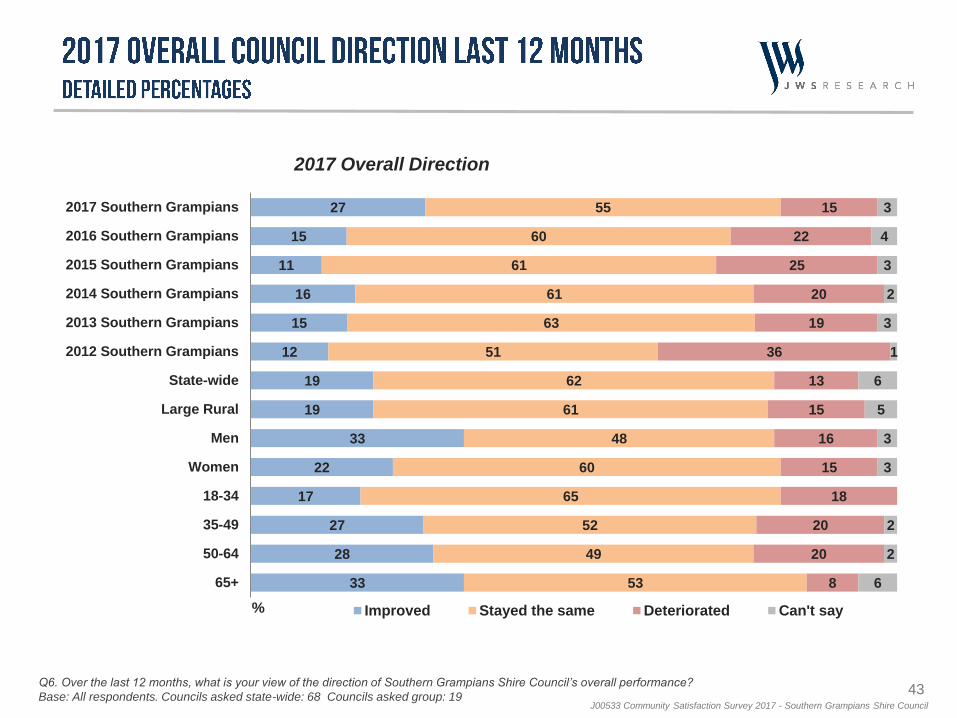
State-wide
Large Rural
18-34
47
45
46
44
48
47
51
48
47
40
39
43
40
46
40
53
51
51
51
47
48
45
49
41
53
n/a
54
47
49
48
44
47
51
53
n/a
52
36
38
38
33
37
32
52
n/a
51
2016 2015 2014 2013 20122017 Overall Direction
Q6. Over the last 12 months, what is your view of the direction of Southern Grampians Shire Council’s overall performance?
Base: All respondents. Councils asked state-wide: 68 Councils asked group: 19
Note: Please see page 5 for explanation about significant differences
43J00533 Community Satisfaction Survey 2017 - Southern Grampians Shire Council
27
15
11
16
15
12
19
19
33
22
17
27
28
33
55
60
61
61
63
51
62
61
48
60
65
52
49
53
15
22
25
20
19
36
13
15
16
15
18
20
20
8
3
4
3
2
3
1
6
5
3
3
2
2
6
2017 Southern Grampians
2016 Southern Grampians
2015 Southern Grampians
2014 Southern Grampians
2013 Southern Grampians
2012 Southern Grampians
State-wide
Large Rural
Men
Women
18-34
35-49
50-64
65+
% Improved Stayed the same Deteriorated Can't say
2017 Overall Direction
Q6. Over the last 12 months, what is your view of the direction of Southern Grampians Shire Council’s overall performance?
Base: All respondents. Councils asked state-wide: 68 Councils asked group: 19
44J00533 Community Satisfaction Survey 2017 - Southern Grampians Shire Council
71
46
58
69
73
85
73
69
63
22
42
33
25
20
9
26
29
23
4
7
5
3
4
6
2
6
1
1
1
1
2
1
3
2
3
3
2
2
5
2017 Southern Grampians
State-wide
Large Rural
Men
Women
18-34
35-49
50-64
65+
% A lot A little Not much Not at all Can't say
2017 Room for Improvement
Q7. Thinking about the next 12 months, how much room for improvement do you think there is in Southern Grampians Shire
Council’s overall performance?
Base: All respondents. Councils asked state-wide: 4 Councils asked group: 2
45J00533 Community Satisfaction Survey 2017 - Southern Grampians Shire Council
15
12
9
18
17
17
13
6
9
19
21
44
48
39
47
45
45
44
47
43
42
45
15
19
23
12
13
11
19
18
19
15
10
13
14
24
10
12
15
11
21
16
11
7
13
7
5
13
14
13
13
9
14
13
16
2017 Southern Grampians
2013 Southern Grampians
2012 Southern Grampians
State-wide
Large Rural
Men
Women
18-34
35-49
50-64
65+
%Definitely right direction Probably right direction Probably wrong direction Definitely wrong direction Can't say
2017 Future Direction
Q8. Would you say your local Council is generally heading in the right direction or the wrong direction?
Base: All respondents. Councils asked state-wide: 8 Councils asked group: 3
46J00533 Community Satisfaction Survey 2017 - Southern Grampians Shire Council
8
9
5
9
9
10
9
11
6
12
13
5
5
25
18
23
25
24
21
21
27
23
38
23
24
18
21
22
24
24
27
23
22
19
22
21
14
31
18
24
27
30
26
24
27
26
21
27
18
29
16
30
22
24
18
17
16
20
21
22
22
12
21
23
29
2017 Southern Grampians
2016 Southern Grampians
2015 Southern Grampians
2013 Southern Grampians
2012 Southern Grampians
State-wide
Large Rural
Men
Women
18-34
35-49
50-64
65+
%Definitely prefer rate rise Probably prefer rate rise Probably prefer service cuts Definitely prefer service cuts Can't say
2017 Rate Rise v Service Cut
Q10. If you had to choose, would you prefer to see council rate rises to improve local services OR would you prefer to see
cuts in council services to keep council rates at the same level as they are now?
Base: All respondents. Councils asked state-wide: 19 Councils asked group: 3
48J00533 Community Satisfaction Survey 2017 - Southern Grampians Shire Council
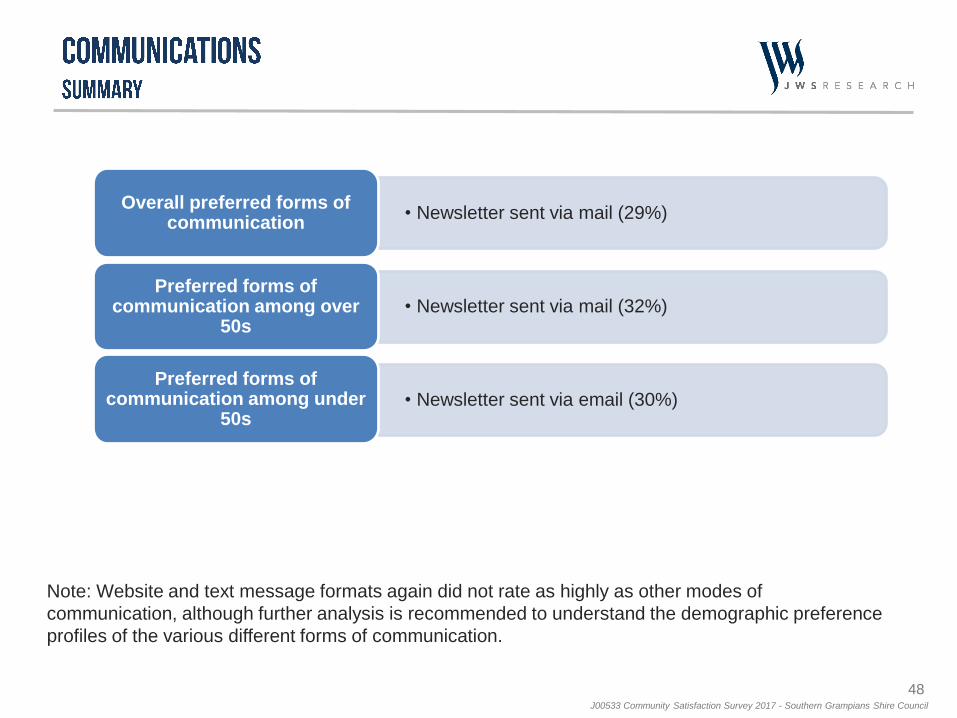
Note: Website and text message formats again did not rate as highly as other modes of
communication, although further analysis is recommended to understand the demographic preference
profiles of the various different forms of communication.
• Newsletter sent via mail (29%)Overall preferred forms of
communication
• Newsletter sent via mail (32%) Preferred forms of
communication among over 50s
• Newsletter sent via email (30%)Preferred forms of
communication among under 50s
49J00533 Community Satisfaction Survey 2017 - Southern Grampians Shire Council
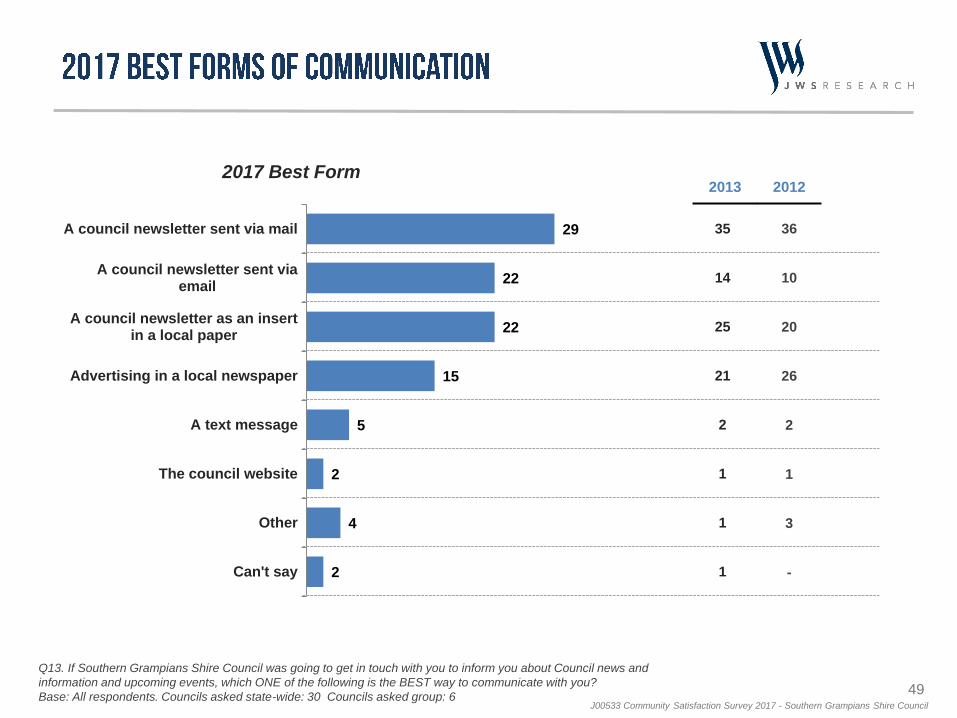
2017 Best Form
Q13. If Southern Grampians Shire Council was going to get in touch with you to inform you about Council news and
information and upcoming events, which ONE of the following is the BEST way to communicate with you?
Base: All respondents. Councils asked state-wide: 30 Councils asked group: 6
2013
29
22
22
15
5
2
4
2
A council newsletter sent via mail
A council newsletter sent viaemail
A council newsletter as an insertin a local paper
Advertising in a local newspaper
A text message
The council website
Other
Can't say
2012
35
14
25
21
2
1
1
1
36
10
20
26
2
1
3
-
50J00533 Community Satisfaction Survey 2017 - Southern Grampians Shire Council
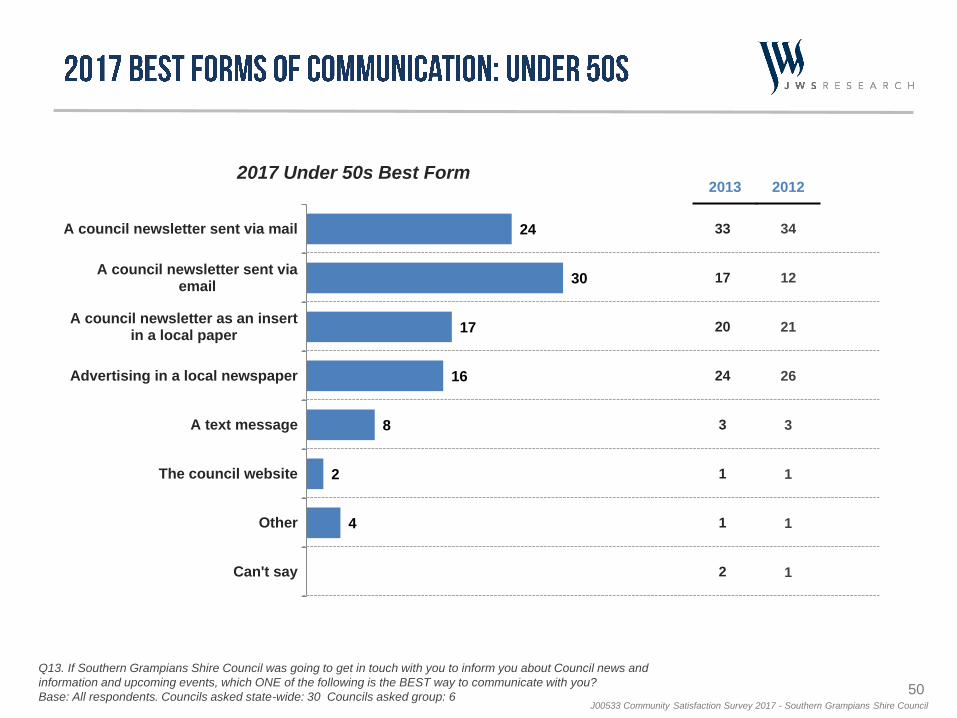
2017 Under 50s Best Form
Q13. If Southern Grampians Shire Council was going to get in touch with you to inform you about Council news and
information and upcoming events, which ONE of the following is the BEST way to communicate with you?
Base: All respondents. Councils asked state-wide: 30 Councils asked group: 6
34
12
21
26
3
1
1
1
2013 2012
24
30
17
16
8
2
4
A council newsletter sent via mail
A council newsletter sent viaemail
A council newsletter as an insertin a local paper
Advertising in a local newspaper
A text message
The council website
Other
Can't say
33
17
20
24
3
1
1
2
51J00533 Community Satisfaction Survey 2017 - Southern Grampians Shire Council
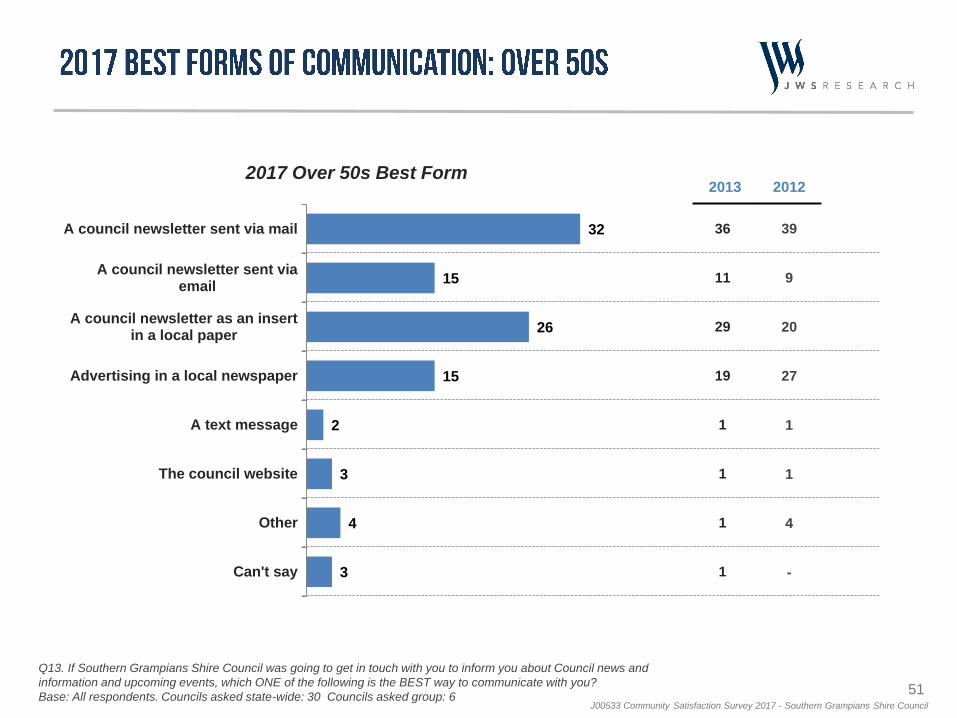
36
11
29
19
1
1
1
1
2017 Over 50s Best Form
Q13. If Southern Grampians Shire Council was going to get in touch with you to inform you about Council news and
information and upcoming events, which ONE of the following is the BEST way to communicate with you?
Base: All respondents. Councils asked state-wide: 30 Councils asked group: 6
2013
32
15
26
15
2
3
4
3
A council newsletter sent via mail
A council newsletter sent viaemail
A council newsletter as an insertin a local paper
Advertising in a local newspaper
A text message
The council website
Other
Can't say
39
9
20
27
1
1
4
-
2012
53J00533 Community Satisfaction Survey 2017 - Southern Grampians Shire Council
58
58
56
56
55
55
55
52
52
35-49
50-64
Women
Southern Grampians
65+
Men
State-wide
Large Rural
18-34
53
50
53
49
47
45
54
52
49
46
43
53
50
49
46
56
54
60
58
51
56
57
58
58
57
n/a
63
54
53
56
55
52
55
57
n/a
64
47
43
46
48
48
49
57
n/a
53
2017 Consultation and Engagement Performance2016 2015 2014 2013 2012
Q2. How has Council performed on ‘community consultation and engagement’ over the last 12 months?
Base: All respondents. Councils asked state-wide: 68 Councils asked group: 19
Note: Please see page 5 for explanation about significant differences
54J00533 Community Satisfaction Survey 2017 - Southern Grampians Shire Council
6
6
6
10
8
6
7
6
6
6
8
9
7
34
26
28
32
29
26
29
28
33
35
38
39
32
30
34
32
31
34
35
30
32
33
38
31
35
31
38
33
13
19
19
15
19
18
15
16
9
17
15
17
11
11
6
10
11
6
3
15
6
8
9
4
9
3
5
7
6
7
4
3
5
4
10
9
5
7
3
3
6
11
2017 Southern Grampians
2016 Southern Grampians
2015 Southern Grampians
2014 Southern Grampians
2013 Southern Grampians
2012 Southern Grampians
State-wide
Large Rural
Men
Women
18-34
35-49
50-64
65+
%Very good Good Average Poor Very poor Can't say
2017 Consultation and Engagement Performance
Q2. How has Council performed on ‘community consultation and engagement’ over the last 12 months?
Base: All respondents. Councils asked state-wide: 68 Councils asked group: 19
55J00533 Community Satisfaction Survey 2017 - Southern Grampians Shire Council
54
54
51
51
49
49
49
48
43
65+
State-wide
Large Rural
Women
Southern Grampians
35-49
50-64
Men
18-34
50
53
50
53
49
51
47
45
48
50
55
53
50
49
45
45
47
55
59
56
n/a
56
57
55
50
58
66
55
55
n/a
51
53
52
48
54
57
50
55
n/a
47
49
45
45
52
57
2017 Lobbying Performance2016 2015 2014 2013 2012
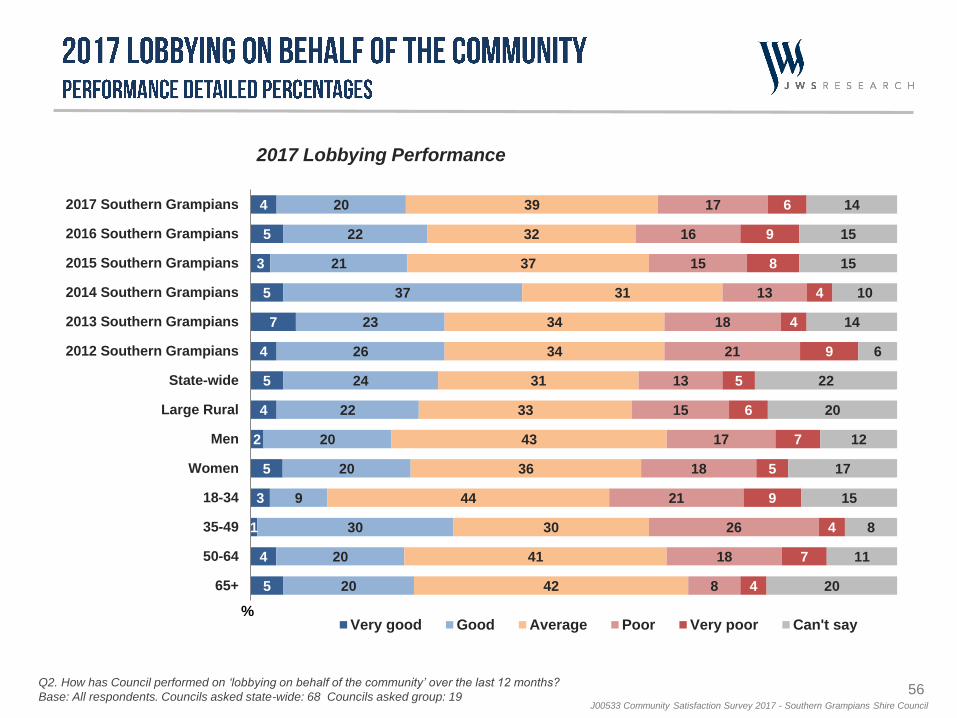
Q2. How has Council performed on ‘lobbying on behalf of the community’ over the last 12 months?
Base: All respondents. Councils asked state-wide: 68 Councils asked group: 19
Note: Please see page 5 for explanation about significant differences
56J00533 Community Satisfaction Survey 2017 - Southern Grampians Shire Council
4
5
3
5
7
4
5
4
2
5
3
1
4
5
20
22
21
37
23
26
24
22
20
20
9
30
20
20
39
32
37
31
34
34
31
33
43
36
44
30
41
42
17
16
15
13
18
21
13
15
17
18
21
26
18
8
6
9
8
4
4
9
5
6
7
5
9
4
7
4
14
15
15
10
14
6
22
20
12
17
15
8
11
20
2017 Southern Grampians
2016 Southern Grampians
2015 Southern Grampians
2014 Southern Grampians
2013 Southern Grampians
2012 Southern Grampians
State-wide
Large Rural
Men
Women
18-34
35-49
50-64
65+
%Very good Good Average Poor Very poor Can't say
2017 Lobbying Performance
Q2. How has Council performed on ‘lobbying on behalf of the community’ over the last 12 months?
Base: All respondents. Councils asked state-wide: 68 Councils asked group: 19
57J00533 Community Satisfaction Survey 2017 - Southern Grampians Shire Council
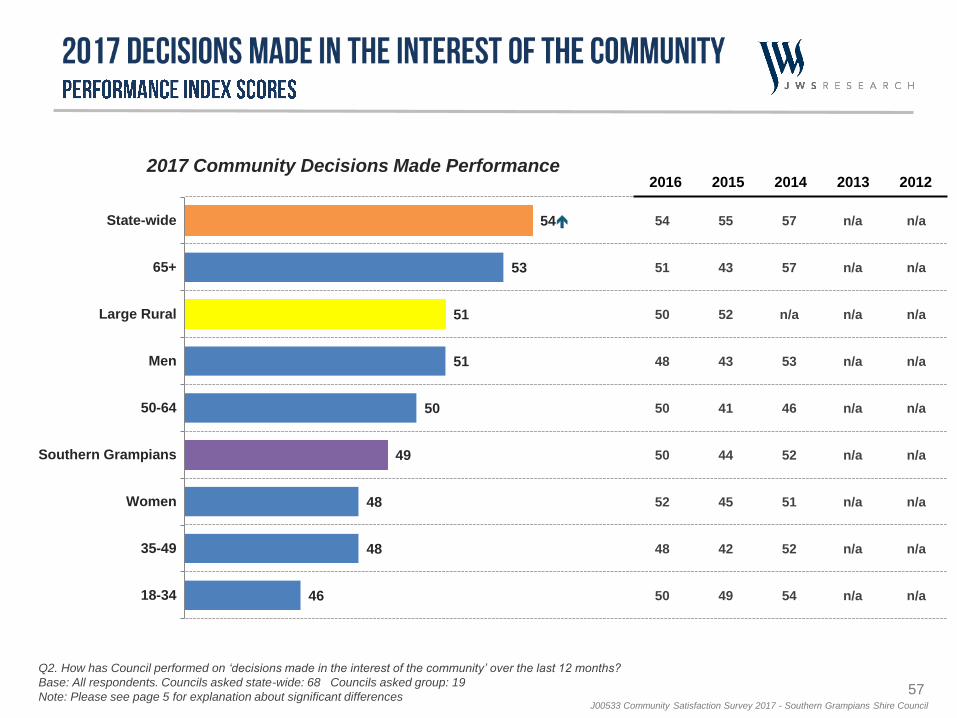
54
53
51
51
50
49
48
48
46
State-wide
65+
Large Rural
Men
50-64
Southern Grampians
Women
35-49
18-34
54
51
50
48
50
50
52
48
50
55
43
52
43
41
44
45
42
49
57
57
n/a
53
46
52
51
52
54
n/a
n/a
n/a
n/a
n/a
n/a
n/a
n/a
n/a
n/a
n/a
n/a
n/a
n/a
n/a
n/a
n/a
n/a
2017 Community Decisions Made Performance2016 2015 2014 2013 2012
Q2. How has Council performed on ‘decisions made in the interest of the community’ over the last 12 months?
Base: All respondents. Councils asked state-wide: 68 Councils asked group: 19
Note: Please see page 5 for explanation about significant differences
58J00533 Community Satisfaction Survey 2017 - Southern Grampians Shire Council
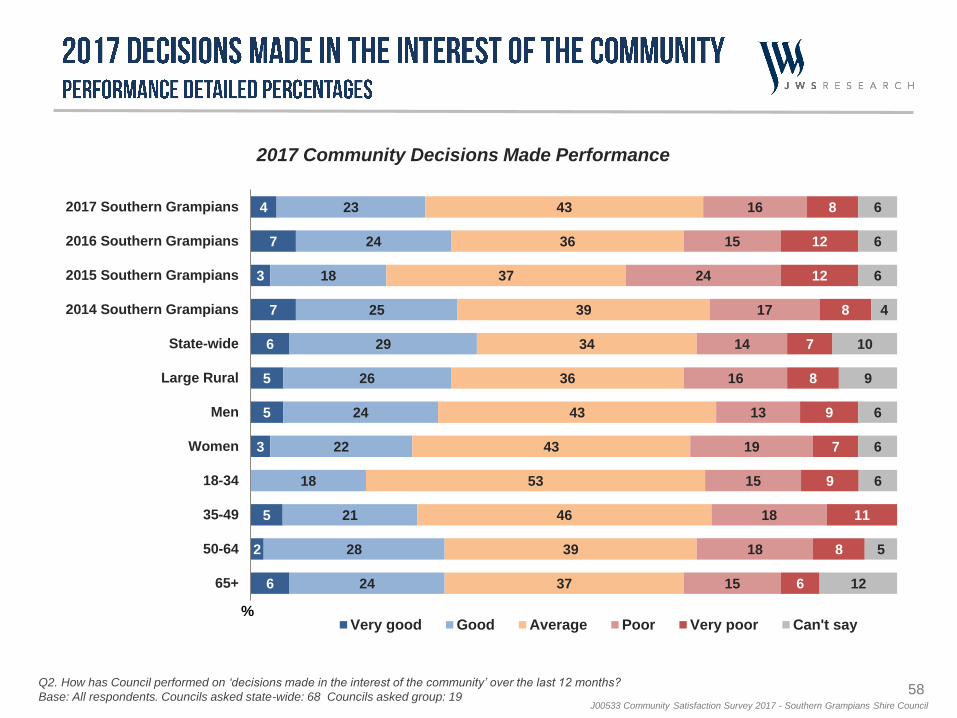
4
7
3
7
6
5
5
3
5
2
6
23
24
18
25
29
26
24
22
18
21
28
24
43
36
37
39
34
36
43
43
53
46
39
37
16
15
24
17
14
16
13
19
15
18
18
15
8
12
12
8
7
8
9
7
9
11
8
6
6
6
6
4
10
9
6
6
6
5
12
2017 Southern Grampians
2016 Southern Grampians
2015 Southern Grampians
2014 Southern Grampians
State-wide
Large Rural
Men
Women
18-34
35-49
50-64
65+
%Very good Good Average Poor Very poor Can't say
2017 Community Decisions Made Performance
Q2. How has Council performed on ‘decisions made in the interest of the community’ over the last 12 months?
Base: All respondents. Councils asked state-wide: 68 Councils asked group: 19
59J00533 Community Satisfaction Survey 2017 - Southern Grampians Shire Council
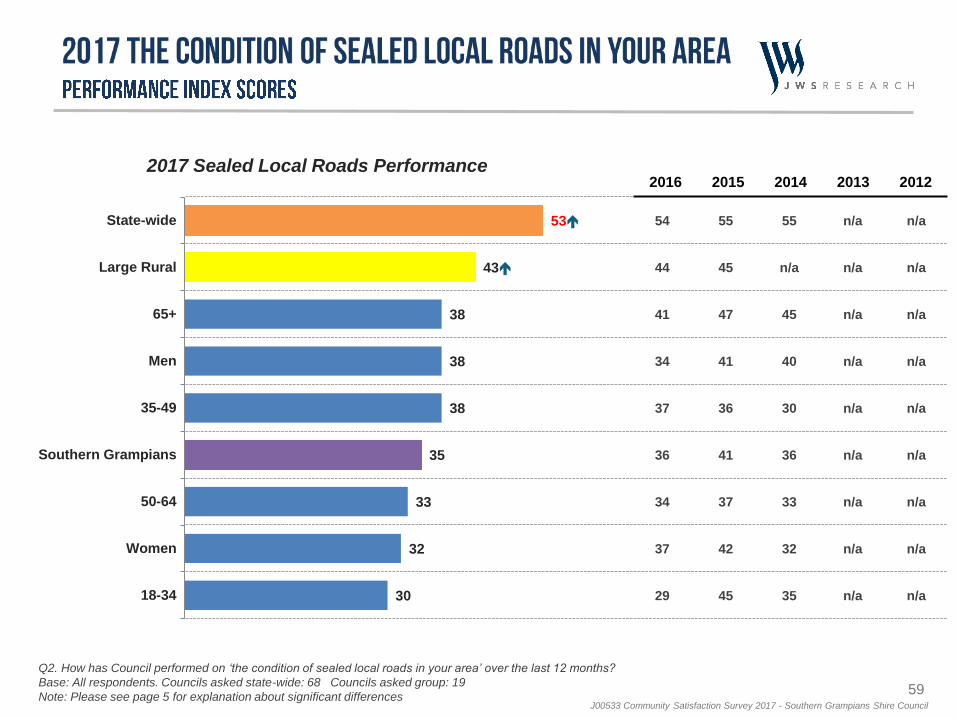
53
43
38
38
38
35
33
32
30
State-wide
Large Rural
65+
Men
35-49
Southern Grampians
50-64
Women
18-34
54
44
41
34
37
36
34
37
29
55
45
47
41
36
41
37
42
45
55
n/a
45
40
30
36
33
32
35
n/a
n/a
n/a
n/a
n/a
n/a
n/a
n/a
n/a
n/a
n/a
n/a
n/a
n/a
n/a
n/a
n/a
n/a
2017 Sealed Local Roads Performance2016 2015 2014 2013 2012
Q2. How has Council performed on ‘the condition of sealed local roads in your area’ over the last 12 months?
Base: All respondents. Councils asked state-wide: 68 Councils asked group: 19
Note: Please see page 5 for explanation about significant differences
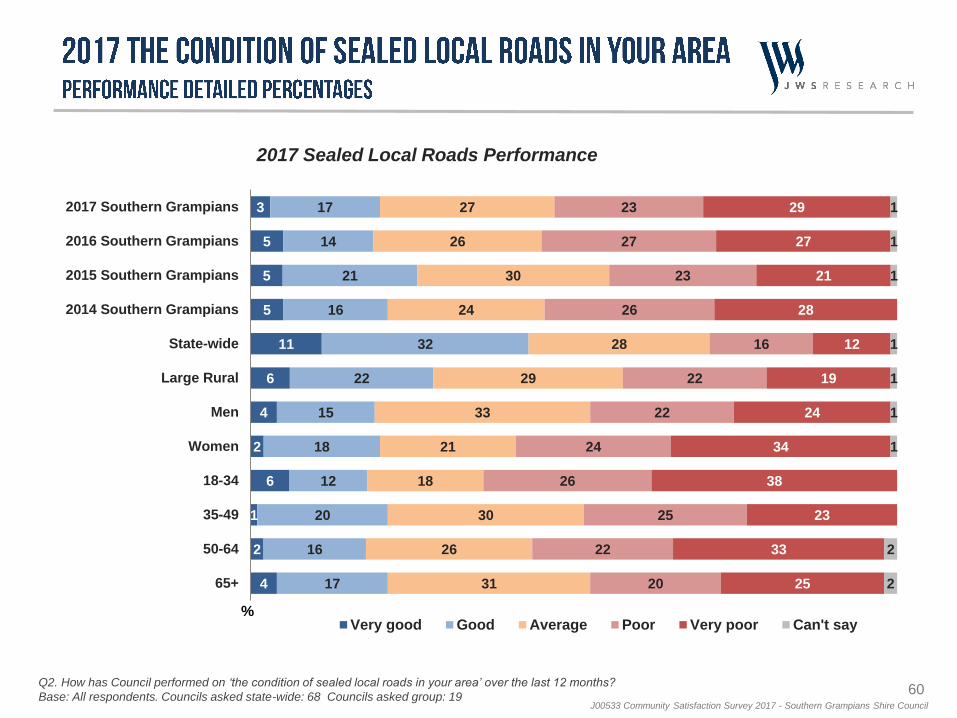
60J00533 Community Satisfaction Survey 2017 - Southern Grampians Shire Council
3
5
5
5
11
6
4
2
6
1
2
4
17
14
21
16
32
22
15
18
12
20
16
17
27
26
30
24
28
29
33
21
18
30
26
31
23
27
23
26
16
22
22
24
26
25
22
20
29
27
21
28
12
19
24
34
38
23
33
25
1
1
1
1
1
1
1
2
2
2017 Southern Grampians
2016 Southern Grampians
2015 Southern Grampians
2014 Southern Grampians
State-wide
Large Rural
Men
Women
18-34
35-49
50-64
65+
%Very good Good Average Poor Very poor Can't say
2017 Sealed Local Roads Performance
Q2. How has Council performed on ‘the condition of sealed local roads in your area’ over the last 12 months?
Base: All respondents. Councils asked state-wide: 68 Councils asked group: 19
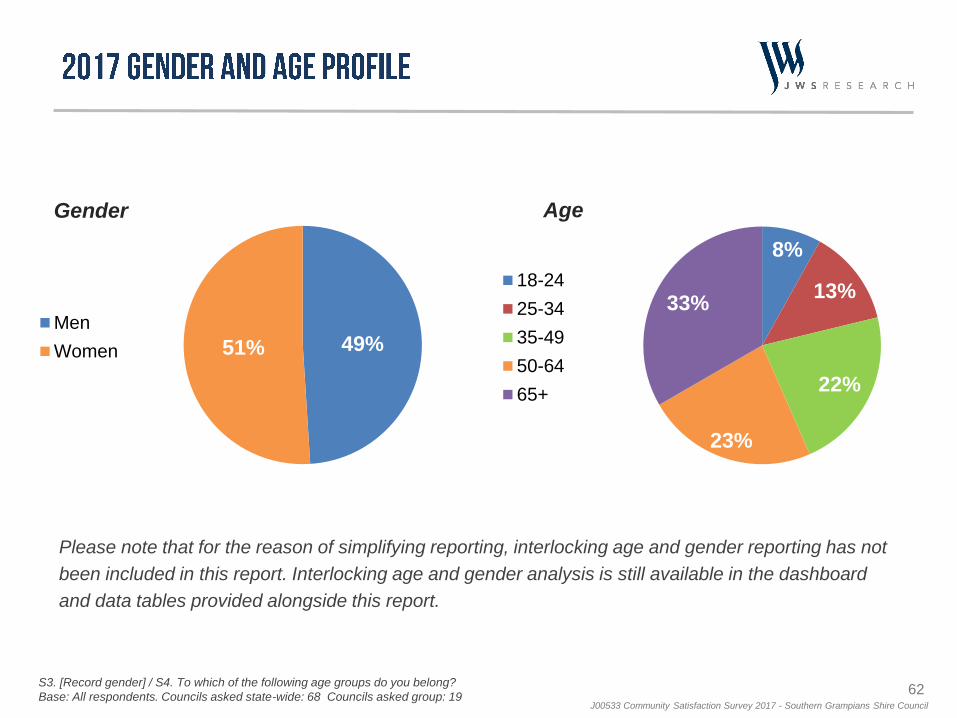
62J00533 Community Satisfaction Survey 2017 - Southern Grampians Shire Council
Please note that for the reason of simplifying reporting, interlocking age and gender reporting has not
been included in this report. Interlocking age and gender analysis is still available in the dashboard
and data tables provided alongside this report.
Gender Age
49%51%
Men
Women
8%
13%
22%
23%
33%18-24
25-34
35-49
50-64
65+
S3. [Record gender] / S4. To which of the following age groups do you belong?
Base: All respondents. Councils asked state-wide: 68 Councils asked group: 19
65J00533 Community Satisfaction Survey 2017 - Southern Grampians Shire Council
The survey was revised in 2012. As a result:
The survey is now conducted as a representative random probability survey of residents aged 18
years or over in local councils, whereas previously it was conducted as a ‘head of household’
survey.
As part of the change to a representative resident survey, results are now weighted post survey to
the known population distribution of Southern Grampians Shire Council according to the most
recently available Australian Bureau of Statistics population estimates, whereas the results were
previously not weighted.
The service responsibility area performance measures have changed significantly and the rating
scale used to assess performance has also changed.
As such, the results of the 2012 State-wide Local Government Community Satisfaction Survey should
be considered as a benchmark. Please note that comparisons should not be made with the State-wide
Local Government Community Satisfaction Survey results from 2011 and prior due to the
methodological and sampling changes. Comparisons in the period 2012-2017 have been made
throughout this report as appropriate.
66J00533 Community Satisfaction Survey 2017 - Southern Grampians Shire Council
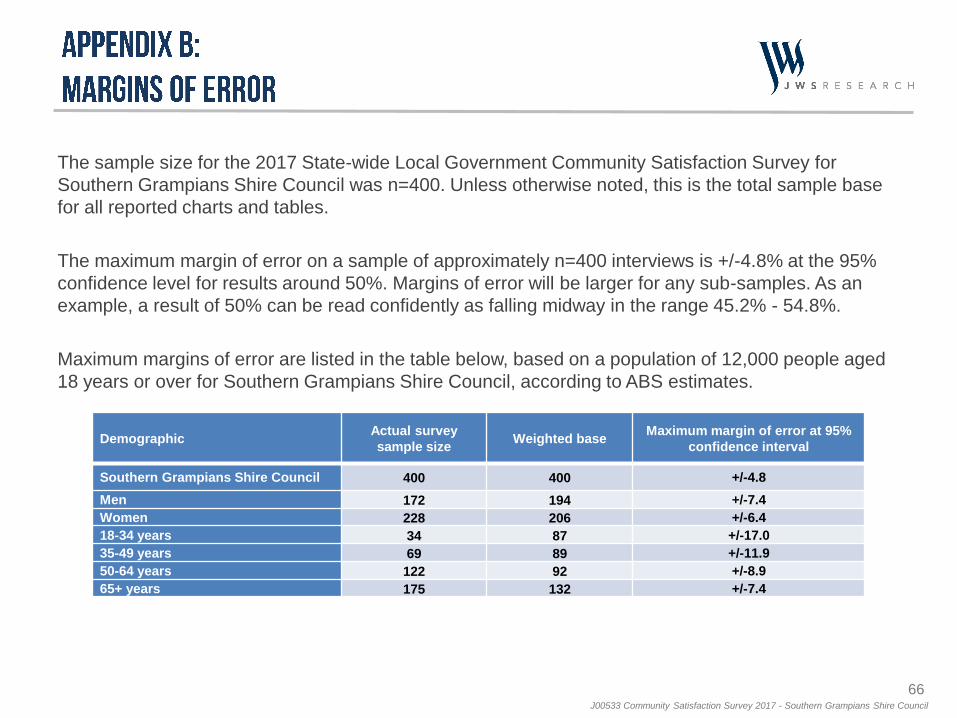
Demographic Actual survey
sample sizeWeighted base
Maximum margin of error at 95%
confidence interval
Southern Grampians Shire Council 400 400 +/-4.8
Men 172 194 +/-7.4
Women 228 206 +/-6.4
18-34 years 34 87 +/-17.0
35-49 years 69 89 +/-11.9
50-64 years 122 92 +/-8.9
65+ years 175 132 +/-7.4
The sample size for the 2017 State-wide Local Government Community Satisfaction Survey for
Southern Grampians Shire Council was n=400. Unless otherwise noted, this is the total sample base
for all reported charts and tables.
The maximum margin of error on a sample of approximately n=400 interviews is +/-4.8% at the 95%
confidence level for results around 50%. Margins of error will be larger for any sub-samples. As an
example, a result of 50% can be read confidently as falling midway in the range 45.2% - 54.8%.
Maximum margins of error are listed in the table below, based on a population of 12,000 people aged
18 years or over for Southern Grampians Shire Council, according to ABS estimates.
67J00533 Community Satisfaction Survey 2017 - Southern Grampians Shire Council
All participating councils are listed in the state-wide report published on the DELWP website. In 2017,
68 of the 79 Councils throughout Victoria participated in this survey. For consistency of analysis and
reporting across all projects, Local Government Victoria has aligned its presentation of data to use
standard council groupings. Accordingly, the council reports for the community satisfaction survey
provide analysis using these standard council groupings. Please note that councils participating across
2012-2017 vary slightly.
Council Groups
Southern Grampians Shire Council is classified as a Large Rural council according to the following
classification list:
Metropolitan, Interface, Regional Centres, Large Rural & Small Rural
Councils participating in the Large Rural group are: Bass Coast, Baw Baw, Campaspe, Colac Otway,
Corangamite, East Gippsland, Glenelg, Golden Plains, Macedon Ranges, Mitchell, Moira, Moorabool,
Mount Alexander, Moyne, South Gippsland, Southern Grampians, Surf Coast, Swan Hill and
Wellington.
Wherever appropriate, results for Southern Grampians Shire Council for this 2017 State-wide Local
Government Community Satisfaction Survey have been compared against other participating councils
in the Large Rural group and on a state-wide basis. Please note that council groupings changed for
2015, and as such comparisons to council group results before that time can not be made within the
reported charts.
68J00533 Community Satisfaction Survey 2017 - Southern Grampians Shire Council
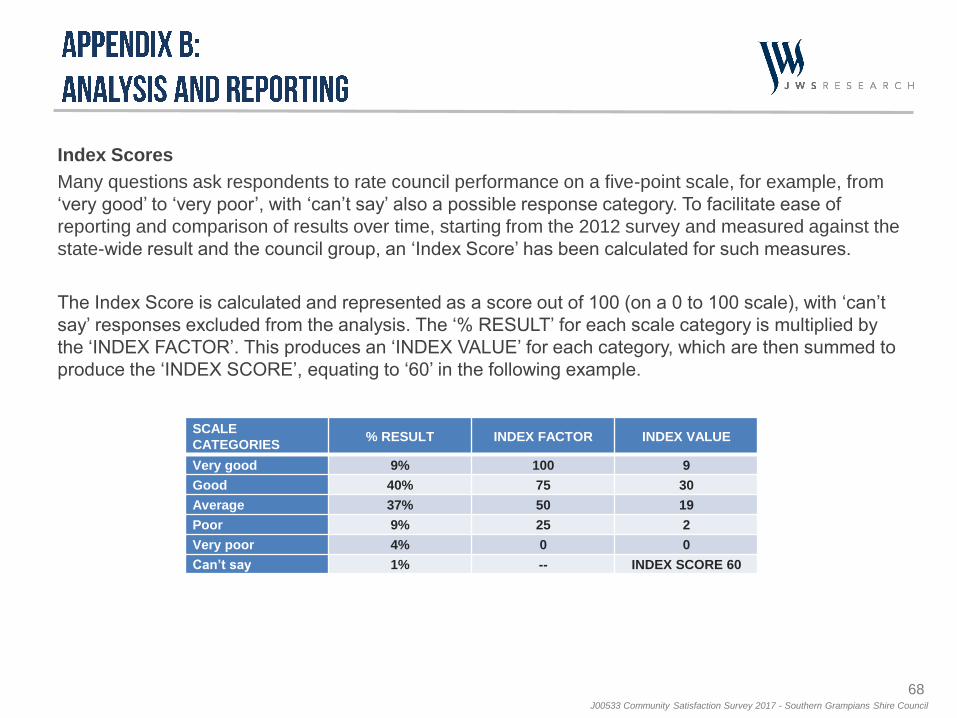
Index Scores
Many questions ask respondents to rate council performance on a five-point scale, for example, from
‘very good’ to ‘very poor’, with ‘can’t say’ also a possible response category. To facilitate ease of
reporting and comparison of results over time, starting from the 2012 survey and measured against the
state-wide result and the council group, an ‘Index Score’ has been calculated for such measures.
The Index Score is calculated and represented as a score out of 100 (on a 0 to 100 scale), with ‘can’t
say’ responses excluded from the analysis. The ‘% RESULT’ for each scale category is multiplied by
the ‘INDEX FACTOR’. This produces an ‘INDEX VALUE’ for each category, which are then summed to
produce the ‘INDEX SCORE’, equating to ‘60’ in the following example.
SCALE
CATEGORIES% RESULT INDEX FACTOR INDEX VALUE
Very good 9% 100 9
Good 40% 75 30
Average 37% 50 19
Poor 9% 25 2
Very poor 4% 0 0
Can’t say 1% -- INDEX SCORE 60
69J00533 Community Satisfaction Survey 2017 - Southern Grampians Shire Council
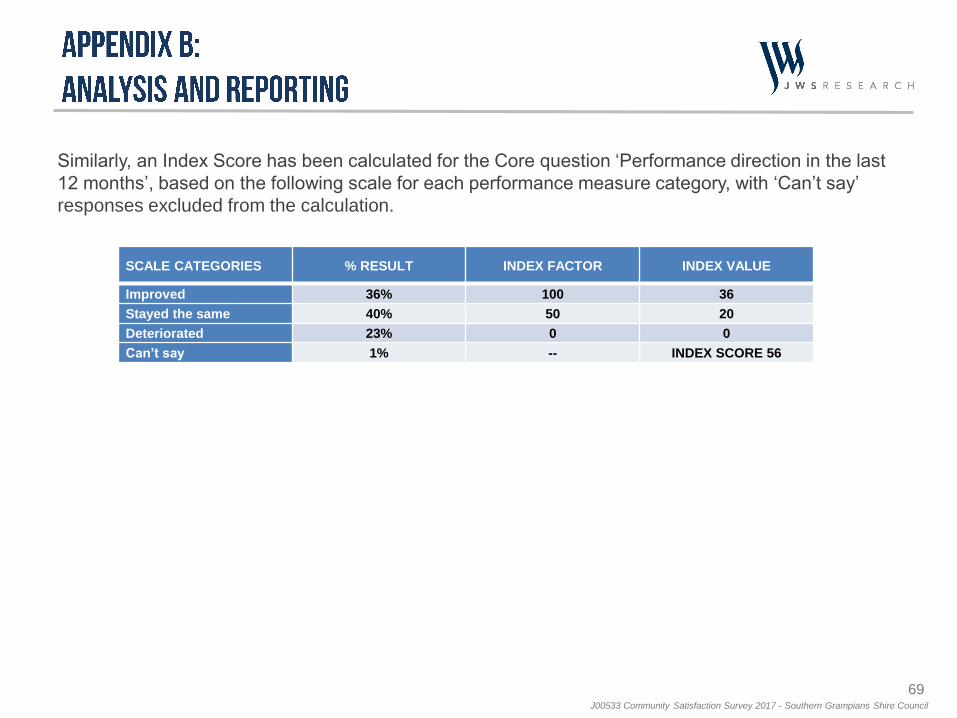
Similarly, an Index Score has been calculated for the Core question ‘Performance direction in the last
12 months’, based on the following scale for each performance measure category, with ‘Can’t say’
responses excluded from the calculation.
SCALE CATEGORIES % RESULT INDEX FACTOR INDEX VALUE
Improved 36% 100 36
Stayed the same 40% 50 20
Deteriorated 23% 0 0
Can’t say 1% -- INDEX SCORE 56

70J00533 Community Satisfaction Survey 2017 - Southern Grampians Shire Council
Index scores are indicative of an overall rating on a particular service area. In this context, index scores
indicate:
a) how well council is seen to be performing in a particular service area; or
b) the level of importance placed on a particular service area.
For ease of interpretation, index score ratings can be categorised as follows:
INDEX SCORE Performance implication Importance implication
75 – 100Council is performing very well
in this service area
This service area is seen to be
extremely important
60 – 75Council is performing well in this service
area, but there is room for improvement
This service area is seen to be
very important
50 – 60Council is performing satisfactorily in
this service area but needs to improve
This service area is seen to be
fairly important
40 – 50Council is performing poorly
in this service area
This service area is seen to be
somewhat important
0 – 40Council is performing very poorly
in this service area
This service area is seen to be
not that important
71J00533 Community Satisfaction Survey 2017 - Southern Grampians Shire Council
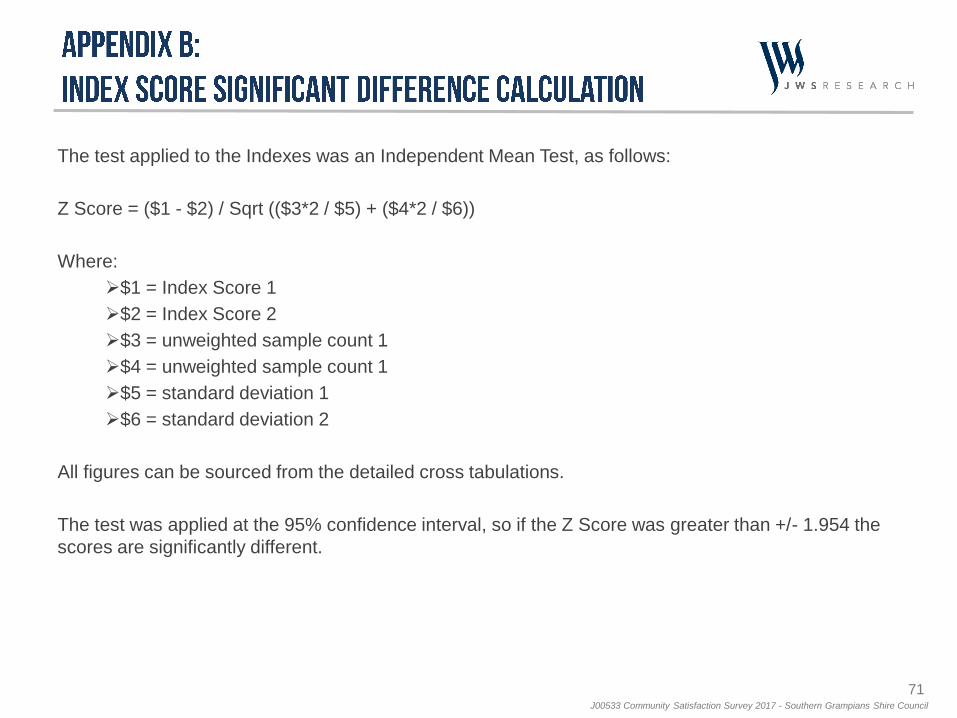
The test applied to the Indexes was an Independent Mean Test, as follows:
Z Score = ($1 - $2) / Sqrt (($3*2 / $5) + ($4*2 / $6))
Where:
$1 = Index Score 1
$2 = Index Score 2
$3 = unweighted sample count 1
$4 = unweighted sample count 1
$5 = standard deviation 1
$6 = standard deviation 2
All figures can be sourced from the detailed cross tabulations.
The test was applied at the 95% confidence interval, so if the Z Score was greater than +/- 1.954 the
scores are significantly different.
72J00533 Community Satisfaction Survey 2017 - Southern Grampians Shire Council
Core, Optional and Tailored Questions
Over and above necessary geographic and demographic questions required to ensure sample
representativeness, a base set of questions for the 2017 State-wide Local Government Community
Satisfaction Survey was designated as ‘Core’ and therefore compulsory inclusions for all participating
Councils.
These core questions comprised:
Overall performance last 12 months (Overall performance)
Lobbying on behalf of community (Advocacy)
Community consultation and engagement (Consultation)
Decisions made in the interest of the community (Making community decisions)
Condition of sealed local roads (Sealed local roads)
Contact in last 12 months (Contact)
Rating of contact (Customer service)
Overall council direction last 12 months (Council direction)
Reporting of results for these core questions can always be compared against other participating
councils in the council group and against all participating councils state-wide. Alternatively, some
questions in the 2017 State-wide Local Government Community Satisfaction Survey were optional.
Councils also had the ability to ask tailored questions specific only to their council.
73J00533 Community Satisfaction Survey 2017 - Southern Grampians Shire Council
Reporting
Every council that participated in the 2017 State-wide Local Government Community Satisfaction
Survey receives a customised report. In addition, the state government is supplied with a state-wide
summary report of the aggregate results of ‘Core’ and ‘Optional’ questions asked across all council
areas surveyed.
Tailored questions commissioned by individual councils are reported only to the commissioning council
and not otherwise shared unless by express written approval of the commissioning council.
The overall State-wide Local Government Community Satisfaction Report is available at
https://www.localgovernment.vic.gov.au/our-programs/council-community-satisfaction-survey.
.
74J00533 Community Satisfaction Survey 2017 - Southern Grampians Shire Council
Core questions: Compulsory inclusion questions for all councils participating in the CSS.
CSS: 2017 Victorian Local Government Community Satisfaction Survey.
Council group: One of five classified groups, comprising: metropolitan, interface, regional centres, large rural and
small rural.
Council group average: The average result for all participating councils in the council group.
Highest / lowest: The result described is the highest or lowest result across a particular demographic sub-group e.g.
men, for the specific question being reported. Reference to the result for a demographic sub-group being the highest or
lowest does not imply that it is significantly higher or lower, unless this is specifically mentioned.
Index score: A score calculated and represented as a score out of 100 (on a 0 to 100 scale). This score is sometimes
reported as a figure in brackets next to the category being described, e.g. men 50+ (60).
Optional questions: Questions which councils had an option to include or not.
Percentages: Also referred to as ‘detailed results’, meaning the proportion of responses, expressed as a percentage.
Sample: The number of completed interviews, e.g. for a council or within a demographic sub-group.
Significantly higher / lower: The result described is significantly higher or lower than the comparison result based on
a statistical significance test at the 95% confidence limit. If the result referenced is statistically higher or lower then this
will be specifically mentioned, however not all significantly higher or lower results are referenced in summary reporting.
Statewide average: The average result for all participating councils in the State.
Tailored questions: Individual questions tailored by and only reported to the commissioning council.
Weighting: Weighting factors are applied to the sample for each council based on available age and gender
proportions from ABS census information to ensure reported results are proportionate to the actual population of the
council, rather than the achieved survey sample.
Contact Us:
03 8685 8555
John Scales
Managing Director
Mark Zuker
Managing Director