Embed Size (px)
Citation preview
8/22/2019 CES_13_Mates
http://slidepdf.com/reader/full/ces13mates 1/52
5
Neven Mates
Fiscal Policy: Lessons from the Global Crisis
Croatian Economic Survey : Vol. 13 : No. 1 : April 2011 : pp. 5-56
Fiscal Policy:
Lessons fromthe Global Crisis
Abstract
Te global crisis interacted heavily with fiscal policy in the run-up to the crisis,
during the crisis and now in the recovery phase. Contrary to the general consensus,
the paper argues that in the run-up to the crisis, fiscal policy in the advanced
economies and China substantially contributed to the propagation of the globalimbalances, while at the same time it reduced the fiscal space that was available
to the advanced countries when the crisis occurred. On the policy response
during the crisis, the paper suggests that the discretionary relaxation was a mixed
blessing at best: appropriate to some extent in countries that entered the crisis
with solid fiscal and current account positions, but much less, if at all, in other
countries, particularly those that faced problems of public debt sustainability.
Even letting the automatic stabilizers operate fully was not an option for countries
in a weak fiscal position, particularly in light of the substantial downward
Neven Mates
Croatian National Bank, Croatia
CroEconSur
Vol. 13
No. 1
April 2011
pp. 5-56
Received: December 20, 2010
Accepted: February 06, 2011
Review Article

8/22/2019 CES_13_Mates
http://slidepdf.com/reader/full/ces13mates 2/52
6
Neven Mates
Fiscal Policy: Lessons from the Global Crisis
Croatian Economic Survey : Vol. 13 : No. 1 : April 2011 : pp. 5-56
revisions in the potential GDP level and growth rates. Looking ahead, the large
deterioration in the public debt ratios resulting from the crisis will slow down
output growth in the advanced economies, while also requiring painful fiscal
adjustment. Emerging market economies, in general, did better in the crisis than
the advanced economies, but in most of the post-transition European economies,
the effects of the crisis were amplified by the pronounced external imbalances at
the outset of the crisis. A majority of European post-transition countries will,
therefore, also face substantial fiscal challenges in the period ahead.
Keywords: fiscal policy, global crisis, structural fiscal balances
JEL classification: E62, E63, H62, H87
1 Introduction1
Te current global crisis provides important lessons for fiscal policy. In this
context, in a broad overview, the paper addresses the following issues: (i) the role
of fiscal policy in the run-up to the crisis, (ii) the issue of fiscal space when the crisis
occurred, (iii) fiscal policy response during the crisis and (iv) the implications of
the deterioration in public debt ratios for fiscal policy in the future.
Te paper explores to what extent fiscal policies in countries with external current
account deficits and in those with surpluses contributed to the global imbalances,particularly the U.S. and China. Contrary to the consensus that was held at
least until the sovereign debt phase of the crisis, the paper argues that fiscal
policies in these countries did play a substantial role among the causes of the
crisis. Moreover, it offers a somewhat different view from the one that is generally
held on the causes of the rising surpluses in China, attributing them primarily
1 Te author delivered a lecture based on this paper at the conference “Fiscal Policy in the Crisis and Beyond: Short-term Impacts and Long-term Implications”, organized by the Institute of Economics, Zagreb on November 25,2010.

8/22/2019 CES_13_Mates
http://slidepdf.com/reader/full/ces13mates 3/52
7
Neven Mates
Fiscal Policy: Lessons from the Global Crisis
Croatian Economic Survey : Vol. 13 : No. 1 : April 2011 : pp. 5-56
to the public sector. Te paper also expands the question about the relationship
between the current account imbalances and fiscal policy to the euro area.
Te issue of fiscal space available to countries when the crisis occurred is
addressed in the next section and particular attention is focused on the public
debt dynamics in the advanced economies.
Te fiscal policy response to the crisis included both automatic stabilizers and
discretionary relaxation. Te latter was, surprisingly, initiated by the IMF early in
the crisis and later, after the Lehman bankruptcy, accepted by major players. Te
issue of the marginal contribution of the discretionary stimulus to the recovery,
over and above the effects of automatic stabilizers and non-conventional central
bank operations, will be a hotly debated academic topic in the years ahead. Te
paper offers some preliminary assessments, particularly in the context of the
third, sovereign debt phase of the crisis.
Regarding the post-transition countries in Central and Eastern Europe (CEE)
and Southeast Europe (SEE), the paper explores to what extent their fiscal space was limited when the crisis struck and, particularly, the role of their external
imbalances.
Looking forward, the large deterioration in the budget deficits and public debt
ratios in the advanced economies will be a defining fact for fiscal policy in the next
decade. Te secular growth in public debt ratios over the last 40 years suggests
that the current fiscal policy frameworks would need to be revised, including the
possible expansion of the role of fiscal rules and councils.
On the methodological side, the current crisis has opened the issue of the
reliability of the concept of potential output and structural fiscal balances, given
the large downward ex-post revisions in both. Tis issue is addressed in more
detail in Appendix 1.
Te last section concludes.

8/22/2019 CES_13_Mates
http://slidepdf.com/reader/full/ces13mates 4/52
8
Neven Mates
Fiscal Policy: Lessons from the Global Crisis
Croatian Economic Survey : Vol. 13 : No. 1 : April 2011 : pp. 5-56
2 Fiscal Policy in the Run-up to the Crisis:
Adding Fuel to the FireIn the debates about the crisis during 2009, a consensus was reached that the
two crucial causes of the crisis were the following: (i) global macroeconomic
imbalances, which produced an environment of exceptionally low interest rates
and (ii) failures in the regulation and supervision of the financial system.2 Te
debate was somewhat inconclusive on whether the Fed’s monetary policy was
excessively lax as well. Te ECB’s policy was even spared such questions. In any
case, policy interest rates were seen as secondary to the effect of global imbalanceson the long-term real interest rates.
Te imbalances were seen as a private sector event, not as a fiscal one. Tey were
supposed to reflect the strong saving propensity of households in the surplus
countries, such as China, on the one hand, and property, consumption and
equity bubbles in the advanced economies on the other.
Fiscal policy was absent from the circle of potential suspects. Even whenthe sovereign debt phase of the crisis started, it was considered to be more a
consequence than a cause.
Was this, however, a fair picture?
2.1 Untimely Fiscal Relaxation under the Bush Administration
From today’s perspective, it surely looks strange that at the turn of the century
economists lively debated the problem of a disappearing U.S. public debt.
Under the Clinton administration, the U.S. budget started running surpluses.
Extrapolating the trend, many observers concluded that the U.S. public debt,
at least its tradable part, would soon disappear. Markets became concerned
about this for two reasons. Te first one was the loss of the risk-free benchmark,
traditionally facilitated by the U.S. securities. Second, in the absence of the2 See, for example, G-20 (2009a).
8/22/2019 CES_13_Mates
http://slidepdf.com/reader/full/ces13mates 5/52
9
Neven Mates
Fiscal Policy: Lessons from the Global Crisis
Croatian Economic Survey : Vol. 13 : No. 1 : April 2011 : pp. 5-56
treasury papers that the FED was using for open market operations, markets
worried that monetary policy might be inadvertently tightened for purely
technical reasons.
Greenspan (2001) shared the view that the privately held stock of reasuries
would, indeed, soon be repaid, although he expected the deficit to later reappear
once the post-WW2 baby-boom generation started to retire. For that reason, on
several occasions he tried to reassure markets that monetary policy would not be
affected, as the FED could easily expand the set of eligible instruments. On the
risk-free benchmark, Greenspan assured markets that the financial sector couldeasily produce synthetic AAA instruments with the same characteristics as the
U.S. treasury bonds.
en years later, we can see how forecasts by economists sometimes become reality
in a surprising way. Te FED has, indeed, widely expanded the set of eligible
assets, but not because the U.S. public debt has disappeared. In addition, the
synthetic AAA debt instruments were created, but instead of being a solution,
they have become more of a problem.
Early in his first mandate, George W. Bush’s administration enacted large tax
cuts that set the U.S. debt back on the rising trend. Te relaxation in fiscal policy
came at a time of reasonably strong growth and when there was a widening U.S.
current account deficit. In fact, the current account position started to deteriorate
from about 1998 onwards, reflecting large capital inflows. Te standard
recommendation under the Washington consensus for such circumstances was to tighten fiscal policy to offset, at least partly, the effects of private capital
flows. Fiscal tightening, indeed, happened during the Clinton administration.
However, under the Bush administration, fiscal policy went into the opposite
direction. As a result, the U.S. structural fiscal balance deteriorated by some 3.6
percentage points relative to GDP between 1997 and 2007, approximately the
same as the U.S. current account balance during that period (Figure 1).

8/22/2019 CES_13_Mates
http://slidepdf.com/reader/full/ces13mates 6/52
10
Neven Mates
Fiscal Policy: Lessons from the Global Crisis
Croatian Economic Survey : Vol. 13 : No. 1 : April 2011 : pp. 5-56
Figure 1: Te Current Account and the Budget Balance in the U.S.
-8
-6
-4
-2
0
Current account balance (in % of GDP)
GDP growth rate (%)
General government cyclically adjusted balance (in % of potential GDP)
1 9 9
4
1 9 9
5
1 9 9
6
1 9 9 7
1 9 9 8
1 9 9 9
2 0 0 0
2 0 0 1
2 0 0 2
2 0 0 3
2 0 0
4
2 0 0
5
2 0 0
6
2 0 0 7
2 0 0 8
2 0 0 9
2 0 1 0
2 0 1 1
2 0 1 2
2 0 1 3
2 0 1
4
2 0 1
5
2
4
6In %
Sources: World Economic Outlook Database, October 2010; Eurostat.
Of course, not only the budget steered the dynamics of the U.S. current account.
Empirical and modeling research, most of which was conducted before the
current crisis, has produced estimates that a change in the budget balance by 1
percentage point affects the current account in industrial countries on average
between 0.1 and 0.49 percentage points (Chinn and Ito, 2007).3 Even if we use
the midpoint of that range, it would follow that the U.S. fiscal policy contributed
about a third to the widening in the U.S. current account position in that period.
Te fiscal relaxation under the Bush administration was, therefore, adding fuel
to the fire of capital inflows and the private sector consumption boom.
3 Abbas et al. (2010) estimated that a strengthening in the fiscal balance produces an improvement in the currentaccount balance of 0.2-0.3 percentage points of GDP, and the effect is even stronger when output is above thepotential. A positive effect of the budget balance on the current account balance has also been documented byNickel and Vansteenkiste (2008). Estimating the effect is complicated by the reversed causal ity and the fact thatcyclical and structural components work in opposite directions. For example, during booms strong capital inflows
and private sector consumption might result, on the one hand, in a large current account deficit, but also in windfal l budget revenue that improves the headline fisca l balance. Even structural balance might, wrongly, lookbetter if all effects are not captured by the cyclical adjustment.
8/22/2019 CES_13_Mates
http://slidepdf.com/reader/full/ces13mates 7/52
11
Neven Mates
Fiscal Policy: Lessons from the Global Crisis
Croatian Economic Survey : Vol. 13 : No. 1 : April 2011 : pp. 5-56
2.2 China’s Fiscal Policy as the Driving Force behind its Current
Account Surpluses
Let us now look at the savings side, i.e., at countries with large current account
surpluses, and focus on China. Most commentators have claimed that the main
factor behind China’s external surpluses was the high saving propensity of China’s
households. Tis was supported by statistics showing a sharp decline in household
consumption relative to GDP over the last decade and a half, coinciding with the
increasing current account surpluses.
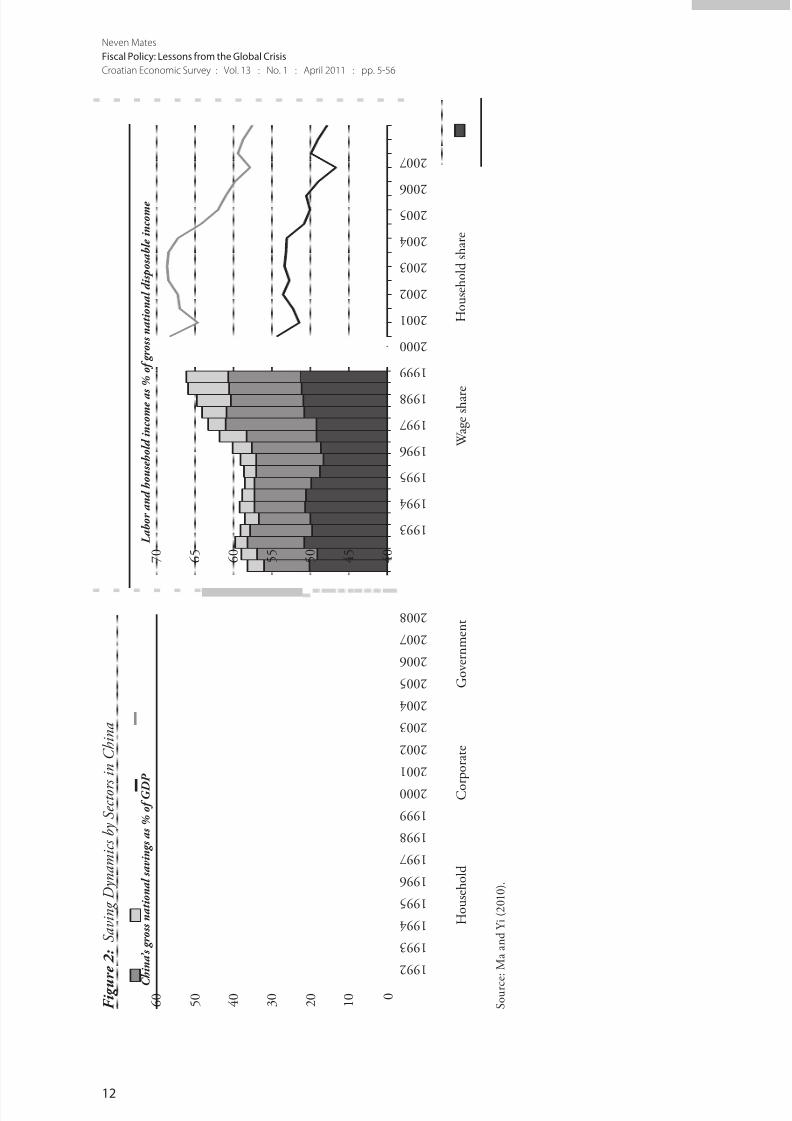
However, households’ savings as a share of GDP have been relatively stable
since China’s current account surplus started to grow. Te national savings
rate increased by some 15 percentage points of GDP between 1997 and 2008,
but most of this came from the government and the corporate sectors (Figure
2). Given that in China the government still controls a dominant part of the
corporate sector, one can look into the saving behavior of the corporate sector as
a part of, broadly taken, fiscal policy.
It has been noted that China has persistently followed the policy of not
transferring dividends of state-owned corporations to the budget, even when the
same companies were paying dividends to their private minority shareholders.
One can also safely assume that the rising surplus in the state-owned corporate
sector reflects China’s tight wage policy, as suggested by the declining wage share
in GDP. aken together, the budget in the narrow sense and the dividend and
wage policies in state-controlled corporations were, therefore, the main drivingforces of growing aggregate savings in China. In fact, in the absence of such a
tight overall fiscal stance in China, its exchange rate policy would soon have
created unsustainable inflationary pressures.4
4 IMF (2010a) attributed to corporate savings a critical role in propagating China’s current account surpluses.
8/22/2019 CES_13_Mates
http://slidepdf.com/reader/full/ces13mates 8/52
12
Neven Mates
Fiscal Policy: Lessons from the Global Crisis
Croatian Economic Survey : Vol. 13 : No. 1 : April 2011 : pp. 5-56
F i g u
r e 2 : S a v i n g D y n a m i c s b y S e c t o r s i n C h i n a
C h i n a ’ s g r o s s n a t i o n a l s a v i n g s a s % o f G D P
0 1 0 2 0 3 0 4 0 5 0 6 0
H o u s e h o l d
C o r p o r a t e
G o v e r n m e n t
L a b o r a n d h o u s e h o l d i n c o m e a s
% o f g r o s s n a t i o n a l d i s p o s a b l e i n c o m e
4 0 4 5 5 0 5 5 6 0 6 5 7 0
W a g e s h a r e
H o u s e h o l d s h a r e
1 9 9 2
1 9 9 3
1 9 9 4
1 9 9 5
1 9 9 6
1 9 9 7
1 9 9 8
1 9 9 9
2 0 0 0
2 0 0 1
2 0 0 2
2 0 0 3
2 0 0 4
2 0 0 5
2 0 0 6
2 0 0 7
2 0 0 8
1 9 9 3
1 9 9 4
1 9 9 5
1 9 9 6
1 9 9 7
1 9 9 8
1 9 9 9
2 0 0 0
2 0 0 1
2 0 0 2
2 0 0 3
2 0 0 4
2 0 0 5
2 0 0 6
2 0 0 7
S o u r c e : M a a n d Y i ( 2 0 1 0 ) .

8/22/2019 CES_13_Mates
http://slidepdf.com/reader/full/ces13mates 9/52
13
Neven Mates
Fiscal Policy: Lessons from the Global Crisis
Croatian Economic Survey : Vol. 13 : No. 1 : April 2011 : pp. 5-56
2.3 Fiscal Policy in Periphery Europe: Much Too Lax
Let us now turn to the EU and the euro area. Until recently, the general viewhas been that the euro area did not contribute to global imbalances, as the
aggregate current account deficit of the region was close to zero. Regarding the
current account imbalances within the euro area, the EU and the ECB originally
discounted them as unimportant.
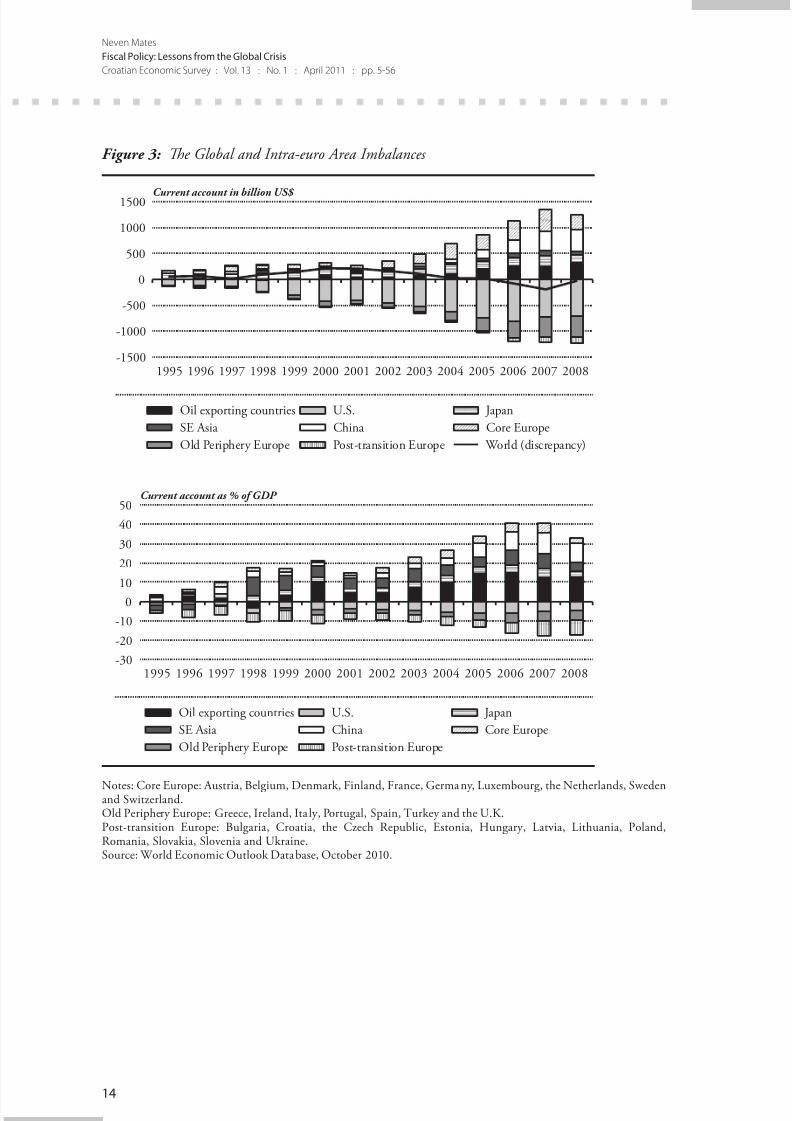
However, when the Greece crisis hit and then spread to other countries in what is
now called the euro area’s periphery, it became obvious that the current account
balances of individual countries do matter. Moreover, the imbalances within the
euro area appeared to be of a similar magnitude as those between the U.S. and
Asian countries (Figure 3).
As always, the rapid worsening of the current account imbalances was propagated
by a credit boom (Figure 4). In fact, the credit boom in the Old Europe periphery
was mind-boggling, surpassing by a large margin everything that was happening
in post-transition Europe. Amazingly, this credit boom in the euro area peripheralcountries was overlooked until the global crisis turned into the sovereign debt
crisis.
Did fiscal policies in the euro area periphery countries contribute to the imbalances,
or did they constrain them? While headline fiscal balances somewhat improved
after the introduction of the euro, this primarily reflected the transitory effects of
the credit boom. Structural balances in most of these countries have continuously
deteriorated since the introduction of the euro and have been substantially larger
than the Maastricht limit (Figure 5).5
5 Tis is based on the latest estimates of the output gap, which substantially differ from the previous estimates and
particularly real-time estimates, an issue that we will discuss later in this paper. In addition to overoptimisticestimates of potential output, Regling and Watson (2010) refer to another problem, which is the increasedelasticity of tax revenue during financial booms that al so result in overestimated structural balances.
8/22/2019 CES_13_Mates
http://slidepdf.com/reader/full/ces13mates 10/52
14
Neven Mates
Fiscal Policy: Lessons from the Global Crisis
Croatian Economic Survey : Vol. 13 : No. 1 : April 2011 : pp. 5-56
Figure 3: Te Global and Intra-euro Area Imbalances
Current account in billion US$
-1500
-1000
-500
0
500
1000
1500
1995 1996 1997 1998 1999 2000 2001 2002 2003 2004 2005 2006 2007 2008
Oil exporting countries U.S. Japan
SE Asia China Core Europe
Old Periphery Europe Post-transition Europe World (discrepancy)
Current account as % of GDP
-30
-20
-10
010
20
30
40
50
1995 1996 1997 1998 1999 2000 2001 2002 2003 2004 2005 2006 2007 2008
Oil exporting countries U.S. Japan
SE Asia China Core Europe
Old Periphery Europe Post-transition Europe
Notes: Core Europe: Austria, Belgium, Denmark, Finland, France, Germany, Luxembourg, the Netherlands, Swedenand Switzerland.Old Periphery Europe: Greece, Ireland, Ita ly, Portugal, Spain, urkey and the U.K.Post-transition Europe: Bulgaria, Croatia, the Czech Republic, Estonia, Hungary, Latvia, Lithuania, Poland,Romania, Slovakia, Slovenia and Ukraine.Source: World Economic Outlook Database, October 2010.

8/22/2019 CES_13_Mates
http://slidepdf.com/reader/full/ces13mates 11/52
15
Neven Mates
Fiscal Policy: Lessons from the Global Crisis
Croatian Economic Survey : Vol. 13 : No. 1 : April 2011 : pp. 5-56
Figure 4: Private Sector Credit Growth in Selected Groups of European Countries
20
40
60
80
100
120
140
Core Europe* Old periphery euro area** Post-transition Europe***
Private credit to GDP ratio in %
1 9 9
0
1 9 9
1
1 9 9
2
1 9 9
3
1 9 9
4
1 9 9
5
1 9 9
6
1 9 9
7
1 9 9
8
1 9 9
9
2 0 0
0
2 0 0
1
2 0 0
2
2 0 0
3
2 0 0
4
2 0 0
5
2 0 0
6
2 0 0
7
2 0 0
8
2 0 0
9
Notes: * Data for Sweden not available before 2001; data for Austria, Belgium and Luxembourg not available before1996; ** Data for Ireland not available before 1997; *** Data for Ukraine not available before 2001; data for Latvianot available before 1998.Core Europe: Austria, Belgium, Denmark, Finland, France, Germany, Luxembourg, the Netherlands, Sweden andSwitzerland.Old periphery euro area: Greece, Ireland, Italy, Portugal and Spain.Post-transition Europe: Bulgaria, Croatia, the Czech Republic, Estonia, Hungary, Latvia, Lithuania, Poland,Romania, Slovakia, Slovenia and Ukraine.
Sources: Eurostat; the IFS; central banks’ websites.
Figure 5: Structural Balances in the Euro Area Periphery
General government structural balance as % of potential GDP
-10
-8
-6
-4
-2
0
2
1995 1996 1997 1998 1999 2000 2001 2002 2003 2004 2005 2006 2007
Greece Ireland Italy Portugal Spain
Source: World Economic Outlook Database, November 2010.

8/22/2019 CES_13_Mates
http://slidepdf.com/reader/full/ces13mates 12/52
16
Neven Mates
Fiscal Policy: Lessons from the Global Crisis
Croatian Economic Survey : Vol. 13 : No. 1 : April 2011 : pp. 5-56
Fiscal policies in the periphery euro area countries, therefore, propagated the
current account imbalances in a similar manner as the fiscal policies in the
U.S. We will see later how by sustaining high public debt ratios, they became a
problem on their own in the third phase of the crisis.
3 Limited Fiscal Space When the Crisis Struck
Let us now turn to the question of how much fiscal space the policy-makers had
when the crisis struck.
Te concept of fiscal space has yet to be precisely defined, but it is supposed to
summarize the capability of fiscal policy to respond to negative shocks. Its main
components are the level of budget deficit and public debt at the beginning of the
crisis. Te larger they are the less fiscal space the country has to use fiscal policy
for ameliorating the shock.
However, the concept is broader than just numbers. It includes institutionalfactors, like the capacity for adjusting the budget to changing circumstances.
It also includes governments’ fiscal credibility. If investors and households have
confidence in the government, they will accept temporary fiscal relaxation
without taking offsetting actions, either by asking for higher risk premiums or
by changing their saving behavior.
Let us, however, focus on the public debt as the most comprehensive single
indicator of fiscal prudence. Once the crisis emerged, it became clear that the
advanced economies had entered the crisis in a much worse fiscal shape than one
would want. In fact, only then did everybody realize that the public debt to GDP
ratio of the G-7 economies had been on a permanently increasing path since the
early 1970s (Figure 6).

8/22/2019 CES_13_Mates
http://slidepdf.com/reader/full/ces13mates 13/52
17
Neven Mates
Fiscal Policy: Lessons from the Global Crisis
Croatian Economic Survey : Vol. 13 : No. 1 : April 2011 : pp. 5-56
Figure 6: General Government Gross Debt in G-7 Countries
0
50
100
150
200
250 In % of GDP
Canada France Germany
Italy Japan UK
US G-7
1 9
6 0
1 9
6 2
1 9
6 4
1 9
6 6
1 9
6 8
1 9 7 0
1 9 7 2
1 9 7 4
1 9 7 6
1 9 7 8
1 9 8 0
2 0 0 0
2 0 0 2
2 0 0 4
2 0 0 6
2 0 0 8
1 9 8 2
1 9 8 4
1 9 8 6
1 9 8 8
1 9 9 0
1 9 9 2
1 9 9 4
1 9 9 6
1 9 9 8
Source: World Economic Outlook Database, November 2010.
And this was a period of strong global growth, characterized by the absence oflarge wars, which in the past were the main factors driving the public debt ratios
up. Te persistent growth in debt ratios remains to be explained, although its
mechanics were simple. In recessions, the debt ratios went up, but in the upturns
they did not decline much, if at all.
And what is worse, the rising deficits and debt did not reflect the reduction in
taxes, which could have had the beneficial effect of strengthening the supply
response, but they reflected primary growth in expenditure (Cottarelli and
Schaechter, 2010).
In the euro area, the average public debt to GDP ratio has been well above the 60
percent Maastricht ceiling ever since the introduction of the euro; and it declined
only slowly from 72 percent of GDP in 1999 to 66 percent at the end of 2007, the
last pre-crisis year (Figure 7). However, if the statutory ceiling was supposed to
be 60 percent, then the average should have been around 40-50 percent. Also, if

8/22/2019 CES_13_Mates
http://slidepdf.com/reader/full/ces13mates 14/52
18
Neven Mates
Fiscal Policy: Lessons from the Global Crisis
Croatian Economic Survey : Vol. 13 : No. 1 : April 2011 : pp. 5-56
the monetary union takes its fiscal rule seriously, one would expect some visible
effort to bring the average down to that level. Tis did not happen.
Figure 7: Public Debt in the Euro Area Countries
010
2030405060708090
100In % of GDP
Euro area (16) Euro area (12) New euro area members (4)
1 9 9
5
1 9 9
6
1 9 9 7
1 9 9 8
1 9 9 9
2 0 0 0
2 0 0 1
2 0 0 2
2 0 0 3
2 0 0
4
2 0 0
5
2 0 0
6
2 0 0 7
2 0 0 8
2 0 0 9
2 0 1 0
2 0 1 1
2 0 1 2
2 0 1 3
2 0 1
4
2 0 1
5
Source: Eurostat.
Moreover, the two largest and most influential economies of the zone, Germany
and France, have continuously increased their debt ratios, breaching the
Maastricht ceiling early in the first decade of the 2000s (Figures 8 and 9).
Figure 8: Euro Area Countries with Rising Public Debt Ratios
40
50
60
70
8090
100
110
120
1995 1996 1997 1998 1999 2000 2001 2002 2003 2004 2005 2006 2007 2008 2009
In % of GDP
Germany Greece France Portugal
Source: Eurostat.

8/22/2019 CES_13_Mates
http://slidepdf.com/reader/full/ces13mates 15/52
19
Neven Mates
Fiscal Policy: Lessons from the Global Crisis
Croatian Economic Survey : Vol. 13 : No. 1 : April 2011 : pp. 5-56
Figure 9: Euro Area Countries with Declining Public Debt Ratios
20
40
60
80
100
120
140
1995 1996 1997 1998 1999 2000 2001 2002 2003 2004 2005 2006 2007 2008 2009
In % of GDP
Belgium Ireland Spain Italy Netherlands Austria Finland
Source: Eurostat.
Furthermore, as mentioned above, the fiscal space is not about numbers. It is also
about credibility and institutions. A massive reaction to the large budget deficit
in Greece was triggered when markets realized the scale of fiscal misreporting.
Later, the public realized that the misreporting had continued for several years
and had been known and tolerated by the EU institutions. Moreover, fiscal
gimmickry in the EU was not limited to Greece. As Koen and Van den Noord
(2005) documented, such practices were more widespread. All these factors have
unfavorably affected the fiscal credibility of the EU institutions.
Fiscal space available to advanced countries and particularly the euro area was,
therefore, limited when the crisis struck. Tis reduced their options not onlyfor implementing discretionary fiscal stimulus, but also for using the policy of
automatic stabilizers.
In Central and Southeast Europe, or the post-transition countries, public debt
ratios at the onset of the crisis were on the safe levels of about 30 percent of GDP
or less, with the exception of Hungary (66 percent) and Poland (45 percent). In
the Baltics, the ratios were even below 15 percent. Headline budget deficits did
not look particularly bad either, except in Hungary. However, a majority of the
8/22/2019 CES_13_Mates
http://slidepdf.com/reader/full/ces13mates 16/52
20
Neven Mates
Fiscal Policy: Lessons from the Global Crisis
Croatian Economic Survey : Vol. 13 : No. 1 : April 2011 : pp. 5-56
countries in the region entered the crisis with high current account deficits. Being
small open economies, this reduced their fiscal space as we will see below.
4 Fiscal Policy Responses During Three DifferentPhases of the Crisis and the IMF PolicyRecommendations
4.1 The Initial Stage of the Crisis
During the initial stage of the crisis until the Lehman Brothers bankruptcy,
policy-makers in the advanced economies focused primarily on relaxing
monetary policy, recapitalizing the financial system and preventing surge in
trade protectionism.
With regard to fiscal policy, the general line was to let automatic fiscal stabilizers
work as long as fiscal sustainability permits. Tere was no appetite for discretionary
fiscal relaxation.
Tis line of thinking was consistent with the traditional IMF doctrine that
discretionary fiscal measures are ineffective in fighting recessions for the following
reasons:
the effects usually come late, when the economy is already recovering;•
discretionary fiscal relaxation, therefore, often leads to a permanent fiscal•
deterioration as it is difficult to find expenditure that can be increasedonly temporarily;
there are usually no shovel-ready investment projects, which would satisfy•
speed and temporary criteria;
tax reduction, particularly if perceived as temporary, usually does not•
result in increased private spending;
the quality of ad-hoc spending measures is on average weak.•

8/22/2019 CES_13_Mates
http://slidepdf.com/reader/full/ces13mates 17/52
21
Neven Mates
Fiscal Policy: Lessons from the Global Crisis
Croatian Economic Survey : Vol. 13 : No. 1 : April 2011 : pp. 5-56
Te empirical research conducted by the Fund persistently supported this
doctrine. Except for the U.S., as a large and relatively closed economy, and to
a lesser extent the EU, the estimates of multipliers for budget spending were
generally low. For medium-sized economies, for budget expenditure they were
about 0.5 and for small countries about 0.3, and even lower for revenue measures
and transfers (Spilimbergo, Symansky and Schindler, 2009). Empirical research
also suggests that the multipliers could be negative if the country faces fiscal
sustainability issues. Te low values of estimated budget multipliers are explained
by the leaks of additional spending into the external current account and by
offsetting increases in private sector savings.
In line with such thinking, the discretionary fiscal policy response in the first
phase of the crisis was modest, as mentioned above. Among large economies,
only the U.S. implemented a modest tax rebate in 2008. Te fiscal policy stance
in the U.K. remained neutral throughout most of 2008. Te euro area countries
opposed the relaxation. Later, the total discretionary relaxation by the G-20
countries in 2008 was estimated at some 0.4 percent of GDP on average.
4.2 The New Management of the IMF Called for a Policy of
Fiscal Stimulus Early in 2008
Much to everybody’s surprise, the IMF started to change its position on
discretionary fiscal relaxation in early 2008. Namely, Strauss-Kahn (2008)
suggested that countries with fiscal space need to consider discretionary fiscal
relaxation as an instrument to fight recession.6
However, the response to Strauss-Kahn’s initiative remained weak throughout
most of 2008. Te main decision-makers of the G-8/G-20 at their meetings in
Hokkaido, Sao Paolo and Washington in that year either did not mention fiscal
6 “imely and targeted fiscal stimulus can add to aggregate demand in a way that supports private consumptionduring a critical phase. […] In a sense, medium-term fiscal policy is all about saving for a rainy day. It is now
raining.” […] “Countries that have fiscal and monetary space should consider now what it would take to lineup a temporary fiscal stimulus that can be deployed quickly if needed as events unfold in 2008” (Strauss-Kahn,2008).

8/22/2019 CES_13_Mates
http://slidepdf.com/reader/full/ces13mates 18/52
22
Neven Mates
Fiscal Policy: Lessons from the Global Crisis
Croatian Economic Survey : Vol. 13 : No. 1 : April 2011 : pp. 5-56
policy or took a highly cautious and non-committal line, stressing, instead, the
considerations of fiscal sustainability.
Moreover, the IMF continued to produce technical papers pointing to the limited
efficiency of discretionary measures. Tis particularly came to the surface in the
October 2008 World Economic Outlook and its update in November 2008,
both of which were published after the bankruptcy of Lehman Brothers. On that
occasion, the new Chief Economist of the Fund, Blanchard, having just assumed
this position, wrote that “[t]he findings are not very encouraging for proponents
of fiscal activism: fiscal multipliers – the impact of discretionary fiscal stimuluson output – are generally found to be quite low, and sometimes even to operate in
the wrong direction, especially in economies with high debt levels where a turn to
expansionary fiscal policy may raise doubts about long-term debt sustainability”
(IMF, 2008: XIII).
4.3 Discretionary Fiscal Relaxation After the Lehman Brothers
Te situation changed after the Lehman Brothers bankruptcy. As Manuel
Barroso argued at the time, “exceptional times call for exceptional measures”.
Following this thinking, the EU Commission approved a plan to boost demand
on November 26, 2008, suggesting its members implement a temporary fiscal
stimulus of about 1.5 percent of GDP. Te stimulus was supposed to remain
within the limits set by the Stability and Growth Pact (SGP), although by that
time it was no longer quite clear what this actually meant (European Commission,
2008).
In the U.S., after the new administration took over, Congress approved a large
stimulus package in the amount of US$ 787 billion in February 2009.
At the G-20 London Summit in April 2009, the “unprecedented and concerted
fiscal expansion” became the official line of the international community. With
fiscal expansion amounting to US$ 5 trillion by the end of the next year, this
8/22/2019 CES_13_Mates
http://slidepdf.com/reader/full/ces13mates 19/52
23
Neven Mates
Fiscal Policy: Lessons from the Global Crisis
Croatian Economic Survey : Vol. 13 : No. 1 : April 2011 : pp. 5-56
policy was expected to “save or create millions of jobs, which would otherwise
have been destroyed”, “raise output by 4 percent, and accelerate the transition to
a green economy” (G-20, 2009b).7 Te agreed fiscal stimulus among the G-20
countries was supposed to reach 2 percent of GDP in 2009 and 1.6 percent in
2010.
4.4 The IMF Support of Expansionary Policies
A few days after the London Summit, Strauss-Kahn (2009) pointed out thatthe G-20 group had accepted the proposal by the IMF (which he had promoted
already in January 2008) on the global fiscal stimulus. Moreover, he expressed
satisfaction that the Fund got a new role to monitor the implementation of the
agreed stimulus. Finally, he praised the G-20 decision to triple the IMF’s lending
capacity, pointing out that the IMF had already implemented reforms of its
lending facilities and announced additional reforms.
Te reforms of the IMF lending operations were indeed far-reaching. Tey
included:
two new, the largest ever, allocations of SDRs to provide member countries•
with unconditional liquidity in the amount of SDR 180 billion;
the introduction of the Flexible Credit Line (FCL), which would offer•
liquidity to countries with so-called “strong fundamentals” without
imposing ex-post conditionality on them;
reform of the Stand-By Arrangements (SBAs), the workhorse among the•
IMF lending instruments, which drastically increased the size of loans
(“the access”), accelerated the approval process and softened conditionality,
including eliminating structural performance criteria;
7 “We are undertaking an unprecedented and concerted fiscal expansion, which will save or create millions of jobs
which would otherwise have been dest royed, and that will, by the end of next year, amount to US$5 tri llion, ra iseoutput by 4 percent, and accelerate the transition to a green economy. We are committed to deliver the sca le ofsustained fiscal effort necessary to restore growth.” (G-20, 2009b).

8/22/2019 CES_13_Mates
http://slidepdf.com/reader/full/ces13mates 20/52
24
Neven Mates
Fiscal Policy: Lessons from the Global Crisis
Croatian Economic Survey : Vol. 13 : No. 1 : April 2011 : pp. 5-56
a similar reform of the Fund’s facility for low-income countries;•
an effective cut in the borrowing costs under all facilities by reducing•
high-access surcharges.
Most importantly, the reform widely opened the possibility of using the Fund’s
resources to finance budget deficits, which was a very rare practice in the past.
Previously known as a fiscally conservative institution, the IMF suddenly became
a proponent of discretionary fiscal relaxation. Tis was not left unnoticed
by policy-makers in many countries even if they did not enter into program
arrangements with the Fund. It encouraged those that were in favor of softening
fiscal policy and discouraged those that were against.
4.5 Confidence in the Success of Coordinated Fiscal Relaxation
Evaporated
However, when the crisis moved into its third phase, the appropriateness of the
discretionary relaxation appeared in a different light.
First, when Greece lost access to capital markets, the issue of a possible sovereign
default came to the forefront. Te status of “an advanced economy” in the past
implied a zero probability of default. Now this has suddenly changed.
Second, the deterioration in sovereign spreads did not remain limited to Greece, as
it soon spread to Ireland, Portugal and Spain. Tese three countries implemented
sizable stimulus packages in 2009 and early 2010: Ireland 1 percent, Spain
2.9 percent and Portugal 1 percent of GDP (European Central Bank, 2010).8
However, under market pressures, they had to quickly reverse the course.
Tird, analytical work in several institutions produced estimates about the
astonishing size of deterioration in public debt ratios in the advanced economies.
Te IMF staff estimated that between 2007 and 2015, public debt to GDP ratio
8 According to the IMF (2010b), Portugal ’s fisca l stimulus amounted to 1.5 percent of GDP.

8/22/2019 CES_13_Mates
http://slidepdf.com/reader/full/ces13mates 21/52
25
Neven Mates
Fiscal Policy: Lessons from the Global Crisis
Croatian Economic Survey : Vol. 13 : No. 1 : April 2011 : pp. 5-56
in these countries would deteriorate by some 39 percentage points, raising the
debt level to 110 percent of GDP (Figure 10). Te contribution of fiscal stimulus
to this increase was estimated at 4.5 percentage points, the contribution of
financial sector support at 3.2 percentage points and of below-the-line lending
at 4 percentage points. Te major part, however, almost three quarters of the
deterioration, would come from the adverse effects of the lower GDP growth
path (including its effect on revenue) and the interest rates (IMF, 2010c).
Figure 10: Debt Dynamics after the Crisis
General government gross debt in % of GDP, 2009 PPP-GDP weighted average
2030405060708090
100110120
G-20 advanced G-20 emerging* CEE* SEE**
1 9
9 4
1 9
9 5
1 9
9 6
1 9
9 7
1 9
9 8
1 9
9 9
2 0
0 0
2 0
0 1
2 0
0 2
2 0
0 3
2 0
0 4
2 0
0 5
2 0
0 6
2 0
0 7
2 0
0 8
2 0
0 9
2 0
1 0
2 0
1 1
2 0
1 2
2 0
1 3
2 0
1 4
2 0
1 5
Notes: * Incomplete data before 2000; ** Incomplete data before 2004.Source: World Economic Outlook Database, October 2010.
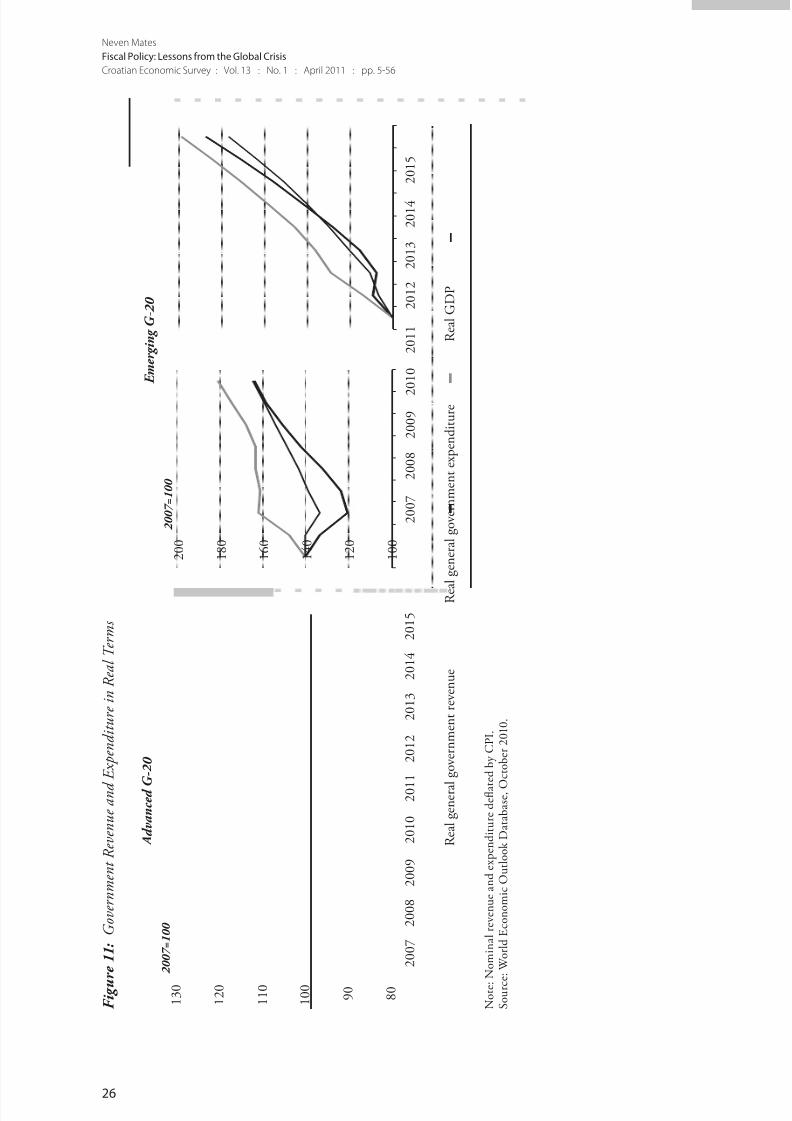
Te mechanics behind the debt explosion in the advanced G-20 countries are
easily seen from the developments in revenue and expenditure – the formerfalling by about 10 percent in real terms between 2007 and 2009 and the
latter increasing by 11 percent (Figure 11). Even assuming some decline in real
spending between 2012 and 2015 and a recovery of revenue in line with the GDP
path, these developments will inevitably lead to a huge deterioration in the debt
ratios.
8/22/2019 CES_13_Mates
http://slidepdf.com/reader/full/ces13mates 22/52
26
Neven Mates
Fiscal Policy: Lessons from the Global Crisis
Croatian Economic Survey : Vol. 13 : No. 1 : April 2011 : pp. 5-56
F i g u
r e 1 1 : G o v e r n m e n t R e v e n u e a n d
E x p e n d i t u r e i n R e a l T e r m s
A d v a n c e d G
- 2 0
8 0
9 0
1 0 0
1 1 0
1 2 0
1 3 0
2 0 0 7
2 0 0 8
2 0 0 9
2 0 1 0
2 0 1
1
2 0 1 2
2 0 1 3
2 0 1 4
2 0 1 5
R e a l g e n e r a l g o v e r n m e n t r e v e n u e
R e a l
e x p e n d i t u r e
g e n e r a l g o v e r n m e n t
R e a l G D P
E m e r g i n g G - 2 0
1 0 0
1 2 0
1 4 0
1 6 0
1 8 0
2 0 0
2 0 0 7
2 0 0 8
2 0 0 9
2
0 1 0
2 0 1 1
2 0 1 2
2 0 1 3
2 0 1 4
2 0 1 5
2 0 0 7 = 1 0 0
2 0 0 7 = 1 0 0
N o t e :
N o m i n a l r e v e n u e a n d e x p e n d i t u r e d e fl a t e d b y C P I .
S o u r c e : W o r l d E c o n o m i c O u t l o o k D a t a b a s e , O
c t o b e r 2 0 1 0 .
8/22/2019 CES_13_Mates
http://slidepdf.com/reader/full/ces13mates 23/52
27
Neven Mates
Fiscal Policy: Lessons from the Global Crisis
Croatian Economic Survey : Vol. 13 : No. 1 : April 2011 : pp. 5-56
Te IMF also estimated the adjustments in primary balances that the G-20
countries would need to implement so as to reverse the debt ratio back to 60
percent of GDP by 2030, or to the pre-crisis level if lower. Te adjustment in
the primary balances would need to be achieved by 2020, and then the primary
balances would remain constant. Te adjustment needs estimated in this way for
most G-20 advanced economies are huge, some 9.5 percentage points of GDP on
average, measured relative to the projected primary balances in 2010.9
Similar results were obtained by Cecchetti, Mohanty and Zampolli (2010), who
provided longer projections for selected advanced economies. By assuming thatthe revenue ratio and non-age-related spending would remain constant relative
to GDP and taking the EU and the U.S. Congressional Budget Office (CBO)
projections for age-related spending, the baseline projection shows a dramatic
deterioration in the debt ratios over the next 30 years, bringing them for most
countries above 300 percent of GDP. Even assuming that age-related spending is
kept constant, which would require radical reforms, and assuming some modest
adjustments in other spending, several countries will still face explosive debtdynamics, including the U.S., the U.K., Japan and to a lesser extent Spain,
Portugal, Ireland and France.
Finally, nothing describes better the change in attitude toward fiscal relaxation
than the point made by richet (2010) that “[w]ith hindsight, we see how
unfortunate was the oversimplified message of fiscal stimulus given to all
industrial economies under the motto: ‘stimulate’, ‘activate’, ‘spend’!”.
Once the prospective deterioration in public debt and the implied risks of
sovereign defaults became evident to policy-makers, investors and the general
public, it undermined their confidence. As a result, the public debt became a
drag on recovery.
9 Interestingly enough, Italy, despite its high starting level of debt, would have to adjust the primary balance by onlyhalf, some 4 percentage points, owing to its low starting primary deficit and the fact that it did not implement anyfiscal stimulus during the crisis.

8/22/2019 CES_13_Mates
http://slidepdf.com/reader/full/ces13mates 24/52
28
Neven Mates
Fiscal Policy: Lessons from the Global Crisis
Croatian Economic Survey : Vol. 13 : No. 1 : April 2011 : pp. 5-56
4.6 Fiscal Policy Response in the CEE-SEE Region
So far we have focused on the advanced economies. Emerging market economies,in general, did much better during the crisis. However, this was not the case with
the post-transition European economies. Most of them entered the crisis with
large external vulnerabilities.
In terms of output growth, the SEE and CEE regions were hit by the crisis
more than other groups of countries (able 1). Within that region, the Baltics
were affected the most, followed by the SEE countries. Te factors behind such
unfavorable performance were manifold. One of them was the high degree
of integration in global trade and another was that the crisis triggered a long-
overdue adjustment in their external current account positions.
Table 1: Growth Shock in the CEE-SEE Countries (GDP Growth Rate)
2007 2009 2009/2007
G-20 advanced 2.3 -3.2 -5.4
G-20 emerging 9.7 3.5 -5.7CEE 6.4 -2.7 -8.5
SEE 6.2 -5.9 -11.4
Czech Republic 6.1 -4.1 -9.7
Slovakia 10.6 -4.7 -13.8
Slovenia 6.8 -7.8 -13.7
Poland 6.8 1.7 -4.8
Estonia 6.9 -13.9 -19.5
Latvia 10.0 -18.0 -25.4
Lithuania 9.8 -14.8 -22.4
Hungary 1.0 -6.3 -7.2Bulgaria 6.2 -5.0 -10.5
Croatia 5.5 -5.8 -10.7
Romania 6.3 -7.1 -12.7
Serbia 6.9 -30 -9.3
Source: World Economic Outlook Database, October 2010.
8/22/2019 CES_13_Mates
http://slidepdf.com/reader/full/ces13mates 25/52
29
Neven Mates
Fiscal Policy: Lessons from the Global Crisis
Croatian Economic Survey : Vol. 13 : No. 1 : April 2011 : pp. 5-56
F i g u
r e 1 2 : F i s c a l E x p a n s i o n i n C E E a n d S E E C o u n t r i e s 2 0 0 7 - 2 0 0 9 a n d t h e S t a r t i n g C o n d i t i o n s
S l o v a k i a
S l o v e n i a
P o l a n d
E s t o n i a
C r o a t i a
C z e c h R
e p .
L a t v i a
L i t h u a n i a
H u n g a r y
B u l g a r i a
R o m a n i a
S e r b i a
- 1 0
- 8 - 6 - 4 - 2 0 2
G e n e r a l g o v e r n m e n t d e b t i n 2
0 0 7 , i n % o
f G D P
S l o v a k i a
S l o v e n i a
P o
l a n d
E s t o n i a
C
r o a t i a
C z e c h R e p .
L a t v i a
L i t h u a n i a
H u n g a r y
B u l g a r i a
R o m a n i a
S e r b i a
- 1 0 - 8 - 6 - 4 - 2 0 2
- 6
- 4
- 2
0
2
4
G e n e r a l g o v e r n m e n t b a l a n c e i n 2 0 0 7 , i n % o
f G D P
C
h a n g e o f g e n e r a l g o v e r n m e n t b a l a n c e
i n p e r i o d 2 0 0 9 - 2 0 0 7 , i n % o
f G D P
C h a n g e o f g e n e r a l g o v e r n m e n
t b a l a n c e
i n p e r i o d 2 0 0 9 - 2 0 0 7 , i n % o f G D P
S o u r c e : W o r l d E c o n o m i c O u t l o o k D a t a b a s e , O
c t o b e r 2 0 1 0 .

8/22/2019 CES_13_Mates
http://slidepdf.com/reader/full/ces13mates 26/52
30
Neven Mates
Fiscal Policy: Lessons from the Global Crisis
Croatian Economic Survey : Vol. 13 : No. 1 : April 2011 : pp. 5-56
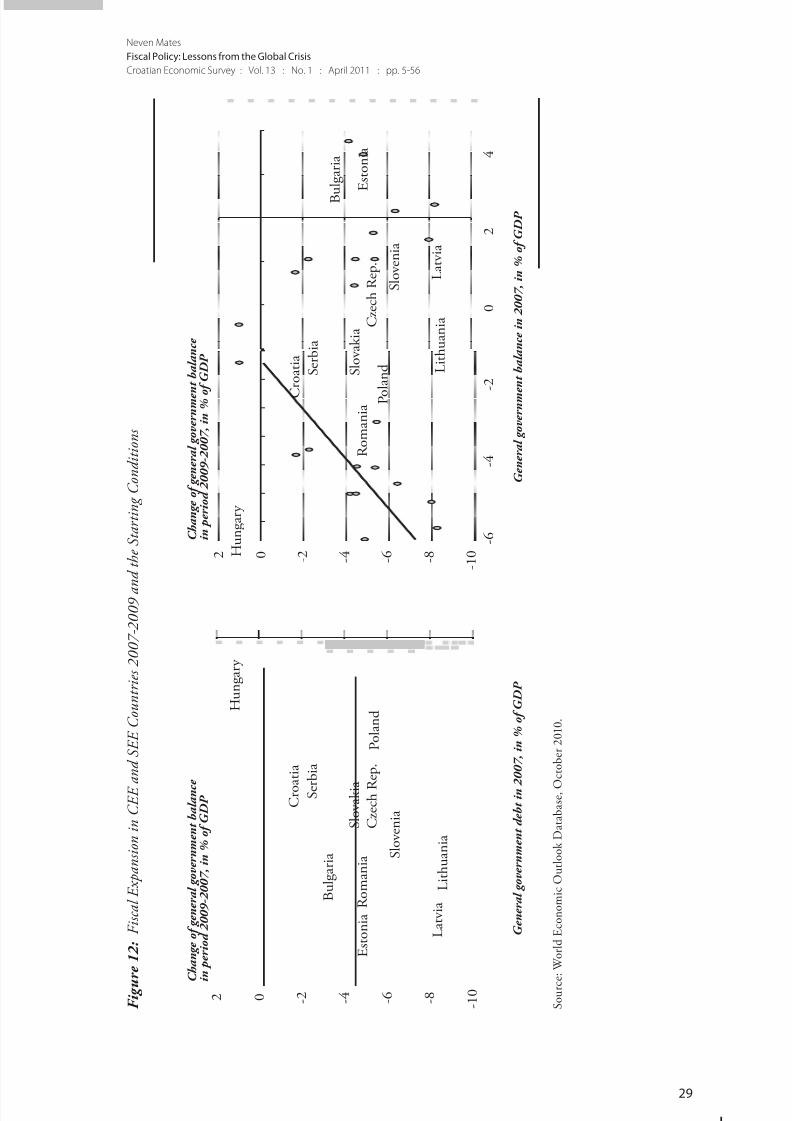
Exposed to such a shock, how did fiscal policy in these countries react?
Te picture that arises is that the actual scale of fiscal expansion heavily dependedon the initial fiscal conditions, i.e., the budget deficit and the public debt ratio
(Figure 12). Te better they were at the start, the more fiscal expansion the
countries have allowed.
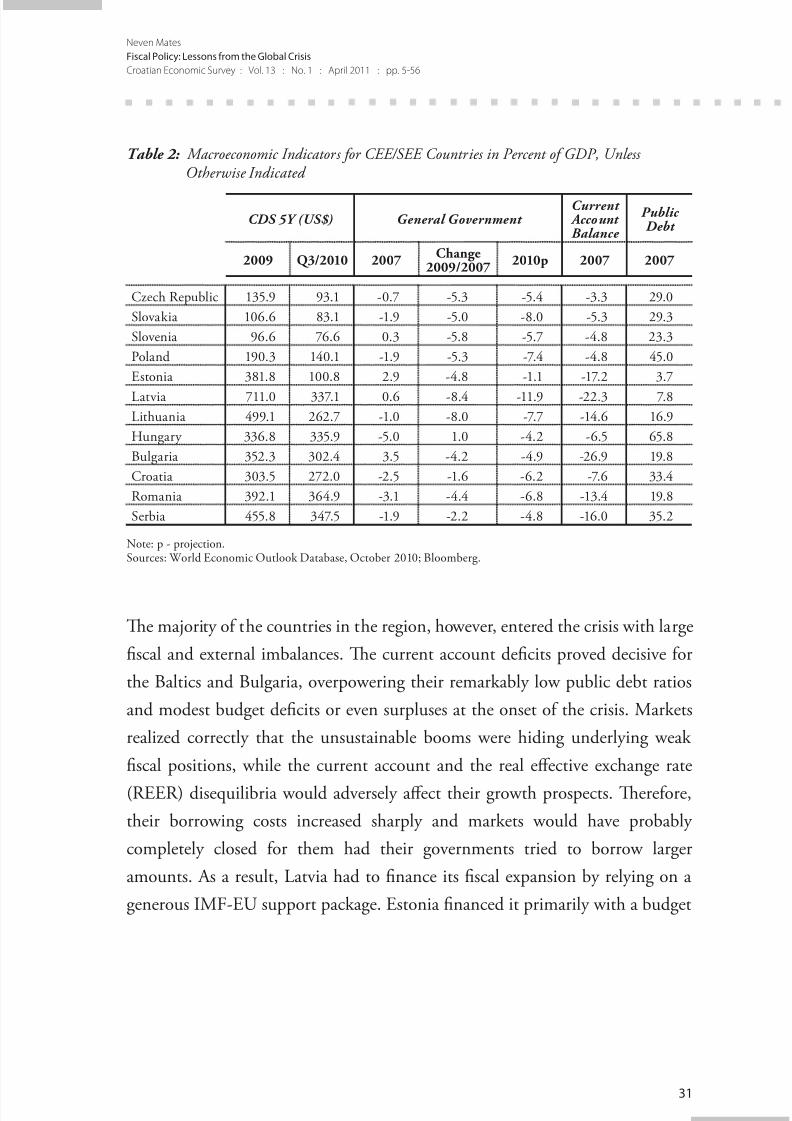
However, only the best performers managed to finance the fiscal expansion
without triggering an adverse market reaction. Te relevant performance
indicators at the onset of the crisis appear to be a low public debt ratio (below
30 percent of GDP), a low budget deficit (less than 2 percent of GDP) and a low
current account deficit (below 6 percent) (able 2). Countries satisfying these
criteria were able to let their deficits expand and could even implement additional
stimulus without seeing their sovereign spreads substantially deteriorate relative
to the pre-crisis time. Tis was the case with the Czech Republic, Slovakia and
Slovenia. Between 2007 and 2009, their headline deficits expanded between 4.4
percentage points and 6.4 percentage points, of which about one third came
from discretionary stimulus. Nevertheless, their sovereign and Credit Default
Swap (CDS) spreads remained quite low, recently below 100 basis points.
Poland has been a kind of a border case, as it entered the crisis with a higher
public debt and a larger budget deficit compared to the previously mentioned
three countries. It relaxed its fiscal policy by more than 5 percentage points of
GDP between 2007 and 2009, of which a large part was discretionary; but as a
result, it experienced an increase in its sovereign spreads substantially above thelevel of the best performers. Poland also had to seek assurance for investors by
arranging a Flexible Credit Line with the IMF.
8/22/2019 CES_13_Mates
http://slidepdf.com/reader/full/ces13mates 27/52
31
Neven Mates
Fiscal Policy: Lessons from the Global Crisis
Croatian Economic Survey : Vol. 13 : No. 1 : April 2011 : pp. 5-56
Table 2: Macroeconomic Indicators for CEE/SEE Countries in Percent of GDP, UnlessOtherwise Indicated
CDS 5Y (US$) General Government Current AccountBalance
PublicDebt
2009 Q3/2010 2007Change
2009/20072010p 2007 2007
Czech Republic 135.9 93.1 -0.7 -5.3 -5.4 -3.3 29.0
Slovakia 106.6 83.1 -1.9 -5.0 -8.0 -5.3 29.3
Slovenia 96.6 76.6 0.3 -5.8 -5.7 -4.8 23.3
Poland 190.3 140.1 -1.9 -5.3 -7.4 -4.8 45.0
Estonia 381.8 100.8 2.9 -4.8 -1.1 -17.2 3.7
Latvia 711.0 337.1 0.6 -8.4 -11.9 -22.3 7.8
Lithuania 499.1 262.7 -1.0 -8.0 -7.7 -14.6 16.9
Hungary 336.8 335.9 -5.0 1.0 -4.2 -6.5 65.8
Bulgaria 352.3 302.4 3.5 -4.2 -4.9 -26.9 19.8
Croatia 303.5 272.0 -2.5 -1.6 -6.2 -7.6 33.4
Romania 392.1 364.9 -3.1 -4.4 -6.8 -13.4 19.8
Serbia 455.8 347.5 -1.9 -2.2 -4.8 -16.0 35.2
Note: p - projection.Sources: World Economic Outlook Database, October 2010; Bloomberg.
Te majority of the countries in the region, however, entered the crisis with large
fiscal and external imbalances. Te current account deficits proved decisive for
the Baltics and Bulgaria, overpowering their remarkably low public debt ratios
and modest budget deficits or even surpluses at the onset of the crisis. Markets
realized correctly that the unsustainable booms were hiding underlying weak
fiscal positions, while the current account and the real effective exchange rate
(REER) disequilibria would adversely affect their growth prospects. Terefore,
their borrowing costs increased sharply and markets would have probably
completely closed for them had their governments tried to borrow larger
amounts. As a result, Latvia had to finance its fiscal expansion by relying on a
generous IMF-EU support package. Estonia financed it primarily with a budget

8/22/2019 CES_13_Mates
http://slidepdf.com/reader/full/ces13mates 28/52
32
Neven Mates
Fiscal Policy: Lessons from the Global Crisis
Croatian Economic Survey : Vol. 13 : No. 1 : April 2011 : pp. 5-56
cash reserve, stemming from previous surpluses.10 Only Lithuania reportedly
managed to finance the deficit from external and domestic non-official sources,
but its sovereign spread, nevertheless, increased to high levels. Bulgaria had to
keep its deficit below 1 percent of GDP in 2009.
Te SEE countries and Hungary entered the crisis with a combination of cyclically
high budget deficits, higher debt ratios and large current account imbalances.
As a result, they could not entertain the option of letting automatic stabilizers
operate, not to mention discretionary stimulus, without running into financing
risks. Some of them had to rely on IMF assistance (Hungary, Romania, Serbiaand Bosnia and Herzegovina).11
4.7 How to Judge Fiscal Policy Reaction on the Global Level?
Was the policy of discretionary stimulus and even of letting the automatic
stabilizers operate fully the best response? o what extent did it help in smoothing
the output variability as opposed to the adverse effects on fiscal sustainability
and possibly macroeconomic imbalances?12 While policy-makers were obviously
under strong pressure to act during the peak of the crisis, the question is whether
discretionary fiscal relaxation in some countries did more harm than good.
After all, the mainstream of economic theory pointed toward the weak effects of
10 Estonia’s fiscal balance worsened by close to 5 percent of GDP in 2007-2009, but it remained within the Maastrichtlimit; this despite a cumulative GDP drop of close to 20 percent in that period. Surprisingly, expenditure at thesame time went up in nominal and real terms. Tis was achieved by a plethora of one-time revenue measures,amounting to 3.2 percent of GDP and by redirecting mandatory pension contributions to the budget, yieldinganother 0.6 percent of GDP. (Lithuania and Latvia implemented such a measure, which is surprisingly in line
with the EU budget rules.) Te EU at the same time accelerated disbursement of its assistance to Estonia, whichthen reached 6.7 percent of GDP in 2009 and further increased to 8.3 percent of GDP in 2010, compared with3 percent of GDP before the crisis. All these factors raise the issue of sustainability. See Purfield and Rosenberg(2010).
11 Hungary is the only country that actually improved its headline fiscal balance during the crisis, in line with thetough program agreed with the IMF before the cri sis struck (and before the IMF became soft). It is set to have oneof the highest primary balances in 2010.
12 Troughout this paper, we do not include the discretionary fisca l adjustment government measures that were
used to shore up the banking system. Most countries, in any case, kept these interventions outside of the budget.Discretionary stimulus is understood only as measures aimed at increasing government spending or cuttingtaxes.

8/22/2019 CES_13_Mates
http://slidepdf.com/reader/full/ces13mates 29/52
33
Neven Mates
Fiscal Policy: Lessons from the Global Crisis
Croatian Economic Survey : Vol. 13 : No. 1 : April 2011 : pp. 5-56
fiscal expansion in circumstances when public debt is high. Tese questions will
obviously be hot topics among economists in the years to come.
If judged by the views expressed at the G-20 Summit in Pittsburg in September
2009, fiscal relaxation was an unqualified success.13 Te triumphant tone of
the new policy was best manifested in a statement by the then new British PM
Gordon Brown, who wrote on the occasion of the Summit that the total fiscal
response (this included both the automatic and discretionary stimulus) was 5
percentage points both in 2008 and 2009. On that occasion, he also claimed that
the multiplier for discretionary spending might have been as high as 2 (G-20,2009d).
Te above estimates suggest that the contribution of fiscal relaxation was large,
but they apply to total fiscal expansion and not only to the discretionary part.
Te latter amounted to about a third of the total fiscal expansion in the G-20
countries during these two years (able 3). Whether the marginal contribution of
the discretionary measures over and above the effects of the automatic stabilizers
has made a material difference in output dynamics will surely remain a popular
academic subject in the years to come.
Table 3: G-20 General Government Balance 2007-2009 (In Percent of GDP)
2007 2008 2009 2007-2009
G-20 -0.9 -2.7 -7.5
Advanced -1.7 -4.3 -9.4
Emerging 0.3 -0.4 -4.8
Fiscal expansion
G-20 1.8 4.8 6.6
Advanced 2.6 5.1 7.7
Emerging 0.7 4.4 5.1
G-20 discretionary adjustment 0.4 2 2.4
In percent of total 22 42 36
Source: IMF (2010c).
13 “Our national commitments to restore growth resulted in the largest and most coordinated fiscal and monetarystimulus ever undertaken. We acted together to increase dramatically the resources necessary to stop the crisisfrom spreading a round the world.” (G-20, 2009c).
8/22/2019 CES_13_Mates
http://slidepdf.com/reader/full/ces13mates 30/52
34
Neven Mates
Fiscal Policy: Lessons from the Global Crisis
Croatian Economic Survey : Vol. 13 : No. 1 : April 2011 : pp. 5-56
Most observers, however, consider that the discretionary stimulus was much less
important than the combined effect of automatic stabilizers and central banks’
measures that led to huge expansions in their balance sheets, which were never
experienced in the past (Rogoff, 2010). Moreover, we know that the discretionary
stimulus added to the sovereign debt problem, directly and indirectly via the
credibility channel. When implemented by countries with the current account
problem, it preserved and possibly exacerbated the global imbalances and
postponed the inevitable adjustment in their real effective exchange rates.
Based on the above considerations, a following preliminary assessment might besuggested.
Discretionary fiscal relaxation was a mixed blessing at best. It was the most
appropriate response in countries with sound starting fiscal and external current
account positions, like China and oil-producing countries and perhaps Germany.
In such countries, automatic and discretionary fiscal expansion compensated
for the weak private demand while at the same time correcting the underlying
imbalances.
In the U.S., the case is less clear, given its entrenched current account and fiscal
problem. On balance, perhaps the case could still be made for the stimulus given
the high risk of deep recession as was perceived at the time and the fact that
the U.S. automatic stabilizers are weak. Tis reflects the low share of federal
government spending in GDP and the balanced budget rules in most states.
At the same time, the run for safety prevented the US$ from adjusting to amore realistic level, which would facilitate correction in net exports, which left
fiscal policy as the only available instrument. On the negative side, the stimulus
contributed to a postponement in the adjustment of the real effective exchange
rate. Moreover, once the prospective large deterioration in the public debt ratio
became known, this probably strengthened the Ricardian effect in the behavior
of households. Tey realized that large fiscal correction is unavoidable down the
road.
8/22/2019 CES_13_Mates
http://slidepdf.com/reader/full/ces13mates 31/52
35
Neven Mates
Fiscal Policy: Lessons from the Global Crisis
Croatian Economic Survey : Vol. 13 : No. 1 : April 2011 : pp. 5-56
Ten there were countries in which the discretionary relaxation was clearly wrong.
Providing fiscal stimulus while already being in a precarious fiscal position is a
policy of asking for trouble. Some examples are Portugal, Spain and Ireland, the
countries that soon had to reverse their course under market pressures. Te U.K.,
although not facing immediate market pressures, also had to take measures to
calm markets in the context of the threatening public debt dynamics. On the
other hand, the EU countries that did not provide stimulus, like Italy, clearly
benefited from abstaining.
Te IMF’s willingness to readily finance budget deficits of the countries thatentered the crisis with weak fiscal and current account positions (like Latvia,
Romania and Serbia) without requiring a substantial adjustment already in
2009 was also questionable. Was this an optimal strategy for these countries?
Postponing fiscal adjustment in such countries had the unfortunate effect of
delaying the adjustment in the real effective exchange rate and the current
account position. Te purpose of such programs seemed to be more to support
global demand via so-called coordinated fiscal relaxation than meeting theparticular needs of these countries. Te weaknesses of such an approach became
visible in 2010 when the programs had to be substantially tightened, but by then
credibility suffered. Te same applies to the Fund’s encouragement to Poland
to implement fiscal stimulus by using the FCL, which ended with Poland now
facing a substantial fiscal problem.14
Finally, there were countries that entered the crisis in a strong position and
implemented stimulus while avoiding a worsening in their financing costs. Being
in most cases small and open economies, fiscal expansion did not help them
much in terms of lowering the output variability. Moreover, for those among
them that operate in a flexible exchange rate framework, it is not clear that fiscal
versus monetary relaxation was a better choice. But looking forward, as a result
of the fiscal relaxation, these countries will face a more difficult adjustment. Te
previously mentioned best performers in the CEE region belong to this group.
14 Despite completely avoiding a recession, Poland´s deficit hit 7.5 percent of GDP in 2010 and the economy is on thepath to breach its legislated public debt limits (IMF, 2010c).
8/22/2019 CES_13_Mates
http://slidepdf.com/reader/full/ces13mates 32/52
36
Neven Mates
Fiscal Policy: Lessons from the Global Crisis
Croatian Economic Survey : Vol. 13 : No. 1 : April 2011 : pp. 5-56
Let us now address the issue of automatic stabilizers. Did the countries that did
not let them operate fully make a mistake, assuming they did not face financing
constraints?
o answer this question, the following is of importance. Te concept of automatic
stabilizers operates well in situations when output oscillates around a more or less
stable potential growth path. Assuming that the starting expenditure path is
consistent with a prudent debt deficit target over a cycle, in the case of a negative
demand shock, governments can leave the expenditure path unchanged despite
the cyclical drop in revenue. By doing this, they avoid disruptive spending cutsand even somewhat smooth the output path. As the output returns to the potential
path and temporarily surpasses it, the higher deficit during the recession is offset
and the debt target achieved.
However, the concept falls apart when the crisis causes not only a temporary
deviation of output from the potential output path, but also results in a
permanent loss of level and growth in the potential output. Keeping the
expenditure path unchanged in such circumstances would result in a public
debt explosion and automatic stabilizers might become automatic destabilizers.
In such circumstances, the previously set expenditure path needs to be revised
down. Moreover, the usual methods for estimating structural balances in such a
situation become highly unstable, as demonstrated by large ex-post corrections
of the output gap (see Appendix 1).
Given that the current crisis will have such a profound effect on potential output,countries that immediately started to contain spending did not make a mistake.
In fact, they positioned themselves better for the recovery.
5 The Challenge of Fiscal Adjustment
Te effects of the crisis, superimposed on the already existing fiscal pressures
stemming from population aging, has pushed budgets in advanced economies on

8/22/2019 CES_13_Mates
http://slidepdf.com/reader/full/ces13mates 33/52
37
Neven Mates
Fiscal Policy: Lessons from the Global Crisis
Croatian Economic Survey : Vol. 13 : No. 1 : April 2011 : pp. 5-56
a path that will raise public debt ratios to unprecedented levels. Even in the best of
circumstances, growth will slow down, as the high level of debt will affect interest
rates over the next 20 years. For advanced economies, the IMF estimates suggest
the effect of higher interest rates on the GDP growth rate might be somewhere
in the range of 0.5-0.8 percentage points.15 Reinhart and Rogoff (2010) suggest a
drop in the potential growth rate of 1 percentage point or more. However, as the
fiscal retrenchment will be accomplished not only by expenditure cuts, but also
by increased taxation, this will create an additional drag on growth. Needless to
say, lower growth in the advanced economies, particularly in Europe, will affect
growth prospects in the CEE/SEE region.
5.1 Could a High Level of Public Debt Be Tolerated?
Let us here reply to arguments that high debt levels might perhaps be a less
worrisome issue.
Te fact that similar debt ratios were reached in the past, usually during wars,
should not be seen as providing much comfort. First, their wartime character
provided prima facie evidence of exceptional circumstances and not of weak fiscal
discipline. Second, the wartime deficits were often supported by forced savings
via rationing of consumer goods and by patriotic campaigns. Tird, such debt
levels were achieved at a time when global capital mobility was much weaker
than today. Fourth, they were achieved mainly by countries that were important
financial centers and whose currencies played a reserve currency role at the time,
like the U.S. and the U.K.
Japan’s public debt which is often reported as amounting to 200 percent of GDP
should not provide comfort either. First, there is a statistical peculiarity that Japan
reports gross public debt, which includes central government securities held by its
various agencies and local governments. Adjusted for this, i.e., calculating only
15 Te lower side of the range is taken from Cottarel li and Schaechter (2010). Te higher side follows from theestimated effect of debt on growth in Kumar and Woo (2010).

8/22/2019 CES_13_Mates
http://slidepdf.com/reader/full/ces13mates 34/52
38
Neven Mates
Fiscal Policy: Lessons from the Global Crisis
Croatian Economic Survey : Vol. 13 : No. 1 : April 2011 : pp. 5-56
debt held by the private sector, its debt ratio is actually almost half this amount.
Second, the stability of Japan’s debt is supported by a high domestic savings rate
and a strong preference of households for domestic financial instruments. Tese
characteristics are not shared by other countries.
Regarding the reserve currency argument, the U.S. now has an even stronger
monopoly, as concerns about the euro will not disappear soon. In the absence
of a credible alternative, large movements out of the dollar are difficult to
imagine. Tis could, indeed, facilitate continuing large budget deficits in the
U.S. However, this cannot be said for other financial-center countries; whichexplains why the U.K., which still enjoys very low long-term interest rates, has,
nevertheless, undertaken an early and painful fiscal adjustment.
Most importantly, with public debt reaching exceptional levels, sovereign
defaults will be seen as much more likely than in the last several decades.
Markets now perceive the possibility that even an advanced economy might
default. Such concerns are amplified in the situation in which high deficit and
debt are combined with weak growth prospects, particularly in countries facing
competitiveness issues while being members of a monetary union or operating in
a fixed-exchange-rate framework.
And finally, the possibility of global recession and crisis in the future cannot be
excluded. If the next one happens with public debts at elevated levels, the risk
of instability will be enormous. Fiscal consolidation in advanced economies is,
therefore, a necessity.
5.2 Reform of Institutional Frameworks for Conducting FiscalPolicy
Achieving such large consolidation will be a difficult task. Political tensions will
increase compared to the period of the generally prosperous last decades. Tese
pressures will arise not only in individual countries, but also in monetary unions,

8/22/2019 CES_13_Mates
http://slidepdf.com/reader/full/ces13mates 35/52
39
Neven Mates
Fiscal Policy: Lessons from the Global Crisis
Croatian Economic Survey : Vol. 13 : No. 1 : April 2011 : pp. 5-56
and will put their institutions to the test. In several EU countries, debt to private
investors, both resident and non-resident, is now being rapidly replaced by debt
to official creditors, including the ECB. While this reduces the risk of default
toward the private sector, it increases the risk of conflict within the union if such
debt eventually has to be restructured.
Terefore, the current frameworks for decision making on fiscal policy will have
to be revised, both at national levels and in monetary unions. Without going into
details here, we can safely say that fiscal rules and special fiscal institutions, like
fiscal councils and boards, will become more important.
5.3 The Implications for the CEE and SEE Region
Te fiscal prospects of the majority of the CEE and SEE countries are also
challenging, despite lower levels of debt ratios. In the Baltics, projected fiscal
deficits for 2010 are high and the underlying deficits might be even higher owing
to the temporary nature of many measures implemented over the last two years.
Despite large output drops, these countries have not succeeded in reducing
budget expenditure in real terms, except in Latvia; but even there they remained
substantially above the pre-crisis 2007 level (Figure 13). In fact, the only country
in the CEE/SEE region that managed to reduce real government spending for
four years in a row was Hungary. Te prospects for the Baltics remain, therefore,
quite difficult.
Regarding the best performers in the CEE/SEE region (the Czech Republic,
Slovakia and Slovenia), they will see only a moderate increase in their public debt
ratios. Still, to reverse those back to the pre-crisis level would require a midsize
fiscal adjustment in primary balances of some 4 percentage points of GDP.
Poland’s adjustment will, however, be more challenging, requiring measures of
about 7 percentage points of GDP (able 4).

8/22/2019 CES_13_Mates
http://slidepdf.com/reader/full/ces13mates 36/52
40
Neven Mates
Fiscal Policy: Lessons from the Global Crisis
Croatian Economic Survey : Vol. 13 : No. 1 : April 2011 : pp. 5-56
F i g u
r e 1 3 : N o m i n a l a n d R e a l B u d g e t
E x p e n d i t u r e i n C E E a n d S E E C o u n t r i e s
G e n e r a l g o v e r n m e n t t o t a l e x p e n d i t u r e , n o m i n a l , 2 0 0 7 = 1 0 0
6 0
7 0
8 0
9 0
1 0 0
1 1 0
1 2 0
1 3 0
1 4 0
2 0 0 5
2 0 0 6
2 0 0 7
2 0 0 8
2 0 0 9
2 0 1 0
2 0 1 1
C z e c h R e p u b l i c
S l o v a k i a
S l o v e n i a
P o l a n d
E s t o n i a
L a t v i a
L i t h u a n i a
H u n g a r y
B u l g a r i a
C r o a t i a
R o m a n i a
S e r b i a
G e n e r a l g o v e r n m e n t t o t a l e x p e n d i t u r e , r e a l , 2 0 0 7 = 1 0 0
7 0
8 0
9 0
1 0 0
1 1 0
1 2 0
1 3 0
2 0 0 5
2 0 0 6
2 0 0 7
2 0 0 8
2 0 0 9
2 0 1 0
2 0 1 1
S o u r c e : W o r l d E c o n o m i c O u t l o o k D a t a b a s e , O
c t o b e r 2 0 1 0 .

8/22/2019 CES_13_Mates
http://slidepdf.com/reader/full/ces13mates 37/52
41
Neven Mates
Fiscal Policy: Lessons from the Global Crisis
Croatian Economic Survey : Vol. 13 : No. 1 : April 2011 : pp. 5-56
Table 4: Starting Primary Balance and Necessary Adjustment in Post-transition Countries (InPercent of GDP)
Cyclically adjusted primarybalance 2010
Adjustment to achieveprudent debt limit in 2030
Czech Republic -2.3 3.7
Slovakia -3.1 4.1
Slovenia -3.2 4.0
Poland -4.5 7.2
Estonia 1.1 -0.1
Latvia -7.1 8.8
Lithuania -4.6 8.0
Hungary 3.2 -1.3Bulgaria 0.7 -0.8
Croatia -0.8 -
Romania -1.4 2.1
Serbia -4.6 -
Sources: Bloomberg; World Economic Outlook Database, October 2010; IMF (2010c).
In SEE, the projected debt ratios of some 30 percent of GDP are around or lower
than the reasonably safe level for emerging market economies, except in Croatia.However, the SEE region still faces high current account deficits, despite the sharp
drop in domestic demand. Estimating an underlying current account position is
difficult in the current circumstances, but it is likely that further adjustment will
be needed. Tis suggests that the recovery will be slow, as moving resources to
tradable sectors takes time. Te main risk is that some countries in the region find
themselves in a vicious circle of high sovereign spreads causing high borrowing
costs for both the budget and the private sector, which then translates into lowgrowth and then further deterioration in the fiscal position. For these countries,
developing credible medium-term fiscal frameworks, improving transparency
and addressing structural issues will play a crucial role in reducing such risks.

8/22/2019 CES_13_Mates
http://slidepdf.com/reader/full/ces13mates 38/52
42
Neven Mates
Fiscal Policy: Lessons from the Global Crisis
Croatian Economic Survey : Vol. 13 : No. 1 : April 2011 : pp. 5-56
6 Conclusions
Contrary to the generally established view that prevailed until the sovereign debtphase of the crisis, fiscal policy in the major economies since the early 2000s
directly contributed to the global imbalances, which were one of the two main
causes of the global crisis. Moreover, as a result of the secular growth in public
debt ratios in advanced economies, which started in the 1970s, the available
fiscal space was limited when the crisis occurred.
During the crisis, the discretionary fiscal relaxation, initiated to a large extent
by the IMF, was a mixed blessing at best. It made sense in countries with strong
initial fiscal and current account positions, but much less, if at all, in others.
In some countries, it directly contributed to the sovereign debt pressures that
appeared in 2010. In others, particularly small and open economies, it had a
modest effect on output while making future fiscal consolidation more difficult.
Regarding the post-transition countries in Central and Eastern Europe (CEE)
and Southeast Europe (SEE), most of them entered the crisis with large externalvulnerabilities. For them, the discretionary stimulus and even keeping spending
on the pre-crisis path in line with the doctrine of automatic stabilizers were risky
options.
Looking forward, owing to the large deterioration in the budget deficits and
public debt ratios, advanced economies will face unprecedented challenges in
achieving sizable fiscal consolidation at a time of lower GDP growth and aging
pressures. Te current fiscal policy frameworks will need to be revised, and fiscal
rules and fiscal councils will become more important. On the methodological
side, the concept of structural fiscal balance will have to be used much more
carefully than in the past. Deep crises lead to large downward revisions in both
the level and growth rates of potential output. Te estimates of structural fiscal
balances should not rely just on the recent trend in output, even if it is achieved
with low inflation.

8/22/2019 CES_13_Mates
http://slidepdf.com/reader/full/ces13mates 39/52
43
Neven Mates
Fiscal Policy: Lessons from the Global Crisis
Croatian Economic Survey : Vol. 13 : No. 1 : April 2011 : pp. 5-56
Finally, the main lesson from the crisis is that during the times of reasonably
high growth, fiscal policies should aim at rapidly reducing public debt to safe
levels, so as to have fiscal space when a crisis occurs. As demonstrated during this
crisis, the safe debt levels are lower than previously thought. Moreover, the risk of
new crises in an environment of large and volatile capital flows is high. Prudent
policy, therefore, requires that public debt ratios be reached sooner rather than
later.
While the CEE and SEE countries currently show better basic fiscal indicators
than the advanced countries, their comfort-thresholds are also lower. Te mainrisk, particularly for the SEE countries and the Baltics is a vicious circle of high
sovereign spreads, high real interest rates and low GDP growth, which then
translates into a worsening of fiscal indicators.
8/22/2019 CES_13_Mates
http://slidepdf.com/reader/full/ces13mates 40/52
44
Neven Mates
Fiscal Policy: Lessons from the Global Crisis
Croatian Economic Survey : Vol. 13 : No. 1 : April 2011 : pp. 5-56
Appendix 1
How Can Potential Output Fall Sharply and What Are theImplications for Fiscal Policy?
Te structural fiscal balance is intended to provide information about an
underlying fiscal position after adjusting for cyclical factors. Basically, revenue
and expenditure are recalculated as if the output were at the point of potential
output, instead of its actual level.
Te implicit assumption is that the potential output is a slowly and smoothlymoving variable. In some models, it is estimated by aggregate production
function or by using capacity utilization indices. More often, it is estimated as
an unobservable variable, constructed to explain the actual dynamics of inflation
and employment.
Te concept of structural balance then assumes that the actual output and fiscal
balance more or less regularly oscillate around this stable trend. Tis suggests that
as long as the structural balance is sustainable before the crisis, policy-makers
can ignore a cyclical deterioration in the deficit. Instead, as the saying goes, they
can let the automatic stabilizers work. Te temporary worsening of the budget
balance will reduce variability of the output and it will help in avoiding painful
expenditure cuts. However, it will not change the medium-term debt dynamics.
Tis can be illustrated by a simple illustration (Figure 14).
However, these models break down if the potential output is not a smoothfunction. If, for example, its level suddenly falls and then reverts to a new trend
with a lower slope, the situation is fundamentally different (Figure 15). Letting
the automatic stabilizers work, which means letting the budget expenditure
follow the previously determined path, might actually destabilize fiscal position.
Automatic fiscal stabilizers might turn into automatic fiscal destabilizers.

8/22/2019 CES_13_Mates
http://slidepdf.com/reader/full/ces13mates 41/52
45
Neven Mates
Fiscal Policy: Lessons from the Global Crisis
Croatian Economic Survey : Vol. 13 : No. 1 : April 2011 : pp. 5-56
Figure 14: GDP Growth Oscillating around the Potential Growth Path
Source: Author’s calculation.
Figure 15: ECB Illustration of Various Potential Growth Paths
In trillion EUR, 1995 market prices
6.0
6.5
7.0
7.5
8.0
8.5
9.0
9.5
10.0
Real GDP
Potential output spring 2009
Pre-crisis long-run trend of potential output
Potential output: full recovery scenario
Potential output: level shift scenario
Potential output: lower growth scenario
2 0 0 0
2 0 0 1
2 0 0 2
2 0 0 3
2 0 0
4
2 0 0
5
2 0 0
6
2 0 0 7
2 0 0 8
2 0 0 9
2 0 1 0
2 0 1 1
2 0 1 2
2 0 1 3
2 0 1
4
2 0 1
5
2 0 1
6
2 0 1 7
2 0 1 8
Source: ECB (2009).

8/22/2019 CES_13_Mates
http://slidepdf.com/reader/full/ces13mates 42/52
46
Neven Mates
Fiscal Policy: Lessons from the Global Crisis
Croatian Economic Survey : Vol. 13 : No. 1 : April 2011 : pp. 5-56
But why would the potential output path suddenly fall in terms of level and
growth rate? In a closed economy, this could happen only as a result of some
huge supply shock, like a natural catastrophe, war, or something similar. Less
dramatic factors could be a loss of skills of unemployed workers or a decline in
investment following an increase in the level and volatility of interest rates. Tese
two factors were recently mentioned as explaining the drop in potential output
during the current crisis (Oeberg, 2010). However, it does not look as if these two
factors could explain any large drop in potential output: both the skill loss and
the interest rate effect take place only gradually.
Te concept of potential output is based, however, in most cases on a single
sector model. As long as we are in a closed economy, this might be a reasonable
approximation. Te structure of demand in such an economy changes only
slowly, so that supply can gradually adjust to changes in the structure of demand.
Changes in consumer preferences will, therefore, never render large parts of
productive capacities superfluous.
However, in an open economy, the structure of demand might suddenly change:
demand for non-tradables can drop sharply, which may or may not be offset by
demand for tradables. Before the current crisis, for example, several countries
had experienced a construction boom. Once this growth model comes to an
end, all the spare capacity in construction becomes irrelevant. Potential output
not only slows, but, in fact, sharply drops. Tis is roughly what has happened to
many countries with the onset of the crisis (Figures 16-17).

8/22/2019 CES_13_Mates
http://slidepdf.com/reader/full/ces13mates 43/52
47
Neven Mates
Fiscal Policy: Lessons from the Global Crisis
Croatian Economic Survey : Vol. 13 : No. 1 : April 2011 : pp. 5-56
Figure 16: Global GDP Projections in Various Editions of the WEO - World
95
100
105
110
115
120
125
130
135
140
145
2006 2007 2008 2009 2010 2011 2012 2013 2014 2015
WEO Apr. 2007 WEO Oct. 2009 WEO Oct. 2010
2006=100
Source: World Economic Outlook Database, various editions.
Figure 17: Global GDP Projections in Various Editions of the WEO - Advanced Economies
95
100
105
110
115
120
2006 2007 2008 2009 2010 2011 2012 2013 2014 2015
WEO Apr. 2007 WEO Oct. 2009 WEO Oct. 2010
2006=100
Source: World Economic Outlook Database, various editions.

8/22/2019 CES_13_Mates
http://slidepdf.com/reader/full/ces13mates 44/52
48
Neven Mates
Fiscal Policy: Lessons from the Global Crisis
Croatian Economic Survey : Vol. 13 : No. 1 : April 2011 : pp. 5-56
Figure 18: Estimates of Potential Output and Gap in Sweden
2006 2007 2008 2009 2010 2011 20122005
Real time September 2010
0
2
4
6
-6
-4
-2
In %
2013
Source: Oeberg (2010).
Figure 19: Sweden: Estimates of Potential Output and Outcomes
0
20
40
60
80
100
120
140
160
1960 1965 1970 1975 1980 1985 1990 1995 2000 2005 2010 2015
Historical GDP Trend 1966-1976 Trend 1980-1990
Trend 1998-2008 Forecast
2000=100
Source: Oeberg (2010).
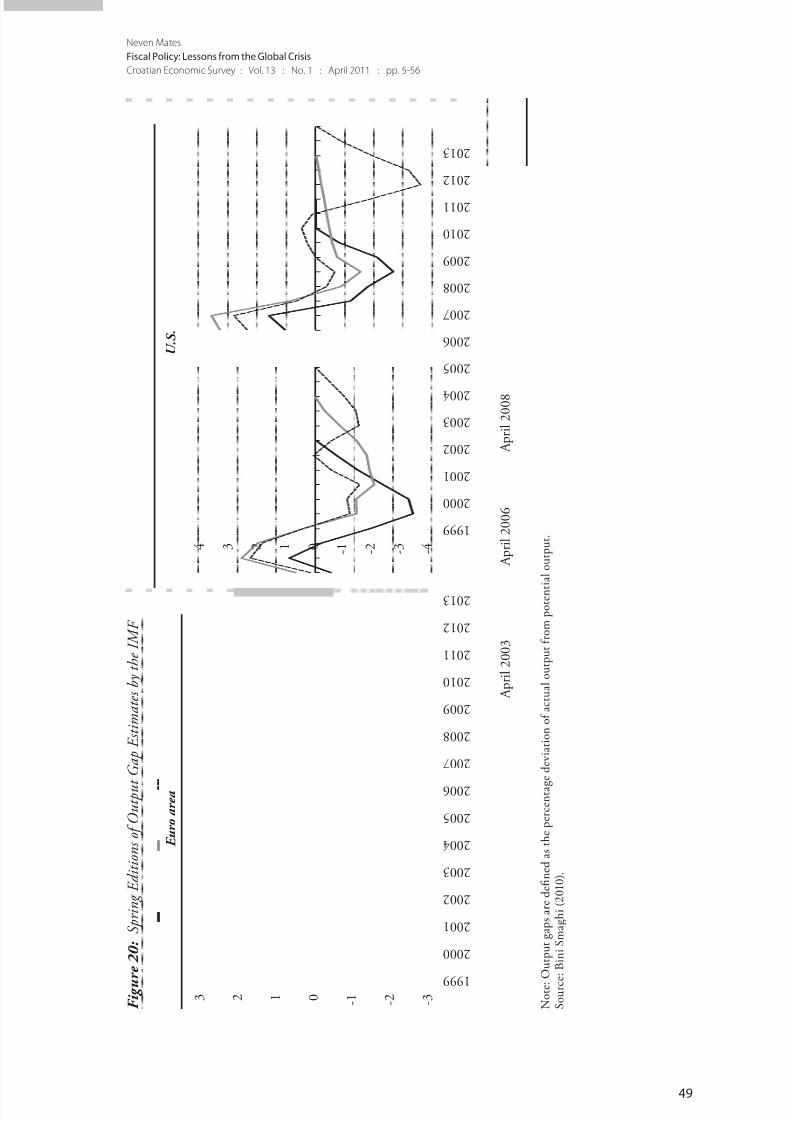
8/22/2019 CES_13_Mates
http://slidepdf.com/reader/full/ces13mates 45/52
49
Neven Mates
Fiscal Policy: Lessons from the Global Crisis
Croatian Economic Survey : Vol. 13 : No. 1 : April 2011 : pp. 5-56
F i g u
r e 2 0 : S p r i n g E d i t i o n s o f O u t p u t
G a p E s t i m a t e s b y t h e I M F
4 3 2 1 0 - 1 - 2 - 3 - 4
A p r i l 2 0 0 3
A p r i l 2 0 0 6
A p r i l 2 0 0 8
1 9 9 9
2 0 0 0
2 0 0 1
2 0 0 2
2 0 0 3
2 0 0 4
2 0 0 5
2 0 0 6
2 0 0 7
2 0 0 8
2 0 0 9
2 0 1 0
2 0 1 1
2 0 1 2
2 0 1 3
3 2 1 0 - 1 - 2 - 3
1 9 9 9
2 0 0 0
2 0 0 1
2 0 0 2
2 0 0 3
2 0 0 4
2 0 0 5
2 0 0 6
2 0 0 7
2 0 0 8
2 0 0 9
2 0 1 0
2 0 1 1
2 0 1 2
2 0 1 3
E u r o a r e a
U . S .
N o t e :
O u t p u t g a p s a r e d e fi n e d a s t h e p e r c e n t a g e d e v i a t i o n o f a c t u a l o u t p u t f r o m p o t e n t i a l o u t p u t .
S o u r c e : B i n i S m a g h i ( 2 0 1 0 ) .

8/22/2019 CES_13_Mates
http://slidepdf.com/reader/full/ces13mates 46/52
50
Neven Mates
Fiscal Policy: Lessons from the Global Crisis
Croatian Economic Survey : Vol. 13 : No. 1 : April 2011 : pp. 5-56
wo conclusions follow. Ex-ante, meaning before the crisis occurres, a prudent
estimate of structural balance should not rely just on the recent trend in output
even if it was achieved with low inflation. Tis might be misleading, particularly if
the current account is in large deficit and is worsening or the country experiences
terms-of-trade gains. Low inflation might, in fact, reflect imported deflation or a
real effective currency appreciation.
When calculating the underlying or structural balance, the simplest solution
is to take a substantially lower growth rate than recorded at peaceful times. At
least one big crisis needs to be included in the calculation of the average growthrates. One should also be aware that ex-post estimates of potential output and,
therefore, structural balances are often substantially revised (Figures 18-20).
Another option is to correct the headline fiscal balance not only for short-term
output deviations, but also for excessive current account deficits and other factors
like exceptional construction and equity booms. Te IMF used such an approach
in its Article IV reports on Serbia and Bulgaria, in which it tried to estimate
structural fiscal balance on the basis of an absorption gap that takes into account
the current account position (IMF, 2010d). However, this has not yet found a
wider application.
Te third solution would be to use more complex models that would differentiate
between potential output in the tradable and non-tradable sectors. Such models
will most likely be developed in the future.
Ex-post, once the economy has been struck by a severe crisis, one should
understand that the structural balance can change not only because of
discretionary measures or predetermined adjustment of some benefits, but also
because the level and the growth rate of potential output have permanently
dropped. In such circumstances, the expenditure path can only temporarily be
left on the previous course, but it should be clear that the accumulation of debt
during that period will not automatically be offset in the future. Instead, sooner
or later, the expenditure path will have to be revised down or taxes increased if

8/22/2019 CES_13_Mates
http://slidepdf.com/reader/full/ces13mates 47/52
51
Neven Mates
Fiscal Policy: Lessons from the Global Crisis
Croatian Economic Survey : Vol. 13 : No. 1 : April 2011 : pp. 5-56
the debt is not to explode. How long automatic stabilizers could be left to work
depends on the initial fiscal position. Te trade-off here is between the risk of
the economy going into a free-fall and the risk of it accumulating excessive debt,
which could lead to another crisis.
Finally, the main lesson from this crisis is that during the times of reasonably
strong growth, fiscal policies should aim at rapidly reducing public debt to safe
levels. Te last crisis gives an indication that these levels are much lower than
previously thought. As the risk of future crisis in an environment of large capital
flows is not negligible (the great moderation turned out to be a great delusion),prudent policy requires that such debt levels be reached soon and not in a distant
future.
8/22/2019 CES_13_Mates
http://slidepdf.com/reader/full/ces13mates 48/52
52
Neven Mates
Fiscal Policy: Lessons from the Global Crisis
Croatian Economic Survey : Vol. 13 : No. 1 : April 2011 : pp. 5-56
Literature
Abbas, Ali S.M., Jacques Bougha-Hagbe, Antonio J. Fatas, Paolo Mauro andRicardo C. Velloso, 2010, “Fiscal Policy and the Current Account”, IMF Working
Paper, No. WP/10/121, Washington, DC: International Monetary Fund.
Bini Smaghi, Lorenzo, 2010, “Comments on the Paper ‘From Convoy to Parting
Ways? Post Crisis Divergence between European and US Macroeconomic
Policies’ by Jean Pisani-Ferry and Adam Posen”, comments presented at the
conference “Te ransatlantic Relationships in an Era of Growing Economic
Multipolarity” organized by the Peterson Institute for International Economics
and Bruegel, Washington, DC, October 8, 2010.
Cecchetti, Stephen G., M.S. Mohanty and Fabrizio Zampolli, 2010, “Te future
of public debt: prospects and implications”, BIS Working Papers, No. 300, Basel:
Bank for International Settlements.
Chinn, Menzie D. and Hiro Ito, 2007, “Global Current Account Imbalances,
American Fiscal Policy versus East Asian Savings”, La Follette School Working
Paper Series, No. 2007-012, Madison, WI: Robert M. La Follette School of
Public Affairs, http://www.lafollette.wisc.edu/publications/workingpapers/
chinn2007-012.pdf (accessed October 30, 2010).
Cottarelli, Carlo and Andrea Schaechter, 2010, “Long-erm rends in Public
Finances in the G-7 Economies”, IMF Staff Position Note, No. SPN/10/13,
Washington, DC: International Monetary Fund.
ECB, European Central Bank, 2009, “Economic and Monetary Developments”,
Monthly Bulletin, 07/2009, pp. 9-62.
European Commission, 2008, “Autumn economic forecast 2008-2010:
GDP growth comes close to a stand-still in the EU and euro area,” news
release, November 3, 2008, http://europa.eu/rapid/pressReleasesAction.
do?reference=IP/08/1617 (accessed October 30, 2010).

8/22/2019 CES_13_Mates
http://slidepdf.com/reader/full/ces13mates 49/52
53
Neven Mates
Fiscal Policy: Lessons from the Global Crisis
Croatian Economic Survey : Vol. 13 : No. 1 : April 2011 : pp. 5-56
Greenspan, Alan, 2009, “Te pay down of federal debt,” remarks before the
Bond Market Association, White Sulphur Springs, WV, April 27, 2001,
http://www.federalreserve.gov/boarddocs/speeches/2001/20010427/default.htm
(accessed October 30, 2010).
G-20, 2009a, “Causes of the Crisis: Key Lessons”, paper presented at the “G-20
Workshop on the Global Economy” organized by G-20 , Mumbai, May 24-26,
2009, http://www.g20.org/Documents/g20_workshop_causes_of_the_crisis.
pdf (accessed October 30, 2010).
G-20, 2009b, “Global Plan For Recovery And Reform: 2 April 2009”, the official
communiqué issued at the close of the G-20 London Summit, London, April 2,
2009, http://www.g20.org/Documents/final-communique.pdf (accessed October
30, 2010).
G-20, 2009c, “Te Pittsburgh Summit: Key Accomplishments”, news release,
September 25, 2009, http://www.pittsburghsummit.gov/resources/129665.htm
(accessed October 30, 2010).
G-20, 2009d, “Supporting growth: A preliminary report on the responsiveness
and adaptability of the international financial institutions by the Chair of
London Summit, Prime Minister Gordon Brown”, report presented at the
G-20 Pittsburgh Summit 2009, Pittsburgh, PA, September 24-25, 2009,
http://www.pittsburghsummit.gov/documents/organization/129852.pdf
(accessed October 30, 2010).
IMF, International Monetary Fund, 2008, World Economic Outlook: Financial
Stress, Downturns, and Recoveries , Washington, DC: International Monetary
Fund.
8/22/2019 CES_13_Mates
http://slidepdf.com/reader/full/ces13mates 50/52
54
Neven Mates
Fiscal Policy: Lessons from the Global Crisis
Croatian Economic Survey : Vol. 13 : No. 1 : April 2011 : pp. 5-56
IMF, International Monetary Fund, 2010a, “People’s Republic of
China: 2010 Article IV Consultation ‒ Staff Report”, IMF Country
Report, No. 10/238, Washington, DC: International Monetary Fund,
http://www.imf.org/external/pubs/ft/scr/2010/cr10238.pdf (accessed October
30, 2010).
IMF, International Monetary Fund, 2010b, “Staff Report; Public Information
Notice on the Executive Board Discussion and Statement by the Executive
Director for Portugal”, IMF Country Report, No. 10/18, Washington, DC:
International Monetary Fund.
IMF, International Monetary Fund, 2010c, “Navigating the Fiscal Challenges
Ahead”, IMF Fiscal Monitor Series, May 14, 2010, Washington, DC:
International Monetary Fund.
IMF, International Monetary Fund, 2010d, “Republic of Serbia: Staff Report
for the 2010 Article IV Consultation, Tird Review Under the Stand-By
Arrangement, and Financing Assurances Review”, IMF Country Report, No.10/93, Washington, DC: International Monetary Fund.
Koen, Vincent and Paul Van den Noord, 2005, “Fiscal Gimmickry in Europe:
One-Off Measures and Creative Accounting”, OECD Economics Department
Working Papers, No. 417, Paris: Organisation for Economic Co-operation and
Development.
Kumar, Manmohan S. and Jaejoon Woo, 2010, “Public debt and growth”, IMF Working Paper, No. WP/10/174, Washington, DC: International Monetary
Fund.
Ma, Guonan and Wang Yi, 2010, “China’s high savings rate: myth and reality”,
BIS Working Papers, No. 312, Basel: Bank for International Settlements.
8/22/2019 CES_13_Mates
http://slidepdf.com/reader/full/ces13mates 51/52
55
Neven Mates
Fiscal Policy: Lessons from the Global Crisis
Croatian Economic Survey : Vol. 13 : No. 1 : April 2011 : pp. 5-56
Nickel, Christiane and Isabel Vansteenkiste, 2008, “Fiscal Policies, the Current
Account and Ricardian Equivalence”, Working Paper Series, No. 935, Frankfurt
am Main: European Central Bank.
Oeberg, Svante, 2010, “Potential GDP, resource utilization and monetary
policy”, speech at the Statistics Sweden’s annual conference, Grand Hotel,
Saltsjöbaden, Sweden, October 7, 2010, http://www.riksbank.se/templates/Page.
aspx?id=45067 (accessed October 30, 2010).
Purfield, Catriona and Cristoph B. Rosenberg, 2010, “Adjustment under a
Currency Peg: Estonia, Latvia and Lithuania during the Global Financial Crisis
2008/09”, IMF Working Paper, No. WP/10/213, Washington, DC: International
Monetary Fund.
Regling, Klaus and Max Watson, 2010, A Preliminary Report on the Sources of
Ireland’s Banking Crisis , Dublin: Government Publications Office.
Reinhart, Carmen M. and Kenneth S. Rogoff, 2010, “Growth in a ime of
Debt”, NBER Working Paper Series, No. 15639, Cambridge, MA: National
Bureau of Economic Research.
Rogoff, Kenneth, 2010, “No need for a panicked fiscal surge”, Financial
imes , July 20, 2010, http://www.ft.com/cms/s/0/6571e6c8-93f5-11df-83ad-
00144feab49a.html#axzz1JK0zMp4h (accessed October 30, 2010).
Spilimbergo, Antonio, Steve Symansky and Martin Schindler, 2009, “Fiscal
Multipliers”, IMF Staff Position Note, No. SPN/09/11, Washington, DC:
International Monetary Fund.
Strauss-Kahn, Dominique, 2008, “Te Case for a argeted Fiscal Boost”,Financial
imes , January 30, 2008, http://www.imf.org/external/np/vc/2008/013008.htm
(accessed October 30, 2010).

8/22/2019 CES_13_Mates
http://slidepdf.com/reader/full/ces13mates 52/52
Neven Mates
Fiscal Policy: Lessons from the Global Crisis
Croatian Economic Survey : Vol. 13 : No. 1 : April 2011 : pp. 5-56
Strauss-Kahn, Dominique, 2009, “A Mandate for Action”, address at National
Press Club, Washington, DC, April 16, 2009, http://www.imf.org/external/np/
speeches/2009/041609.htm (accessed October 30, 2010).
richet, Jean-Claude, 2010, “Stimulate no more – it is now time for all to tighten”,
Financial imes , July 22, 2010, http://www.ft.com/cms/s/0/1b3ae97e-95c6-11df-
b5ad-00144feab49a,dwp_uuid=bd2f85d2-8e90-11db-a7b2-0000779e2340.
html (accessed October 30, 2010).
van Riet, Ad, ed., 2010, “Euro Area Fiscal Policies and the Crisis”, Occasional
Paper Series, No. 109, Frankfurt am Main: European Central Bank,
http://www.ecb.int/pub/pdf/scpops/ecbocp109.pdf (accessed October 30, 2010).


