Embed Size (px)
Citation preview

Chemicals in Washington State 2009 Summary Report
Tier Two – Emergency and Hazardous Chemical Inventory and Toxics Release Inventory Data
June 2011, Revised September 2011
Publication 11-04-006
Washington State Emergency
Response Commission
Published by the
Washington State Department of Ecology’s
Hazardous Waste and Toxics Reduction Program
Publication and Contact Information
This publication is available on the Department of Ecology’s website at
www.ecy.wa.gov/biblio/1104006.html. A web report, with supporting data tables, is also
available at www.ecy.wa.gov/epcra.
For additional information, please contact:
Washington State Emergency Response Commission
Ecology Community Right-to-Know Unit
P.O. Box 47659
Olympia WA 98504-7659
(360) 407-6178
www.ecy.wa.gov/epcra
To make an emergency release notification to the Washington State Emergency Response
Commission, call a Duty Officer at (800) 258-5990.
To report a chemical release to the Department of Ecology, contact a regional office near you:
To ask about the availability of this document in a format for the visually impaired, call the Hazardous
Waste and Toxics Reduction Program at 360-407-6700. Persons with hearing loss can call 711 for
Washington Relay Service. Persons with a speech disability can call 877-833-6341.

Chemicals in Washington State 2009 Summary Report
Tier Two – Emergency and Hazardous Chemical Inventory
and Toxics Release Inventory Data
by Diane Fowler and Sadie Whitener
Hazardous Waste and Toxics Reduction Program
Washington State Department of Ecology
Olympia, Washington

This page is purposely left blank

Table of Contents
Executive Summary ........................................................................................................ ES1 Use of Hazardous Chemical Inventory and Toxics Release Inventory Data ..................................... ES1
Statewide Summary of Tier Two – Emergency and Hazardous Chemical
Inventory Reporting in Washington................................................................................................... ES1
Summary of TRI Reporting in Washington ....................................................................................... ES2
Background .......................................................................................................................... 1
Tier Two – Emergency and Hazardous Chemical Inventory ............................................ 2 Tier Two Reporting Requirements ......................................................................................................... 2
Statewide Summary of Chemical Inventory Reporting .......................................................................... 2
Tier Two Reporting Facilities ................................................................................................................. 3
Local Emergency Planning Committees ................................................................................................. 5
Most Frequently Reported Hazardous Substances and Extremely Hazardous Substances .................... 6
Toxics Release Inventory .................................................................................................... 7 What is the Toxics Release Inventory (TRI)? ......................................................................................... 7
Who Must Report Under the TRI?.......................................................................................................... 7
TRI Reporting Thresholds ...................................................................................................................... 8
TRI Key Trends in Washington .............................................................................................................. 8
On-site Releases to Air, Land, and Water ............................................................................................... 8
Releases to Washington Waters ............................................................................................................ 10
Releases of Dioxins and Dioxin-like Compounds ................................................................................ 12
TRI by Industry ..................................................................................................................................... 13
Top Ten TRI by County ........................................................................................................................ 13
Top Ten TRI by Chemical .................................................................................................................... 14
PBT Releases in Washington ................................................................................................................ 14
Reporting Facilities Ranked by Greatest Volume of Total Releases .................................................... 15
Releases of Carcinogens ....................................................................................................................... 16
TRI on Tribal Lands.............................................................................................................................. 17
Tribal Lands in Washington.................................................................................................................. 18
Risk-screening of Environmental Indicators (RSEI) – A Way to Identify Priorities ........................... 18
How Are TRI Data Used? ..................................................................................................................... 20
Data Limitations of the TRI .................................................................................................................. 21
The TRI Over Time .............................................................................................................................. 22
For More Information ........................................................................................................................... 23
Appendix A Tier Two Reporting by LEPC ...................................................................... 25 Appendix B Washington State TRI Chemicals ............................................................... 27

List of Figures and Tables
Figures
1. Historical Number of Facilities by Reporting Year ..........................................................................3
2. Tier Two Facilities and Chemicals by County .................................................................................4
3. Top Ten LEPCs with the Most Reporting Facilities .........................................................................5
4. Top Ten LEPCs by Chemicals Stored On Site ...............................................................................6
5. TRI On-site Releases by Media .....................................................................................................9
6. TRI On-site Releases by Media (in pounds) ...................................................................................9
7. TRI Dioxin Releases (in grams) ................................................................................................... 12
8. Toxic Release Risks from Manufacturers in Washington State by Relative Risk Score ................ 19
9. Toxic Release Risks from Manufacturers in Washington State, Comparing
Carcinogens and Non-carcinogens ........................................................................................ 19
Tables
1. Top Ten Most Frequently Reported Hazardous and Extremely Hazardous Substances .................6
2. TRI On-site Releases to Water by Facility, Dioxins Only .............................................................. 11
3. TRI On-site Releases to Water by Water Body, Dioxins Only ....................................................... 11
4. TRI On-site Releases Ranked by Industry Sector ........................................................................ 13
5. Top Ten TRI Releases by County ................................................................................................ 13
6. Top Ten TRI Releases by Chemical ............................................................................................. 14
7. TRI Releases of PBT Chemicals .................................................................................................. 14
8. TRI On-site Releases by Facility .................................................................................................. 15
9. TRI Facilities by Number of Chemicals Reported ......................................................................... 16
10. TRI Releases of Chemicals Identified as Carcinogens ................................................................. 17
11. Top Ten TRI Facilities Ranked by RSEI Score ............................................................................. 19
12. Top Ten TRI Chemicals Ranked by RSEI Score .......................................................................... 20
Acronyms used in this document
EHS Extremely Hazardous Substance
EPA U.S. Environmental Protection Agency
EPCRA Emergency Planning and Community Right-to-Know Act
LEPC Local Emergency Planning Committee
NAICS North American Industry Classification System
PAC Polycyclic Aromatic Compounds; also referred to as PAH
PAH Polycyclic Aromatic Hydrocarbons; also referred to as PAC
PBT Persistent, Bioaccumulative, and Toxic
POTW Publicly-owned Treatment Works
SERC State Emergency Response Commission
SIC Standard Industrial Classification
TRI Toxics Release Inventory

ES1
Executive Summary
This report summarizes information about chemicals stored on site or released into the air, land, or water
by certain businesses in Washington State during 2009. It also includes Toxics Release Inventory (TRI)
data for the 2008 reporting year. While data for 2008 are shown in many tables and figures reflecting
trends over time, the focus of this report is data for the 2009 calendar year. TRI data for the 2010
calendar year will not be submitted until July 1, 2011.
The Emergency Planning and Community Right-to-Know Act (EPCRA) contains five sections dealing
with various reporting requirements of businesses and responsibilities of state, tribal, and local
governments. A facility may be subject to one or all EPCRA sections. This summary focuses on the
two annual EPCRA reporting requirements: Tier Two – Emergency & Hazardous Chemical Inventory
reporting (Section 312) and Toxics Release Inventory reporting (Section 313).
Use of Hazardous Chemical Inventory (Tier Two) and Toxics Release Inventory (TRI) Data
Tier Two data is used for emergency planning activities. Local Emergency Planning Committees
(LEPCs) use the information for emergency preparedness, disaster and mitigation planning, and counter-
terrorism planning. Local fire departments use the information to respond to incidents at or near
reporting facilities. When firefighters enter a facility during an emergency, it’s critical they know what
dangers they may face. Information about hazardous chemicals stored on site saves lives.
The Department of Ecology (Ecology) uses TRI data as one of many environmental indicators for the
state. The data also serve as a valuable tool for measuring the progress and effectiveness of pollution
prevention programs. It is used as an indicator for Beyond Waste, Ecology’s long-range plan to reduce
and eliminate solid and hazardous waste (www.ecy.wa.gov/beyondwaste). It is used to identify sources
of toxic chemicals in Puget Sound as part of the effort to protect Puget Sound waters. It is also used for
assessing Pollution Prevention (P2) planning fees.
Statewide Summary of Tier Two – Emergency and Hazardous Chemical Inventory Reporting in Washington, 2009
Nearly 4,000 facilities in Washington State reported storage of one or more hazardous chemicals at or
above reportable thresholds during 2009. Under EPCRA Section 312 Tier Two reporting requirements,
the reportable threshold for hazardous substances was established at 10,000 pounds at any one time
during the reporting period, with much lower thresholds for extremely hazardous substances. While the
Washington Tier Two reporting form requires more detailed information than the federal form, EPCRA
reporting thresholds are the same as the federal EPCRA thresholds.
Federally designated extremely hazardous substances (EHSs) have significantly lower thresholds for
reporting due to their acute risk to employees, the public, and the environment. The top three reported
EHSs were sulfuric acid, ammonia, and chlorine.

ES2
Top Three Hazardous and Extremely Hazardous Substances Reported in Storage, 2009
Hazardous Extremely Hazardous
Substance Reports Substance Reports
Diesel fuel 1,244 Sulfuric acid 1,082
Gasoline 720 Ammonia 548
Propane 525 Chlorine 200
Summary of TRI Reporting in Washington, 2009
In 2009, 312 Washington facilities submitted 1,040 TRI reports representing the use of 107 different
chemicals or chemical groups. Nearly 14 million pounds of toxic chemicals were released to air, land,
and water in Washington. These releases are considered on-site releases, even though they do not stay
within the boundary of the facility. For TRI, off-site releases occur when a chemical is transferred from
the facility to another location for the purpose of disposal, recycling, energy recovery, or further
treatment. Transfers to publicly-owned treatment works (POTWs) are a type of off-site release. This
report focuses on on-site releases.
In past years, on-site releases reported by the Pend Oreille Mine (2004-2009) had a significant impact on
Washington’s TRI numbers. Not surprisingly, the vast majority of releases reported by the mine have
been to land. In 2008, 64 percent of the total TRI releases were to land, in large part due to mining
activities. As production at the Pend Oreille Mine has decreased, so have the proportion of land releases
of Washington’s overall TRI numbers. Now, in 2009, half of all releases – 7 million pounds – were
released to air. Land releases totaled 5.3 million pounds (39 percent) and 1.5 million pounds (11
percent) were released to water.
TRI On-site Releases by Media
2008 2009

ES3
The largest chemical releases by weight (in pounds) were from methanol (1.9 million), barium
compounds (1.8 million), and nitrate compounds (1.3 million). Lead compounds (categorized as
persistent, bioaccumulative, and toxic) were reported by the greatest number of facilities − 74.
The top three on-site releases of PBT chemicals by weight were lead, lead compounds, and polycyclic
aromatic compounds1 (PACs). If amounts of lead and lead compounds were added together, mercury
compounds would be the third most-reported chemical release by weight. Most of the releases for lead
and lead compounds were to land, while the majority of releases of other PBT chemicals were to air,
including mercury. By number of chemical reports, the top three reported chemicals were lead
compounds (74), lead (66), and PACs (31).
In 2009, the top 20 facilities reporting under the TRI released 12.1 million pounds of TRI chemicals
during the year. Their releases equaled 87 percent of the state's 13.9 million pound total. Transalta
Centralia Generation/Mining reported the highest total on-site releases of more than 2 million pounds.
The Pend Oreille Mine reported the next highest release totals with 1.4 million pounds, followed by
Weyerhaeuser Company Longview with 1.1 million pounds of on-site releases. Releases from Transalta
and the Pend Oreille Mine were mostly to land. The majority of releases from Weyerhaeuser Longview
were to air.
The following report is a full summary of the 2009 TRI data. More detailed information and supporting
data is available at www.ecy.wa.gov/epcra/.
1 Polycyclic aromatic compounds (PACs) are also known as polycyclic aromatic hydrocarbons (PAHs) or polynuclear
aromatic hydrocarbons. Some TRI chemicals (anthracene, benzo(g,h,i)perylene, and napththalene) are PACs (or PAHs), but
are not included in the TRI PAC chemical category. Instead, they are listed separately on the TRI list of reportable
chemicals. For the purposes of this report, the term polycyclic aromatic compounds will be used for the chemical group in
order to be consistent with TRI reporting nomenclature. The individually listed TRI PAC chemicals will be listed by name
and it will be noted that these are also PACs.

This page purposely left blank

1
Background In December 1984, a deadly cloud of methyl
isocyanate was accidentally released from a pesticide
manufacturer in Bhopal, India. Tragically, thousands
of people were killed and many thousands more were
seriously injured. In August 1985, there was another
accidental release at a facility in Institute, West
Virginia. These events raised public concerns about
lack of planning and preparation for responding to
chemical accidents. It also led to public demand for
information about toxic chemicals released ‘beyond
the fence line’ of a facility that could endanger
surrounding communities.
As a result, Congress passed the Emergency Planning and Community Right-to-Know Act (EPCRA), also
known as SARA Title III. It was created as part of the Superfund Amendments and Reauthorization Act
(SARA) of 1986, but is more commonly referred to as the Community Right-to-Know law or simply
EPCRA. EPCRA facilitates emergency planning and preparedness, helps minimize the effects of potential
chemical accidents, and provides the public with information about potentially dangerous chemicals in their
communities.
While EPCRA helps communities deal safely and effectively with hazardous chemicals, the law also
establishes a number of requirements for businesses and government. EPCRA's primary objective is to
help improve emergency planning for hazardous chemicals at the local level by:
Enhancing emergency response capabilities for chemical incidents.
Expanding emergency planning for hazardous chemical incidents.
Identifying storage, use, and releases of hazardous chemicals in communities.
Promoting communication between facilities that handle hazardous chemicals, the community, local
planners, and emergency responders.
In 1987, Washington State Governor Booth Gardner appointed the members of the Washington State
Emergency Response Commission (SERC), which then established Local Emergency Planning
Committees (LEPCs) statewide, as directed under federal law. Chapter 118-40 of the Washington
Administrative Code (WAC) was established in 1987. This state rule adopted the federal Community
Right-to-Know reporting thresholds and requirements in accordance with federal Public Law 99-499.
The SERC is responsible for the establishment of a state hazardous materials emergency preparedness,
response, and Community Right-to-Know program.
Every state has a SERC or an equivalent entity that carries out these duties. In Washington, the Military
Department, State Patrol, and Department of Ecology share the core implementation of EPCRA. As
required under Chapter 118-40 WAC, Ecology coordinates the development, implementation, and
maintenance of a state EPCRA program. Ecology receives the EPCRA reports, manages data, and
distributes information on storage and releases of chemicals under these regulations on behalf of the
SERC. Ecology staff also track facility compliance and provide technical and regulatory guidance to
businesses, local emergency planning committees, tribal nations, and the public.

2
This report summarizes information about chemicals stored on site or released into the air, land, and
water by some Washington businesses. It focuses on the two annual EPCRA reporting requirements:
1. Tier Two - Emergency & Hazardous Chemical Inventory (Section 312) for 2009.
2. Toxics Release Inventory (Section 313) for 2009.
Tier Two - Emergency and Hazardous Chemical Inventory
Tier Two Reporting Requirements
Facilities that are required to maintain a material safety data sheet
(MSDS) for any hazardous chemical stored or used in the workplace are
potentially covered under Community Right-to-Know laws.
Under EPCRA Section 312, facilities are required to report inventories
of substances or products over a certain amount (reporting threshold).
Reporting thresholds for hazardous substances are 10,000 pounds or
more at any one time during the reporting period. Much lower
thresholds apply for extremely hazardous substances (EHSs). While
there is no list of chemicals or products that must be reported, EPA
classified over 360 chemicals as EHSs. A list of them and their reporting
thresholds is available at
http://edocket.access.gpo.gov/cfr_2008/julqtr/pdf/40cfr355AppB.pdf.
Businesses must submit a Tier Two - Emergency and Hazardous Chemical Inventory report by March
1st of each year for the inventory of hazardous substances or chemicals stored on site during the
previous calendar year. These reports are submitted to the SERC, LEPC, and local fire department. The
information required on the Tier Two – Emergency and Hazardous Chemical Inventory report includes:
Facility identification
Identification of two emergency contacts
Chemical or product name
Physical and health hazards
Actual, maximum, and average inventory
amounts
Description of storage conditions
Location of chemicals on site
This data is entered into a computerized tracking system to share with first responders, LEPCs, other
government agencies, and the public. Tier Two data identifies chemicals that are stored in our
communities and help us prepare for a disaster before it occurs. LEPCs and local fire departments use
the information to prepare for emergencies, disaster and counter-terrorism planning, and emergency
responses to incidents at or near reporting facilities. It also helps the state better understand how and
where the chemicals are used. Ecology frequently responds to inquiries from citizens interested in what
chemicals are used at facilities in their community.
Statewide Summary of Tier Two Chemical Inventory Reporting in 2009
For reporting year 2009, 3,817 facilities in Washington reported 13,867 chemicals in 27,861 storage
locations at their business sites. Nearly 3,000 of these chemicals were EHSs.
What are Material Safety Data Sheets?
MSDSs are detailed
information sheets that
provide data on physical and
health hazards of chemicals
along with associated
protective measures. More
than 500,000 products have
MSDSs, which are normally
obtained from the chemical
manufacturer.

3
Tier Two Reporting Facilities
The number of facilities reporting Tier Two chemicals increased each year through 1998 due to
increased outreach efforts, awareness of reporting requirements, and enforcement activities. In 1998,
reporting requirements were changed for retail gas stations causing a substantial decrease in reports from
this sector the following reporting year. This also explains the decreased volume of gasoline and diesel
products reported. Both of these chemicals remain the top two products reported. Each year the number
of reporting facilities changes because some businesses store smaller quantities and are no longer
required to report, while other new businesses begin reporting.
Historical Number of Facilities by Reporting Year
Figure 1

4
Tier Two Facilities and Chemicals by County
Figure 2

5
Local Emergency Planning Committees
Each LEPC looks for ways to prevent chemical accidents. It is responsible for:
Collecting reports on chemicals stored and released as reported by
industry.
Developing and submitting a local emergency plan to the SERC.
There are currently 43 LEPCs in Washington State. Most of them share
the same jurisdictional area as counties, but some communities serve as
their own LEPC. A list of all the LEPCs and their reporting facilities and
reported chemicals can be found in Appendix A on page 25. A current
LEPC list is also available at www.ecy.wa.gov/epcra/lepclist.html.
Figure 3 displays the top ten LEPCs with the most facilities within their
jurisdiction that filed Tier Two reports in 2009. Figure 4 on page 6, is
similar, but shows the top ten LEPCs in terms of the total number of
chemicals reported for their jurisdiction.
Top Ten LEPCs With the Most Reporting Facilities, 2009
LEPCs include:
Emergency managers
Local government officials
Law enforcement
personnel
Health professionals
Environmental and citizen
groups
Industry representatives
Other interested parties
Figure 3
King County’s value does not include City of Seattle or City of Kent values.

6
Top Ten LEPCs by Chemicals Stored on Site, 2009
Most Frequently Reported Hazardous and Extremely Hazardous Substances
The ten most frequently reported hazardous substances and extremely hazardous substances are
displayed in Table 1 below. EHSs pose a higher risk to the public and the environment and therefore
have much lower reporting thresholds. The availability of information on these chemicals is important
due to the risk faced by employees, emergency responders, and others in close proximity.
Table 1. Top Ten Most Frequently Reported Hazardous and Extremely Hazardous Substances, 2009
Hazardous Extremely Hazardous
Substance Reports Substance Reports
Diesel fuel 1,244 Sulfuric acid 1,082
Gasoline 750 Ammonia 548
Propane 525 Chlorine 200
Lead 421 Gramoxone 113
Lube oil 303 Hydrochloric acid 72
Sodium hydroxide 264 Formaldehyde 70
Nitrogen 188 Nitric acid 68
Sodium hypochlorite 151 Dimethoate 64
Oxygen 98 Ammonium hydroxide 48
Carbon dioxide 90 Hydrofluoric acid 43
King County’s value does not include City of Seattle or City of Kent values.
King County’s value does not include City of Seattle values.
Figure 4
King County’s value does not include City of Seattle values.

7
TRI Definition of Manufacture, Process, and Otherwise Use
Manufacture means to produce, prepare, compound, or import a TRI-listed chemical. It also includes coincidental production of a chemical as a byproduct or impurity.
Process means the preparation of a TRI-listed chemical after its manufacture, for distribution into commerce.
Otherwise Use means any use of a TRI-listed chemical (including those contained in a mixture or other trade name product or waste) that is not covered by the terms manufacture or process. For example, if a facility receives a waste containing a TRI-listed chemical from offsite and treats it for further reuse or disposal, the chemical is considered otherwise used.
The Toxics Release Inventory
What is the Toxics Release Inventory?
EPCRA Section 313, the Toxics Release Inventory (TRI), identifies facilities and chemicals
manufactured and used at those facilities. It also tracks accidental and routine releases of those
chemicals to air, land, and water. Facilities required to report under TRI are manufacturing companies
in specific industrial sectors and several other industries including:
Chemical
wholesalers
Commercial hazardous waste
treatment and disposal
Metal mining Solvent recovery
services
Coal mining Electric power utilities Petroleum bulk
stations & terminals
Nationally, the TRI reflects chemical information collected from more than 23,000 facilities that
manufacture, process, or otherwise use over 650 chemicals. In addition to chemical release information,
TRI collects information about how dangerous waste is managed through disposal, treatment, recycling, or
energy recovery.
The U.S. Environmental Protection Agency (EPA) compiles TRI data each year from every state and
makes it available through several data access tools, including TRI Explorer (www.epa.gov/triexplorer/)
and Envirofacts (www.epa.gov/enviro/). Information available through these systems includes national,
state, and county level TRI data. Other organizations also make the data available to the public through
their own data access tools. For example, Unison Institute provides data through its tool "RTKNet"
(www.rtknet.org/), and the U.S. National Library of Medicine provides a searchable database of TRI
information through "TOXNET" (http://toxnet.nlm.nih.gov/).
Who must report under the Toxics Release Inventory?
Under EPCRA Section 313, a plant, factory, or other facility must complete a TRI report, if it meets all
three of these criteria:
1. It is included in a covered industry category as
determined by its North American Industry
Classification System (NAICS) code, or prior to 2007,
its Standard Industry Classification (SIC) code; and
2. It has ten or more full-time employees (or the
equivalent of 20,000 employee hours per year); and
3. It manufactures, imports, processes, or otherwise uses
any of the EPCRA Section 313 chemicals in amounts
greater than established threshold quantities of these
chemicals. Currently, more than 650 chemicals and
chemical categories are covered under TRI.
If these criteria are met during a calendar year, the facility
must file an annual report by July 1 of the following year
to EPA or tribal government, and to the state where the
facility is located. In Washington State, these reports are
sent to Ecology.

8
Toxics Release Inventory Reporting Thresholds
Each chemical reportable under the TRI is assigned a reportable threshold amount. The reporting
threshold is based on the toxicity of the chemical and how the chemical is used. If a facility exceeds this
threshold during a calendar year, it is required to file a TRI report.
Chemicals that are not persistent, bioaccumulative, and toxic (non-PBT) The quantities that trigger TRI reporting for non-PBT chemicals are:
25,000 pounds for chemicals that are either manufactured or processed at the facility, or
10,000 pounds for chemicals otherwise used.
PBT Chemicals There are 16 PBT chemicals and 4 PBT chemical compound categories subject to reporting under TRI.
PBT chemicals:
Are toxic and remain in the environment for long periods of time.
Are not readily destroyed, and tend to build up or accumulate in body tissue of living things.
Increase in concentration as they move up the food chain.
Move easily through air, water, and land and are widely distributed throughout the environment.
Have been linked to a wide range of adverse health effects including nervous system damage,
reproductive and developmental problems, cancer, and genetic impacts, such as birth defects.
By federal rule, PBT chemicals have lower thresholds for reporting under the TRI. The reporting
thresholds for PBT chemicals are:
One hundred pounds for persistent and bioaccumulative chemicals like PACs, lead, and lead
compounds.
Ten pounds for a small subset of PBT chemicals that are highly persistent and highly
bioaccumulative chemicals like mercury and mercury compounds.
One tenth of a gram for dioxins and dioxin-like compounds.
Key Trends in Toxics Release Inventory in Washington
With a few notable exceptions, TRI releases, especially to air and water, have been decreasing in
Washington State for more than a decade. Large increases in on-site releases to land occurred in 1998, when
seven new industry sectors were added to TRI (by federal rule change), and again in 2004 when the
reopening of the Pend Oreille Mine added millions of ‘new’ pounds to the data annually. However, those
newly reported releases (mostly from mine tailings put into regulated, lined, holding basins) have also been
decreasing since 2005.
On-site Releases to Air, Land, and Water
On-site disposal or other releases include emissions to the air, discharges to bodies of water, disposal at
the facility to land, and disposal in underground injection wells. These releases are reported to TRI by
environmental media type, either air, land, or water.

9
Water, 11%
Land, 39%
Air, 50%
TRI On-site Releases by Media (Air, Land, Water), 1995-2009
The trends for TRI releases are partly related to economic factors. For example, the cost per pound to
manage and properly dispose of toxic waste is going up. Higher waste management costs provide incentives
to use fewer toxic materials and generate less toxic waste.
Other factors contributing to the downward trend in Washington TRI releases include:
Fewer businesses filing TRI reports each year.
More businesses understand that the costs and liability for using toxic chemicals are increasing, as
are associated cleanup costs.
State required Pollution Prevention (P2) Plans. P2 planning has fostered significant reductions in
waste and toxic chemicals used. Washington TRI facilities must submit and annually update these
P2 Plans. Go to www.ecy.wa.gov/programs/hwtr/P2/p3.html for more information about state
required P2 plans.
In 2009, 312 Washington facilities submitted 1,040 TRI reports representing the use of 107 different
chemicals or chemical groups. A total of 13,945,013 pounds of toxic chemicals were released to air,
land, and water.
In years past, the reporting of on-site releases by the Pend
Oreille Mine (2004-2009), had a significant effect on
Washington’s TRI numbers. The vast majority of releases
reported by the mine have been to land. As production at the
Pend Oreille mine has decreased, so have the proportion of
land releases of Washington’s overall TRI numbers. Half of all
releases – 7,021,400 pounds – were released to air, followed by
releases to land, 5,373,590 pounds (39 percent) and
1,550,023 pounds (11 percent) released to water.
Land
Air
Water
Figure 5
Figure 6
On-site Releases by Media, 2009

10
TRI releases have generally decreased over time. However, releases of dioxins and dioxin-like
compounds have continued to rise since 2005 (see Figure 7, page 12).
Releases to air are classified as either ‘fugitive’ or ‘stack’ releases. Fugitive releases, or ‘non-point’
source emissions include evaporative losses, leaks, and releases from building ventilation systems.
Stack, or ‘point source’ emissions originate from known points such as stacks, confined vents, ducts,
pipes, or other confined air streams. Stack releases also include air releases from air pollution control
equipment and storage tank emissions.
Releases to water are discharges to streams, rivers, lakes, oceans, and other bodies of water. These
include process outfalls such as pipes and open trenches, releases from on-site wastewater treatment
systems, and the contribution from stormwater runoff. Discharges to a publicly-owned treatment works
(community wastewater treatment plants) or other off-site wastewater treatment facility are not counted
here under water releases, but rather as transfers.
There are several types of land releases reported under TRI - underground injection (not available in
Washington State), disposal to landfills, land treatment, surface impoundment, and disposal methods not
covered by the above categories. Land treatment is a disposal method in which a waste containing an
EPCRA Section 313 chemical is applied onto or incorporated into soil.
Releases to Washington Waters
A total of 1,550,023 pounds of chemicals were released to Washington’s waters in 2009. This is an increase
of more than 161,000 pounds or 11.6 percent from 2008. Of the 47 chemicals or chemical compounds
released to water, the top three – nitrate compounds, methanol, and manganese compounds – account for 88
percent of releases.
By water body, the Columbia River received the most chemical discharges by weight (600,593 pounds,
or 39 percent), followed by the Pend Oreille River (206,681 pounds, 13 percent), and the Strait of
Georgia (156,980 pounds, 10 percent).
Of Washington’s 39 counties, 17 reported water releases under TRI. Cowlitz County had the highest
volume of releases (308,240 pounds, 20 percent) followed closely by Benton County (303,038 pounds,
20 percent) and Pend Oreille County (206,681 pounds, 13 percent).
A total of 7.9 grams dioxins and dioxin-like compounds (PBT chemicals), were released to Washington
waters in 2009. This is a 48 percent increase over the previous year (5.4 grams). There was little change in
release amounts for facilities that reported in 2008, with the exception of Boise Cascade, Wallula. Boise
Cascade reported an increase of 2.1 grams over the previous year, which alone accounts for nearly all of the
state’s 48 percent increase.

11
Table 2. 2009 TRI Releases to Water by Facility - Dioxins Only, in Grams
Facility Name Releases (in grams)
Boise White Paper LLC 2.320
Simpson Tacoma Kraft Co. LLC 2.243
Longview Fibre Paper and Packaging Inc. 1.966
Kimberly-Clark Worldwide 0.419
Tesoro Refining and Marketing Co. 0.410
ConocoPhillips Ferndale Refinery 0.225
McFarland Cascade Pole and Lumber Co. 0.218
Brooks Manufacturing Co. 0.063
Nippon Paper Industries USA Co. LTD 0.035
Oeser Co. 0.023
Georgia-Pacific Consumer Products (Camas) 0.003
Total 7.925
For releases of dioxins by body of water, the Columbia River received the highest volume of dioxin
discharges (4.289, or 54 percent of the state’s total). The facilities that released dioxins into the Columbia
River are paper manufacturers – Boise Cascade (Wallula), Longview Fibre Paper and Packaging
(Longview), and Georgia-Pacific Consumer Products (Camas).
The body of water with the next highest volume of dioxin releases is Puget Sound’s Commencement Bay
with 2.2 grams, or 28 percent of total dioxin releases. The only facility discharging dioxins into
Commencement Bay is Simpson Tacoma Kraft (Tacoma), also a paper manufacturing facility.
Table 3. 2009 TRI Releases to Water by Water Body - Dioxins Only, in Grams
Water Body Releases (in grams)
Columbia River 4.289
Commencement Bay 2.243
Everett Harbor 0.419
Fidalgo Bay 0.410
Strait of Georgia 0.225
Blair Waterway via Lincoln Avenue Ditch, Puyallup 0.218
Whatcom Creek 0.063
Strait of Juan De Fuca 0.035
Little Squalicum Creek 0.023
Total 7.925

12
Releases of Dioxins and Dioxin-like Compounds
In Washington State, dioxin releases come from manufacturing wood products, paper, petroleum and
coal products, non-metallic mineral products, and primary metals, or from waste management and
remediation services.
Facilities report dioxin and dioxin-like compounds in smaller quantities (grams instead of pounds)
because these compounds are very toxic. There are 454 grams in one pound. There has been a general
upward trend in the amount of dioxin and dioxin-like compounds released from TRI facilities in the past
few years. Although overall dioxin releases more than doubled between 2008 and 2009, the increase in
2009 is consistent with this upward trend.
In 2009, 24 facilities released 46.9 grams of dioxins to air, land, and water in Washington State. Of
these 24 facilities, three facilities account for two-thirds (67 percent) of these releases. Kaiser
Aluminum Fabricated Products – Trentwood Works released 17.1 grams (all to air), Tesoro Refining
and Marketing Company released 7.8 grams (nearly all to land), and Boise Cascade LLC released 6.6
grams (majority to land, followed by water, then air).
As shown in Figure 7 below, more than half of on-site dioxin releases in 2009 were to air (59 percent). Releases to land were the next largest contribution (25 percent), and water releases accounted for 17 percent of on-site releases. Dioxin releases followed similar proportions in 2008. However, in previous years releases to water accounted for the greatest proportion. In 2007, a slightly higher proportion of releases were to water (58 percent), followed by air (33 percent) and land (9 percent).
TRI Dioxin Releases, 2005-2009, in Grams
Figure 7

13
Toxics Release Inventory by Industry
As shown in Table 4 below, manufacturing facilities were responsible for 8.7 million pounds, or 63
percent of on-site releases in the state. The next largest contributors were utilities (2 million pounds, 15
percent) and mining (1.8 million pounds, 13 percent).
Table 4. TRI On-site Releases Ranked by Industry Sector, 2009
2-Digit NAICS*
2009 NAICS* Category * North American Industry Classification System
Total Pounds
Released On Site
31-33 Manufacturing 8,743,118
22 Utilities 2,086,052
21 Mining 1,866,691
92 Public Administration2 1,214,019
42 Wholesale Trade 25,964
56 Administrative/Support, Waste Management/Remediation Services 9,169
Toxics Release Inventory by County
Facilities in 31 of Washington's 39 counties reported under TRI in 2009. King County had the greatest
number of facilities (73), but was ranked tenth in total volume of releases.
Table 5. Top Ten TRI Releases by County, 2009
County No.
Facilities Pounds
Released to Air Pounds Released
to Water Pounds Released
to Land Total Pounds
Released On Site
Lewis 9 125,287 66,446 1,880,026 2,071,758
Pend Oreille 2 63,430 206,681 1,420,476 1,690,588
Cowlitz 14 1,350,811 308,240 0 1,659,052
Benton 9 52,975 303,038 1,046,712 1,402,725
Pierce 37 1,080,520 121,783 125,048 1,327,352
Whatcom 18 780,998 156,983 1,899 939,880
Walla Walla 4 559,617 66,686 210,838 837,141
Jefferson 1 464,101 53,453 46,864 564,418
Chelan 2 539,081 0 976 540,058
King 73 449,411 48 770 450,229
2 In Washington, facilities classified under Public Administration include military installations, Superfund clean-up sites
managed by EPA, and the U.S. Department of Energy’s Hanford Site.

14
Toxics Release Inventory by Chemical
TRI provides information about the type and amount of chemicals that are released to air, land, and
water. In the 2009 reporting year, 312 facilities in Washington submitted 1,040 TRI reports representing
the use of 107 different chemicals or chemical groups, a slight decrease from the previous year.
The highest chemical releases by weight in 2009 were from methanol (primarily from the pulp and paper
industry), barium compounds (mostly from a coal-fired electrical plant), and nitrate compounds (from
facilities that include a paper mill, metal processing plant, food manufacturer, and petroleum refinery). Lead
compounds (PBTs) were reported by the greatest number of facilities − 74 in 2009.
Table 6. Top Ten TRI Releases by Chemical, 2009
Chemical No.
Reports Pounds
Released to Air Pounds Released
to Water Pounds Released
to Land Total Pounds
Released On Site
Methanol 29 1,753,839 160,794 311 1,914,944
Barium Compounds 10 1,989 8,156 1,572,624 1,582,768
Nitrate Compounds 46 2,675 1,051,832 207,159 1,261,666
Lead 66 1,631 681 1,148,937 1,151,249
Zinc Compounds 20 9,617 32,996 1,072,758 1,115,370
Hydrochloric Acid 17 1,054,918 0 0 1,054,918
Ammonia 31 739,295 81,702 3,398 824,395
Carbonyl Sulfide 6 756,026 0 0 756,026
Manganese Compounds 17 1,820 150,906 402,580 555,305
Lead Compounds 74 2,964 4,005 530,894 537,864
PBT Releases in Washington
In 2009, the top three PBT chemicals by weight of on-site releases were lead, lead compounds, and
PACs. If amounts of lead and lead compounds are added together, mercury compounds would be the
third most-reported chemical release by weight. Most of the releases for lead and lead compounds were
to land, while the majority of releases for the other PBT chemicals were to air. The three PBT
chemicals named most often on TRI reports were lead compounds (74), lead (66), and PACs (31).
Table 7. TRI On-site Releases of PBT Chemicals, 2009
Chemical No. of
Reports Pounds
Released to Air Pounds Released
to Water Pounds Released
to Land Total Pounds
Released On Site
Lead 66 1,631 681 1,148,937 1,151,249
Lead Compounds 74 2,964 4,005 530,894 537,864
PAC Chemical Category 31 3,476 37 229 3,742
Mercury Compounds 19 627 17 103 747
Benzo(g,h,i)perylene (a PAC) 23 452 3 10 464
Mercury 6 3 0 9 12
Polychlorinated Biphenyls 4 0 0 0 0
Tetrabromobisphenol A 3 0 0 0 0
Hexachlorobenzene 1 0 0 0 0

15
For comparison, in 2008, the top three PBT chemicals were lead and lead compounds (if combined),
PACs, and benzo(g,h,i)perylene (also a PAC). By number of chemical reports, the top three reported
chemicals for 2008 were lead compounds (79), lead (74), and PACs (36). These data show that TRI data
regarding releases of PBTs are relatively stable from year to year.
Reporting Facilities Ranked by Greatest Volume of Total Releases
In 2009, the top 20 facilities reporting under the TRI released 12.1 million pounds of TRI chemicals
during the year, 87 percent of the state's 13.9 million pound total. Transalta Centralia Generation/
Mining reported the highest total on-site releases with 2 million pounds. The Pend Oreille Mine ranked
second with 1.4 million pounds, and the Weyerhaeuser Company ranked third with 1.2 million pounds
released.
Table 8. TRI On-site Releases by Facility, 2009
Facility Name City County
No. of Chemicals Reported
Total Pounds Released On
Site
Transalta Centralia Generation/Mining Centralia Lewis 18 2,052,023
Pend Oreille Mine Metaline Falls Pend Oreille 7 1,421,958
Weyerhaeuser Co. Longview Cowlitz 24 1,152,226
U.S. Department of Energy - Hanford Site Richland Benton 3 989,562
Simpson Tacoma Kraft Co. LLC Tacoma Pierce 20 984,554
Boise Cascade LLC Wallula Walla Walla 18 809,281
Port Townsend Paper Corp. Port Townsend Jefferson 14 564,418
Alcoa Wenatchee Works Malaga Chelan 5 539,081
Longview Fibre Paper & Packaging Inc. Longview Cowlitz 15 475,406
Kettle River Operations Mill Republic Ferry 4 438,022
Intalco Aluminum Corp. Ferndale Whatcom 9 423,156
Georgia-Pacific Consumer Products LLC-Camas Camas Clark 16 373,573
Kimberly-Clark Worldwide Everett Snohomish 13 313,221
Ponderay Newsprint Co. Usk Pend Oreille 4 268,631
Rexam Beverage Can Co. Kent King 5 255,237
Crown Beverage Packaging Olympia Thurston 4 239,435
Tesoro Refining & Marketing Co. Anacortes Skagit 31 230,567
BP Cherry Point Refinery Blaine Whatcom 31 211,930
Conoco Phillips Ferndale Refinery Ferndale Whatcom 33 207,156
Sandvik Special Metals LLC Kennewick Benton 3 189,170
Total 277 12,138,607
By number of TRI reports submitted by a single facility, Shell Oil Products U.S. - Puget Sound Refinery
ranked first with 36 chemicals. ConocoPhillips Ferndale Refinery followed with 33. Tesoro Refining
and Marketing and BP Cherry Point tied with 31.

16
Table 9. Top TRI Facilities by Number of Chemicals Reported, 2009
Facility Name No. of
Chemicals City County
Total Pounds Released On
Site
Shell Oil Products U.S. - Puget Sound Refinery 36 Anacortes Skagit 101,080
ConocoPhillips Ferndale Refinery 33 Ferndale Whatcom 207,156
Tesoro Refining and Marketing Co. 31 Anacortes Skagit 230,567
BP Cherry Point Refinery 31 Blaine Whatcom 211,930
Emerald Services Inc. 26 Tacoma Pierce 9,147
Weyerhaeuser Company NR Co. – Longview 24 Longview Cowlitz 1,152,226
Simpson Tacoma Kraft Co. LLC 20 Tacoma Pierce 984,554
Transalta Centralia Generation/Mining 18 Centralia Lewis 2,052,023
Boise Cascade LLC 18 Wallula Walla Walla 809,281
Georgia-Pacific Consumer Products LLC 16 Camas Clark 373,573
Longview Fibre Paper and Packaging Inc. 15 Longview Cowlitz 475,406
Port Townsend Paper Corp. 14 Pt Townsend Jefferson 584,418
U.S. Oil and Refining Co. 14 Tacoma Pierce 120,921
Puget Sound Coatings 14 Seattle King 36,931
Tidewater Terminal Co. Snake River Terminal 14 Pasco Franklin 6,530
Kimberly-Clark Worldwide 13 Everett Snohomish 313,221
Steelscape 12 Kalama Cowlitz 11,424
BP West Coast Products Co. - Seattle Terminal 12 Seattle King 4,563
Burlington Environmental Inc. 12 Kent King 0
As shown in Table 9 above, the facilities that release the greatest amounts of toxic chemicals are not
necessarily the ones with the highest number of reportable toxic chemicals. Transalta Centralia
Generation/Mining, the facility with the largest reported on-site releases, reported 18 chemicals. On the
other hand, Shell Oil-Puget Sound Refinery reported the greatest number of chemicals used, but did not
show up on the list of Top TRI On-site Releases by Facility for 2009.
Releases of Carcinogens
A total of 1,876,176 pounds of chemicals identified as carcinogens were released in 20093. This amount
is a decrease of 1.6 million pounds from 2008. For both years, lead, by far, ranked highest in terms of
releases by weight, accounting for 61 percent of total carcinogen releases in 2009. The next highest
releases were acetaldehyde and styrene, accounting for 16 and 13 percent of the total, respectively.
Washington’s releases of carcinogens occur mostly at the U.S. Department of Energy’s Hanford site.
This facility reported 989,298 pounds of lead released in 2009, compared to 2.2 million pounds for
2008. These values reflect the 53 percent of total carcinogens released in 2009 and 63 percent of the
total for 2008.
3. TRI classifies chemicals as carcinogens if they are possible, probable, or known human carcinogens according to the International
Agency for Research on Cancer (IARC), the National Toxicology Program (NTP), or 29 CFR 1910, Subpart Z, Toxic and Hazardous
Substances, Occupational Safety and Health Administration.

17
In 2009, lead was reported by the greatest number of facilities (66), followed by PACs (31), and
benzo(g,h,i)perylene (also a PAC) (23). This is similar to 2008 with 74, 36, and 25 respectively.
Table 10. TRI Releases of Chemicals Identified as Carcinogens, 2009
Chemical No. of Facilities Total Pounds of On-site
Releases
Lead 66 1,151,249
Acetaldehyde 7 294,947
Styrene 22 245,884
Formaldehyde 11 78,603
Benzene 16 39,347
Chloroform 2 36,407
Cobalt compounds 2 7,485
Dichloromethane 2 4,652
Trichloroethylene 4 4,153
PAC chemical category 31 3,742
Chromium 21 2,864
Di(2-ethylehexyl) Phthalate 3 2,644
Tetrachloroethylene 6 1,196
Nickel 19 1,049
Benzo(g,h,i)perylene (a PAC) 23 464
Toluene Diisocyanate (mixed isomers) 3 415
1,2-Dichloroethane 1 362
1,3-Butadiene 4 292
N,N-Dimethylformamide 1 275
1,3-Dichloropropylene 1 80
Trans-1,3-Dichloropropene 1 37
Acrylamide 1 23
Pentachlorophenol 5 5
TRI on Tribal Lands
Congress gave EPA the authority to ensure that environmental programs designed to protect human
health and the environment are carried out throughout the United States, including tribal lands. EPA
works with tribes on a government-to-government basis to protect the air, land, and water in Indian
country and to support tribal assumption of program authority.
According to EPA data, there were 49 TRI facilities located on lands in 19 tribal nations within the lower
48 states and Alaska. Total disposal and other releases from these facilities was 9.6 million pounds. Two
electric utilities located on Navajo Nation Reservation (Arizona/New Mexico) accounted for almost two-
thirds (64 percent) of the total. More than three-quarters (79 percent) of releases were to land.

18
Tribal Lands in Washington State
There are 29 federally recognized tribes within Washington. TRI facilities are located on three of these
tribal lands – Puyallup Reservation, Yakama Nation Reservation, and Tulalip Tribes Reservation. In
2009, 21 facilities on tribal lands reported 94 chemicals to TRI, for a total on-site release of 1,198,616
pounds. Most of these releases (1,077,391 pounds or 90 percent) were to air.
The Puyallup Reservation (within Pierce County) had the highest number of TRI facilities in Washington
(16 of 21), and represents a third of the nation’s total (16 of 49). In Washington, they subsequently reported
the highest percentage of chemicals (87 of 94, or 93 percent) and total on-site releases (1,156,184, or 96
percent). The top three chemicals by volume accounted for 81 percent of all on-site releases for this
reservation. The top three chemicals by volume were hydrochloric acid, (468,905 pounds), methanol
(351,054 pounds), and ammonia (119,294 pounds). These chemicals are used primarily in the manufacture
of paper (ammonia, hydrochloric acid, and methanol), petroleum, and coal products (ammonia).
Four TRI facilities on the Yakama Nation Reservation (within Yakima and Klickitat counties) reported
41,922 pounds of on-site releases. These releases were for styrene used in the production of plastics.
One TRI facility on the Tulalip Reservation (within Snohomish County) reported releases of 510 pounds
for 2009, split evenly between chromium compounds and nickel compounds.
Risk-Screening of Environmental Indicators – A way to Identify Priorities
EPA developed the Risk Screening Environmental Indicators (RSEI) computer program to prioritize
toxic releases that might be of public health concern. RSEI uses many aspects of risk assessment
including:
The amount of chemical released. The fate and transport of the chemical. The route and extent of human exposure to the chemical. The number of people affected. The toxicity of the chemical.
The computer model takes the pounds of a chemical released to the environment, analyzes its toxicity
and risk to humans, and ranks its potential risk relative to other TRI chemical releases. RSEI scores can
be used for trend analysis and as a tool to target follow-up activities. The RSEI program can be
downloaded from EPA’s website: www.epa.gov/oppt/rsei.
The most recent year of TRI data available for RSEI modeling is 2007. The RSEI scores for Washington
show that risks from toxic chemicals has decreased since 2000 and has leveled out in most recent years.

19
Toxic release risks from manufacturers in Washington State by relative risk score, 1996-2007
Toxic release risks from manufacturers in Washington State – comparing carcinogens and non-carcinogens, 1996-2007
Figure 8 Figure 9
The newest RSEI model (version 2.3.0) assigns a higher risk to carcinogens. The spikes in 1998 and
2000 (Figures 8 and 9) are due to higher weighting of a large number of reported carcinogens, even
though the number of pounds of chemicals released between 1996 and 2007 has been relatively constant.
The chemicals that had the highest risk scores in 1998 are chromium and chromium compounds,
followed by chloroform, and polycyclic aromatic compounds. The chemicals that have the highest risk
scores in 2000 are PACs, followed by chromium and chromium compounds, and quinoline, a non-
carcinogen.
Table 11. Top Ten TRI Facilities Ranked by RSEI Score, 2007
Facility ID (TRIFID) Facility Name Pounds Score
98108SNDPR79168 Sound Propeller Services Inc. 18,666 1,416,191
98108RLMJR8531E Jorgensen Forge Corp. 410,377 1,347,500
98203CBSRV55SFI CB & I Services Inc. 8,012 400,352
98632WYRHS3401I Weyerhaeuser Co. 1,619,766 280,593
98409TLSFN3021S Atlas Castings & Technology (Bradken-Atlas) Tacoma 67,729 185,885
98930WLCHS504BI Welch’s 6,850 103,508
98134SHGRV3801E Ash Grove Cement 224 66,214
98033WSTRN8356T Western Pneumatic Tube Co. 76,408 44,901
98271SCSTN61303 Seacast Inc. 4,020 37,523
98421SMPSN801PO Simpson Tacoma Kraft Co. LLC 1,124,868 37,112
As shown in Table 12, chromium and chromium compounds had the highest values for risk-related
scores by chemical, followed by chloroform and nickel and nickel compounds.

20
Table 12. Top Ten TRI Chemicals Ranked by RSEI Score, 2007
Chemical Pounds Score
Chromium and chromium compounds 583,807 3,417,684
Chloroform 80,070 246,698
Nickel and nickel compounds 158,862 159,214
PAC chemical category 50,349 125,600
Formaldehyde 161,187 98,644
Acetaldehyde 322,730 52,581
Trichloroethylene 37,822 44,901
Manganese and manganese compounds 2,030,815 41,276
Benzene 84,543 19,848
Sulfuric acid 438,022 9,704
How are the Toxics Release Inventory Data Used?
TRI data are valuable because they are of high interest to and easily accessible by the public, fulfilling a
key goal for community right-to-know. The public can use TRI data to better understand the potential
risks from chemical releases to their communities. States and communities, working with business
operations, can use the information from the TRI and other reports collected under EPCRA to improve
chemical safety and protect the environment. Businesses are aware that these data are public records and
this transparency may lead to better chemical management practices.
When TRI data are used with demographic data, the results can help government agencies and the public
identify potential environmental justice concerns. Environmental justice is the fair treatment and
meaningful involvement of all people regardless of race, color, national origin, or income with respect to
the development, implementation, and enforcement of environmental laws, regulations, and policies.
The TRI is one of the primary databases used in environmental justice research. Specifically, TRI data
are often used in proximity-based studies examining the location of industrial facilities in relation to
community demographics. National and regional studies (including a Washington State study) have
used TRI data to demonstrate a pattern of low-income communities and people of color living
disproportionately near industrial facilities.
Residents living near TRI facilities, along with academic researchers, environmental organizations,
health and social welfare groups, and other interested parties, rely on the TRI data to provide
information about a community’s potential exposure to toxic chemicals released by local industrial
facilities. TRI data have helped communities better understand potential environmental and health
concerns from industrial sources and to investigate cumulative impacts.
The data also serve as a rough indicator of environmental progress over time. Federal, state, and local
governments have used TRI to set priorities, measure progress, and target areas of special and
immediate concern. For example, TRI data are used to measure pollution trends from specific industrial
sectors, and it provides an annual gauge of whether industrial pollution is going up or down. TRI data is
one indicator used in Ecology’s Beyond Waste Progress Report to track progress towards reducing
wastes and toxics. View the report online at www.ecy.wa.gov/beyondwaste/bwprog_front.html.
For chemicals of particular concern, such as mercury, dioxins, and other persistent bioaccumulative
toxics, the TRI is an especially important data source for environmental releases of these substances.

21
Data Limitations of the Toxics Release Inventory
TRI data cannot be used alone to determine risk. TRI data do not tell to what degree the public is
exposed to listed chemicals. Exposure to a chemical depends on many factors, including the type of
environmental medium (air, water, or land) into which a chemical is either disposed of or otherwise
released.
TRI chemicals also vary widely in toxicity. High volume releases of less toxic chemicals might seem to
be a more serious problem than lower volume releases of highly toxic chemicals. Just the opposite may
be true. Dioxins are a good example of a chemical that is highly toxic in small amounts.
TRI does not represent all toxic releases. It covers only those generally associated with manufacturing.
Emissions from vehicles, other types of businesses, and many other sources are not captured by the TRI.
For example, sources for the majority of releases of pesticides, volatile organic compounds, and
fertilizer chemicals common in agricultural use are not included. TRI also does not account for the toxic
chemicals found in personal care products, pharmaceuticals, wood smoke, and vehicle emissions that are
disposed down the drain, released into the air, or placed in landfills.
Since TRI information is collected for releases that occur during a calendar year, there is no way to
know exactly when the release took place. Releases (and thus potential exposures) may have occurred
throughout the year, or as one-time events. Further, because reports for each calendar year are due on
July 1 of the following year, the information is at least six months old even before it is submitted.
Also, while many facilities base their TRI data on actual measurements, other methods may be legally
used to estimate releases. The use of different measurement techniques makes data accuracy and
comparing data between facilities more difficult.
In spite of its limitations, TRI remains one of the most comprehensive environmental data resources
available since it does not focus on a single medium (air, land, or water). It is arguably the most widely
cited and tracked environmental indicator now used by the public, the news media, environmental
groups, and regulators.

22
The Toxics Release Inventory Over Time
TRI Timeline
1986 President Reagan signs into law the Emergency Planning and Community Right-to-Know Act of 1986 (EPCRA), which was commonly known as SARA Title III. Section 313 establishes the TRI Program.
1988 When TRI first began, manufacturing sector facilities reported releases of more than 300 chemicals and chemical categories. Initially, the collected data was confined to information on releases and certain transfers off site for further waste management.
1990 Congress passes the Pollution Prevention Act (PPA). Among its requirements is a mandate to expand TRI to include additional information on toxic chemicals in waste and on source reduction methods.
1991 Facilities are required to report quantities of TRI chemicals treated on site, recycled, and burned for energy recovery. The TRI program becomes a powerful tool that provides information on how facilities handle their chemicals and overall progress in reducing releases.
1994 Federal facilities are added to the list of facilities required to report under TRI.
1995 EPA issues rules that roughly doubles the number of chemicals included in the TRI to more than 600.
1998 Seven new industry sectors are added to expand coverage beyond the original covered facilities.
2000 Reporting thresholds for PBT chemicals are lowered to better track those with potential for serious harm even in small amounts. The chemical category of dioxin and dioxin-like compounds are added to the TRI list along with six additional PBT chemicals.
2006 A Burden Reduction Rule is passed that increases the number of facilities eligible to report on TRI’s Form A. For the first time, PBT chemicals (except dioxin and dioxin-like compounds) can be filed on Form A, and the threshold for total pounds of releases is raised from 500 to 5,000 pounds. Now more facilities can report using Form A and details of these releases and other waste management activities are not provided to EPA, the states, or to communities.
2007 Industries that report under TRI must now identify themselves under the more detailed six-digit North American Industry Classification System (NAICS) rather than the previous four-digit Standard Industry Classification (SIC) codes. These codes are used throughout the federal government to classify economic activity by industry. The switch from a four-digit SIC to a six-digit NAICS code does not affect the number of facilities required to report under TRI, but allows for greater precision and flexibility when grouping activities by industry. NAICS codes are reviewed every five years for potential revisions so that the classification system can keep the pace with the changing economy. Note: For the 2007 reporting year, the 2002 NAICS codes were used. Beginning with the 2008 reporting year, TRI facilities are required to use the 2007 NAICS codes. More information about the NAICS codes used for TRI reporting is available on EPA’s website at www.epa.gov/tri/lawsandregs/naic.
2009 In recognition of the importance of TRI data, the Omnibus Appropriations Act amends the Burden Reduction Rule of 2006, returning reporting thresholds to their previous lower limits. The requirements of the Act are in effect for the 2008 reporting year.
2011 EPA finalizes a rule to add 16 new chemicals to the TRI chemical list – the first chemical expansion in nearly ten years. These chemicals are added because they are suspected carcinogens. The final rule is effective for the 2011 reporting year, with the first reports due July 1, 2012.

23
TRI will continue to change over time as new chemicals of concern are identified and additional
industry sectors are added to the TRI reporting universe.
For more information
This publication is available on Ecology’s website at www.ecy.wa.gov/biblio/1104006.html. More
detailed information including supporting data is available on the web at www.ecy.wa.gov/epcra.


25
Appendix A 2009 Tier Two Reporting By LEPC
LEPC Reporting Facilities Chemicals Reported EHS Reporting
Facilities EHS Chemicals
Reported
Adams 45 209 23 77
Asotin 10 22 3 3
Benton 95 505 55 119
Chelan 89 405 56 123
City of Kent 96 786 51 101
City of Seattle 145 788 98 155
Clallam 59 208 25 36
Clark 146 819 55 116
Columbia 22 62 8 15
Cowlitz 76 918 39 145
Douglas 36 97 22 31
Ferry 9 44 1 9
Fort Lewis 1 40 1 3
Franklin 86 847 38 151
Garfield 13 25 7 8
Grant 190 1,036 73 221
Grays Harbor 69 241 27 38
Island 34 92 9 9
Jefferson 21 95 8 12
King 577 1,875 407 631
Kitsap 89 247 41 53
Kittitas 46 82 23 26
Klickitat 16 57 10 17
Lewis 75 341 31 61
Lincoln 37 104 25 34
Mason 33 102 11 12
Okanogan 71 231 42 75
Pacific 25 66 11 13
Pend Oreille 12 89 4 10
Pierce 270 1,344 145 203
San Juan 5 10 2 2
Skagit 91 752 35 77
Skamania 4 10 2 2
Snohomish 283 949 98 127
Snohomish (SW) 28 57 8 11
Spokane 209 906 101 143
Stevens 23 76 10 14
Thurston 95 279 38 45
Wahkiakum 4 11 3 4

26
LEPC Reporting Facilities Chemicals Reported EHS Reporting
Facilities EHS Chemicals
Reported
Walla Walla 76 390 31 87
Whatcom 110 540 57 102
Whitman 57 279 40 76
Yakima 230 876 157 358

27
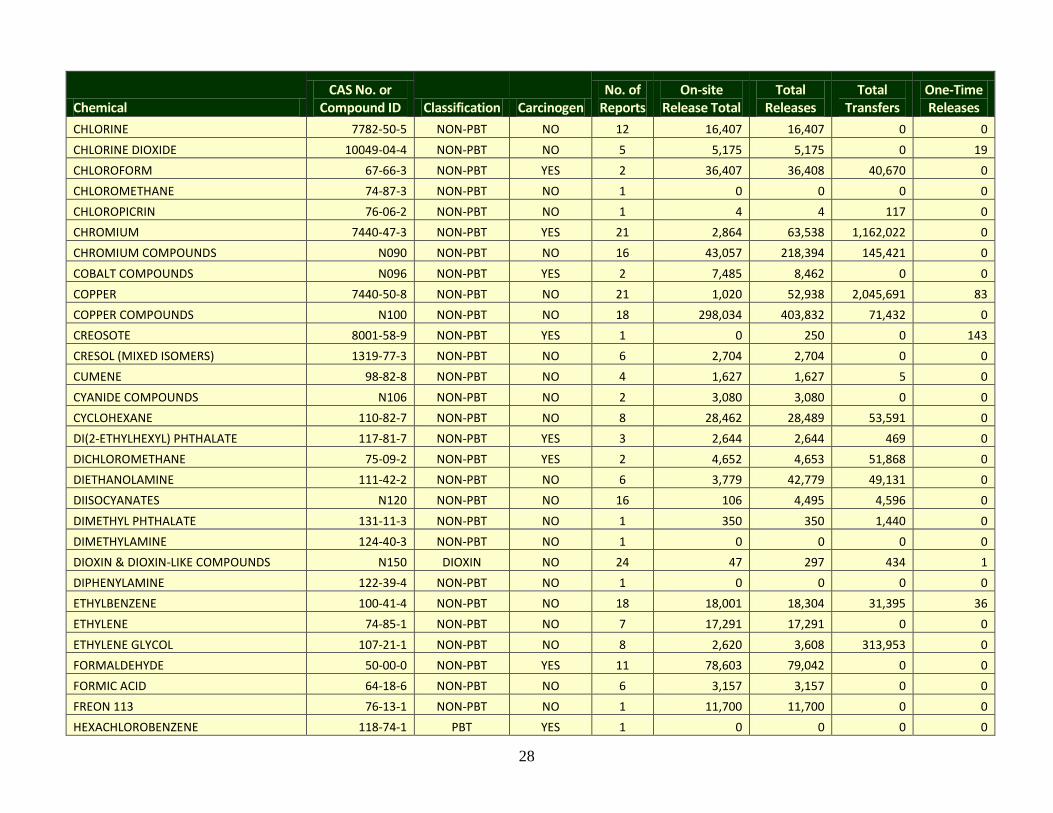
Appendix B
Washington State TRI Chemicals, 2009 (all in pounds EXCEPT dioxins, which are in grams)
Chemical CAS No. or
Compound ID Classification Carcinogen No. of
Reports On-site
Release Total Total
Releases Total
Transfers One-Time Releases
1,1,1-TRICHLOROETHANE 71-55-6 NON-PBT NO 1 28 28 347 0
1,2,4-TRIMETHYLBENZENE 95-63-6 NON-PBT NO 20 22,144 22,883 15,667 20
1,2-DICHLOROETHANE 107-06-2 NON-PBT YES 1 362 362 40,477 0
1,3-BUTADIENE 106-99-0 NON-PBT YES 4 292 292 22 0
1,3-DICHLOROPROPYLENE 542-75-6 NON-PBT YES 1 80 80 554 0
ACETALDEHYDE 75-07-0 NON-PBT YES 7 294,947 294,951 0 0
ACETONITRILE 75-05-8 NON-PBT NO 2 253 253 87,161 0
ACRYLAMIDE 79-06-1 NON-PBT YES 1 23 23 106 0
ACRYLIC ACID 79-10-7 NON-PBT NO 1 0 0 0 0
ALUMINUM (FUME OR DUST) 7429-90-5 NON-PBT NO 3 1,501 80,121 0 0
AMMONIA 7664-41-7 NON-PBT NO 31 824,395 925,137 67,158 3,440
ANTHRACENE 120-12-7 NON-PBT NO 3 23 23 0 0
ANTIMONY 7440-36-0 NON-PBT NO 1 23 111 3 0
ANTIMONY COMPOUNDS N010 NON-PBT NO 2 0 0 0 0
ARSENIC COMPOUNDS N020 NON-PBT NO 5 5,175 5,175 250 0
BARIUM COMPOUNDS N040 NON-PBT NO 10 1,582,768 1,759,706 690 0
BENZENE 71-43-2 NON-PBT YES 16 39,347 39,951 4,721 12
BENZO(G,H,I)PERYLENE 191-24-2 PBT YES 23 464 5,508 0 0
BENZOYL PEROXIDE 94-36-0 NON-PBT NO 1 5 5 0 0
BIPHENYL 92-52-4 NON-PBT NO 3 564 564 1,554 4
CADMIUM COMPOUNDS N078 NON-PBT NO 1 4 9 0 0
CARBON DISULFIDE 75-15-0 NON-PBT NO 5 2,669 2,669 0 0
CARBONYL SULFIDE 463-58-1 NON-PBT NO 6 756,026 756,026 0 0
CATECHOL 120-80-9 NON-PBT NO 7 368 371 3,737 0
CERTAIN GLYCOL ETHERS N230 NON-PBT NO 11 363,490 363,505 276,164 0
28
Chemical CAS No. or
Compound ID Classification Carcinogen No. of
Reports On-site
Release Total Total
Releases Total
Transfers One-Time Releases
CHLORINE 7782-50-5 NON-PBT NO 12 16,407 16,407 0 0
CHLORINE DIOXIDE 10049-04-4 NON-PBT NO 5 5,175 5,175 0 19
CHLOROFORM 67-66-3 NON-PBT YES 2 36,407 36,408 40,670 0
CHLOROMETHANE 74-87-3 NON-PBT NO 1 0 0 0 0
CHLOROPICRIN 76-06-2 NON-PBT NO 1 4 4 117 0
CHROMIUM 7440-47-3 NON-PBT YES 21 2,864 63,538 1,162,022 0
CHROMIUM COMPOUNDS N090 NON-PBT NO 16 43,057 218,394 145,421 0
COBALT COMPOUNDS N096 NON-PBT YES 2 7,485 8,462 0 0
COPPER 7440-50-8 NON-PBT NO 21 1,020 52,938 2,045,691 83
COPPER COMPOUNDS N100 NON-PBT NO 18 298,034 403,832 71,432 0
CREOSOTE 8001-58-9 NON-PBT YES 1 0 250 0 143
CRESOL (MIXED ISOMERS) 1319-77-3 NON-PBT NO 6 2,704 2,704 0 0
CUMENE 98-82-8 NON-PBT NO 4 1,627 1,627 5 0
CYANIDE COMPOUNDS N106 NON-PBT NO 2 3,080 3,080 0 0
CYCLOHEXANE 110-82-7 NON-PBT NO 8 28,462 28,489 53,591 0
DI(2-ETHYLHEXYL) PHTHALATE 117-81-7 NON-PBT YES 3 2,644 2,644 469 0
DICHLOROMETHANE 75-09-2 NON-PBT YES 2 4,652 4,653 51,868 0
DIETHANOLAMINE 111-42-2 NON-PBT NO 6 3,779 42,779 49,131 0
DIISOCYANATES N120 NON-PBT NO 16 106 4,495 4,596 0
DIMETHYL PHTHALATE 131-11-3 NON-PBT NO 1 350 350 1,440 0
DIMETHYLAMINE 124-40-3 NON-PBT NO 1 0 0 0 0
DIOXIN & DIOXIN-LIKE COMPOUNDS N150 DIOXIN NO 24 47 297 434 1
DIPHENYLAMINE 122-39-4 NON-PBT NO 1 0 0 0 0
ETHYLBENZENE 100-41-4 NON-PBT NO 18 18,001 18,304 31,395 36
ETHYLENE 74-85-1 NON-PBT NO 7 17,291 17,291 0 0
ETHYLENE GLYCOL 107-21-1 NON-PBT NO 8 2,620 3,608 313,953 0
FORMALDEHYDE 50-00-0 NON-PBT YES 11 78,603 79,042 0 0
FORMIC ACID 64-18-6 NON-PBT NO 6 3,157 3,157 0 0
FREON 113 76-13-1 NON-PBT NO 1 11,700 11,700 0 0
HEXACHLOROBENZENE 118-74-1 PBT YES 1 0 0 0 0

29
Chemical CAS No. or
Compound ID Classification Carcinogen No. of
Reports On-site
Release Total Total
Releases Total
Transfers One-Time Releases
HYDROCHLORIC ACID ("ACID AEROSOLS" ONLY) 7647-01-0 NON-PBT NO 17 1,054,918 1,054,918 0 0
HYDROGEN CYANIDE 74-90-8 NON-PBT NO 3 1,163 1,163 1 0
HYDROGEN FLUORIDE 7664-39-3 NON-PBT NO 14 315,381 318,110 19,115 0
LEAD 7439-92-1 PBT YES 66 1,151,249 1,219,757 89,931 929,978
LEAD COMPOUNDS N420 PBT NO 74 537,864 583,051 396,168 54
LITHIUM CARBONATE 554-13-2 NON-PBT NO 1 0 0 0 0
MANGANESE 7439-96-5 NON-PBT NO 23 6,548 172,776 158,039 0
MANGANESE COMPOUNDS N450 NON-PBT NO 17 555,305 761,337 438,786 0
MERCURY 7439-97-6 PBT NO 6 12 410 1,570 0
MERCURY COMPOUNDS N458 PBT NO 19 747 829 87 0
METHAM SODIUM 137-42-8 NON-PBT NO 2 2,302 3,113 203 0
METHANOL 67-56-1 NON-PBT NO 29 1,914,944 1,918,587 158,301 1
METHYL ISOBUTYL KETONE 108-10-1 NON-PBT NO 8 31,429 32,580 37,496 0
METHYL METHACRYLATE 80-62-6 NON-PBT NO 2 5,635 5,635 0 0
METHYL TERT-BUTYL ETHER 1634-04-4 NON-PBT NO 1 355 355 47,545 0
MOLYBDENUM TRIOXIDE 1313-27-5 NON-PBT NO 4 260 260 0 0
M-XYLENE 108-38-3 NON-PBT NO 1 78 78 0 0
N,N-DIMETHYLFORMAMIDE 68-12-2 NON-PBT YES 1 275 275 65,051 0
NAPHTHALENE 91-20-3 NON-PBT NO 25 9,694 16,618 9,326 15
N-BUTYL ALCOHOL 71-36-3 NON-PBT NO 9 198,989 198,989 186,329 0
N-HEXANE 110-54-3 NON-PBT NO 15 76,638 76,709 43,682 32
NICKEL 7440-02-0 NON-PBT YES 19 1,049 38,715 104,838 0
NICKEL COMPOUNDS N495 NON-PBT NO 10 23,693 169,387 65,275 0
NITRATE COMPOUNDS N511 NON-PBT NO 46 1,261,666 1,308,085 2,390,003 42,100
NITRIC ACID 7697-37-2 NON-PBT NO 27 3,460 106,920 597,212 0
N-METHYL-2-PYRROLIDONE 872-50-4 NON-PBT NO 3 23,230 23,231 456,528 0
PENTACHLOROPHENOL 87-86-5 NON-PBT YES 5 5 33 2,482 24
PHENANTHRENE 85-01-8 NON-PBT NO 4 218 218 9 1
PHENOL 108-95-2 NON-PBT NO 18 151,824 152,197 9,748 3

30
Chemical CAS No. or
Compound ID Classification Carcinogen No. of
Reports On-site
Release Total Total
Releases Total
Transfers One-Time Releases
POLYCHLORINATED BIPHENYLS 1336-36-3 PBT YES 4 0 9,123 3,311 0
POLYCYCLIC AROMATIC COMPOUNDS N590 PBT YES 31 3,742 43,591 1,274 25
POTASSIUM DIMETHYLDITHIOCARBAMATE 128-03-0 NON-PBT NO 1 0 0 0 0
POTASSIUM N-METHYLDITHIOCARBAMATE 137-41-7 NON-PBT NO 1 25 25 0 0
PROPIONALDEHYDE 123-38-6 NON-PBT NO 1 11 11 0 0
PROPYLENE 115-07-1 NON-PBT NO 7 26,190 26,190 267 3
PYRIDINE 110-86-1 NON-PBT NO 1 378 378 62,965 0
SILVER 7440-22-4 NON-PBT NO 2 10 260 858,606 0
SODIUM DIMETHYLDITHIOCARBAMATE 128-04-1 NON-PBT NO 1 0 0 0 0
SODIUM NITRITE 7632-00-0 NON-PBT NO 2 0 0 0 0
STYRENE 100-42-5 NON-PBT YES 22 245,884 247,004 18,302 13
SULFURIC ACID ("ACID AEROSOLS" ONLY) 7664-93-9 NON-PBT NO 9 316,826 316,926 0 0
TETRABROMOBISPHENOL A 79-94-7 PBT YES 3 0 11 56 0
TETRACHLOROETHYLENE 127-18-4 NON-PBT YES 6 1,196 1,196 10 0
TOLUENE 108-88-3 NON-PBT NO 27 236,108 248,051 434,218 134
TOLUENE DIISOCYANATE (MIXED ISOMERS) 26471-62-5 NON-PBT YES 3 415 415 2,071 0
TRANS-1,3-DICHLOROPROPENE 10061-02-6 NON-PBT YES 1 37 37 265 0
TRICHLOROETHYLENE 79-01-6 NON-PBT YES 4 4,153 4,565 8,109 0
TRIETHYLAMINE 121-44-8 NON-PBT NO 1 116 116 3,838 0
VANADIUM COMPOUNDS N770 NON-PBT NO 2 52,963 53,281 0 0
XYLENE (MIXED ISOMERS) 1330-20-7 NON-PBT NO 25 123,578 125,914 299,230 190
ZINC (FUME OR DUST) 7440-66-6 NON-PBT NO 2 4,900 4,900 0 0
ZINC COMPOUNDS N982 NON-PBT NO 20 1,115,370 1,392,443 5,965,425 0
GRAND TOTAL (Pounds only, no dioxins) 1037 13,945,013 15,925,858 17,406,084 976,330