Embed Size (px)
Citation preview

Gerontological Gerontological NursingNursing
Patricia TabloskiPatricia Tabloski

Life ExpectancyLife Expectancy► All nations are facing an aging populationAll nations are facing an aging population
In 1997, approximately 10% world population was older than In 1997, approximately 10% world population was older than age 60age 60
This figure is projected to increase 15% by 2025This figure is projected to increase 15% by 2025► Women comprise 55% of the world’s older populationWomen comprise 55% of the world’s older population
The majority reside in developing countriesThe majority reside in developing countries Men have shorter life expectancies Men have shorter life expectancies
► Because of greater exposure to risk factors, both occupational Because of greater exposure to risk factors, both occupational and vocationaland vocational
► Women will close this gender gap if they increase their risk Women will close this gender gap if they increase their risk exposuresexposures
► Life expectancy is also impacted by nationality, race, Life expectancy is also impacted by nationality, race, and socioeconomic status (SES).and socioeconomic status (SES).

►FIGURE 1-1FIGURE 1-1 U.S. population age U.S. population age structure, 2000 and 2030 (projected). structure, 2000 and 2030 (projected). Source: Center for Disease Control, 2004.Source: Center for Disease Control, 2004.
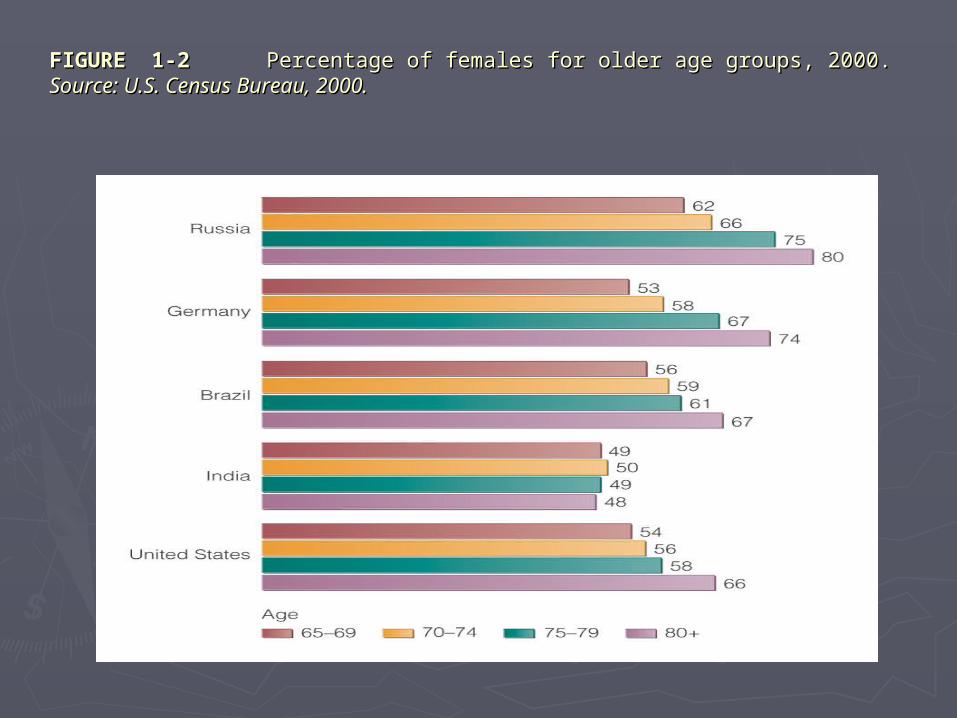
FIGUREFIGURE 1-21-2 Percentage of females for older age groups, 2000. Percentage of females for older age groups, 2000. Source: Source: U.S. Census Bureau, 2000.U.S. Census Bureau, 2000.

FIGUREFIGURE 1-31-3 Life expectancy at birth for selected countries, 1900–1998. Life expectancy at birth for selected countries, 1900–1998. Source: U.S. Census Bureau, 2000.Source: U.S. Census Bureau, 2000.

FIGUREFIGURE 1-41-4 U.S. population percent change by age between 1990 and U.S. population percent change by age between 1990 and 2000. 2000. Source: U.S. Census Bureau. Census 2000 Summary File 1: 1990 Census Source: U.S. Census Bureau. Census 2000 Summary File 1: 1990 Census of Population. General Population Characteristics, United States (1990 of Population. General Population Characteristics, United States (1990 C.P.1.13)C.P.1.13)

Life after 65Life after 65► Chronic conditions develop over time.Chronic conditions develop over time.► Nurses can intervene using three levels of Nurses can intervene using three levels of
preventionprevention PrimaryPrimary SecondarySecondary TertiaryTertiary
► In 1990, two of the leading causes of death among In 1990, two of the leading causes of death among elders, heart disease and stroke, declined by 1/3elders, heart disease and stroke, declined by 1/3
► Seventy percent of physical decline is a result of Seventy percent of physical decline is a result of modifiable risk factorsmodifiable risk factors TobaccoTobacco Poor nutritionPoor nutrition InactivityInactivity Lack of preventive careLack of preventive care

FIGUREFIGURE 1-51-5 Selected chronic conditions affecting U.S. adults age 70 Selected chronic conditions affecting U.S. adults age 70 or older. or older. Source: Centers for Disease Control. National Center for Health Source: Centers for Disease Control. National Center for Health Statistics. Supplement on Aging Study and Second Supplement on Aging Statistics. Supplement on Aging Study and Second Supplement on Aging Study. 1995. Study. 1995.


Myths of AgingMyths of Aging►Myths of Aging Myths of Aging
““You can’t teach an old dog new tricks”You can’t teach an old dog new tricks” ““Dirty old man”Dirty old man” Disease and disability are an inevitable part of Disease and disability are an inevitable part of
agingaging Health promotion is wasted on older peopleHealth promotion is wasted on older people The elderly do not pull their own weightThe elderly do not pull their own weight
►Myths of aging lead to:Myths of aging lead to: AgeismAgeism Reduced healthcare servicesReduced healthcare services Segregation of elders from mainstream societySegregation of elders from mainstream society Nurse recruitment difficultiesNurse recruitment difficulties

Chronic ConditionsChronic Conditions►Seventy percent of physical decline is Seventy percent of physical decline is
modifiable throughmodifiable through Smoking cessation Smoking cessation Improved nutritionImproved nutrition Physical activityPhysical activity Prevention of injuries from fallsPrevention of injuries from falls Improved use of Medicare-covered Improved use of Medicare-covered
preventive services preventive services

Chronic DiseaseChronic Disease►Leading chronic diseases are Leading chronic diseases are
treatable but not curable.treatable but not curable.►Chronic diseaseChronic disease
Reduces quality of lifeReduces quality of life Limits activityLimits activity Requires assistance Requires assistance Increases healthcare costsIncreases healthcare costs Increases hospitalizationsIncreases hospitalizations Impacts emotional healthImpacts emotional health

Healthy People 2010 GoalsHealthy People 2010 Goals► Increase quality and quantity of Increase quality and quantity of
healthy lifehealthy life►Eliminate health disparitiesEliminate health disparities
Nurses can have significant impact on Nurses can have significant impact on people’s lives.people’s lives.

The Aging ProcessThe Aging Process►The aging process is multifactorial and The aging process is multifactorial and
includesincludes Benign changes, such as graying hairBenign changes, such as graying hair Nonbenign changes, such as senescenceNonbenign changes, such as senescence Individualized aging progressionIndividualized aging progression Modifiable changes related to lifestyleModifiable changes related to lifestyle Normal or universal aging processesNormal or universal aging processes

FIGUREFIGURE 1-71-7 Normal changes of aging. Normal changes of aging.

►Normal aging includesNormal aging includes Loss of organ reserves resulting in Loss of organ reserves resulting in
decreased response to physiological decreased response to physiological stress stress
Variations among individualsVariations among individuals Chronologic and physiologic aging, which Chronologic and physiologic aging, which
are not synonymous are not synonymous Organ system changesOrgan system changes
The Aging ProcessThe Aging Process

Biological Aging TheoriesBiological Aging Theories►Programmed TheoriesProgrammed Theories►Endocrine TheoryEndocrine Theory► Immunological TheoryImmunological Theory►Error TheoryError Theory►Wear and Tear TheoryWear and Tear Theory►Cross-Link TheoryCross-Link Theory►Free Radical TheoryFree Radical Theory►Somatic DNA Damage TheorySomatic DNA Damage Theory

Psychological Aging TheoriesPsychological Aging Theories► Jung’s Theory of IndividualismJung’s Theory of Individualism►Erikson’s Developmental TheoryErikson’s Developmental Theory

Sociological Aging TheoriesSociological Aging Theories►Disengagement Theory Disengagement Theory ►Activity TheoryActivity Theory►Continuity TheoryContinuity Theory

Evolution of the Study of AgingEvolution of the Study of Aging►1950s and 1960s disease based1950s and 1960s disease based►Today, holistic and health promotion Today, holistic and health promotion
focusedfocused


