Embed Size (px)
Citation preview

7/27/2019 Chpt_3_presentationscoot.ppt
http://slidepdf.com/reader/full/chpt3presentationscootppt 1/35
CHAPTER 3
The Decision
UsefulnessApproach to
Financial
ReportingNicole Fitzmaurice,Eric Poolman, Lisa Landon,Pang Sing Koh & Ping Zhou

7/27/2019 Chpt_3_presentationscoot.ppt
http://slidepdf.com/reader/full/chpt3presentationscootppt 2/35
DECISION USEFULNESS APPROACH
Topics:
Single Person Decision Theory
The Information System
Information defined Rational, Risk-Adverse Investor
Investment Theory
The Principle of Portfolio Diversification
The Optimal Investment Decision
Portfolio Risk
Reaction of Professional Accounting Bodies to theDecision Usefulness Approach

7/27/2019 Chpt_3_presentationscoot.ppt
http://slidepdf.com/reader/full/chpt3presentationscootppt 3/35
3.2 DECISION USEFULNESS APPROACH
Who are the users of the financial statements?
Investors, lenders, managers, unions,
government and standard setters (invisible)
What are the decision problems of the users?
whether to invest or lend funds make company decisions
see if companies are complying toregulations

7/27/2019 Chpt_3_presentationscoot.ppt
http://slidepdf.com/reader/full/chpt3presentationscootppt 4/35
3.3 SINGLE PERSON DECISION THEORY
Decisions made under conditions ofuncertainty
State probabilities are no longer objective
Formal procedures are set up to assist inmaking the best decision.

7/27/2019 Chpt_3_presentationscoot.ppt
http://slidepdf.com/reader/full/chpt3presentationscootppt 5/35
3.3.1 DECISION THEORY APPLIED
Bill Cautious has $10,000 to invest in either shares of X Ltd or government bondsyielding 2 ¼ %.
State 1: X Ltd future performance high
net return is $1,600
State 2: X Ltd future performance low
net return is $0

7/27/2019 Chpt_3_presentationscoot.ppt
http://slidepdf.com/reader/full/chpt3presentationscootppt 6/35
PAYOFF TABLE
probability of state 1 = .30
probability of state 2 = .70
ACT STATE
High Low
Buy shares $ 1,600 $ 0
Buy bonds $ 225 $ 225

7/27/2019 Chpt_3_presentationscoot.ppt
http://slidepdf.com/reader/full/chpt3presentationscootppt 7/35
DECISION TREE
high performance - .30 Payoff (Utility)
$1600 (40)
shares
Invest --------- low performance - .70
($10,000) $0 (0)
performance high or low – 1.00
bonds $225 (15)
Shares = (.30 x 40) + (.70 x 0) = 12
Bonds = 1.00 x 15 = 15

7/27/2019 Chpt_3_presentationscoot.ppt
http://slidepdf.com/reader/full/chpt3presentationscootppt 8/35
ALTERNATIVE 2FINANCIAL STATEMENT PROBABILITY
High state firm:
P(GN/H) = .80P(BN/H) = .20
Low state firm:
P(GN/L) = .10P(BN/L) = .90
Where:
GN = Good newsBN = Bad news
H = high performance
L = low performance
7/27/2019 Chpt_3_presentationscoot.ppt
http://slidepdf.com/reader/full/chpt3presentationscootppt 9/35
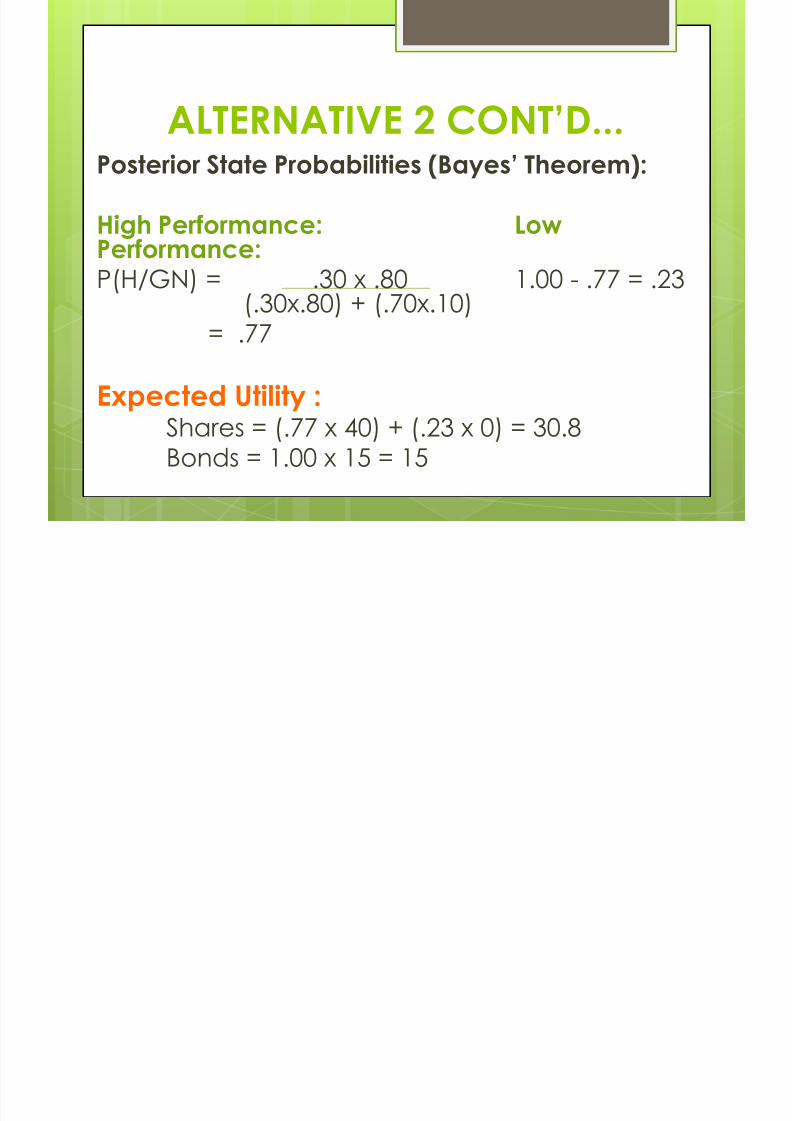
ALTERNATIVE 2 CONT’D...Posterior State Probabilities (Bayes’ Theorem):
High Performance: Low
Performance:P(H/GN) = .30 x .80 1.00 - .77 = .23
(.30x.80) + (.70x.10)= .77
Expected Utility :Shares = (.77 x 40) + (.23 x 0) = 30.8Bonds = 1.00 x 15 = 15

7/27/2019 Chpt_3_presentationscoot.ppt
http://slidepdf.com/reader/full/chpt3presentationscootppt 10/35
FINANCIAL STATEMENT
INFORMATION USEFULNESS It is important for users to know why financial
statement information is useful
WHY Because the usefulness helps investors predict future
investment returns/payoffs
Under non-ideal conditions the financial statementdoes not give direct information about expected
future firm performance
However, FS information is still useful
Under the assumption good or bad new willcontinue in the future

7/27/2019 Chpt_3_presentationscoot.ppt
http://slidepdf.com/reader/full/chpt3presentationscootppt 11/35
3.3.2 THE INFORMATION SYSTEM
"An information system is a table giving, conditional oneach state of nature, the objective probability of each
possible financial statement evidence item."
main
diagonal
probabilities
off-main
diagonal
probabilities

7/27/2019 Chpt_3_presentationscoot.ppt
http://slidepdf.com/reader/full/chpt3presentationscootppt 12/35
3.3.2 THE INFORMATION SYSTEM
Higher the main diagonal probabilities the moreuseful the FS information becomes
Thus investors can better predict the expectedfuture firm performance
Noise: represents the weakening of the relationshipbetween the current FS information and future firmperformance
NOTE information system concept is decision-
specific

7/27/2019 Chpt_3_presentationscoot.ppt
http://slidepdf.com/reader/full/chpt3presentationscootppt 13/35
3.3.3 INFORMATION DEFINED“Information is evidence that has the
potential to affect an individual’s decision.”
Information is used to come to aconclusion
Once information is gathered anindividuals conclusions may change
FS, if reliable and relevant, are importantsource of information

7/27/2019 Chpt_3_presentationscoot.ppt
http://slidepdf.com/reader/full/chpt3presentationscootppt 14/35
3.4 THE RATIONAL, RISK-AVERSEINVESTOR
Maximizes expected utility
A model of how the average investor should make
decisions Does not imply that all investors make decisions this way
Investor is usually assumed to be risk-averse
When faced with 2 choices with the same expectedpayoff, would prefer the one with lower risk .
Risk costs something, causing trade-off between risk andreturn
How to model?
Concave utility function for payoff
7/27/2019 Chpt_3_presentationscoot.ppt
http://slidepdf.com/reader/full/chpt3presentationscootppt 15/35
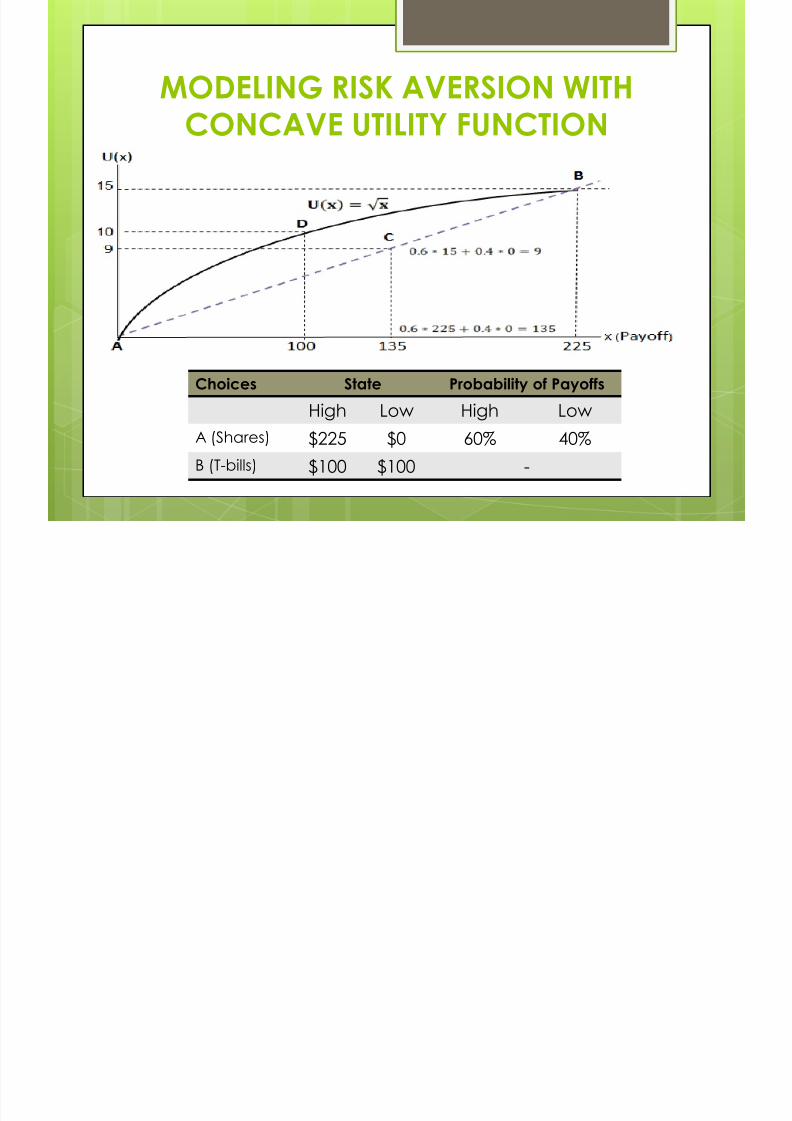
MODELING RISK AVERSION WITH
CONCAVE UTILITY FUNCTION
Choices State Probability of Payoffs
High Low High Low
A (Shares) $225 $0 60% 40%
B (T-bills) $100 $100 -
7/27/2019 Chpt_3_presentationscoot.ppt
http://slidepdf.com/reader/full/chpt3presentationscootppt 16/35
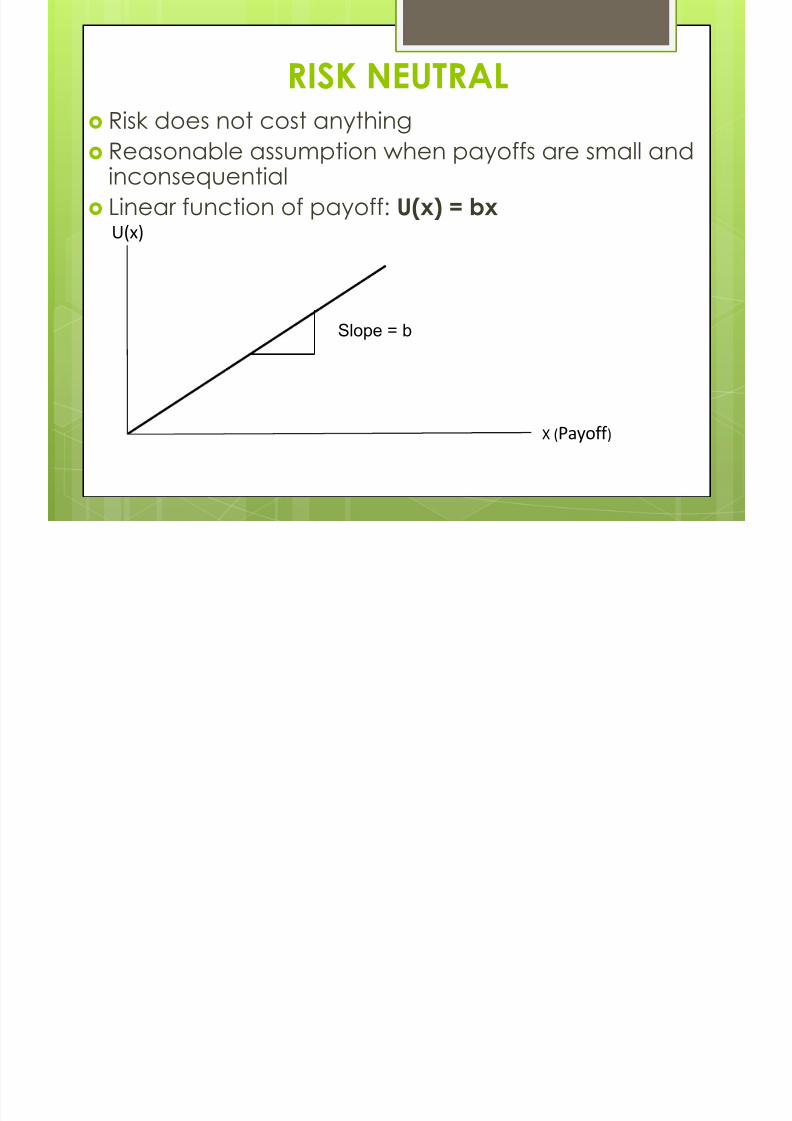
RISK NEUTRAL
Risk does not cost anything Reasonable assumption when payoffs are small and
inconsequential
Linear function of payoff: U(x) = bx
X (Payoff )
U(x)
Slope = b

7/27/2019 Chpt_3_presentationscoot.ppt
http://slidepdf.com/reader/full/chpt3presentationscootppt 17/35
3.5 Principle of Portfolio
Diversification Now, will use mean-variance utility function to model risk
aversion
o Utility increases with expected rate of return, decreases with risk of return
Principle of Portfolio Diversification
o Holding expected rate of return constant, more than oneinvestment spreads risk and increases utility, provided the returns
are not perfectly correlatedo Market-wide factors affecting returns
Non-diversifiable
o Firm-specific factors affecting returns
Diversifiable
+ -

7/27/2019 Chpt_3_presentationscoot.ppt
http://slidepdf.com/reader/full/chpt3presentationscootppt 18/35
EXAMPLE 1Toni, a risk-averse investor has $200 to invest
Payoffs from firm A’s share:
If shares increase: $230 (Probability = 0.74)
If shares decrease: $180 (Probability = 0.26)
Payoff Rate of Return Probability Expected Rate
of ReturnVariance
$230 (230 – 200) /
200 = 0.15
0.74 0.1110 (0.15 – 0.085)2 x .74
= 0.0031
$180 (180 - 200) /200 = -0.10
0.26 -0.026 (-0.10 – 0.085)2 x .26= 0.0089

7/27/2019 Chpt_3_presentationscoot.ppt
http://slidepdf.com/reader/full/chpt3presentationscootppt 19/35
EXAMPLE 1 CONT’D
Assume that Toni’s utility function is:
Utility from this investment is:
(2 x 0.085) – 0.012 = 0.1580
Can Toni do better?

7/27/2019 Chpt_3_presentationscoot.ppt
http://slidepdf.com/reader/full/chpt3presentationscootppt 20/35
EXAMPLE 2
Her utility now is:
(2 x 0.085) – 0.0074 = 0.1626 (0.158 in Example 1)
States Payoff Rate of Return Probability ExpectedRate of Return
Variance
GG $230 (230 – 200) / 200= 0.15
0.5742 0.0861 (0.15 – 0.085)2 x .5742= 0.0024
GB $214 (214 - 200) / 200= 0.07
0.1658 0.0116 (0.07 – 0.085)2
x .1658= 0.0000
BG $200 (200 - 200) / 200= 0.00
0.1008 0.0000 (0.00 – 0.085)2 x .1008= 0.0007
BB $184 (184 - 200) / 200
= -0.08
0.1592 -0.0127 (-0.08 – 0.085)2 x .1592
= 0.0043
Buy 2 Investments instead, Investment A and B

7/27/2019 Chpt_3_presentationscoot.ppt
http://slidepdf.com/reader/full/chpt3presentationscootppt 21/35
3.6 THE OPTIMAL INVESTMENT DECISION(IGNORING TRANSACTION COSTS)
To maximize diversification, buy the marketportfolio
Firm-specific risks are diversified away
Only systematic (economy-wide) risks remain
To maximize utility, buy a combination of
market portfolio and risk-free assetAchieve desired risk-return trade-off, depending
on investor’s risk -averseness
Does not undo the benefits of diversification

7/27/2019 Chpt_3_presentationscoot.ppt
http://slidepdf.com/reader/full/chpt3presentationscootppt 22/35
OPTIMAL PORTFOLIOINVESTMENT DECISION

7/27/2019 Chpt_3_presentationscoot.ppt
http://slidepdf.com/reader/full/chpt3presentationscootppt 23/35
3.7.1 CALCULATING AND
INTERPRETING BETA
Beta measures the changes in the price of asecurity in relation to changes in the market
A high beta stock's price will fluctuate by a largemargin in response to changes in the market
Using beta helps to attain desired level of risk in aportfolio

7/27/2019 Chpt_3_presentationscoot.ppt
http://slidepdf.com/reader/full/chpt3presentationscootppt 24/35
3.7.2 PORTFOLIO EXPECTED VALUE
AND VARIANCE Expected rate of return and variance need to be calculated
for the mean-variance utility function
Expected rate of return on a portfolio:
Variance of portfolio:
Covariance between securities can be expressed as:

7/27/2019 Chpt_3_presentationscoot.ppt
http://slidepdf.com/reader/full/chpt3presentationscootppt 25/35
3.7.3 PORTFOLIO RISK AS THENUMBER OF SECURITIES INCREASES
As securities in portfolio increase,
systematic risk increases rapidlyMost of the benefits of diversification can
be attained with relatively few securities inthe portfolio
Entire market portfolio does not need to bepurchase to adequately diversify

7/27/2019 Chpt_3_presentationscoot.ppt
http://slidepdf.com/reader/full/chpt3presentationscootppt 26/35
3.8 PROFESSIONAL ACCOUNTING REACTION
TO THE DECISION USEFULNESS APPROACH
Adopted by most of the major professional accountingbodies
FSAB adopted as part of the Conceptual Framework project,specifically mentions investors’ needs for information aboutthe uncertainty of future investments and their expectedvalues
Section 1000 does not mention the risk factor
Statement of Financial Accounting Concepts 1978 (SFAC 1)states the purpose of the project is
“ to set forth fundamentals on which financial accountingand reporting standards will be based”

7/27/2019 Chpt_3_presentationscoot.ppt
http://slidepdf.com/reader/full/chpt3presentationscootppt 27/35
SFAC 1
Objective 1 on financial reporting:
“to provide information that is useful topresent and potential investors andcreditors and other users in making
rational investment, credit, and similar decisions.”

7/27/2019 Chpt_3_presentationscoot.ppt
http://slidepdf.com/reader/full/chpt3presentationscootppt 28/35
SFAC 1Objective 2 on financial reporting:
“provide information to help present and
potential investors and creditors and other users in assessing the amounts, timing, anduncertainty of prospective cash receipts fromdividends or interest and the proceeds fromthe sale, redemption, or maturity of securitiesor loans.”
7/27/2019 Chpt_3_presentationscoot.ppt
http://slidepdf.com/reader/full/chpt3presentationscootppt 29/35
SFAC 1
INFORMATION SYSTEM LINKAGE
“although investment and credit decisions
reflect investors’ and creditors’ expectations
about future enterprise performance, thoseexpectations are commonly based at least
partly on evaluations of past enterpriseperformance.”

7/27/2019 Chpt_3_presentationscoot.ppt
http://slidepdf.com/reader/full/chpt3presentationscootppt 30/35
SFAC 2Relevant accounting information is capableof making a difference in a decision by
helping users to form predictions about thefuture outcomes of past, present and futureevents or to confirm or correct prior expectations.
Also important is timeliness.

7/27/2019 Chpt_3_presentationscoot.ppt
http://slidepdf.com/reader/full/chpt3presentationscootppt 31/35
CICA HANDBOOK SECTIONS
1000 & 1100 The CICA and FASB have accepted the decision
theory model as a guide to the preparation of
useful financial statement information Sections 1000 and 1100 of the CICA Handbook,
contain evidence of the decision theory model
Adherence to GAAP is essential so as to make
rational investor decisions relevantDeviation from standards renders the single-person
decision theory useless

7/27/2019 Chpt_3_presentationscoot.ppt
http://slidepdf.com/reader/full/chpt3presentationscootppt 32/35
EXPENSE ITBy John Lorinc
Main Issue: what is the proper accountingtreatment for employee stock optioncompensation?
Before: companies didn't have to expense thevalue of these items immediately after beingissued
After: governing bodies such as the FASB, IASB,and AcSB introduce regulations forcingcompanies to recognize these items once theyare issued

7/27/2019 Chpt_3_presentationscoot.ppt
http://slidepdf.com/reader/full/chpt3presentationscootppt 33/35
EXPENSE IT By John Lorinc
Secondary Issues: How do we effectively measure the value of
these expenses to be recorded on the financialstatements?
Most employee stock option compensationpackages come loaded with a range ofconditions and restrictions that make them
difficult to measureOptions can’t be sold or traded (only
exercised); employee must forfeit allunexercised options when leaving the firm, etc.

7/27/2019 Chpt_3_presentationscoot.ppt
http://slidepdf.com/reader/full/chpt3presentationscootppt 34/35
EXPENSE IT By John Lorinc
What method of valuation is appropriate?
Intrinsic value:
Based purely on the historic cost of the stock optionswhen issued
Fair value:
Taking into consideration all related factors that mightinfluence the reasonable cost of these items.
Estimating the expected life of the option and theratio between stock price and exercise price theemployee would seek before exercising the options

7/27/2019 Chpt_3_presentationscoot.ppt
http://slidepdf.com/reader/full/chpt3presentationscootppt 35/35
Questions?


