Embed Size (px)
Citation preview
Combining food web and species distribution models forimproved community projectionsLo€ıc Pellissier1,*, Rudolf P. Rohr2,*, Charlotte Ndiribe3, Jean-Nicolas Pradervand3, Nicolas Salamin3,Antoine Guisan3,† & Mary Wisz1,†
1Department of Bioscience, The Arctic Research Centre, Aarhus University, Ny Munkegade 114, DK-8000 Aarhus, Denmark2Integrative Ecology Group, Estaci�on Biol�ogica de Do~nana (EBD – CSIC), Calle Am�erico Vespucio s/n, Sevilla 41092, Spain3Department of Ecology and Evolution, University of Lausanne, Batiment Biophore, Lausanne CH-1015, Switzerland
Keywords
Biotic interactions, ecological niche modeling,
phylogeny, plant–herbivore interactions,
trophic network.
Correspondence
Lo€ıc Pellissier, Department of Bioscience, The
Arctic Research Centre, Aarhus University, Ny
Munkegade 114, DK-8000 Aarhus, Denmark.
Tel: +45 8715 8707; E-mail: loic.
Funding Information
This study was supported by the National
Science Foundation (NSF) Grant Nr. 31003A-
125145 (BIOASSEMBLE project), the Danish
Council for Independent Research Grant no.
12-126430 and FP7-REGPOT 2010-1
EcoGenes Project (Grant No. 264125).
Received: 5 June 2013; Revised: 3 September
2013; Accepted: 9 September 2013
Ecology and Evolution 2013; 3(13): 4572–
4583
doi: 10.1002/ece3.843
*L. P and R. P. R — Co-first authors.†A. G and M. W — Co-last authors.
Abstract
The ability to model biodiversity patterns is of prime importance in this era of
severe environmental crisis. Species assemblage along environmental gradients is
subject to the interplay of biotic interactions in complement to abiotic filtering
and stochastic forces. Accounting for complex biotic interactions for a wide
array of species remains so far challenging. Here, we propose using food web
models that can infer the potential interaction links between species as a con-
straint in species distribution models. Using a plant–herbivore (butterfly) inter-
action dataset, we demonstrate that this combined approach is able to improve
species distribution and community forecasts. The trophic interaction network
between butterfly larvae and host plant was phylogenetically structured and
driven by host plant nitrogen content allowing forecasting the food web model
to unknown interactions links. This combined approach is very useful in ren-
dering models of more generalist species that have multiple potential interac-
tion links, where gap in the literature may occur. Our combined approach
points toward a promising direction for modeling the spatial variation in entire
species interaction networks.
Introduction
Sound predictions of the composition and function of
future ecosystems are needed to inform decision-making
in the face of global change but remain one of the greatest
challenges facing ecological scientists (Mokany and Ferrier
2011; Nogu�es-Bravo and Rahbek 2011). Predicting which
species will occur when and where, and their potential
interactions requires an understanding of the complex
network of trophic linkages that vary in space and time, as
well as the associated competitive and facilitative effects
(Kissling et al. 2012; Wisz et al. 2013). Species distribution
models are spatially explicit models that are used to fill the
gaps in our knowledge of spatial distributions of biodiver-
sity, and recent advances in these are used to generate
community-level forecasts. These models have only recently
begun to incorporate the effect of biotic interactions, but so
far, only account for these effects indirectly (e.g., based on
correlations in occurrence patterns, Kissling et al. 2012)
and cannot divulge information about the way species may
or may not interact (Guisan and Thuiller 2005). In contrast
to these modeling tools, food web models are used to
understand and predict interaction links between species
within an interaction network in a given location, as well as
4572 ª 2013 The Authors. Ecology and Evolution published by John Wiley & Sons Ltd.
This is an open access article under the terms of the Creative Commons Attribution License, which permits use,
distribution and reproduction in any medium, provided the original work is properly cited.
measure patterns in the structure of food webs (Naisbit
et al. 2012), but these models are generally not spatially
explicit (but see Massol et al. 2011). Combining food web
models with species distribution models to predict spatial
variation in community composition remains an unex-
plored area in biodiversity modeling but would be a major
advancement for predictive ecology.
A common approach to improve species distribution
and community models is to consider the distribution of
interacting species as a predictor in statistical models
(Wisz et al. 2013). This approach is particularly straight-
forward when examining pairs of species that are known
to interact, for example, specialist species when there are
at most only a few obligate interactions (e.g., Ara�ujo and
Luoto 2007). In such cases, considering positive and neg-
ative correlations between species occurrence patterns in
models of species distribution and communities generally
improves model accuracy (Pellissier et al. 2010; Boulang-
eat et al. 2012; Giannini et al. 2013; Le Roux et al. 2013).
Accounting for correlations in the distributions between
species within distribution models can generate useful
information on the potential distribution of species given
the presence/absence of the known interacting species and
has enabled improved forecast of species’ fate under
future climate change (Schweiger et al. 2012; Giannini
et al. 2013). However, this approach is more difficult to
apply to more generalist species because it may be
unknown how these species interact with others, espe-
cially in cases where they do not yet co-occur but may do
with global change (Wisz et al. 2013). The difficulty in
accounting for species interactions is further heightened
when the goal is to model all species in a region and
predict community composition or richness. In this case,
species distribution modeling lacks the capacity to predict
occurrences for all the species in a region, while account-
ing for multiple and often partially known interactions
(Wisz et al. 2013).
Recently, a new approach for modeling food webs was
proposed by Rohr et al. (2010). This approach is based
on a statistical model that relates the presence and
absence of known trophic interactions (links) between
species to measureable traits that relate to trophic rela-
tionships (such as energy content, size, digestibility, mor-
phological characteristics linked with feeding, etc.) and
latent traits (Naisbit et al. 2012). These latent traits are
surrogates for properties of interacting species derived
from the combined information in the measured traits
and are estimated a posteriori from the matrix of trophic
interactions. The food web model can be interpolated by
fitting and predicting linkages between species to the
original dataset (here referred as “interpolation”) or
extrapolated by projecting the model on to an indepen-
dent dataset to infer potential links between poorly
known species, or species in a different or hypothetical
community (Clauset et al. 2008). The capacity to extrapo-
late a food web model has so far never been exploited,
nor have food web models been coupled with species
distribution models to predict assemblage structure and
function in space and time (Thuiller et al. 2013).
Here, we propose combining the strength of food web
models and species distribution models to account for
multiple interactions between species. This approach aims
to improve community projections by filling in gaps in
our knowledge about food webs through accounting for
multiple and potentially unknown interaction links across
species. Biotic interactions in species distribution models
among species of higher or lower trophic positions are
quite under-represented (Van der Putten et al. 2010)
compared to within trophic level (e.g., Ovaskainen et al.
2010; Laughlin et al. 2012). Extrapolation of food web
models within a species distribution modeling framework
is therefore a promising approach to fill gaps in our
knowledge about the interactions between species and to
produce more ecologically realistic forecasts. We test our
approach on a comprehensive spatial dataset of plant and
herbivore communities distributed along broad environ-
mental gradients in the Swiss Alps (Pellissier et al. 2013).
Because phylogenies provide relevant information to
understand and predict species trophic associations and
assemblages (Mouquet et al. 2012; Whitfeld et al. 2012;
Best et al. 2013; Pellissier et al. 2013), we reconstructed
two species-level phylogenies for plant species and butter-
fly species. We also measured several commonly used
plant palatability related traits (specific leaf area, leaf dry
matter content, leaf carbon, and nitrogen content Wright
et al. 2004) that are used to fit the food web models. Leaf
palatability traits represent important components medi-
ating plant–herbivore interactions (Ibanez et al. 2013).
We then compared the accuracy of species distribution
and community models using only abiotic predictors and
considering as a predictor the links inferred from the
food web models. We use this approach to address the
questions (1) Can statistical food web models be used for
extrapolation to an independent community? (2) Does
accounting for inferred interaction links in species distri-
bution models improve the accuracy of species distribu-
tion and community composition projections?
Methods
General framework
The core of our methodology resides in combining statis-
tical models for inferring a plant–butterfly food web and
spatial distribution models for projecting the spatial
distributions of butterflies. Food webs are only partially
ª 2013 The Authors. Ecology and Evolution published by John Wiley & Sons Ltd. 4573
L. Pellissier et al. Combining Food Web and Species Distribution Models
known, as observations of herbivores feeding on plants
are likely to be incomplete. Furthermore, in the illustra-
tion dataset (see description below), 38% of the plant–butterfly pairs of species are never detected in the same
place, and for these pairs, the assessment of the presence
or absence of a trophic link from field observation is
impossible. The inference of the linking probabilities was
achieved in two steps. First, we inferred the food web
consisting of a species subset with at least one trophic
link recorded. We used a statistical model based on latent
traits (Rohr et al. 2010) to infer the probabilities of tro-
phic links between plant and butterfly pairs. The model
used measurable plant traits as predictors and latent traits
to increase the prediction ability. Latent traits are surro-
gates for properties of interacting species (relating to e.g.,
foraging sucsceptibility, palatability, or nutrition content)
derived from the combined information in the measured
traits and are estimated a posteriori from the matrix of
trophic interactions. The probability of occurrence of
species in the landscape was calculated so that they were
constrained by their relationship to the abiotic environ-
ment, and also the “best-case scenario” trophic link prob-
abilities of the butterfly and plant species present at a
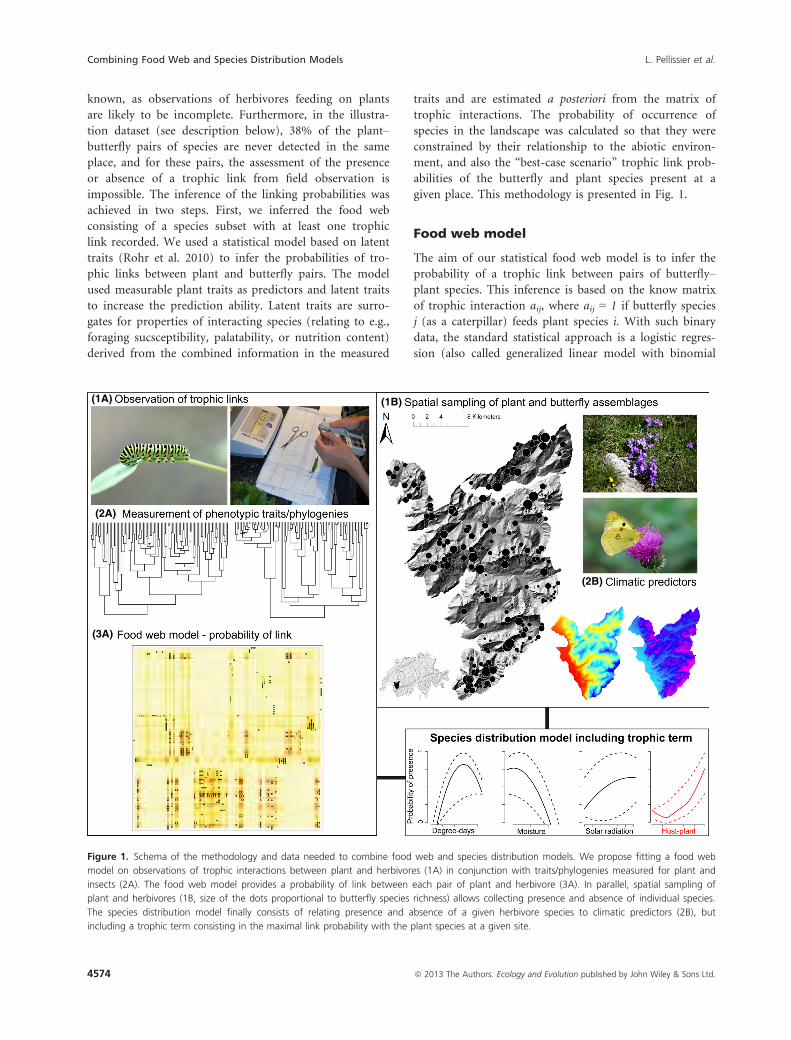
given place. This methodology is presented in Fig. 1.
Food web model
The aim of our statistical food web model is to infer the
probability of a trophic link between pairs of butterfly–plant species. This inference is based on the know matrix
of trophic interaction aij, where aij = 1 if butterfly species
j (as a caterpillar) feeds plant species i. With such binary
data, the standard statistical approach is a logistic regres-
sion (also called generalized linear model with binomial
(1A)
(2A)
(3A)
(1B)
(2B)
Figure 1. Schema of the methodology and data needed to combine food web and species distribution models. We propose fitting a food web
model on observations of trophic interactions between plant and herbivores (1A) in conjunction with traits/phylogenies measured for plant and
insects (2A). The food web model provides a probability of link between each pair of plant and herbivore (3A). In parallel, spatial sampling of
plant and herbivores (1B, size of the dots proportional to butterfly species richness) allows collecting presence and absence of individual species.
The species distribution model finally consists of relating presence and absence of a given herbivore species to climatic predictors (2B), but
including a trophic term consisting in the maximal link probability with the plant species at a given site.
4574 ª 2013 The Authors. Ecology and Evolution published by John Wiley & Sons Ltd.
Combining Food Web and Species Distribution Models L. Pellissier et al.
distribution) and we model the probability PFWij of a tro-
phic links between species i and j. As a probability takes
value between zero and one, the standard approach is to
write the model for the logit of the probability. We model
this probability using a similar function as in Rohr et al.
(2010):
logit PFWij
� �¼ aþ b1Nj þ b2AvgHj þ f 1i d
1v1j þ f 2i d2v2j : (1)
This model has two parts: (1) a standard linear part,
where Nj and AvHj denote the nitrogen level and average
height of plant species i (b1 and b2 are the corresponding
slopes, and a is the intercept) and (2) a latent trait part (
f 1i d1v1j and f 2i d2v
2j are the corresponding parameter esti-
mates) that quantifies, at the species level, what cannot be
captured by the linear part. Each species is characterized
by two latent traits, f 1i and f 2i for the butterfly species j,
and v1j and v2j for plants species i, and d1 and d2 are scal-
ing factors. Leaves with higher nitrogen content are more
palatable and nutritious to herbivores, and larger conspic-
uous plants may potentially be more susceptible to attract
herbivores (Pellissier et al. 2012b). Consequently, the two
latent traits of each butterfly species can be viewed as spe-
cies-specific foraging traits, while the plant latent traits can
be seen as species-specific susceptibility traits. These latent
traits aimed to quantified nonmeasured species’ character-
istics that are important in explaining the presence or
absence of trophic link, while taking into account the
measured species’ traits (here, the nitrogen level and the
average height of plant species). For the latent traits, as
the product of the plant vulnerability latent traits and but-
terfly foraging trait increases, so does the probability that
the butterfly feeds on the plant during its caterpillar stage.
The value of the latent traits is not know a priori, and they
are parameters to be inferred in the food web model from
data on observed trophic interactions.
The likelihood function of our latent trait model is
given by:
L ¼Yzij¼1
PFWij
� �aij � 1� PFWij
� �1�aij; (2)
where, as the trophic interactions are only partially
observed, the product only takes into account pairs of
species co-occurring at least once, that is, zij = 1. We cal-
culated the number of co-occurrence using the formula
presented in Pellissier et al. (2010). We fit the parameters
of the model using a Monte Carlo Markov Chain proce-
dure (specifically the Metropolis–Hasting algorithm),
adapted from Rohr et al. (2010), equation (2) as the like-
lihood function. The advantage of using the likelihood
function (2) is all the parameters, and the latent traits for
all species can be inferred, even if the trophic network is
incompletely known. Based on the inferred values, and
using the equation (1), we can predict the probability of
interaction between all pairs of butterfly and host plant
species in the food web.
Phylogeny as predictor for latent traits
Our observations used to compute values of latent traits
come from phylogenetically related species and cannot be
considered as independent observations. To account for
phylogenetic pseudoreplications, following Felsenstein
(1985), we used the phylogenetic correlation to predict
the latent traits and also to estimate the trophic link
probabilities for all pairs of species.
Here, we first examined whether there was such corre-
lation in the latent traits, using a phylogenetic regression
(Freckleton et al. 2002). Such correlation is expected, as
plant–herbivore interactions display generally a strong
phylogenetic component (Pellissier et al. 2013). A phylo-
genetic regression is similar to a standard linear regres-
sion, only that it does not assume independence of data
points, but rather that they are correlated (Freckleton
et al. 2002), that is,
vi �N ~v;C kð Þð Þ;where the variance–covariance matrix C(k) is given by:
C kð Þij ¼r2 i ¼ j
r2ktij i 6¼ j
�:
Here, r denotes the variance. This variance–covariancematrix derives the correlation between two latent traits
given by:
corðvi; vjÞ ¼ ktij;
where k, called Pagel’s k,is the parameter that controls for
the strength in the correlation from the phylogeny and tijis the fraction of time common between species i and j
on the phylogenetic tree. When the parameters of the
phylogenetic regression are fitted, they can be used to
predict the latent traits of a new species using conditional
expectation of a normal distribution:
vn ¼ ~v þXij
C kð Þni C kð Þ�1� �ijvj � ~v� �
: (3)
where the sum is made over all species for which at
least one interaction was recorded. Using equation (3),
the latent traits values are predicted for all the species
with unknown information. Based on these predicted
latent traits, the linking probabilities between all pairs of
plant–butterfly species are estimated using equation (1).
The phylogenetic regression is fitted in R (R Develop-
ment Core Team 2013), using the library ape. We tested
the predictive power of the food web model both
internally (fit) and externally using cross-validation.
ª 2013 The Authors. Ecology and Evolution published by John Wiley & Sons Ltd. 4575
L. Pellissier et al. Combining Food Web and Species Distribution Models

We measured it with the area under the curve (AUC) of
a receiver operating characteristic plot (ROC). We tested
whether the ability of the food web model to predict butter-
fly larvae association along with host plants differed among
the main butterfly families using a Kruskal–Wallis test.
Species distribution modeling
We modeled the species distributions using the presence
and absence for each species with four different techniques:
generalized linear model (GLM), generalized additive
model (GAM), gradient boosted model (GBM), and a ran-
dom forest model (RF). These four statistical techniques
are among the most commonly used in species distribution
modeling. To produce predictions independent of the cali-
bration data, we ran a tenfold cross-validation. We ran-
domly split the dataset into ten partitions, successively
calibrating the models with 90% of the data and sequen-
tially predicting the species distributions and communities
based on the remaining 10% data. We used three steps to
model the distribution of each species. First, we modeled
the distribution of the species using only abiotic predictors.
For the GLM model, the probability of presence of a
given butterfly species at a site k is then given by
logit PPRk
� � ¼ aþ b1ddegk þ b2mindk þ b3sradk:
where ddegk denotes the degree-days, mindk the moisture,
and sradk the solar radiations. Second, in concert with the
abiotic predictors, we added a biotic predictor comprising
the presence or absence at a given site of the obligatory
trophic partner from the biotic interactions as provided
by the literature. Third, alongside the abiotic predictors,
we added a biotic predictor comprising the highest proba-
bility of an interaction link with any of the plants occur-
ring at the site given by the food web model. For the
GLM model, the probability of presence of a given butter-
fly species at site k is then given by
logit PPRk
� � ¼ aþ b1ddegk þ b2mindk þ b3sradk
þ b4 maxplant j
present in site k
PFWij
� �:
where PFWij is the maximum or “best-case scenario” tro-
phic link probability predicted by our food web model.
We calculated the predictive power of the SDMs for each
species, technique and set of predictors using the AUC. In
addition, to obtain the community at each site, we stacked
all the species predicted using the threshold independent
resampling approach developed in Dubuis et al. (2011) and
Pellissier et al. (2013). We evaluated the projected commu-
nity composition to observed values using the Sørenson
index and compared the accuracy between abiotic and bio-
tic SDMs. The Sørenson index is computed as follow:
S�renson index ¼ 2a
2aþ bþ c
where a is the number of species that are both observed
and predicted as being present, b is the number of species
observed as present but predicted as absent, and c is the
number of species observed as absent but predicted as
present. Finally, we also compared species richness
between observed and predicted values following Pellissier
et al. (2012a,b) to assess whether richness predictions are
more accurate, once trophic interactions are included in
the models. Species distribution models were run in R
using the libraries referred in Thuiller et al. (2009). We
compared the species distribution and communities com-
position predictive accuracies between abiotic and biotic
models using paired Wilcoxon signed-rank tests.
Species data
To test our framework, we used a dataset collected in the
Western Swiss Alps spanning an elevation gradient from
1000 m to 3210 m a.s.l. (Fig. 1, Pellissier et al. 2013). Site
selection, which only included open vegetation grasslands,
was conducted following a balanced stratified random
sampling design based on elevation, slope, and aspect in
open grasslands (Hirzel and Guisan 2002). Sampling in
forests was avoided because they constitute suboptimal
habitats for the majority of Papilionoidea species in the
study area. Between May and September 2009 and 2010,
192 plots of 50 9 50 m were sampled across the whole
study area (700 km2, Fig. S1). All butterfly species belong-
ing to the Papilionoidea super-family (sensu Heikkil€a
et al. 2012) were monitored. We collected adult speci-
mens instead of caterpillars because they are more con-
spicuous, more reliable to survey and easier to identify.
For modeling purposes, we only considered species with
at least 10 occurrences and excluded very mobile species,
as these are not necessarily related to environments or
resources where they occur and may constitute noise in
our analyses (77 species in total). Because occurrences of
the butterfly species from our dataset had a low degree of
spatial autocorrelation (mean Moran’s I = 0.14, range
�0.04 to 0.55), we can be confident about the statistical
independence of the inventoried sites (see also Randin
et al. 2009). Plant species as potential hosts for butterfly
larvae were exhaustively inventoried in 4 m2 subplots at
the center of each butterfly plot. We ensured that the veg-
etation was representative of the entire 2500 m2 area from
which the butterflies were monitored. For each site, we
extracted climatic predictors known to influence plant
and insect establishment (Hodkinson 2005). All predictors
were interpolated from meteorological stations using a
digital elevation model (DEM) at 100 m resolution.
4576 ª 2013 The Authors. Ecology and Evolution published by John Wiley & Sons Ltd.
Combining Food Web and Species Distribution Models L. Pellissier et al.

Values for degree-days (above 0°C) and moisture index
(computed as the difference between precipitation and
evapotranspiration) were interpolated following Zimmer-
mann and Kienast (1999). Solar radiation values were
calculated using the tool implemented in ArcGIS 10. For
each plot location, we extracted the values of environ-
mental variables from the associated environmental layers.
To model the trophic interactions between each butter-
fly and host plant using the food web model, we collected
feeding preferences for the butterfly species recorded in
the plots from the literature (Pellissier et al. 2013). In
addition, leaf traits were gathered for all the 215 most
frequent and abundant vascular plant species occurring in
the study area (from a total of ~700 recorded species)
and span major portions of the angiosperm phylogeny
(Pellissier et al. 2013). Leaf nitrogen (N) was measured
from grounded dried leaves and was analyzed by combus-
tion with an elemental analyser. Canopy height was
measured from 10 individuals spanning the species eco-
logical conditions. In addition, the phylogenetic relation-
ships of all butterfly species found in the study area, and
the 215 plant species were inferred using DNA sequences
following methods described in Pellissier et al. (2013) (see
also Supplementary materials, Figures S1 and S2).
Results
Plant traits and phylogeny predict butterflyand host plant interactions
We fitted the food web model on 89 plant species that
are known to be eaten by at least one butterfly species
(Fig. 2). Based on this calibration dataset, the food web
model was able to predict the trophic associations
between butterfly species and their respective host plants
both internally (AUC fit = 0.96) and externally (AUC
cross-validation = 0.84). We found a significant effect of
plant nitrogen content in the susceptibility of being a
trophic resource for butterfly larvae (slope = 0.145,
P = 0.002). In addition, we found that the two latent
traits were significantly correlated with the plant and but-
terfly phylogenies. Based on the phylogenetic regression
(A)
(B)
Figure 2. Trophic interactions matrix between butterfly species (A) and plant species (B). Each column and row represents a butterfly and a plant
species, respectively. A black dot at an intersection represents a trophic interaction between the two corresponding species, while a blue dot
indicates the absence of co-occurrence. Plants and butterfly phylogenies are presented on the left and bottom of the trophic interaction matrix.
Phylogenetically closely related species tend to interact with the same subset of species. Our statistical food web model uses the trophic
information on co-occurring species to infer the probability of a trophic link between all pair of species. The magnitudes of these probabilities are
represented by the background color, increasing from pale yellow to red.
ª 2013 The Authors. Ecology and Evolution published by John Wiley & Sons Ltd. 4577
L. Pellissier et al. Combining Food Web and Species Distribution Models
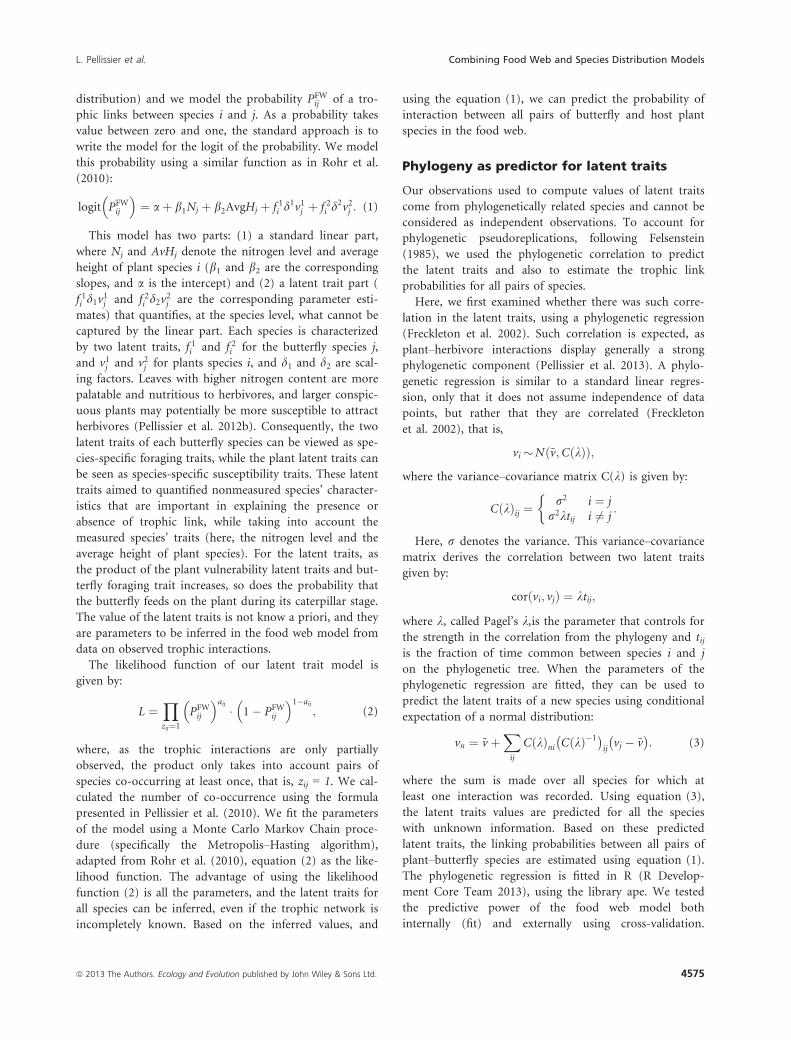
using Pagel’s-k correlation structure, we found for plants
latent traits f 1j : Pagel’s-k = 0.8217 P-value < 0.001, plants
latent traits f 2j : Pagel’s�k = 0.6497 P-value < 0.001, and
for butterfly latent traits v1j : Pagel’s�k = 0.7257 P-value <0.001, butterfly latent traits v2j : Pagel’s�k = 0.9230
P-value < 0.001. The ability of the food web model to
predict butterfly larvae association along with host plants
differed among the main butterfly families (Kruskal–Wallis
test, KW = 17.06, P = 0.004). The highest predictive
performance was achieved for the families Nymphalidae
and Pieridae, followed by Hesperiidae, while the weakest
performance was achieved for Lycaenidae, Papapilionidae,
and the Riodinidae species (Haemearis lucina). (Fig. S3).
Species distribution
Accounting for modeled trophic links between each but-
terfly and host plant in models of species distributions
significantly improved the predictive power of the models
(measured using AUC) compared with a model with only
abiotic components (paired Wilcoxon test, GLM:
V = 790, P = 0.01, GAM: V = 858, P = 0.03, GBM:
V = 843, P = 0.03, RF: V = 758, P = 0.008, Fig. S4).
Model accuracy for some species was largely improved by
accounting for the potential trophic links with host plants
(e.g., Parnassius appolo +21%, Pontia callidice +15%,
Papilio machaon +10%). In contrast, the predictive power
of SDMs for some species declined by incorporating the
biotic component (e.g., Pyrgus andromedae �9%, Poly-
ommatus eros �7%, Plebejus argus �4%).
We found no general improvement in predictive power
when species interactions included in the models were
directly based on the literature (paired Wilcoxon test,
GLM: V = 1150, P = 0.55, GAM: V = 1167, P = 0.57,
GBM: V = 1289, P = 0.82, RF: V = 1129, P = 0.47) or
when the food web was only interpolated to the 89 plant
species used for calibration and those used in the SDMs
(paired Wilcoxon test, GLM: V = 1050, P = 0.48, GAM:
V = 1172, P = 0.59, GBM: V = 1340, P = 0.84, RF:
V = 1127, P = 0.47).
Only models for species from the Nymphalidae (paired
Wilcoxon test, GLM: V = 161, P = 0.04, GAM: V = 166,
P = 0.04, GBM: V = 149, P = 0.03, RF: V = 139, P = 0.01)
and Pieridae (paired Wilcoxon test, GAM: V = 2, P = 0.04,
GBM: V = 2, P = 0.04, RF: V = 2, P = 0.01) families were
improved using the food web model compared with the
model using the raw literature data. Hesperiidae (paired
Wilcoxon test, GLM: V = 44, P = 0.85, GAM: V = 46,
P = 0.87, GBM: V = 31, P = 0.45, RF: V = 25, P = 0.25)
and Lycaenidae (paired Wilcoxon test, GLM: V = 72,
P = 0.56, GAM: V = 69, P = 0.53, GBM: V = 70, P = 0.55,
RF: V = 69, P = 0.53) showed no significant difference in
predictive power.
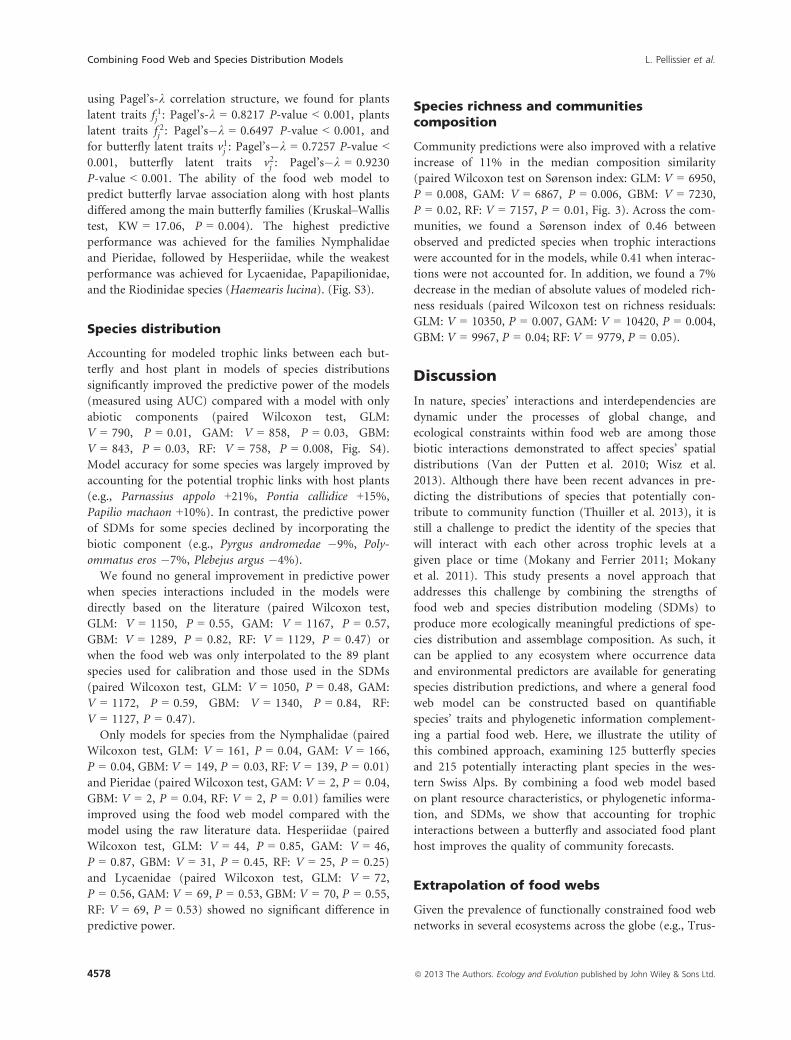
Species richness and communitiescomposition
Community predictions were also improved with a relative
increase of 11% in the median composition similarity
(paired Wilcoxon test on Sørenson index: GLM: V = 6950,
P = 0.008, GAM: V = 6867, P = 0.006, GBM: V = 7230,
P = 0.02, RF: V = 7157, P = 0.01, Fig. 3). Across the com-
munities, we found a Sørenson index of 0.46 between
observed and predicted species when trophic interactions
were accounted for in the models, while 0.41 when interac-
tions were not accounted for. In addition, we found a 7%
decrease in the median of absolute values of modeled rich-
ness residuals (paired Wilcoxon test on richness residuals:
GLM: V = 10350, P = 0.007, GAM: V = 10420, P = 0.004,
GBM: V = 9967, P = 0.04; RF: V = 9779, P = 0.05).
Discussion
In nature, species’ interactions and interdependencies are
dynamic under the processes of global change, and
ecological constraints within food web are among those
biotic interactions demonstrated to affect species’ spatial
distributions (Van der Putten et al. 2010; Wisz et al.
2013). Although there have been recent advances in pre-
dicting the distributions of species that potentially con-
tribute to community function (Thuiller et al. 2013), it is
still a challenge to predict the identity of the species that
will interact with each other across trophic levels at a
given place or time (Mokany and Ferrier 2011; Mokany
et al. 2011). This study presents a novel approach that
addresses this challenge by combining the strengths of
food web and species distribution modeling (SDMs) to
produce more ecologically meaningful predictions of spe-
cies distribution and assemblage composition. As such, it
can be applied to any ecosystem where occurrence data
and environmental predictors are available for generating
species distribution predictions, and where a general food
web model can be constructed based on quantifiable
species’ traits and phylogenetic information complement-
ing a partial food web. Here, we illustrate the utility of
this combined approach, examining 125 butterfly species
and 215 potentially interacting plant species in the wes-
tern Swiss Alps. By combining a food web model based
on plant resource characteristics, or phylogenetic informa-
tion, and SDMs, we show that accounting for trophic
interactions between a butterfly and associated food plant
host improves the quality of community forecasts.
Extrapolation of food webs
Given the prevalence of functionally constrained food web
networks in several ecosystems across the globe (e.g., Trus-
4578 ª 2013 The Authors. Ecology and Evolution published by John Wiley & Sons Ltd.
Combining Food Web and Species Distribution Models L. Pellissier et al.

(A)
(B)
(C)
(D)
(E)
Figure 3. Histograms of Sørenson similarity
with observations and richness residuals of the
stacked species distribution models. Shown are
the results for the random forest modeling
technique with abiotic predictors (in orange
below) and considering in addition the trophic
links with host plant (in blue), for all species
together (A) and the four main families,
Nymphalidae (B), Pieridae (C), Lycaenidae (D),
and Hesperiidae (E).
ª 2013 The Authors. Ecology and Evolution published by John Wiley & Sons Ltd. 4579
L. Pellissier et al. Combining Food Web and Species Distribution Models
sell et al. 2002; Petchey et al. 2005), our approach shows
great promise for providing more ecologically informed
and realistic spatial distributions for species including those
that have incomplete distributional information or when it
is unknown how they interact with other species. A limited
number of studies have attempted to integrate trophic
interactions in biogeographical modeling, including Gravel
et al. (2011), who extended the island biogeography theory
of extinction-colonization processes to account for trophic
interactions. Similarly, Jabot and Bascompte (2012) inte-
grated a spatial meta-community structure to food web
network approaches by studying a bitrophic plant–pollina-tor interaction. This is the first attempt to combine a food
web model with a niche-based species distribution model.
The ability to extrapolate food web models is useful in the
context of climate change, to predict potential interactions
of species that do not currently co-occur or interact, but
may do so in the future. For example, a recent study docu-
mented a temperature-dependent shift of a butterfly species
to a novel host plant impacting species range (Pateman
et al. 2012; but see Pelini et al. 2010). Our food web model
SDM approach could be used to predict shifts such as this
one.
A unique feature of our approach is the extrapolation
of the food web model to predict missing interactions in
networks and inform species distribution models. Our
food web modeling approach yields a continuous index
of interaction probability, based on the quantitative sup-
port for the presence or absence of interactions between
species derived from information on species’ traits and
phylogeny. Information directly derived from the litera-
ture is less reliable, as there is typically underrepresenta-
tion of information on the interactions among species.
Here, based on known interactions involving 125 butterfly
and 89 host plants, we extrapolate a food web model to
215 host plants (~35% of the regional species pool) for
which relevant functional traits and phylogenetic posi-
tions were available. The extrapolation was based on the
strong associations between nitrogen content and the
probability of a trophic interaction between species and
the correlation between the latent traits and the species
phylogeny. This supports the view that herbivore diet
shows strong phylogenetic constraints (Pellissier et al.
2013) and is driven by plant resource content (Pellissier
et al. 2012a,b). Previous studies also showed that food
webs may be phylogenetically structured (Ives and God-
fray 2006). We found no general improvement of species
distribution models when we considered only interpolated
values on the 89 host plants (~15% of the plant species
pool) or using the raw links in the literature. This may
have arisen because too many potential host plants were
missing resulting in biased inferences of butterfly presence
and absences at sites. We speculate that more accurate
assemblage predictions may have been realized if we had
information for the full regional species pool (~700 plant
species), but for which trait information is currently
unavailable.
Our approach is particularly suited for group of species
that are neither specialist nor extreme generalists, but still
interact with a large number of species, where current
knowledge on species interactions is probably incomplete.
From our dataset, the models built for the butterfly families
Nymphalidae and Pieridae showed the most consistent
improvement in model predictive performance (Fig. 3).
This may perhaps be due to the Nymphalidae family being
composed of more polyphagous species (larger number of
potential host plants) and the display of lower phylogenetic
variability in host plant association (e.g., Satyrinae subfam-
ily feeding on the grass family, Poaceae and Cyperaceae)
(Pellissier et al. 2013). Consequently, the food web model
performed relatively well across this family and could
explain several missing links in the interaction matrix
required to predict communities using SDMs. Models for
species of the Lycaenidae and Hesperiidae were not
improved when information from the food web model was
included in SDMs. Those families display higher degree of
shifts in host-plant associations with closely related lineages
specialized on distinct plant clades (Megens et al. 2005;
Vila et al. 2011). As a consequence, trophic interactions are
more difficult to model and including uncertain interaction
probabilities results in poorest predictions. The overall
trend of improvement at the species and community levels
is likely to arise because the more generalist Nymphalidae
family is dominant in our butterfly dataset, while specialist
species are less frequent (Fig. 3).
One caveat of the approach proposed in this study is
that it is bound to a statistical framework and cannot
demonstrate causality. Even if species ecological knowl-
edge supports the relevance of including trophic interac-
tions in model of species distribution, adding further
abiotic predictors may also have led to model improve-
ment. Hence, we are unable to demonstrate that the
inclusion of trophic interactions actually improves the
models in a causal and mechanistic way. Nevertheless,
despite the fact that our results are correlative, they sug-
gest new research areas related to the inclusion of trophic
interactions in studies of species distributions.
Future perspectives
In addition to improving model predictions, the next-
generation models combining SDMs and food web
models should allow novel and complex ecological ques-
tions to be addressed (Thuiller et al. 2013). For instance,
how might recurrent perturbations in the food web (e.g.,
the extinction of a predator) affect the distribution of
4580 ª 2013 The Authors. Ecology and Evolution published by John Wiley & Sons Ltd.
Combining Food Web and Species Distribution Models L. Pellissier et al.
species in a landscape? Nevertheless, the approach pre-
sented here is a timely contribution in using food web
models to infer the geographical distribution of species in
the landscape, as recently proposed by Massol et al.
(2011) and Jabot and Bascompte (2012). In addition, we
considered a food web that only accounts for bottom-up
interactions that potentially influence species’ distribu-
tions (i.e., the host plant resources that simultaneously
influence butterfly distribution). Our approach can be
extended to both bottom-up and top-down interactions
within food webs. However, this would require a statisti-
cal model that simultaneously fits both food web struc-
ture and the presences/absences of interactions along
environmental gradients, while considering the turnover
in these interactions in time and space.
A key improvement of our approach is that with wide-
spread species, trophic interactions usually shift across a
species range, and as yet cannot be accounted for in SDMs
that do not incorporate food web models. With the plant–butterfly system, we have illustrated, as plant leaf palatabil-
ity (SLA, LDMC) shift along environmental gradients, this
may in turn influence the interactions with other species
along those gradients (Linder et al. 2012). In such a land-
scape, food web models can potentially account for shifts
in prevailing environmental conditions, an area to be con-
sidered in future modeling efforts. As with many interdisci-
plinary modeling efforts, the refinement of our models is
constrained by the availability of data to fit and evaluate
them. For instance, the dataset used to test these methods
are hindered by a spatial scale mismatch between plant and
butterfly taxa. While the butterfly communities were sam-
pled in plots of 50 9 50 m, only 2 9 2 m grasslands were
sampled for plant species presences. It is probable that if
we had collected host plant data at a scale more representa-
tive of the butterfly plots, better results may have been
achieved. In addition, because of the difficult detection of
larvae in the field, we used presence and absence of adult
butterfly specimens, while we modeled the food web of
larvae. It is likely that the difference between abiotic models
and those considering trophic interactions would have
been more pronounced if records of larvae were used.
Conclusion
Here, we facilitate the integration of ecological rules based
on trophic interactions to constrain prediction of species
assemblages in space and time. The models built using
our combined approach are ecologically more sounds as
they consider biotic interaction that are known a priori to
influence the life history of butterflies. This framework
extends the boundaries of SDMs by accounting for known
and unknown species ecological interactions and produces
more realistic models of species’ assemblages. It also
offers an innovative way to improve our understanding of
community assembly by accounting for the multiple
interactions among different species based on extensive
datasets. Moreover, it informs where species can be found
as a function of their relation to the abiotic environment,
as well as how these species will interact with novel com-
ponents of the biotic environment. Our approach draws
upon the strengths of spatial ecology and trophic ecology,
and should encourage the further integration of these dis-
ciplines to advance efforts to predict species assemblages.
Acknowledgments
We would like to thank those who helped with the field
work, and Yannick Chittaro for providing pictures. This
study was supported by the NSF Grant Nr. 31003A-125145
(BIOASSEMBLE project) to AG. LP was supported by The
Danish Council for Independent Research Grant n° 12-
126430. RPR was supported by the FP7-REGPOT 2010-1
EcoGenes Project (Grant No. 264125). This project also
received support from the Vital-IT facilities of the Swiss
Institute of Bioinformatics at the University of Lausanne.
Conflict of Interest
None declared.
References
Ara�ujo, M. B. and M. Luoto. 2007. The importance of biotic
interactions for modelling species distributions under
climate change. Glob. Ecol. Biogeogr. 16:743–753.
Best, R. J., N. C. Caulk, and J. J. Stachowicz. 2013. Trait vs.
phylogenetic diversity as predictors of competition and
community composition in herbivorous marine amphipods.
Ecol. Lett. 16:72–80.
Boulangeat, I., D. Gravel, and W. Thuiller. 2012. Accounting
for dispersal and biotic interactions to disentangle the
drivers of species distributions and their abundances. Ecol.
Lett. 15:584–593.
Clauset, A., C. Moore, and M. Newman. 2008. Hierarchical
structure and the prediction of missing links in networks.
Nature 101:98–101.
Dubuis, A., J. Pottier, V. Rion, L. Pellissier, J.-P. Theurillat,
and A. Guisan. 2011. Predicting spatial patterns of plant
species richness: a comparison of direct macroecological and
species stacking modelling approaches. Divers. Distrib.
17:1122–1131.
Felsenstein, J. 1985. Confidence limits on phylogenies:
an approach using the bootstrap. Evolution 39:783–
791.
Freckleton, R., P. Harvey, and M. Pagel. 2002. Phylogenetic
analysis and comparative data: a test and review of evidence.
Am. Nat. 160:712–726.
ª 2013 The Authors. Ecology and Evolution published by John Wiley & Sons Ltd. 4581
L. Pellissier et al. Combining Food Web and Species Distribution Models
Giannini, T. C., D. S. Chapman, A. M. Saraiva, I.
Alves-dos-Santos, and J. C. Biesmeijer. 2013. Improving
species distribution models using biotic interactions: a
case study of parasites, pollinators and plants. Ecography
36:649–656.
Gravel, D., E. Canard, F. Guichard, and N. Mouquet. 2011.
Persistence increases with diversity and connectance in
trophic metacommunities. PLoS ONE 6:e19374.
Guisan, A., and W. Thuiller. 2005. Predicting species
distribution: offering more than simple habitat models. Ecol.
Lett. 8:993–1009.
Heikkil€a, M., L. Kaila, M. Mutanen, C. Pe~na, and N.
Wahlberg. 2012. Cretaceous origin and repeated tertiary
diversification of the redefined butterflies. Proc. R. Soc. B
Biol. Sci. 279:1093–1099.
Hirzel, A., and A. Guisan. 2002. Which is the optimal
sampling strategy for habitat suitability modelling. Ecol.
Mod. 157:331–341.
Hodkinson, I. D. 2005. Terrestrial insects along elevation
gradients: species and community responses to altitude.
Biol. Rev. 80:489–513.
Ibanez, S., S. Lavorel, S. Puijalon, and M. Moretti. 2013.
Herbivory mediated by coupling between
biomechanical traits of plants and grasshoppers. Funct.
Ecol. 27:479–489.
Ives, A. R., and H. C. J. Godfray. 2006. Phylogenetic analysis
of trophic associations. Am. Nat. 168:E1–E14.
Jabot, F., and J. Bascompte. 2012. Bitrophic interactions
shape biodiversity in space. Proc. Natl Acad. Sci. USA
109:4521–4526.
Kissling, W. D., C. F. Dormann, J. Groeneveld, T. Hickler, I.
K€uhn, G. J. McInerny, et al. 2012. Towards novel
approaches to modelling biotic interactions in multispecies
assemblages at large spatial extents. J. Biogeogr. 39:2163–
2178.
Laughlin, D. C., C. Joshi, P. M. van Bodegom, Z. A. Bastow,
and P. Z. Ful�e. 2012. A predictive model of community
assembly that incorporates intraspecific trait variation. Ecol.
Lett. 15:1291–1299.
Le Roux, P., J. Lenoir, L. Pellissier, M. Wisz, and M. Luoto.
2013. Horizontal, but not vertical, biotic interactions affect
fine-scale plant distribution patterns in a low energy system.
Ecology 94:671–682.
Linder, H. P., O. Bykova, J. Dyke, R. S. Etienne, T. Hickler, I.
K€uhn, et al. 2012. Biotic modifiers, environmental
modulation and species distribution models. J. Biogeogr.
39:2179–2190.
Massol, F., D. Gravel, N. Mouquet, M. W. Cadotte, T.
Fukami, M. Leibold, et al. 2011. Linking community and
ecosystem dynamics through spatial ecology. Ecol. Lett.
14:313–323.
Megens, H.-J., R. De Jong, and K. Fiedler. 2005. Phylogenetic
patterns in larval host plant and ant association of
Indo-Australian Arhopalini butterflies Lycaenidae: Theclinae.
Biol. J. Linn. Soc. 84:225–241.
Mokany, K., and S. Ferrier. 2011. Predicting impacts of
climate change on biodiversity: a role for semi-mechanistic
community-level modelling. Divers. Distrib. 17:374–380.
Mokany, K., T. D. Harwood, J. M. Overton, G. M. Barker, and
S. Ferrier. 2011. Combining a - and b -diversity models to
fill gaps in our knowledge of biodiversity. Ecol. Lett.
14:1043–1051.
Mouquet, N., V. Devictor, C. N. Meynard, F. Munoz, L.-F.
Bersier, J. Chave, et al. 2012. Ecophylogenetics: advances
and perspectives. Biol. Rev. 87:769–785.
Naisbit, R. E., R. P. Rohr, A. G. Rossberg, P. Kehrli, and L.-F.
Bersier. 2012. Phylogeny versus body size as determinants
of food web structure. Proc. R. Soc. B Biol. Sci. 279:3291–
3297.
Nogu�es-Bravo, D. and C. Rahbek. 2011. Communities under
climate change. Science 334:1070–1071.
Ovaskainen, O., J. Hottola, and J. Siitonen. 2010. Modeling
species co-occurrence by multivariate logistic regression
generates new hypotheses on fungal interactions. Ecology
91:2514–2521.
Pateman, R. M., J. K. Hill, D. B. Roy, R. Fox, and C. D.
Thomas. 2012. Temperature-dependent alterations in host
use drive rapid range expansion in a butterfly. Science
336:1028–1030.
Pelini, S. L., J. A. Keppel, A. E. Kelley, and J. J. Hellmann.
2010. Adaptation to host plants may prevent rapid insect
responses to climate change. Glob. Ch. Biol. 16:2923–2929.
Pellissier, L., K. Anne Br�athen, J. Pottier, C. F. Randin, P.
Vittoz, A. Dubuis, et al. 2010. Species distribution models
reveal apparent competitive and facilitative effects of a
dominant species on the distribution of tundra plants.
Ecography 33:1004–1014.
Pellissier, L., J.-N. Pradervand, J. Pottier, A. Dubuis, L.
Maiorano, and A. Guisan. 2012a. Climate-based empirical
models show biased predictions of butterfly communities
along environmental gradients. Ecography 35:684–692.
Pellissier, L., S. Rasmann, G. Litsios, K. Fiedler, A. Dubuis, J.
Pottier, et al. 2012b. High host-plant nitrogen content: a
prerequisite for the evolution of ant–caterpillar mutualism?
J. Evol. Biol. 25:1658–1666.
Pellissier, L., C. Ndiribe, A. Dubuis, J.-N. Pradervand, N.
Salamin, A. Guisan, et al. 2013. Turnover of plant lineages
shapes herbivore phylogenetic beta diversity along ecological
gradients. Ecol. Lett. 16:600–608.
Petchey, O. L., A. P. Beckerman, J. O. Riede, and P. H.
Warren. 2005. Size, foraging, and food web structure. Proc.
Natl Acad. Sci. USA 105:4191–4196.
Randin, C. F., H. Jaccard, P. Vittoz, N. G. Yoccoz, and A.
Guisan. 2009. Land use improves spatial predictions of
mountain plant abundance but not presence-absence. J. Veg.
Sci. 20:996–1008.
4582 ª 2013 The Authors. Ecology and Evolution published by John Wiley & Sons Ltd.
Combining Food Web and Species Distribution Models L. Pellissier et al.
Rohr, R. P., H. Scherer, P. Kehrli, C. Mazza, and L.-F. Bersier.
2010. Modeling food webs: exploring unexplained structure
using latent traits. Am. Nat. 176:170–177.
Schweiger, O., R. K. Heikkinen, A. Harpke, T. Hickler, S.
Klotz, O. Kudrna, et al. 2012. Increasing range
mismatching of interacting species under global change is
related to their ecological characteristics. Glob. Ecol.
Biogeogr. 21:88–99.
Thuiller, W., B. Lafourcade, R. Engler, and M. B. Ara�ujo.
2009. BIOMOD – a platform for ensemble forecasting of
species distributions. Ecography 32:369–373.
Thuiller, W., T. M€unkem€uller, S. Lavergne, D. Mouillot, N.
Mouquet, K. Schiffers, et al. 2013. A road map for
integrating eco-evolutionary processes into biodiversity
models. Ecol. Lett. 16:94–105.
Trussell, G. C., P. J. Ewanchuk, and M. D. Bertness. 2002.
Field evidence of trait-mediated indirect interactions in a
rocky intertidal food web. Ecol. Lett. 5:241–245.
Van der Putten, W. H., M. Macel, and M. E. Visser. 2010.
Predicting species distribution and abundance responses to
climate change: why it is essential to include biotic
interactions across trophic levels. Phil. Trans. R. Soc. B.
Biol. Sci. 365:2025–2034.
Vila, R., C. D. Bell, R. Macniven, B. Goldman-Huertas, R. H.
Ree, C. R. Marshall, et al. 2011. Phylogeny and
palaeoecology of Polyommatus blue butterflies show
Beringia was a climate-regulated gateway to the New World.
Proc. R. Soc. B: Biol. Sci. 278:2737–2744.
Whitfeld, T., V. Novotny, S. Miller, and J. Hrcek. 2012.
Predicting tropical insect herbivore abundance from host
plant traits and phylogeny. Ecology 93:211–223.
Wisz, M. S., J. Pottier, W. D. Kissling, L. Pellissier, J. Lenoir,
C. F. Damgaard, et al. 2013. The role of biotic interactions
in shaping distributions and realised assemblages of species:
implications for species distribution modelling. Biol. Rev.
88:15–30.
Wright, I. J., P. B. Reich, M. Westoby, D. D. Ackerly, Z.
Baruch, F. Bongers, et al. 2004. The worldwide leaf
economics spectrum. Nature 428:821–827.
Zimmermann, N., and F. Kienast. 1999. Predictive mapping of
alpine grasslands in Switzerland: species versus community
approach. J. Veg. Sci. 10:469–482.
Supporting Information
Additional Supporting Information may be found in the
online version of this article:
Figure S1. Butterfly phylogeny.
Figure S2. Molecular dated phylogenetic tree of 231 angio-
sperm species from the Western Swiss Alps.
Figure S3. Trophic interactions matrix between butterfly
species and plant species extrapolated on the full dataset
comprising 125 butterfly and 215 plant species.
Figure S4. Boxplot of the AUC of the modeled links of the
food web model for each of the four main butterfly fami-
lies, Nymphalidae, Pieridae, Lycaenidae, Hesperiidae.
Figure S5. Histograms of the difference between the predic-
tive power of the models (AUC) without and with the tro-
phic interaction as a predictor.
Table S1. Species belonging to Papilionoidea that were
found in the study area.
ª 2013 The Authors. Ecology and Evolution published by John Wiley & Sons Ltd. 4583
L. Pellissier et al. Combining Food Web and Species Distribution Models