Embed Size (px)
Citation preview

C o u n t r y R e p o r t
I n d o n e s i a
Natural Disaster Risk Assessment and
Area Business Continuity Plan Formulation for
Industrial Agglomerated Areas in the ASEAN Region
March 2015
AHA CENTRE
Japan International Cooperation Agency
OYO International Corporation Mitsubishi Research Institute, Inc.
CTI Engineering International Co., Ltd.


Overview of the Country Basic Information of Indonesia 1), 2), 3)
National Flag
Country Name Long form : Short form :
Republic of Indonesia Indonesia
Capital Jakarta Area (km2) Total:
Land: Inland Water:
1,910,930 1,811,570 99,360
Population 249,865,631 Population density(people/ km2 of land area) 138 Population growth (annual %) 1.2 Urban population (% of total) 52 Languages Indonesian Ethnic Groups Mostly Malays (there are about 300 ethnic
groups including Java and Sunda) Religions Islam 88.1%, Christianity 9.3%(Protestant 6.1%,
Catholic 3.2%), Hinduism 1.8%, Buddhism 0.6%, Confucianism 0.1%, Others 0.1%
GDP (current US$) (billion) 868 GNI per capita, PPP (current international $) 9,260 GDP growth (annual %) 5.8 Agriculture, value added (% of GDP) 14 Industry, value added (% of GDP) 46 Services, etc., value added (% of GDP) 40
Brief Description Indonesia is the largest archipelago in the world comprised of 18,110 islands, extending 5,110 km from east to west. In Indonesia and the surrounding region, several ocean plates collide with each other, and form part of the Circum-Pacific orogenic belts. For that reason, Indonesia has many volcanoes, including Krakatoa. Indonesia is the fourth most populous nation, with the world’s largest Muslim population. Indonesia is one of the founding members of ASEAN (founded on August 8, 1967), and the Headquarters of ASEAN is located in Jakarta, the capital of Indonesia. It is the most populous country in ASEAN, with approximately 40 percent of the total population of ASEAN living in the country. The country adopts a presidential system, and the government is classified as a republican government. The current president of Indonesia is Susilo Bamban Yudhoyono. The Yudhoyono administration identified economic development, use of natural resources, and improvement of
i

human resources as the country’s highest priority areas. It is expected that the country will continue to promote mining and processing of resources, and the manufacturing of industrial products. Natural Hazards The various types of disasters such as flooding, earthquake, mass movement-wet, and volcanic eruption occurred in Indonesia. Earthquake and flood disrupted 88% of the total number of affected people. On the other hand, earthquake caused the highest number of death and significant economic losses. This is mainly due to the Sumatra Earthquake in 2004 and Java Earthquake in 2006. Flooding and earthquake will be the two major disasters that have great impact in Indonesia.
Disaster Management System 4), 5)
References: 1) Central Intelligence Agency (CIA) website (2014): https://www.cia.gov (Accessed: October 15, 2014)
2) Ministry of Foreign Affairs website (2014): http://www.mofa.go.jp (Accessed: October 15, 2014)
3) The World Bank Data Bank website (2013): http://data.worldbank.org (Accessed: October 15, 2014)
4) Dr. Syamsul Maarif, Msi (date unknown): Disaster Management in Indonesia (Presentation Slide), p.11.
5) BNPB Website: http://www.bnpb.go.id/website/asp/content.asp?id=4 (Accessed: October 15, 2014) (BNPB’s organogram was provisionally translated in English by the JICA Study Tea)
ii

Contents Overview of the Country
Page 1. Introduction ............................................................................................................. 1 2. Natural Disaster Risks ............................................................................................ 2
2.1 Predominant Hazards ....................................................................................... 2 2.2 Flood ................................................................................................................. 4 2.3 Earthquake ....................................................................................................... 11 2.4 Tsunami ........................................................................................................... 18 2.5 Volcanoes ....................................................................................................... 26 2.6 Cyclone and Meteorological Hazards.............................................................. 33 2.7 Landslides ....................................................................................................... 41
3. Industrial Parks ..................................................................................................... 46 3.1 Distribution of Industrial Parks in Indonesia .................................................... 46 3.2 Historical Evolution of Industrial Parks ............................................................ 47 3.3 Recent Trends and Japanese Investment ....................................................... 48 3.4 Risks of Natural Hazards ................................................................................ 48
4. Transport Infrastructure and Lifeline Utilities ......................................................... 50 4.1 Overview of Transport Infrastructure ............................................................... 50 4.2 Overview of Lifeline Utilities ............................................................................ 53 4.3 Natural Disasters and Infrastructure................................................................ 57
5. Legislative Systems .............................................................................................. 60 5.1 Legislative Systems for Disaster Management ............................................... 60 5.2 Regulations and Standards for Business Continuity Management ................. 61 5.3 Legislative Systems for the Environment and Pollution Control ...................... 61 5.4 Legislative Systems for Development including Land Use, Rivers, and Building
Code in Indonesia .......................................................................................... 62 6. Implementation of BCP ......................................................................................... 64
6.1 Major Natural Disasters and Awareness Disaster Management ..................... 64 6.2 Current State of BCP Implementation ............................................................. 64 6.3 Efforts on Promoting BCP Implementation ...................................................... 65 6.4 Problems Facing for Implementation of BCP .................................................. 66
Appendix 1: Method for Evaluating Predominant Hazards ....................................... 67 Appendix 2: Data Sheets Outline of Existing Investigations and Studies ............... 69 Appendix 3: List of Industrial Parks in Indonesia ..................................................... 114 Appendix 4: General Investment Risk of Indonesia ................................................. 117


Introduction
1. Introduction This report is the first version of the Country Report for Indonesia, which gives
information on natural disaster risks of the country, industrial parks, major traffic
infrastructure and lifeline utilities, and legislative systems relating to disaster
management and business continuity.
The country report is prepared as a reference document for individuals and
organizations who are wishing to integrate disaster risk information for their decisions:
such as investment to Indonesia, preparation of a business continuity plan (BCP) or
disaster management plan of their organization, preparation of an Area Business
Continuity Plan (Area BCP) of their area, and simply knowing natural disaster risks of
their area.
Information contained in this report is macroscopic covering the entire country at the
same level. When detailed risk information is necessary, hazard and risk assessments
for an area of interest are required.
Since the country report was prepared with limited data and information as one of
the components of the project1 of ASEAN Coordinating Centre for Humanitarian
Assistance on Disaster Management (AHA Centre) and Japan International
Cooperation Agency (JICA) with a limited data and information, a revision by
national experts is required for further refinement.
The following are reference documents prepared by the project of AHA Centre and
JICA.
1. AHA Centre and JICA (2015): Planning Guide for Area Business Continuity, Area
BCM Took Kits, Version 2.
2. AHA Centre and JICA (2015): The Country Reports; Brunei, Cambodia, Laos,
Malaysia, Myanmar, the Philippines, Thailand, Singapore and Vietnam.
3. AHA Centre and JICA (2015): The Risk Profile Reports; Karawang and Bekasi of
Indonesia, Cavite, Laguna and the Southern Part of Metropolitan Manila of the
Philippines, and Haiphong of Vietnam.
1 AHA Centre and JICA (2015), Natural Disaster Risk Assessment and Area Business Continuity Plan Formulation for Industrial Agglomerated Areas in the ASEAN Region, , 2013 to 2015.
1
Country Report
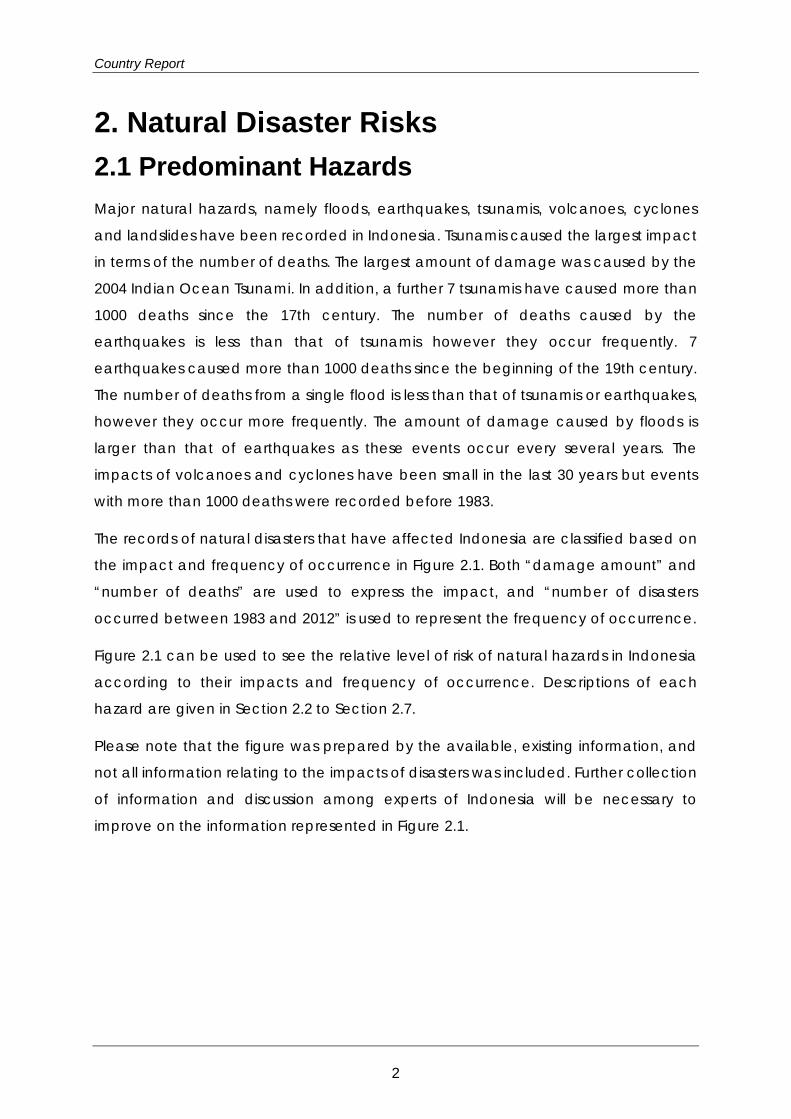
2. Natural Disaster Risks 2.1 Predominant Hazards Major natural hazards, namely floods, earthquakes, tsunamis, volcanoes, cyclones
and landslides have been recorded in Indonesia. Tsunamis caused the largest impact
in terms of the number of deaths. The largest amount of damage was caused by the
2004 Indian Ocean Tsunami. In addition, a further 7 tsunamis have caused more than
1000 deaths since the 17th century. The number of deaths caused by the
earthquakes is less than that of tsunamis however they occur frequently. 7
earthquakes caused more than 1000 deaths since the beginning of the 19th century.
The number of deaths from a single flood is less than that of tsunamis or earthquakes,
however they occur more frequently. The amount of damage caused by floods is
larger than that of earthquakes as these events occur every several years. The
impacts of volcanoes and cyclones have been small in the last 30 years but events
with more than 1000 deaths were recorded before 1983.
The records of natural disasters that have affected Indonesia are classified based on
the impact and frequency of occurrence in Figure 2.1. Both “damage amount” and
“number of deaths” are used to express the impact, and “number of disasters
occurred between 1983 and 2012” is used to represent the frequency of occurrence.
Figure 2.1 can be used to see the relative level of risk of natural hazards in Indonesia
according to their impacts and frequency of occurrence. Descriptions of each
hazard are given in Section 2.2 to Section 2.7.
Please note that the figure was prepared by the available, existing information, and
not all information relating to the impacts of disasters was included. Further collection
of information and discussion among experts of Indonesia will be necessary to
improve on the information represented in Figure 2.1.
2

Natural Disaster Risks
Note: GDP-PPP, Gross domestic product based on
purchasing-power-parity (PPP) valuation of country GDP, International Monetary Fund, World Economic Outlook Database, October 2012
Source of data and information:
EM-DAT, The OFDA/CRED International Disaster Database, Université catholique de Louvain, Brussels, Belgium: http://www.emdat.be.
Pacific Rim Coordination Center Disaster Data: http://data.pacificrimnetwork.org/. Global Unique Disaster Identification Number:
http://www.glidenumber.net/glide/public/search/search.jsp. National Geophysical Data Center (NGDC), National Oceanic and Atmospheric
Administration (NOAA): http://ngdc.noaa.gov/hazard/hazards.shtml Dartmouth Flood Observatory, University of Colorado:
http://floodobservatory.colorado.edu/
Figure 2.1 Impact of Natural Hazards in Indonesia
3
Country Report
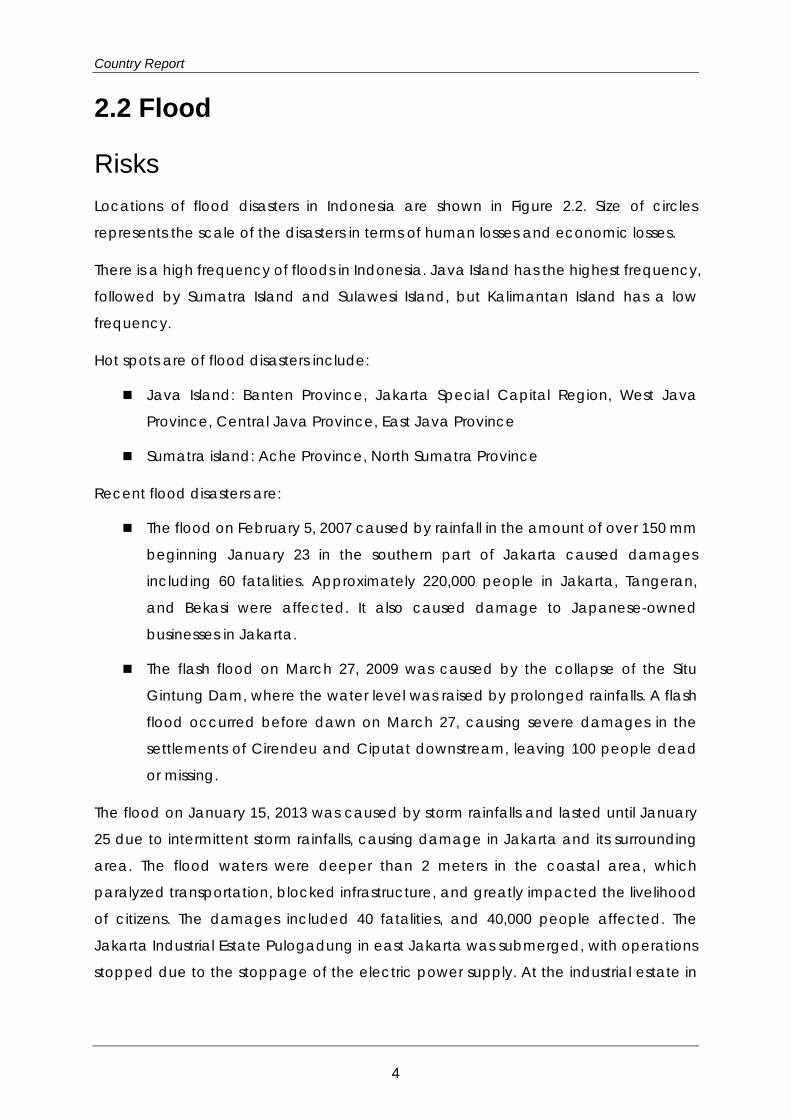
2.2 Flood
Risks Locations of flood disasters in Indonesia are shown in Figure 2.2. Size of circles
represents the scale of the disasters in terms of human losses and economic losses.
There is a high frequency of floods in Indonesia. Java Island has the highest frequency,
followed by Sumatra Island and Sulawesi Island, but Kalimantan Island has a low
frequency.
Hot spots are of flood disasters include:
Java Island: Banten Province, Jakarta Special Capital Region, West Java
Province, Central Java Province, East Java Province
Sumatra island: Ache Province, North Sumatra Province
Recent flood disasters are:
The flood on February 5, 2007 caused by rainfall in the amount of over 150 mm
beginning January 23 in the southern part of Jakarta caused damages
including 60 fatalities. Approximately 220,000 people in Jakarta, Tangeran,
and Bekasi were affected. It also caused damage to Japanese-owned
businesses in Jakarta.
The flash flood on March 27, 2009 was caused by the collapse of the Situ
Gintung Dam, where the water level was raised by prolonged rainfalls. A flash
flood occurred before dawn on March 27, causing severe damages in the
settlements of Cirendeu and Ciputat downstream, leaving 100 people dead
or missing.
The flood on January 15, 2013 was caused by storm rainfalls and lasted until January
25 due to intermittent storm rainfalls, causing damage in Jakarta and its surrounding
area. The flood waters were deeper than 2 meters in the coastal area, which
paralyzed transportation, blocked infrastructure, and greatly impacted the livelihood
of citizens. The damages included 40 fatalities, and 40,000 people affected. The
Jakarta Industrial Estate Pulogadung in east Jakarta was submerged, with operations
stopped due to the stoppage of the electric power supply. At the industrial estate in
4

Natural Disaster Risks
west Java, some auto industries suspended operations as the disruption of the supply
chain stopped the supply of parts.
5

Country Report
(a) Human Losses
(b)Economic Losses (% of GDP) : Hot Spots
Data Sources: EM-DAT, The OFDA/CRED International Disaster Database, Université catholique de Louvain, Brussels, Belgium:
http://www.emdat.be. Pacific Rim Coordination Center Disaster Data: http://data.pacificrimnetwork.org/. Global Unique Disaster Identification Number: http://www.glidenumber.net/glide/public/search/search.jsp.
Figure 2.2 Locations of Flood Disasters in Indonesia
6

Natural Disaster Risks
Background In Indonesia floods are caused by storm rainfalls occurred in the rainy season from
January to February. Heavy rainfalls in the mountain area cause floods in the plains
downstream. Many floods have occurred due to the east-west monsoons in the rainy
season (January to February). Heavy rainfalls in the mountainous region cause floods
in the plain and extensive damage in swamps and coastal low-lying areas. Urban
areas become inundated because of an insufficient drainage system and poor
maintenance work. Land subsidence is common in coastal towns due to
groundwater use by industries, etc., and due to an increase in ponding.
Sources of Hazard and Risk Information Table 2.1 Sources of Hazard and Risk Information: Flood
Badan Nasional Penanggulangan Bencana, National Disaster Management Agency (BNPB)
http://www.bnpb.go.id/
Regional Disaster Management Agency(BPBD) DKI Jakarta
http://bpbd.jakarta.go.id/
Regional Disaster Management Agency (BPBD) Java Tengah
http://bpbdjateng.info/
Regional Disaster Management Agency (BPBD) Java Barat
http://bpbd.jabarprov.go.id/
Badan Meteorologi, Klimatologi, dan Geofisika (BMKG)
http://www.bmkg.go.id/BMKG_Pusat/Depan.bmkg
Lembaga Ilmu Pengetahuan Indonesia Indonesian Institute of Sciences (LIPI)
http://www.lipi.go.id/www.cgi?depan&&&&&eng
Institut Teknologi Bandung (ITB)
http://www.itb.ac.id/en/
ASEAN Coordinating Centre for Humanitarian Assistance on Disaster Management(AHA Centre)
http://www.ahacentre.org/
7

Country Report
Studies on Hazard and/or Risk Assessment Some useful studies on flood hazard, risk, and vulnerability are publicly available
presenting assessment results, case studies of countermeasures, as well as different
methodological approaches. There are a few types of methodologies to assess risks
and vulnerability including, for example, risks involving exposure to flooding events
and population density. Vulnerability can be defined as a function of exposure,
adaptive or coping capacity, and land-use etc. There are slightly different
combinations of these factors with different studies for use. Therefore, these concepts
must be defined in advance to plan a methodology for an assessment, in terms of
which definitions are to be used in a certain analysis.
Locations of existing investigations and studies on flood are shown in Figure 2.3.
Outline of those investigations and studies are attached in Appendix 2 and their
summary is given in Table 2.2.
Figure 2.3 Locations of Existing Investigations and Studies: Flood
8

Natural Disaster Risks
Table 2.2 Summary of Existing Investigations and Studies: Flood
Country/Region Summary of Existing Studies and Reports
ASEAN
There are a few reports that study natural disasters for ASEAN and the Pacific regions at large in recent years. Disaster risks are assessed by scenario, exposure, vulnerability, damage, and loss. An assessment framework is also sought to give an overview of risks, hazard and vulnerability.
Indonesia The analytical work for Indonesia leans toward the Jakarta region. Both highly technical analysis using hydrologic models as well as community interview methods have been used to assess hazards and risks.
References for Data and Further Reading 1) Ministry of Foreign Affairs of Japan (2013): “Information on Indonesia in
Japanese”, 06 2013
2) Asian Disaster Preparedness Center (2011) Program for Hydro-Meteorological
Disaster Mitigation in Secondary Cities in Asia (PROMISE) 2005 to 2010: Bangkok
3) ADRC: “Countries: Indonesia”, Information on Disaster Risk Reduction of the
Member
4) ADRC: “Indonesia, Flood, 2007/02/03”
5) ADRC: “Indonesia, Flash Flood, 2009/03/27”. Details of Disaster Information
6) ADRC(2009):”Indonesian Flood, 2013/01/15,” Details Disaster Information.
7) Arief Anshory Yusuf & Herminia Francisco (2009). Climate Change Vulnerability
Mapping for Southeast Asia, Singapore: EEPSEA
8) BBC NEWS (2007b): “Disease fears amid Jakarta floods,” 5 February 2007
9) BBC NEWS (2007a): “Jakarta floods death toll rises”, 4 February 2007
10) BBC NEWS (2007): “In pictures: Jakarta flooding,” Sunday, 4 February 2007
11) Brinkman, JanJaap et al (2009) Jakarta Flood Hazard Mapping Framework:
Jakarta
12) CNN NEWS (2009): “Suburban 'tsunami' kills 98 in Jakarta,” March 29, 2009
13) Global Voices: Indonesia: ““Mini-Tsunami” hits village as dam collapses Posted,”
30 March 2009
14) Relief Web, OCHA (2007d): “ACT Rapid Response for floods in Jakarta,
Indonesia,” Rapid Response Payment No.03/2007,09 Feb 2007
15) Relief Web, OCHA (2007e): “Indonesia: Jakarta flood victims could face more
rain, illness,” Report from Caritas, 16 Feb 2007
9

Country Report
16) Relief Web, OCHA (2007f): “Major Natural Disaster in Indonesia During 2007,”
Map from UN Office for the Coordination of Humanitarian Affairs, 31 Dec 2007.
17) Relief Web, OCHA (2007c): “Jakarta, Indonesia, Area affected by Flooding,”
Map from UN Office for the Coordination of Humanitarian Affairs, as of 13 Feb
2007
18) Relief Web, OCHA (2007a): “DKI Jakarta Province, Indonesia, Location of Persons
Displaced by Flooding,” Map from UN Office for the Coordination of
Humanitarian Affairs, as of 7 Feb 2007
19) Relief Web, OCHA (2007b): “Indonesia, Flood Information Product - Jakarta
Overview Derived from Radarsat-1,” Map from MDA Geospatial Services, 7 Feb
2007
20) Relief Web, OCHA (2013c): Report from UN Office for the Coordination of
Humanitarian Affairs, 22 Jan 2013
21) Relief Web, OCHA (2013b): “Assistance to Jakarta flood victims delayed floods in
Jakarta and its greater area - Situation Report No. 03,” Report from IRIN, 21 Jan
2013
22) Relief Web, OCHA (2013d): “Indonesia, Floods in Jakarta and its greater area,”
Situation Report No. 04/2013, as of 25 January 2013
23) Relief Web, OCHA (2013a): “Indonesia: Jakarta Flood,” Map from UN Office for
the Coordination of Humanitarian Affairs, 17 Jan 2013
24) Velasquez, Jerry et al (ed.) (2012). Reducing vulnerability and exposure to
disasters: Asia-Pacific disaster report 2012, ESCAP/UNISDR AP
25) World Bank (2011). Advancing Disaster Risk Financing and Insurance in ASEAN
Countries: Framework and Options for Implementation, Washington: Global
Facility for Disaster Reduction and Recovery
26) World Bank, UNISDR (2010). Synthesis Report on Ten ASEAN Countries Disaster
Risks Assessment
10

Natural Disaster Risks
2.3 Earthquake
Risks Locations of earthquake disasters in Indonesia are shown in Figure 2.4. Size of circles
represents the scale of the disasters in terms of human losses and economic losses.
Since 1797, 24 earthquakes with magnitude of 8 or more have been recorded in and
around Indonesia. The 2004 Indian Ocean Earthquake (M9.1) was the largest.
More than 1,000 people were killed in 7 of those earthquakes. Additionally, 10,000
people were killed by the earthquakes that occurred in 1815 and 1917 in Bali.
The earthquakes that greatly impacted the Indonesian economy were the 2004
Indian Ocean Earthquake (M9.1), the 2006 Central Java Earthquake, and the 2009
Sumatra Earthquake (M7.5).
Total losses caused by the 2004 Indian Ocean Earthquake (M9.1) were USD 10 billion
(1.5% of GDP). The 2006 Central Java Earthquake (M6.3) was not so large in
magnitude, but more than 5 thousand people were killed, with loss totaling USD 3.1
billion (0.40% of GDP). The 2009 Sumatra Earthquake (M7.5) caused the deaths of
more than 1,000 people and USD2.2 billion in losses (0.23% of GDP).
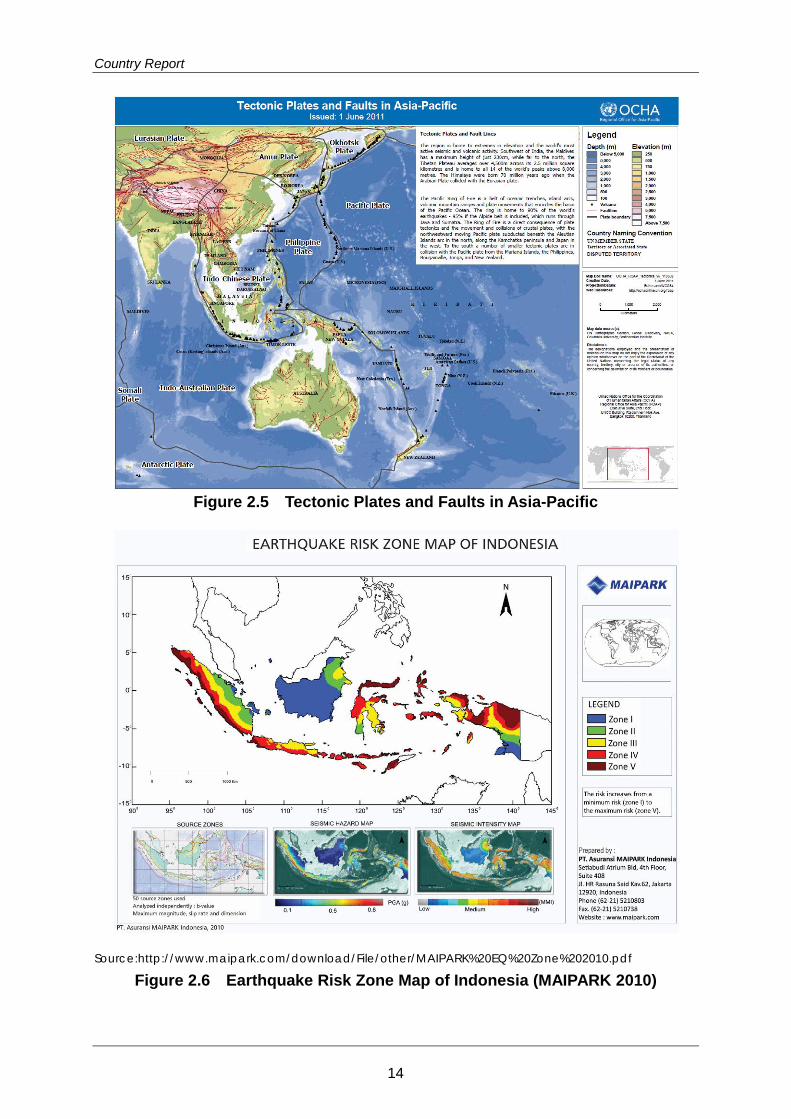
Background The south end of the Eurasian Plate where the Indonesian Archipelago is located
forms complex plate boundaries with the subducting Indo-Australian Plate and the
surging Pacific Plate and Philippine Sea Plate (See Figure 2.5). This causes many
earthquakes around the area.
Many large earthquakes occur along the Sunda (Java) Trench where the
Indo-Australian Plate subducts under the Indonesian Archipelago, as seen in the 2004
Indian Ocean Earthquake (M9.1) (See Figure 2.4).
Figure 2.6 is the Earthquake Risk Map developed by the insurance company, PT.
Asuransi MAIPARK Indonesia. The map illustrates that the Sunda Trench sides of
Sumatra and Java and the Pacific Ocean sides of New Guinea and Sulawesi have a
high earthquake risk. On the other hand, the Java Sea and the Banda Sea sides have
11

Country Report
a low earthquake risk. The earthquake risk of Kalimantan is especially lower than other
areas.
Responses by Indonesia Disaster Management Information
The Geology Research Development Centre (GRDC) has developed active fault
maps for Mt. Merapi and Mt. Krakatoa, and a seismotectonic map of Manado.
For Aceh Province, TDMRC (Tsunami & Disaster Mitigation Research Center, Syiah
Kuala University) has developed risk maps.
The National Agency for Disaster Management (BNPB) has developed two databases
called GEOSPASIAL and DIBI (Data dan Informasi Bencana Indonesia), which are
posted on their website. GEOSPASIAL is a Web-GIS database system that displays: (1)
disaster/damage information caused by disasters occurring within 30 days, (2) various
types of hazard maps, and (3) administrative boundaries on maps. DIBI is a database
that stores information on historical disaster events in Indonesia. After a disaster has
occurred, BNPB collects disaster information from the national government, local
governments, NGOs, universities, etc., and enters the information into the database.
The DIBI has accumulated data on disasters since 1815.
Early Warning and Information Transmission
The Meteorological, Climatological and Geophysical Agency (BMKG) prepares
Seismic Intensity Maps in measured in Modified Mercalli Intensity after earthquakes
and posts them on their website.
BMKG also operates the InaTEWS (Indonesia Tsunami Early Warning System), which
manages the observation, analysis, evaluation, and transmission of information for
earthquakes and tsunamis. Data is transmitted to the InaTEWS from more than 300
BMKG seismographs, GPS and tide-gauges from the Geospatial Information Agency
(BIG), and tsunami buoys of Agency for the Assessment and Application of
Technology (BPPT).
12

Natural Disaster Risks
(a) Human Losses
(b) Economic Losses (% of GDP)
Data Sources: EM-DAT, The OFDA/CRED International Disaster Database, Université catholique de Louvain, Brussels, Belgium:
http://www.emdat.be. National Geophysical Data Center (NGDC), National Oceanic and Atmospheric Administration (NOAA):
http://ngdc.noaa.gov/hazard/hazards.shtml
Figure 2.4 Locations of Earthquake Disasters in Indonesia
13
Country Report
Figure 2.5 Tectonic Plates and Faults in Asia-Pacific
Source:http://www.maipark.com/download/File/other/MAIPARK%20EQ%20Zone%202010.pdf
Figure 2.6 Earthquake Risk Zone Map of Indonesia (MAIPARK 2010)
14

Natural Disaster Risks
Sources of Hazard and Risk Information Table 2.3 Sources of Hazard and Risk Information: Earthquake
Badan Nasional Penanggulangan Bencana (BNPB) National Agency for Disaster Management
http://www.bnpb.go.id/
GEOSPASIAL
http://geospasial.bnpb.go.id/
Data dan Informasi Bencana Indonesia (DIBI) Indonesian Disaster Information and Data
http://dibi.bnpb.go.id/DesInventar/dashboard.jsp?lang=ID
Badan Meteorologi, Klimatologi, dan Geofisika (BMKG) Meteorological, Climatological and Geophysical Agency
http://www.bmkg.go.id/BMKG_Pusat/Depan.bmkg
Indonesia Tsunami Early Warning System (InaTEWS)
http://inatews.bmkg.go.id/new/
Badan Informasi Geospasial (BIG) Geospatial Information Agency
http://www.bakosurtanal.go.id/
Badan Penanggulangan Bencana Aceh (BPBA) Aceh Disaster Management Agency
http://bpba.acehprov.go.id/
Tsunami and Disaster Mitigation Research Center (TDMRC), Syiah Kuala University
http://www.tdmrc.org/en/
Badan Geologi
http://www.bgl.esdm.go.id/
Pusat Vulkanologi dan Mitigasi Bencana Geologi (PVMBG) Center for Volcanology and Geological Hazard Mitigation
http://www.vsi.esdm.go.id/static_content.php?id_kategori=1
Reports on Hazard and/or Risk Assessment Useful information and studies on earthquake hazard, risk, and vulnerability were
collected from resources available in the public domain including websites. The
information and studies include methodologies with analysis and assessment.
15
Country Report
There is no standardized or authorized methodology for risk and vulnerability
assessment. Therefore, the methodology should be selected or updated in
accordance with the purpose when risk and vulnerability assessments are required.
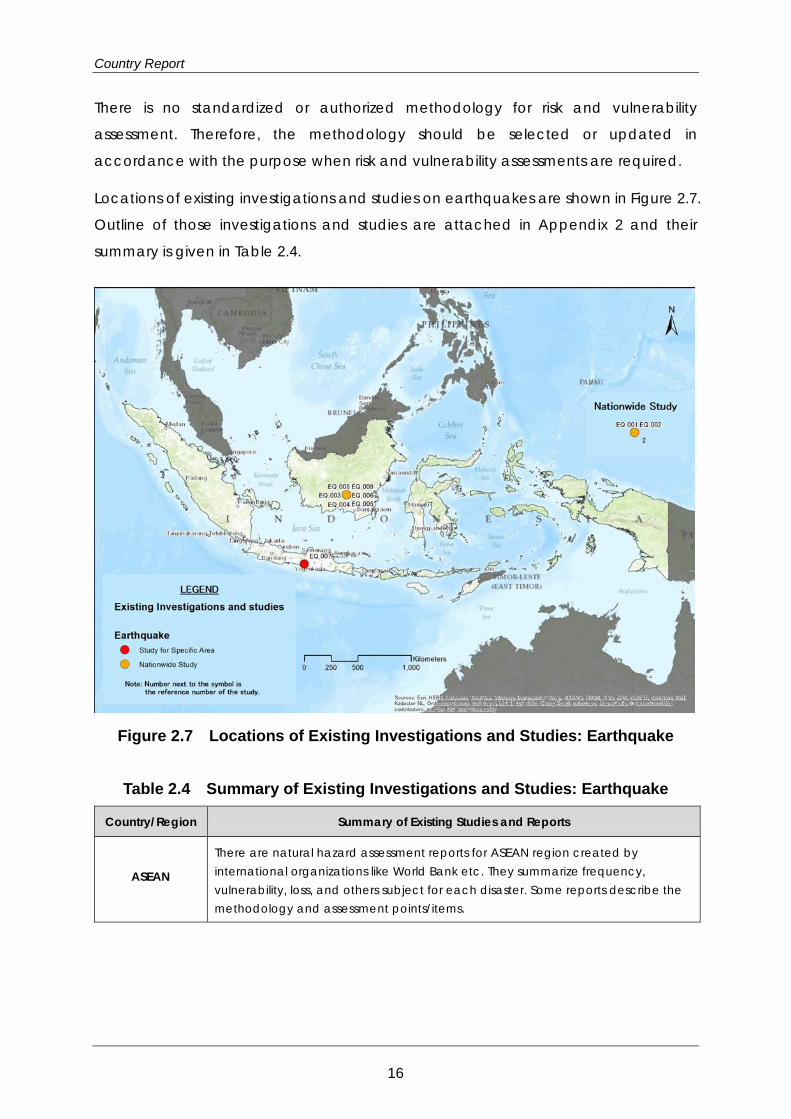
Locations of existing investigations and studies on earthquakes are shown in Figure 2.7.
Outline of those investigations and studies are attached in Appendix 2 and their
summary is given in Table 2.4.
Figure 2.7 Locations of Existing Investigations and Studies: Earthquake
Table 2.4 Summary of Existing Investigations and Studies: Earthquake
Country/Region Summary of Existing Studies and Reports
ASEAN
There are natural hazard assessment reports for ASEAN region created by international organizations like World Bank etc. They summarize frequency, vulnerability, loss, and others subject for each disaster. Some reports describe the methodology and assessment points/items.
16

Natural Disaster Risks
Indonesia
Many organizations executed earthquake hazard-related investigations and studies for Indonesia. There is a zoning map for earthquake insurance in this country. BNPB publishes seismic intensity maps and related damage information for the earthquakes that have occurred since 2009. However, descriptions are written in Indonesian, limiting users.
References for Data and Further Reading 1) BAPPENAS, the Provincial and Local Governments of D.I. Yogyakarta, the
Provincial and Local Governments of Central Java, and international partners,
(2006). Preliminary Damage and Loss Assessment: Yogyakarta and Central Java
Natural Disaster: The 15th Meeting of The Consultative Group on Indonesia
Jakarta, June 14, 2006
2) EM-DAT: The OFDA/CRED International Disaster Database – www.emdat.be –
Université Catholique de Louvain – Brussels – Belgium.
3) Japan International Cooperation Agency (JICA) (2012): “Data Collection Survey
on ASEAN Regional Collaboration in Disaster Management”
4) Mark Petersen et al. (2007). , Documentation for the Southeast Asia Seismic
Hazard Maps, USGS
5) OCHA-ROAP (2011). Indonesia: Natural Hazard Risks
6) PT. Asuransi MAIPARK (2010). Earthquake Risk Zone Map of Indonesia
7) United Nations Office for the Coordination of Humanitarian Affairs (OCHA),
Regional Office for Asia Pacific (ROAP) (2011): “Tectonic Plates and Faults in
Asia-Pacific”, Downloaded from
http://reliefweb.int/sites/reliefweb.int/files/resources/OCHA_ROAP_Tectonics_v6
_110602.pdf
8) USGS (2009). Seismic Hazard of Western Indonesia
17

Country Report
2.4 Tsunami
Risks Locations of earthquake disasters in Indonesia are shown in Figure 2.8. Size of circles
represents the scale of the disasters in terms of human losses and economic losses.
The 2004 Indian Ocean Earthquake (M9.1) and its tsunami affected 500,000 people,
with 170,000 dead or missing, and USD 4.45 billion in losses (0.68% of GDP). The 2006
Java Earthquake (M7.7) caused 800 deaths and USD 55 million in losses (0.007% of
GDP).
More than 1,000 people were also killed by the 1674 Seram Earthquake (M6.8), the
1815 Bali Earthquake (M7.0), the 1861 Sumatra Earthquake (M8.5), the 1899 Seram
Earthquake (M7.8), and the 1992 Flores Earthquake (M7.8). Moreover, the volcanic
eruption of Mt. Krakatoa in 1883 caused a tsunami that killed more 30,000 people.
In Indonesia, which is surrounded by ocean and experiences many earthquakes,
tsunami is one of the most catastrophic risks and attention should be paid to it.
Background It is well known that tsunamis are generated by sea floor earthquakes. However, an
undersea volcanic eruption, an undersea landslide, or other disturbances above or
below water can also generate a tsunami.
Figure 2.9 is the Tsunami Disaster Risk Map of Indonesia developed by the National
Agency for Disaster Management (BNPB). It illustrates that the coasts of Sumatra and
Java along the Sunda Trench, the coasts of Lesser Sunda, Sulawesi, and Moluccas,
and the east coast of Kalimantan have tsunami risk.
Moreover, the Tsunami Hazard Map, developed by the Volcanic Tsunami Working
Group (called “Firewaves”), shows that the coast of Sumatra along the Sunda Trench,
the coast along the Cenderawasih Bay of New Guinea and the coast of Seram along
the Banda Sea have especially high tsunami risk. (See Figure 2.10)
18

Natural Disaster Risks
(a) Human Losses
(b) Economic Losses (% of GDP)
Data Sources: EM-DAT, The OFDA/CRED International Disaster Database, Université catholique de Louvain, Brussels, Belgium:
http://www.emdat.be. National Geophysical Data Center (NGDC), National Oceanic and Atmospheric Administration (NOAA):
http://ngdc.noaa.gov/hazard/hazards.shtml
Figure 2.8 Locations of Tsunami Disaster in Indonesia
19

Country Report
Figure 2.9 Threat of Tsunami Disaster in Indonesia by BNPB
Figure 2.10 Tsunami Hazard Map of Indonesia
20

Natural Disaster Risks
Responses by Indonesia Disaster Management Information
Geospatial Information Agency (BIG) developed multi-hazard maps for flooding and
tsunami, which are posted on their website.
Geology Research Development Centre (GRDC) developed tsunami hazard maps of
Sulawesi, Barat, Gorontalo, and Aceh in 2012, and is currently developing tsunami
hazard maps of Sulawesi Utara and Sulawesi Selatan.
The National Agency for Disaster Management (BNPB) has set up two database
systems named “GEOSPASIAL” and “DIBI,” which are posted on their website.
GEOSPASIAL is a Web-GIS database system that displays: (1) disaster/damage
information caused by disasters occurring within 30 days, (2) various types of hazard
maps, and (3) administrative boundaries on maps. DIBI is a database that stores
information on historical disasters in Indonesia after 1815 collected by the national
government, local governments, NGOs, universities, etc.
Early Warning and Transmitting Information
The Meteorological, Climatological and Geophysical Agency (BMKG) operates the
InaTEWS (Indonesia Tsunami Early Warning System), which is an integrated system
composed of seismic and tsunami observations, analysis, evaluation, and
dissemination. All data recoded by more than 300 seismometers managed by BMKG,
GPS and tide gauges managed by BIG, and tsunami buoys managed by Agency for
the Assessment and Application of Technology (BPPT) are transmitted to InaTEWS.
The tsunami early warning consists of the following 3 ranks, “Red (Major Warning):
Tsunami height > 3 meters”, “Orange (Warning): Tsunami height 0.5-3 meters”, and
“Yellow (Advisory): Tsunami height < 0.5 meters.” The InaTEWS provides early warning
on tsunami that may impact Indonesia to disaster management agencies, local
governments, mass media, etc. within 5 minutes after an earthquake occurs.
Early warning to the public is disseminated through sirens, television, radio, SMS, FM
Radio Data System (FMRDS) alerts receiver, speakers, police sirens, social media
(Facebook, Twitter), etc. Twenty-four (24) tsunami sirens are installed in six provinces.
21

Country Report
Preparedness and Education
For Aceh Province, the Tsunami & Disaster Mitigation Research Center (TDMRC) of
Syiah Kuala University has developed many kinds of risk maps. TDMRC has also
published educational materials on tsunami disaster prevention. The database,
called DIBA (Data dan Informasi Bencana Aceh), includes all of the disasters that
have occurred in Aceh Province and is posted on their website. The Aceh Tsunami
Museum can be used as a tsunami evacuation building. The four evacuation
buildings constructed by a grant aid project in Aceh Province can accommodate
6,000 people.
The Ministry of National Education of Indonesia has established a curriculum for
primary and secondary school students regarding disaster management for six major
hazards: earthquake, tsunami, volcano, flood, landslide and typhoon/cyclone.
Sources of Hazard and Risk Information Table 2.5 Sources of Hazard and Risk Information: Tsunami
Badan Nasional Penanggulangan Bencana (BNPB) National Agency for Disaster Management
http://www.bnpb.go.id/
GEOSPASIAL
http://geospasial.bnpb.go.id/
Data dan Informasi Bencana Indonesia (DIBI) Indonesian Disaster Information and Data
http://dibi.bnpb.go.id/DesInventar/dashboard.jsp?lang=ID
Badan Meteorologi, Klimatologi, dan Geofisika (BMKG) Meteorological, Climatological and Geophysical Agency
http://www.bmkg.go.id/BMKG_Pusat/Depan.bmkg
Indonesia Tsunami Early Warning System (InaTEWS)
http://inatews.bmkg.go.id/new/
Badan Informasi Geospasial (BIG) Geospatial Information Agency
http://www.bakosurtanal.go.id/
Badan Penanggulangan Bencana Aceh (BPBA) Aceh Disaster Management Agency
http://bpba.acehprov.go.id/
Tsunami and Disaster Mitigation Research Center (TDMRC), Syiah Kuala University
22

Natural Disaster Risks
http://www.tdmrc.org/en/
Badan Geologi
http://www.bgl.esdm.go.id/
Pusat Vulkanologi dan Mitigasi Bencana Geologi (PVMBG) Center for Volcanology and Geological Hazard Mitigation
http://www.vsi.esdm.go.id/static_content.php?id_kategori=1
Reports on Hazard and/or Risk Assessment Useful information and studies on tsunami hazard, risk, and vulnerability were
collected from resources available in the public domain including websites. The
information and studies include methodologies with analysis and assessment.
There is no standardized or authorized methodology for risk and vulnerability
assessment. Therefore, methodology should be selected or updated in accordance
with the purpose when risk and vulnerability assessment are required.
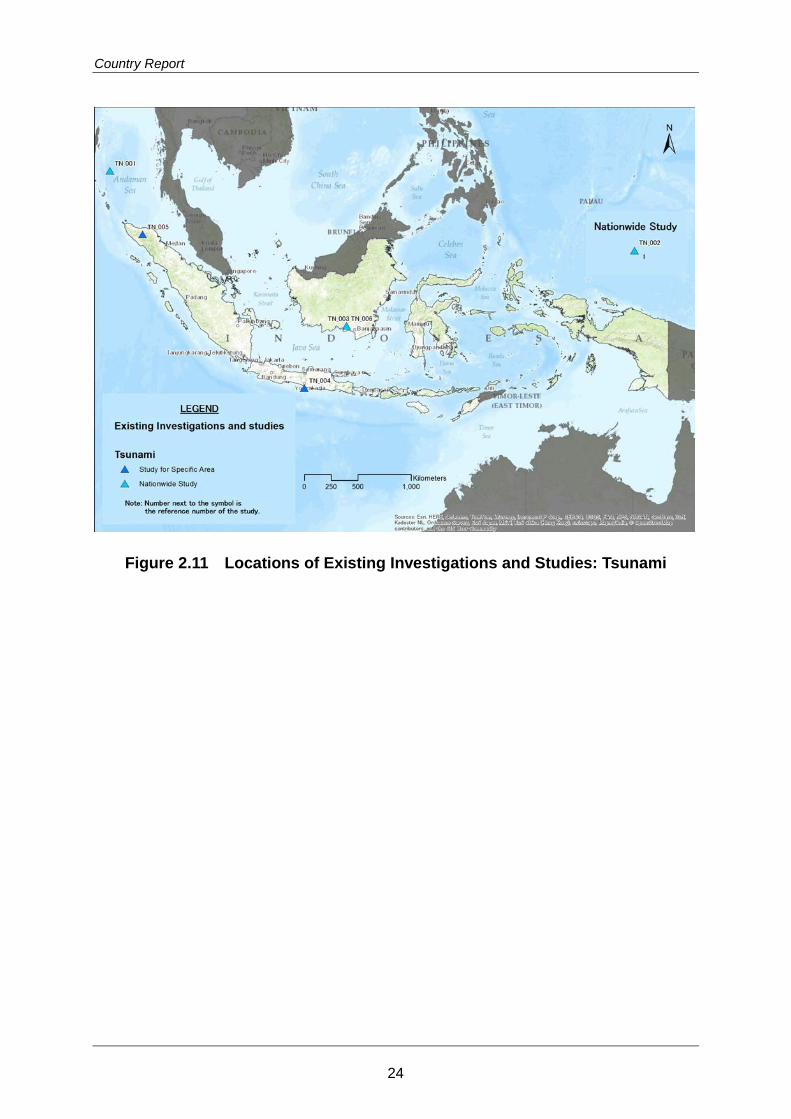
Locations of existing investigations and studies on tsunami are shown in Figure 2.11.
Outline of those investigations and studies are attached in Appendix 2 and their
summary is given in Table 2.6.
23
Country Report
Figure 2.11 Locations of Existing Investigations and Studies: Tsunami
24

Natural Disaster Risks
Table 2.6 Summary of Existing Investigations and Studies: Tsunami
Country/Region Summary of Existing Studies and Reports
ASEAN Tsunami induced by the Sumatra earthquake on December 26, 2004 caused major damage to ASEAN countries. The disaster is summarized by organizations like ADB.
Indonesia
There are some materials summarizing tsunami hazards. There is a report of tsunami disaster on May 27, 2006 that affected Jogjakarta and the surrounding area. BNPB publishes damage information for tsunamis caused by earthquakes that have occurred since 2010. However, descriptions are made in Indonesian, limiting users.
References for Data and Further Reading 1) ADB (2005). From Disaster to Reconstruction: A Report on ADB's Response to the
Asian Tsunami
2) BAPPENAS, the Provincial and Local Governments of D.I. Yogyakarta, the
Provincial and Local Governments of Central Java, and international partners,
(2006). Preliminary Damage and Loss Assessment: Yogyakarta and Central Java
Natural Disaster: The 15th Meeting of The Consultative Group on Indonesia
Jakarta, June 14, 2006
3) Japan International Cooperation Agency (JICA) (2012): “Data Collection Survey
on ASEAN Regional Collaboration in Disaster Management”
4) EM-DAT: The OFDA/CRED International Disaster Database – www.emdat.be –
Université Catholique de Louvain – Brussels – Belgium.
5) Volcanic Tsunami Working Group, Firewaves:
“Tsunami Hazard map of Indonesia”, Downloaded from
“http://raphael.paris.pagesperso-orange.fr/database/indonesia_tsunami.jpg”
25

Country Report
2.5 Volcanoes
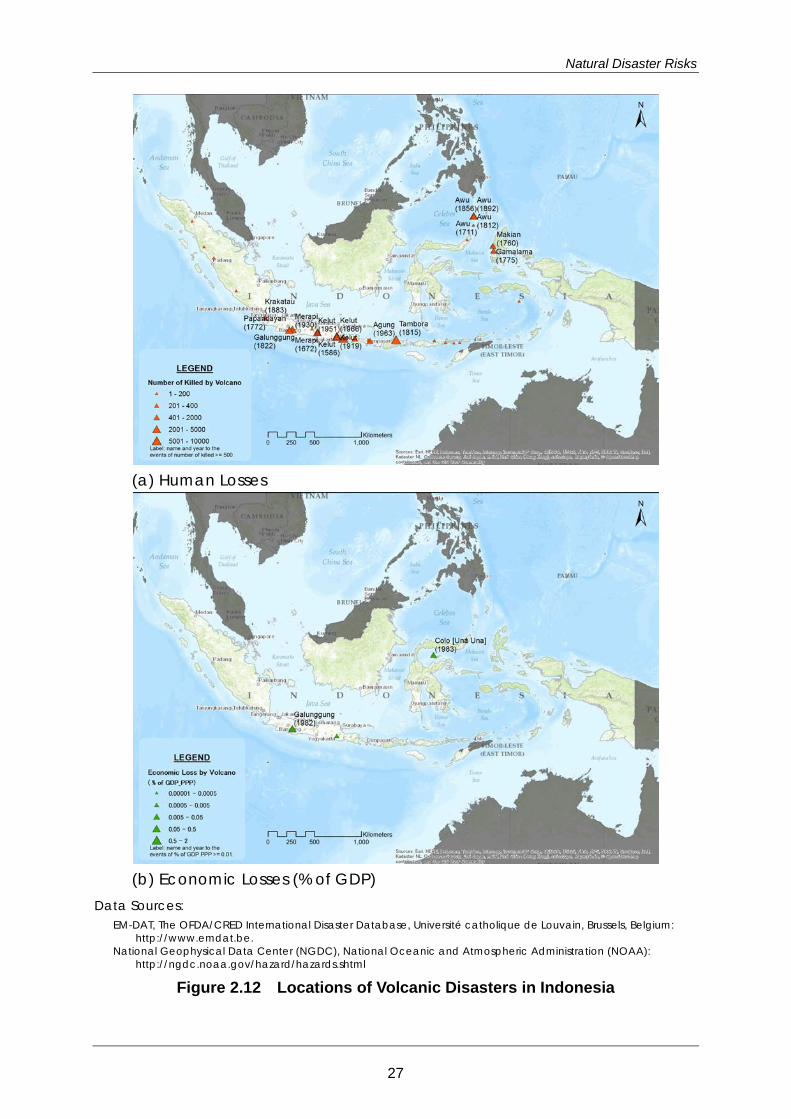
Risks Locations of earthquake disasters in Indonesia are shown in Figure 2.12. Size of triangle
symbols represents the scale of the disasters in terms of human losses and economic
losses.
The volcanic eruption of Mt. Tambora in 1815 was the largest eruption in the history of
Indonesia caused more than 10,000 deaths. The eruption of Mt. Krakatoa in 1883 was
the second largest eruption in history inducing a large landslide, which in turn caused
a devastating tsunami.
There are many volcanoes including Mt. Merapi, Mt. Kelute, Mt. Awe and Mt. Sumeru,
which had erupted many times in throughout history and are still active. Mt. Merapi is
especially active and has erupted five times in the past 20 years (1994, 1997, 1998,
2006, and 2010). 322 people were killed by the eruption in 2010. The eruptions of Mt.
Kelute in 1586, 1909, 1919, and 1966 caused several thousands of deaths and the
latest eruption in 1990 also caused 10~20 deaths.
In terms of economic impact, the following losses caused by the eruptions were
recorded: USD 160 million (0.12% of GDP) with the eruption of Mt. Galunggung in 1982,
USD 150 million (0.10% of GDP) with the eruption of Mt. Gamalama in 1983, and USD
25 million (0.02% of GDP) with the eruption of Mt. Colo in 1983.
Background There are about 150 volcanoes in Indonesia and 80 of them are active volcanoes.
Historical records show up to 1,200 eruptions. Figure 2.13 shows volcanoes that
erupted after 1900 A.D. Most of the volcanoes are located in Sumatra, Java, Lesser
Sunda, the north part of Sulawesi and Moluccas.
Figure 2.14 shows the volcanoes in Asia-Pacific region that have erupted during the
Holocene. The Holocene is a geological epoch from 10,000 years ago to the present.
The map indicates that Indonesia is one of the areas where volcanoes have erupted
most actively.
26
Natural Disaster Risks
(a) Human Losses
(b) Economic Losses (% of GDP)
Data Sources: EM-DAT, The OFDA/CRED International Disaster Database, Université catholique de Louvain, Brussels, Belgium:
http://www.emdat.be. National Geophysical Data Center (NGDC), National Oceanic and Atmospheric Administration (NOAA):
http://ngdc.noaa.gov/hazard/hazards.shtml
Figure 2.12 Locations of Volcanic Disasters in Indonesia
27

Country Report
Figure 2.13 Major Volcanoes of Indonesia
Figure 2.14 Holocene Eruption and Selected Volcanoes in Asia-Pacific
28
Natural Disaster Risks
Responses by Indonesia Disaster Management Information
The National Agency for Disaster Management (BNPB) has set up two database
systems named “GEOSPASIAL” and “DIBI,” which are posted on their website.
GEOSPASIAL is a Web-GIS database system that displays: (1) disaster/damage
information caused by disasters occurring within 30 days, (2) various types of hazard
maps, and (3) administrative boundaries on maps. DIBI is a database that stores
information on historical disasters in Indonesia after 1815 collected by the national
government, local governments, NGOs, universities, etc.
Early Warning and Transmitting Information
Survey and monitoring activities of active volcanoes, such as creating geological
maps, seismic observations, ground deformations, magnetic and gravity surveys, and
geochemical surveys, etc., are conducted by the Center for Volcanology and
Geological Hazard Mitigation (CVGHM).
The CVGHM has developed 80 hazard maps for volcanoes. On the maps, the
volcanic hazardous areas are classified into the following 3 categories: “Region I:
Affected by secondary risk from eruption (lahars, ash clouds)”, “Region II: Affected by
material eruption by climatic condition,” and “Region III: Directly affected by material
eruption (pyroclastic flow, debris, gasses).”
The early warning system for volcanic eruption is by the CVGHM. The warning levels
for volcanic eruption are classified into the following 4 categories: “Level I: Normal,
Volcanic activity stays in normal without any difference from its background levels”,
“Level II: Alert, Volcanic activity begins to increase and has passed over its
background levels”, “Level III: Stand by, Volcanic activity shows its precursor before
eruption,” and “Level IV: Danger, Started with volcanic ash eruption, and then
approaching the main eruption.”
Preparedness and Education
Relocation of communities from hazardous areas has been conducted in the
rehabilitation and reconstruction program of Merapi.
29
Country Report
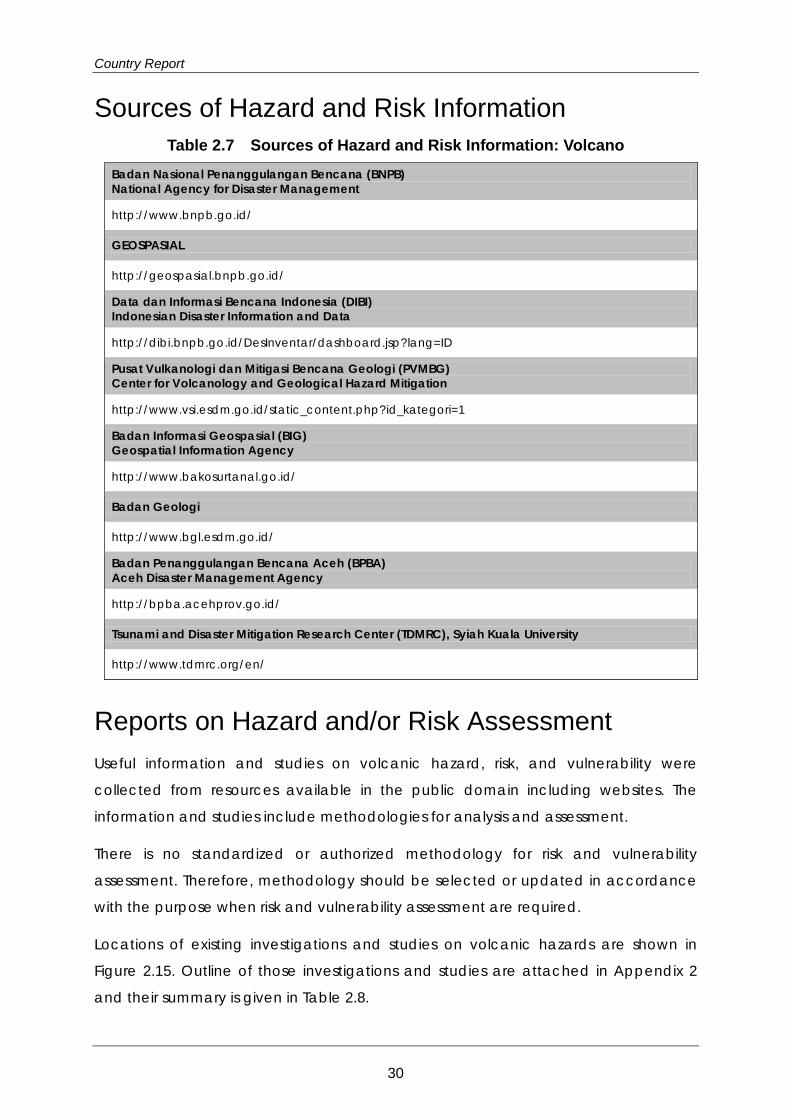
Sources of Hazard and Risk Information Table 2.7 Sources of Hazard and Risk Information: Volcano
Badan Nasional Penanggulangan Bencana (BNPB) National Agency for Disaster Management
http://www.bnpb.go.id/
GEOSPASIAL
http://geospasial.bnpb.go.id/
Data dan Informasi Bencana Indonesia (DIBI) Indonesian Disaster Information and Data
http://dibi.bnpb.go.id/DesInventar/dashboard.jsp?lang=ID
Pusat Vulkanologi dan Mitigasi Bencana Geologi (PVMBG) Center for Volcanology and Geological Hazard Mitigation
http://www.vsi.esdm.go.id/static_content.php?id_kategori=1
Badan Informasi Geospasial (BIG) Geospatial Information Agency
http://www.bakosurtanal.go.id/
Badan Geologi
http://www.bgl.esdm.go.id/
Badan Penanggulangan Bencana Aceh (BPBA) Aceh Disaster Management Agency
http://bpba.acehprov.go.id/
Tsunami and Disaster Mitigation Research Center (TDMRC), Syiah Kuala University
http://www.tdmrc.org/en/
Reports on Hazard and/or Risk Assessment Useful information and studies on volcanic hazard, risk, and vulnerability were
collected from resources available in the public domain including websites. The
information and studies include methodologies for analysis and assessment.
There is no standardized or authorized methodology for risk and vulnerability
assessment. Therefore, methodology should be selected or updated in accordance
with the purpose when risk and vulnerability assessment are required.
Locations of existing investigations and studies on volcanic hazards are shown in
Figure 2.15. Outline of those investigations and studies are attached in Appendix 2
and their summary is given in Table 2.8.
30

Natural Disaster Risks
Figure 2.15 Locations of Existing Investigations and Studies: Volcano
Table 2.8 Summary of Existing Investigations and Studies: Volcano
Country/Region Summary of Existing Studies and Reports
ASEAN UNOCHA summarized the scale of the explosion of volcanoes around the Asia-Pacific region using the Volcanic Explosivity Index (VEI).
Indonesia The governmental organization BNPB publishes volcanic hazard maps on its website. Some maps use satellite images.
References for Data and Further Reading 1) EM-DAT: The OFDA/CRED International Disaster Database – www.emdat.be –
Université Catholique de Louvain – Brussels – Belgium.
2) Japan International Cooperation Agency (JICA) (2012): “Data Collection Survey
on ASEAN Regional Collaboration in Disaster Management”
3) Lee Siebert, Tom Simkin, and Paul Kimberly (2011): “Volcanoes of the World -
Third Edition”, Smithsonian Institute/University of California Press
4) OCHA -ROAP (2011). Holocene Eruption and Selected Volcanoes in Asia-Pacific
31
Country Report
5) United Nations Office for the Coordination of Humanitarian Affairs (OCHA),
Regional Office for Asia Pacific (ROAP) (2011): “Holocene Eruption and Selected
Volcanoes in Asia-Pacific”, Downloaded from
http://reliefweb.int/sites/reliefweb.int/files/resources/map_619.pdf
6) USGS/CVO (2001), “Map, Major Volcanoes of Indonesia with eruptions since
1900 A.D.”, Downloaded from
http://vulcan.wr.usgs.gov/Volcanoes/Indonesia/Maps/map_indonesia_volcano
es.html
32

Natural Disaster Risks
2.6 Cyclone and Meteorological Hazards
Risks Indonesia is located between latitudes 6° to the north and 11° to the south and
longitudes 95° and 141° to the east. As it is located near the equator, it has a tropical
climate characterized by high temperatures, heavy rainfall, and high humidity.
The southeastern part of Sumatra Island, Java Island, and the Lesser Sunda Islands
located in the southern hemisphere away from the equator have two seasons. There
is much rain during the rainy season (summer in the southern hemisphere) from
October to March and less rain during the dry season (winter in the southern
hemisphere) from April to September in these regions. On the other hand, there are
two maximum occurrences of rain in a year in the Moluccas Malay Peninsula close to
the equator, Sumatra, Borneo, and Celebes, as the rainfall increases during the
alternation of monsoon winds there. Annual rainfall in most areas of the country
exceeds 2,000 mm. Rainfall is less than 1,000 mm in parts of the Lesser Sunda Islands
and the eastern part of Java.
As Indonesia is located in the subtropical region on the equator, it is not usually
affected by tropical cyclones. Five storm disasters due to tropical cyclones have
occurred in the country according to 1980 - 2012 records.
Table 2.9 Tropical Cyclone (Storm) Disasters in Indonesia (1980 - 2012)
Date Cause Killed Total Affected February 1980 Tropical Cyclone - 800 January 1982 Tropical Cyclone 2 123 February 1985 Storm - 10000 February 2004 Storm 4 2400 March 2004 Tropical Cyclone - 1315
The major meteorological disaster which occurs in Indonesia is flood. In addition to
flood hazards, Indonesia is also affected by landslides, forest fires, droughts, and storm
disasters. Extreme weather phenomena such as droughts and heavy rains related to
El Niño may result to significant impacts on agriculture. Serious damage brought
about by droughts and heavy rains due to El Niño have been reported in 1982, 1991,
1997 and 1998. The most severe of these occurrences was the drought of 1997, which
resulted in the death of 672 people and affected over one (1) million others. The
Indonesian regions most prone to drought are the western Sumatra and Java Islands.
33
Country Report
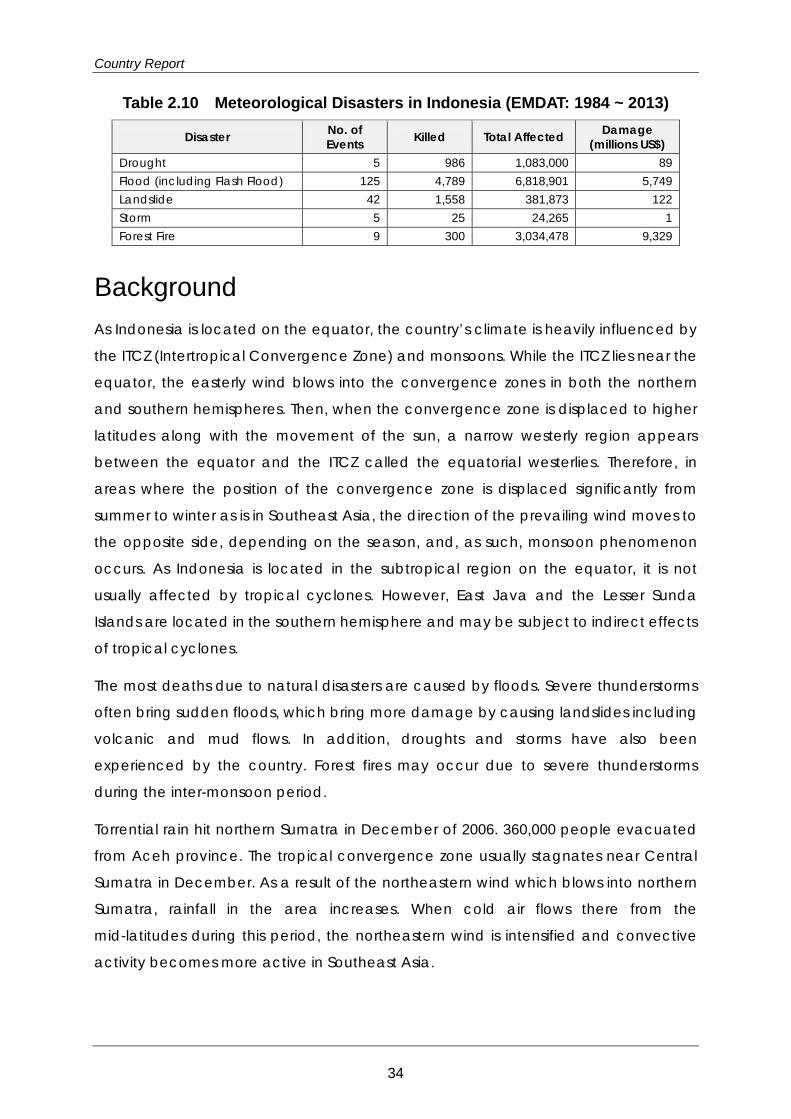
Table 2.10 Meteorological Disasters in Indonesia (EMDAT: 1984 ~ 2013)
Disaster No. of Events Killed Total Affected Damage
(millions US$) Drought 5 986 1,083,000 89 Flood (including Flash Flood) 125 4,789 6,818,901 5,749 Landslide 42 1,558 381,873 122 Storm 5 25 24,265 1 Forest Fire 9 300 3,034,478 9,329
Background As Indonesia is located on the equator, the country’s climate is heavily influenced by
the ITCZ (Intertropical Convergence Zone) and monsoons. While the ITCZ lies near the
equator, the easterly wind blows into the convergence zones in both the northern
and southern hemispheres. Then, when the convergence zone is displaced to higher
latitudes along with the movement of the sun, a narrow westerly region appears
between the equator and the ITCZ called the equatorial westerlies. Therefore, in
areas where the position of the convergence zone is displaced significantly from
summer to winter as is in Southeast Asia, the direction of the prevailing wind moves to
the opposite side, depending on the season, and, as such, monsoon phenomenon
occurs. As Indonesia is located in the subtropical region on the equator, it is not
usually affected by tropical cyclones. However, East Java and the Lesser Sunda
Islands are located in the southern hemisphere and may be subject to indirect effects
of tropical cyclones.
The most deaths due to natural disasters are caused by floods. Severe thunderstorms
often bring sudden floods, which bring more damage by causing landslides including
volcanic and mud flows. In addition, droughts and storms have also been
experienced by the country. Forest fires may occur due to severe thunderstorms
during the inter-monsoon period.
Torrential rain hit northern Sumatra in December of 2006. 360,000 people evacuated
from Aceh province. The tropical convergence zone usually stagnates near Central
Sumatra in December. As a result of the northeastern wind which blows into northern
Sumatra, rainfall in the area increases. When cold air flows there from the
mid-latitudes during this period, the northeastern wind is intensified and convective
activity becomes more active in Southeast Asia.
34
Natural Disaster Risks
Droughts, floods, and many more extreme weather events are likely to occur
because Indonesia is impacted by El Niño. Areas with a high risk of flooding are
spread all throughout Indonesia, especially on the east coast of the northern part of
Sumatra, the northern coasts of the western part of Java Island, the western and
southern parts of Kalimantan Island, the southern part of Sulawesi Island, and the
southern parts of Papua. Direct damage of tropical cyclones is not that significant,
but cyclones (tropical depressions) may affect Java and the Lesser Sunda Islands,
which are located in the eastern part of Indonesia located in the southern
hemisphere. Tidal waves, tornadoes, and storm surges in the area may also cause
damage. In addition, the northern states of Sulawesi and the coastal areas of Marc
Islands in the northern hemisphere may be subject to damage due to storm surges
and high waves, which may have resulted from the effects of typhoons in Philippine
waters. Additionally, many tornadoes that occurred in Java and Bali were due to the
cumulonimbus clouds associated with Cyclone Iggy in January of 2012.
Climate change vulnerability and impact on Indonesia are follows.
For tropical cyclone frequency, more models suggest a decreasing trend in
tropical storm frequency over the 21st century than an increasing trend in the
western North Pacific.
For tropical cyclone intensity, most of the studies projected an increase in
tropical cyclone intensity over the western North Pacific.
The annual mean temperature in Indonesia has been increasing by around
0.3 °C since 1990, occurring in all seasons of the year. This is relatively
consistent with, if not slightly lower than the expectation of the warming trend
due to climate change.
It has been projected that mean temperature will increase over 20 years from
somewhere between 0.36 to 0.47 °C by 2020 with the highest temperatures
potentially occurring in the islands of Kalimantan and the southeastern part of
the Moluccas (DFID, 2007).
An increase in annual precipitation is predicted across the majority of the
Indonesian islands, except in southern Indonesia, where it is projected to
decline by up to 15%.
35
Country Report
There could also be change in the seasonality of precipitation. Parts of
Sumatra and Borneo may become 10 to 30% wetter by the 2080s during
December-February. Jakarta is projected to become 5 to 15% drier during
June-August.
Indonesia is sensitive to climate change. The country may experience prolonged
droughts, increased flooding, and more frequent and severe storms as a
consequence of climate change. Indonesia is currently experiencing a sea level
increase of 1-3 mm/year in coastal areas, and this is projected to increase at a rate of
about 5 mm per year over the next century. In addition, the impact of the increased
frequency and severity of El Niño events may cause several coastal regions to
become susceptible to damage.
Responses by Indonesia As part of the implementation of Law Number 24 Year 2007 on Disaster Management,
particularly Article 36, the government and local governments are required to
prepare a Disaster Management Plan in line with their authority. These preparations
will be coordinated by the Agency.
Meteorological Service in Indonesia is under the responsibility of the BMKG (Badan
Meteorologi, Klimatologi, Dan Geofisika). It consists of four technical sections:
meteorology, climatology, geophysical, and instrument/calibration/network.
The Indonesian region is not directly affected by tropical cyclones. However, the
occurrence of tropical cyclones in nearby regions influences Indonesian weather,
resulting in extreme weather disasters, floods, and landslides.
Indonesia has been a member of the RA-V Tropical Cyclone Committee since it was
established by RA V-IX in 1986. BMG (BMKG) operates the Jakarta TCWC (Tropical
Cyclone Warning Centre) covering the sea area of latitudes from the equator to 10°
to the south and longitudes 90° and 125° to the east. The BKMG monitors the
tendencies of tropical cyclones and conducts forecasts in its area of responsibility.
The Jakarta TCWC issues TC outlooks, extreme weather warnings, high wave warnings,
coastal zone warnings, and aviation advisories.
The BKMG has been authorized to perform the following tasks:
To prepare for national policy, public policy, and technical policy;
36

Natural Disaster Risks
To do maintenance work for observation instruments, data and information
processing;
To provide information related to climate change to stakeholders and
relevant institutions;
To issue early warning information to the public and relevant agencies;
To promote research, assessment, and development;
To implement and educate with regards to the calibration of observation
equipment and the communication network; and
To implement of projects in cooperation with international actors.
Sources of Hazard and Risk Information Table 2.11 Sources of Hazard and Risk Information: Cyclone and Other
Meteorological Hazards Indonesia Weather, Climate, Geophysical Agency (BMKG) (Badan Meteorologi, Klimatologi, Dan Geofisika)
http://www.bmkg.go.id/BMKG_Pusat/Depan.bmkg / Tel : +62-21-4246321
Table 2.12 Other Sources of Information: Cyclone and Other Meteorological
Hazards
Institution Literature name
UNDP (2007) Climate Variability and Climate Changes, and Their Implication Government http://www.undp.or.id/pubs/docs/Final% 20Country% 20Report% 20 -% 20Climate% 20Change.pdf
UNISDR (2010) Synthesis Report on Ten ASEAN Countries Disaster Risks Assessment http://www.unisdr.org/files/18872_asean.pdf
OCHA Regional Office for Asia Pacific (2011)
Indonesia: Natural Hazard Risks http://reliefweb.int/sites/reliefweb.int/files/resources/map_1297.pdf
Reports on Hazard and/or Risk Assessment “Cyclone” is a term to describe many types of low pressure systems, of which tropical
cyclones/typhoons are the main types creating disasters in the ASEAN region. Under
the framework of WMO, leading countries implement monitoring/detection of
37

Country Report
tropical cyclones on a regional basis. Table 2.13 indicates the responsible territory
allocated to ASEAN members and its leading country.
Table 2.13 Members of WMO Tropical Cyclone Committee
Warning Zones
Members(ASEAN) Leading Country
Western North Pacific Ocean and South China Sea
0° - 60°(N) 0° - 100°(E)
Cambodia, Lao PDR, Malaysia, Philippines, Singapore, Thailand, Vietnam Japan
Bay of Bengal and the Arabian Sea
5°S - 45°(N) 30°E - 90°(E) Myanmar, Thailand India
South Pacific and South-East Indian Ocean
0°-50°(S) 90° - 170°(E) Indonesia Fiji
The dates and information utilized in this report have been acquired from various
reports on the studies and research conducted on tropical cyclones and
meteorological hazards published on the internet. Collected documents include
evaluation results of hazards/risks, as well as their evaluation methods. With regard to
tropical cyclones/typhoons, a meteorological organization of each country compiles
a summary on the damage situation, including the number of casualties or loss of
human lives, and the estimated amount of damage, etc.
Locations of existing investigations and studies on cyclone and other meteorological
hazards are shown in Figure 2.16. Outline of those investigations and studies are
attached in Appendix 2 and their summary is given in Table 2.14.
38

Natural Disaster Risks
Figure 2.16 Locations of Existing Investigations and Studies: Cyclone and Other Meteorological Hazards
39
Country Report
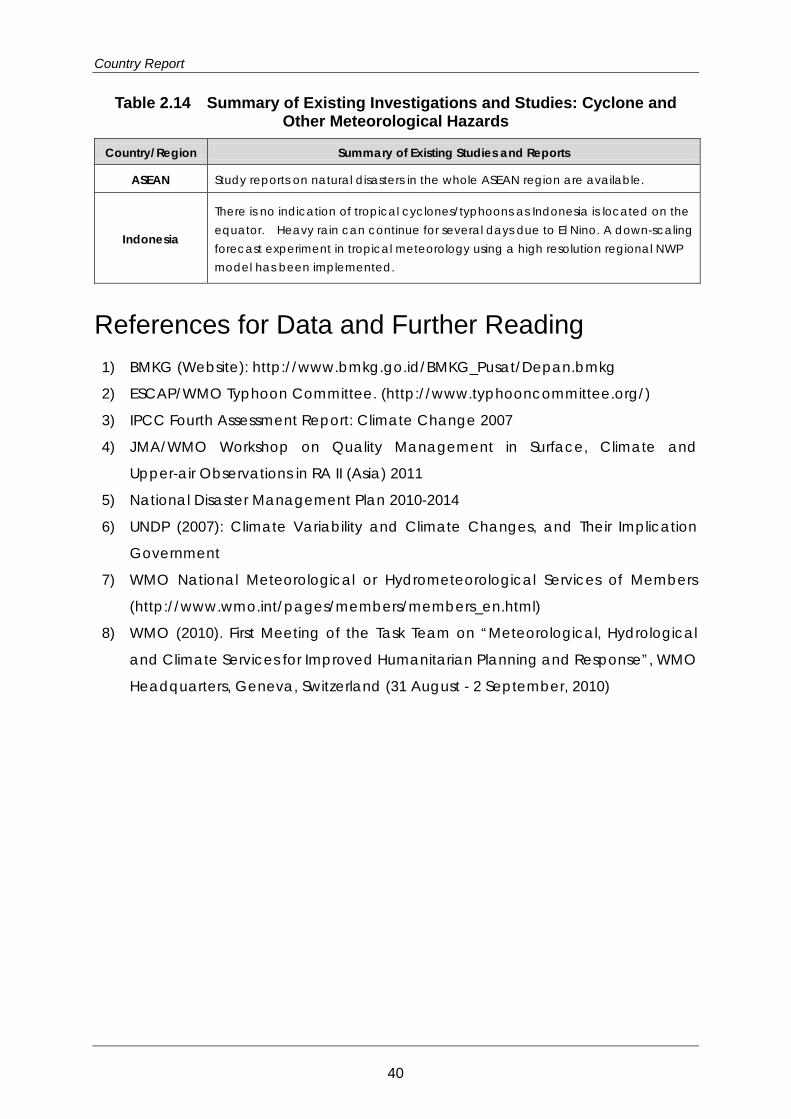
Table 2.14 Summary of Existing Investigations and Studies: Cyclone and Other Meteorological Hazards
Country/Region Summary of Existing Studies and Reports
ASEAN Study reports on natural disasters in the whole ASEAN region are available.
Indonesia
There is no indication of tropical cyclones/typhoons as Indonesia is located on the equator. Heavy rain can continue for several days due to El Nino. A down-scaling forecast experiment in tropical meteorology using a high resolution regional NWP model has been implemented.
References for Data and Further Reading 1) BMKG (Website): http://www.bmkg.go.id/BMKG_Pusat/Depan.bmkg
2) ESCAP/WMO Typhoon Committee. (http://www.typhooncommittee.org/)
3) IPCC Fourth Assessment Report: Climate Change 2007
4) JMA/WMO Workshop on Quality Management in Surface, Climate and
Upper-air Observations in RA II (Asia) 2011
5) National Disaster Management Plan 2010-2014
6) UNDP (2007): Climate Variability and Climate Changes, and Their Implication
Government
7) WMO National Meteorological or Hydrometeorological Services of Members
(http://www.wmo.int/pages/members/members_en.html)
8) WMO (2010). First Meeting of the Task Team on “Meteorological, Hydrological
and Climate Services for Improved Humanitarian Planning and Response”, WMO
Headquarters, Geneva, Switzerland (31 August - 2 September, 2010)
40

Natural Disaster Risks
2.7 Landslides
Risks Locations of earthquake disasters in Indonesia are shown in Figure 2.17. Circle size
represents the scale of the disaster in terms of human losses and economic losses.
There is a record of the tragic mudflow from the eruption of Kelut Volcano in 1911. The
disaster killed more than 5,000 people. 144 landslides have been recorded since 1950.
There are 7 landslides on record (3 of them are after 2000) that killed more than 100
people.
Thus, the country frequently suffers from landslides, most of which occur around Java
and Sumatra Islands. Relatively fewer landslides are recorded in the islands of
Sulawesi and Irian Jaya.
Landslides in the country are deeply related to the distribution of volcanoes.
Vulnerable and steep geological formations from volcanic activity form predisposing
factors, while heavy rain and earthquakes form contributing factors.
Most types of landslides are caused by land collapse and flash floods. In particular,
flash floods called “Banjir-Bandang” are being studied as a combination disaster of
flooding and debris flow.
Background The landslides that occurred in Central and West Java such as Cipinas (2001),
Bandung (2005), and Sijeruk (2006) recorded more than 100 fatalities. In those
disasters, slopes collapsed during heavy rains and flowed down along valley
topography, hitting settlements in the basin and causing serious damage.
Landslides in the country feared as "Banjir-Bandang" are so called flash flood caused
due to landslide dam failure. They have recently occurred at Langkat (North
Sumatra), Sinjai (South Sulawesi), and Jember (East Java) on a massive scale.
These landslides occur mainly on slopes in volcanic mountain areas, especially on
Sumatra and Java, which are densely populated regions, increasing the amount of
damage. Since volcanoes are distributed on every island of the country, flash floods
should be expected in the lower reaches of these volcanoes.
41

Country Report
Landslide exposure related to climate change has been widely confirmed at
mountain slopes in Sulawesi Island and Irian Jaya Island, in addition to Sumatra and
the volcanic area of Java.
Some areas of large cities such as Jakarta, Bandung, and Semarang are
experiencing rapid land subsidence.
Responses by Indonesia Early Warning and Transmitting Information
An early warning system for landslides is not operated in the country.
Observation of landslides by GPS, hyetometer, and extensometer are conducted by
the Center of Volcanology and Geological Hazard Mitigation (CVGHM), which issues
alerts for landslides.
Sources of Hazard and Risk Information CVGHM publishes hazard maps of landslides on 33 states and small scale provincial
hazard maps.
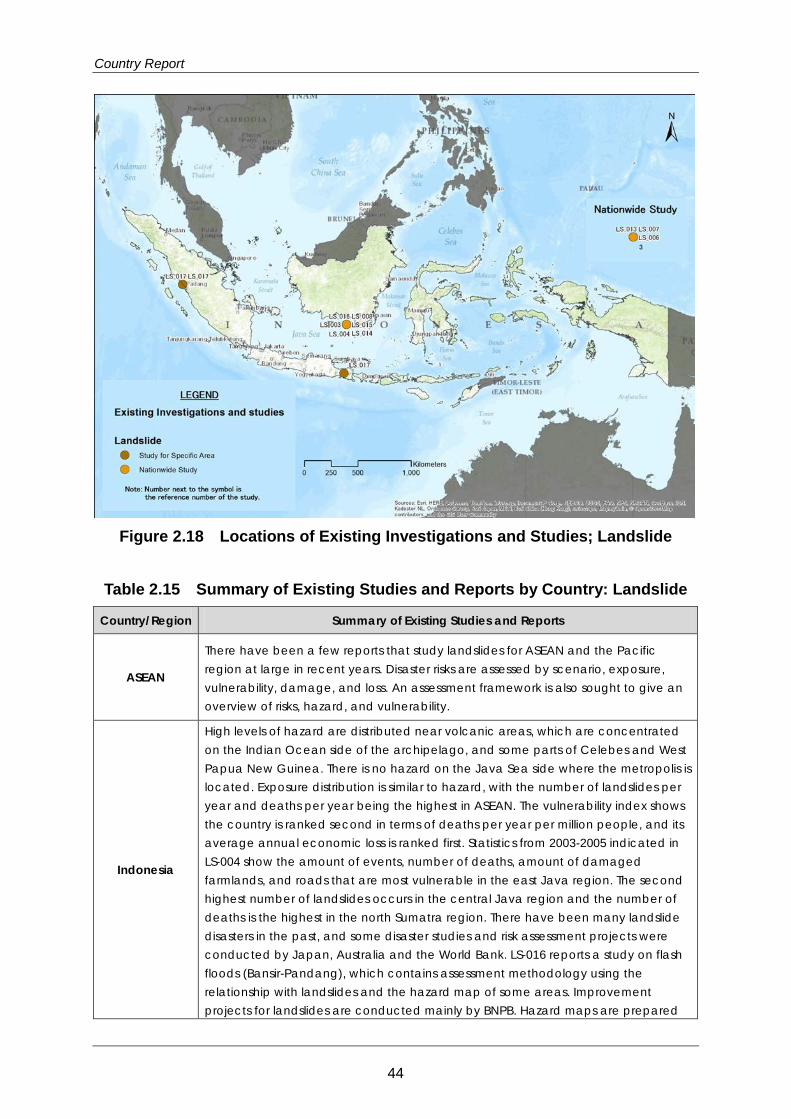
Reports on Hazard and/or Risk Assessment Locations of existing investigations and studies on landslides are shown in Figure 2.18.
Outlines of those investigations and studies are shown in Appendix 2 and their
summary is given in Table 2.15.
42

Natural Disaster Risks
(a) Human Losses
(b) Economic Losses (% of GDP)
: Hot Spots
Data Sources: EM-DAT, The OFDA/CRED International Disaster Database, Université catholique de Louvain, Brussels, Belgium:
http://www.emdat.be. Pacific Rim Coordination Center Disaster Data: http://data.pacificrimnetwork.org/. Global Unique Disaster Identification Number: http://www.glidenumber.net/glide/public/search/search.jsp.
Figure 2.17 Location of Landslide Disasters in Indonesia
43
Country Report
Figure 2.18 Locations of Existing Investigations and Studies; Landslide
Table 2.15 Summary of Existing Studies and Reports by Country: Landslide
Country/Region Summary of Existing Studies and Reports
ASEAN
There have been a few reports that study landslides for ASEAN and the Pacific region at large in recent years. Disaster risks are assessed by scenario, exposure, vulnerability, damage, and loss. An assessment framework is also sought to give an overview of risks, hazard, and vulnerability.
Indonesia
High levels of hazard are distributed near volcanic areas, which are concentrated on the Indian Ocean side of the archipelago, and some parts of Celebes and West Papua New Guinea. There is no hazard on the Java Sea side where the metropolis is located. Exposure distribution is similar to hazard, with the number of landslides per year and deaths per year being the highest in ASEAN. The vulnerability index shows the country is ranked second in terms of deaths per year per million people, and its average annual economic loss is ranked first. Statistics from 2003-2005 indicated in LS-004 show the amount of events, number of deaths, amount of damaged farmlands, and roads that are most vulnerable in the east Java region. The second highest number of landslides occurs in the central Java region and the number of deaths is the highest in the north Sumatra region. There have been many landslide disasters in the past, and some disaster studies and risk assessment projects were conducted by Japan, Australia and the World Bank. LS-016 reports a study on flash floods (Bansir-Pandang), which contains assessment methodology using the relationship with landslides and the hazard map of some areas. Improvement projects for landslides are conducted mainly by BNPB. Hazard maps are prepared
44

Natural Disaster Risks
for the entire country, even though some areas are not of a large enough scale. SATLAKPB has been organized as the main body for disaster emergency command. The conditions for which have been reported in terms of framework, responsibility, and their role in some pilot provinces (LS-017). Significant subsidence of the ground in metropolises (such as Jakarta, Bandon, Semarang) shall be assessed as a disaster of soils.
References for Data and Further Reading
45

Country Report
3. Industrial Parks 3.1 Distribution of Industrial Parks in Indonesia 67 industrial parks were identified by the study, and as shown in Figure 3.1, most of
them are distributed in Java. The rest are located in Sumatera, Sulawesi and
Kalimantan.
A list of the industrial parks in Indonesia is given in Appendix 3, and a brief description
of the selected industrial parks is given in reference2.
Figure 3.1 Distribution of Industrial Parks in Indonesia
While the level of development of industrial estates in Indonesia varies, most are
relatively well managed, and maintain their own websites and marketing teams.
Estates in Java and Riau are generally equipped to communicate with and support
foreign investors, given their significant experience with foreign tenants. Most websites
have English language content. Marketing teams generally have English-speaking
staff that are helpful and responsive to inquiries, though specific kinds of information,
2 AHA Centre and JICA (2014), Risk Assessment Reports for ASEAN and its Countries, Natural Disaster Risk Assessment and Area Business Continuity Plan Formulation for Industrial Areas in the ASEAN Region.
46

Industrial Parks
such as details on tenant firms, is often considered confidential and not publicly
available.
3.2 Historical Evolution of Industrial Parks Industrial estates in Indonesia started to develop in the early 1970s as part of
government effort to promote inbound FDI. Initially, most industrial estates were
established and owned by the government. In 1973, the government established the
country’s first industrial estate, Pulo Gadung Industrial Estate. This was followed by the
establishment of Surabaya Rungkut Industrial Estate in 1974. Several industrial estates
were subsequently developed. In 1986, the government established the Nusantara
Bonded Zone, which increased the facilities available to exporters, in a further effort
to attract FDI.
In 1989, the government issued Presidential Decree 53/1989, which opened the
industrial estate development business to private companies. The decree also
established the legal and technical requirements for the development and operation
of estates. The decree was replaced in 1996 by Presidential Decree 41/1996, which
set new guidelines for industrial estates in Indonesia. The decree defines an industrial
estate as “a center for industrial activities with provisions of infrastructure and
supporting facilities, which is developed and operated by a licensed industrial estate
company”. Since then, industrial estates run by private sector firms have shown
significant growth.
During the 1990s, the strong development of manufacturing industries in Indonesia
further contributed to the development of industrial estates, until the 1997 Asian
Financial Crisis. The Crisis saw many investors leave industrial estates, resulting in low
occupancy rates and multiple estate closures. The development of new estates also
slowed significantly. Indeed, several areas set aside for estates prior to 1997 have yet
to be developed. As Indonesia’s economic growth has recovered, industrial estate
development has improved, but generally remains slower than in the early 1990s.
Estate development slowed in 2005 and 2006 due to the fuel price increases, but has
increased since 2007. Part of this improvement was due to a law passed in 2006
requiring new manufacturing companies to locate their operations in industrial
estates, driving estate development. (Existing factories outside industrial estates are
required to move into industrial estates when their land use right end.)
47

Country Report
According to Industrial Park Association (HKI) data, as of June 2012, the total industrial
land in Indonesia reached 27,320.6 ha. Industrial estates are concentrated on Java
Island, where the vast majority of commercial businesses are based and the best
infrastructure is located.
3.3 Recent Trends and Japanese Investment Japanese investors have been present in Indonesian industrial estates since the 1970s,
attracted by relatively low costs. However, Japanese investment increased
significantly in the late 1980s, following the appreciation of the Yen and the opening
of industrial estate development to private firms. Since then, Japanese companies
have established various industrial estates in the area between Jakarta and
Cikampek in West Java Province. The growth of Japanese-affiliated industrial estates
attracted further Japanese investment, especially in West Java province or the
nearby Jakarta Special Area. Until 2003, 75% of Japanese investment was
concentrated in these two provinces, with 8% located in Riau province. While some
Japanese firms have extended into other areas, this general pattern of Japanese
investment is still present today.
3.4 Risks of Natural Hazards For the first glance of risks of natural hazards to industrial parks and individual
enterprises, it is useful superimpose your location on the distribution maps of natural
disasters given in Chapter 2. Figures 3.2 and 3.3 are enlarged maps of Banten, Jakarta
and West Java showing relationships of locations of Industrial parks, and flood and
earthquake disasters, respectively. For the detailed assessment of the risks of natural
disasters to industrial parks and individual enterprises, hazard and risk assessment are
required for an area of interest.
A description of general investment risks of Indonesia is attached in Appendix 4.
48

Industrial Parks
Figure 3.2 Industrial Parks and Flood Disasters: Banten, Jakarta, West Java
Figure 3.3 Industrial Parks and Earthquake Disasters:
Banten, Jakarta, West Java
49

Country Report
4. Transport Infrastructure and Lifeline Utilities
4.1 Overview of Transport Infrastructure
Road The total length of road in Indonesia is about 497,000 km: 39,000 km of national road,
54,000 km of provincial road, and 404,000 km of regency road. Not all of the national
roads are paved, and there are more unpaved roads in other categories. It can also
be said that the pavement maintenance is insufficient. In Indonesia, there are two (2)
Asian Highways: one is the road (AH25) which travels north-south through Sumatra,
and the other is the road (AH2) which travels west-east through Java.
Major road networks of Indonesia are shown in Figure 4.1.
Railway Although Indonesia has a 6,720-km train line, the length of route actually used is 4,600
km. The railroad has not been connected in many areas. There are three routes in
Java, with one route in Sumatra. The length of the train line is 3,300 km in Java and
1,300 km in Sumatra.
The gauge of the track is 1,067 mm, which is the same narrow gauge used
Japan.
The railroad of Indonesia is managed by PT Kereta Api (PTKA).
There have been 200 million railway passengers, 98% of whom are from within Java
and 93% of whom are from the Jakarta metropolitan area. The rail freight tonnage is
20 million tons per year.
Major railway networks are shown in Figure 4.1.
50

Transport Infrastructure and Lifeline Utilities
Figure 4.1 Major Road and Railway Networks of Indonesia
Port Indonesia consists of approximately 17,000 islands. Therefore, the maritime transport
that connects these islands plays an important role. The management and operation
of ports are conducted by the four (4) national port companies (PT. Pelabuhan
Indonesia I~IV: PELINDO).
In Indonesia there are 300 public ports, of which 43 are international ports and 14 are
designated ports of ASEAN (Table 4.1). There are four (4) major ports (Tanjung Priok,
Tanjung Perak, Belawan, and Makassar), of which the largest is Tanjung Priok. This port
is located in northern Jakarta and handles half of the entire container throughput of
Indonesia.
Locations of major ports are shown in Figure 4.2.
51

Country Report
Table 4.1 14 Designated Ports by ASEAN in Indonesia
Island Port
Sumatra Belawan, Dumai, Tanjung Pelapas, Palembang, Pajang
Java Tanjung Priok, Tanjung Emas, Tanjung Perak
Kalimantan Pontianak, Bajarmashin, Balikpapan
Sulawesi Makassar, Bitung
New Guinea Sorong, Jayapura
Source: ERIA, ASEAN Strategic Transport Plan 2011-2015
Figure 4.2 Major Ports and Airports of Indonesia
Airport There are 187 airports for civil aviation use in Indonesia, of which 16 are international
airports. These airports are mostly only equipped with short runways less than 1,000 m.
There are only seven airports that have runways over 3,000 m.
Locations of major airports of Indonesia are shown in Figure 4.2.
52

Transport Infrastructure and Lifeline Utilities
4.2 Overview of Lifeline Utilities
Electricity In Indonesia, Perusahaan Listrik Negara (PLN) is engaged in electric power generation
and power transmission. Although PLN is the only entity conducting power
transmission, an Independent Power Producer (IPP) may enter the electric power
generation business.
The total power generation in 2011 was about 183,400 million kWh, and the electric
power generating capacity was 29,268 MW. In addition, the national electrification
rate was 72.95% as of 2011, although the electrification rates were low in Sulawesi,
New Guinea, and especially Pulau Timor.
The sources of energy are largely dependent on fossil fuels such as coal, natural gas,
and oil produced at home.
Locations of major power stations and dams are shown in Figure 4.3.
Table 4.2 Rate of Produced Energy Source of Indonesia 2010
Source of Power Generation Energy
Produced Electricity (1 million kWh) Share (%)
Coal 68,040.5 41.1
Natural Gas 51,977.8 31.4
Oil / Diesel 19,104.4 11.5
Hydro 17,031.9 10.3
Geo Thermal 9,305.2 5.6
Biomass 87.5 0.1
Sunlight / Wind 0.5 0.0
Gross Total 165,547.9 100.0
Source: JBIC, Indonesia Investment Environment 2012.4
Water Supply In Indonesia, BPPSPAM and Cipta Karya, which are under the Ministry of Public Works,
have jurisdiction over the national water supply. Under this, PDAMs, which are wholly
53

Country Report
financed by local governments, perform operation and maintenance work for the
water supply system.
The number of PDMAs is not clear because of different numbers in statistical
data.
The water supply system should be reviewed because the rate of
non-revenue water is as high as 30%. The access rate to safe water is 82% for
the whole country.
Figure 4.3 Major Power Stations and Dams of Indonesia
Sewerage In Indonesia, the sewerage coverage ratio is about 1%, which is remarkably low, even
compared with the neighboring countries. Generally, septic tanks are popularly used
(62%) in urban areas, but discharging into rivers without treatment is a cause of river
water pollution. Only 4% of septic tanks discharge their waste water after treatment.
The industrial estates in east Jakarta have installed sewerage treatment plants within
their lots in order to avoid discharging polluted waters.
54

Transport Infrastructure and Lifeline Utilities
The waste water treatment technologies applied by the industrial estates are widely
varied from the most simple aerated lagoon process to oxidation treatment with long
aeration, membrane separation and filtration methods.
Communications Internet and Broadband
204 companies have obtained licenses to provide internet access service as of 2011.
Moreover, there are 2.74 million broadband subscribers with a yearly upward trend.
Mobile Phone
The main companies in the mobile phone business are Telkomset, Indosat, and XL
Axiata. This market also shows rapid growth and a one mobile phone per person
distribution.
Fixed-line Phone
Six (6) companies provide local telephone service. Indonesia holds a satellite and
provides satellite communications services.
Radio Broadcasting
There are about 800 broadcasting stations in the country including RRI (public
broadcasting), commercial broadcasting, university broadcast, army broadcast, and
community broadcasting.
Broadcasting
After TVRI started broadcasting in 1962, commercial broadcasting was started from
1989 with 11 companies performing broader-based broadcasting. The satellite
broadcasting company Indovision started broadcasting in 1994, and about 650,000
people have now subscribed. For cable TV, there are two main companies, but the
number of subscriber remains low at about 160,000, with only people in the
metropolitan area being able access the channels. The government is aiming to
convert to digital broadcasting completely by 2018.
Waste
55
Country Report
In Indonesia, waste is defined as "invaluable organic and/or inorganic solid or
semi-solid residue from a business and/or other activities" by the Environment
Management Act, etc. Waste is divided into the two (2) categories: domestic waste
and dangerous/harmful waste, officially called B3 waste.
The amount of waste production is estimated to be about 2 - 3 liters per person per
day or 440 million liters per day in the country. This calculates to 80.3 million tons or 154
billion liters per year. The average composition rate of waste is estimated based on
the composition of waste of each urban area.
56

Transport Infrastructure and Lifeline Utilities
4.3 Natural Disasters and Infrastructure Since transport infrastructure and lifeline utilities have crucial for business continuity of
enterprises, it is important to know their risks to natural disasters. For the first glance of
the risks, it is useful superimpose locations of transport infrastructure and lifeline utilities
on the distribution maps of natural disasters given in Chapter 2. Figures 4.4 to 4.6 are
examples focusing on Java. Following description of natural disasters may be useful
to interpret the figures. For the detailed assessment of the risks of natural disasters to
transport infrastructure and lifeline utilities, hazard and risk assessment are required for
an area of interest.
Indonesia is an archipelago state which consists of about 17,000 islands. There are
5,500 or more rivers in the whole country and since most rivers have not been
improved, several big floods occur during the monsoon every year.
There is a high frequency of floods in this country. Java Island has the highest
frequency, followed by Sumatra Island and Sulawesi Island, but Kalimantan Island has
a low frequency. Many floods have occurred due to the east-west monsoons in the
rainy season (November to March). Heavy rainfalls in the mountainous region cause
floods in the plain and extensive damage in swamps and coastal low-lying areas.
Urban areas become inundated because of an insufficient drainage system and
poor maintenance work.
Sumatra, Java, Bali, Nusa Tenggara, Irian Jaya, and Sulawesi, etc. have earthquake
belts running through all the places throughout the country, and many earthquakes
exceeding M5.0 have occurred.
The earthquake of Sumatra that occurred in 2004 was of a huge scale at M9.1. The
Java Trench was generated by a gap between plate boundaries and in its vicinity,
earthquakes exceeding M7.0 occur frequently.
There are 129 active volcanoes in Indonesia and it is thought that 70 of them are
dangerous. Because of the eruptions of Mount Merapi in 2006 and 2010, there is a
suspected correlation with the Great Sumatra Earthquake. Since the north side of
Java is far from the Java Trench, the impact of an earthquake is quite small. However,
it is an area prone to flooding due to its heavy rains.
Since Indonesia is near the equator, it is not affected by trade winds. Therefore,
cyclones and typhoons affect only a portion of the country. However, the heavy rain
57

Country Report
in the rainy season caused by the monsoon is intense, causing floods and landslides.
Even though the industrial estates are built on high ground, the impact for these
disasters on roads, railroads, power lines, lifelines, etc. cannot be avoided. Attention
should also be paid to ash fall from volcanic eruptions in central Java.
Although the seashore zone needs to be protected from tsunamis caused
earthquakes in the southern areas of Sumatra or Java, it can be said that the north
side is not greatly affected by tsunami. However, the generation of high tides by low
pressure is possible.
Figure 4.4 Flood Disasters and Major Road and Railway Networks: Java
58

Transport Infrastructure and Lifeline Utilities
Figure 4.5 Tsunami Disasters, and Major Ports and Airports: Java
Figure 4.6 Earthquake Disasters, and Power Stations and Dams: Java
59

Country Report
5. Legislative Systems 5.1 Legislative Systems for Disaster
Management Disaster Management Laws
Table 5.1 Laws and Regulations of Disaster Management in Indonesia
Laws / Regulations Supervisory Authority Matter
Law Law of the Republic of Indonesia concerning disaster management, (Law No.24), 2007
National Disaster Management Agency (BNPB)
Disaster Management
The Law on Disaster Management (No. 24) was enacted in 2007. Ancillary regulations
for this law were also enacted in 2008: 1) Regulation No. 22 on Disaster Aid Financing
and Management, 2) Regulation No.23 on Participation of International Institutions
and Foreign Non-Governmental Organizations in Disaster Management, and 3)
Regulation No.8 on National Agency Disaster Management. Disaster mitigation
aspects are reflected in nearly all of the ministries’ policy frameworks.
Disaster Management Strategies and Plans Table 5.2 Strategies and Plan for Disaster Management in Indonesia
Laws / Regulations Supervisory Authority Matter Plan National Disaster Management Plan 2010-2014 BNPB General Disasters
Plan National Action Plan for Disaster Risk Reduction 2010-2012 BNPB General Disasters
Plan Regional governments’ action plans BPBD General Disasters
As stipulated by the Disaster Management Law (No.24), the "National Action Plan for
Disaster Risk Reduction 2010-2012" was formulated as an action plan for the
implementation of disaster management in Indonesia in 2010. The annual action plan
of each ministry and local governments’ action plans are formulated based on this
action plan. As of March 2012, maintenance of an action plan has been completed
in all the 33 states. In regencies and cities where BPBD is established, the same action
plan is to be formulated.
60
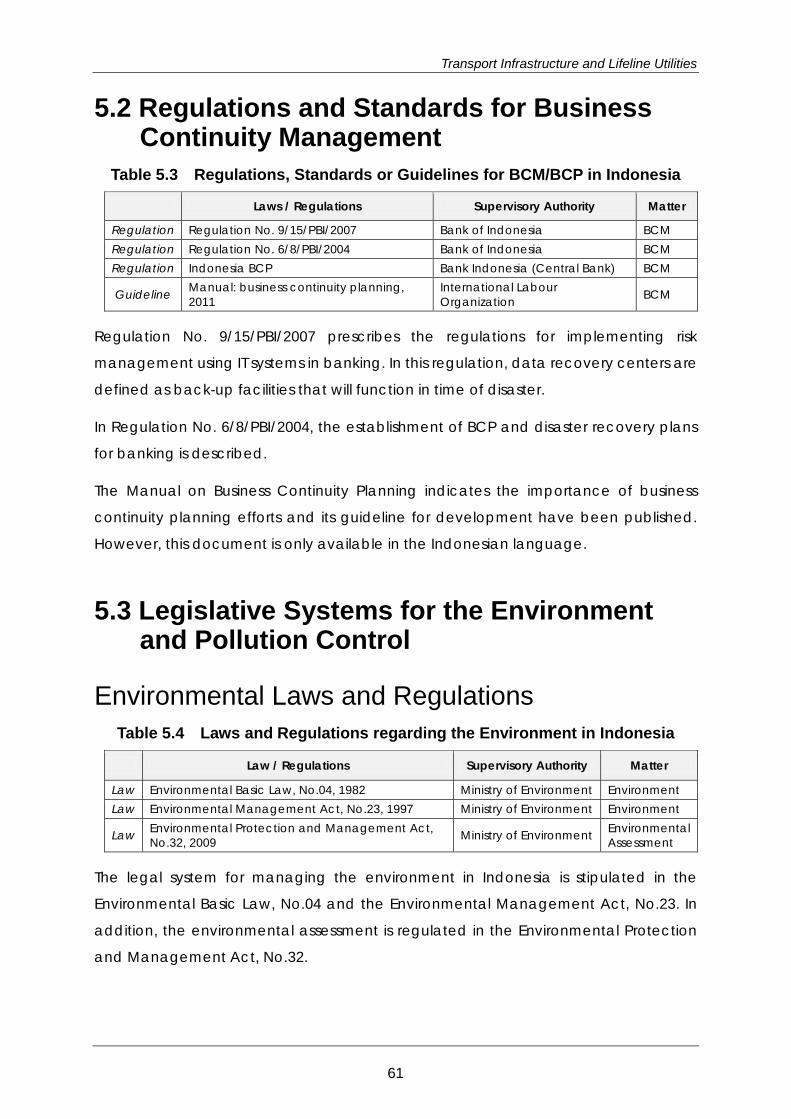
Transport Infrastructure and Lifeline Utilities
5.2 Regulations and Standards for Business Continuity Management
Table 5.3 Regulations, Standards or Guidelines for BCM/BCP in Indonesia
Laws / Regulations Supervisory Authority Matter
Regulation Regulation No. 9/15/PBI/2007 Bank of Indonesia BCM Regulation Regulation No. 6/8/PBI/2004 Bank of Indonesia BCM Regulation Indonesia BCP Bank Indonesia (Central Bank) BCM
Guideline Manual: business continuity planning, 2011
International Labour Organization BCM
Regulation No. 9/15/PBI/2007 prescribes the regulations for implementing risk
management using IT systems in banking. In this regulation, data recovery centers are
defined as back-up facilities that will function in time of disaster.
In Regulation No. 6/8/PBI/2004, the establishment of BCP and disaster recovery plans
for banking is described.
The Manual on Business Continuity Planning indicates the importance of business
continuity planning efforts and its guideline for development have been published.
However, this document is only available in the Indonesian language.
5.3 Legislative Systems for the Environment and Pollution Control
Environmental Laws and Regulations Table 5.4 Laws and Regulations regarding the Environment in Indonesia
Law / Regulations Supervisory Authority Matter
Law Environmental Basic Law, No.04, 1982 Ministry of Environment Environment Law Environmental Management Act, No.23, 1997 Ministry of Environment Environment
Law Environmental Protection and Management Act, No.32, 2009 Ministry of Environment Environmental
Assessment
The legal system for managing the environment in Indonesia is stipulated in the
Environmental Basic Law, No.04 and the Environmental Management Act, No.23. In
addition, the environmental assessment is regulated in the Environmental Protection
and Management Act, No.32.
61

Country Report
Pollution Control Laws and Regulations Table 5.5 Laws and Regulations for Environmental Pollution Control
in Indonesia
Laws / Regulations Supervisory Authority Matter
Law Law on Water Resources, No.7, 2004 Ministry of Environment Water Pollution
Regulation Government Regulation No.82/2001 (Water Quality Management and Waste Water Control)
Ministry of Environment Water Pollution
Decree Ministerial Decree No.51/MENLH/10/1995 (Effluent Standard for Industry) Ministry of Environment Industrial
Effluent
Regulation Government Regulation No.41, 1999 (Air Pollution Management) Ministry of Environment Air Pollution
Decree Ministerial Decree No.48/MENLH/11/1996 (Noise Standards) Ministry of Environment Noise
Decree Ministerial Decree No.49/MENLH/11/1996 (Vibration Standards) Ministry of Environment Vibration
Regulation Government Regulation No.74/2001 Ministry of Environment Hazardous Waste
Decree Government Regulation No.18 and No.85 (Hazardous Waste Management) Ministry of Environment Hazardous
Waste
Regulation Government Regulation No.27, 1999 (Environmental Impact Assessment (EIA)) Ministry of Environment Environmental
Assessment
Decree Ministry of Environment Decree No.11, 2006 Ministry of Environment Environmental
Assessment
Legal rules for environmental pollution control in Indonesia are defined by several
decrees and regulations. The decrees and regulations related to industrial activities
are listed above. These regulations cover water, industrial effluent, air pollution, noise,
vibration, hazardous waste, and environmental assessments.
5.4 Legislative Systems for Development including Land Use, Rivers, and Building Code in Indonesia
Table 5.6 Laws and Regulations for Land, Rivers, and Building Code in Indonesia
Laws / Regulations Supervisory Authority Matter
Law Law No.5, 1960 concerning Basic Agrarian Law under survey Land Use
Decree Presidential Decree No.36, 2005 under survey Land Acquisition
Decree Presidential Decree No.65, 2006 under survey Land Acquisition
Law Forestry Act, 1999 under survey Forestry
62

Transport Infrastructure and Lifeline Utilities
Law River Act, 1991 under survey River
Law No.5, 1960 concerning Basic Agrarian Law pertains to the use of land in
Indonesia. Moreover, acquisition of land is prescribed by the Presidential Decree
No.36, 2005 and the Presidential Decree No.65, 2006.
In addition, although regulations about the fundamental use and development of
forests and rivers are defined by the Forestry Act and River Act, a direct statement
about urgent disaster response measures and disaster recovery/restoration cannot
be found.
Moreover, no regulations on construction standards could be confirmed in this
investigation.
63

Country Report
6. Implementation of BCP 6.1 Major Natural Disasters and Awareness
Disaster Management Earthquakes, volcanic disaster, floods, and storms are regarded as probable natural
disasters for which preparations should be made in Java, Indonesia. Although risk
management for these natural disasters has already been considered by private
enterprises and civil organizations, disaster management plans are not yet well
prepared. Moreover, most business people are not very familiar with the concept of
BCP, nor the necessity of BCP for corporate disaster risk management is commonly
recognized.
Through private institutes such as the Chamber of Commerce and Industry (KADIN),
enterprises seem to put more weight on developing business activities than the
management of disaster risk reduction, and most SMEs in Indonesia are not very
concerned about corporate disaster risk.
6.2 Current State of BCP Implementation
Implementation of BCP in Enterprises Private or public companies dealing with any hazardous material such as oil or gas
are obligated by laws on public safety and environmental conservation to establish a
risk management system for the environment or crisis situations. The implementation
of disaster risk management should be also furthered by general enterprises.
As electric utility companies are also required to prepare for crisis management, they
develop Standard Operating Procedures. Although response during emergencies is
also defined in this procedure, disaster management and contingency plans have
not been established. Furthermore, at water utility agencies, there is no
well-structured disaster risk management currently being conducted.
At other utility companies or agencies such as water resources, telecommunications,
and road networks, no instance of developed BCP could be found. Most company
64

Implementation of BCP
have not even established plans or manuals such as contingency or disaster recovery
plans, nor have they considered the risks of a large-scale disaster.
Implementation of BCP in Foreign Capital Companies and Japanese Companies It is assumed that some foreign capital companies including major manufacturers
and commercial firms have prepared a BCP. In industrial parks accommodating the
main factories of foreign capital companies, utility redundancy is ensured since water
distribution systems and electric transmission systems are basically independent from
the surrounding area. In addition, some individual companies and industrial parks
have electric power facilities for emergencies. Thus, preparedness in terms of utilities
has been established.
Enterprises consider labor demonstrations, accidents, and traffic congestion as
business risks more important than the risks from natural disasters. Because foreign
capital companies commonly devote their resources to these problems, the
implementation of disaster risk management seems to have a relatively low priority.
6.3 Efforts on Promoting BCP Implementation
Regulations and Guidelines for BCP Implementation National strategies for disaster risk management and action plans have been
developed. Enterprises are required to implement risk management in accordance
with these strategies and master plans developed at the regional level.
At the central and local level, governmental authorities related to disaster risk
management such as the National Disaster Management Agency (BNPB) and
Regional Disaster Management Agency (BPBD) are in charge of the establishment
and coordination of disaster management schemes. However, no laws that compel
enterprises to develop disaster management plans are currently established. The
implementation of contingency plans or BCP has not advanced sufficiently at either
private or government-owned enterprises.
65

Country Report
Efforts on Disseminating and Increasing Awareness of BCP by the Private Sector Efforts for the implementation of BCP by enterprises attempted by the private sector
have been determined. For efforts on improving corporate management for disaster
risk, no actions to support enterprises in the establishment of disaster risk management
systems or in conducting disaster risk assessments have been verified.
However a function of KADIN is to support business growth in SMEs. This is done
through periodic business seminars and symposiums. However, the issues of business
continuity and disaster management have never been covered as a main topic.
KADIN also believes interest in implementing BCP will increase in the near future.
6.4 Problems Facing for Implementation of BCP To implement the BCP, it is essential to improve utility infrastructure. The failure to
construct infrastructure in Indonesia is one problem for BCP diffusion. Road network
problems seem to be the main bottleneck, with the continuous traffic congestion
around Jakarta causing a severe impact on logistics. In addition, the improvement of
infrastructure such as roads and drain facilities is an urgent issue considering flood
vulnerability. Private enterprises including foreign capital companies are concerned
by these weaknesses in social infrastructure.
The lack of knowledge and know-how in developing BCM/BCP is also regarded as a
reason for not proceeding with implementation of BCP in the private sector.
66

Appendix 1:Method for Evaluating Predominant Hazards
Appendix 1: Method for Evaluating Predominant Hazards The “Damage Amount / GDP” and “Number of Deaths” are used as the indices to
show the impacts of the disasters considered and 6 natural hazards will be studied
and compared. At the beginning of the study, only the “Damage Amount / GDP”
was used as an index because the results can be used for Area BCP planning.
However, the scarcity of information related to damage amounts became clear as
the study progressed. As the information on the “Number of Deaths” is substantial
compared to the damage amount, the “Number of Deaths” has been added as an
index of impact.
The process of the study is as follows;
1) Based on the Damage Amount / GDP or Number of Death, each disaster is
classified according to the ranking system outlined in Table A1,
2) The number of disaster events for each country is added by type of hazard and
disaster rank, and then classified into Table A2,
3) The above information is then plotted on the impacts - frequency matrix by
country,
4) As for earthquakes, tsunamis and volcanic hazards, if an event occurred before
1983 that was of the same (or higher) disaster rank as the maximum disaster rank
recorded between 1983 to 2012, a point is plotted on the matrix which
corresponds to the relevant disaster and frequency rank ( =1).
Table A1 Disaster Rank and Damage
Disaster Rank Damage Amount / GDP3 Number of Death
5 1.0% - 10,001 -
4 0.1% - 1.0% 1,001 - 10,000
3 0.01% - 0.1% 101 - 1,000
2 0.001% - 0.01% 11 - 100
1 - 0.001% - 10
3 Gross domestic product based on purchasing-power-parity (PPP) valuation of country GDP, International Monetary Fund, World Economic Outlook Database, October 2012
67

Country Report
Table A2 Frequency Rank and Number of Events
Frequency Rank Number of Events from 1983 to 2012
Average Frequency (Events / Year)
5 7 or more 1/5 -
4 4 to 6 1/10 - 1/5
3 2 to 3 1/15 - 1/10
2 1 1/30
1 Large Events occurred before 1983 -
68

Appendix 2:Data Sheets Outline of Existing Investigations and Studies
Appendix 2: Data Sheets Outline of Existing Investigations and Studies
69

Country Report
No.: FL-001 Published Year: 2010 Study/ Report Name: Synthesis Report on Ten ASEAN Countries Disaster Risks
Assessment Access to Information: www.unisdr.org/files/18872_asean.pdf Research Organization: UNISDR/World Bank Study Area (Country): ASEAN (10 countries) Studied Hazard: Flood Studied Damage/ Risk: Flood Main Data Sources: CRED EM-DAT, ADRC, NGDC, GSHAP, MRC, WAMIS,
DWR, Munich Re, World Bank, UNISDR, GAR, In Terragate, IFNet, CCFSC, DESINVENTAR
Summary of the Study: 1) Overview Disaster risks are assessed for years (1970-2009) by 1) Scenario, Exposure, Vulnerability, Damage and Loss analysis using existing database. The dominant disaster risks are cyclonic storms (typhoons), earthquakes, tsunamis, floods, epidemics, landslides, droughts volcanic eruptions and forest-fires. In total 1,211 reported disasters caused over 414,900 deaths. 2) Vulnerability Method: the number of disaster events, deaths, affected population and economic losses are plotted against hazard types for 5 year intervals. To estimate social vulnerability=> the average number of people killed. ASEAN 17.7 death/year/million, Cambodia 3.56, Indonesia 20.38, Lao PDR 4.22, Malaysia 1.26, Myanmar 72.35, Philippines 11.93, Thailand4.63, Vietnam 4.60. Brunei and Singapore have no data. 3) Risk assessment framework A status of risk assessment framework is assessed by country to view the current capacity of risk assessment. The evaluation table is show below.
70
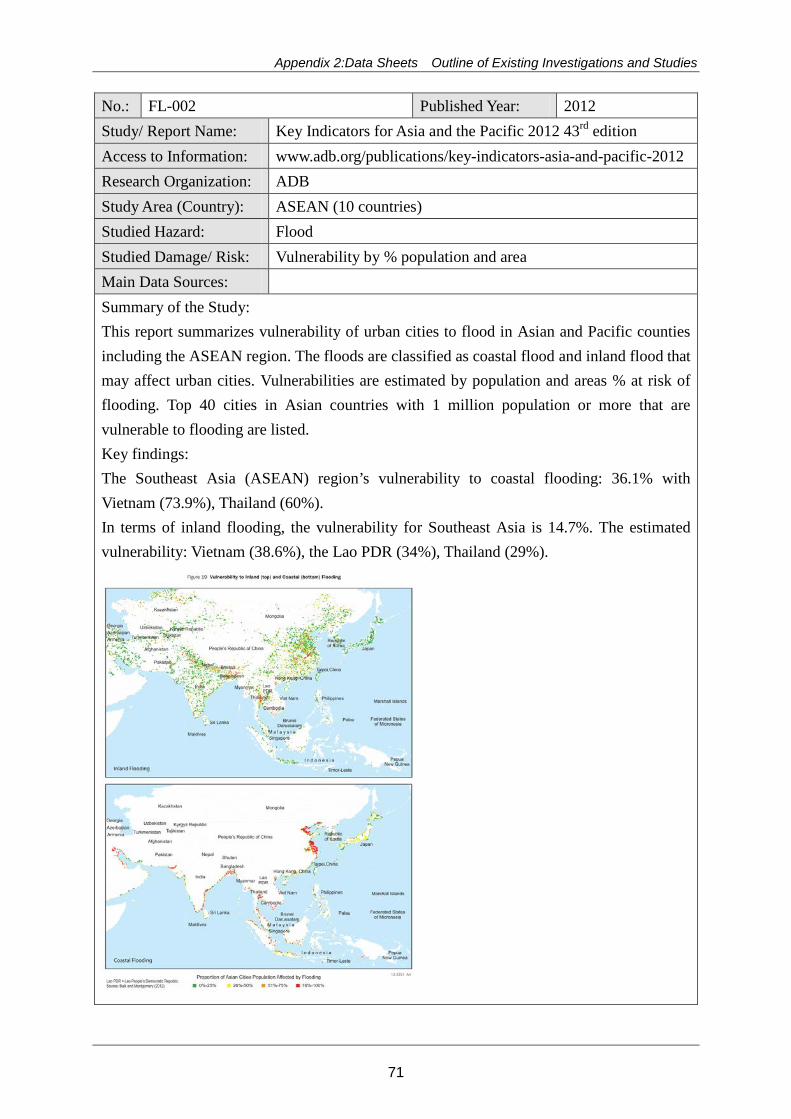
Appendix 2:Data Sheets Outline of Existing Investigations and Studies
No.: FL-002 Published Year: 2012 Study/ Report Name: Key Indicators for Asia and the Pacific 2012 43rd edition Access to Information: www.adb.org/publications/key-indicators-asia-and-pacific-2012 Research Organization: ADB Study Area (Country): ASEAN (10 countries) Studied Hazard: Flood Studied Damage/ Risk: Vulnerability by % population and area Main Data Sources: Summary of the Study: This report summarizes vulnerability of urban cities to flood in Asian and Pacific counties including the ASEAN region. The floods are classified as coastal flood and inland flood that may affect urban cities. Vulnerabilities are estimated by population and areas % at risk of flooding. Top 40 cities in Asian countries with 1 million population or more that are vulnerable to flooding are listed. Key findings: The Southeast Asia (ASEAN) region’s vulnerability to coastal flooding: 36.1% with Vietnam (73.9%), Thailand (60%). In terms of inland flooding, the vulnerability for Southeast Asia is 14.7%. The estimated vulnerability: Vietnam (38.6%), the Lao PDR (34%), Thailand (29%).
71
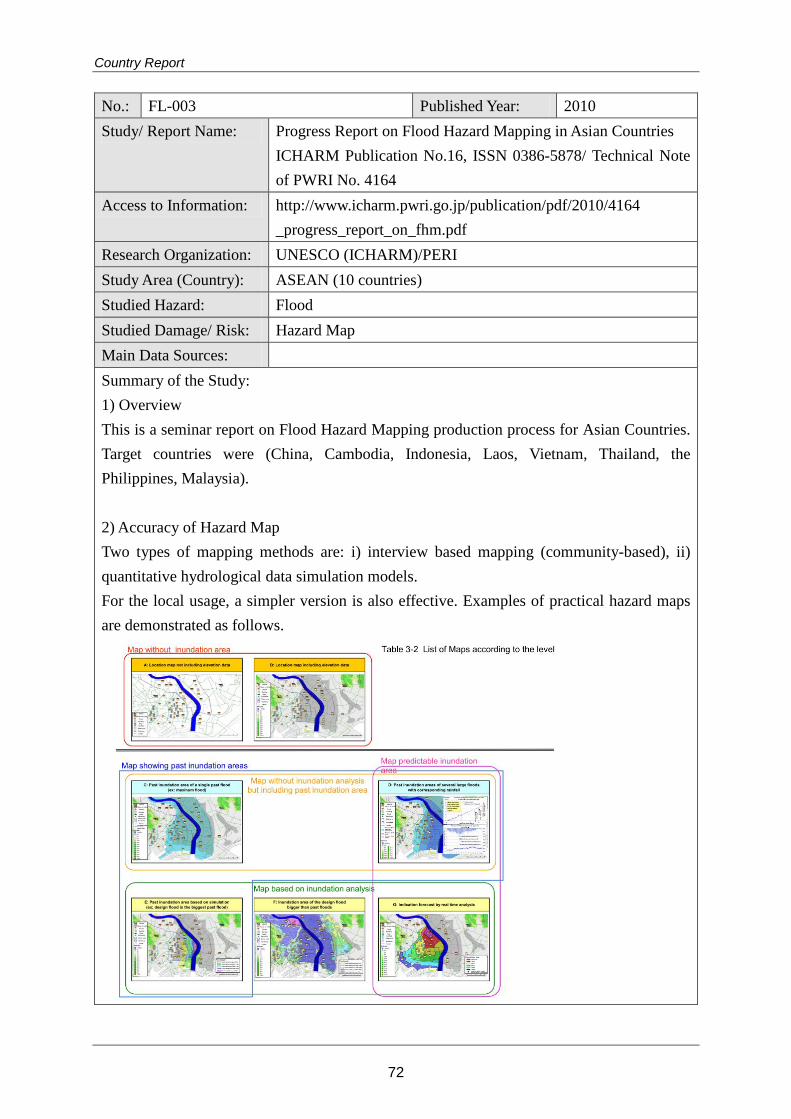
Country Report
No.: FL-003 Published Year: 2010 Study/ Report Name: Progress Report on Flood Hazard Mapping in Asian Countries
ICHARM Publication No.16, ISSN 0386-5878/ Technical Note of PWRI No. 4164
Access to Information: http://www.icharm.pwri.go.jp/publication/pdf/2010/4164 _progress_report_on_fhm.pdf
Research Organization: UNESCO (ICHARM)/PERI Study Area (Country): ASEAN (10 countries) Studied Hazard: Flood Studied Damage/ Risk: Hazard Map Main Data Sources: Summary of the Study: 1) Overview This is a seminar report on Flood Hazard Mapping production process for Asian Countries. Target countries were (China, Cambodia, Indonesia, Laos, Vietnam, Thailand, the Philippines, Malaysia). 2) Accuracy of Hazard Map Two types of mapping methods are: i) interview based mapping (community-based), ii) quantitative hydrological data simulation models. For the local usage, a simpler version is also effective. Examples of practical hazard maps are demonstrated as follows.
72
Appendix 2:Data Sheets Outline of Existing Investigations and Studies
No.: FL-004 Published Year: 2005 Study/ Report Name: A Primer: Integrated Flood Risk Management in Asia 2 Access to Information: www.adpc.net/maininforesource/udrm/floodprimer.pdf Research Organization: Asian Disaster Preparedness Center (ADPC)/UNICEF Study Area (Country): Asia including ASEAN countries Studied Hazard: Flood Studied Damage/ Risk: Assessment method Main Data Sources: Summary of the Study: This is a comprehensive and practical how-to-handbook for policy makers and implementation stakeholders of flood risk management in Asia, with updated resources to (1) authorize programs; (2) formulate decisions; (3) plan, develop and implement decisions; (4) support implementation of decisions. There are extensive glossaries of words and concepts in relation to flood risk management. Topics include:
Chapter 2: Types and levels of flood: riverine flood, slow-onset, rapid-onset, normal flood (1 year flood), catastrophic flood (100 year flood). Causes of flood: meteological, hydrological and anthropogenic. Chapter 3: Policies, legal and institutional arrangement plans: Chapter 4: Flood risk assessment, data required for an assessment of potential damages and losses, Flood frequency calculations Chapter 5: Importance of watershed and floodplain management for flood risk management Chapter 6: Structural interventions: flood storage reservoir, dykes, levee and embankment, EIA, cost benefit analysis Chapter 7: Flood-proofing measures, relocation, elevation, dry-flood proofing, wet-flood proofing, flood-proofing measures categories: permanent, contingent and emergency measures Chapter 8: Flood preparedness planning: preparedness framework, activities, flood forecasting, public awareness Chapter 9: Effective emergency response in environment healthe management, evacuation camps, delivery of goods
Case studies of ASEAN countries include: Disaster Management and Relief in Malaysia, Hazard Assessment in the Philippines, Flood mitigation mix measures/community level management in Thailand, Mekong River Commission Mediation of Transboundary Flood Issues
73

Country Report
No.: FL-005 Published Year: 2009 Study/ Report Name: Climate Change Vulnerability Mapping for Southeast Asia Access to Information: http://web.idrc.ca/uploads/user-S/12324196651Mapping_Report
.pdf Research Organization: Economy and Environment Program for Southeast Asia
(EEPSEA) Study Area (Country): ASEAN (Thailand, Vietnam, Laos, Cambodia, Indonesia,
Malaysia, and Philippines) Studied Hazard: Flood Studied Damage/ Risk: Vulnerability to climate change, flood frequency Main Data Sources: Urban Extent Database (GRUMP version 1) of the (CIESIN)
GEODATA portal (the Environmental Database; http://geodata.grid.unep.ch/extras/datasetlist.php) BAKOSURTANAL
Summary of the Study: 1) Overview This study assesses vulnerability of Southeast Asian countries (Thailand, Vietnam, Laos, Cambodia, Indonesia, Malaysia, and Philippines) of climate change including flooding. Vulnerability is defined as a function of exposure (potential loss due to a hazard), sensitivity (the potential gravity of losses and damage), and adaptive capacity (how much to adapt a hazard situation). 2) Vulnerability assessment Vulnerability is assessed by adaptive capacity (HDI, PPP, Gini-coefficient, Education, road, electricity…), population density (human sensitivity) and hazard map (hazard occurrence frequency data from 1980-2000). Adaptive capacity influences vulnerability. When adaptive capacity is low, vulnerability is high. 3) Area analysis Cambodia is among the most vulnerable in ASEAN despite its relatively low exposure to climate hazards. The eastern coast of Vietnam is susceptible to cyclones, but adaptive capacity is high to manage to moderate its vulnerability. Bangkok and Jakarta have high adaptive capacities but not enough to moderate their extreme vulnerability with high population densities and significant exposure to climate hazards. A map shows annual flood frequency of the region.
74
Appendix 2:Data Sheets Outline of Existing Investigations and Studies
No.: FL-006 Published Year: 2012 Study/ Report Name: Reducing Vulnerability and Exposure to Disasters The
Asia-Pacific Disaster Report 2012 Access to Information: http://www.unisdr.org/we/inform/publications/29288 Research Organization: ESCAP/UNISDR Study Area (Country): ASEAN (10 countries) Studied Hazard: Hydro-meteolological Hazard Studied Damage/ Risk: Economic losses, fatalities, houses, risk-sensitive plans of
investment Main Data Sources: Summary of the Study: 1) Overview The Asia-Pacific region represents 75% of all global disaster fatalities. The economic and population growth contribute to a greater exposure to natural disasters. The population was doubled from 2.2 to 4.2 billion between 1970 and 2010. But the number of people who are exposed to flooding has increased from 29.5 to 63.8 million. The urban settlements are more vulnerable as the urban population increased from 17 to 44% of the total population between 1950 and 2010. 2) Vulnerability Generally, smaller and less diversified economies are more vulnerable to disaster risks. Flood mortality risks are higher in rural areas with a densely concentrated and rapidly growing population with weak governance. 3) Risk Risks are associated with economic and mortality risks. The exposure to flooding events constantly increases as of 1980 but mortality risks are decreasing as countries strengthened their risk governance capacities. However economic risks are increasing, due to slow adaptation of the existing fixed assets, such as old buildings and infrastructure, and institutional instruments such as land use planning and building regulation to cope with flooding particularly in rapidly urbanizing areas. 4) Spatial and land use plan The national spatial and land use plans and policies are a key to reduce flood risks. Brunei, Indonesia, Lao PDR, Malaysia, Philippines, Singapore and Vietnam have land-use policies, plans or measures for DRR.
75

Country Report
No.: FL-008 Published Year: 2011 Study/ Report Name: Advancing Disaster Risk Financing and Insurance in ASEAN
Countries: Framework and Options for Implementation, Volume2: Appendix 1
Access to Information: https://www.gfdrr.org/sites/gfdrr.org/files/documents/DRFI_ASEAN_ Appendices_June12.pdf
Research Organization: GFDRR/World Bank Study Area (Country): ASEAN (10 countries) Studied Hazard: Flood (multiple disasters) Studied Damage/ Risk: Damage, affected population, vulnerability index Main Data Sources: World Bank, EM-DAT, Relief Web, GFDRR, CIA fact book Summary of the Study: 1) Overview Disaster risks were compiled for ASEAN countries with data between 1982 and 2011. The following items are analyzed: disaster profile (% of different disasters), damage ($), affected population, vulnerability index (estimated number of people killed/year). 2) Disaster profile: Typhoon is the dominant incidence causing flood and landslide in most countries except Singapore and Brunei Cambodia: 45% flood (Mekong river), 9% storm, 16% drought, 29% epidemic Indonesia: west and dry zones most severely hit (Jakarta, Medan, Bandug) Lao PDR: 50% flood, 22% epidemics, 13% storm, 13% drought Malaysia: dominantly flood Myanmar: multiple hazards, earthquake serious risk Philippines: dominantly typhoons causing other hazards in conjunction Thailand: multiple hazard (flood, drought, storms and landslide) Vietnam: 49% storm, 37% floods, 5% epidemic, 3% landslide, 2% drought 3) Vulnerable areas Mekong River Delta in Vietnam, all regions of the Philippines, most regions in Cambodia, North ad East Lao PDR, Bangkok in Thailand, the west and south of Sumatra and western and eastern Java in Indonesia. 4) Vulnerability Urban (especially coastal) areas are more vulnerable against disasters due to a rapid population growth, urbanization, deforestation, and unplanned land use.
76
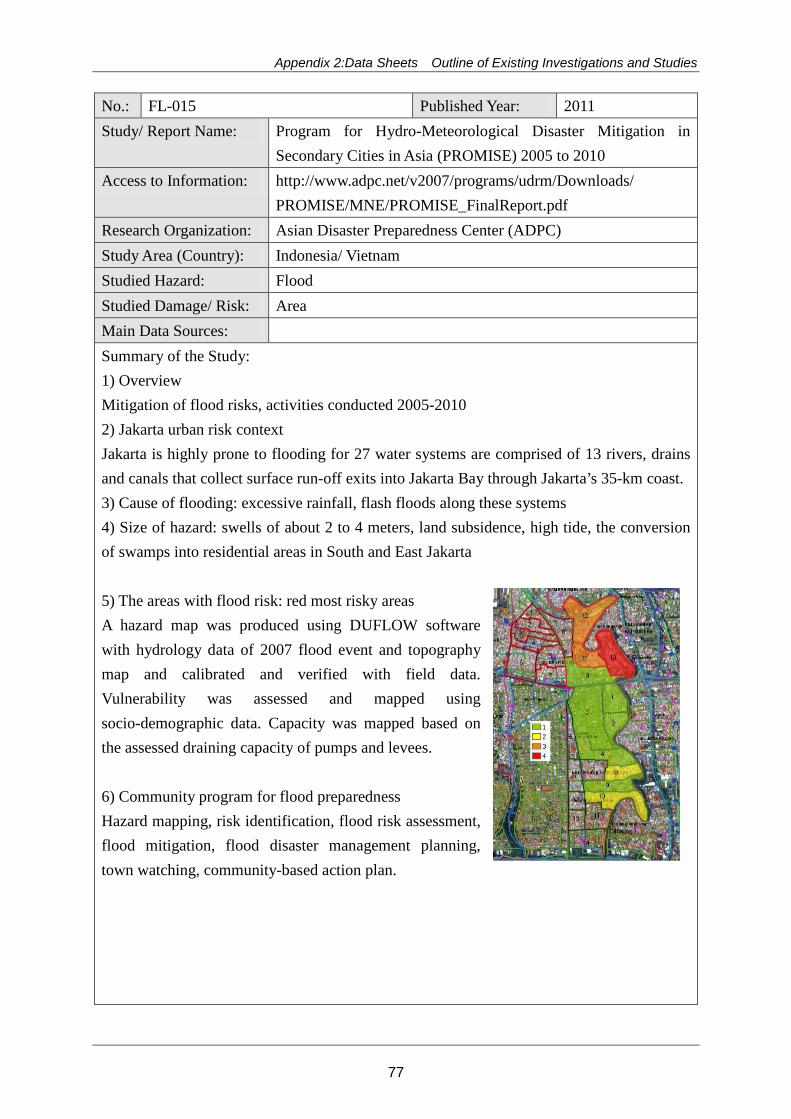
Appendix 2:Data Sheets Outline of Existing Investigations and Studies
No.: FL-015 Published Year: 2011 Study/ Report Name: Program for Hydro-Meteorological Disaster Mitigation in
Secondary Cities in Asia (PROMISE) 2005 to 2010 Access to Information: http://www.adpc.net/v2007/programs/udrm/Downloads/
PROMISE/MNE/PROMISE_FinalReport.pdf Research Organization: Asian Disaster Preparedness Center (ADPC) Study Area (Country): Indonesia/ Vietnam Studied Hazard: Flood Studied Damage/ Risk: Area Main Data Sources: Summary of the Study: 1) Overview Mitigation of flood risks, activities conducted 2005-2010 2) Jakarta urban risk context Jakarta is highly prone to flooding for 27 water systems are comprised of 13 rivers, drains and canals that collect surface run-off exits into Jakarta Bay through Jakarta’s 35-km coast. 3) Cause of flooding: excessive rainfall, flash floods along these systems 4) Size of hazard: swells of about 2 to 4 meters, land subsidence, high tide, the conversion of swamps into residential areas in South and East Jakarta 5) The areas with flood risk: red most risky areas A hazard map was produced using DUFLOW software with hydrology data of 2007 flood event and topography map and calibrated and verified with field data. Vulnerability was assessed and mapped using socio-demographic data. Capacity was mapped based on the assessed draining capacity of pumps and levees. 6) Community program for flood preparedness Hazard mapping, risk identification, flood risk assessment, flood mitigation, flood disaster management planning, town watching, community-based action plan.
77
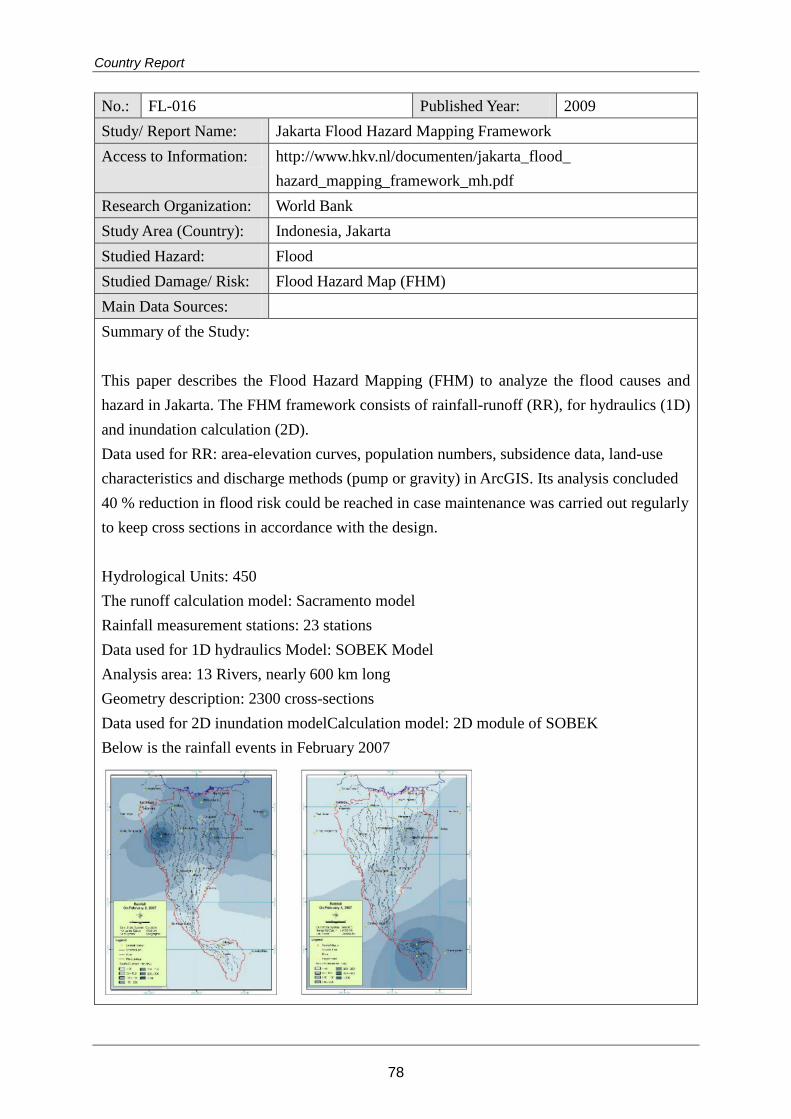
Country Report
No.: FL-016 Published Year: 2009 Study/ Report Name: Jakarta Flood Hazard Mapping Framework Access to Information: http://www.hkv.nl/documenten/jakarta_flood_
hazard_mapping_framework_mh.pdf Research Organization: World Bank Study Area (Country): Indonesia, Jakarta Studied Hazard: Flood Studied Damage/ Risk: Flood Hazard Map (FHM) Main Data Sources: Summary of the Study: This paper describes the Flood Hazard Mapping (FHM) to analyze the flood causes and hazard in Jakarta. The FHM framework consists of rainfall-runoff (RR), for hydraulics (1D) and inundation calculation (2D). Data used for RR: area-elevation curves, population numbers, subsidence data, land-use characteristics and discharge methods (pump or gravity) in ArcGIS. Its analysis concluded 40 % reduction in flood risk could be reached in case maintenance was carried out regularly to keep cross sections in accordance with the design. Hydrological Units: 450 The runoff calculation model: Sacramento model Rainfall measurement stations: 23 stations Data used for 1D hydraulics Model: SOBEK Model Analysis area: 13 Rivers, nearly 600 km long Geometry description: 2300 cross-sections Data used for 2D inundation modelCalculation model: 2D module of SOBEK Below is the rainfall events in February 2007
78

Appendix 2:Data Sheets Outline of Existing Investigations and Studies
No.: EQ_001 Published Year: 2009 Study/ Report Name: Global assessment report on disaster risk reduction (2009)
Risk and poverty in a changing climate Access to Information: http://www.unisdr.org/we/inform/publications/9413 Research Organization: United Nations International Strategy for Disaster Reduction
Secretariat (UNISDR) Study Area (Country): Worldwide Studied Hazard: Tropical cyclones, Floods, Landslides, Earthquakes (10% in 50
years MMI), Drought, Tsunamis, Forest and other biomass fires Studied Damage/ Risk: Multi-hazard risk Main Data Sources: Summary of the Study: An observation of disaster risk patterns and trends at the global level allows a visualization of the major concentrations of risk described in the report and an identification of the geographic distribution of disaster risk across countries, trends over time and the major drivers of these patterns and trends.
79
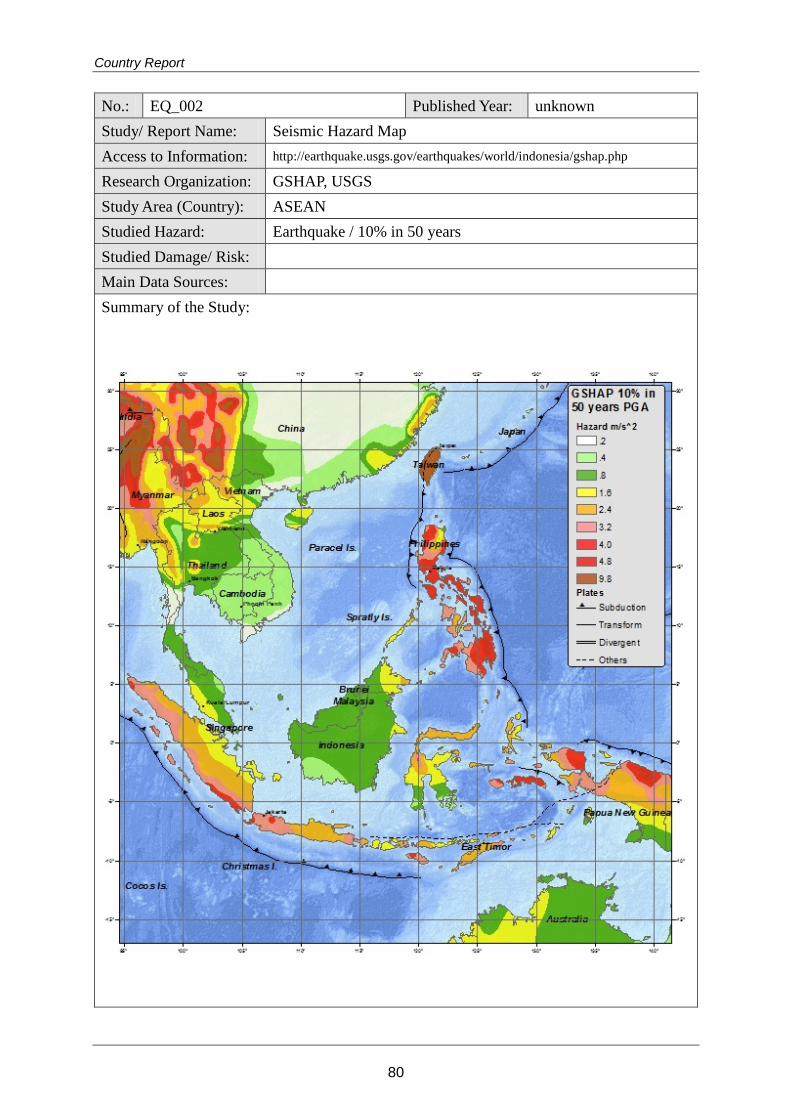
Country Report
No.: EQ_002 Published Year: unknown Study/ Report Name: Seismic Hazard Map Access to Information: http://earthquake.usgs.gov/earthquakes/world/indonesia/gshap.php
Research Organization: GSHAP, USGS Study Area (Country): ASEAN Studied Hazard: Earthquake / 10% in 50 years Studied Damage/ Risk: Main Data Sources: Summary of the Study:
80

Appendix 2:Data Sheets Outline of Existing Investigations and Studies
No.: EQ_003 Published Year: 2011 Study/ Report Name: Indonesia: Natural Hazard Risks Access to Information: http://reliefweb.int/sites/reliefweb.int/files/resources/map_1297.pdf
Research Organization: United Nations Office for the Coordination of Humanitarian Affairs Regional Office for Asia and the Pacific (OCHA-ROAP)
Study Area (Country): Indonesia Studied Hazard: Seismic, Volcanic and Tropical Storm Studied Damage/ Risk: All Natural Hazard Risks Main Data Sources: UN Cartographic Section, Global Discovery, FAO, Smithsonian
Institute, Pacific Disaster Center, UNISYS, Munich Reinsurance Group.
Summary of the Study: This map illustrates Indonesia's exposure to seismic, volcanic and tropical storm hazard. Earthquake intensity zones indicate where there is a 20% probability that degrees of intensity indicated will be exceeded in 50 years; tropical storm intensity zones indicate where there is a 10% probability of a storm of this intensity striking in the next 10 years. The bar chart shows the degree of exposure to natural hazards and the percentage of area affected.
81

Country Report
No.: EQ_004 Published Year: 2010 Study/ Report Name: Earthquake Risk Zone Map of Indonesia Access to Information: http://www.maipark.com/download/File/other/MAIPARK%20EQ%20Zone%
202010.pdf
Research Organization: PT. Asuransi MAIPARK Study Area (Country): Indonesia Studied Hazard: Earthquake Risk Zone for insurance Studied Damage/ Risk: Main Data Sources: Summary of the Study: Maipark’s primary mission, as established by the Ministry of Finance, is to develop a national database on catastrophe insurance in order to provide affordable insurance premiums in line with the government regulation 73/1992, which stipulates business conduct and adequacy of premium practices. In order to establish premium prices, it has divided the country into five earthquake zones, with the highest premiums being charged in the most dangerous zone (Zone 5). Furthermore, it is currently developing a comprehensive earthquake hazard map through a research and development project to identify all geological hazards in the country.
82

Appendix 2:Data Sheets Outline of Existing Investigations and Studies
No.: EQ_005 Published Year: 2009 Study/ Report Name: Seismic Hazard of Western Indonesia Access to Information: http://earthquake.usgs.gov/earthquakes/eqarchives/poster/2009/20090930b.ph
p
Research Organization: USGS Study Area (Country): Indonesia Studied Hazard: Earthquake / 10% in 50 years PGA Studied Damage/ Risk: Main Data Sources: Summary of the Study: The tectonics of Western Indonesia is summarized as Western Indonesia Earthquakes (1988 - June 2009), Seismic Hazard, Significant rupture zones along offshore western Sumatra (1797, 1833, and 2000 – 2008), and Fatal Earthquakes (1988 – 2008) are summarized.
83

Country Report
No.: EQ_006 Published Year: 2007 Study/ Report Name: Documentation for the Southeast Asia Seismic Hazard Maps Access to Information: http://earthquake.usgs.gov/hazards/products/foreign/ Research Organization: USGS Study Area (Country): Indonesia, Thailand, Malaysia / Jakarta, Bangkok Studied Hazard: Earthquake / Probabilistic Seismic Hazard Analysis Studied Damage/ Risk: Main Data Sources: Summary of the Study: The ground motion hazard for Sumatra and the Malaysian peninsula is calculated in a probabilistic framework, using procedures developed for the US National Seismic Hazard Maps.
84

Appendix 2:Data Sheets Outline of Existing Investigations and Studies
No.: EQ_007 Published Year: 2006 Study/ Report Name: Preliminary Damage and Loss Assessment: Yogyakarta and
Central Java Natural Disaster Access to Information: http://www.adb.org/publications/preliminary-damage-and-loss-as
sessment-yogyakarta-and-central-java-natural-disaster Research Organization: Asian Development Bank Study Area (Country): Indonesia, Yogyakarta and Central Java Studied Hazard: Earthquake, Tsunami Studied Damage/ Risk: Mortality risk, GDP Main Data Sources: Summary of the Study: This report presents a preliminary assessment of the damage and losses caused by the earthquake. The assessment used the international standard methodology for measuring disasters, and draws upon some of the best experts in the world. The report provides the Government and the international community a clearer understanding of the impact of the disaster, and a basis for designing reconstruction and recovery programs. The report was prepared under the leadership of BAPPENAS, supported by a strong team of Indonesian and international specialists.
85

Country Report
No.: EQ_008 Published Year: unknown Study/ Report Name: Indonesia Earthquake Information Access to Information: http://earthquake.usgs.gov/earthquakes/world/?region=Indonesia
Research Organization: USGS, GSHAP Study Area (Country): Indonesia (Southeast Asia) Studied Hazard: Earthquake / seismic hazard, earthquake density etc. Studied Damage/ Risk: Main Data Sources: Summary of the Study: Historic Information Institutions •Badan Meteorologi dan Geofisika - BMG •ASEAN Earthquake Information Center •Volcanological Survey of Indonesia
Maps •Seismic Hazard Map of Indonesia •Earthquake Density Map •Seismicity Map of Indonesia
Notable Earthquakes Recent Earthquakes Tectonic Information
86

Appendix 2:Data Sheets Outline of Existing Investigations and Studies
No.: EQ_009 Published Year: continuously-updated Study/ Report Name: Peta Tematik (Thematic Map), Gempa (Earthquake) Access to Information: http://geospasial.bnpb.go.id/category/peta-tematik/gempa/
Research Organization: Bandan Nasional Penanggulangan Bencana (BNPB) National Agency for Disaster Management
Study Area (Country): Indonesia Studied Hazard: Shake map (MMI), 2009 - present Studied Damage/ Risk: Main Data Sources: MMI (USGS) Summary of the Study: Maps are open on the web site of BNPB
87

Country Report
No.: EQ_024 Published Year: 2007 Study/ Report Name: Documentation for the Southeast Asia Seismic Hazard Maps Access to Information: http://earthquake.usgs.gov/hazards/products/foreign/ Research Organization: USGS Study Area (Country): Jakarta of Indonesia, Bangkok of Thailand, Malaysia Studied Hazard: Earthquake / Probabilistic Seismic Hazard Analysis Studied Damage/ Risk: Main Data Sources: Summary of the Study: The ground motion hazard for Sumatra and the Malaysian peninsula is calculated in a probabilistic framework, using procedures developed for the US National Seismic Hazard Maps.
88

Appendix 2:Data Sheets Outline of Existing Investigations and Studies
No.: TN_001 Published Year: 2004 Study/ Report Name: Southern Asia - Earthquake and Tsunami - Indonesia, Sri Lanka
and India (The Sumatra Earthquake of 26 December 2004) Access to Information: http://www.dartmouth.edu/~floods/2004193.html Research Organization: Dartmouth Flood Observatory Study Area (Country): Indonesia, Sri Lanka and India Studied Hazard: Tsunami (Inundation) Studied Damage/ Risk: Main Data Sources: Summary of the Study: World Atlas of Large Flood Events 1985-2002 The information presented in this atlas is derived from a wide variety of news, governmental, instrumental, and remote sensing source. It is designed in order to better understand the evolution of extreme flood events since 1985. The archive is "active" because it is currently updated (with current and past events).
89

Country Report
No.: TN_002 Published Year: 2005 Study/ Report Name: From Disaster to Reconstruction: A Report on ADB's Response
to the Asian Tsunami Access to Information: http://www.adb.org/publications/disaster-reconstruction-report-a
dbs-response-asian-tsunami Research Organization: Asian Development Bank Study Area (Country): ASEAN Studied Hazard: Tsunami Studied Damage/ Risk: Main Data Sources: Summary of the Study: This report summarizes ADB’s response to the earthquake and tsunami during the first year. It highlights major activities, details project components, and identifies challenges ahead and lessons learned in responding to this unprecedented regional natural disaster.
90

Appendix 2:Data Sheets Outline of Existing Investigations and Studies
No.: TN_003 Published Year: 2007 Study/ Report Name: Tsunami Hazard map of Indonesia Access to Information: http://raphael.paris.pagesperso-orange.fr/database/indonesia_tsu
nami.jpg Research Organization: Firewaves: Volcanic Tsunami Working Group, UMR6042
Geolab Study Area (Country): Indonesia Studied Hazard: Tsunami hazard Studied Damage/ Risk: Main Data Sources: NGDC (National Geophysical Data Center, NOAA)
HTDB database (Tsunami Laboratory in Novosibirsk, Russia) Summary of the Study: All the events listed in the database were integrated in a GIS environment and the Indonesian coasts were divided in 39 main areas. The main tectonic lineaments and a map of the cities and population densities provided by the ESRI network were added to the GIS earthquake databases (NGDC, USGS and Smithsonian Institution). The legend presents four levels of hazard: very high (more than 10 attested events since 400 years), high (5-10 events), moderate (4-2 events) and low (< 2 events). http://firewaves.over-blog.com/article-a-tsunami-hazard-map-for-indonesia-80685148.html
91

Country Report
No.: TN_004 Published Year: 2006 Study/ Report Name: Preliminary Damage and Loss Assessment: Yogyakarta and
Central Java Natural Disaster Access to Information: http://www.adb.org/publications/preliminary-damage-and-loss-as
sessment-yogyakarta-and-central-java-natural-disaster Research Organization: Asian Development Bank (ADB) Study Area (Country): Indonesia, Yogyakarta and Central Java Studied Hazard: Earthquake, Tsunami Studied Damage/ Risk: Mortality risk, GDP Main Data Sources: Summary of the Study: This report presents a preliminary assessment of the damage and losses caused by the earthquake. The assessment used the international standard methodology for measuring disasters, and draws upon some of the best experts in the world. The report provides the government and the international community a clearer understanding of the impact of the disaster, and a basis for designing reconstruction and recovery programs. The report was prepared under the leadership of BAPPENAS, supported by a strong team of Indonesian and international specialists.
92
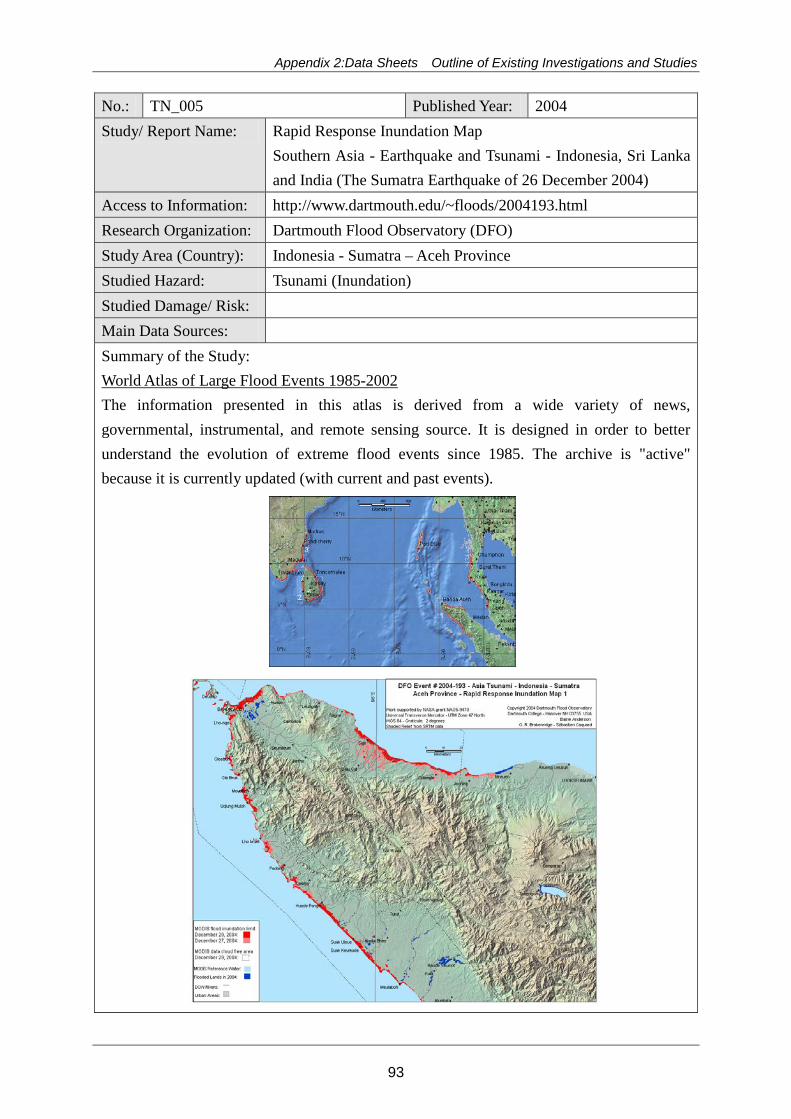
Appendix 2:Data Sheets Outline of Existing Investigations and Studies
No.: TN_005 Published Year: 2004 Study/ Report Name: Rapid Response Inundation Map
Southern Asia - Earthquake and Tsunami - Indonesia, Sri Lanka and India (The Sumatra Earthquake of 26 December 2004)
Access to Information: http://www.dartmouth.edu/~floods/2004193.html Research Organization: Dartmouth Flood Observatory (DFO) Study Area (Country): Indonesia - Sumatra – Aceh Province Studied Hazard: Tsunami (Inundation) Studied Damage/ Risk: Main Data Sources: Summary of the Study: World Atlas of Large Flood Events 1985-2002 The information presented in this atlas is derived from a wide variety of news, governmental, instrumental, and remote sensing source. It is designed in order to better understand the evolution of extreme flood events since 1985. The archive is "active" because it is currently updated (with current and past events).
93

Country Report
No.: TN_006 Published Year: continuously updated Study/ Report Name: Thematic Map of Tsunami (Peta Tematik / Tsunami) Access to Information: http://geospasial.bnpb.go.id/category/peta-tematik/tsunami-peta-tematik/
Research Organization: Bandan Nasional Penanggulangan Bencana (BNPB) National Agency for Disaster Management
Study Area (Country): Indonesia Studied Hazard: inundation area and casualties by Tsunami Studied Damage/ Risk: Main Data Sources: Summary of the Study: Maps are open on the web site of BNPB
94

Appendix 2:Data Sheets Outline of Existing Investigations and Studies
No.: VE_001 Published Year: 2011 Study/ Report Name: Holocene Eruption and Selected Volcanoes in Asia-Pacific Access to Information: http://reliefweb.int/sites/reliefweb.int/files/resources/map_619.pdf
Research Organization: United Nations Office for the Coordination of Humanitarian Affairs, Regional Office for Asia Pacific (OCHA -ROAP)
Study Area (Country): Asia-Pacific Studied Hazard: Volcanic Explosivity Index (VEI) Studied Damage/ Risk: Main Data Sources: UN Cartographic Section, Smithsonian Institution, Global
Volcanism Program Summary of the Study: This map shows the density of volcanic eruptions based on the explosivity index for each eruption and the time period of the eruption. Eruption information is spread to 100km beyond point source to indicate areas that could be affected by volcanic emissions or ground shaking. The volcanic eruptions were rated using the Volcanic Explosivity Index (VEI). The VEI is a simple 0 to 8 index of increasing explosivity, with each successive integer representing about an order of magnitude increase.
95

Country Report
No.: VE_002 Published Year: continuously updated Study/ Report Name: Thematic Map of Volcano (PETA TEMATIK / GUNUNGAPI) Access to Information: http://geospasial.bnpb.go.id/category/peta-tematik/gunungapi-pet
a-tematik/ Research Organization: Bandan Nasional Penanggulangan Bencana (BNPB)
National Agency for Disaster Management Study Area (Country): Volcanos Studied Hazard: Banjir (Flood), Gempa (Earthquake), Gunungapi (Volcano),
Kebakaran (Fire), Kekeringan (Drought), Longsor (Landslide), Tsunami Peta Kawasan Rawan Bencana (KRB): Disaster Prone Area Map etc.
Studied Damage/ Risk: Main Data Sources: Summary of the Study: Volcanic hazard zone is shown as the following ranks, for example. zone III: Frequently affected by pyroclastic flow, lava flow, ejected rock fragments zone II: Potentially affected by pyroclastic flow, lava flow, glowing rock fragments and lahar zone I: Potentially affected by lahar and the possibility of pyroclastic flow and lava flows.
96

Appendix 2:Data Sheets Outline of Existing Investigations and Studies
No.: CM-001 Published Year: 2002 Study/ Report Name: Overview of Early Warning in Cambodia, Indonesia, Lao PDR,
Philippines and Vietnam Access to Information: http://www.adpc.net/pdr-sea/publications/OEWS.pdf Research Organization: Asian Disaster Preparedness Center Study Area (Country): Indonesia, Vietnam, Philippines, Lao PDR, Cambodia Studied Hazard: Storm(heavy rain) Studied Damage/ Risk: Hazard Main Data Sources:
Summary of the Study:
Globally, the incidence of hydro-meteorological disasters has doubled since 1996. In the past decade, more than 90% of the people killed by natural hazards and lost their lives due to droughts, windstorms and floods, of which 85% of the total deaths were reported from Asia (WDR, 2001). Strengthening disaster reduction strategies throughout the region is an important step towards ensuring that natural hazards do not result in social and economic disasters.
The UN International Decade on Natural Disaster Reduction (IDNDR) Conference on Early Warning Systems for Reduction of Natural Disasters (held in Potsdam, Germany in September 1998) declared that the successful application of early warning is the most practical and effective measure for disaster prevention. Ultimately, the declaration continues, early warning systems must be comprehended by and motivate communities at greatest risk, including those disenfranchised and particularly disadvantaged people who must take appropriate protective actions. One of IDNDR’s original program targets was for all countries to have in place, by the year 2000, ready access to global, regional, national and local warning systems as part of their national plans. Many governments and related disaster management organizations throughout Asia have already initiated Early Warning Systems; though, the resulting systems vary widely in their capacity to produce and communicate effective warnings. This report summarizes the findings of a study of Early Warning Systems in Cambodia, Indonesia, Lao PDR, Philippines and Vietnam, the countries targeted by the Disaster Preparedness Program of the European Commission Humanitarian Aid Office (DIPECHO). The study, conducted in accordance with the IDNDR objectives, was undertaken by Asian Disaster Preparedness Center's Partnerships for Disaster Reduction-South East Asia (PDR-SEA) project, which emphasizes the need to address disaster related issues within the context of sustainable development, with communities targeted as major beneficiaries1. Most broadly, the project aims to develop the capacities of communities to prevent or mitigate the impact of disasters.
97

Country Report
This report attempts to raise awareness of the early warning systems in the respective countries and to provide a basis for further enhancing institutional mechanisms, technical capacities and community response options for reducing vulnerability to extreme climate events. The study has the following objectives:
• Review the international initiatives on early warning system
• Conduct a rapid appraisal of existing early warning system for hydro-meteorological hazards in DIPECHO target countries, and
• Undertake short case studies to assess community-level vulnerability and response to hydro-meteorological hazards.
Huge populations in the selected countries are highly vulnerable to hydro-meteorological hazards as large numbers of communities are settled in risk prone marginal areas. Fertile flood valleys, plains and deltas, such as the Lower Mekong River basin, are attractive to farmers as they provide access to livelihoods; but they are also most vulnerable to floods.
In urban areas, burgeoning populations are in many instances located in areas vulnerable to hazards such as tropical storms. This study is limited to the EWS for hydrometeorological hazards focusing on tropical cyclone and floods as recommended in the proposal approved by the European Commission Humanitarian Aid Office (ECHO).
98
Appendix 2:Data Sheets Outline of Existing Investigations and Studies
No.: CM-02 Published Year: 2009 Study/ Report Name: The Economics of Climate Change in Southeast Asia: A
Regional Review Access to Information: http://www.climatechange-foodsecurity.org/uploads/ABD_ec_cli
mate-change-se-asia.pdf Research Organization: UNESCO (ICHARM)/PERI Study Area (Country): Indonesia, Philippines, Singapore, Thailand, Viet Nam
(5 countries) Studied Hazard: Studied Damage/ Risk: Hazard Main Data Sources:
Summary of the Study:
The Economics of Climate Change in Southeast Asia: A Regional Review is the result of a 15-month long Asian Development Bank (ADB) technical assistance project, funded by the Government of the United Kingdom, which examines climate change issues in Southeast Asia, with a particular focus on Indonesia, Philippines, Singapore, Thailand, and Vietnam. The study is intended to enrich the debate on the economics of climate change that includes the economic costs and benefits of unilateral and regional actions. It seeks to raise awareness among stakeholders of the urgency of the grave challenges facing the region, and to build consensus of the governments, business sectors, and civil society on the need for incorporating adaptation and mitigation measures into national development planning processes. The study involves reviewing and scoping of existing climate studies, climate change modeling, and national and regional consultations with experts and policy-makers. It examines how vulnerable Southeast Asia is. to climate change, how climate change is impacting the region, what adaptation measures have been taken by the five study countries to-date, how great the region’s potential is to reduce greenhouse gas (GHG) emissions in the future, how Southeast Asia can step up adaptation and mitigation efforts, and what the policy priorities are. Southeast Asia is highly vulnerable to climate change.
The study observed that climate change is already affecting Southeast Asia, with rising temperature, decreasing rainfall, rising sea levels, increasing frequency and intensity of extreme weather events leading to massive flooding, landslides and drought causing extensive damage to property, assets, and human life. Climate change is also exacerbating the problem of water stress, affecting agriculture production, causing forest fires, degrading forests, damaging coastal marine resources, and increasing outbreaks of infectious diseases. The report urges that Southeast Asian countries should treat adaptation as an extension of sustainable development practices. Its key elements include: adapting agricultural practices to changes in temperature and precipitation; adapting water management to greater risk of
99

Country Report
floods and droughts; adapting coastal zone management to higher sea levels; safeguarding forest areas from forest fires and degradation; adapting people to threats of vector-borne infectious diseases. Southeast Asia countries need to take timely action to adapt to climate change, build resilience, and minimize the costs caused by the impact driven by GHG emissions that have been locked into the climate system.
Climate change is happening now in Southeast Asia, and the worst is yet to come. If not addressed adequately, it could seriously hinder the region’s sustainable development and poverty eradication efforts—there is no time for delay. The review identifies a number of factors that explain why the region is particularly vulnerable. Southeast Asia’s 563 million people are concentrated along coastlines measuring 173,251 kilometers long, leaving it exposed to rising sea levels. At the same time, the region’s heavy reliance on agriculture for livelihoods—the sector accounted for 43% of total employment in 2004 and contributed about 11% of GDP in 2006—make it vulnerable to droughts, floods, and tropical cyclones associated with warming. Its high economic dependence on natural resources and forestry—as one of the world’s biggest providers of forest products—also puts it at risk. An increase in extreme weather events and forest fires arising from climate change jeopardizes vital export industries.
Rapid economic growth and structural transformation in Southeast Asia helped lift millions out of extreme poverty in recent decades. But poverty incidence remains high—as of 2005, about 93 million (18.8%) Southeast Asians still lived below the $1.25-a-day poverty line—and the poor are the most vulnerable to climate change. The review has also assessed a wide range of evidence of climate change and its impact in Southeast Asia to date. It tells a clear story: mean temperature increased at 0.1–0.3°C per decade between 1951 and 2000; rainfall trended downward during 1960—2000; and sea levels have risen 1–3 millimeters per year.
100
Appendix 2:Data Sheets Outline of Existing Investigations and Studies
No.: CM-003 Published Year: 2011 Study/ Report Name: CLIMATE VARIABILITY AND CLIMATE CHANGES, AND
THEIR IMPLICATION Access to Information: http://www.undp.or.id/pubs/docs/Final%20Country%20Report%
20-%20Climate%20Change.pdf Research Organization: UNDP Study Area (Country): Indonesia Studied Hazard: Studied Damage/ Risk: Hazard Main Data Sources:
Summary of the Study:
In the past four decades, climate related hazards such as floods, droughts, storms, landslides and wild fires have caused major loss of human lives and livelihoods, the destruction of economic and social infrastructures as well as environmental damages. Within the period of 2003-2005 alone, there were about 1,429 disaster incidences in Indonesia. About 53.3% were hydro-meteorological disasters (Bappenas and Bakornas PB, 2006). Of this figure, floods occur most often (34%), followed by landslides at 16%. A report from UN-OCHA (2006) indicates that Indonesia is one of the vulnerable countries to climate related hazards (Figure 1). In the future, a changing climate brought about by global warming is expected to create new patterns of risk, and higher risks generally. Sea level rise due to melting glaciers and polar ice and thermal expansion will contribute to the increase of coastal flooding. Increasing intensity of tropical cyclones observed in recent decades may be tied to increasing sea surface temperatures. By impacting the hydrologic cycle, global warming is expected to alter climatic ranges, shift regional climatic averages, resulting in shifting of climate zones, and lead to a higher frequency and amplitude of weather events. Climate variability and change occurring against a backdrop of increasing global population and globalization of economic processes may be expected to lead to increased competition over resources and new vulnerabilities. With the increase of climate risk, many countries, particularly least developed and developing countries, may have difficulties to achieve the Millennium Development Goals related to poverty, hunger and human health.
This country report describes briefly the type of climate hazards in Indonesia and their impact on various sectors, trends of climate change in the past and climate change scenarios in the future as well as their implication on the sectors. Views from sectors on how to address this climate change impact are summarized in the last chapter. The country report was developed based on data and information provided by sectors, reviewed journal articles and project reports. Scientific explanations are not discussed in detail, however, where
101

Country Report
relevant, short notes on the methodology used for data analysis are provided as foot notes.
102
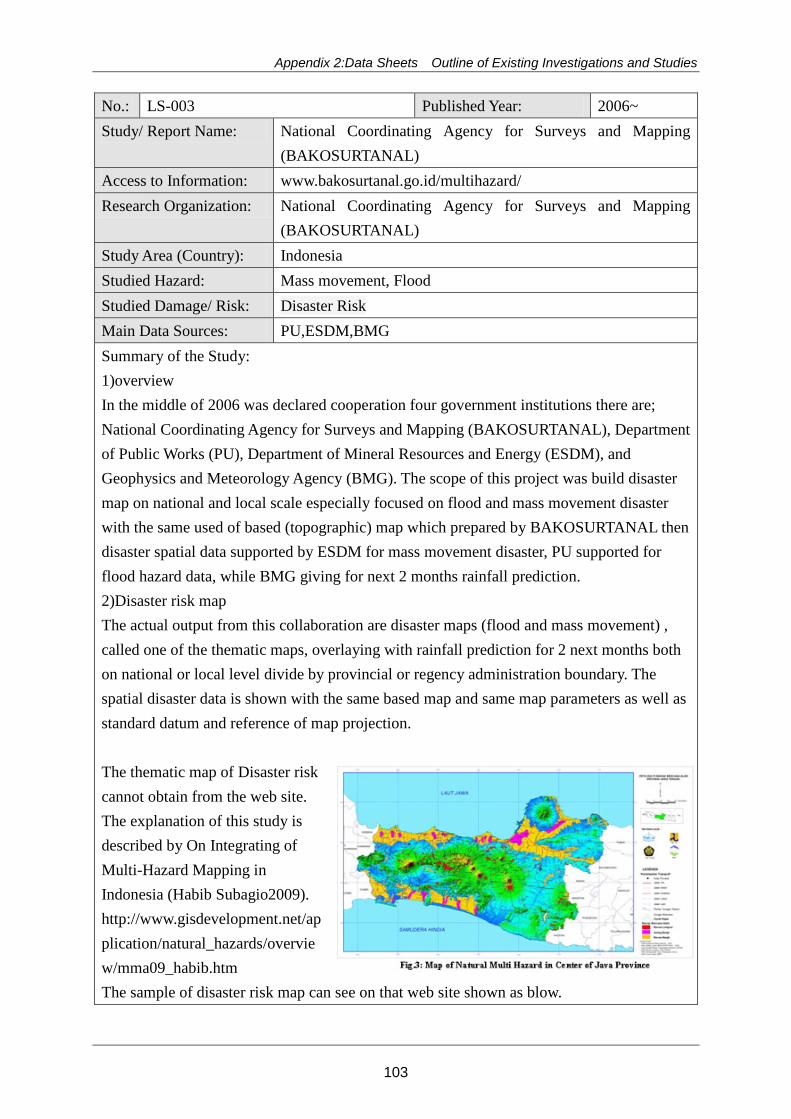
Appendix 2:Data Sheets Outline of Existing Investigations and Studies
No.: LS-003 Published Year: 2006~ Study/ Report Name: National Coordinating Agency for Surveys and Mapping
(BAKOSURTANAL) Access to Information: www.bakosurtanal.go.id/multihazard/ Research Organization: National Coordinating Agency for Surveys and Mapping
(BAKOSURTANAL) Study Area (Country): Indonesia Studied Hazard: Mass movement, Flood Studied Damage/ Risk: Disaster Risk Main Data Sources: PU,ESDM,BMG Summary of the Study: 1)overview In the middle of 2006 was declared cooperation four government institutions there are; National Coordinating Agency for Surveys and Mapping (BAKOSURTANAL), Department of Public Works (PU), Department of Mineral Resources and Energy (ESDM), and Geophysics and Meteorology Agency (BMG). The scope of this project was build disaster map on national and local scale especially focused on flood and mass movement disaster with the same used of based (topographic) map which prepared by BAKOSURTANAL then disaster spatial data supported by ESDM for mass movement disaster, PU supported for flood hazard data, while BMG giving for next 2 months rainfall prediction. 2)Disaster risk map The actual output from this collaboration are disaster maps (flood and mass movement) , called one of the thematic maps, overlaying with rainfall prediction for 2 next months both on national or local level divide by provincial or regency administration boundary. The spatial disaster data is shown with the same based map and same map parameters as well as standard datum and reference of map projection. The thematic map of Disaster risk cannot obtain from the web site. The explanation of this study is described by On Integrating of Multi-Hazard Mapping in Indonesia (Habib Subagio2009). http://www.gisdevelopment.net/application/natural_hazards/overview/mma09_habib.htm The sample of disaster risk map can see on that web site shown as blow.
103

Country Report
No.: LS-004 Published Year: 2006~ Study/ Report Name: Pengenalan Gerakan Tanah (Introduction to Soil Movement)
and Geology Hazard Vulnerability Mapping Access to Information: http://www.esdm.go.id/publikasi/lainlain.html Research Organization: Ministry of Energy and Mining Resouce(MEMR) Study Area (Country): Indonesia Studied Hazard: Landslide Tsunami Volcano Earthquake Studied Damage/ Risk: Hazard area Main Data Sources: Not clear Summary of the Study: 1)overview This site explains general nature of landslide disaster in Indonesia, approximate amount of event and victim in 2003-2005 and hazard area of that country. The data of those are not so detailed but there are at local (province and regency) scale maps, which this agency developed with spatial analysis process from some parameters using GIS except on Map of Volcanic Hazard Areas due to already mapping in each volcanic area. This product is called Geology Hazard Vulnerability Mapping which contains of; Tsunami Inundation Area, Mass Movement Area, Land Stability Index, Earthquake Hazard Area, and other thematic maps which supported of these products Map of Earthquake Hazard Areas in Indonesia. The detailed maps are not shown in the web-site.
Events and Victim of Landslide 2003-2005
(Landslide Vulnerability Zone Map IN.) (Index map of detailed landslide vulnerability zone )
104

Appendix 2:Data Sheets Outline of Existing Investigations and Studies
No.: LS-006 Published Year: 2010 Study/ Report Name: Synthesis Report on Ten ASEAN Countries Disaster Risks
Assessment Access to Information: http://www.unisdr.org/files/18872_asean.pdf Research Organization: UNISDR/World Bank Study Area (Country): An assessment of disaster risks in ten ASEAN countries Studied Hazard: earthquakes, tropical cyclonic storms (typhoons), floods,
landslides, tsunamis, droughts, and forest fires. Studied Damage/ Risk: Hazard profile and Risk profile Main Data Sources: CRED EM-DAT, ADRC, NGDC, GSHAP, MRC, WAMIS,
DWR, Munich Re, World Bank, UNISDR, GAR, InTerragate, IFNet, and CCFSC, DESINVEN-TAR 1970-2009
Summary of the Study: 1)overview This synthesis report on the Ten ASEAN Countries is based on a desk review of existing studies by academia, governments and international governmental and non-governmental organizations. Risk assessments are carried out directly based on recorded historical losses. The economic loss probability estimates presented in this report are not intended for designing catastrophe insurance schemes, which require a much more detailed approach that models hazard, exposure and vulnerability of buildings and infrastructure. 2)landslide and mudslide analysis Landslide and mudslide analysis data sources are shown in above table (Main Data Sources). The landslide hazard risks maps were derived from the GAR Preview platform (GAR, 2009; http://previewgrid.unep.ch), has 10km grid resolution. This report explains overview, Regional setting, Hazard profile and Risk profile of each 10 countries separately.
Assessment sample of Natural disaster (Indonesia)
105
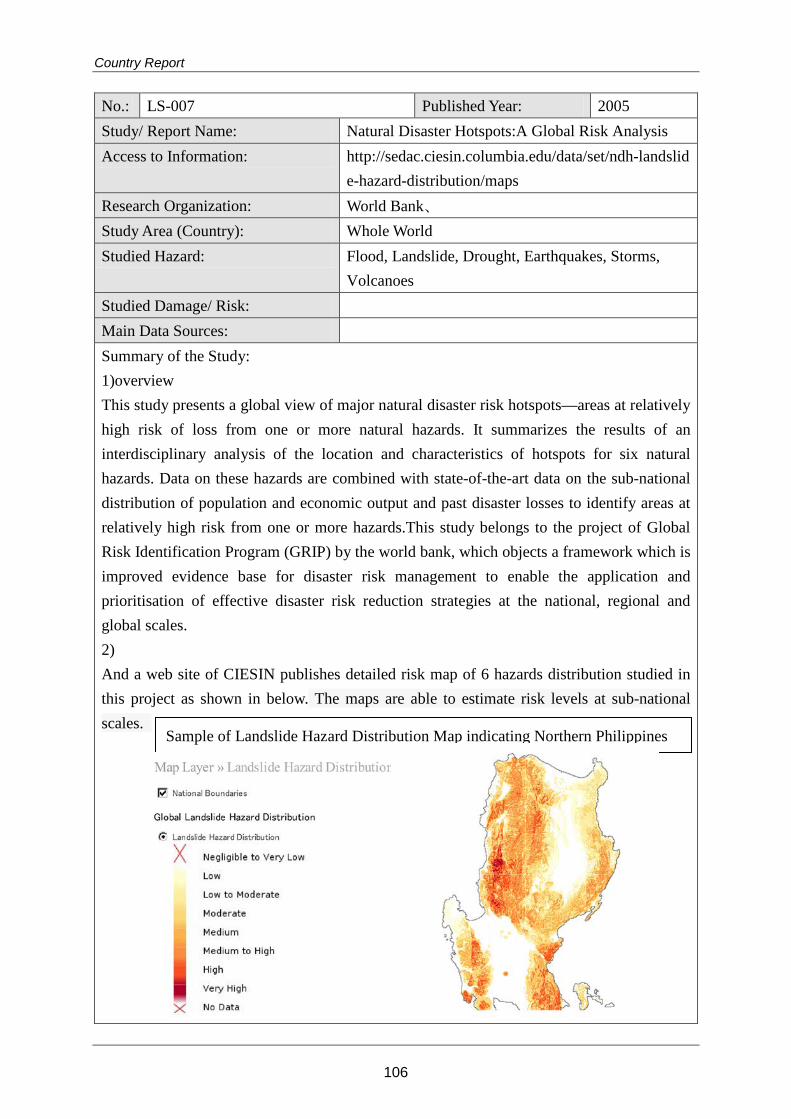
Country Report
No.: LS-007 Published Year: 2005 Study/ Report Name: Natural Disaster Hotspots:A Global Risk Analysis Access to Information: http://sedac.ciesin.columbia.edu/data/set/ndh-landslid
e-hazard-distribution/maps Research Organization: World Bank、 Study Area (Country): Whole World Studied Hazard: Flood, Landslide, Drought, Earthquakes, Storms,
Volcanoes Studied Damage/ Risk: Main Data Sources: Summary of the Study: 1)overview This study presents a global view of major natural disaster risk hotspots—areas at relatively high risk of loss from one or more natural hazards. It summarizes the results of an interdisciplinary analysis of the location and characteristics of hotspots for six natural hazards. Data on these hazards are combined with state-of-the-art data on the sub-national distribution of population and economic output and past disaster losses to identify areas at relatively high risk from one or more hazards.This study belongs to the project of Global Risk Identification Program (GRIP) by the world bank, which objects a framework which is improved evidence base for disaster risk management to enable the application and prioritisation of effective disaster risk reduction strategies at the national, regional and global scales. 2) And a web site of CIESIN publishes detailed risk map of 6 hazards distribution studied in this project as shown in below. The maps are able to estimate risk levels at sub-national scales.
Sample of Landslide Hazard Distribution Map indicating Northern Philippines
106

Appendix 2:Data Sheets Outline of Existing Investigations and Studies
No.: LS-008 Published Year: 2011 Study/ Report Name: Disaster risk management programs for priority countries - 2nd
edition Access to Information: http://www.unisdr.org/we/inform/publications/20049 Research Organization: UNISDR(united nations office for disaster risk reduction) Study Area (Country): Indonesia, Vietnam, Philippines, Lao PDR, Cambodia, Studied Hazard: All natural hazards Studied Damage/ Risk: Profile, management framework, activities about disaster risk Main Data Sources: The world bank, EN-DAT Summary of the Study: 1)overview This report is studying several aspects about disaster risk reduction, such as risk profile, management framework, activities and organization, concerning donor engagement and global facility to prepare comprehensive programs for disaster risk management and climate change adaptation for the next three to five years in each of the priority and donor earmarked countries by GFDRR (global facilities for disaster risk reduction). The following steps are undertaken to develop the country programs. 1. Investigation of a) the underlying risk factors and b) the progress in the five priority areas of the Hyogo Framework for Action; 2. stocktaking of ongoing risk reduction and climate change adaptation programs by key stakeholders, including UN agencies, multilateral and bilateral donors, and other partners; 3. identification of key gaps at national, sector, and local levels; 4. solicitation of proposals from different government and non-government entities and concerned donor agencies; 5. analysis of the solicited proposals and consensus building in a consultative process involving a range of stakeholders, including relevant government ministries, UN organizations, multilateral and bilateral donors, INGOs and civil society actors; 6. development of strategic comprehensive programs of support based on the gathered information. 2)Framework and assessment of present condition In the report, those assessments are described as each countries separately. 1: Ensure that disaster risk reduction is a national and a local priority with a strong institutional basis for implementation 2: Identify, assess and monitor disaster risks and enhance early warning 3: Use of knowledge, innovation, and education to build a culture of safety andresilience at all levels 4: Reduction of the underlying risk factors (reduction of exposure and vulnerability and
107

Country Report
increase of resilience) 5: Disaster preparedness, recovery and reconstruction at national, regional, and local levels
108
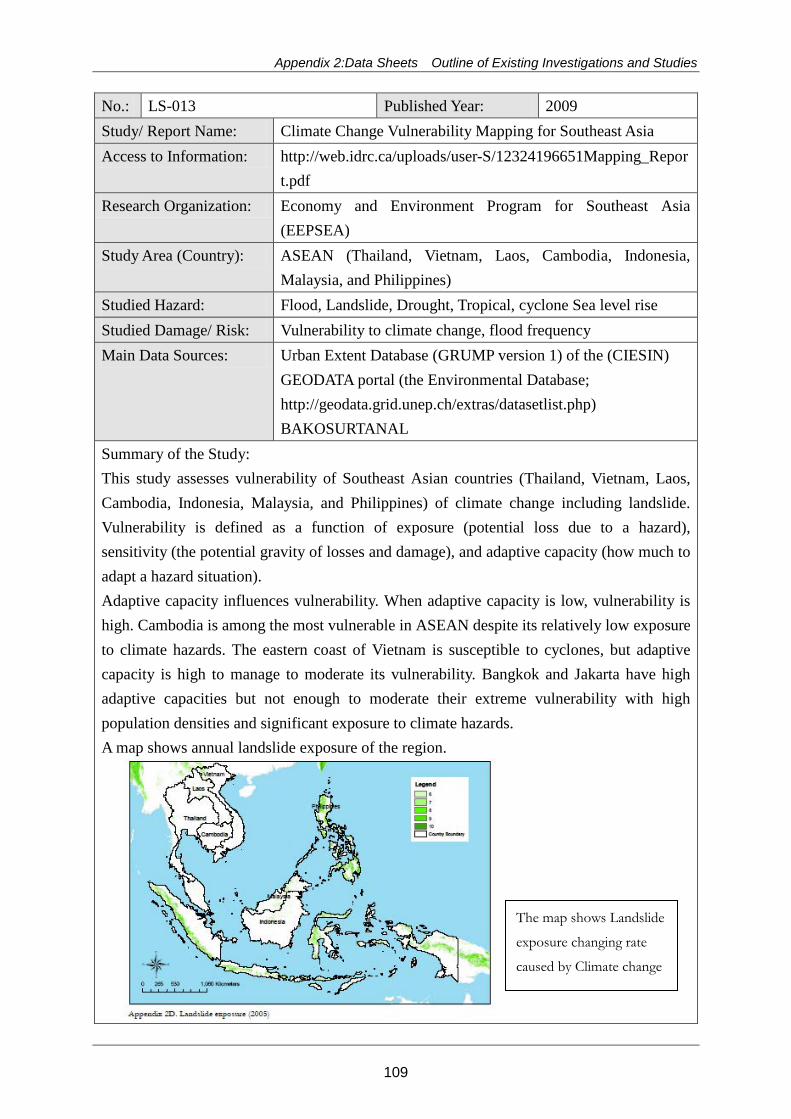
Appendix 2:Data Sheets Outline of Existing Investigations and Studies
No.: LS-013 Published Year: 2009 Study/ Report Name: Climate Change Vulnerability Mapping for Southeast Asia Access to Information: http://web.idrc.ca/uploads/user-S/12324196651Mapping_Repor
t.pdf Research Organization: Economy and Environment Program for Southeast Asia
(EEPSEA) Study Area (Country): ASEAN (Thailand, Vietnam, Laos, Cambodia, Indonesia,
Malaysia, and Philippines) Studied Hazard: Flood, Landslide, Drought, Tropical, cyclone Sea level rise Studied Damage/ Risk: Vulnerability to climate change, flood frequency Main Data Sources: Urban Extent Database (GRUMP version 1) of the (CIESIN)
GEODATA portal (the Environmental Database; http://geodata.grid.unep.ch/extras/datasetlist.php) BAKOSURTANAL
Summary of the Study: This study assesses vulnerability of Southeast Asian countries (Thailand, Vietnam, Laos, Cambodia, Indonesia, Malaysia, and Philippines) of climate change including landslide. Vulnerability is defined as a function of exposure (potential loss due to a hazard), sensitivity (the potential gravity of losses and damage), and adaptive capacity (how much to adapt a hazard situation). Adaptive capacity influences vulnerability. When adaptive capacity is low, vulnerability is high. Cambodia is among the most vulnerable in ASEAN despite its relatively low exposure to climate hazards. The eastern coast of Vietnam is susceptible to cyclones, but adaptive capacity is high to manage to moderate its vulnerability. Bangkok and Jakarta have high adaptive capacities but not enough to moderate their extreme vulnerability with high population densities and significant exposure to climate hazards. A map shows annual landslide exposure of the region.
The map shows Landslide
exposure changing rate
caused by Climate change
109

Country Report
No.: LS-14 Published Year: 2010 Study/ Report Name: THE PREPARATORY STUDY ON DISASTER
MANAGEMENT PROGRAM FOR INDONESIA Access to Information: http://libopac.jica.go.jp/search/detail.do?rowIndex=0&method
=detail&bibId=0000252755 Research Organization: JICA Study Area (Country): INDONESIA Studied Hazard: earthquake, flood, landslide, destructive wind, tsunami,
volcano Studied Damage/ Risk: The GOI policy, their achievements, current situation and
critical issue on disaster management sector Main Data Sources: EM-DAT, Summary of the Study: 1)overview The target of the program is set to contribute to peace and prosperity in Indonesia through strengthening the comprehensive disaster risk management framework, which will increase the country’s ability to cope with disasters at any stage of disaster risk management cycle (Preparedness, Mitigation, Emergency Response, Rehabilitation/Reconstruction). 2)outputs Areal distribution of natural disasters is investigated using the EM-DAT. Highly disaster-prone areas of each natural disaster are summarized as follows. - Landslide: North-western part of Sumatra, Java, Sulawesi and Nusa Tenggara Identified issue of Disaster Management Cycle (HFA) and Disaster Type analysis (as shown in blow) are those. Many of donors cover HFA
Priority 1, 2, and 3, and all types of disasters (not disaster specific)
Response is different from types of disasters, therefore, disaster specific projects need to be implemented or considered
Earthquake disaster especially in HFA Priority 4 on Risk Reduction is lacking
Also, Tsunami, Volcanic disaster in HFA Priority 4 is lacking
110
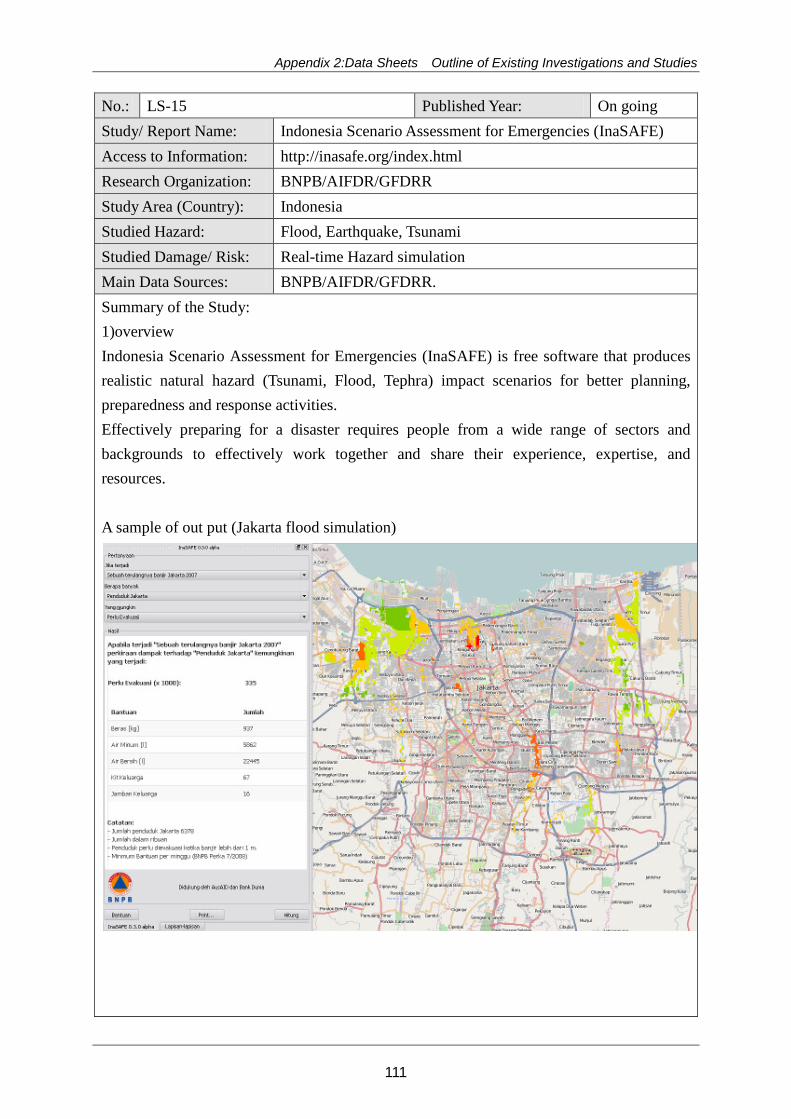
Appendix 2:Data Sheets Outline of Existing Investigations and Studies
No.: LS-15 Published Year: On going Study/ Report Name: Indonesia Scenario Assessment for Emergencies (InaSAFE) Access to Information: http://inasafe.org/index.html Research Organization: BNPB/AIFDR/GFDRR Study Area (Country): Indonesia Studied Hazard: Flood, Earthquake, Tsunami Studied Damage/ Risk: Real-time Hazard simulation Main Data Sources: BNPB/AIFDR/GFDRR. Summary of the Study: 1)overview Indonesia Scenario Assessment for Emergencies (InaSAFE) is free software that produces realistic natural hazard (Tsunami, Flood, Tephra) impact scenarios for better planning, preparedness and response activities. Effectively preparing for a disaster requires people from a wide range of sectors and backgrounds to effectively work together and share their experience, expertise, and resources. A sample of out put (Jakarta flood simulation)
111

Country Report
No.: LS-16 Published Year: 2008 Study/ Report Name: Preparatory Study of the Countermeasure Project for “Banjir
Bandang” (in Japanese) Access to Information: http://libopac.jica.go.jp/search/detail.do?rowIndex=41&method
=detail&bibId=0000245004 Research Organization: JICA Study Area (Country): Indonesia Studied Hazard: Landslide, Flash flood Studied Damage/ Risk: Disaster record, Main Data Sources: BNPB Summary of the Study: 1)overview Indonesia has experienced a major disaster by the tsunami and accompanying earthquake off the coast of Sumatra in December 2004. On this occasion, in relation to disaster management coordination of activities, the Presidential Decree (No.83-2005) will be issued in 2005, the central government BAKORNAS (National Disaster Management Coordination Committee), on the state level disaster management SATKORLAK(State disaster management coordinating committee), on the prefecture level disaster management SATLAK(Prefecture disaster Management coordination Committee)to adjust to disaster management activities across the organization at each level. Coupled with the promotion of decentralization of administrative functions, some organizational changes related to disaster management are implemented at the level of each country, state, prefecture. It is a on-going step of disaster management. BAKORNAS was reorganized and renamed BNPB (Advisory Board for Natural Disaster) in October 2007. 2)result and collected data The result of this project is summarized in that web-site. http://www.jica.go.jp/project/indonesia/0800040/materials/index.html a sample of collected data are show as below ,in which disaster of flash flood is described.
112

Appendix 2:Data Sheets Outline of Existing Investigations and Studies
No.: LS-17 Published Year: 2009 Study/ Report Name: The Study on Natural Disaster Management Plan Access to Information: http://libopac.jica.go.jp/search/detail.do?rowIndex=7&method=d
etail&bibId=0000246685 Research Organization: JICA Study Area (Country): Indonesia(Junburu prefektur, provinsi dan Padang Ammann
Paris,Kota Pariaman) Studied Hazard: Flood, Landslide, Earthquake, Tsunami Studied Damage/ Risk: Hazard and Risk Main Data Sources: - Summary of the Study: 1)overview The hazard assessment of natural disasters in the studying area and implementation and its evaluation about the status of disaster prevention in the level of each community and the local government at the national government have been studied. The project recommended the plan for construct a comprehensive disaster prevention management at the level of both the countries and regions of Indonesia. 2)output The disaster prevention level of Indonesia have been studied and present systems, such disaster records and administration structures are summarized in selected areas (Jember kabupaten, Pariaman kabupaten and Preaman City) as shown in below. As a test-case, a hazard map and risk map of that areas is created from the collected data. Preparedness system and emergency measures in each country and provincial levels are recommended.
113

Country Report
Appendix 3: List of Industrial Parks in Indonesia
ID Short List LongList COUNTRY PROVINCE PARK NAME ADDRESS
ID0001 Indonesia North Sumatera Medan Industrial Area Jalan Perdana Kota Medan 20231
ID0002 Indonesia North Sumatera Medanstar Industrial Estate NO ADRESS
ID0003 Indonesia North Sumatera Pulahan Seruai Industrial Estate NO ADRESS
ID0004 Indonesia West Sumatera Padang Industrial Park
Jalan Mohammad Yamin Sh,Kota Padang
ID0005 Indonesia Riau industrial park Dumai Jendral Sudirman Kota Dumai 28826
ID0006 Indonesia Riau industrial park Tanjung Buton NO ADRESS(Sumatera)
ID0007 XXID01 Indonesia Batam Batamindo Industrial Park
Jalan Gaharu-Batamindo Indurty Park Kota Batam 29433
ID0008 XXID04 Indonesia Batam Bintang Industrial Park
Near Harris resort (Julan Brigien Katamso Tanjang Vncang Batang)
ID0009 XXID08 Indonesia Batam Kabil Integrated Industrial Estate Jalan Pattimura Kota Batam 29467
ID0010 XXID19 Indonesia Batam Panbil Industrial Estate
Jalan Ahmad Yani-Komplek Panbil Industri Kota Batam 29433
ID0011 Indonesia Batam Puri Industrial Park 2000 Jalan Raya Puri 61363
ID0012 XXID25 Indonesia Batam Tunas Industrial Park Jalan Mekar Sari 3 Kota Bekasi 17112
ID0013 Indonesia Batam Union Industrial Park Unnamed Rd Kota Batam 29444
ID0014 Indonesia Batam West Point Maritime Industrial Park Jalan Jend. A. Yani Kota Batam 29433
ID0015 XXID03 Indonesia Bintan Bintan Industrial Estate
Bintan Island Riau Archipelago, Indonesia
ID0016 Indonesia Jakarta CilandakCommercial Estate
Jalan Sekolah Duta 5 22 Kota Jakarta Selatan 12310
ID0017 Indonesia Jakarta Pulogadung IndustrialArea
Pulo Asem Utara 10 11 Kota Jakarta Timur 13220
ID0018 XXID18 Indonesia Jakarta Nusantara Bonded Zone Nusantara Kota Depok 16451
ID0019 Indonesia Banten - Cilegon
Cilegon IndustrialArea
Jalan Kyai Haji Tubagus Ismail Kota Cilegon 42418
ID0020 Indonesia Banten - Cilegon
Jababeka Industrial Estate
Jalan Kh. Ahmad Dahlan 23 Kota Cilegon 42441
ID0021 Indonesia Banten - Cilegon
MGM Cikande Integrated IndustrialPark
Jalan Kh. Ahmad Dahlan 23 Kota Cilegon 42441
ID0022 XXID17 Indonesia Banten - Cilegon
Modern Cikande Industrial Estate
KM. 68 Bakung Cikande Banten, Indonesia
ID0023 Indonesia Banten - Tangerang
Cikupamas Industrial Area & Warehousing
Jalan Ki Samaun 28 Kota Tangerang 15118
ID0024 XXID14 Indonesia Banten - Tangerang
MilleniumIndustrial Estate
Jalan Millenium Raya III, Blok H1, Millenium Industrial Estate, Desa Peusar,, Panongan, Banten 15710
ID0025 Indonesia Banten - Tangerang
Bumi Serpong Damai Techno Park
Jalan Ki Samaun 28 Kota Tangerang 15118
ID0026 Indonesia West Java - Bogor
Cibinong CenterIndustrial Estate
Jalan Kampung Cikempong 2 Cibinong 16915
ID0027 Indonesia West Java - Bogor Sentul IndustrialArea Jalan Lan Bau 25 16810
ID0028 Indonesia West Java – Sumedang
Rancaekek IndustrialArea Cibalong Satu 45355
ID0029 Indonesia West Java – Karawang
BukitIndah Industrial Park
Jalan Benda Sari I 147 Karawang Timur 41371
ID0030 XXID11 XXID11 Indonesia West Java – Karawang Kujang IndustrialArea Near Jalan Teluk Jambe
Indonesia
114
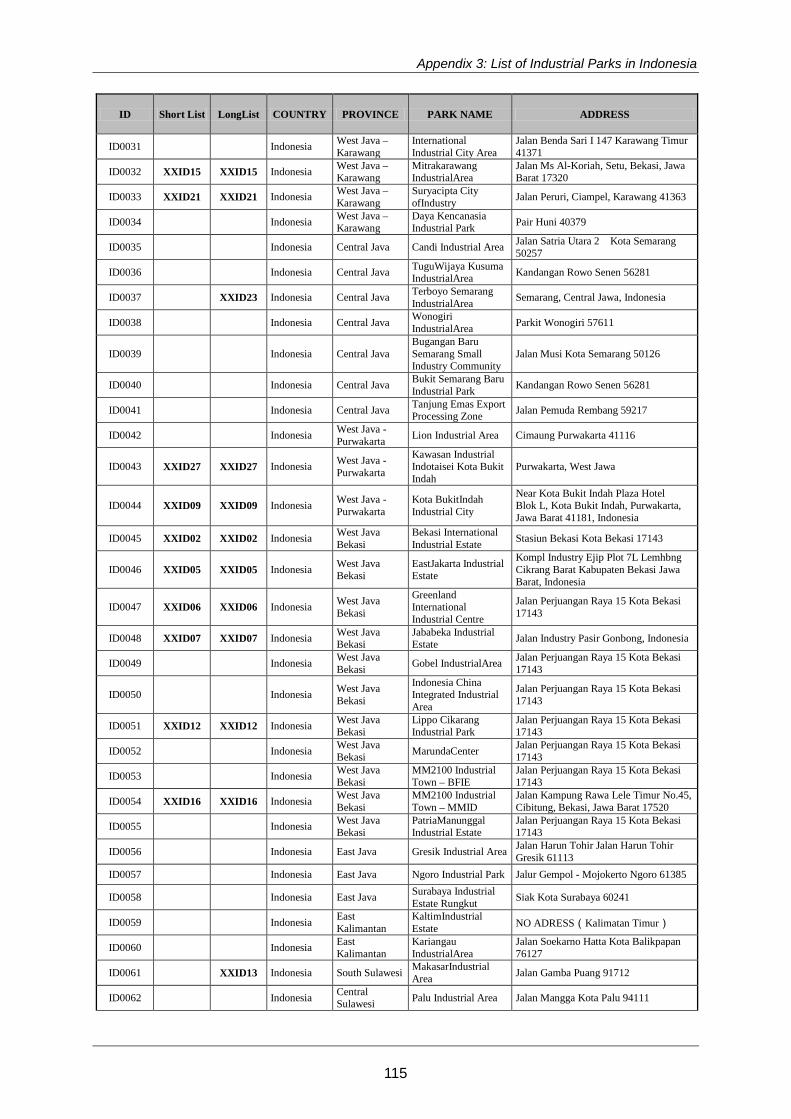
Appendix 3: List of Industrial Parks in Indonesia
ID Short List LongList COUNTRY PROVINCE PARK NAME ADDRESS
ID0031 Indonesia West Java – Karawang
International Industrial City Area
Jalan Benda Sari I 147 Karawang Timur 41371
ID0032 XXID15 XXID15 Indonesia West Java – Karawang
Mitrakarawang IndustrialArea
Jalan Ms Al-Koriah, Setu, Bekasi, Jawa Barat 17320
ID0033 XXID21 XXID21 Indonesia West Java – Karawang
Suryacipta City ofIndustry Jalan Peruri, Ciampel, Karawang 41363
ID0034 Indonesia West Java – Karawang
Daya Kencanasia Industrial Park Pair Huni 40379
ID0035 Indonesia Central Java Candi Industrial Area Jalan Satria Utara 2 Kota Semarang 50257
ID0036 Indonesia Central Java TuguWijaya Kusuma IndustrialArea Kandangan Rowo Senen 56281
ID0037 XXID23 Indonesia Central Java Terboyo Semarang IndustrialArea Semarang, Central Jawa, Indonesia
ID0038 Indonesia Central Java Wonogiri IndustrialArea Parkit Wonogiri 57611
ID0039 Indonesia Central Java Bugangan Baru Semarang Small Industry Community
Jalan Musi Kota Semarang 50126
ID0040 Indonesia Central Java Bukit Semarang Baru Industrial Park Kandangan Rowo Senen 56281
ID0041 Indonesia Central Java Tanjung Emas Export Processing Zone Jalan Pemuda Rembang 59217
ID0042 Indonesia West Java - Purwakarta Lion Industrial Area Cimaung Purwakarta 41116
ID0043 XXID27 XXID27 Indonesia West Java - Purwakarta
Kawasan Industrial Indotaisei Kota Bukit Indah
Purwakarta, West Jawa
ID0044 XXID09 XXID09 Indonesia West Java - Purwakarta
Kota BukitIndah Industrial City
Near Kota Bukit Indah Plaza Hotel Blok L, Kota Bukit Indah, Purwakarta, Jawa Barat 41181, Indonesia
ID0045 XXID02 XXID02 Indonesia West Java Bekasi
Bekasi International Industrial Estate Stasiun Bekasi Kota Bekasi 17143
ID0046 XXID05 XXID05 Indonesia West Java Bekasi
EastJakarta Industrial Estate
Kompl Industry Ejip Plot 7L Lemhbng Cikrang Barat Kabupaten Bekasi Jawa Barat, Indonesia
ID0047 XXID06 XXID06 Indonesia West Java Bekasi
Greenland International Industrial Centre
Jalan Perjuangan Raya 15 Kota Bekasi 17143
ID0048 XXID07 XXID07 Indonesia West Java Bekasi
Jababeka Industrial Estate Jalan Industry Pasir Gonbong, Indonesia
ID0049 Indonesia West Java Bekasi Gobel IndustrialArea Jalan Perjuangan Raya 15 Kota Bekasi
17143
ID0050 Indonesia West Java Bekasi
Indonesia China Integrated Industrial Area
Jalan Perjuangan Raya 15 Kota Bekasi 17143
ID0051 XXID12 XXID12 Indonesia West Java Bekasi
Lippo Cikarang Industrial Park
Jalan Perjuangan Raya 15 Kota Bekasi 17143
ID0052 Indonesia West Java Bekasi MarundaCenter Jalan Perjuangan Raya 15 Kota Bekasi
17143
ID0053 Indonesia West Java Bekasi
MM2100 Industrial Town – BFIE
Jalan Perjuangan Raya 15 Kota Bekasi 17143
ID0054 XXID16 XXID16 Indonesia West Java Bekasi
MM2100 Industrial Town – MMID
Jalan Kampung Rawa Lele Timur No.45, Cibitung, Bekasi, Jawa Barat 17520
ID0055 Indonesia West Java Bekasi
PatriaManunggal Industrial Estate
Jalan Perjuangan Raya 15 Kota Bekasi 17143
ID0056 Indonesia East Java Gresik Industrial Area Jalan Harun Tohir Jalan Harun Tohir Gresik 61113
ID0057 Indonesia East Java Ngoro Industrial Park Jalur Gempol - Mojokerto Ngoro 61385
ID0058 Indonesia East Java Surabaya Industrial Estate Rungkut Siak Kota Surabaya 60241
ID0059 Indonesia East Kalimantan
KaltimIndustrial Estate NO ADRESS(Kalimatan Timur)
ID0060 Indonesia East Kalimantan
Kariangau IndustrialArea
Jalan Soekarno Hatta Kota Balikpapan 76127
ID0061 XXID13 Indonesia South Sulawesi MakasarIndustrial Area Jalan Gamba Puang 91712
ID0062 Indonesia Central Sulawesi Palu Industrial Area Jalan Mangga Kota Palu 94111
115

Country Report
ID Short List LongList COUNTRY PROVINCE PARK NAME ADDRESS
ID0063 XXID22 Indonesia Batam Taiwan International Industrial Estate Jalan Jend. A. Yani Kota Batam 29433
ID0064 XXID10 Indonesia Banten - Cilegon
Krakatau Industrial Estate
Jalan Kh. Ahmad Dahlan 23 Kota Cilegon 42441
ID0065 XXID20 Indonesia East Java Pasuruan Industrial Estate Rembang
Jalan Kyai Haji Wachid Hasyim Kota Pasuruan 67116
ID0066 XXID24 Indonesia East Java Tuban Industrial Estate
PT Kawasan Industri Gresik, Jl. Tridharma 03 Gresik, East Java,Indonesia
ID0067 XXID26 XXID26 Indonesia West Java - Karawang
Karawang International Industrial City
Industri KIIC Karawang 41361, West Java, Indonesia
116

Appendix 4: General Investment Risk of Indonesia
Appendix 4: General Investment Risk of Indonesia (1) Political Risk
Indonesia is a republic headed by a president who is both head of state and
commander-in-chief of the armed forces. President Susilo Bambang Yudhoyono, a
former Army general, was re-elected for his second and final five-year term in July
2009. Yudhoyono heads the Partai Demokrat (PD), which has the most seats - 148 out
of 560 - in the legislature, the People's Representative Council. The PD is in coalition
with four of the largest Islamic political parties. The other main parties are Golkar,
which has 106 seats and is in the coalition, and the Indonesian Democratic
Party-Struggle (PDI-P) with 94 seats. Golkar was the dominant political party under
President Suharto, while former President Megawati Sukarnoputri heads the PDI-P.
These three main parties do not differ substantially in their political platforms and will
tend to favor populist policies ahead of elections, including raising subsidies.
President Yudhoyono relies heavily on businessman-turned-politician Abu Rizal Bakrie,
who is the head of Golkar, to push through politically sensitive laws. His support was
instrumental in pushing through the partial removal of oil subsidies earlier this year as
well as encouraging lower barriers for foreign investment. This is likely to continue
despite Bakrie's falling public popularity because of financial irregularities in his family
business as he retains the support of his party.
The military played a prominent role in politics under President Suharto. Since 1999, its
role in governing the country has decreased, formally ending in 2004. The military's
marginal political role makes a military coup unlikely.
The next presidential and parliamentary elections are scheduled for 2014. The ruling
PD has done poorly in opinion polls; due partly to President Yudhoyono's declining
popularity and multiple corruption scandals. The current president Yudhoyono is
constitutionally banned from seeking a third consecutive term and will therefore
stand aside ahead of the 2014 poll. There is no clear successor for Yudhoyono within
his party and the prospects of the ruling party are marginal at best. Meanwhile, the
PD's coalition partners, Golkar and the Indonesian Democratic Party of Struggle
(Partai Demokrasi Indonesia Perjuangan: PDI-P), have seen their support levels rising in
tandem with the reigning party's downfall. It is likely that one of these big secular
117

Country Report
parties, which have the required wealth and regional connections, will be forming the
next coalition government. Golkar has particular advantages in terms of wealth and
political networks. Gerindra, the largest newcomer to Indonesia's political scene, is
also a potential player in the making.
As a result of popular fear that domestic firms and workers will lose out to foreign
competition, Indonesian politicians have passed multiple populist indigenization
policies as elections have drawn near. These policies narrow the operating space for
foreign firms and increase local ownership requirements. Since 2011, such policies
have been passed in the retail, banking, mining and oil and gas sectors. If Golkar
comes to power in 2014, the enforcement of such policies is likely to be softened, and
new indigenization measures are less likely. Should PDI-P or Gerindra come to power,
this trend is likely to continue, if not accelerate.
(2) Economic Risk
Domestic demand propelled Indonesia to 15-year growth peak in 2011 and will
remain the key driver of the economy in the near term. On the back of strong
consumer and business confidence, household spending and investment should
continue to grow at a brisk pace despite persistent global headwinds. Thanks to
robust domestic demand, Indonesia's economy should clock in growth of 6.1% in 2013,
following last year's 6.2% expansion. Both private consumption and investment
continue to grow at a fast clip owing to rising incomes and inflows of foreign direct
investment as foreign firms seek to capitalize on the country's favorable
demographics and natural resources. Domestic demand is at some risk from the
government’s implementation of fuel subsidy cuts from 22 June 2013 on, although we
do not currently expect this to dramatically weaken demand it will certainly limit
upside surprises.
The Indonesian rupiah (IDR) has been the worst performing emerging market Asian
currency in 2012. To help bolster the rupiah's value, the central bank (BI), in August
2012, reduced terms for foreign exchange hedging contracts to one month from
three months and raised the floor for money market rates to 4% from 3.75% to absorb
excess rupiah liquidity. These measures combined with the extra liquidity from the US
Federal Reserve's quantitative easing that began in September 2012, helped the IDR
to appreciate slightly against the dollar. Despite this, by December 2012, the IDR had
depreciated to around 9,650 to the dollar, or by about 6.5% for 2012. However, a
118

Appendix 4: General Investment Risk of Indonesia
currency crisis is unlikely in the next year largely because foreign exchange reserves
totaled USD 110 billion in November 2012, covering around seven months of imports.
Moreover, at end-2011 domestic and external debt combined stood at 25% of GDP.
These favorable figures are probably underlying BI's tolerance of a declining rupiah.
For 2013, the government projects growth of around 6.6%, accounting for weaker
demand from European and the US.
BI has not introduced any capital controls recently, having put several measures in
place between 2008 and 2010. However, further capital controls would be likely if
external economic conditions were to again deteriorate. In late 2008, BI reacted to
possible currency speculation by requiring Indonesian nationals or firms purchasing
over USD 100,000 in foreign currency to provide evidence of the transactions
underlying the exchange. Foreign nationals and firms were limited to making
currency purchases over USD 100,000 only through spot transactions. In June 2010, the
government introduced further measures to make investors commit funds for longer
durations, stipulating that investors in the bank's debt paper must hold the bills for at
least 28 days. Bank Indonesia also widened spreads on its overnight deposit and
lending rates and began selling longer-dated SBIs.
Financing investment initiatives has become easier and less costly in the wake of
Indonesia's return to investment-grade sovereign credit rating status. Direct
investment inflows have been hitting record highs in 2011–2012, bearing witness to
Indonesia's growing appeal as an investment destination. These positive trends reflect
progress made in the past decade in improving the business environment and
reducing debt. The government has lowered corporate tax rates, modestly reduced
rampant tax evasion, eased red tape, introduced critical new legislation, and taken
concrete steps to clarify the regulatory environment. As a result, Indonesia has been
improving its standing in global competitiveness rankings. However, prevalent
corruption and infrastructure limitations remain key restrictions on foreign investment.
Foreign investors are often compelled to pay bribes or risk facing delays and other
impediments to their investments on both a national and a local level.
(3) Legal Risk
Indonesia's regulatory and legal environment can be opaque, incoherent, and
time-consuming. Laws are subject to inconsistent interpretation and enforcement,
119

Country Report
and many foreign investors see the unreliable legal environment as the main
challenge to starting a business in Indonesia.
The legal system is based on a combination of Roman-Dutch law, indigenous
customary law, and Islamic law. Since the country's independence in 1945,
government rhetoric has long promoted the continuing rationalization and
modernization of laws and regulations. Following the restoration of political stability
and the accession to power of Indonesia's first democratically elected government in
2004, there have been moves to revise significant portions of the legal framework.
These attempts are highlighted by four major amendments to Indonesia's Constitution
every year from 1999 to 2002, dealing with issues such as the decentralization of
authority from the central government to provincial and regional governments,
human rights provisions, and the creation of additional constitutional bodies such as
the House of Regional Representatives and the Constitutional Court.
Despite promises of legal reform, the judiciary remains weak and corrupt, and the
introduction of deregulation under the 2001 Autonomy Law has added further layers
of complicated rules and regulations for foreign investors to deal with. Provinces have
taken over responsibility for various regional-level legislation, including tax and the
handling of revenue from the extraction of natural resources. The central government
remains in charge of legislation in such areas as foreign policy, security, defense,
justice, and monetary/fiscal matters. The current government of President Yudhoyono
has prioritized the modernization of the legal system. It will, however, take some time
before the ramifications of these enhancements are felt and the complex legal
system is turned into a more efficient one. Entrenched corrupt business practices and
deficiencies in law enforcement are also likely to be much harder to remedy than
weaknesses in the legal system.
(4) Tax Risk
The Indonesian tax system is in the process of continuous reform, but progress has
been slow. The main sources of revenue, besides oil and gas, are income taxes –
personal and corporate. Indonesia has a high personal income tax rate and a
moderate corporate tax rate by regional standards. The corporate income-tax
reduction was concluded in January 2010. The system relies heavily on withholding
taxes, reflecting the difficulties in revenue collection. Tax evasion is a major problem
in Indonesia where the tax system works on a self-assessment basis and taxpayers are
120
Appendix 4: General Investment Risk of Indonesia
trusted to register, calculate their income generated and the tax payable, and report
to the tax office. The government therefore urgently needs to widen the tax base. The
decentralization process that commenced in 2001, allowing for more regional
autonomy, has resulted in a greater risk that additional taxes are levied at provincial
level. Improved budget allocation along with better public financial management
systems would lead to substantial efficiency gains on a regional level, while, on the
national level, efforts to improve tax administration and spending efficiency are a
priority. Currently, there is, however, little supervision of the tax office's activities and
corruption is perceived as rife in the Indonesian tax system.
(5) War Risk
Indonesia and Malaysia have a number of disputed maritime borders. The most
significant of these is the Ambalat maritime dispute. This surfaced in 2005 after oil
reserves were found in Ambalat, and both countries deployed naval forces to guard
the area. In 2008, Indonesia's Parliament lodged a protest against alleged territorial
violations by Malaysian troops in the area. Malaysia refers to oil blocks in the area as
ND6 and ND7, which are both partially within the disputed territory. Both countries
have awarded exploration rights to companies there. Malaysia awarded Shell Oil
and PETRONAS Carigali Sdn Bhd joint exploration rights in 2005, while Indonesia
awarded the Italian energy company ENI similar rights.
Despite this, military conflict between Indonesia and Malaysia over the Ambalat
dispute is unlikely, as economic and diplomatic relations have improved. In 2002, a
previous maritime dispute between the two countries concerning the Sipadan and
Ligitan Islands was resolved by the International Court of Justice in Malaysia's favor. It
is likely that the dispute will also be diplomatically resolved. Until then, protests by the
respective navies over encroachment by their counterparts across the disputed
boundary are probable. In 2010, Indonesia was considering the possibility of
managing the territory with Malaysia, with joint naval patrols. But this has not been
acted upon since. There is a moderate risk of naval skirmishes involving ramming, but
commercial vessels in the area are unlikely to be harassed.
Interstate conflict with East Timor is unlikely. Relations between Indonesia and East
Timor have improved significantly since the latter won independence, despite
accusations by East Timor that East Timorese rebels had crossed into Indonesia to seek
refuge in 2006. While Indonesia has admitted that a lack of military capacity means it
121

Country Report
is unable to monitor rebel movements across the common border effectively, it has
initiated joint patrols with East Timorese troops, particularly around East Nusa
Tenggara. Indonesia investment is also increasing in East Timor. In December 2012,
Indonesian state-owned PT Waskita Karya said that it will expand its operations in East
Timor in 2013.
(6) Terrorism Risk
There have been multiple large-scale Islamist militant attacks in Indonesia against
commercial properties that have resulted in significant property damage and loss of
life. Several of these attacks have targeted Western assets, including the 2002 and
2005 Bali bombings. There have been subsequent attacks on Western targets
including the 2009 Ritz-Carlton and Marriott attacks in Jakarta. Counterterrorist police
have since succeeded in disrupting various cells and killing or capturing key militants.
Further, we assess the new generation of militants will probably change this pattern.
Cells are now more dominated by new recruits that are less experienced and more
locally focused. These recruits have backgrounds in vigilante groups and are unlikely
to have trained in Afghanistan or the Philippines, reducing their capability to crude
IEDs. As they are less connected to the global jihadist movement, they are less likely
to follow the traditional jihadist target pattern, i.e. Western diplomatic and
commercial interests. Rather, target sets will probably include 'un-Islamic' assets
(including alcohol and music stores, bars and nightclubs), security forces, local
government assets and central and local government officials perceived to be
opposed to an Islamic state. Overall, this reduces the risk to commercial assets such
as hotels and shopping malls, which fall outside the target set of most cells. Areas
likely to be targeted include Cirebon, Poso, Ambon, Makassar and the urban areas of
Java. Groups which do target Western diplomatic assets lack the capability, unity
and organization to successfully carry out attacks.
Separately, in Papua, there is a low-intensity separatist conflict headed by the Free
Papua Movement (OPM) which is likely to target the US-based mining firm
Freeport-McMoRan's Grasberg mine. OPM militants are likely to mount road
ambushes targeting migrant workers. In September 2012, suspected OPM militants
fired at Freeport Indonesia buses carrying mine employees on two occasions, but
injured no one. Since February 2012, the military has been providing support in
securing the Grasberg mine area, mitigating the risk posed by separatists slightly.
122
Appendix 4: General Investment Risk of Indonesia
(7) Civil Unrest Risk
Protests in Indonesia occur frequently and are driven by a wide range of issues.
Land-related protests are likely to increase after President Yudhoyono implemented
regulations forcing landowners to sell for infrastructure construction in August 2012.
Infrastructure projects have stalled over land disputes and experience protests once
they are completed. In December 2012, a few dozen farmers protested against the
government in Pahlawan, Central Java, after they were forced to leave their land to
make way for the Logung dam in kudus Regency. Palm oil and biofuel cultivation are
a probable source of land-related protests. Biofuel production increased to 1.52
billion from 781 million liters in 2011 year-on-year. This is expected to reach 2.2 billion
liters in 2013. Thousands in East Kalimantan in June 2012 protested against a palm oil
company's plans to clear their land to make way for a plantation.
Mining-related protests are likely to increase and become more violent as a surge in
illegal mining and mining permits awarded without the consent of locals becomes
politicized in the 122 local elections taking place in 2013. In December 2012, the
police identified 900 likely hotspots for conflict between miners and locals across the
country. Mine protests are likely in Sumbawa, Papua, Sulawesi and North Sumatra.
Protests against perceived insults to Islam are also probable. Although these are
normally peaceful, they become violent occasionally and pose an elevated risk of
property damage. In September 2012 protesters in Jakarta threw bricks and Molotov
cocktails at the US embassy after the release of an US-made anti-Islamic video. In
Medan, protesters forcibly closed McDonalds and KFC branches. There is also an
elevated risk of communal unrest based on religious differences. Such events are
exacerbated by the Blasphemy Laws that protesters perceive validate their actions.
In August 2012, 1,000 people attacked homes belonging to members of a minority
Muslim sect in Sukabumi. Such unrest is unlikely to affect commercial assets.
Volatility in the price of commodities is likely to trigger protests. The police, in March
2012, deployed around 14,000 personnel to control thousands of protesters marching
on the Presidential Palace in Jakarta after a fuel price increase was announced.
Protesters also occupied Polonia International Airport for five hours, disrupting flights.
The protests remained peaceful throughout, but further protests over fuel prices have
the potential to turn violent.
123

Country Report
Generally, national level, industry-wide strikes are unlikely, but reform to labor laws,
likely after 2014 elections, is likely to lead to protests lasting a day or two in multiple
cities. More often, there are day-to-day contract negotiations, strikes and protests at
the factory or work-site level. These normally involve local grievances ranging from
the availability of free cigarettes to workers to unpaid wages. The number of strikes
has gradually increased since the end of the Suharto era in 1998, but the right under
the law to fire striking workers gives employers an advantage during industrial action.
Further, while the number of employees in some sectors is large (e.g. 200,000
employed in the timber sector in Kalimantan alone), the low-skilled nature of their
occupations leaves them little bargaining power. And so although strikes may be
more frequent, wide-scale industrial action is rare due to workers' dependence on
daily wages and their weaker bargaining position, reducing business disruption risks.
(8) Infrastructure Risk
A lack of investment in infrastructure since the Asian Financial Crisis means that
infrastructure limitations are increasingly undermining Indonesia’s competitiveness
and ability to attract foreign investment. Despite strong recent economic growth,
there are significant factors that will hinder a sector-wide turnaround in the
infrastructure sector in the next five years. Public opposition to hikes in fares is likely to
constrain the government's options for privatizing key rail, marine and aviation
facilities and utilities operators ahead of elections in 2014. Further, allowing utilities
providers to set their own tariffs would be a major indicator of political will to reform
the power sector; however, the decision not to raise electricity rates in 2011 suggests
that this is also unlikely prior to 2014.
Another factor contributing regulatory uncertainty is that while new legislation, such
as the Railway Law and Electricity Law, is aimed at dismantling underperforming state
infrastructure monopolies, this has yet to be accompanied by clear implementing
regulations and procedures which facilitate the entry of private investors. The
government intends to draw USD 47.3 billion from public private partnerships up to
2014, but the formula is still largely untested. In the last decade, only USD 2 billion has
been realized in new investments from these projects. The outlook for change is
therefore likely to be characterized by sustained but gradual improvements in
infrastructural performance and national/international connectivity, as
poorly-managed and inadequately funded state-owned enterprises dominate the
124

Appendix 4: General Investment Risk of Indonesia
infrastructure sector up to 2014. Other key issues that are likely to derail or at least slow
down the implementation of projects include land acquisition disputes and delays
caused by communal protests.
Roads: The existing road infrastructure compares unfavorably with neighboring
countries, particularly in rural areas. Travel by road is the primary means of passenger
and cargo transportation in Indonesia, but Indonesia’s road density is lower than its
regional peers, including the Philippines, Malaysia, Thailand and Vietnam, at just over
0.2 km per km². Furthermore, of the country’s 437,759 km of roads, just under 60% are
paved (against 99% in Thailand and 81% in Malaysia). Road development has been
outstripped by vehicle sales, which numbered roughly 1 million cars and 3.5 million
motorcycles per year over the last decade. This has led to increasing stress on the
quality of roads and bottlenecks across the country. Costs to business are significant
due to additional maintenance, accidents and time constraints incurred. As a result,
goods transportation is on the whole inefficient and costly when compared to other
Asian countries. Given that approximately 70% of freight is transported by trucks,
Indonesia’s road infrastructure is an impediment to trade and investment, with
implications for a number of sectors. Local disputes over land rights constrain efforts to
improve road infrastructure.
Rail: Indonesia’s rail network is among the worst performing networks in the region.
Indonesia has 5,824 km of railway tracks, making it the longest network in Southeast
Asia. With only 4,337 km in operation, however, the sector has been severely
neglected. Annual growth of rail has been only 4% for the last 25 years. As a result,
performance is low due to poor and dated facilities. Tracks, signals and
telecommunications systems are old and in bad shape, which also contribute to a
high accident rate. Delays are frequent due to the poor quality of infrastructure,
which needs continual attention. Locomotive upgrades and repairs take 30 days on
average to complete, in comparison to modern standards which take 7-10 days. As
such, rail shoulders only a modest part of the burden placed on overland transport,
accounting for 17% and just 0.6% of passenger and freight transport respectively. By
far the greatest application of rail passenger transport is in Java, where two
long-distance routes link Jakarta with Surabaya and Yogyakarta and shorter routes
link the capital with Bandung and Cirebon.
125

Country Report
Ports: Indonesia has some 111 commercial ports (with 25 major commercial ports),
614 non-commercial ports and about 1,000 private ports that deal with specialized
cargo such as specific commodities. The commercial ports are managed by the
state-owned port operator PT Pelabuhan Indonesia (Pelindo), which is divided into
four separate jurisdictions across the country. These Indonesian Port Corporations
(IPCs) have long maintained a national monopoly over port authority and the
provision of services. Private management is limited to a handful of foreign
companies involved in joint-ventures with the regional state-run operators (known as
Pelindos). Privatization is a slow process, and any major restructuring of port
operations will likely increase the risk of strikes and protests by port unions. Despite
their importance, Indonesia’s public ports suffer from a significant shortfall in capacity,
and are slow and expensive to use compared to other Asian economies. Congestion
is a major concern, with ships running through Indonesia’s main ports facing long
waiting times, spending less than half of their turnaround time actually working. Also,
the cost of shipping a 40 foot container from Padang (West Sumatra) to Jakarta is
estimated at USD 600, whereas the cost of transporting the same container over the
greater distance between Jakarta and Singapore costs USD 185. These expenses are
compounded by poor transport logistics around ports and limited dry port
infrastructure which inhibit the movement of cargo in and out of ports. Logistically, a
major constraint is the centralization of shipping around a small number of container
ports, meaning that cargo in and out of remote islands has to be transshipped
through a central hub, typically a port in Java.
Airports: Despite public private partnership initiatives, most airports have not seen
major investments in decades and are struggling to keep up with increasing demand.
There are presently 210 airports in Indonesia, of which some are overseen by
state-owned PT Angkasa Pura. Some smaller airports are operated separately
through local governments or the Ministry of Transportation. There are some PPPs
underway, but overall private uptake in airport projects has been limited. Freight
transportation by air is relatively underdeveloped, and consists mostly of the shipment
of perishable goods, much of which is trans-shipped via Singapore. On the other
hand, between 2002 and 2006, passenger transport increased five-fold.
Power: Indonesia has an installed electricity generation capacity of around 44.5 GW.
Some 57% of this is owned by the state-owned provider Perusahaan Listrik Negara
(PLN), which, until the government passed its electricity law in 2009, was the sole
126

Appendix 4: General Investment Risk of Indonesia
provider of power in the country. The remaining share is accounted for by the 10,000
or so industrial and manufacturing units that see to their own power supply. Electricity
production is heavily dependent on non-renewable feedstock, which is vulnerable to
external price shocks (as in the case of diesel fuel) or entails an opportunity cost in
terms of the non-export of domestic resources (as with natural gas). Indonesia’s
electricity sector is beset by inadequate capacity and inefficient transmission and
distribution infrastructure. Electrification rates are lower than elsewhere in Southeast
Asia, with large disparities by province. Having not seen substantial investment in
decades, most power plants, the majority of which are located in Java, are
inefficient, meaning that actual production falls far short of PLN’s generating
capacity. However, in areas where electricity is more readily available (e.g. Jakarta),
subsidization encourages increased consumption by domestic and industrial
consumers, and electricity demand has increased by roughly 7% annually over the
last few years. Many businesses already regard poor electricity supply as a major
hindrance to their operations.
Water: Water supply is increasingly compromised by pollution, poor management
and the low level of state and private investment in the sector. The use of water in the
agricultural sector accounts for 58.5% of consumption, and this, along with rising
industrial and domestic consumption is putting significant pressure on supply. Water
use was calculated at 591 billion liters/day in 2005 and is forecast to rise to 1,131 billion
liters by 2015. Demand in Jakarta is growing, with the city needing an additional 13%
supply by 2012. Piped water is available to just 24% of the population, but even in
Jakarta some 35% of residents are reliant on other sources such as ground water,
which may be contaminated, or bottled water, which comes at a considerable cost.
The outlook for supply is deteriorating, as rising sea levels threaten coastlines and pose
the risk of fresh water salinization. Similarly, water degradation is an increasingly acute
problem as industry and the population expand, resulting in rivers effectively ending
up as disposal grounds for industrial and household waste.
127