Embed Size (px)
Citation preview

Department of Epidemiology &Biostatistics
School of Public Health, Xinjiang Medical University
Ethnic difference in blood pressure in Xinjiang Han, Uygur and Kazak
children and adolescents
Yan WL, Ma Jinfeng, Wang Qian, Dai JH, Yao H, Yang XY, Zheng YJ
Corresponding: Weili Yan 严卫丽 [email protected]
Tel&Fax: 0991-4366351
Department of Epidemiology &Biostatistics School of Public Health, XJMU
Ethnicities in Xinjiang
Uygur Kazak
38%
46%
3%
13%
Background
1. The risk of common complex diseases, essential
hypertension, type 2 diabetes and obesity differs
among Uygur and Kazak adult populations. (1)
2. Ethnic difference in fat distribution was observed
between Uygur and Kazak adult populations. (1)
3. Ethnic difference in BMI levels and prevalence of
overweight and obesity in pediatric populations (2)
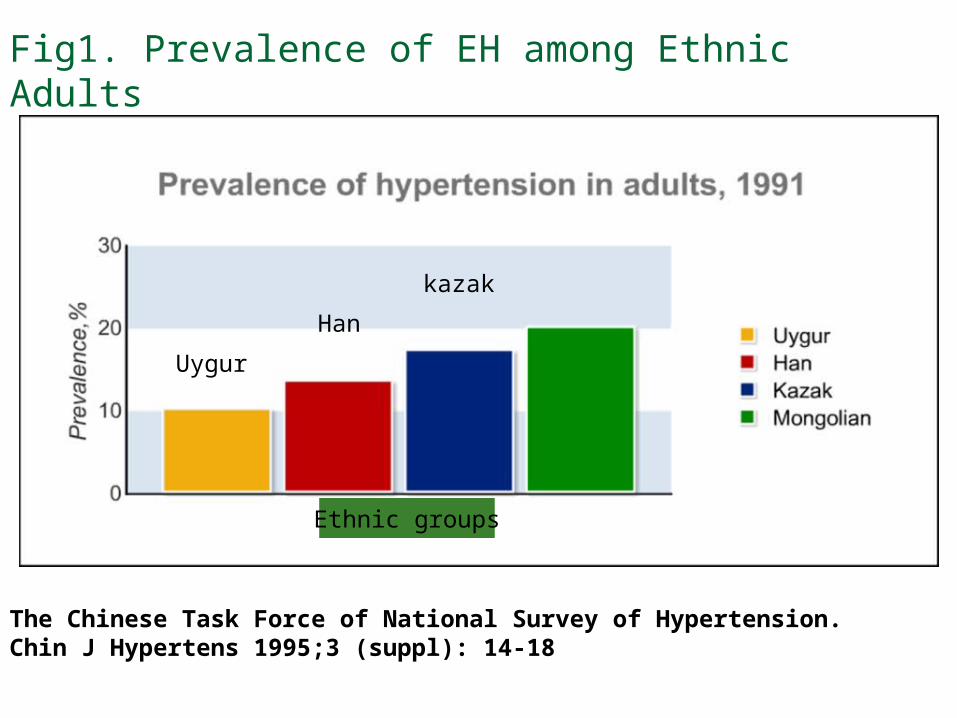
Fig1. Prevalence of EH among Ethnic Adults
The Chinese Task Force of National Survey of Hypertension. Chin J Hypertens 1995;3 (suppl): 14-18
kazak
Uygur
Han
Ethnic groups
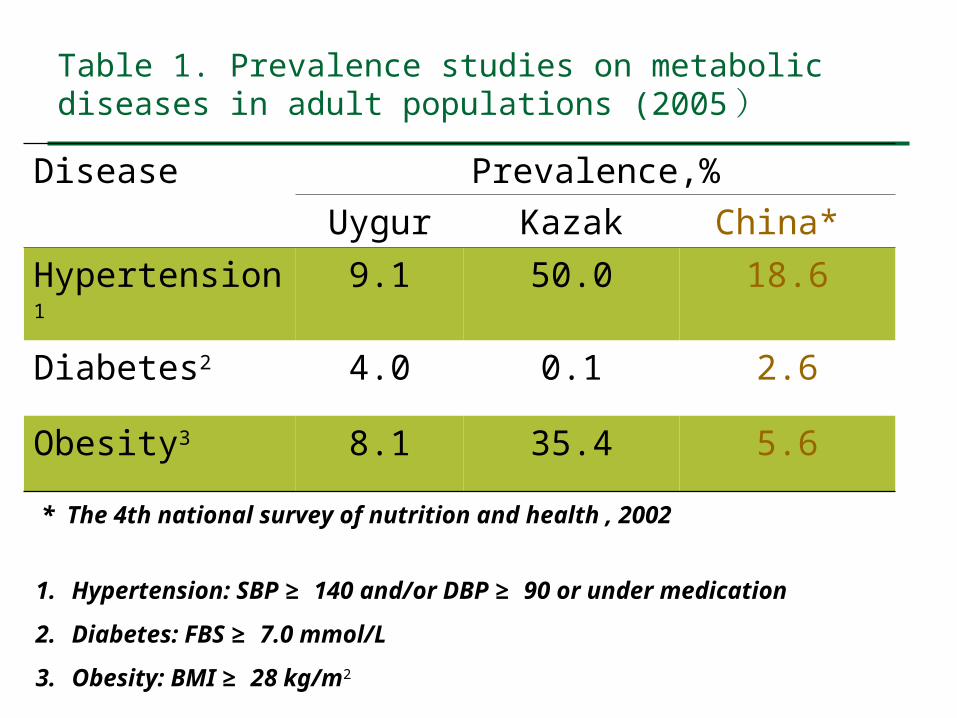
Table 1. Prevalence studies on metabolic diseases in adult populations (2005 )
Disease Prevalence,%
Uygur Kazak China*
Hypertension1 9.1 50.0 18.6
Diabetes2 4.0 0.1 2.6
Obesity3 8.1 35.4 5.6
* The 4th national survey of nutrition and health , 2002
1. Hypertension: SBP ≥ 140 and/or DBP ≥ 90 or under medication
2. Diabetes: FBS ≥ 7.0 mmol/L
3. Obesity: BMI ≥ 28 kg/m2

Fig 2 . Age-adjusted prevalence of overweight&obesity in Han, Uygur, Kazak and Hui ethnic children and adolescents aged 7-18 (2004)
0.0
4.0
8.0
12.0
16.0
Pre
vale
nce,
%
obesity overw eight
Male
0.0
2.0
4.0
6.0
8.0
Pre
vale
nce,%
Obesity Overw eight
Female
Han Hui Uighur Kazak
The prevalence of obesity are 4.3%The prevalence of obesity are 4.3% , , 3.8%3.8% ,, 2.1%2.1% ,, and 0.2% for boys; and 0.2% for boys; as well as 1.4%as well as 1.4% , , 0.8%0.8% , , 0.5%0.5% , , and 0.15% for girls, defined by IOTF and 0.15% for girls, defined by IOTF cutoffs.cutoffs.
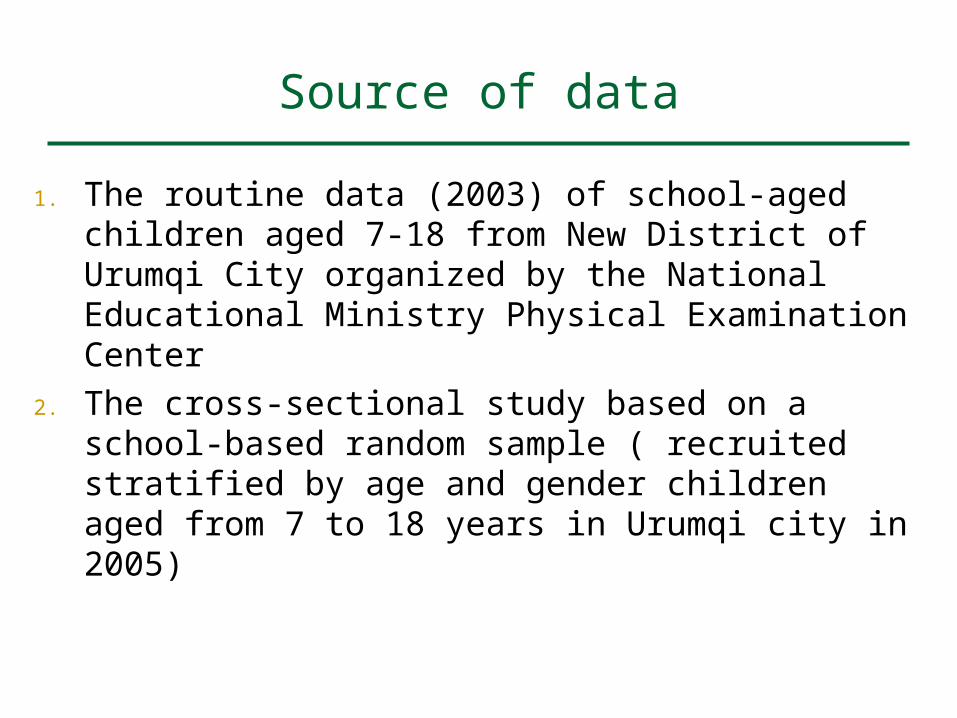
Source of data
1. The routine data (2003) of school-aged children aged 7-18 from New District of Urumqi City organized by the National Educational Ministry Physical Examination Center
2. The cross-sectional study based on a school-based random sample ( recruited stratified by age and gender children aged from 7 to 18 years in Urumqi city in 2005)
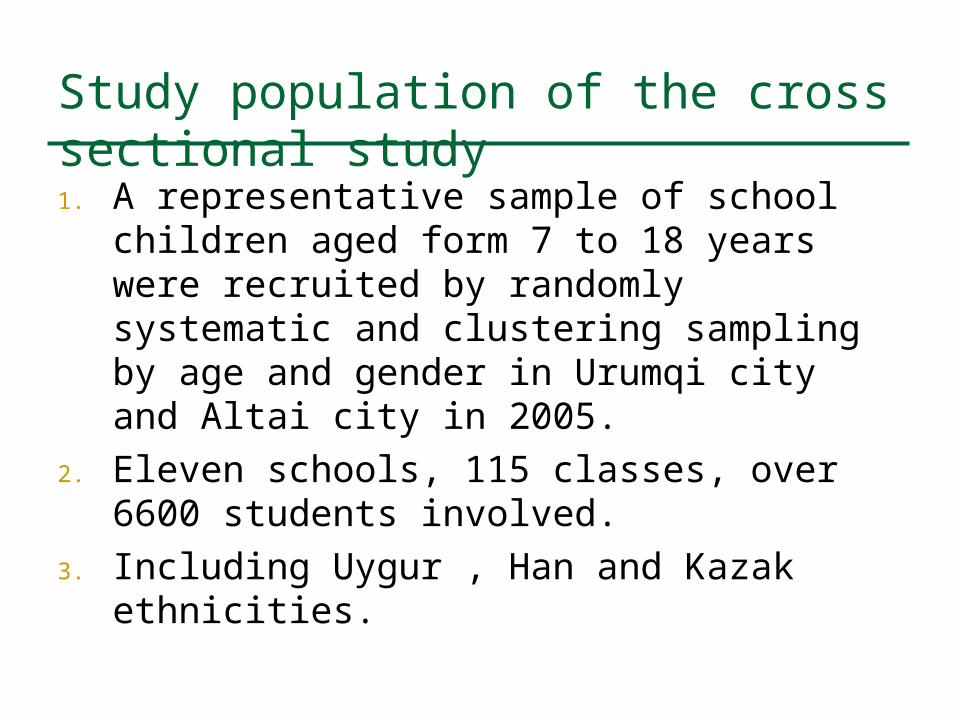
Study population of the cross sectional study1. A representative sample of school children
aged form 7 to 18 years were recruited by randomly systematic and clustering sampling by age and gender in Urumqi city and Altai city in 2005.
2. Eleven schools, 115 classes, over 6600 students involved.
3. Including Uygur , Han and Kazak ethnicities.
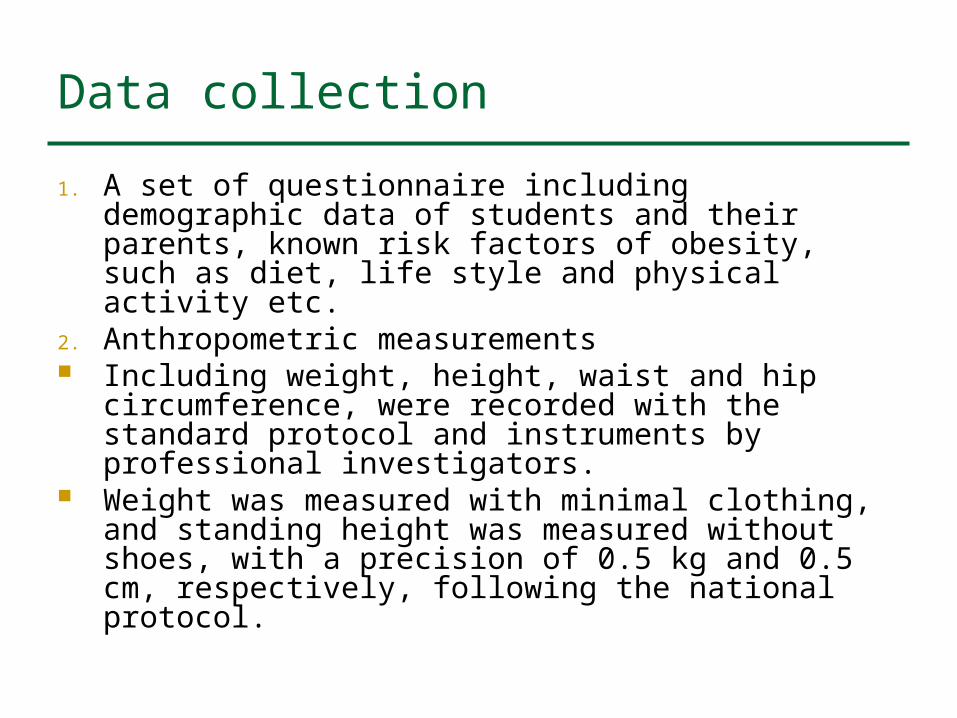
Data collection
1. A set of questionnaire including demographic data of students and their parents, known risk factors of obesity, such as diet, life style and physical activity etc.
2. Anthropometric measurements Including weight, height, waist and hip
circumference, were recorded with the standard protocol and instruments by professional investigators.
Weight was measured with minimal clothing, and standing height was measured without shoes, with a precision of 0.5 kg and 0.5 cm, respectively, following the national protocol.
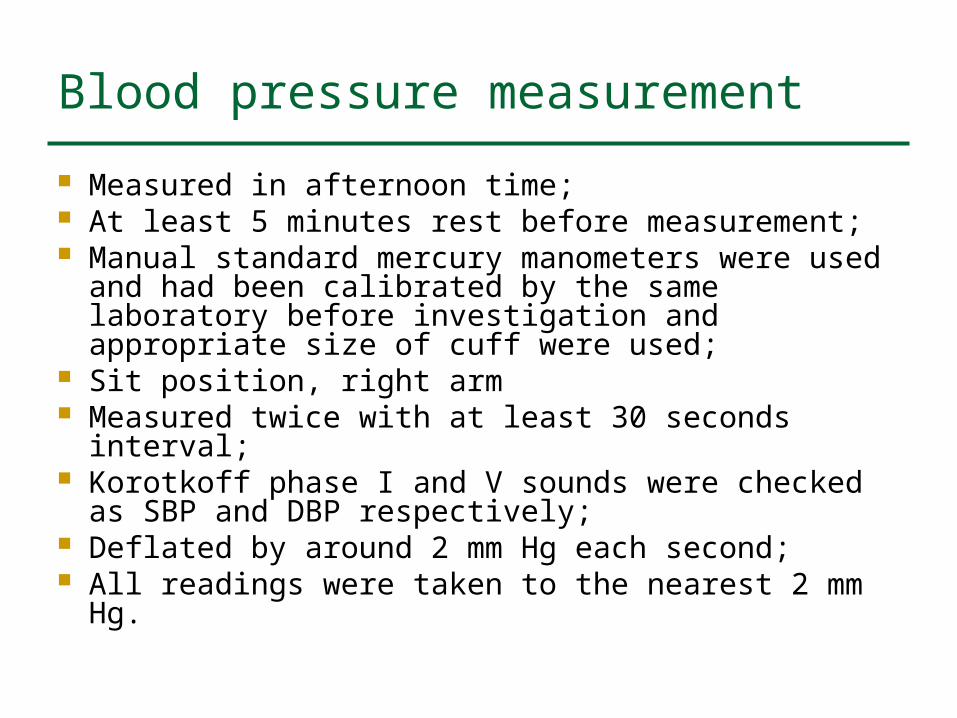
Blood pressure measurement
Measured in afternoon time; At least 5 minutes rest before measurement; Manual standard mercury manometers were used
and had been calibrated by the same laboratory before investigation and appropriate size of cuff were used;
Sit position, right arm Measured twice with at least 30 seconds interval; Korotkoff phase I and V sounds were checked as
SBP and DBP respectively; Deflated by around 2 mm Hg each second; All readings were taken to the nearest 2 mm Hg.

Is double measurement of blood pressure safe?-1A pilot study included 401 volunteers aged from 5-69
years
Age group n
5-10 115
11-17 190
18-69 100
Blood pressure were measured strictly by the standard protocol recommended by AHA.
We compared the average SBP and DBP from the first 2 measurements and the whole 3 measurements.
Is double measurement of blood pressure safe?-2
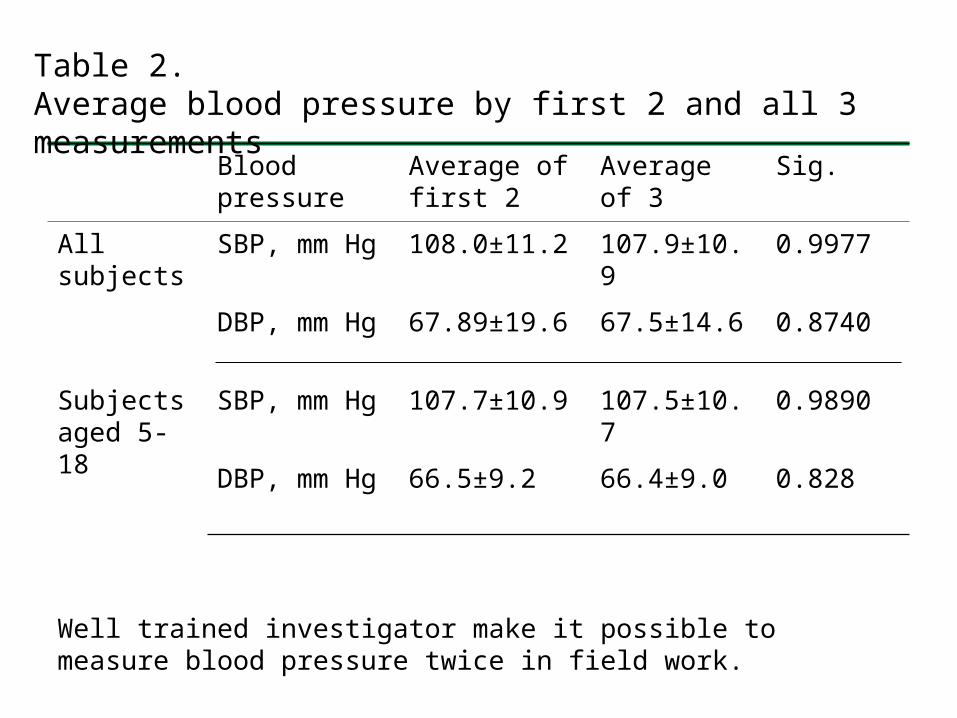
Table 2. Average blood pressure by first 2 and all 3 measurements
Blood pressure
Average of first 2
Average of 3 Sig.
All subjects SBP, mm Hg 108.0±11.2 107.9±10.9 0.9977
DBP, mm Hg 67.89±19.6 67.5±14.6 0.8740
Subjects aged 5-18
SBP, mm Hg 107.7±10.9 107.5±10.7 0.9890
DBP, mm Hg 66.5±9.2 66.4±9.0 0.828
Well trained investigator make it possible to measure blood pressure twice in field work.
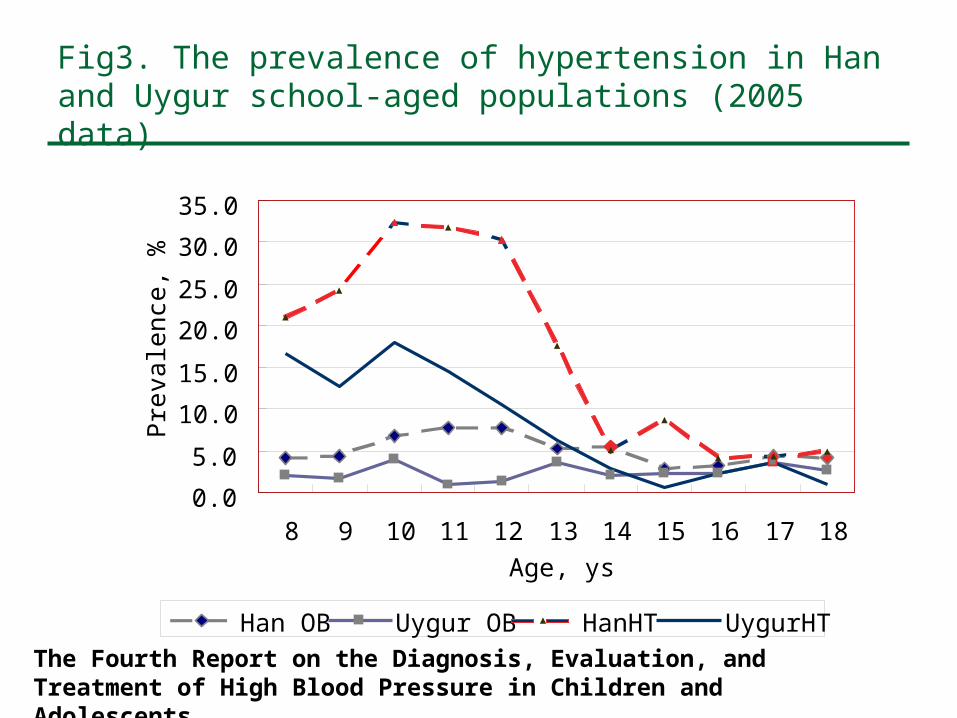
Fig3. The prevalence of hypertension in Han and Uygur school-aged populations (2005 data)
0.0
5.0
10.0
15.0
20.0
25.0
30.0
35.0
8 9 10 11 12 13 14 15 16 17 18Age, ys
Pre
vale
nce
, %
Han OB Uygur OB HanHT UygurHTThe Fourth Report on the Diagnosis, Evaluation, and Treatment of High Blood Pressure in Children and Adolescents
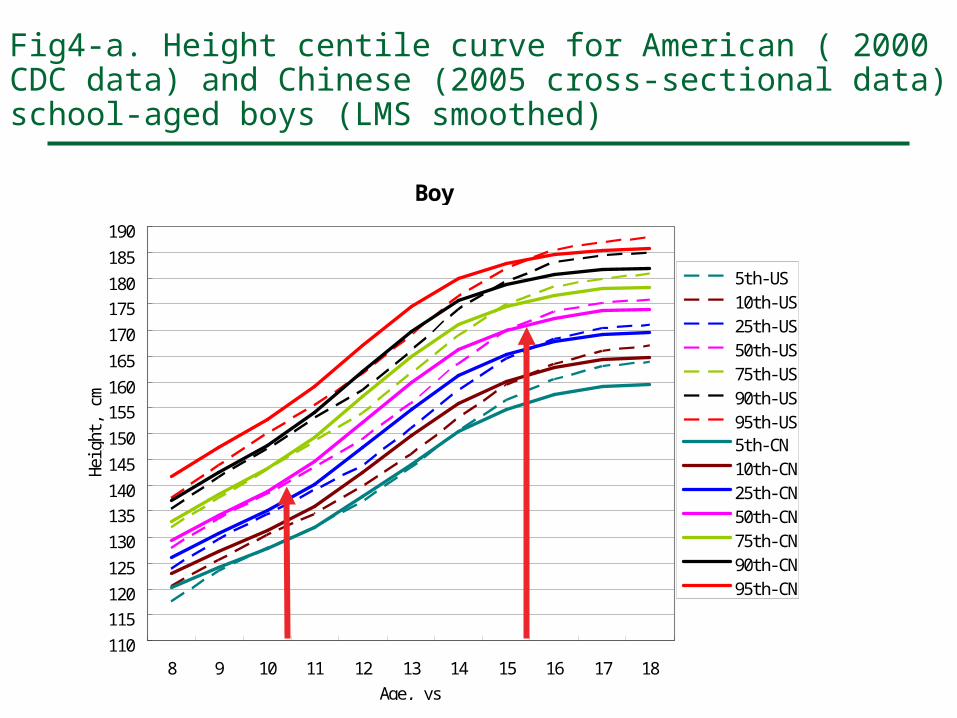
Fig4-a. Height centile curve for American ( 2000 CDC data) and Chinese (2005 cross-sectional data) school-aged boys (LMS smoothed)
Boy
110
115120
125
130
135140
145
150
155160
165
170
175180
185
190
8 9 10 11 12 13 14 15 16 17 18Age, ys
Heig
ht,
cm
5th-US10th-US25th-US50th-US75th-US90th-US95th-US5th-CN10th-CN25th-CN50th-CN75th-CN90th-CN95th-CN
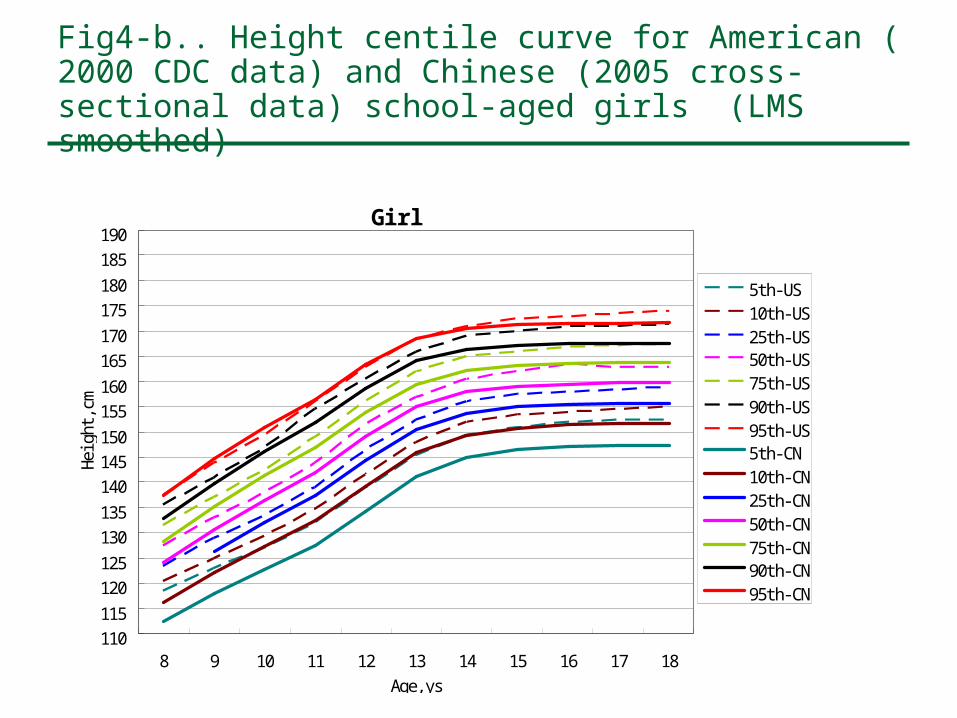
Fig4-b.. Height centile curve for American ( 2000 CDC data) and Chinese (2005 cross-sectional data) school-aged girls (LMS smoothed)
Gi rl
110115
120125
130135
140145150
155160
165170
175180
185190
8 9 10 11 12 13 14 15 16 17 18Age, ys
Heig
ht,c
m
5th-US10th-US25th-US50th-US75th-US90th-US95th-US5th-CN10th-CN25th-CN50th-CN75th-CN90th-CN95th-CN
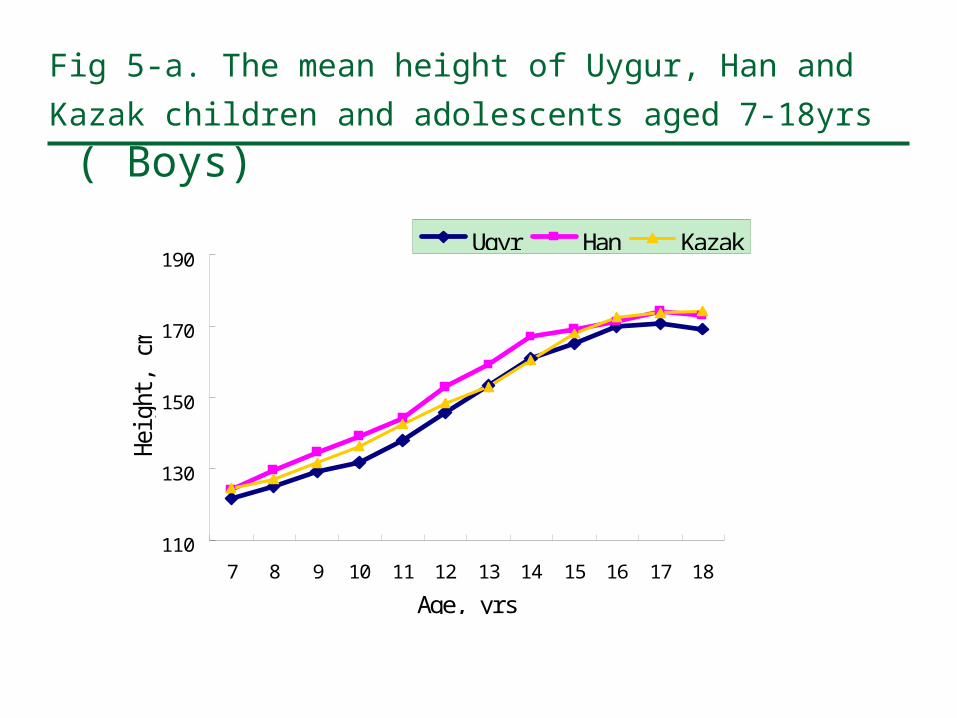
Fig 5-a. The mean height of Uygur, Han and Kazak children
and adolescents aged 7-18yrs ( Boys)
Femal e
110
130
150
170
190
7 8 9 10 11 12 13 14 15 16 17 18
Age, yrs
Heig
ht,
cm
Ugyr Han Kazak
Femal e
110
130
150
170
190
7 8 9 10 11 12 13 14 15 16 17 18
Age, yrs
Heig
ht,
cm
Ugyr Han Kazak
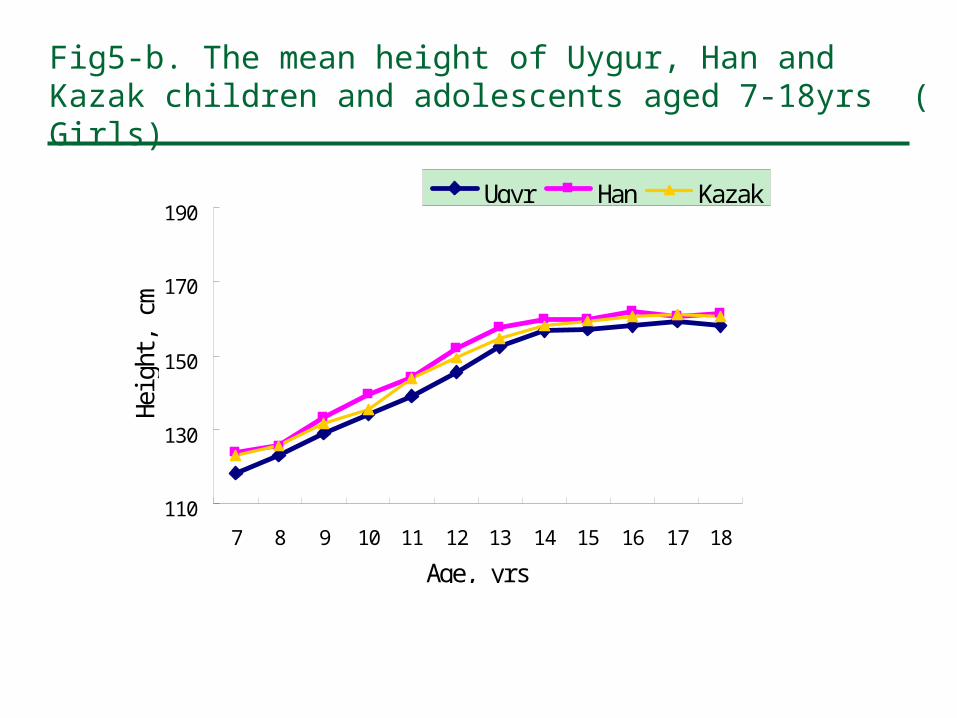
Fig5-b. The mean height of Uygur, Han and Kazak children and adolescents aged 7-18yrs ( Girls)

Mal e
105
106
107
108
109
110
Uygur Han Kazak
SBP,
mm
Hg
Femal e
102
103
104
105
106
107
Uygur Han Kazak
SBP,
mm
Hg
Fig 6. The mean SBP of Han, Uygur and Kazak children and adolescents adjusted by age and height, mm Hg
P<0.001 P<0.001
Male Female
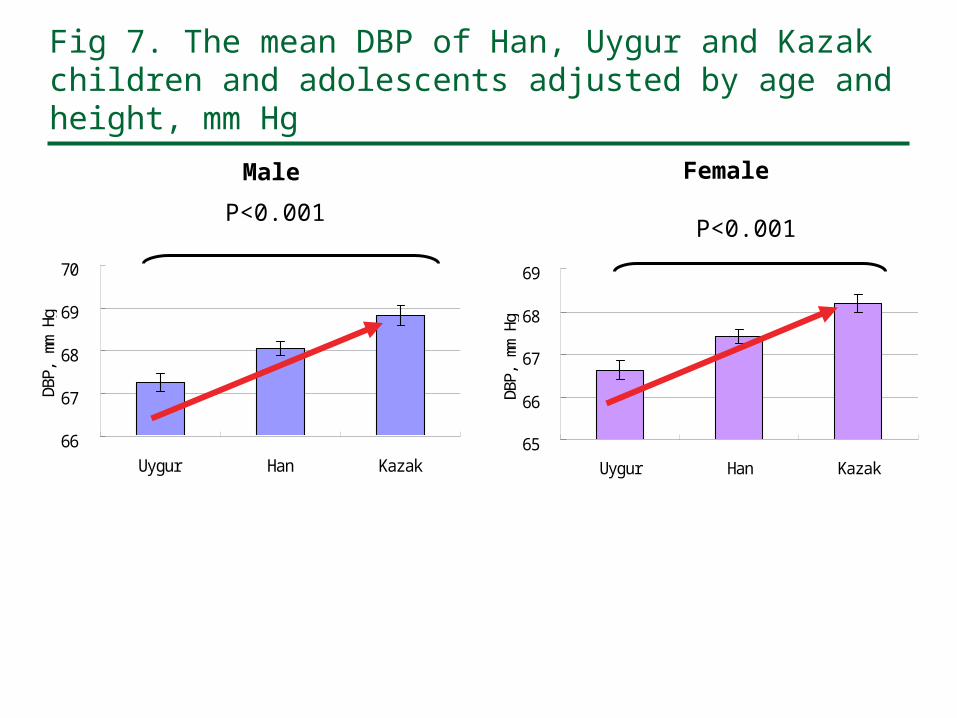
Fig 7. The mean DBP of Han, Uygur and Kazak children and adolescents adjusted by age and height, mm Hg
Mal e
66
67
68
69
70
Uygur Han Kazak
DBP,
mm
Hg
Femal e
65
66
67
68
69
Uygur Han Kazak
DBP,
mm
Hg
P<0.001P<0.001
Male Female
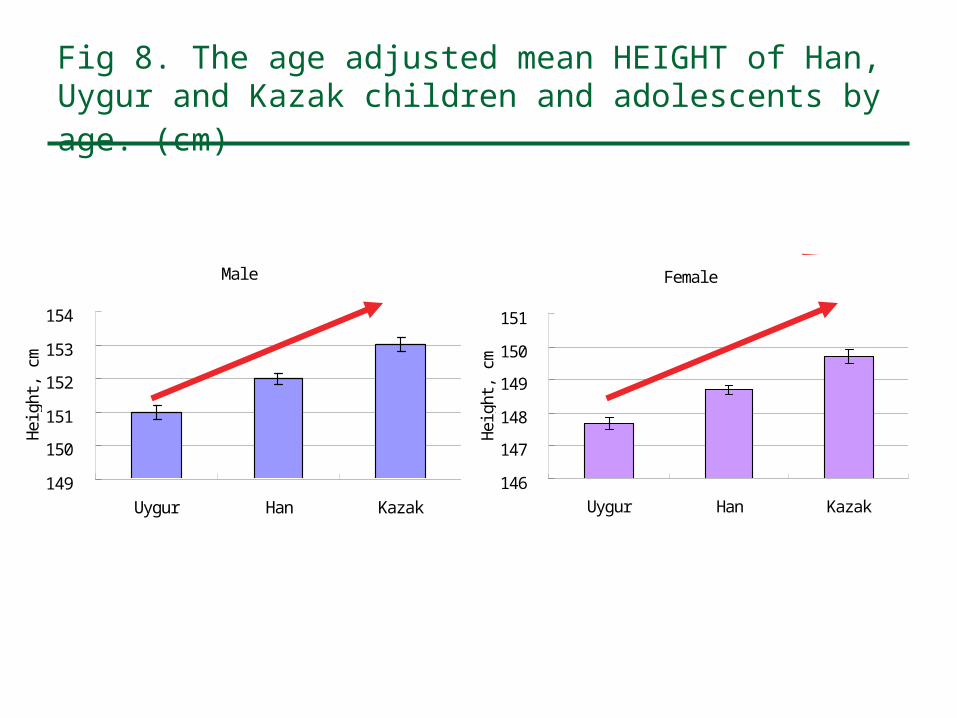
Fig 8. The age adjusted mean HEIGHT of Han, Uygur and Kazak children and adolescents by age. (cm)
Mal e
149
150
151
152
153
154
Uygur Han Kazak
Heig
ht,
cm
Femal e
146
147
148
149
150
151
Uygur Han KazakHe
ight
, cm
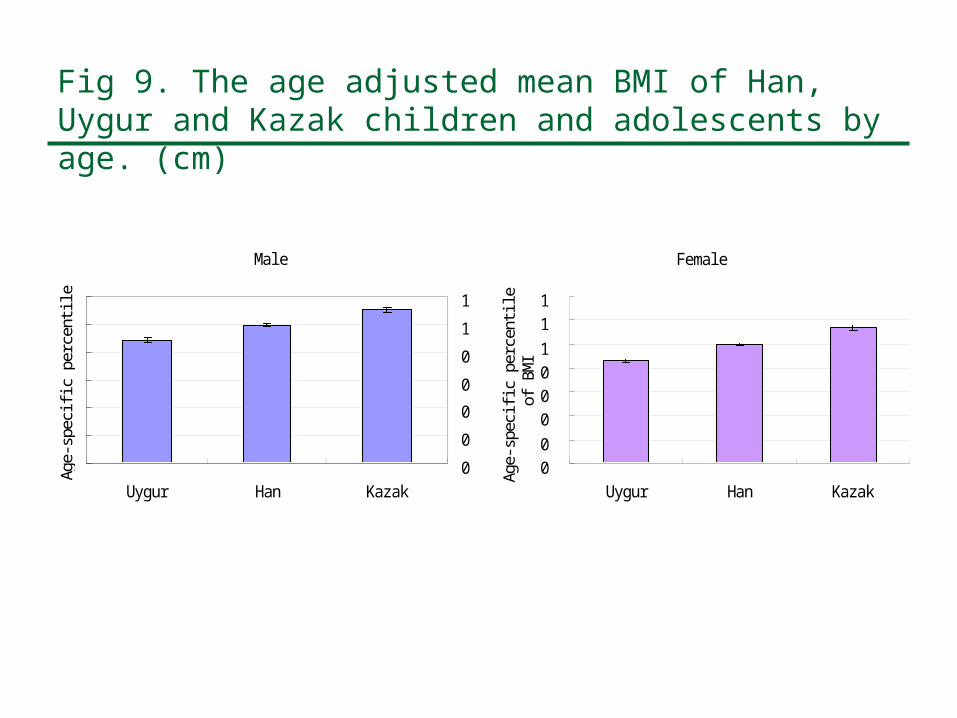
Fig 9. The age adjusted mean BMI of Han, Uygur and Kazak children and adolescents by age. (cm)
Mal e
0
0
0
0
0
1
1
Uygur Han Kazak
Age-
spec
ific
perc
enti
le
Femal e
00
0001
11
Uygur Han KazakAg
e-sp
ecifi
c pe
rcen
tile
of B
MI
Does the difference in height and BMI among ethnicities make the ethnic difference in blood pressure ?
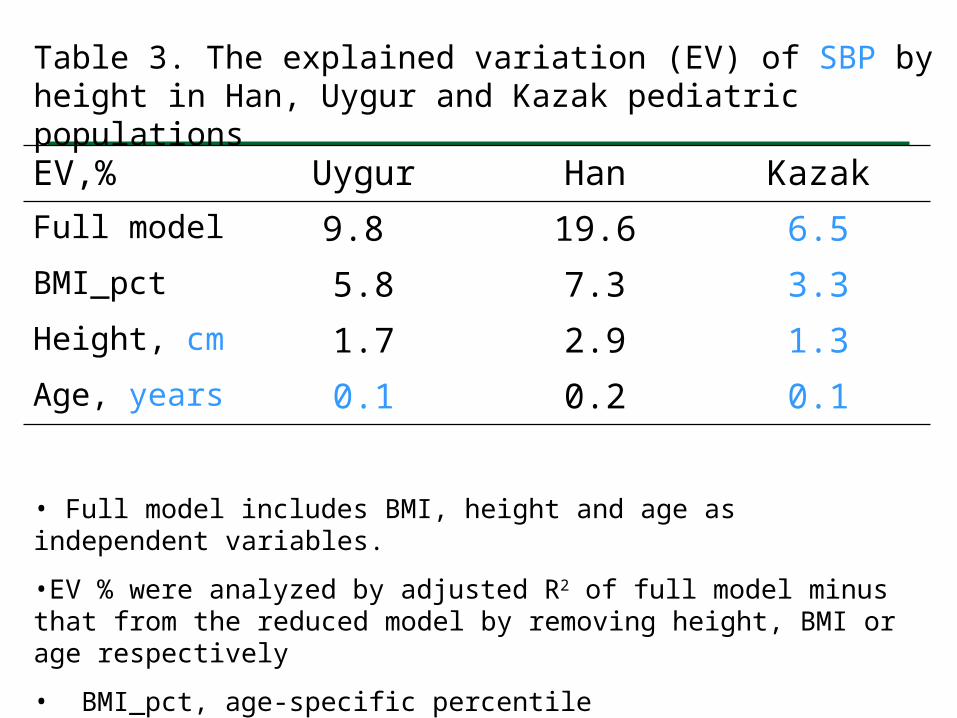
Table 3. The explained variation (EV) of SBP by height in Han, Uygur and Kazak pediatric populations
EV,% Uygur Han Kazak
Full model 9.8 19.6 6.5
BMI_pct 5.8 7.3 3.3
Height, cm 1.7 2.9 1.3
Age, years 0.1 0.2 0.1
• Full model includes BMI, height and age as independent variables.
•EV % were analyzed by adjusted R2 of full model minus that from the reduced model by removing height, BMI or age respectively
• BMI_pct, age-specific percentile

Table 4. The explained variation (EV) of DBP by height in Han, Uygur and Kazak pediatric populations
EV,% Uygur Han Kazak
Full model 2.0 3.1 5.8
BMI_pct 0.05 0.02 2.5
Height, cm 1.7 2.2 1.3
Age, years 0.07 0.0 2.4
• Full model includes BMI, height and age as independent variables.
•EV % were analyzed by adjusted R2 of full model minus that from the reduced model by removing height, BMI or age respectively
• BMI_pct, age-specific percentile

Conclusions-1
1. There is ethnic differences in SBP, DBP,
height and BMI among Uygur, Han and Kazak
school-aged children and adolescents.
2. Height, BMI and age explain greater variation
of SBP in Han but DBP in Kazak population
than that in the other two ethnic pediatric
populations.
3. The rest risk factors out of height, BMI and age, e.g., genetic factors, may contribute more to DBP levels but less to SBP in Kazak children than that in Uygur and Han counterparts.
Conclusions-2
References
1. Yan W, Yang X, Chen S et al. Ethnic Differences in Body Mass Index and Prevalence of Obesity in School Children of Urumqi City, Xinjiang, China. Biomed Environ Sci. 2006 Dec;19(6):469-73 .
2. Yan W, Yang X, Zheng Y, Ge D, Zhang Y, Shan Z, Simu H, Sukerobai M, Wang R. The metabolic syndrome in Uygur and Kazak population. Diabetes Care. 2005 , 28 ( 10 ): 2554-5.
Other published papers based on the same study sample3. Yan W, Yao H, Dai J, Chen Y, Cui J, Wang X. Waist
circumference cutoff points for Chinese children and adolescents.
Obesity. 2008;16(5):1687-1692
4. Yan W, He B, Wang X, et al. Waist-to-Height Ratio Is an Accurate
and Easier Index for Evaluating Obesity in Children and
Adolescents. Obesity (Silver Spring). 2007 Mar;15(3):748-52.
5. Yan W, Wang X, Yao H et al. Waist-to-height Ratio and BMI
Predict Different Cardiovascular Risk Factors in Chinese Children.
Diabetes Care. 2006; 29(12):2760-1.
6. Yan W, Gu D, Yang X, Wu J, Kang L, Zhang L. High-density
lipoprotein cholesterol levels increase with age, body mass index,
blood pressure and fasting blood glucose in a rural Uygur
population in China. J Hypertens. 2005;23 (11):1985-1989.

Thank you !