Embed Size (px)
Citation preview

EEG-Biofeedback and Epilepsy: Concept, Methodology and Tools for
(Neuro)therapy Planning and Objective Evaluation
Dissertation zur Erlangung des
akademischen Grades Doktor-Ingenieur (Dr.-Ing.)
vorgelegt der Fakultät für Informatik und Automatisierung
der Technischen Universität Ilmenau
von
Mehmet Eylem Kirlangic, M.S.
Tag der wissenschaftlichen Aussprache: 31.03.2005
1. Gutachter: Prof. Dr.-Ing. habil. G. Henning
2. Gutachter: Doz. Dr. med. habil. R. Both
3. Gutachter: Assoc. Prof. Dr. Y. Denizhan
urn:nbn:de:gbv:ilm1-2005000028

Acknowledgment
„You’re sure you want walk through this wall with me…? You know, for me it’s easy. Whatever happens, I am coming
home. But you are leaving home. 'True journey is return…' “1, Shevek (Dr.)2
It was a hard decision for a long journey at the beginning: Choice between paths… Uncertainties…
Insecurities… Finally, the decision was made; and probably, the more challenging path was taken.
The journey itself was not easier than the decision: Problems with a new language, a new culture, a
new climate and, certainly not the least, with all the repetitive bureaucratic procedures, which I had
to face, often alone, far away from home. The main motivation that helped be overcome all these
difficulties was my fascination with brain research. And now, the only thing I feel is the satisfaction
of being able to present the results of my work.
There are several people to whom I am thankful for making my journey a very pleasant one, despite
the difficulties. I would like to thank Prof. Günter Henning, my supervisor, for accepting me as his
Ph.D. student and for his support, tolerance and trust in me all through my studies. I would like to
thank Dr. Galina Ivanova, the leader of the NeuroCybernetics Research Group, not only for her
commitment and belief in our project, but also for her encouragement, supervision and scientific
competence. It is an ineffable pleasure for me to have contributed to her project, which has been
awarded with the Innovation Award 2004 for Biomedical Engineering given by the “Stiftung Familie
Klee”. I am sure she will continue to open further frontiers in the field.
I am thankful to Doz. Dr. med. habil. Reinhard Both, the head physician of the Neurology Clinic of
the Zentral Klinik Bad Berka, and to Prof. Diethard Müller of the Neurology Praxis Ilmenau, for the
support and consultations in medical aspects of my work. Without their cooperation and
contributions, the clinical applications would not have been possible.
There have been several interesting observations throughout my work, which lead me to concepts
such as complexity, cooperation, self-organization, and eventually to synergetics. I give very special
thanks to Prof. Hermann Haken, the founder of synergetics, for the time he had for me and for the
consultations and insightful discussions. His supervision helped me clarify and formulate my ideas.
I had the opportunity to present partial results of my work in various conferences. Hence, I could
discuss my findings with the international community and face further challenges. I would
especially like to thank the organizers of the International Non-linear Sciences Conference
1 Ursula Le Guin, The Dispossessed: An Ambiguous Utopia, p. 319, HaperCollinsPublishers, London,
1996.
2 The main character in the a.m. book who is a scientist and leaves his homeplanet (Anarres) to go to
another one (Urras) for his research.

Acknowledgment ii
(INSC2003) in Vienna and the contributors for the fruitful discussions. Special thanks go to the
organizing committee of the 25th International Epilepsy Conference (IEC) 2003, in Lisbon, for the
Conference Attendance Award, without which I would not have had the opportunity to share and
discuss my findings with the medical community.
I am grateful to Prof. Yagmur Denizhan, who introduced me to chaos theory during my M.S. studies
at the Bogazici University and guided me with her comments and remarks not only at the INSC2003
conference, but also in our other meetings at the IEEE International Conference on Acoustics,
Speech and Signal Processing (ICASSP2000), and the International Conference of the IEEE
Engineering in Biology and Medicine Society (EMBS2001) in Istanbul.
Doz. Dr. Rainer Knauf read the last version of my manuscript. He made comments and suggestions
at several points. I admire his supervision and thank him for his very helpful remarks.
The NeuroCybernetics Research Group taught me to work in a team with mutual support and
assistance. I thank all the members of the group for their contribution to our team spirit.
I acknowledge the support of the Deutscher Akademischer Austauschdienst (DAAD – German
Academic Exchange Service). Without this financial support, I would not have had the opportunity
to overtake the current topic as a Ph.D. thesis. I also appreciate the work and organization of the
Akademisches Auslandsamt (Foreign Students Office) of the Technische Universität Ilmenau.
Despite all the distance, my family was always by my side. Without them, their support and trust in
me, I would not have had the courage for this long journey. I would also like to thank
Mr. Arno Schewski, without whom the journey would not have even started, for his encouragement,
motivation and support.
Last but not the least, I would like to thank all the very nice friends I have gained in Ilmenau (‘da ist
der Himmel blau’3, although it is very often ‘grau’4) and in Germany for their hospitality and open-
mindedness. They all made my journey adventurous and very pleasant. Thank you!
The journey is now coming to an end, opening new paths and new challenges not only scientifically
but also personally. New decisions are waiting to be made. Surely, they will not be easier than the
ones at the beginning. Maybe further journeys are ahead, who knows, maybe, the true journey is,
indeed, return…
Ilmenau, June 2004 Mehmet Eylem Kirlangic
3 “Where the sky is blue”, a common description in German used for Ilmenau.
4 The color gray in German.

Abstract
Objective diagnosis and therapy evaluation are still challenging tasks for many neurological
disorders. This is highly related to the diversity of cases and the variety of treatment modalities
available. Especially in the case of epilepsy, which is a complex disorder not well-explained at the
biochemical and physiological levels, there is the need for investigations for novel features, which
can be extracted and quantified from electrophysiological signals in clinical practice. Neurotherapy
is a complementary treatment applied in various disorders of the central nervous system, including
epilepsy. The method is subsumed under behavioral medicine and is considered an operant
conditioning in psychological terms. Although the application areas of this promising
unconventional approach are rapidly increasing, the method is strongly debated, since the
neurophysiological underpinnings of the process are not yet well understood. Therefore, verification
of the efficacy of the treatment is one of the core issues in this field of research.
Considering the diversity in epilepsy and its various treatment modalities, a concept and a
methodology were developed in this work for increasing objectivity in diagnosis and therapy
evaluation. The approach can also fulfill the requirement of patient-specific neurotherapy planning.
Neuroprofile is introduced as a tool for defining a structured set of quantifiable measures which can
be extracted from electrophysiological signals. A set of novel quantitative features (i.e., percentage
epileptic pattern occurrence, contingent negative variation level difference measure, direct current recovery index,
heart rate recovery ratio, and hyperventilation heart rate index) were defined, and the methods were
introduced for extracting them. A software concept and the corresponding tools (i.e., the neuroprofile
extraction module and a database) were developed as a basis for automation to support the
methodology.
The features introduced were investigated through real data, which were acquired both in
laboratory studies with voluntary control subjects and in clinical applications with epilepsy
patients. The results indicate the usefulness of the introduced measures and possible benefits of
integrating the indices obtained from electroencephalogram (EEG) and electrocardiogram for
diagnosis and therapy evaluation. The applicability of the methodology was demonstrated on
sample cases for therapy evaluation. Based on the insights gained through the work, synergetics was
proposed as a theoretical framework for comprehending neurotherapy as a complex process of
learning. Furthermore, direct current (DC)-level in EEG was hypothesized to be an order parameter
of the brain complex open system. For future research in this field, investigation of the interactions
between higher cognitive functions and the autonomous nervous system was proposed.
Keywords: EEG-biofeedback, epilepsy, neurotherapy, slow cortical potentials, objective diagnosis,
therapy evaluation, epileptic pattern quantification, fractal dimension, contingent negative
variation, hyperventilation, DC-shifts, instantaneous heart rate, neuroprofile, database system,
synergetics.

Zusammenfassung (Abstract in German)
Die Epilepsie ist eine komplexe neurologische Erkrankung, die auf biochemischer und
physiologischer Ebene nicht ausreichend geklärt ist. Die Vielfalt der epileptischen Krankheitsbilder
und der Behandlungsmodalitäten verursacht ein Defizit an quantitativen Kenngrößen auf
elektrophysiologischer Basis, die die Objektivität und die Effizienz der Diagnose und der
Therapieevaluierung signifikant erhöhen können. Die Neurotherapie (bzw. EEG-Biofeedback) ist
eine komplementäre Behandlung, die bei Erkrankungen, welche in Zusammenhang mit
Regulationsproblemen des Zentralnervensystems stehen, angewandt wird. Obwohl sich die
Applikationen dieser unkonventionellen Methode erweitern, wird sie nach wie vor stark diskutiert,
da deren neuro- und psychophysiologischen Mechanismen wenig erforscht sind. Aus diesem Grund
ist die Ermittlung von Kenngrößen als elektrophysiologische Korrelaten der ablaufenden Prozesse
zur objektiven Einstellung und Therapievalidierung eines der Kernprobleme des
Forschungsgebietes und auch der vorliegenden Arbeit.
Unter Berücksichtigung der aktuellen neurologischen Erkenntnisse und der durch Untersuchungen
an Probanden, sowie an Epilepsie-Patienten gewonnenen Ergebnisse, wurden ein Konzept und eine
Methodologie entwickelt, um die Objektivität in der Diagnose und Therapieevaluierung zu erhöhen.
Die Methodologie basiert auf einem Neuroprofil, welches als ein signalanalytisches
mehrdimensionales Modell eingeführt wurde. Es beschreibt einen strukturierten Satz
quantifizierbarer Kenngrößen, die aus dem Elektroenzephalogramm (EEG), den ereignisbezogenen
Potentialen und dem Elektrokardiogramm extrahiert werden können. Als Komponenten des
Neuroprofils wurden neuartige quantitative Kenngrößen (percentage epileptic pattern occurrence,
contingent negative variation level difference measure, direct current recovery index, heart rate recovery ratio,
hyperventilation heart rate index) definiert und die Methoden zu deren Berechnung algorithmisiert. Die
Anwendbarkeit der Methodologie wurde beispielhaft für die Evaluierung von Neurotherapien an
Epilepsie-Patienten demonstriert. Als Basis für eine zukünftige Automatisierung wurden ein
Softwarekonzept und entsprechende Tools (neuroprofile extraction module und die Datenbank
„NeuroBase“) entwickelt. Der Ansatz erfüllt auch die Anforderungen der patientenspezifischen
Therapieplanung und kann auf andere Krankheitsbilder übertragen werden.
Durch die neu gewonnenen Erkenntnisse wurde die Synergetik als ein theoretischer Rahmen für die
Analyse der Neurotherapie als komplexer Lernprozess vorgeschlagen. Es wurde die Hypothese
aufgestellt, dass das Gleichspannungsniveau im EEG ein Ordnungsparameter des Gehirn ist, wobei
das Gehirn als ein komplexes offenes System betrachtet wird. Für zukünftige Forschungen auf dem
Gebiet wird empfohlen, die Wechselwirkungen zwischen den höheren kognitiven Funktionen und
dem autonomen Nervensystem in diesem Kontext zu untersuchen.
Schlüsselwörter: EEG-Biofeedback, Epilepsie, Neurotherapie, langsame kortikale Potentiale,
objektive Diagnose, Therapieevaluierung, epileptische Musterquantifizierung, Fraktal Dimension,
Kontingent negative Variation, Hyperventilation, DC-Verschiebung, momentane
Herzschlagfrequenz, Neuroprofil, Datenbanksystem, Synergetik.

Özet (Abstract in Turkish)
Birçok nörolojik bozuklukta, vak’aların ve tedavi yöntemlerinin çeşitliliği, nesnel tanı ve tedavi
değerlendirmelerini güçleştirmektedir. Özellikle epilepsi gibi, gerek biyokimyasal gerekse fizyolojik
düzlemlerde yeterince açıklanamamış rahatsızlıklarda, elektrofizyolojik sinyallerden elde
edilebilecek yeni nesnel parametrelere ihtiyaç duyulmaktadır. Davranışsal tedavi olarak
sınıflandırılıp psikoloji terimiyle ‘aletli koşullanma’ olarak tanımlanan nöroterapi, epilepsi de dahil
olmak üzere merkezi sinir sisteminin regülasyon bozukluklarında kullanılan bir yöntemdir.
Uygulama alanları giderek yaygınlık kazanmakla birlikte, nörofizyolojik temelleri henüz açıklık
kazanmadığından, bu yöntemin geçerliliği büyük ölçüde tartışılmaktadır. Dolayısıyla, nöroterapinin
etkinliğinin saptanması bu araştırma alanının önemli konularındandır.
Bu çalışmada, epilepsi hastalığının ve tedavi yöntemlerinin çeşitliliği göz önünde tutularak, tanı ve
tedavi değerlendirmelerinde nesnelliği artırmak amacıyla yöntem ve araçlar geliştirilmiş, yeni
parametreler tanımlanmıştır. Elektorfizyolojik sinyallerden elde edilebilecek nicelikler kümesini
içeren matematiksel bir araç olarak ‘Nöroprofil’ kavramı tanımlanmıştır. Nöroprofilin bileşenlerinin
bir alt kümesi olarak yeni parametreler (epileptik örüntü sıklığı, bağıl negatif değişim düzeyi ölçüsü,
hiperventilasyonda doğru akım değişim göstergesi, hiperventilasyonda nabız değişim oranı ve nabız göstergesi) ve
bu parametrelerin hesaplanma yöntemleri ortaya konulmuştur. Geliştirilen yöntemlerin
otomasyonunu sağlayabilecek yazılım araçları (nöroprofil çıkarım modülü ve veri tabanı) geliştirilmiştir.
Tanımlanan parametreler, gerek epilepsi hastalarından gerekse gönüllü katılımcılardan elde edilen
sinyallerle hesaplanmış ve karşılaştırılımıştır. Sonuçlar, bu parametrelerin tanı amaçlı
kullanılabilirliğini göstermektedir. Özellikle hiperventilasyon sonucu EEG ve EKG sinyallerinde
meydana gelen degişimleri niceliklendirmek için tanımladığımız göstergelerin birleşik analizi yeni
bir yöntem olarak önemli sonuçlar vermiştir. Geliştirilen yöntemler, tedavi değerlendirilmesi amaçlı
örnek vak’alarda kullanılmıştır. Çalışmalarda elde edilen gözlem ve sonuçlar doğrultusunda,
karmaşık bir öğrenme süreci olarak nöroterapinin daha iyi anlaşılabilmesi için yeni bir düşünce
sistematiğininin gerekliliği tartışılmıştır. Sinerjetik yaklaşımın bu alanda teorik bir çerçeve sağladığı öne sürülmüştür. Bu açıdan, EEG’nin doğru akım bileşeninin, beyin karmaşık açık sisteminin bir
‘düzen parametresi’ olduğu hipotezi ortaya atılmıştır. Bu alandaki bilimsel çalışmaların, beynin
bilişsel işlevleri ve otonom sinir sistemi arasındaki etkileşimlere yoğunlaştırılması önerilmiştir.
Anahtar Sözcükler: EEG-biyogeribildirim, epilepsi, nöroterapi, yavaş kortikal gerilimler, nesnel
tanı, tedavi değerlendirilmesi, nöroprofil, veri tabanı, epileptik örüntü nicelendirilmesi, fraktal
boyut, bağıl negatif değişim, hiperventilasyon, doğru akım kayması, anlık nabız, sinerjetik.

Contents
Acknowledgment......................................................................................................................... i
Abstract ........................................................................................................................................iii
Zusammenfassung (Abstract in German) ........................................................................... iv
Özet (Abstract in Turkish) ...................................................................................................... v
Contents ....................................................................................................................................... vi
List of Figures............................................................................................................................... x
List of Tables .............................................................................................................................xiv
List of Abbreviations................................................................................................................xv
List of Symbols....................................................................................................................... xviii
1 Introduction........................................................................................................................ 1
2 Fundamentals: Epilepsy and EEG-Biofeedback ....................................................... 6
2.1 Epilepsy........................................................................................................................... 6
2.1.1 Clinical Features ..........................................................................................................................6
2.1.2 Focal (Partial) and Generalized Epilepsy .............................................................................. 7
2.1.3 The Neurophysiology..................................................................................................................8
2.2 Therapies in Epilepsy .................................................................................................. 9
2.2.1 Pharmacological Therapy...........................................................................................................9
2.2.2 Surgical Therapy ........................................................................................................................ 10
2.2.3 Alternative Therapies................................................................................................................ 10
2.2.4 Behavioral Approaches ............................................................................................................. 10
2.3 Neurotherapy in Epilepsy.......................................................................................... 11
2.3.1 Sensorimotor Rhythm Studies................................................................................................ 12
2.3.2 Slow Cortical Potentials Studies............................................................................................ 12
2.4 DC-Potentials in the Brain ........................................................................................15

Contents vii
2.4.1 Cortical DC-Shifts and Seizure Activity .............................................................................. 15
2.4.2 Cortical DC-Shifts and Gas Pressures in Blood and Tissue ............................................ 16
2.4.3 Cortical DC-Shifts and Cognitive Information Processing ............................................. 16
2.4.4 Cortical DC-Shifts and the Sleep-Wake Cycle .................................................................. 17
2.4.5 Cortical DC-Shifts Associated with Anesthesia and Related Burst Suppression ..... 18
3 Problem Analysis: Objective (Neuro)therapy Planning and Evaluation in Epilepsy ..............................................................................................................................19
3.1 EEG in Epilepsy ..........................................................................................................24
3.2 Quantitative EEG in Epilepsy .................................................................................25
3.3 Objectives .....................................................................................................................26
4 Therapy Evaluation and the Neuroprofile ...............................................................29
4.1 The Therapy Evaluation Strategy ...........................................................................29
4.1.1 The Neuroprofile....................................................................................................................... 29
4.2 Protocol for Evaluation Measurements................................................................. 32
5 Data Acquisition ............................................................................................................. 38
5.1 The EEG-Biofeedback System................................................................................. 38
5.2 Evaluation Measurements .........................................................................................41
5.3 EEG-Biofeedback Sessions.......................................................................................42
5.4 Studies with Control Subjects ................................................................................44
5.5 Studies with Epilepsy Patients ...............................................................................46
6 Signal Processing for Feature Extraction and Quantification............................48
6.1 Epileptic Pattern (Graphoelement) Analysis ......................................................49
6.1.1 Measures of Pattern Characterization in EEG .................................................................. 50
6.1.1.1 Värri Measures .............................................................................................................. 51
6.1.1.2 Fractal Dimension......................................................................................................... 51
6.1.2 Supervised Quantification of Epileptic Patterns in EEG ................................................ 52
6.1.3 Unsupervised Quantification of Epileptic Patterns in EEG............................................53
6.1.3.1 Adaptive EEG Segmentation Algorithm ................................................................ 54

Contents viii
6.1.3.2 Clustering the Obtained Segments ..........................................................................55
6.2 Contingent Negative Variation Analysis .............................................................. 57
6.3 Analysis of Hyperventilation Induced DC-Shifts...............................................59
6.4 Analysis of Hyperventilation Induced Changes in Instantaneous Heart Rate.........................................................................................................................................60
7 Software-Technical Aspects as a Basis for Automation.......................................62
7.1 The Neuroprofile Extraction Module....................................................................62
7.2 Database Development..............................................................................................64
7.2.1 Methodological Concerns........................................................................................................65
7.2.2 Database Planning .....................................................................................................................65
7.2.2.1 Requirements Analysis................................................................................................65
7.2.2.2 Data Warehouse Outline ............................................................................................67
7.2.2.3 Software Concept ........................................................................................................ 69
7.2.3 Design and Implementation .................................................................................................... 71
7.2.3.1 Conceptual Design ....................................................................................................... 71
7.2.3.2 Logical Design................................................................................................................ 71
7.2.3.3 Physical Design..............................................................................................................72
7.2.3.4 Realization .....................................................................................................................73
8 Results ............................................................................................................................... 75
8.1 Epileptic Patterns Analysis ...................................................................................... 75
8.1.1 Värri Measures versus Fractal Dimension ...........................................................................75
8.1.2 Supervised and Unsupervised Detections ........................................................................... 77
8.2 Differences in the Contingent Negative Variation between Patients and Controls ........................................................................................................................80
8.3 Differences in the Hyperventilation Induced DC-Shifts ..................................82
8.4 Instantaneous Heart Rate and Hyperventilation ............................................... 87
8.5 DC-Shifts and Instantaneous Heart Rate in Patients and Controls..............89
8.6 EEG-Biofeedback Adjustment and Learning.......................................................90

Contents ix
8.7 Application of the Methodology on Sample Cases for Pre- and Post-Therapy Comparisons .................................................................................................................91
8.7.1 Case I – P2WM .......................................................................................................................... 91
8.7.2 Case II – P6RB ............................................................................................................................93
9 Discussion.........................................................................................................................96
9.1 Clinical Tools for Decision Supporting in (Neuro)therapy Evaluation........96
9.1.1 Refinement of the Data Model................................................................................................97
9.1.2 Integration of Existing Clinical Databases..........................................................................97
9.1.3 Forming a Normative Database, Data Mining and Decision Supporting.................... 98
9.2 Selected Quantitative Measures .............................................................................98
9.2.1 Graphoelements .......................................................................................................................100
9.2.2 Contingent Negative Variation ............................................................................................100
9.2.3 Hyperventilation Induced DC-Shifts in EEG and Changes in IHR ............................100
9.3 Quantification of Learning ..................................................................................... 103
9.4 Understanding Neurotherapy ............................................................................... 103
9.4.1 Changing the Paradigm ..........................................................................................................105
9.4.2 Self-Regulation and Self-Organization...............................................................................106
9.4.3 EEG-Biofeedback and Non-Linear Phase Transitions.................................................... 107
9.4.4 Concepts of Synergetics ......................................................................................................... 107
9.4.5 Neurotherapy as a Process of Learning: Operant Conditioning and Coordination.108
9.4.6 Is the DC-level an Order Parameter of the Brain Complex Open System? ................109
9.4.7 Neurotherapy: An Interface of Psychology and Neurology via Synergetics?.............. 111
10 Summary and Conclusion............................................................................................ 113
References .................................................................................................................................. 117
Appendix A............................................................................................................................... 126
Appendix B ............................................................................................................................... 128

List of Figures
Fig. 2.1 EEG and DC/EEG. Principles of wave generation. The excitatory synapses of two afferent fibers contact the superficial dendritic arborisation of two longitudinal neuronal elements. The afferent fiber activity is recorded by means of the intracellular electrodes E1 and E2, and the membrane potentials (MP) of the dendritic elements are recorded by the electrodes E3 and E4. The field potential at the surface of the neuronal structure (cortex) is led by the electrode E5. Synchronized groups of action potentials in the afferent fibers (E1, E2) generate wavelike excitatory postsynaptic potentials (EPSPs) in the dendritic areas (E3, E4) and corresponding field potentials in the EEG and DC/EEG recording (E5). Tonic activity in the afferent fibers results in a long-lasting EPSP with small fluctuations. During this period the EEG (5b) shows only a reduction in amplitude, whereas the DC/EEG recording (5a) reflects the depolarization of the neuronal elements as well. [Erwin-Josef Speckmann and Christian E. Elger, “Introduction to the Neurophysiological Basis of the EEG and DC Potentials” in Ernst Niedermeyer and Fernando Lopes da Silva (Eds.) , Electroencephalography: Basic principles, Clinical Applications, and Related Fields, p. 20, 4th Ed., Williams & Wilkins, Baltimore 1999.]............................................................................................ 13
Fig. 3.1 General therapy evaluation flow diagram.................................................................................................. 20
Fig. 3.2 Components of the problem analysis and orientation. .............................................................................. 22
Fig. 4.1 Sample section from the qEEG part of the neuroprofile model. The highlighted column shows the parameters extracted from EEG (e.g., DC-level; delta, theta, alpha1, alpha2-frequency band powers; amplitude of mu rhythm) from a single time-interval of a single provocation for a given channel. © IEEE Transactions on Information Technology in Biomedicine.......................................................................... 30
Fig. 4.2 Therapy evaluation flow diagram. Initial measurements, as well as evaluation measurements are analyzed by the data analysis module, which extracts the neuroprofile. Based on the neuroprofiles, therapy is evaluated and accordingly, is either continued unchanged or modified, or terminated. ........... 31
Fig. 4.3 Odd-ball paradigm. Ss = standard tone of 1000 Hz (duration 100 ms); St = target tone of 2000 Hz (duration 100 ms, occurrence 20%); t = 2 sec. ......................................................................................... 35
Fig. 4.4 Modified S1-S2 paradigm. S1 = acoustic warning stimulus, S2 = visual aversive or non–aversive stimulus. t1 = 6 sec, t2 = 6 sec, and t3 = 4 sec. .......................................................................................... 36
Fig. 4.5 Paradigm for SMR measurements. Sl = visual stimulus for left hand thumb response Rl, Sr = visual stimulus for right hand thumb response Rr, So = visual stimulus for no-reaction. t = 3 sec....................... 37
Fig. 5.1 Simplified block diagram of the developed EEG-biofeedback system. EEG/DC signals are acquired by the signal acquisition module, which is controlled and monitored by a separate software module. The signals are processed on-line, and the multimedia feedback is controlled by the extracted feedback parameter. ................................................................................................................................................. 39
Fig. 5.2 Modalities of the system. (a) Evaluation measurement using LCD glasses (28 channels EEG), (b) Biofeedback session (single channel EEG). © The NeuroCybernetics Research Group. ................... 40
Fig. 5.3 Samples of the multimedia feedback components. (a) Airplane: amplitude controlled feedback, (b) Puzzle: band power controlled feedback. © The NeuroCybernetics Research Group. ....................... 40
Fig. 5.4 The 28 channels of EEG acquired in an evaluation measurement (10/20 System).................................. 41
Fig. 5.5 An interval from the polygraphic signals acquired during an evaluation measurement. ........................... 42

List of Figures xi
Fig. 5.6 Acquired signals in different measurements from controls and patients. .................................................. 44
Fig. 6.1 Block diagram of the analysis process. ..................................................................................................... 48
Fig. 6.2 Supervised and non-supervised strategies for quantification of epileptic patterns. After pre-processing, measures need to be assigned for pattern characterization in both approaches. In the supervised path, the supervisor selects the pattern of interest from the real data, and subsequently similar patterns are searched for in the data. In the unsupervised path, EEG is segmented adaptively and the segments obtained are clustered by a classification algorithm.................................................................................. 50
Fig. 6.3 Signal processing steps for quantification of CNV. ................................................................................... 58
Fig. 6.4 Signal processing steps for quantification of hyperventilation induced DC-shifts. .................................... 59
Fig. 6.5 Signal processing steps for IHR calculation during hyperventilation......................................................... 61
Fig. 7.1 Software components and flow diagram of the neuroprofile extraction module. Polygraphic data of different formats are read, interactively presented, and pre-processed for the main analysis, which contains software components for extraction of the relevant parameters. The quantitative results are stored in proprietary files. © IEEE Transactions on Information Technology in Biomedicine.................... 63
Fig. 7.2 Graphic User Interface of the Neuroprofile Extraction Module.................................................................. 64
Fig. 7.3 The database design process according to [92]. © IEEE Transactions on Information Technology in Biomedicine............................................................................................................................................... 66
Fig. 7.4 Datawarehouse outline. © IEEE Transactions on Information Technology in Biomedicine. ..................... 68
Fig. 7.5 Software concept using the database. 1st development stage (current): Quantitative results are extracted both by the implemented sub-modules of the neuroprofile extraction module (version I) and the commercial software packages. They are entered into the data warehouse via a wrapper. Database frontend is used for maintenance of supplementary medical information. Results stored in the data warehouse can be visualized or statistically analyzed by the corresponding modules which have access via embedded SQL or ODBC. 2nd development stage (future): Neuroprofile extraction module (Version II) shall overtake the quantitative analysis completely and store the results directly into the data warehouse. © IEEE Transactions on Information Technology in Biomedicine. ............................................................ 70
Fig. 7.6 A sample part from the entity-relationship diagram. Person, proband and epilepsy patient are central entity types of the model. Neurofeedback represents a session of neurofeedback training performed with a person, diagnostic raw data is a set of EEG data recorded for a particular person. © IEEE Transactions on Information Technology in Biomedicine. .............................................................................................. 73
Fig. 7.7 NeuroBase for entering clinical information. © IEEE Transactions on Information Technology in Biomedicine............................................................................................................................................... 74
Fig. 8.1 Segmentation results for sample pattern 1, (a) Värri measures (threshold = 0.4 (*) and 0.45 (o)), (b) FD (threshold = 0.4). Window width = 1.1 sec, window overlapping = 60%. © IEEE Engineering in Medicine and Biology................................................................................................................................................ 76
Fig. 8.2 Segmentation results for sample pattern 2, (a) Värri measures (threshold = 0.3 (*) and 0.4 (o)), (b) FD (threshold = 0.35). Window width = 1.1 sec, window overlapping = 60%. © IEEE Engineering in Medicine and Biology................................................................................................................................................ 76
Fig. 8.3 Segmentation results for sample pattern 3, (a) Värri measures (threshold = 0.6 (*) and 0.75 (o)), (b) FD (threshold = 0.5). Window width = 1.1 sec, window overlapping = 60%. © IEEE Engineering in Medicine and Biology................................................................................................................................................ 77

List of Figures xii
Fig. 8.4 Sample results of fuzzy clustering after adaptive segmentation based on FD on an EEG channel. Statistics (percentage occurrence) of the clusters which have the corresponding FD value as the center................................................................................................................................................................... 78
Fig. 8.5 Sample CNV results for 28 EEG channels. Initial measurement of subject S1JN. Time average of 20 sweeps. ..................................................................................................................................................... 80
Fig. 8.6 Quantification of CNV results, dcnv. Subject S5PT, initial measurement, channel Cz. ............................. 81
Fig. 8.7 Topological mapping of the measure dCNV from, a) control subject S2MN, initial measurement; b) epilepsy patient P4ES, pre-therapy measurement. ................................................................................................. 81
Fig. 8.8 DC-level during a standard measurement for all EEG electrodes. Subject S5PT, initial measurement. Triggers: F6=HV-start, F7=HV-end, F4=recovery-end.............................................................................. 82
Fig. 8.9 DC-shifts during and after hyperventilation at electrode positions Fp1, Fp2, Fz, Cz, Pz, Oz, O1, and O2. t = 0, hyperventilation starts; t = 185 s, hyperventilation ends. Subject S5PT, 1st evaluation measurement................................................................................................................................................................... 83
Fig. 8.10 DC-shifts during and after hyperventilation at electrode positions Fp1, Fp2, Fz, Cz, Pz, Oz, O1, O2. t = 0, hyperventilation starts; t = 176 s, hyperventilation ends. Patient P2WM, pre-therapy measurement................................................................................................................................................................... 83
Fig. 8.11 Linear regression for determining the rate of change of DC-level within HV and recovery intervals. ....... 84
Fig. 8.12. Topological mapping of the rate of change of DC-level for a control subject (S1JN, initial measurement), a) hyperventilation (shv), and b) recovery (srec). ......................................................................................... 84
Fig. 8.13 Topological mapping of the rate of change of DC-level for an epilepsy patient (P2WM, pre-therapy measurement), a) hyperventilation (shv), and b) recovery (srec)................................................................. 85
Fig. 8.14 IHR analysis result during HV and recovery for a control subject (S4OL). (a) the ECG channel after pre-processing from the standard I measurement, (b) the detected R peaks (an interval zoomed from (a)), (c) the corresponding IHRC....................................................................................................................... 87
Fig. 8.15 IHR analysis result during HV and recovery for a patient (P2WM). (a) the ECG channel after pre-processing from the standard I measurement, (b) the detected R peaks (an interval zoomed from (a)), (c) the corresponding IHRC....................................................................................................................... 88
Fig. 8.16 srec at the vertex (Cz) versus %HRrec/hv in patients (PT) and controls (CS). .............................................. 89
Fig. 8.17 DCIrec at the vertex versus HRIhv in patients and controls. ........................................................................ 90
Fig. 8.18 DC-shifts during and after hyperventilation at electrode positions Fp1, Fp2, Fz, Cz, Pz, Oz, O1, and O2. t = 0, hyperventilation starts; t = 176 s, hyperventilation ends. Patient P2WM, evaluation measurement 3................................................................................................................................................................... 92
Fig. 8.19 CNV results of evaluation measurements in patient P2WM, (a) evaluation measurement 1 (pre-therapy), (b) evaluation measurement 2, (c) evaluation measurement 3. ................................................................ 93
Fig. 8.20 CNV results of evaluation measurements in patient P5RB, (a) evaluation measurement 1 (pre-therapy), (b) evaluation measurement 2, (c) evaluation measurement 3. ................................................................ 95
Fig. 9.1 Results of an EEG-biofeedback session based on SCP (black: negativation task, red: positivation task), (a) feedback channel Fcz, (b) respiration channel ATHM, and corresponding spectral power of the respiration channel (c) negativation task, (b) positivation task. © RGESIM/ASIM Verlag-Proceedings of World Congress on Neuroinformatics. .................................................................................................... 104

List of Figures xiii
Fig. 9.2 Synergetical representation of microscopic and macroscopic interactions, and corresponding parameters. Psychology as a higher macroscopic level is excluded for simplification................................................ 111

List of Tables
Table 4-1 The protocol for evaluation meaurements................................................................................................. 34
Table 5-1 Measurements carried out with control subjects. ...................................................................................... 45
Table 5-2 Measurements carried out with epilepsy patients. .................................................................................... 47
Table 8-1 CNV Comparison between patients and control subjects. © IEEE Transactions on Information Technology in Biomedicine. ...................................................................................................................... 82
Table 8-2 Rate of change of DC-level within HV and recovery intervals for control subjects.................................... 85
Table 8-3 Rate of change of DC-level within HV and recovery intervals for patients. .............................................. 86
Table 8-4 Percentage DC-recovery after hyperventilation in patients and controls. ................................................. 86
Table 8-5 Measures HRbsl, HRhv, HRrec and the indices %HRrec/hv and %HRIhv for control subjects in initial measurements........................................................................................................................................... 88
Table 8-6 Measures HRbsl, HRhv, HRrec and the indices %HRrec/hv and %HRIhv for patients in pre-therapy measurements........................................................................................................................................... 89
Table 8-7 Results of follow-up for patient P2WM. ..................................................................................................... 91
Table 8-8 Results of follow-up for patient P5RB........................................................................................................ 94

List of Abbreviations
ADD Attention Deficit Disorder
ADHD Attention Deficit Hyperactivity Disorder
ATHM Respiration curve
BCI Brain-computer-interface
BP Bereitschaftspotential
CEN European Standardization Committee
CNS Central Nervous System
CNV Contingent Negative Variation
CSE Common Standards for Quantitative Electrocardiography
CT Computed Tomography
DBMS Database management system
DC Direct current
EBS Extensible Biosignal Format
ECG Electrocardiogram
EDF European Data Format
EEG Electroencephalogram
EOG Electrooculogram
ERD Entity-relationship diagram
ERM Entity-relationship modeling
ERP Event-related Potentials
FCMI Fuzzy c-means iterative algorithm
FD Fractal dimension
FFT Fast Fourier Transformation
fMRI Functional Magnetic Resonance imaging
List of Abbreviations xvi
GABA Gamma-amino butyric acid
GUI Graphical user interface
HEOG Horizontal electrooculogram
HV Hyperventilation
IAPS International Affective Picture System
ID Identity code
IHR Instantaneous heart rate
IHRC Instantaneous heart rate curve
ILAE International League Against Epilepsy
LTP Long-term potentiation
MEG Magnetoencephalogram
NCRG NeuroCybernetics Research Group
NMDA N-methyl-D-aspartate
ODBC Open database connectivity
OEDIPE Open European Data Interchange and Processing for
Electrocardiography
PDS Paroxysmal depolarization shift
PET Positron Emission Tomography
PS Photostimulation
qEEG Quantitative electroencephalogram
SCP Slow Cortical Potentials
SMR Sensorimotor rhythm
SNOMED Systematized Nomenclature of Medicine
SP Slow potentials
SPECT Single Photon Emission Computed Tomography
SQL Structured Query Language
TC251 Technical Committee 251
VEOG Vertical electrooculogram

List of Abbreviations xvii
VITAL Vital Signs Information Representation
VM Värri measures

List of Symbols
ac Adaptation constant
ap, bp, cp Measures of a pattern
A Amplitude measure
ADIF Amplitude difference measure
B Block size of analysis in data points
c Number of clusters
ca Amplitude difference measure coefficient
cf Frequency difference measure coefficient
Ca+ Calcium ion
dCNV Contingent negative variation level difference measure
D Euclidean distance
DCIrec Direct current recovery index
E Maximum error
EPO Epileptic pattern occurrence measure
f Number of measures used for pattern characterization
F Derivate measure
FDIF Frequency difference measure
FD Fractal dimension
G Measure difference function
GVk Measure difference function of Värri measures
GDk Measure difference function of fractal dimension
Hz Hertz

List of Symbols xix
HRbsl Baseline heart rate
HRhv Average heart rate during hyperventilation
HRrec Average heart rate during recovery
HRrec/hv Heart rate recovery ratio
HRIhv Hyperventilation heart rate index
If(i) Local fuzzy performance index
K+ Potassium ion
L Curve length
lt Liters
m Number of patterns
ml Milliliters
min Minutes
ms Milliseconds
mV Millivolts
M Maximum number of iterations
Na+ Sodium ion
ol Overlap of successive windows in data points
pm EEG segments
Pij Degree of membership of pattern pj
pCO2 Partial pressure of carbon dioxide
pO2 Partial pressure of oxygen
pH Acidity
Qn Adaptive recursive threshold function
R Estimated diameter
Rl Left hand thumb response in SMR paradigm
Rr Right hand thumb response in SMR paradigm
s Seconds

List of Symbols xx
shv Rate of change of DC-level during hyperventilation
srec Rate of change of DC-level during recovery
S1 Stimulus 1 in S1-S2 paradigm
S2 Stimulus 2 in S1-S2 paradigm
Sl Stimulus for left hand reaction in SMR paradigm
So Stimulus for no-reaction in SMR paradigm
Sr Stimulus for right hand reaction in SMR paradigm
Ss Standard tone in odd-ball paradigm
St Target tone in odd-ball paradigm
t Time
T Over all duration of a measurement
TH Adaptive segmentation threshold
U = pi Set of EEG segments
wl Window length in data points
W(t) Weierstrass cosine function
xi Signal
Y0 = yi0 Set of initial cluster centers
zi Cluster center
α Quantile parameter
β Tuning parameter of fuzziness
ε Tolerance
µV Microvolts

1 Introduction
Biofeedback is an unconventional method introduced for the treatment of diverse
disorders related to regulation problems in human physiology. The method, which is
defined as a process of learning (i.e., operant conditioning), and subsumed under
behavioral medicine, is based on the capability of learning to bring the physiological
functions under voluntary control. If the physiological function under consideration is a
brain function, then terms such as operant brain regulation, cortical self-regulation or
neurofeedback are utilized.
Parallel with developments in computer technology and on-line signal processing in
recent decades, neurofeedback treatment, which is often referred to as neurotherapy,
has enlarged its fields of application beyond the more historically established research
in treatment of epilepsy and attention deficit hyperactivity disorder (ADHD).
Research in this field has many facets and needs highly interdisciplinary cooperation:
On the one hand, psychologists and neurologists search for new protocols, investigate
their applicability in different disorders, and try to explain the underlying neuronal
mechanisms. On the other hand, engineers work on the development of new brain-
computer-interface (BCI) systems which can comply with the requirements of high
flexibility and adaptability. The present state of investigations shows that, in order to
achieve success in neurotherapy, patient-specific clinical manifestations have to be
considered for adapting the learning process according to the subject’s individual
characteristics
In our studies at the Technische Universität Ilmenau, the Institute of Biomedical
Engineering, we (i.e., the NeuroCybernetics Research Group (NCRG) [1]) have
developed a prototype of a flexible BCI system which can also be employed for
neurofeedback applications for different disorders [2]-[4]. Using this system we held
training sessions with healthy controls and clinical applications with refractory
epilepsy patients. The training sessions were based on the self-regulation of the so

1 Introduction 2
called slow cortical potentials (SCP). These are slow potentials (SP) recorded on the
scalp which include direct current (DC) and near DC components.
The present work does not focus on the developed BCI system5, but on two other issues
in the research field, namely, (1) a patient-specific neurotherapy strategy, and (2) an
objective, possibly automated, evaluation of the applied therapy. The problem in
objective evaluation, as in other medical treatment processes, is concentrated in the
determination and quantification of the changes resulting from therapy by means of
pre- and post-therapy comparisons. The prerequisite for these comparisons is, however,
the determination of features which distinguish a certain pathological state from
normal functioning. The issue of patient-specific neurotherapy can similarly be
addressed by means of quantitative features which reflect the neurophysiological
differences between the individuals.
The neurometric quantitative electroencephalogram (qEEG) analysis, as defined in
[5]-[8], appears to be a possible tool for solving this problem. However, in epilepsy, as
in several other neurological disorders, the qEEG cannot be considered apart from
additional medical information, such as the results of the clinical examination, medical
history, previous and current pharmacological and other (e.g. surgical) treatments, and
further disorder specific information. Especially in case of refractory epilepsy patients
with a long history of the disorder, it is necessary to include all accessible information
for the evaluation of the therapy. Additionally, the therapy specific information
regarding its modalities must be considered. For pharmacological treatment, this can be
the active substance, its daily doses and the time span of prescription. For
neurotherapy, it is essential to access information such as
the feedback parameter (i.e., frequency bands, slow cortical potentials etc.),
the stimuli used for the task definition (i.e., visual, acoustic or tactile),
the feedback used (i.e., visual or acoustic),
the duration and number of trials, and
the information related to the simultaneously acquired polygraphical signals.
5 The BCI system has been awarded with the German Innovation Award 2004 for Biomedical Engineering given by the “Stiftung Familie Klee”.

1 Introduction 3
All these necessities yield an excessive amount of data which need to be structured and
managed. This is one of the components of the problem solved via a software concept
linked to a data warehouse in this study.
The scope of the problem, however, extends far beyond this aspect alone, because in
many epilepsy cases there is no significant deviation from the normal neurometric
qEEG values. The present state of investigation reflects a very high individual diversity.
Due to the lack of distinguishing features, epilepsy cannot be clustered in any existing
normative qEEG database. Hence, in order to evaluate and validate the success of
neurotherapy in epilepsy, there is the need for a better understanding of both
neurotherapy as an emerging unconventional treatment and of epilepsy as an
inadequately explained disorder. From this perspective, the problem extends over the
disciplines of psychology, neurology and engineering.
For this reason, an overview of the conventional medical fundamentals of epilepsy and
of the two main neurotherapy protocols proposed for epilepsy treatment is provided in
chapter 2. The SCP based neurotherapy is described in more detail, since it is the
clinically applied protocol in the current study. In the same chapter, the DC potentials
associated with diverse states of the brain are introduced in order to complete the
basics necessary for problem orientation and analysis.
After a critical analysis of the interdisciplinary issue with its biomedical engineering
aspects and roots in both neurology and psychology, the guidelines for a possible
solution are sketched in chapter 3.
In chapter 4, associated with the developed therapy evaluation strategy, the concept of
neuroprofile is coined, and the protocol for the initial and evaluation measurements,
which is determined in consultation with medical partners, is presented.
A separate chapter (chapter 5) is dedicated to data acquisition, since the measurements
in both healthy controls and epilepsy patients constitute a significant part of the study.
In this chapter, the equipment, including the developed BCI system and the technical
settings of the measurements, is introduced shortly. The laboratory studies with
voluntary control subjects and the clinical applications with epilepsy patients, which
involve learning and training the self-regulation of the central or frontocentral SP, are

1 Introduction 4
presented along with the corresponding details of the acquired electrophysiological
signals.
Chapter 6 comprises the signal analytical methodology developed or, respectively, used
for extraction and quantification of the selected feature candidates. The unsupervised
and supervised approaches are introduced for quantifying epileptic patterns
(i.e., graphoelements) in electroencephalogram (EEG). The procedures for analyzing
contingent negative variation (CNV), as well as hyperventilation induced DC-shifts in
EEG and changes in simultaneously acquired electrocardiogram (ECG) are presented.
The data management component of the solution is addressed in chapter 7. The
developed software concept and the corresponding database system are introduced
with their implementations.
Chapter 8 presents the essential results of signal analysis, comparisons between healthy
controls and epilepsy patients, as well as sample pre- and post- therapy comparisons
for the patients who were available for follow-up.
After this overview of the obtained results, the thesis continues with a detailed
discussion in chapter 9. Based on the essentials of the results, the discussion focuses on
the necessity of a change in paradigm for understanding neurotherapy and its effects in
epilepsy, in order to comprehend a complex process of operant conditioning (i.e.,
neurotherapy as a process of learning) which elicits alterations on a very complex
system: The human brain with its more than 100 billion neurons, 104 connections per
neuron, and 1022 molecules per cubic centimeter is a giant dynamical system [9]. The
neurofeedback process, on the other hand, is a voluntary intervention with the central
nervous system (CNS) at a macroscopic level and involves both psychological and
neurological processes. At this point, the discussion reaches to the depth of the
philosophical mind-body problem. Even though the problem appears to be very
complicated, changing our paradigm and using new concepts such as open systems,
self-organization, circular causality and synergy, which are the foundations of synergetics
as coined by Haken [9], [10], lead us to new possible approaches, which should be a
subject of further research in the field. From this perspective, not only neurotherapy
and epilepsy but also the SP on the scalp gain new meaning.

1 Introduction 5
In chapter 10, conclusions are derived and future research directions are proposed
based on new perspectives obtained from synergetics. A new path concentrating on
parameters, which shall and can reflect functional couplings between the participating
subsystems in the neurofeedback process (e.g., the higher cognitive functions and the
autonomic nervous system), is proposed for further investigations in both epilepsy
research and objective (neuro)therapy6 evaluation.
6 The form with parentheses is used for the term (neuro)therapy in order to emphasize that the results and
conclusions in terms of engineering, as well as in terms of psychology and neurology, achieved in this
work can also be employed for other therapies in epilepsy.

2 Fundamentals: Epilepsy and EEG-Biofeedback
In order to have a point of reference for the issues of patient-specific neurotherapy
strategy and objective (neuro)therapy evaluation in epilepsy, it is necessary to have an
overview on the disease, its therapies and corresponding treatment modalities. These
will be summarized in this chapter.
2.1 Epilepsy
"A disease of the nervous system, characterized (in its severer forms) by violent paroxysms, in which the
patient falls to the ground in a state of unconsciousness, with general spasm of the muscles and foaming
at the mouth."
The above description of the Oxford English Dictionary is also the common public
imagination of an epileptic seizure. A “generalized seizure” is, however, only one of the
categories of possible epileptic symptoms. One can even prefer to consider the term
“epilepsies” representing the plurality of the forms of the disorder [11], [12]. Epilepsies
are characterized by the episodic recurrence of paroxysmal neurological or behavioral
manifestations caused by abnormal synchronous and excessive discharges of large
groups of neurons. In this chapter, the term “epilepsy” will be used as a genus for the
group of diseases and syndromes of which the common feature is the occurrence of
epileptic seizures.
2.1.1 Clinical Features
The incidence of human epilepsy is estimated to range between 0.5 and 1% of the
general population. After disorders of circulation, epilepsy is the most frequent chronic
disorder of the nervous system [11], [13].
Epilepsy is not a unitary disease. It varies not only in etiology, but also in seizure types
and accompanying somatic and/or psychic symptoms, as well as in the course of

2 Fundamentals: Epilepsy and EEG-Biofeedback 7
occurring seizures. The differential diagnosis of epilepsy must consider other episodic
disturbances of CNS functions such as syncope, migraine, hysteria, and other
psychiatric disorders, and determine whether the seizures are caused by a structural
brain lesion, a metabolic derangement, or a genetically determined brain disorder [14].
In fact, epilepsy is a multi-factorial condition reflecting acquired and genetic factors.
Factors such as prenatal and postnatal cerebral trauma, infections of the CNS, brain
tumors, cerebral vascular lesions, congenital malformations, and some metabolic
disorders can be listed as possible exogenous factors. Such epilepsies, for which an
exogenous factor is identifiable, are defined as symptomatic epilepsy. Identification of
the exogenous factors involved in the causation of epilepsy is relevant for its
prevention, since the incidence of disorder can be reduced by prenatal care or by
prevention of brain injuries. The idiopathic epilepsies, on the other hand, are those
which have genetic factors as an identifiable cause. These may include seizures caused
by a single gene disorder (e.g., some inborn errors of metabolism) and other genetic
factors that interact with exogenous factors. In some forms of inherited seizure
disorders in animals, significant progress has recently been made in understanding their
molecular biology. In many epilepsy cases, however, the etiology remains unknown.
Therefore, a large group of epilepsies is classified under the term cryptogenic
epilepsy [14].
2.1.2 Focal (Partial) and Generalized Epilepsy
Epileptic discharges may involve any structure of the CNS, although they usually
originate in some of them (most often the cerebral cortex, including the hippocampus,
or the amygdala) [14]. The most dramatic clinical manifestation is loss of consciousness
with generalized tonic-clonic convulsions (i.e., a generalized seizure), which actually
may be the final outcome of any epileptic seizure, but particular seizures exhibit a great
variety of clinical signs and symptoms. Their distinctive features depend upon
differences in the site of origin and in the extent and pattern of spread of the seizure
discharge. Thus, the symptomatology of an epileptic seizure reflects the functional
significance of the brain area involved in the seizure discharge. For instance, twitching
of the left or right facial muscles can be associated with discharges involving the
contra-lateral face area of the precentral gyrus, or phosphenes occurring in the visual

2 Fundamentals: Epilepsy and EEG-Biofeedback 8
field with discharges in the contra-lateral visual cortex, or evocation of past memories
can be related to discharges in temporal lobe. Such symptoms result from ictal
activation of neuronal mechanisms represented in the corresponding areas, whereas
other manifestations such as the inability to utter or understand speech result from
disruption of the normal function of the speech cortex when this area is involved in
ictal discharge [14].
Depending on whether the brain is entirely or only partially involved in a seizure
discharge at its onset, which is evaluated by both clinical and EEG criteria, epileptic
seizures are subdivided into two main categories: (1) partial (i.e., focal) and (2)
generalized. Each category is further subdivided into subcategories according to the
ictal symptoms of the seizure [12]-[14]. The International League Against Epilepsy
(ILAE) classifies epileptic seizures mainly as (1) focal, (2) complex focal, (3) secondary
generalized, and (4) (primary) generalized seizures [15]-[16]. Although epilepsy
classification has various aspects and is much more complicated, the separation as focal
and generalized will be taken as a basis in this work, since focal epilepsy patients are
considered as more suitable for neurotherapy.
2.1.3 The Neurophysiology
Although the biochemical mechanisms are not yet clearly explained, certain typical
electrical phenomena are observed in epilepsy. Intercellular measurements at epileptic
foci show an extraordinary long lasting, high amplitude membrane depolarization
accompanied with spike trains. This phenomenon is defined as paroxysmal
depolarization shift (PDS). This was first described in neurons lying under
experimentally induced foci. The long-lasting depolarization corresponds to epileptic
discharges observed at surface electrodes. There may be various mechanisms or
combinations of them promoting this phenomenon:
a. decreased inhibition (insufficient gamma-amino butyric acid –GABA),
b. increased excitation (derangement in N-methyl-D-aspartate (NMDA) receptor
and glutamate),
c. alterations in Na+, Ca+, K+ ion concentrations, or
d. alterations in membrane ion channels.

2 Fundamentals: Epilepsy and EEG-Biofeedback 9
Mechanisms of kindling (i.e., long-term sub-threshold stimulation giving rise to
persistent primary and secondary foci) and long-term potentiation (LTP)
(i.e., modification of synaptic activity upon synchronously recurrent firing), which are
addressed for memory and learning processes in normal brain functioning, are also
considered for their involvement in epileptogenesis [17].
2.2 Therapies in Epilepsy
The objective of any epilepsy therapy is that the patient becomes seizure free, or at least
a significant reduction in the frequency and/or intensity of seizures is aimed with the
least possible physical and psychological disruption for the patient (i.e., side effects).
The therapies offered in epilepsy today can be listed as: pharmacological, surgical,
alternative and behavioral therapies.
2.2.1 Pharmacological Therapy
Traditionally, the first choice in epilepsy treatment is pharmacological therapy. Based
on the possible biochemical mechanisms presumed, different anti convulsive
substances are offered in pharmacological therapy. These aim at acting on the
corresponding biochemical components such as the ion balance of the neuronal
environment through either
a. changing the ion concentrations or the permeability of the neuronal membranes
to certain ions such as K+, Na+, Ca+ (i.e., Type A medication: carbamazepine,
phenytoin, lamotrigine); or
b. increasing the inhibition (GABA energic) (i.e., Type B medication: valproate,
benzodiazepine, vigabatrin, tiagabin); or
c. decreasing the excitation (acting on NMDA-receptor/glutamate) (i.e., Type C
medication: NMDA-antagonist, losigamon, dextromethorphan, felbamat,
gabapentin) [18].
The pharmacological therapy in epilepsy has two main problems: First is pharmaco-
resistance (i.e., refractory epilepsy patients) of a significant percentage of the patients
(i.e., 25%), and the second is the strong side-effects of the medication on both organic

2 Fundamentals: Epilepsy and EEG-Biofeedback 10
(e.g., hepatic side effects) and psychophysiological (e.g., perceptive and cognitive side
effects) levels [19].
2.2.2 Surgical Therapy
Surgical treatment is the second choice in mainly intractable focal epilepsy cases for
which the focus can be precisely determined, so that it can be removed by a surgical
operation. It is also applied to remove larger brain areas or to severe the corpus
callosum so that communication between the cerebral hemispheres is interrupted (i.e.,
callosotomy). Due to the problems with focus localization and the high risks of surgical
intervention, this treatment can be applied to a rather small group (20%) of patients
with refractory epilepsy [20].
Vagus Nerve Stimulation
Another relatively new treatment, which can be classified under surgical therapy, is
vagus nerve stimulation. In this treatment an electrical pacemaker is implanted into the
body in order to stimulate the vagus nerve at different frequencies, which result in an
increased desynchronization in EEG. It can be applied in severe intractable epilepsy
cases and may be a possible alternative to callosotomy. However, it is contraindicated
for patients with obstructive lung or heart diseases [21].
2.2.3 Alternative Therapies
There are other treatment approaches which can be summarized under the term
alternative treatment. In this category, therapies such as diet, acupuncture or yoga can
be listed [22].
2.2.4 Behavioral Approaches
The behavioral approaches for seizure control arise mainly from studies in psychology
and learning rather than neurology, and are based on the concept that the seizures
occur as a reaction to certain environmental stimulants or as reinforced behavior. These
approaches are also considered for treatment as a second choice, if no success is
achieved in pharmacological treatment.

2 Fundamentals: Epilepsy and EEG-Biofeedback 11
In these approaches, both the brain electrical activity and its clinical manifestations
during seizures are considered as behavior, which is influenced by both external stimuli
and internal contingence, from a learning theoretical perspective [23]. The episode of a
seizure is viewed in its temporal structure with its prodromi, aura, seizure and post-
ictal phases. The antecedent events and initiating stimuli are defined and consequently,
the seizure facilitating conditions are specified. Correspondingly, by means of classical
and operant conditioning, an alteration not only in behavioral components but also in
contingencies are sought. In this context, several approaches are studied. These involve
modification of, (1) external and internal seizure supporting stimuli and reactions,
(2) seizure facilitating contingencies, (3) the motion of the limbs participating in the
behavior chain of the seizure, and (4) electro-cortical processes [23].
Desensibilization therapy in reflex epilepsies caused by certain visual, acoustic,
olfactory or tactile stimuli, psychological self-control programs in which the patients
learn to perceive the seizure facilitating factors via self-observation, and EEG-
biofeedback belong to behavioral approaches in epilepsy treatment.
2.3 Neurotherapy in Epilepsy
Biofeedback is the method of feeding back a quantitative parameter of a physiological
function of the body to the perception of a subject through artificial equipment so that
the person learns to control the quantitative parameter voluntarily. Consequently, it is
expected that the subject gain the skill of controlling the physiological dynamics
generating the given parameter which otherwise proceed unconsciously.
If the quantitative parameter is obtained from the brain electrical activity (e.g., EEG),
then it is defined as EEG-biofeedback, neurofeedback [24], learned cortical self-
regulation [25]-[27], or operant brain regulation [28], [29]. The therapeutic
applications of EEG-biofeedback are commonly referred to as neurotherapy [30].
Studies of the operant control of EEG components go back to the 1960s. An alpha
rhythm feedback study was first published in 1969 [31]. Since then, EEG-biofeedback
has enlarged its protocols as well as its application spectrum beyond the treatment of
epilepsy and ADHD. Like other biofeedback approaches (i.e. self-regulation of heart

2 Fundamentals: Epilepsy and EEG-Biofeedback 12
rate, blood pressure, galvanic skin response, finger tip temperature etc.), the method is
subsumed under the term behavioral medicine. The different approaches, which use
different EEG components, vary basically in the physiological relevance of the extracted
quantitative parameter.
In epilepsy, two main protocols of neurotherapy are singled out: the sensorimotor
rhythm (SMR) studies and SCP studies:
2.3.1 Sensorimotor Rhythm Studies
Conditioning of certain frequency bands of EEG and its effects on seizure frequency
and intensity was initially examined by Sterman [32], [33] and Lubar [34]. The term
SMR, which refers to the activity between 12-15 Hz in EEG over the sensorimotor
cortex and is associated with motoric inactivity, was first coined by Sterman during his
studies with cats [35]. The findings in the animal experiments and measurements on
the sensorimotor cortex of the cats during different states of sleep showed that the
SMR activity occurs as a consequence of increased recurrent inhibition and blockage of
over-excitation in the thalamus [35], [36]. The possible seizure preventing benefit of
SMR-feedback was also observed during the same studies [35]-[38].
Significant seizure reductions following the SMR feedback training were reported by
Sterman [32], [33], by Lubar and Bahler [34], and by Finley et al. [39]. In [34], the
feedback protocol included increasing the SMR activity and suppressing the slower
(3-7 Hz) frequency activity at the same time. The protocol was applied at central brain
regions. In 50% of the patients, a 35-50% seizure rate reduction was observed.
Additionally, a normalization of sleep EEG, especially in the patients with abnormal
sleep-EEG patterns, e.g., absence of sleep spindles, was observed. According to [37],
Wyler et al. [40], who provided a reward for higher frequencies in the central cortical
EEG (14-26 Hz), reported similar successful seizure reduction.
2.3.2 Slow Cortical Potentials Studies
The second protocol of neurotherapy applied in epilepsy is based on SCP. SCP, which
are often referred to as DC-shifts [41]-[44] and studied in various contexts under
different provocations and paradigms, are the shifts observed in the EEG-baseline

2 Fundamentals: Epilepsy and EEG-Biofeedback 13
(Fig. 2.1), which can last from seconds to minutes [23], [29], [41], [44]. Although there
is no consensus on the origin and generation mechanism of these potentials, they are
reported to be fundamental in diverse states of the brain and are accepted to be
indicators of cortical excitability [29], [43], [44].
Fig. 2.1 EEG and DC/EEG. Principles of wave generation. The excitatory synapses of two afferent fibers contact the superficial dendritic arborisation of two longitudinal neuronal elements. The afferent fiber activity is recorded by means of the intracellular electrodes E1 and E2, and the membrane potentials (MP) of the dendritic elements are recorded by the electrodes E3 and E4. The field potential at the surface of the neuronal structure (cortex) is led by the electrode E5. Synchronized groups of action potentials in the afferent fibers (E1, E2) generate wavelike excitatory postsynaptic potentials (EPSPs) in the dendritic areas (E3, E4) and corresponding field potentials in the EEG and DC/EEG recording (E5). Tonic activity in the afferent fibers results in a long-lasting EPSP with small fluctuations. During this period the EEG (5b) shows only a reduction in amplitude, whereas the DC/EEG recording (5a) reflects the depolarization of the neuronal elements as well. [Erwin-Josef Speckmann and Christian E. Elger, “Introduction to the Neurophysiological Basis of the EEG and DC Potentials” in Ernst Niedermeyer and Fernando Lopes da Silva (Eds.) , Electroencephalography: Basic principles, Clinical Applications, and Related Fields, p. 20, 4th Ed., Williams & Wilkins, Baltimore 1999.]

2 Fundamentals: Epilepsy and EEG-Biofeedback 14
According to Caspers [44], the cortical DC potential shift is an indicator of the cortical
excitability changes with a negative shift showing an increased cortical excitability and
a positive shift showing a decreased one. At the neuronal level, these potentials are
proposed to reflect changes in the depolarization of apical dendrites and regulate local
thresholds of excitability in cortical cell assemblies [29], [42]-[44]. The amplitude of
SCP is reported to range from several µV (i.e., during a cognitive task) to more than
100 µV during seizures [29].
In [28], different negative polarizations observed in different experimental settings are
considered as the members of a family having different labels: “orienting wave”,
“processing negativity”, “Bereitschaftspotential” in preparation for voluntary
movements, and CNV if it occurs between two consecutive stimuli or responses. The
neuroanatomical sources of SCP are claimed to depend on the stimulus modality and
the type of information processing or motor responses involved. Local synchronous
depolarization of the apical dendrites reflected in negative SCP is reported to increase
the firing probability, whereas positive SCP disfacilitate the respective cell assembly in
those instances in which no actual processing of stimuli or responses occurs [42].
Therefore, SCP are ascribed an active role in the preparatory distribution of sensory,
motor, and attentional resources into the respective cortical areas [29]. It is shown that
the response organization, perceptual processing, and problem solving accuracy are
increased when the tasks are presented during negative SCP [29], [42]. Both in patients
and in some animal experiments, high amplitude negative SCP shifts (e.g., over 100 µV)
are observed shortly before and during seizures, as well as during epileptic patterns in
EEG [44].
Based on the view of an active modulatory role of the topographically specific SCP in
cortical processing, it was hypothesized that patients with intractable epilepsy are
characterized by an impaired ability to regulate their level of cortical activation using
cortico-thalamic feedback loops. Thus, it is suggested that epilepsy patients can
acquire the lacking cortical self-regulation during a process of learning based on the
biofeedback of the SCP [45]. In several studies [25]-[27], [45], [46] it is reported that
using this method, most patients with drug-resistant epilepsy could learn to control
their SCP, resulting in a significant decrement in the seizure rate. Results of 1.5-year
follow up studies have demonstrated a 50% average reduction of seizures, with some

2 Fundamentals: Epilepsy and EEG-Biofeedback 15
patients being seizure free and some unchanged [23], [25]. A further study to predict
the outcome of SCP based neurotherapy [47] reports that patients who have extreme
negative SCP values before training respond less favorably.
2.4 DC-Potentials in the Brain
As mentioned in section 2.3.2, the DC-potentials are studied in various contexts under
different provocations and paradigms. Behavioral changes associated with the sleep-
wake cycle, seizure activity, and deviations of gas pressures in blood and tissue serve as
experimental models for investigating the DC-potentials in the brain.
The following subsection presents an overview of different states of the brain, in which
DC-shifts are observed, in order to have a more detailed insight of their role in brain
functioning:
2.4.1 Cortical DC-Shifts and Seizure Activity
In experiments with cats, a negative cortical DC potential shift was found to be
associated with a depolarization of the cortical neurons during tonic-clonic convulsive
seizures. Although the changes of the fast DC-transients (i.e., EEG spikes) were
observed to be more complex in the course of a generalized seizure activity, the shape
and the polarity of the spikes have also been found to depend on the amplitude of
sustained negative DC shift [48], [49].
Many investigations have confirmed that seizure activity (both in focal and generalized
convulsive discharges) in the cerebral cortex is associated with distinct deviations of
the DC baseline in the negative direction with respect to the reference level, which is
determined in the pre-ictal phase. Caspers [44] states:
“With focal seizure activity elicited by topical application of a convulsant agent or by
direct electrical stimulation, the negative DC shift exhibits maximum amplitude in the
center of the focus and declines toward peripheral regions. Beyond a zone of complete
extinction the evoked DC shifts often reverse in sign. Generalized convulsive
discharges evoked, for example, by systemic application of convulsant agents are

2 Fundamentals: Epilepsy and EEG-Biofeedback 16
usually preceded by a stage of increasing seizure susceptibility. As a rule, this phase is
marked by slowly rising negative shift of the DC baseline all over the cortex.”
Caspers [44] concludes that the negative DC shifts associated with seizure activity
originate from a mixed generator of neurons and are functionally related to glial cells,
and that the contribution of each of these elements to the compound response may vary
in different brain regions depending on factors such as the relative density of the
generator structures and the actual rise of the local K+ concentration.
2.4.2 Cortical DC-Shifts and Gas Pressures in Blood and Tissue
The DC-potentials are studied in association with the alterations of partial gas
pressures, both pCO2 and pO2, in blood and tissue [44]. DC displacements are reported
to result from a rise in the inspiratory CO2 contents as well as from a reduction of the
ventilation rate (apnoea) or from a respiratory arrest following a period of breathing
pure oxygen (oxygenated apnoea). The amplitude of the DC-shifts increases
logarithmically with the rise of pCO2 and linearly with the fall in pH. A number of
studies have been devoted to the origin and electrogenesis of the DC-shifts elicited by
changes in pCO2 and/or pH. Besides neurons, glial cells and blood brain barrier have
been taken into account as generator structures [44].
2.4.3 Cortical DC-Shifts and Cognitive Information Processing
Cognitive information processing is another field of investigation related to cortical
DC-shifts. Birbaumer [28] defines the SCP (e.g., CNV, Bereitschaftspotential,
negativation during memory search) observed by using different paradigms as members
of a family.
Contingent negative variation (CNV)
The CNV, which is observed in a paradigm where a warning signal precedes an
imperative stimulus for a motoric activity, is shown to be related to the expectation and
anticipatory attention, and claimed to be observable in all situations of subjective
mobilization and anticipatory attention even without any motoric activity [28].

2 Fundamentals: Epilepsy and EEG-Biofeedback 17
Bereitschaftspotential (BP)
Before a planned movement, a negativation occurs in the supplementary motoric
cortex, which is shortly before the execution of the movement overlapped with a
negativation at the contra lateral primary motoric cortex. The amplitude of BP is
reported to depend on many psychological and kinematic characteristics, of which the
automation level of the movement plays a primary role. The more the movement
exercised, the lower the amplitude [50], [51].
Negative DC-shift during memory search
In circumstances demanding memory search due to their complexity, a negative DC
shift of 400 ms (or longer) occurs after the stimulus processing, which returns to the
reference level after the solution of the task [52].
SCP associated with postural adjustment
Saitou et al. [53] have investigated the existence of a cortical potential, similar to the
BP, preceding postural adjustment followed by voluntary ballistic rising on tiptoe in
healthy subjects. The slopes of the slow negative potential associated with the pre-
motion silent period onset were significantly more negative than those of the potential
associated with rise-on-tiptoe movement, particularly over the frontal electrode
positions. They conclude that the results suggest that a cortical potential precedes
postural adjustment, which is followed by voluntary rising on tiptoe.
2.4.4 Cortical DC-Shifts and the Sleep-Wake Cycle
In animal experiments, the well-known changes in EEG waves during sleep-wake cycle
are shown to be accompanied by distinct DC-shifts on the cerebral cortex too [44]. It is
reported that at the transition from wakefulness to sleep, the baseline of the DC
recordings usually shifts to the positive side of the reference level determined in the
awake but relaxed animal. Furthermore, in most cortical regions, the amplitude of the
DC-shift increases with the progressive slowing of the transients in the EEG frequency
range [44].

2 Fundamentals: Epilepsy and EEG-Biofeedback 18
2.4.5 Cortical DC-Shifts Associated with Anesthesia and Related Burst Suppression
Yli-Hnakala et al. [54] demonstrated that the instantaneous heart rate (IHR) decreases
during EEG suppression in deep enflurane anesthesia. Combining their results with
two other observations, (1) burst suppression pattern in EEG occurs after ischemic
brain damage [55] and during enflurane, isoflurane or barbiturate anesthesia [56], and
(2) under enflurane anesthesia, hyperventilation provokes epileptic discharges during
burst suppression pattern [57], Jäntti and Yli-Hankala [58] hypothesized that a non-
linear inhibiting mechanism exists in the CNS which inhibits the burst activity in both
EEG and heart rate. They concluded that there is a control system in the CNS which
synchronously inhibits EEG burst activity and heart rate. They presented the
hypothesis that this inhibitory mechanism is related to the mechanisms that inhibit or
limit epileptiform discharges. In their study in 1993, they combined their observations
on burst suppression and IHR with the cortical DC potential shifts. They expanded
their hypothesis and proposed that a non-linear (on-off) control system exists, which
controls both the bursting and DC-shifts, as well as IHR [59].

3 Problem Analysis: Objective (Neuro)therapy Planning and Evaluation in Epilepsy
Neurotherapy is introduced as a complementary treatment in various disorders of the
CNS such as epilepsy, attention deficit hyperactivity disorder, depression, and chronic
fatigue syndrome. The method is subsumed under behavioral medicine, and is
considered an operant conditioning in terms of psychology. Although the application
areas of this promising unconventional approach are rapidly increasing, the
physiological underpinnings of the process are not yet well understood. Due to the lack
of controlled studies for its evaluation, the approach is strongly debated: There is
consensus neither on the applicability of double blind studies in this behavioral
approach nor on its possible placebo effects. Especially in the case of epilepsy, which is
also, as a complex disorder, not well-explained at the biochemical and physiological
levels, the success of the treatment is even more debated. Therefore, verification of the
efficacy of the treatment is one of the core issues in this field of research.
Another issue of discussion is the individual diversity which has to be considered in
neurotherapy: current investigations indicate that if the treatment is not individually
adapted according to patient specific characteristics, the expected efficacy is not
achieved [8], [24]. Neurotherapy needs to be planned and monitored subject
specifically.
Both of these issues, individualization of neurotherapy and verification/validation of the
treatment, can be addressed under the heading of objectivity in diagnostics and therapy
evaluation. The very basic questions underlying the problem are:
a. What is the specific pathology in a certain case, so that the therapy can be
planned accordingly?
b. What is altered in the brain through (neuro)therapy ?
These questions, of their very nature, pertain to both neurology and psychology, and are
related to the rationale of neurotherapy at both levels. Both of them can be handled via

3 Problem Analysis: Objective (Neuro)therapy Planning and Evaluation in Epilepsy 20
determination and comparison of quantitative parameters reflecting the basic
neurological functions, so that the therapy can be accordingly planned and evaluated.
Thus, two further questions arise:
c. How can we determine the pathology, or respectively, the changes in a certain
case?
d. How can we quantify them for an objective diagnostics, therapy planning, and
evaluation?
These latter two questions add the first engineering component to the problem as they
are mainly related to data acquisition and signal processing.
Another very important aspect of the problem orientation is the clinical practice. The
practical aspects of clinical use and applicability must be considered in the solution.
The iterative process of therapy evaluation which accompanies any treatment in
medical practice can be summarized in a flow diagram Fig. 3.1.
Examinations / Measurements
Therapy Planning / Modification
Therapy
Diagnostic / Therapy Evaluation
Termination
Fig. 3.1 General therapy evaluation flow diagram
At the first step, diagnostic measurements and examinations are carried out. Based on
the evaluation of the diagnostic results, the medical expert plans and then applies the
therapy. After a certain period of treatment, the examinations (i.e., evaluation
measurements) are repeated. Upon a therapy evaluation process, the therapy is either

3 Problem Analysis: Objective (Neuro)therapy Planning and Evaluation in Epilepsy 21
continued, respectively modified, by the medical expertise, or terminated if success is
achieved (i.e, certain measures are normalized and clinical symptoms are overcome).
As implicitly expressed in the above description, the therapy planning and evaluation
procedures in medical practice is a more subjective process which highly depends on
the expertise of clinical personnel. Despite the necessity, objectivity is achieved neither
in neurotherapy nor in other therapies (e.g., pharmacological, surgical, etc.) applied in
many neurological diseases. This is highly related to the lack of quantitative measures
which can bring more objectivity to both procedures. The determination of generally
applicable quantitative measures, however, has not been achieved, due to the diversity
of cases and variety of the treatment modalities in epilepsy as in many other
neurological disorders. Additionally, the diversity yields an excessive amount of
information to be managed and processed in both diagnostics and therapy evaluation.
The desired solution to the problem of objectivity shall be applicable (with some
modifications or supplements) to neurological disorders in the realm of the
neurotherapy, though our focus shall be on epilepsy as a specific disorder. This aspect
adds the second engineering component to the problem: development of a strategy
which can be implemented in terms of information technology for a possible
automation of the process. Hence the problem considered is an interdisciplinary one,
having neurology, psychology and biomedical engineering (in terms of data acquisition,
signal processing and data management) as its components (Fig. 3.2).
Having elucidated the fundamental problem orientation, for a possible solution, we
need to advance to a more detailed analysis of procedures followed in therapy
evaluation in epilepsy.
Traditionally, pharmacotherapy is the first treatment addressed in epilepsy. It begins
with monotherapy in which the patient is prescribed a single substance. According to
the outcome of the therapy, the substance is either replaced by another one or
supplemented with further substances (i.e., co-medication). The sort and doses of the
substance is decided according to the seizure frequency and intensity as well as the
side-effects [11], [61]. Despite the further development of highly effective antiepileptic
substances, a significant percentage (i.e., 25%) of epilepsy patients is still pharmaco-
resistant [60].

3 Problem Analysis: Objective (Neuro)therapy Planning and Evaluation in Epilepsy 22
Biomedical Engineering
Demand 1Verification / Validation of (neuro)therapy in epilepsy
ProblemObjective diagnosis, (neuro)therapy planning, monitoring and evaluation
in epilepsy
Demand 2Individualization of
(neuro)therapy
Neurology(Epilepsy)
Psychophysiology(EEG-biofeedback)
Digital signalprocessing Data acquisition Data management
Fig. 3.2 Components of the problem analysis and orientation.
As explained in section 2.2, the main target of epilepsy treatment is preventing, or at
least, reducing the seizures. Therefore, the main criteria in the clinical evaluation of
epilepsy are the frequency and intensity of the seizures which are registered on a
seizure calendar kept by the patients.
The conventional clinical follow-up of pharmacological epilepsy therapy is based on
three main tools [61]:
a. the seizure calendar which documents the type, the number and the intensity of
the seizures,
b. the data on the pharmacotherapy (sort of medicine prescribed, the time span of
prescription), and
c. the blood serum level of the active substance acquired in time intervals.
Based on this information, the course of the treatment can be graphically
represented [61]. The change in frequency and/or intensity of seizures is an important

3 Problem Analysis: Objective (Neuro)therapy Planning and Evaluation in Epilepsy 23
quantitative clinical parameter for therapy evaluation. Nevertheless, the evolution of
epilepsy, with or without treatment, can be vicissitudinous in most cases. A
spontaneous improvement can be misinterpreted, especially if a sufficiently long time-
span is not considered [61].
The seizure calendar is an invaluable tool for clinical evaluation. There are additional
clinical examination results which are considered in diagnostics and therapy evaluation
by the medical expert. These include the verbally expressed information such as the
anamnesis, family history for genetic relevance, the impressions of the doctor, and
clinical reaction tests on the general neurological and psychological state of the patient.
The difficulty of using this information is the quantification, since they are purely
verbal. This issue can be addressed by a knowledge-based system approach in terms of
information systems. Nevertheless, none of these information components reflect any
objective psycho- or neuro-physiological correlates of the efficacy of any treatment and
cannot answer the question of placebo effects.
Therefore, other tools which can yield objective parameters are needed. The possible
parameters of biochemical level (i.e., alterations in neurotrasmitters or in membrane
mechanisms) have to be excluded, since the corresponding in vivo data acquisition (i.e.,
measurements at the neuronal level) is not possible for clinical use. The in vitro tools
can be methods such as electroencephalogram (EEG), magnetoencephalogram (MEG);
and imaging techniques such as computed tomography (CT), single photon emission
computed tomography (SPECT) and positron emission tomography (PET), and
functional magnetic resonance imaging (fMRI).
Among these methods, the EEG is the one which is more established in clinical use, not
only in epilepsy but also in other neurological and/or psychological disorders because of
its relative simplicity and lower costs compared to other methods of neurological
diagnostics. Although the spatial resolution of the clinically practiced 10/20 system
EEG measurements cannot compete with of the other methods, the time resolution is
superior, and thus can yield essential information on the cerebral functions or
respectively, dysfunctions.

3 Problem Analysis: Objective (Neuro)therapy Planning and Evaluation in Epilepsy 24
3.1 EEG in Epilepsy
The EEG examinations in epilepsy are employed, basically in order to observe the so
called epileptic graphoelements which may occur in interictal (i.e., the intervals
between seizures) periods. The epileptic graphoelements are characterized by short
lasting EEG abnormalities such as high amplitude spikes or sharp-waves, spike wave
complexes, slow spike wave complexes, and polyspikes [62]. The time characteristics
as well as the topography of such graphoelements are considered in epilepsy for
diagnosis. The ictal charges (i.e., recorded during a seizure) which vary more, but
usually consist of abnormally rhythmic EEG patterns are also important for epilepsy
diagnosis. In some rare cases, there might also be alterations (e.g., slowing), which are
often unspecific, in EEG background activity. Such alterations in background EEG
activity can also be due to medication [62].
The standard EEG measurement in clinical practice lasts commonly between 20-30
minutes. This duration is often insufficient for detecting epileptic graphoelements or a
seizure. Additionally, the existence of epileptiform discharges does not always mean
existence of a seizure in clinical terms. Therefore, long-term EEG monitoring (over 24
hours), either ambulatory or combined with video monitoring if the patients are
in-patient, is emphasized as an important tool in diagnosis and differential diagnosis of
epilepsy [63].
Activation Methods
Several activation methods, such as hyperventilation, photostimulation, and sleep
deprivation are also commonly used in clinical routine in order to provoke epileptic
discharges and other diagnostically relevant alterations in EEG [64].
Although all these methods are important tools, the resulting EEG data are in general
visually analyzed and evaluated. Therefore, the evaluation depends strongly on the
clinical expertise, hence it is subjective.

3 Problem Analysis: Objective (Neuro)therapy Planning and Evaluation in Epilepsy 25
3.2 Quantitative EEG in Epilepsy
In order to overcome the problem of subjectivity, relevant EEG measures need to be
quantified. With the developments in computer technology and digital time-series
analysis, numerous mathematical and statistical methods are also applied in EEG
analysis. These include a wide spectrum of methods from the established spectral
analysis to more recent methods of non-linear analysis such as fractal dimension,
Lyapunov exponents, and wavelets. The relevance of these parameters to certain
pathologies, as in epilepsy, however, is incomplete in the literature.
Although all the methods mentioned above are means of EEG quantification, the qEEG,
as a term in the realm of objective and automatic neurological and psychiatric
diagnostics and therapy evaluation (i.e., neurometrics [5]), defines a certain set of
measures, which are extracted from EEG data at a standardized state (i.e., 2 minutes of
artefact free eyes closed alert resting state EEG) [6]-[8]. These measures include [6]:
a. absolute and relative spectral power in the traditionally accepted EEG
frequency bands (delta (1.5-3.5 Hz), theta (3.5-7.5 Hz), alpha (7.5-12.5 Hz, beta
(12.5-20.5 Hz)),
b. mean frequency in these bands,
c. mean coherence between homologous electrode pairs of hemispheres,
d. inter- and intrahemispheric symmetry (or asymmetry) of the absolute power of
the frequency bands between homologous electrodes.
On the other hand, the neurometrics [5], as the methodology of analysing these
measures defines the whole procedure of:
a. fast Fourier transformation (FFT),
b. calculation of the quantitative parameters,
c. logarithmic transformation of these measures to obtain Gaussianity,
d. age-regression,
e. Z-transformation relative to population norms,
f. topological presentation of the results via mapping, and
g. multiple stepwise discriminant analysis for clustering according to disorders.
In spite of the fact that qEEG and neurometrics offer a possible solution in many
neurological and/or psychiatric disorders (e.g, schizophrenia, major affective disorder,

3 Problem Analysis: Objective (Neuro)therapy Planning and Evaluation in Epilepsy 26
alcoholism, dementia and learning disabilities [5], [8]), distinguishing them from
healthy controls as well as from each other, this is not the case in epilepsy. This is not
only because these measures often do not deviate from the norms in epilepsy, but also
because the deviations cannot be clustered due to the high diversity.
There have been some approaches for possible objective therapy evaluation in
SMR-based neurotherapy studies in epilepsy. The earlier study focuses on the
normalization of sleep EEG (i.e, reoccurrence of sleep spindles, which were absent
before EEG-biofeedback in some patients) after neurotherapy [65]. The recent studies
take the so called comodulation (as coined by Sterman and Kaiser [66]) as the metric of
quantification. The parameter is described to examine the temporal correspondence of
magnitude modulation between cortical recording sites, and is applied as a cross-
correlation analysis either within the subject, or statistically between subject and a
control database. The mathematical formulation of the metric, however, is not
explicitly defined in the literature.
3.3 Objectives
Based on the analysis in the previous sections of the current chapter and the basics
introduced in chapter 2, we can now continue with our strategy for a possible solution:
Primarily, it is necessary to search further quantifiable information from the EEG and
possibly from evoked potentials and/or event related potentials which might also
reflect dysfunctions related to epilepsy. These measures should correspond to the
following aspects:
a. Because of their relevance to clinical practice, they should correspond to
i. the possible graphoelements in standard or long-term EEG, and
ii. the reaction to activation methods used in epilepsy diagnostics,
b. Because of their relevance to neurotherapy protocols proposed in epilepsy, they
should correspond to
i. possible alterations in the evoked and/or event related potentials, and
ii. possible alterations in the slow cortical potentials.
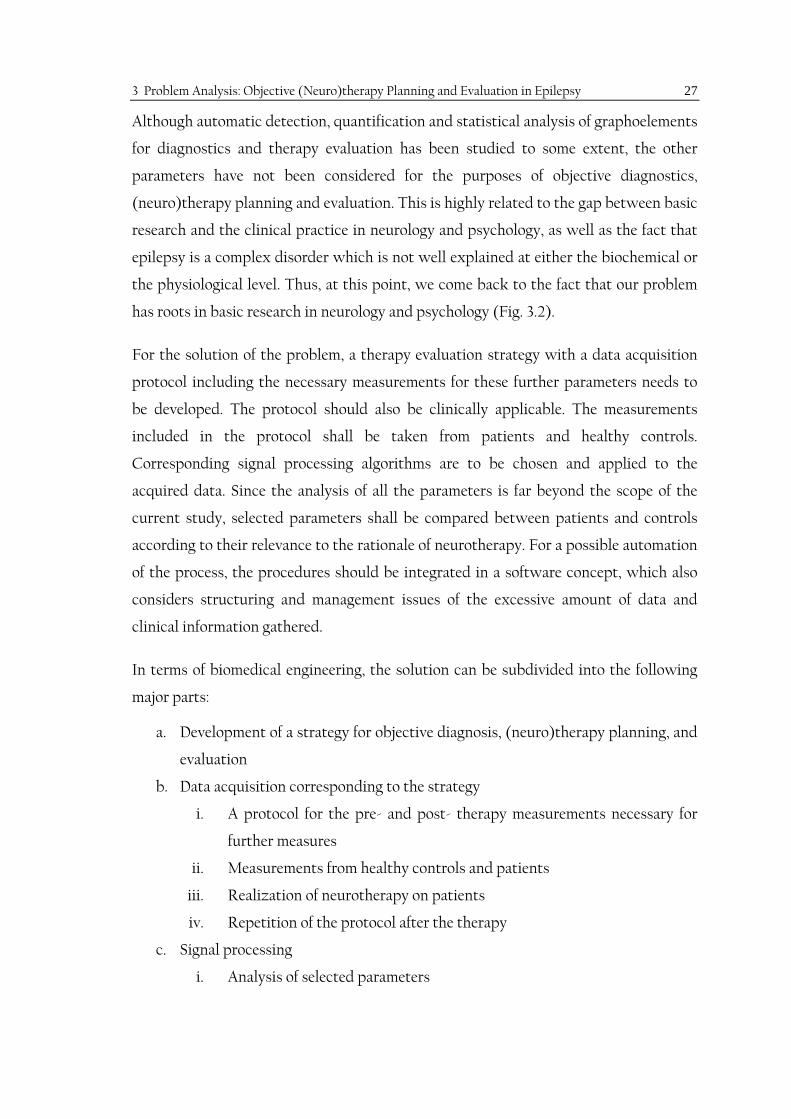
3 Problem Analysis: Objective (Neuro)therapy Planning and Evaluation in Epilepsy 27
Although automatic detection, quantification and statistical analysis of graphoelements
for diagnostics and therapy evaluation has been studied to some extent, the other
parameters have not been considered for the purposes of objective diagnostics,
(neuro)therapy planning and evaluation. This is highly related to the gap between basic
research and the clinical practice in neurology and psychology, as well as the fact that
epilepsy is a complex disorder which is not well explained at either the biochemical or
the physiological level. Thus, at this point, we come back to the fact that our problem
has roots in basic research in neurology and psychology (Fig. 3.2).
For the solution of the problem, a therapy evaluation strategy with a data acquisition
protocol including the necessary measurements for these further parameters needs to
be developed. The protocol should also be clinically applicable. The measurements
included in the protocol shall be taken from patients and healthy controls.
Corresponding signal processing algorithms are to be chosen and applied to the
acquired data. Since the analysis of all the parameters is far beyond the scope of the
current study, selected parameters shall be compared between patients and controls
according to their relevance to the rationale of neurotherapy. For a possible automation
of the process, the procedures should be integrated in a software concept, which also
considers structuring and management issues of the excessive amount of data and
clinical information gathered.
In terms of biomedical engineering, the solution can be subdivided into the following
major parts:
a. Development of a strategy for objective diagnosis, (neuro)therapy planning, and
evaluation
b. Data acquisition corresponding to the strategy
i. A protocol for the pre- and post- therapy measurements necessary for
further measures
ii. Measurements from healthy controls and patients
iii. Realization of neurotherapy on patients
iv. Repetition of the protocol after the therapy
c. Signal processing
i. Analysis of selected parameters

3 Problem Analysis: Objective (Neuro)therapy Planning and Evaluation in Epilepsy 28
ii. Extraction of possible quantitative features
iii. Comparisons between healthy controls and patients
iv. Pre- and post-therapy comparisons
d. Data management
i. A software concept which can cover the components for signal
processing and management of the extracted parameters, so that an
automation of the procedures can be achieved

4 Therapy Evaluation and the Neuroprofile
In this chapter, the developed therapy evaluation strategy with the concept of
neuroprofile will be introduced. Associated with this strategy, the protocol for initial
and evaluation measurements will be presented.
4.1 The Therapy Evaluation Strategy
As discussed in chapter 3, one of the main components of the solution to the problem of
an objective diagnosis and (neuro)therapy evaluation, is a strategy which can
standardize the process. Hence, in this section, a therapy evaluation strategy based on a
new concept and tool, the neuroprofile, will be introduced.
The information processed in therapy evaluation in epilepsy can be roughly divided
into two categories:
a. the signal analytically quantifiable, purely numeric measures which can be
extracted from EEG and possibly from other bioelectrical signals, and
b. the verbal medical information which includes the clinical examination results
as expressed by the expertise.
More objectivity can be attained via a strategy based on the first category of
information. The second category of information, however, should also be accessible.
4.1.1 The Neuroprofile
The term neuroprofile is coined in order to define a structured set of possible quantifiable
measures which can be extracted from electrophysiological signals and characterize the
neurological functions of a subject. The neuroprofile, as a clinical tool, is
conceptualized as a three dimensional vector having the dimensions:
a. Quantitative measure,
b. Localisation (e.g., electrode position), and

4 Therapy Evaluation and the Neuroprofile 30
c. Time.
The dimension time involves the smaller intervals within the measurements having
different provocations, as well as the successive measurements. The dimension
localisation projects the electrode positions of EEG recordings according to the
international 10/20 system, or of other electrophysiological signals (e.g., ECG,
electrooculogram (EOG)) according to the type of derivation. And finally, the
quantitative measures dimension represents the parameters extracted from the signals
after processing. Fig. 4.1 illustrates the model for the neuroprofile.
alpha2
alpha1
theta
delta
DC
mu
…
…
alpha2
alpha1
theta
delta
DC
mu
…
…
alpha2
alpha1
theta
delta
DC
mu
…
…
alpha2
alpha1
theta
delta
DC
mu
…
…
alpha2
alpha1
theta
delta
DC
mu
…
…
alpha2
alpha1
theta
delta
DC
mu
…
alpha2
alpha1
theta
delta
DC
mu
…
…
DC
alpha2
alpha1
theta
delta
mu
…
…
alpha2
alpha1
theta
delta
DC
mu
…
…
…
…
…
… …
…
Intervals
Provocations
Time
Electrode
positions
Freq
uenc
y ba
nds
/ fe
atur
es
Fig. 4.1 Sample section from the qEEG part of the neuroprofile model. The highlighted column shows the parameters extracted from EEG (e.g., DC-level; delta, theta, alpha1, alpha2-frequency band powers; amplitude of mu rhythm) from a single time-interval of a single provocation for a given channel. © IEEE Transactions on Information Technology in Biomedicine.
The neuroprofile is central in the developed strategy. The quantitative results of pre-
therapy, as well as follow-up measurements are registered in the neuroprofile for
further statistical comparisons. The developed strategy can be illustrated in a flow
diagram (Fig. 4.2).
The process begins with initial measurements and consideration of already existing
information (i.e., previous measurements and examination results) for a given case. In
order to have a standard for later statistical comparisons, an extended protocol of

4 Therapy Evaluation and the Neuroprofile 31
clinical EEG measurements including different provocations, and event related
potentials (ERP) measurements relevant to epilepsy (i.e., initial and evaluation
measurements) are carried out.
NEUROPROFILE
Patient specific multi-parameter
profile
EVALUATION MEASUREMENTS
(e.g., standard and/or long-term EEG,
CNV, p300)
INITIAL MEASUREMENTSand INFORMATION
(e.g., standard and/or long-term EEG,
CNV, p300)
DATA ANALYSIS
Extraction of neurorprofile components
(e.g., CNV amplitude, QEEG parameters, IHR)
(THERAPY) EVALUATION
Adaptation / modification of
the therapy
TERMINATION
THERAPY(e.g., neurotherapy,
pharmacological, surgical)
Fig. 4.2 Therapy evaluation flow diagram. Initial measurements, as well as evaluation measurements are analyzed by the data analysis module, which extracts the neuroprofile. Based on the neuroprofiles, therapy is evaluated and accordingly, is either continued unchanged or modified, or terminated.
The protocol will be explained in detail in this chapter. The measurements are analyzed
in order to extract different quantitative measures which compose the user specific
information (i.e., data analysis). The quantitative results are then integrated into the
neuroprofile. Based on the initial neuroprofile, a neurotherapy modality (i.e., the
feedback parameter, the electrode position to be trained, the modalities of feedback and
task definitions –visual, acoustic or combined) is proposed, and an initial supervised
training is realized. The therapy is conducted if the supervising medical doctor
approves the proposed modality. In the course of the therapy, the evaluation
measurements protocol is repeated and the neuroprofile is updated. The neuroprofiles
referring to a particular case are statistically compared (i.e., evaluation). Accordingly,

4 Therapy Evaluation and the Neuroprofile 32
the therapy is continued or modified. The iterative process is repeated until clinical
success is achieved.
4.2 Protocol for Evaluation Measurements
An extended protocol of clinical EEG measurements is proposed in this study in order
to obtain standardization for the comparison of neuroprofiles. Clinical factors
considered for the proposal include applicability, duration, priority of relevance to
epilepsy and neurotherapy, and recent findings in basic research in neurology and
psychology, which do not have clinical applications yet. The measurements included
were determined through consultation with the medical partners. After some
modifications, the final protocol is as follows (Table 4-1):
The first part (standard I) of the protocol includes background EEG/DC acquisition in
an open-eyes alert state as well as during essential clinical activations such as the
Berger effect, hyperventilation and apnoea.
The ERP measurements include three paradigms: Odd-ball paradigm for P300, S1-S2 for
CNV and a motoric reaction paradigm for SMR measurements. Photo-stimulation is
used for the final measurement (standard II). This activation method is separated from
the first part because of the influences of light adaptation processes on the measured
DC component [67].
In order to gain a better insight for the protocol, the activation methods and the
paradigms used will be explained below:
Activation Methods
a. Berger Effect
This method refers to the alpha activity predominant in occipital region in an eyes-
closed alert state, which is suppressed when the eyes are open, as described by
Hans Berger. This activation method is normally applied for 3-5 sec in order to
examine the reactivity, which may be absent in some epilepsy cases, especially due
to long term medication [62]. The eyes-closed and eyes open alert states are also
essential for comparison of the two states. Additionally, for further signal analysis,
4 Therapy Evaluation and the Neuroprofile 33
the eyes-closed alert state is more suitable, since the EEG is less contaminated with
ocular artefacts. The duration of an eyes-closed alert state in the protocol is,
therefore, longer (i.e., 5 min).
b. Hyperventilation (HV)
It is well-known that hyperventilation precipitates seizure activity in epilepsy
patients. Therefore, it is commonly used as an EEG activation method in clinical
routine examinations. The epileptic discharges induced by hyperventilation have a
crucial diagnostic value. This method consists of deep and regular respiration at a
rate of about 20cycles/min for a period of 2-4 minutes. In adults, such HV causes an
air exchange of 20-50lt/min and a drop in pCO2 in the range of 4-7ml%. The
characteristic EEG response to HV, most prominent in children, consists of
fluctuating increase of bilaterally synchronous slow activity and the slowing of
alpha and beta rhythms. In normal adults, although the slowing is generally not
marked, there are wide differences among individuals. For the purpose of routine
examination with HV, however, it is suggested that the rate of breathing be as close
as possible to that of the resting rhythm (15-20 breaths/min) [68].
Another effect of hyperventilation on the EEG is observed in the DC-shifts,
especially at the vertex. These potentials, however, are not commonly studied, since
the measurement requires more sophisticated equipment and is highly open to low
frequency artefacts. They are addressed, though, for their relevance in the context of
the SCP based neurotherapy in epilepsy [43], [60], but not studied for their possible
diagnostic value. Therefore, this activation constitutes an essential part of the
protocol.
c. Apnoea
An apnoeic episode is defined as a cessation of breathing of longer than a 10 sec
duration. Although such episodes are mostly considered in sleep EEG studies (e.g.,
sleep disorders) and it is not a standard activation in epilepsy diagnosis, it is an
important activation which needs to be investigated more in detail in the realm of
basic neurology research within the realm of DC studies, as a counter reaction of
hyperventilation.

4 Therapy Evaluation and the Neuroprofile 34
Table 4-1 The protocol for evaluation meaurements.
Measurement State Activation/Paradigm Activity Duration
Standard I
Eyes-open alert --- Background
EEG/DC
2 min
Eyes-closed alert
Berger effect (reactivity) Background EEG/DC
5 min
Eyes-open alert --- Background
EEG/DC
2 min
Eyes-open alert Hyperventilation (HV) EEG/DC 3 min
Eyes-open alert Recovery from HV EEG/DC 3 min
Eyes-open alert Apnoea EEG/DC 20 sec
Eyes-open alert Recovery from apnoea EEG/DC 3 min
Eyes-closed alert
Berger effect (reactivity) EEG/DC 2 min
Eyes-open alert --- EEG/DC 2 min
ERP 1 Eyes-open alert Odd-ball P300 200 trials
Eyes-closed alert
Odd-ball P300 200 trials
ERP 2 Eyes-open alert S1-S2 CNV 44 trials
ERP 3 Eyes-open alert Motoric reaction SMR 100 trials
Standard II
Eyes-closed alert
Photo-stimulation
Ramp (1-30 Hz):
1, 3, 6, 9, 12, 15, 18, 21, 24, 27, 30 Hz and
backwards.
Photosensibility
8 sec stimulation,
8 sec pause at the listed frequencies.
d. Photo-stimulation (PS)
Photo-stimulation is especially important for the evaluation of photosensitivity,
which is encountered in certain seizure types. The paroxysmal discharges related to
PS are crucial for diagnosis. Details of PS use in routine examination vary highly
between EEG labs. According to [69], the following protocol is suggested by
Bickford [70]: flashes at frequencies of 1, 3, 6, 9, 12, 15, 18, 21, 24, 27, and 30 Hz each
are given for a duration of 5 seconds with eyes open and closed in a room with

4 Therapy Evaluation and the Neuroprofile 35
reduced illumination. The PS is integrated into the protocol with the above listed
frequencies only when the eyes are closed, with 8 seconds stimulation, 8 seconds
pause intervals. The intervals are assigned longer, so as to facilitate the signal
analysis afterwards.
Paradigms
a. Odd-ball
Selective and sustained attention and short term memory deficits have been
reported in epilepsy. P300 as a measure of attentional resource and as a measure of
cognitive functions is discussed in the context of epilepsy diagnosis, and differences
are reported in the latency and amplitude of P300 in epilepsy [71]-[73]. These
findings, however, are not integrated to the clinical practice yet. Therefore, an
auditory odd-ball paradigm is included in the protocol. Standard tones of 1000 Hz
(100 ms duration) are presented once every 2 sec with a 2000 Hz target tone
occurring randomly in 20% of the trials. Subjects are requested to press a button
with the thumb of their right hand as quickly and accurately as possible when the
target tone is perceived. The eyes closed and eyes open options are necessary for a
possible comparison of the two states.
Ss Ss
t t t
t
t
Ss Ss SsSt
Response
Fig. 4.3 Odd-ball paradigm. Ss = standard tone of 1000 Hz (duration 100 ms); St = target tone of 2000 Hz (duration 100 ms, occurrence 20%); t = 2 sec.
b. S1-S2
The CNV is a long-latency event-related potential elicited by paired or associated
stimuli. The slow negativity in the EEG appears during the anticipation period
between a warning stimulus (S1) and a target response “imperative” stimulus. Its
neural generators are hypothesized to be at the prefrontal cortex. This activity is

4 Therapy Evaluation and the Neuroprofile 36
considered one of the possible negative polarizations, an example of which is
Bereitschaftspotential. CNV is addressed in the context of SCP based neurotherapy.
According to [28], CNV is observable in all situations of subjective mobilization
and anticipatory attention regardless of motoric activity.
Hence, a modified S1-S2 paradigm without motoric activity is integrated into the
protocol: An acoustic stimulus (S1) preceding a visual aversive or non-aversive one
(S2) is presented. The S1 (i.e., two distinguished tones) warns whether the S2 is
aversive or non-aversive. And accordingly, the S2 is a randomly assigned aversive or
non-aversive picture from the International Affective Picture System (IAPS)7. For
the standardization of the measurements, the inter stimulus intervals are assigned
as t1=6 sec, t2=6 sec, and t3=4 sec (Fig. 4.4).
t1 t2 t3
Warning
S1
Aversive or non-aversive
S2
Pause
Fig. 4.4 Modified S1-S2 paradigm. S1 = acoustic warning stimulus, S2 = visual aversive or non–aversive stimulus. t1 = 6 sec, t2 = 6 sec, and t3 = 4 sec.
c. Motoric reaction (SMR)
The SMR activity, which forms the basis of one of the main neurotherapy protocols
in epilepsy, is included because of its relevance to neurotherapy (see. chapter 2
section 2.3.1).
An SMR paradigm is constructed for the protocol where the subject is requested to
respond according to the presented imperative visual stimulus by pressing two
different buttons either with the left hand thumb or the right hand thumb, or by
show no reaction (Fig. 4.5).
7 International Affective Picture System (IAPS) is a development of the Center for the Study of Emotion
and Attention (CSEA) directed by P. J. Lang at the University of Florida.

4 Therapy Evaluation and the Neuroprofile 37
t t t t
Rl
SoSrSl Sr Sl
t
So
Rr Rr Rl
Fig. 4.5 Paradigm for SMR measurements. Sl = visual stimulus for left hand thumb response Rl, Sr = visual stimulus for right hand thumb response Rr, So = visual stimulus for no-reaction. t = 3 sec.
There are certainly other possible measurements which can be included in the protocol.
Nevertheless, the solution considers to optimize the over-all measurement duration and
the priority of the relevance to epilepsy and neurotherapy. The durations of single
measurements are assigned according to the necessities of further signal processing.
Although not all the measurements included in the protocol can be analyzed within the
scope of this work, the protocol is extensively structured so as to provide vital
information embedded in the initial measurements, which cannot be replicated after
the therapy. The signal analysis (quantification) will only consider selected
measurements.

5 Data Acquisition
The current chapter is devoted to the measurements and the acquired data. After a brief
introduction of the EEG-biofeedback system, the technical settings of different
measurement types, as well as the details of the acquired electrophysiological signals
are presented. The focus shall then be on the laboratory studies with voluntary control
subjects and clinical applications with epilepsy patients.
5.1 The EEG-Biofeedback System
The original system used for data acquisition in this study was a 32- channel AC/DC
polygraphic amplifier system [74]. Using certain modalities of the original one, a
laboratory prototype for an adaptive BCI system, which can be also utilized for EEG-
biofeedback and neurotherapy applications, was developed by the NeuroCybernetics
Research Group [1], at the Technische Universität Ilmenau, Institute of Biomedical
Engineering and Informatics.
The system is conceptualized in the form of two units; one central and one portable. It
can be configured for different disorders and adapted according to the individual needs
and characteristics of the subject for flexible EEG-biofeedback [2]. The central unit
involves modules for selecting an individual specific training protocol and configuring
the corresponding necessary software components [4]. After determining the
configuration for a certain subject, the initial familiarization stage of EEG-biofeedback
can be realized with the central unit under the supervision of a medical professional.
Upon completion of the first stage, the training process can be continued either at the
central unit or, after the transfer of the subject-specific configuration to the portable
unit, on the portable one (i.e., home-training) [3]. A simplified block diagram of the
central unit is illustrated in Fig. 5.1.
The AC/DC amplifier system acquires EEG signals, which are monitored by a software
component. The control/monitoring software also assigns the feedback parameter(s)

5 Data Acquisition 39
and the sequences of stimulation/task-definitions. Based on the assigned feedback
parameter, a control time-series is extracted by a separate on-line signal processing
software module. The multimedia animation is then controlled by the extracted time-
series. During the session, an additional software component continuously updates the
results. After the sessions, it presents over-all averages.
SUBJECT
Control / Monitoring
Signal Acquisition
Online Signal Processing
Stimulation / Task Definition
ResultPresentation
Multimedia Feedback
Fig. 5.1 Simplified block diagram of the developed EEG-biofeedback system. EEG/DC signals are acquired by the signal acquisition module, which is controlled and monitored by a separate software module. The signals are processed on-line, and the multimedia feedback is controlled by the extracted feedback parameter.
Three distinguishing features of the system can be listed as follows:
a. Not only higher frequency components, but also very slow components
(including 0 Hz) can be acquired.
b. Besides EEG, other polygraphic signals such as electrocardiogram (ECG),
vertical and horizontal electrooculograms (VEOG and HEOG), and respiration
curves (ATHM) can be simultaneously acquired.
c. Multimedia feedback components can be configured according to the needs of
the subject.
Some modalities of the system are illustrated in Fig. 5.2 and Fig. 5.3. More details about
the developed system can be found elsewhere [2]-[4].

5 Data Acquisition 40
(a) (b)
Fig. 5.2 Modalities of the system. (a) Evaluation measurement using LCD glasses (28 channels EEG), (b) Biofeedback session (single channel EEG). © The NeuroCybernetics Research Group.
t1 t2 t3 Time
t1 t2 t3 Time
Raw signal
Control parameter
Signal Feedback
(a)
(b)
Fig. 5.3 Samples of the multimedia feedback components. (a) Airplane: amplitude controlled feedback, (b) Puzzle: band power controlled feedback. © The NeuroCybernetics Research Group.
A
t
Raw signal
A. Amplitude
P
t
Control parameter
P. Band power

5 Data Acquisition 41
The measurements obtained through the study can be roughly grouped into two types:
a. evaluation measurements, and
b. EEG-biofeedback sessions.
These will be addressed in the following sections:
5.2 Evaluation Measurements
Both the initial diagnostic measurements and the therapy evaluation measurements are
grouped under this category. These measurements mainly involve the application of the
protocol proposed in section 4.2. The acquired polygraphic data consist of:
a. 28 unipolar EEG channels according to the International 10/20 System
(reference: linked mastoids) (see Fig. 5.4 for electrode positions),
b. an ECG channel according to Einthoven I derivation (right and left arm),
c. a bipolar VEOG channel,
d. a bipolar HEOG channel, and
e. a bipolar respiration channel (via respiration belt).
Fp1 Fp2
F7 F3 Fz F4
F8
T3 Cz C4 T4
T5 P3 Pz P4
T6O1 O2
A1 A2
Fcz
Cpz
Oz
Fc3
Tp7Cp3 Cp4
Fc4
Tp8
GND
C3
Fig. 5.4 The 28 channels of EEG acquired in an evaluation measurement (10/20 System).
A sampling rate of 500 Hz is assigned to all channels for a higher frequency resolution.
The DC modus is used (no high pass filtering) for the EEG channels, where the low
pass filter (i.e., high cut-off) is set to 70 Hz. For all measurements, the electrode
impedances are guaranteed to be less than 2 kΩ. A sample interval of the signals
acquired during an evaluation measurement is shown in Fig. 5.5. The room conditions
(i.e., light and temperature) are kept constant during a measurement. In order to avoid
the influences of the highly discussed “time of the day” factor in EEG measurements,

5 Data Acquisition 42
the evaluation measurements referring to a particular subject are started at the same
hour of the day each time the measurements are taken.
Fig. 5.5 An interval from the polygraphic signals acquired during an evaluation measurement.
5.3 EEG-Biofeedback Sessions
According to our experience, the long-term process of EEG-biofeedback can be divided
into the following stages:
a. familiarization: getting familiar with the procedure,
b. training: gaining the skill, and improving it (i.e., achieving a higher success rate
in trials),
c. transfer: training without feedback for transferring the skills to daily
conditions, and
d. refreshment: maintenance of the skills gained after longer breaks.
The first two stages, (a) and (b), together can be considered as “the process of learning”.
The third stage (c) is essential for the patients to apply the learned skills in day to day
situations, in which no feedback can be supplied. The last stage is important for the
long-term follow-up in order to sustain the skills gained. The term “EEG-biofeedback
sessions” refers to the sessions at all four stages, otherwise explicitly stated in the text.

5 Data Acquisition 43
In our studies, the sessions were based on self-regulation of the central or frontocentral
SP. Sessions were configured subject specifically: The feedback electrode was assigned
according to the topology of the CNV, and the range of the feedback component
according to the amplitude of the CNV, which were determined after the evaluation of
the initial measurements. Different modalities (e.g., acoustic, visual or combined) of the
multi-media feedback module of the BCI system were configured according to the
needs and preferences of the subjects. The task was defined as controlling the selected
multimedia feedback component in two opposite directions corresponding to positive
and negative DC shifts according to the delivered random sequence of instructing
stimuli. Subjects were given no further instructions.
We define a session as an approximately 15 minutes of continuous feedback containing
40±1 trials. Two successive trials in a session are separated with a break interval which
randomly varies between 6 and 12 seconds in order to prevent habituation. All the
parameters related to the task declaration can be configured subject-specifically too. A
subject is expected to complete 4 to 6 sessions during an EEG-biofeedback
measurement.
In a session, the subject is expected to distinguish between two different states of
activation at the selected electrode position. In SCP based EEG-biofeedback, these two
states are defined as “negativation” and “positivation”. As the terms suggest, they refer
to the shifts in the baseline (i.e., DC) either in the negative or positive direction with
respect to a reference level. In our realization, the reference level is automatically
initialized before each trial.
A standard EEG-biofeedback session data-set is composed of:
a. a single EEG channel (i.e., the feedback electrode),
b. a bipolar VEOG,
c. a bipolar HEOG, and
d. an ECG channel.
For standard sessions a sampling rate of 100 Hz is assigned to channels. The DC modus
is used (no high pass filtering) for the EEG channel, where the low pass filter (i.e., high
cut-off) is set to 30 Hz. In certain training sessions, the respiration channel is added to

5 Data Acquisition 44
the set-up. The feedback electrode impedances are assured to be less than 1 kΩ. In order
to avoid the influence of light adaptation on the recorded DC shifts, which was
observed in the course of the study, the illumination of the room is kept constant
through a session.
Besides standard sessions, several training sessions were carried out in addition to the
evaluation measurements, where the acquisition set-up was kept the same as the
evaluation measurements (section 5.1). The feedback electrode was assigned to the
same position as the standard sessions, and signals of all 28 EEG channels were
recorded. The acquired signals can be summarized in the diagram below (Fig. 5.6).
Evaluation measurements
a. 28 unipolar EEG channels (10/20 system), b. Bipolar VEOG, c. Bipolar HEOG, d. ECG channel, e. Respiration channel (respiration belt.)
Controls Patients
Polygraphic data
EEG-biofeedback sessions
a. Single EEG channel (i.e., feedback electrode), b. Bipolar VEOG, c. Bipolar HEOG, d. ECG channel, e. Additional respiration channel when necessary.
Fig. 5.6 Acquired signals in different measurements from controls and patients.
5.4 Studies with Control Subjects
A control group is studied within the realm of the current thesis. The primary purpose
was to acquire data for comparison with the patients. The secondary purpose was to
conduct EEG-biofeedback sessions in order to test the functions of the developed

5 Data Acquisition 45
system, as well as to observe possible influences of neurofeedback on healthy controls.
The study was necessary to establish a basis for clinical applications.
Six voluntary subjects (4 males, 2 females) participated in the studies at the
Electrophysiological Laboratory of the Institute of Biomedical Engineering and
Informatics, Technische Universität Ilmenau. The subjects were expected to take part
in 6 EEG-biofeedback sessions per week until having completed at least 40 sessions in
total, as well as the evaluation measurements. The schedules were determined
according to the availability of the candidates.
The proposed protocol of evaluation measurements was employed at the beginning for
the initial evaluation. The feedback electrode is individually determined after the initial
evaluations. The protocol is repeated after completing 21±3 sessions (i.e., evaluation
measurement 2) and at the end of the study (i.e., evaluation measurement 3). The
resulting measurements are listed below in Table 5-1.
Table 5-1 Measurements carried out with control subjects.
Four subjects (2 males and 1 female) completed the required minimum number of
sessions, as well as the evaluation measurements. A female subject (S2MN) missed 3
sessions, whereas a male subject (S6CR) dropped out after 18 sessions because of
private problems.
Subject
Code
Sex
(m=male,
f=female)
Age Evaluation Measurements
Standard sessions
Sessions
with 28 channels
EEG
Feedback Electrode
Feedback Type
Task Declaration
1 2 3 (#) (#)
S1JN f 21 + + + 42 5 Fcz Visual Audio
S2MN f 21 + + + 30 7 Fcz Visual Audio
S3AD m 21 + + + 39 6 C3 Visual Audio
S4OL m 26 + + + 36 6 Fcz, Cz Visual Audio
S5PT m 21 + + + 45 7 Fz, Fcz Visual Audio
S6CR m 24 + - - 18 - Fz Visual Audio

5 Data Acquisition 46
5.5 Studies with Epilepsy Patients
The clinical applications were conducted under the supervision of medical partners,
either at the Neurology Clinic of the Zentral Klinik Bad-Berka (supervision by Chefarzt
Doz. Dr. med. habil. R. Both) or at the Electrophysiological Laboratory of the Institute
of Biomedical Engineering and Informatics (supervision by Prof. Dr. med. D. Müller,
Neurological Praxis Ilmenau). The patients are selected and assigned for neurotherapy
by the medical partners. Therefore, various patients were evaluated and treated at
different times throughout the study. The patients (n=6, 4 females, 2 males) were
diagnosed with focal or multi-focal epilepsy with at least 15 years of intractable
epilepsy history.
The neurotherapy sessions had to be organized according to the availability of the
patients. A different schedule had to be followed for the patients, due to the health
insurance regulations: In the first two weeks of the therapy, which was in-patient and
covered by the insurance, the patients were trained intensively (i.e., daily except
Sundays with an average of 8 sessions per day). The training continued once a week
(i.e., 6 to 8 sessions), until the learning was achieved. Learning was accepted to be
achieved, if at least 70% of the trials in successive sessions were successful. After the
learning stage was completed, transfer sessions were conducted. The follow-up
continued with refreshment sessions once every three months for those patients who
accepted to continue with the treatment ambulatory after the first two weeks.
The evaluation measurements are obtained at the beginning of the therapy, after the
completion of the first two weeks, and in the course of further training. The resulting
measurements are listed in Table 5-2.
For certain comparisons between the controls and patients, for which no neurotherapy
is required (e.g., CNV amplitude and topology), additional data from previous studies
have been integrated into the analysis. The additional data includes measurements from
other controls (n=5) and epilepsy patients (n=6) with focal or multi-focal epilepsy.

Table 5-2 Measurements carried out with epilepsy patients.
Patient
Code
Sex
(m=male,
f=female)
Age
Diagnosis
History
Evaluation
Measurements
Standard
Training sessions
Sessions
with 28 channels
EEG
Transfer sessions
Feedback Electrode
Feedback Type
V=visual
A=audio
C=combined
Task Declaration
V=visual
A=audio
(years) 1 2 3 (#) (#) (#)
P1MH f 51 Focal epilepsy (focal seizures)
45 + + - 78 5 3 Cz V A
P2WM m 47 Focal epilepsy (complex focal and
secondary generalized seizures)
44 + + + 264 13 11 Cz V, A, C V, A
P3GM f 31 Focal epilepsy (complex focal and
secondary generalized seizures)
30 + + + 112 3 - Cz V, A, C V, A
P4ES f 52 Focal epilepsy (focal and complex focal
seizures)
49 + + - 76 4 - C4 V A
P5RB f 33 Focal epilepsy(focal and generalized seizures)
21 + + + 276 3 - Fz V, A, C V, A
P6MU m 41 Focal epilepsy (focal and generalized seizures)
27 + - - 27 - - Cz V A
5 Data A
cquisition
47

6 Signal Processing for Feature Extraction and Quantification
The electrophysiological signals acquired according to the evaluation measurement
protocol introduced in chapter 4 (Table 4-1) need to be processed for a quantification
of the relevant measures (i.e., the features). The procedure can be illustrated in a block
diagram (Fig. 6.1):
Data Acquisition
Signals
NEURORPOFILE
Feature Extraction
Feature Quantification
Fig. 6.1 Block diagram of the analysis process.
In this chapter, two stages of the analysis process, which comprise the signal
processing tasks, will be elucidated: Feature extraction and feature quantification.
The possible measures which can be extracted from the acquired data from different
measurements are numerous. Based on the discussions in chapter 3, two groups of
features will be focused upon for quantification because of their priority in epilepsy
diagnostics and relevance to SCP based neurotherapy:
6 Signal Processing for Feature Extraction and Quantification 49
a. Epileptic graphoelements, which can possibly occur in any EEG measurement,
will be studied for their clinical priority in epilepsy diagnosis. Depending on the
occurrence frequency of such epileptic patterns, long-term EEG monitoring may
be required. Via activation methods such as hyperventilation, the occurrence
probability of such patterns in EEG is increased. Therefore, the measurement
Standard I (Table 4-1) will be considered for the graphoelements analysis.
b. DC-shifts and other related neurophysiological features will be studied for their
relevance to SCP based neurotherapy. Considering CNV under the category
“DC-shifts”, we will focus on the S1-S2 paradigm measurements, as well as the
hyperventilation activation method for analyzing the associated DC-shifts.
Changes in IHR resulting from hyperventilation will be analyzed as an
additional measure based on the hypothesis by Jäntti and Yli-
Hankala [58], [59] discussed in section 2.4.5.
Next, the methodology necessary for signal processing will be introduced for the
extraction (or detection) and quantification of the selected features.
6.1 Epileptic Pattern (Graphoelement) Analysis
Epileptic patterns in EEG are characterized by distinctive transient waveforms such as
spikes, sharp-waves, spike wave complexes, slow spike wave complexes and
polyspikes. A spike is a transient with a pointed peak at conventional paper EEG
speeds with a duration of 20-70 ms, and a sharp wave is defined similarly but with a
duration of 70-200 ms. The slower transients may occur individually or accompanying
the spikes. A spike wave-complex defines a slow wave (250-350 ms) following a
spike [75].
The percentage occurrence of any epileptic activity in an EEG measurement can be
regarded as a feature for objective therapy evaluation. In order to achieve a
quantification of similar patterns or certain selected patterns in a given data set, we
suggest two approaches (Fig. 6.2):
a. Supervised, and
b. Unsupervised pattern analysis.

6 Signal Processing for Feature Extraction and Quantification 50
Supervised detection is based on the assignment of a representative epileptic pattern by
an expert (i.e., supervisor) on the real data. Similar patterns are then searched for in the
EEG recordings. On the other hand, in the unsupervised approach, the EEG is
segmented adaptively and the segments obtained are classified by a clustering
algorithm. Both approaches require measures to characterize the patterns in EEG.
Quantification of Epileptic Patterns in EEG
EEGchannels
Signal conditioning / Pre-processing
UNSUPERVISEDSUPERVISED
Measure(s) selection for pattern characterization
Statistical analysis for percentage occurrence
Detection of similar patterns
Clustering of the obtained segments
Pattern assignment by a supervisor Adaptive segmentation
Fig. 6.2 Supervised and non-supervised strategies for quantification of epileptic patterns. After pre-processing, measures need to be assigned for pattern characterization in both approaches. In the supervised path, the supervisor selects the pattern of interest from the real data, and subsequently similar patterns are searched for in the data. In the unsupervised path, EEG is segmented adaptively and the segments obtained are clustered by a classification algorithm.
6.1.1 Measures of Pattern Characterization in EEG
The performance of both supervised and unsupervised approaches depends highly on
the measure(s) used, because these measures determine either the segments obtained in
adaptive segmentation in the unsupervised approach or, respectively, the pattern to be
recognized in the supervised approach. Measure(s) should be able to characterize
patterns in EEG distinctively.

6 Signal Processing for Feature Extraction and Quantification 51
6.1.1.1 Värri Measures
Different measures can be used for this purpose. In an earlier study [76], a measure of
spectral density calculated via FFT was used in the context of adaptive EEG
segmentation. Because of the computational inefficiency in huge data sets, Värri [77]
introduced an amplitude measure A (eq. 6.1) and a derivate measure F (which can be
regarded as a measure of frequency) (eq. 6.2) for pattern characterization in EEG.
∑−+
=
=1wlj
jiij xA (6.1)
∑−+
=+ −=
1
1
wlj
jiiij xxF (6.2)
where xi is the ith data point, j is the first data point in the analysis window of the length
wl (in data points). These two measures will be referred to as Värri measures (VM).
6.1.1.2 Fractal Dimension
In the current work, fractal dimension (FD) is investigated as a new measure for
detecting epileptic patterns, and its performance is compared with VM.
FD is commonly applied in both system and signal analysis. In non-linear system
analysis, it is used for representing attractors which have fractional dimensions. The
algorithm most commonly used for this purpose is the Grassberger and Proccacia
method [78]. In signal processing, FD was investigated for its ability to detect non-
stationarities in time series. It has been shown to be a useful tool for detecting
transients in biomedical signals including EEG, as well [79], [80]. The changes in FD
were shown to characterize changes in EEG due to alterations in the physiological state
of the brain, not only in normal, but also in pathological functioning like epilepsy. Thus,
in this study, the FD is also tested for its performance in pattern characterization.
In the study by Esteller [81], the most prominent methods are compared for FD
computing in EEG analysis. It is concluded, that the Katz algorithm is the most
consistent method for the discriminating epileptic states from intracranial EEG.
Therefore, we selected the Katz algorithm for fractal dimension calculation in our
application. According to Katz, the FD of a curve is defined as:

6 Signal Processing for Feature Extraction and Quantification 52
)(log)(log
10
10
rL
FD = (6.3)
where L is the total length of the curve, and r is the diameter estimated as the distance
between the first data point and the data point that gives the largest distance.
Normalizing the distances by the average distance between successive data points y,
the eq. (6.4) is obtained.
)/(log)/(log
10
10
yryL
FD = (6.4)
Defining n=L/y, the number of steps in the curve, we get eq. (6.5),
)(log)/(log
)(log
1010
10
nLrn
FD+
= (6.5)
For FD calculation Katz algorithm is implemented and tested on simulated data which
is produced using the deterministic Weierstrass cosine function [82]:
∑∞
=
−=0
)cos()(n
nnH ttW ωω (6.6)
where ω > 1 and H, 0 < H < 1, is the constant determining the FD. Accordingly, the FD of
the generated signal is given by FD=2-H.
6.1.2 Supervised Quantification of Epileptic Patterns in EEG
The supervised approach (Fig. 6.1), which is, to our knowledge, not addressed in this
form in the literature, aims at automatic detection of a priori assigned patterns in EEG.
The assignment has to be done by a supervisor on the real data. Then, the patterns,
which are within a given tolerance similar to the original ones, are detected for further
statistical analysis.
The method used for pattern recognition is a template matching algorithm based on a
data window containing the template (i.e., the assigned measure(s) calculated for the
selected pattern) that moves along the signal. The window length of detection is the

6 Signal Processing for Feature Extraction and Quantification 53
same as the window length of the selected pattern. The measure(s) in the current
window of analysis is (are) compared with those in the original one. When the
difference between the current window and the reference pattern is smaller than an
assigned tolerance, then a pattern is assumed to be recognized. After selection of the set
of patterns to be recognized, two parameters need to be assigned in the developed
approach: a. window overlapping, b. the maximum allowed error (E).
The measure used for comparison of the patterns is the Euclidean distance,
...)()()( 222jpjpjpj ccbbaaD −+−+−= (6.7)
where ap, bp, cp are the measures of the selected original pattern, aj, bj, cj are the measures
of the pattern in the jth window analyzed, and D is the Euclidean distance. If Dj ≤ E,
then the pattern in the current window j is recognized as a similar pattern. E is
assigned according to empirical results.
The percentage epileptic pattern occurrence (%EPO) is not assigned via the number of
patterns detected, rather via the ratio of the sum of the duration of similar patterns to
the total duration of the measurement:
1% 100 , 1,...,
n
ijj
i
tEPO i m
T== × =∑
(6.8)
where %EPOi is the percentage occurrence of the ith pattern, T is the over-all duration of
the measurement, tij is the duration of the jth similar pattern, n is the total number
detected similar patterns, and m is the number of distinctive patterns.
6.1.3 Unsupervised Quantification of Epileptic Patterns in EEG
Though not identified as “unsupervised quantification”, adaptive segmentation and
clustering of obtained EEG segments have been found to be a convenient solution to
the problem of visual inspection of huge EEG data sets [76], [83], [84]. The term
“unsupervised quantification” is coined in this study, since the segments to be classified

6 Signal Processing for Feature Extraction and Quantification 54
are not defined a priori by a supervisor, but rather are obtained through an adaptive
process.
6.1.3.1 Adaptive EEG Segmentation Algorithm
The adaptive segmentation approach, which is selected for its proved efficiency in other
studies [77], [84], has been proposed by Silin and Skrylev [76]. The procedure uses two
successive windows moving on the time series in which the selected feature(s) is/are
calculated. A measure difference function G is obtained through the difference of
measure(s) in the two successive windows. The adaptive segment boundaries are then
assigned to be the local maxima of G.
As proposed in [77], [84], the difference measures, ADIF and FDIF in eq. (6.9),
computed from the successive windows, are derived from the VM in eq. (6.1) and
eq. (6.2),
,
k j k
k j k
ADIF A A
FDIF F F k j wl ol
= −
= − = + − (6.9)
where j and k are the data points, wl is the window length and ol is the overlapping of
the successive windows (both in sample points).
Accordingly, the corresponding difference function GV is obtained as
k a k f kGV c ADIF c FDIF= ⋅ + ⋅ (6.10)
where ca and cf are coefficients for amplitude and frequency measures respectively. The
suggested values for the coefficients are ca = 1 and cf =7 in the literature [84], [85].
In the adaptive segmentation application, the FD was assigned as a single measure for
the function G. Thus, the corresponding difference function GD is obtained as
, k j kGD FD FD k j wl ol= − = + − (6.11)

6 Signal Processing for Feature Extraction and Quantification 55
where, similar to eq. (6.9), j and k are the data points, wl is the window length and ol is
the overlapping of the successive windows (both in sample points).
The Threshold in the Algorithm
In order to avoid excessive segmentation due to redundant small segments, Krajca [84]
introduced a threshold for the measure difference to the algorithm. The local maxima of
the function G, which are over an assigned threshold, are assumed to position the
segment boundaries. The threshold TH proposed in [84] is computed within the
incoming block B of analysis as:
1 ( )a B f BTH c A c FB
= ⋅ + ⋅ (6.12)
where AB and FB are the measures calculated for the whole block of analysis; ca and cf are
the corresponding coefficients as in eq. (6.10).
For achieving a higher adaptability of the threshold to the signals, an adaptive recursive
approach was used in the current work. The threshold function Qn is obtained
according to eq. (6.13)
1 1
1 1
1
, , 2,...,(1 ) ,
n c n nn
n c
Q GQ a if G Q n N
QQ a otherwise
αα
− −
−
=+ ⋅ ≥ =⎧
= ⎨ − ⋅ −⎩
(6.13)
where n is the number of steps in the function G with N number of points; ac, 0 ≤ ac ≤ 1, is
an adaptation constant and α, 0 ≤ α ≤ 1, is the quantile parameter. The details on the
adaptive recursive threshold can be found in [87].
6.1.3.2 Clustering the Obtained Segments
The next step of the unsupervised approach is clustering the obtained segments. Due to
the fact that the conventional clustering methods have the drawback of disjunctive
classification, which does not apply to EEG, we follow the suggestions in [84] and use a
fuzzy clustering algorithm. In a fuzzy classification, the patterns can have different
degrees of membership in different classes at the same time.

6 Signal Processing for Feature Extraction and Quantification 56
Below, the FCMI algorithm used according to [86] and its application to EEG segments
will be explained: Given a group of segments U=p1, p2,…,pm, it is assumed that a
specific number c of clusters exist. The centers of the clusters are unknown and the
initial values y10, y20,…,yc0 are given. In our application, these initial points are set
according to the measures of the first c segments of the first channel analyzed.
Segments of each EEG channel are clustered separately.
After each iteration, the membership values of a pattern to the corresponding clusters
are obtained. The cluster centers are then updated by minimizing the local fuzzy
performance indices If(i) of eq. (6.14). The process is terminated when the difference
between two consecutive iterations does not exceed a given tolerance or when the
current iteration is equal to the maximum number of iterations allowed (i.e., an upper
boundary for avoiding infinite loops).
2
1( ) , 1 i c
m
f ij i jj
I i P z p=
= − ≤ ≤∑ (6.14)
where If(i) is the ith local fuzzy performance index and Pij denotes the grade of
membership of pattern pj to the iteratively updated c number of clusters with the
centers zi. m is the number of patterns (i.e., obtained EEG segments).
The details of the used fuzzy clustering algorithm according to [86] are as follows:
Input: f, the segments dimension (number of measures).
m, the number of segments.
c, the number of clusters.
U = pi, 1 ≤ i ≤ m, the given segments in Rn.
Y0 = yi0, 1 ≤ i ≤ c, the initial c cluster centers.
M, maximum number of iterations allowed.
ε, a given tolerance.
β, a tuning parameter which controls the degree of fuzziness in the
process.
Output: Y = yi, 1 ≤ i ≤ c, the final c cluster centers.
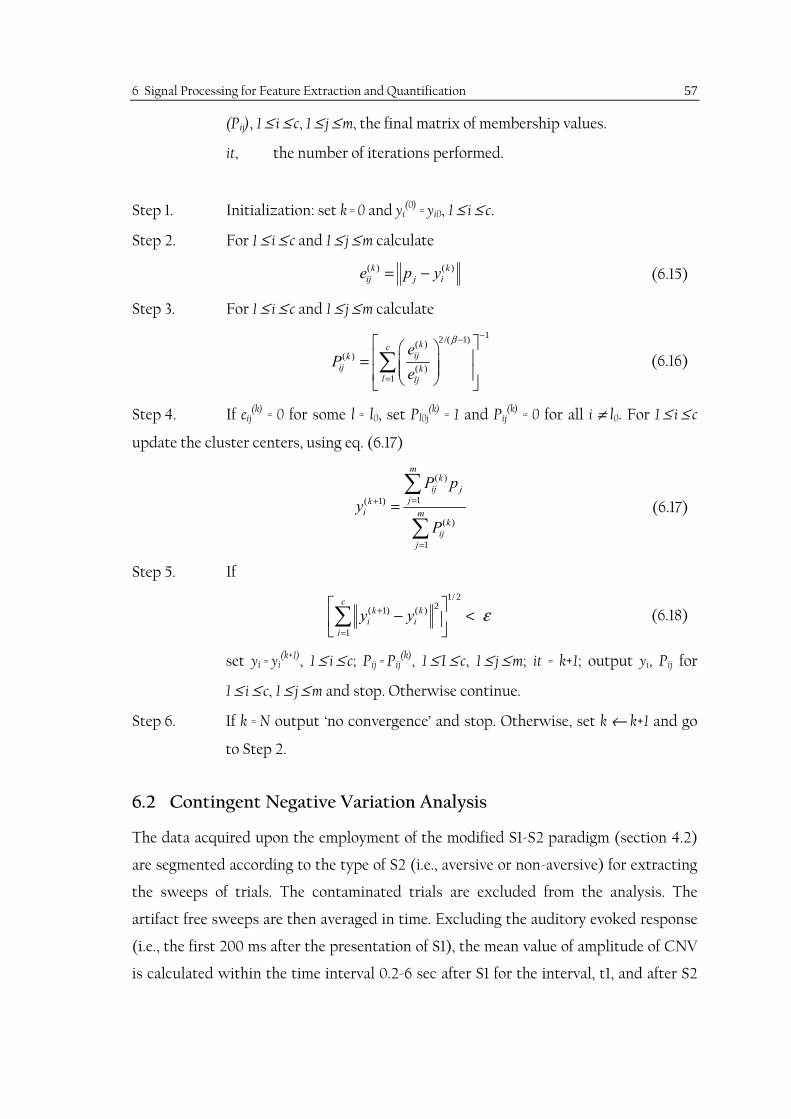
6 Signal Processing for Feature Extraction and Quantification 57
(Pij), 1 ≤ i ≤ c, 1 ≤ j ≤ m, the final matrix of membership values.
it, the number of iterations performed.
Step 1. Initialization: set k = 0 and yi(0) = yi0, 1 ≤ i ≤ c.
Step 2. For 1 ≤ i ≤ c and 1 ≤ j ≤ m calculate
( ) ( )k kij j ie p y= − (6.15)
Step 3. For 1 ≤ i ≤ c and 1 ≤ j ≤ m calculate
12/( 1)( )( )
( )1
kcijk
ij kl lj
eP
e
β −−
=
⎡ ⎤⎛ ⎞⎢ ⎥= ⎜ ⎟⎜ ⎟⎢ ⎥⎝ ⎠⎣ ⎦∑ (6.16)
Step 4. If eij(k) = 0 for some l = l0, set Pl0j
(k) = 1 and Pij(k) = 0 for all i ≠ l0. For 1 ≤ i ≤ c
update the cluster centers, using eq. (6.17)
( )
1( 1)
( )
1
mk
ij jjk
i mk
ijj
P py
P
=+
=
=∑
∑ (6.17)
Step 5. If
1/ 2
2( 1) ( )
1
ck k
i ii
y y ε+
=
⎡ ⎤− <⎢ ⎥⎣ ⎦∑ (6.18)
set yi = yi(k+1), 1 ≤ i ≤ c; Pij = Pij
(k), 1 ≤ I ≤ c, 1 ≤ j ≤ m; it = k+1; output yi, Pij for
1 ≤ i ≤ c, 1 ≤ j ≤ m and stop. Otherwise continue.
Step 6. If k = N output ‘no convergence’ and stop. Otherwise, set k ← k+1 and go
to Step 2.
6.2 Contingent Negative Variation Analysis
The data acquired upon the employment of the modified S1-S2 paradigm (section 4.2)
are segmented according to the type of S2 (i.e., aversive or non-aversive) for extracting
the sweeps of trials. The contaminated trials are excluded from the analysis. The
artifact free sweeps are then averaged in time. Excluding the auditory evoked response
(i.e., the first 200 ms after the presentation of S1), the mean value of amplitude of CNV
is calculated within the time interval 0.2-6 sec after S1 for the interval, t1, and after S2

6 Signal Processing for Feature Extraction and Quantification 58
for the interval, t2 (see Fig. 4.4). The steps followed in the sweep based analysis of the
employed S1-S2 paradigm, in order to extract CNV quantitatively, are given in Fig. 6.3.
Measurement ERP 2(Table 4.1)
Segmentation according to S1(sweep extraction)
Artefact correction / rejection
Channel selection
Baseline correction
Sweep averaging in time
Low-pass filtering (cut-off: 6 Hz)
Mean value calculation within t1 and t2 (Fig. 4.4)
Quantitative Results(dCNV)
Fig. 6.3 Signal processing steps for quantification of CNV.
As the quantitative measure dCNV, the difference between the mean value of CNV and
the mean value of the post S2 interval (i.e., t2 ) response, is assigned
= (CNV)- (Post_S2)CNVd mean mean (6.19)
The quantitative results obtained corresponding to aversive and non-aversive S2 are
statistically compared between healthy controls and epilepsy patients.

6 Signal Processing for Feature Extraction and Quantification 59
6.3 Analysis of Hyperventilation Induced DC-Shifts
In order to investigate the DC shifts during the hyperventilation measurements, the 28
channel EEG signals are averaged in time within a window length of 4 sec without
overlapping through the measurements. The rate of change of the DC level is calculated
via linear regression within the hyperventilation (shv) and recovery (srec) intervals. The
slopes of the DC shifts, corresponding to the fitted lines, are assigned as quantitative
measures. The flow diagram of the DC-level analysis during and after hyperventilation
is given in Fig. 6.4.
Measurement Standard I(Table 4.1)
Averaging in time(window length= 4 sec)
Linear regression within the HV and recovery intervals
Channel selection
Quantitative Results(shv and srec)
Rate of change of DC-levels
Fig. 6.4 Signal processing steps for quantification of hyperventilation induced DC-shifts.
A percentage DC recovery index (DCIrec) is calculated from the parameters shv and srec as
in eq. (6.20).
% 100recrec
hv
sDCIs
⎛ ⎞= − ×⎜ ⎟
⎝ ⎠ (6.20)

6 Signal Processing for Feature Extraction and Quantification 60
6.4 Analysis of Hyperventilation Induced Changes in Instantaneous Heart Rate
For extracting parameters reflecting the changes in IHR resulting from
hyperventilation, R-peaks of the simultaneously acquired ECG channel are detected
automatically by a QRS detector which is optimized for different sampling rates. The
QRS detector is based on the basic principle of a peak detector, whereby it has a
distinguishing approach of exploiting both the rising and falling edges of the
R-peak [88]. IHR is calculated at each R-peak from the succeeding R-R interval. The
R-R intervals are then linearly interpolated. Fig. 6.5 shows the analysis steps for
obtaining IHR curves (IHRC) and for parameter quantification.
The average HR values are extracted from IHR curves (IHRC) within three intervals,
(1) before hyperventilation, the baseline reference value, (2) during hyperventilation,
and (3) during recovery intervals as in eq. (6.21).
( )( )( )
bsl bsl
hv hv
rec rec
HR mean IHRCHR mean IHRCHR mean IHRC
===
(6.21)
where notation bsl (baseline) denotes the 3 minute interval before hyperventilation, hv
denotes the 3 minute hyperventilation interval, and rec denotes the 3 minute interval
after hyperventilation (i.e., recovery).
From the average IHR values obtained (i.e., HRbsl, HRhv, HRrec), two indices are calculated
for quantifying changes in the heart rate: The heart rate recovery ratio (HRrec/hv) and the
hyperventilation heart rate index (HRIhv), which are given in percentage in eq. (6.22)
and in eq, (6.23), respectively.
/% 1 100recrec hv
hv
HRHRHR
⎛ ⎞= − ×⎜ ⎟⎝ ⎠
(6.22)
% 100hv rechv
hv bsl
HR HRHRIHR HR
−= ×−
(6.23)

6 Signal Processing for Feature Extraction and Quantification 61
Measurement Standard I(Table 4.1)
Signal conditioning
Automatic R-peak detection
ECG channel
Quantitative Results(HRbsl, HRhv, and HRrec)
Calculation of R-R intervals
IHR calculationAssigment of the values to the
preceding R positions
Linear interpolation in R-R intervals (IHRC)
Average heart rate in HV, recovery and pre-HV intervals
Fig. 6.5 Signal processing steps for IHR calculation during hyperventilation.
The obtained results of IHR analysis are combined with the results of DC analysis for
comparisons between patients and controls.

7 Software-Technical Aspects as a Basis for Automation
A software technical approach is necessary, not only for processing the acquired signals
for feature extraction and quantification, and subsequent analysis, but also for
recording the supplementary medical information such as the seizure calendar and
verbal results of clinical examinations, there is the need of an information technological
approach. For a possible automation of the signal processing options, a software
concept has been developed within the scope of current study. If the dimensions of the
neuroprofile and the additional clinical data are considered, the information to be
processed in therapy evaluation is immense. In order to solve the problem of managing
the excessive amount of data, a database system, which is linked to the signal
processing software, has been planned, designed and implemented.
Even though the current study concentrates on epilepsy, the system introduced in
chapter 5 is also applicable to other neurological disorders, such as attention deficit
disorder (ADD), ADHD, depression and sleep disorders. Therefore, in the
conceptualization of the software and the database, applicability and extension to
other neurological diseases in the realm of neurotherapy, is taken into account. The
database system developed is presented in [89].
7.1 The Neuroprofile Extraction Module
In order to extract the selected parameters of the neuroprofile, the components of
signal processing procedures introduced in chapter 6 (i.e., for supervised and
unsupervised epileptic pattern analysis and fuzzy clustering; for DC-level analysis
during hyperventilation and thereafter, as well as CNV; and for IHR analysis) are
integrated in a software concept. The software concept of the neuroprofile extraction
module is illustrated in Fig. 7.1. Different procedures of signal processing, implemented
as sub-modules in Matlab, are integrated in the structure.

7 Software-Technical Aspects as a Basis for Automation 63
The module reads polygrahic data (i.e., EEG, ECG, VEOG; HEOG, respiration curve) of
different formats from different systems (e.g., BrainQuick and NeuroScan). A graphical
user interface (GUI) (Fig. 7.2) enables interactive presentation of data and results of
analyses. There is a separate sub-module is developed for signal conditioning (i.e., pre-
processing, e.g., downsampling, artefact rejection and/or correction). The analysis
module, which contains the feature extraction and quantification components, is the
central element in the concept. The current version of the neuroprofile extraction
module can extract
a. graphoelements and their corresponding statistics from clinical EEG,
b. DC-shifts in EEG accompanying provocations such as hyperventilation and
apnea,
c. parameters corresponding to event-related potentials (e.g., amplitude of CNV),
and
d. parameters of simultaneously acquired polygraphic signals (e.g., IHR and
respiration rate).
READ DATAReading data of different formats
ANALYSIS MODULES
(e.g., adaptive segmentation, DC-level analysis, frequency
analysis, CNV and p300 analysis)
POLYGRAPHIC DATA
GUIInteractive presentation
of the data
QUANTITATIVE RESULTS
PRE-PROCESSING(e.g., artifact rejection
and/or correction, signal conditioning)
DATABASE SYSTEM
RESULTSPRESENTATION
Fig. 7.1 Software components and flow diagram of the neuroprofile extraction module. Polygraphic data of different formats are read, interactively presented, and pre-processed for the main analysis, which contains software components for extraction of the relevant parameters. The quantitative results are stored in proprietary files. © IEEE Transactions on Information Technology in Biomedicine.

7 Software-Technical Aspects as a Basis for Automation 64
Fig. 7.2 Graphic User Interface of the Neuroprofile Extraction Module.
The quantitative results obtained from the analysis module are saved in a pre-defined
format in a file system. These results can be recalled and presented either as curves or
statistics or, for EEG, as topographic mappings. The details on the realization of the
software components for epileptic pattern analysis can be found in [90]. At a further
stage of development, a database system was developed in order to manage the
obtained quantitative results.
7.2 Database Development
For systematically managing the extracted quantitative features resulting from the
developed software components, as well as the supplementary medical information, a
database system was planned, designed and implemented:
7 Software-Technical Aspects as a Basis for Automation 65
7.2.1 Methodological Concerns
According to the ANSI-SPARC8 model, three levels of abstraction can be distinguished
during the database design process [91]. At an external level the real world’s cutout to
be modeled is structured, and the database is described from each user’s point of view.
The resulting external user views are merged at the conceptual level into an integrative
conceptual database scheme that describes the database structure for all types of users.
It contains information about the objects modeled by the database, their properties, the
relations between objects and constraints derived at the external level. Finally, the
internal level describes the parameters of the database management system used to
implement the database model. As a result, the physical structures of the database are
determined by the internal scheme.
Fig. 7.3 shows the database design process and the corresponding generated
documents [92], [93]. The requirements specification obtained after the requirements
analysis documents the needs of the user(s). This specification is formalized by a
conceptual database scheme, which is the outcome of the conceptual design. The
logical design process transforms the conceptual scheme into the data model of the
target database management system, the parameters of which are determined by the
physical design process. The whole design process and its results are finally
documented by the data dictionary.
7.2.2 Database Planning
7.2.2.1 Requirements Analysis
The requirements analysis can be divided into two components: the information
requirements and the functional requirements. Functional requirements include the
dynamic processes which are expected to be carried out by the database: The
transactions (the requests, evaluations, and report generations) which are to be
realized through the system, and the corresponding access regulations for different
types of users belong to functional requirements. The information requirements, on the
other hand, include the static information, which the database system will contain. The
8 American National Standards Institute, Standards Planning and Requirements Committee.

7 Software-Technical Aspects as a Basis for Automation 66
objects of the real world with their properties, types and ranges, their relationships and
integrity conditions refer to information requirements.
Choice of target DBMS
Requirements analysis
Conceptual design
Logical design
Physical design
Requirements specification
Conceptual database scheme
Logicaldatabase scheme
Physicaldatabase scheme
Implementation, prototyping
Documentation: Data Dictionary
Demands
Fig. 7.3 The database design process according to [92]. © IEEE Transactions on Information Technology in Biomedicine.
The information requirements will be discussed in detail, since the current study is
concerned with the extraction of essential features; both quantitative (results of the
signal processing procedures) and verbal data (the verbal clinical information and
seizure calendar, which can be quantified in a knowledge-based approach in further
studies). The clinical relevance and priority are considered for the data concept.
The database is expected to combine two types of information which are inherently
different: The quantitative data is well structured, purely numeric and extensive. In
contrast, the medical information is rather unstructured, verbal and concise. The
combination of these two types of information makes the design process demanding.
Therefore, from the information technology point of view, the database to be
conceptualized is not an operational system but a data warehouse [94], [95]. It
regularly collects data from different sources (residing in different places using

7 Software-Technical Aspects as a Basis for Automation 67
different formats) and concentrates them in the database warehouse. The data are
integrated in advance, meaning the necessary information are fetched, filtered,
processed, consolidated and stored in the warehouse prior to the analyses being done.
In order to provide the data necessary for a specific analysis none of the original data
sources have to be accessed again.
Due to the consideration that the database can be extended to further disorders, it
needs to be structured in two parts: a disorder-independent and a disorder-specific
division (Fig. 7.4). The first version of the database contains the epilepsy-specific
component, which is related to the content of the current study. Further versions can
be supplemented with other disorder-specific components.
The database has to contain information regarding not only the patients but also
healthy controls, so that comparisons with the norms will be possible. The control
subjects (i.e., probands) are assured not to have any registered neurological disorder.
This is tested via an inventory of yes/no questions. Thus, inter-group comparisons of
the neuroprofiles (considering factors such as age, sex and handedness) shall also be
done when a statistically significant number of control subjects and patients are
obtained. The data warehouse, which will be introduced next, is conceptualized
according to these requirements.
7.2.2.2 Data Warehouse Outline
Fig. 7.4 shows the outline of the data warehouse. Apart from the distinction between
disorder independent/specific components, the database can be divided into five parts,
each of which contains information essential for therapy evaluation purposes.
General information
This part contains information that is collected for both patients and control subjects.
It incorporates personal data (identity code (ID), birth date, sex etc.), the
neurofeedback sessions done along with their parameters and a list of EEG
measurements performed. The polygraphic raw data are not included in the database;
rather they are linked to the system over a file-system due to their large size and
quantity.

7 Software-Technical Aspects as a Basis for Automation 68
I. General information
II. Control subject
information
(yes/no questions on the subject’s neurological
health)
III. Epilepsy patient information
- patient and family history- clinical findings- pharmacological, neurotherapy, surgical, treatment information- archive codes of EEG measurements- treatment comments- diagnosis- seizure symptomatic- photosensibility- seizure calendar etc.
Dep
ress
ion
info
rmat
ion
AD
D/A
DH
D in
form
atio
n
….
Control subjects
Patients(disorder to be treated)
V. Auxiliary data
IV. Quantitative data(Contents of the neuroprofile)
Legend:
Current components
Future components
Disorder-independent parts
Disorder-specific parts
Fig. 7.4 Datawarehouse outline. © IEEE Transactions on Information Technology in Biomedicine.
Control subject information
This information is vital to ensuring that the control subjects have no neurological
disorders that would disqualify them from being considered healthy for our
investigations. It includes yes/no questions about any history of head injury, alcohol
addiction, drug abuse, or neurological disorders (see Appendix A).
Patient (epilepsy) information
This division documents a detailed history of the patients’s disorder and the
treatment(s) applied. In the case of epilepsy, it includes the type of epilepsy, its
classification and symptomatic, the seizure types, a list of occurred seizures (seizure
calendar), all treatment modalities apart from neurotherapy (pharmacotherapy, surgery

7 Software-Technical Aspects as a Basis for Automation 69
etc.), clinical examination results, and measurements performed along with their
results and findings. Summarized inventories can be found in Appendix B. Future
extensions in this division will include supplements with specific information related
to other neurological disorders.
Quantitative data
This part constitutes the largest part of the database. It contains the components of the
neuroprofile (i.e., the measures addressed in chapter 6, qEEG and other quantitative
parameters extracted from polygraphic signals).
Auxiliary data
This section contains data used by the other parts of the database, such as a list of
antiepileptic medication that can be prescribed, possible electrode positions, and
provocations.
7.2.2.3 Software Concept
Fig. 7.5 illustrates the integration of the database into the applications and the data that
remain outside the database. The parts of the concept that will be completed in the
future are marked with dashed lines (see Fig. 7.5).
Due to their size, acquisition and storage modalities, it is preferable not to store the
polygraphic raw data in the database, but rather to maintain them in an encrypted
directory structure on a file server. Based on the type of EEG session
(diagnostic/therapy), the date of the recording and the patient’s or control subject’s ID,
the file name and the directory in which the data are stored, are coded. The database
only contains a list of the recordings done for a particular person. At the first stage of
implementation (Fig. 7.5), calculation of the quantitative parameters and extraction of
relevant features are done both by the implemented sub-modules of the neuroprofile
extraction module (Version I) and by different commercial software packages. The
obtained results are stored in proprietary files. The wrapper, a converter program
accessing the database via ODBC or embedded SQL, stores the content of the
proprietary files in the database.

7 Software-Technical Aspects as a Basis for Automation 70
Statistical analysis module
(therapy evaluation)
Databasefrontend
(maintenance of supplementary
medical information)
Wrapper
Visualization module
Export
Data warehouse
Access viaembedded SQL
andODBC
Polygraphic raw data
(file server)
Quantitative results
Quantitative parameter calculation
and feature extraction
Neuroprofile extraction module
(Version I)
CommercialSoftware 1
CommercialSoftware N
…..
Neuroprofile extraction module
(Version II)
Fig. 7.5 Software concept using the database. 1st development stage (current): Quantitative results are extracted
both by the implemented sub-modules of the neuroprofile extraction module (version I) and the commercial software packages. They are entered into the data warehouse via a wrapper. Database frontend is used for maintenance of supplementary medical information. Results stored in the data warehouse can be visualized or statistically analyzed by the corresponding modules which have access via embedded SQL or ODBC. 2nd development stage (future): Neuroprofile extraction module (Version II) shall overtake the quantitative analysis completely and store the results directly into the data warehouse. © IEEE Transactions on Information Technology in Biomedicine.
At a later stage of development, the commercial software packages will be completely
substituted with the neuroprofile extraction module (Version II), which is still under
development. Version II will have direct access to the database, thus the temporary
storage of the results in proprietary files will become obsolete. This will not only enable
the usability in different clinics, but also hasten the automation. The maintenance of
non-quantitative data is accomplished by means of a database frontend. It shall be done
by the medical-technical personnel who apply the therapy.

7 Software-Technical Aspects as a Basis for Automation 71
7.2.3 Design and Implementation
Having analyzed the requirements, the database development process is continued
with the design and implementation. Corresponding steps of conceptual, logical and
physical design (Fig. 7.3) will be addressed next:
7.2.3.1 Conceptual Design
The objective of the conceptual design process is to describe the cutout of the real
world that is to be modeled by the database in a formal way, independent from the
characteristics of the target database management system. In most cases it is done
using Entity-Relationship Modeling (ERM) [96].
In ERM, physical or virtual objects and concepts of the real world are termed as
entities. Similar entities are abstracted by entity types and clustered in entity sets.
Likewise, similar relationships between entities are abstracted by relationship types
and clustered in relationship sets. The entity sets are universally characterized by
attributes which describe the owner’s properties, whereas the relationship sets may or
may not have attributes. Functionality and cardinality are two other elements which
belong to the description of the real world. They quantitatively define the links
between the entity sets which are connected via relationships. By means of these
elements, a real world system can be modeled in an entity-relationship diagram
(ERD) [93], [96].
Thus, the data warehouse outline described above is given full particulars in a global
ERD. The five parts of the database are modeled with all of their details and linked
together adequately. Fig. 7.6 shows a small part of the final diagram. The overall ERD
contains many more entity types which relate to person, proband, epilepsy patient or
diagnostic raw data.
7.2.3.2 Logical Design
The aim of this step of the design process is to map the conceptual database scheme
into the data model utilized by the target database management system (DBMS) [97].
The data model is the paradigm used by the database to store information. Currently
there are three types of data models used by databases. The relational data model is the
prevalent model used by most databases. The object-oriented model integrates aspects

7 Software-Technical Aspects as a Basis for Automation 72
of software development into the database world and is more flexible. The object-
relational model [98] is a hybrid of both which combines the sophisticated mechanisms
of relational databases with the advanced features of object-oriented databases.
Because of the fact that most of the warehouse contents have a simple structure that
can be modeled easily with relations, the object-relational data model was chosen for
the warehouse. The three-dimensional structure of the neuroprofile (Fig. 4.1) can be
adequately mapped into multi-dimensional arrays.
As a result of logical database design, a list of relations was produced from the
conceptual scheme. The entity and relationship types of the ERD became relations
(see Fig. 7.6). As an example, the “epilepsy patient” entity type was mapped to the
relation “epilepsy patient” (i.e., ID, employed, patient history, family history, epilepsy
type, epilepsy classification, focus, position, photosensibility exists, photosensibility
description).
7.2.3.3 Physical Design
This last step addresses the internals of the database system. It comprises the choice of
the target database management system, the definition of the structures used to store
the information, the mechanisms used to speed up searches, the implementation of
constraints that ensure a consistent data stock, and the management of access
rights [99].
As the target system several candidates (Borland [100], Frontbase [101], mySQL AB
[102], and Postgres [103]) were compared in facilities such as administration, interface
options, network capability, multi-user option, and costs. Finally, the PostgreSQL9 was
chosen: It is an open-source object-relational database system which offers a variety of
object-relational features. Apart from its sophisticated mechanisms to enforce data
consistency and its ability to handle large amounts of data, it has the advantage of being
free, compared to the expensive commercial database servers. For the enforcement of
data consistency domain constraints, functions and rules were used.
9 PostgreSQL was developed at the University of California at Berkeley.
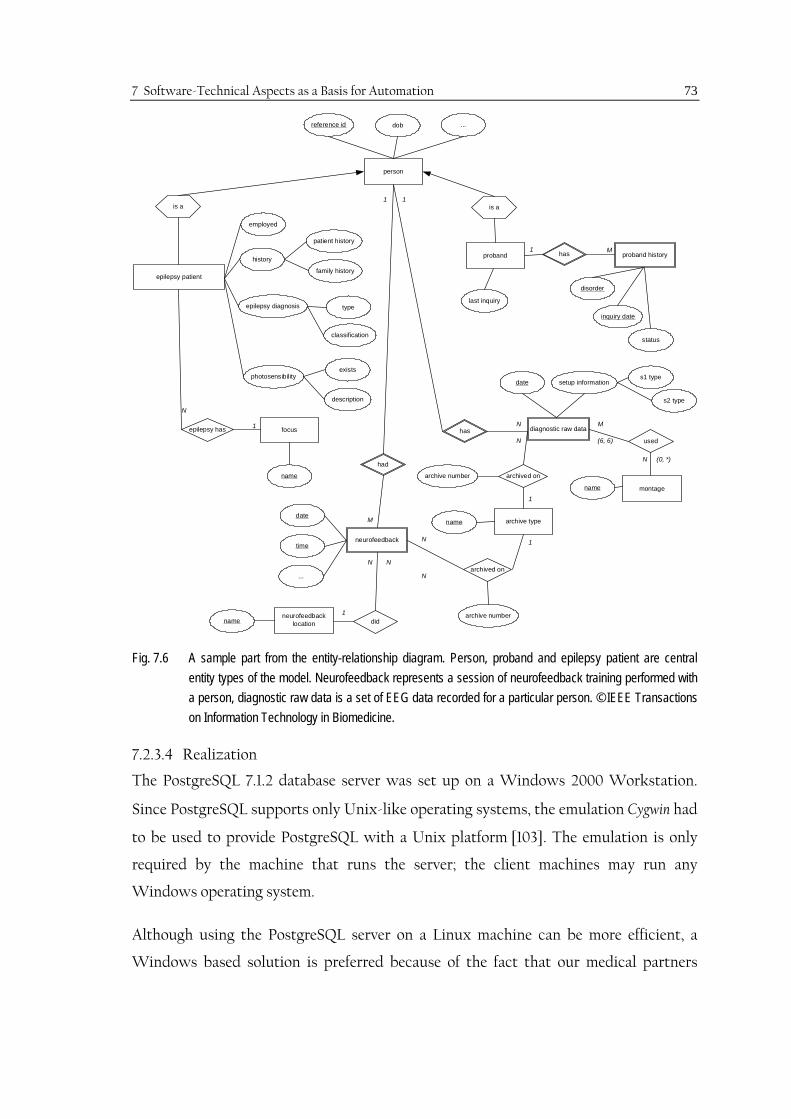
7 Software-Technical Aspects as a Basis for Automation 73
is a
inquiry date
status
epilepsy patient
reference id dob ...
patient history
family history
neurofeedbacklocationname
archive typename
neurofeedback
date
time
...
did
archived on
had
diagnostic raw data
date
archived on
type
classification
focus
name
epilepsy has
exists
description
has
person
history
epilepsy diagnosis
photosensibility
proband
is a
archive number
archive number
s1 type
s2 type
montagename
used
11
M
N
1 M
setup information
M
N
(6, 6)
(0, *)
1
1N
N
N N
1
N
N
1
last inquiry
employed
proband historyhas
disorder
Fig. 7.6 A sample part from the entity-relationship diagram. Person, proband and epilepsy patient are central entity types of the model. Neurofeedback represents a session of neurofeedback training performed with a person, diagnostic raw data is a set of EEG data recorded for a particular person. © IEEE Transactions on Information Technology in Biomedicine.
7.2.3.4 Realization
The PostgreSQL 7.1.2 database server was set up on a Windows 2000 Workstation.
Since PostgreSQL supports only Unix-like operating systems, the emulation Cygwin had
to be used to provide PostgreSQL with a Unix platform [103]. The emulation is only
required by the machine that runs the server; the client machines may run any
Windows operating system.
Although using the PostgreSQL server on a Linux machine can be more efficient, a
Windows based solution is preferred because of the fact that our medical partners

7 Software-Technical Aspects as a Basis for Automation 74
mainly use Windows operating systems, and the software components of the developed
EEG-biofeedback system are also Windows based.
As shown in Fig. 7.5, at this first stage of the development several applications are used
to enter data into the warehouse: The quantitative data are inserted by the wrapper
which gets access via ODBC, whereas the non-quantitative information needs to be
entered manually by means of the database frontend, the Neurobase (Fig. 7.7), which is
implemented in Microsoft Access. The statistical analyses are carried out by the
corresponding application (Fig. 7.5) which also has access to the database via ODBC.
More details on the data warehouse realization can be found in [104].
Fig. 7.7 NeuroBase for entering clinical information. © IEEE Transactions on Information Technology in Biomedicine.

8 Results
Having introduced our approach, measurements, methodology, and software
realizations, the results10 obtained by application of the methods on real data will be
presented next.
8.1 Epileptic Patterns Analysis
The performance of both supervised and unsupervised approaches to epileptic pattern
detection depends primarily on the measure(s) used. The better the measures
characterize epileptic activities, the higher the performance is. Hence, the performance
of the measures for pattern recognition (i.e., VM as the previously used measures, and
FD as a new feature introduced in this study) is tested and compared [105] in a set of
randomly chosen epileptic patterns (n=30) from data acquired in previous studies.
Representative results are illustrated on 3 sample patterns (Fig. 8.1-Fig. 8.3). For
facilitation of comparison, the threshold for preventing redundant segmentation is
assigned differently for each case as the value for which the highest number of
redundant segments is eliminated, without missing the desired segment boundaries.
8.1.1 Värri Measures versus Fractal Dimension
When the performance of the features was compared in the 30 randomly selected
epileptic patterns, 14 patterns (47 %) showed FD to be more sensitive to the end points
of the patterns, whereas VM detected some redundant boundaries within the patterns
before the end points were detected, as shown in Fig. 8.1 a, b. In 3 patterns (10%), VM
failed to detect the segment boundaries correctly (Fig. 8.2 a), whereas FD was
successful (Fig. 8.2 b). The results in the remaining 13 patterns were similar for both
VM and FD. The detection results as shown in Fig. 8.3 a, b, are accepted to be equally
successful. Based on these results, it was concluded that FD performs superiorly to VM
in extracting epileptic patterns in EEG [105].
10 Some partial results have been presented in different publications [89], [105]-[107].

8 Results 76
Fig. 8.1 Segmentation results for sample pattern 1, (a) Värri measures (threshold = 0.4 (*) and 0.45 (o)), (b) FD (threshold = 0.4). Window width = 1.1 sec, window overlapping = 60%. © IEEE Engineering in Medicine and Biology
Fig. 8.2 Segmentation results for sample pattern 2, (a) Värri measures (threshold = 0.3 (*) and 0.4 (o)), (b) FD (threshold = 0.35). Window width = 1.1 sec, window overlapping = 60%. © IEEE Engineering in Medicine and Biology.
(b)
330 332 334 336 338 340 342 344 346 348 350
330 332 334 336 338 340 342 344 346 348 350
330 332 334 336 338 340 342 344 346 348 350
0.35
sec
330 332 334 336 338 340 342 344 346 348 350
330 332 334 336 338 340 342 344 346 348 350
330 332 334 336 338 340 342 344 346 348 350
330 332 334 336 338 340 342 344 346 348 350
0.4
sec
(a)
0 2 4 6 8 10 12 14 16 18 20
0 2 4 6 8 10 12 14 16 18 20
0 2 4 6 8 10 12 14 16 18 20
0 2 4 6 8 10 12 14 16 18 20
0.45
sec
(a)
0 2 4 6 8 10 12 14 16 18 20
0 2 4 6 8 10 12 14 16 18 20
0 2 4 6 8 10 12 14 16 18 20
0.4
sec
(b)

8 Results 77
Fig. 8.3 Segmentation results for sample pattern 3, (a) Värri measures (threshold = 0.6 (*) and 0.75 (o)), (b) FD (threshold = 0.5). Window width = 1.1 sec, window overlapping = 60%. © IEEE Engineering in Medicine and Biology.
There are further observations which need to be emphasized concerning the FD as a
feature for adaptive EEG segmentation and epileptic pattern extraction [105]: The first
observation is that FD decreases in epileptic pattern intervals (Fig. 8.1 b, Fig. 8.2 b, Fig.
8.3 b). Secondly, FD is more sensitive to the end points of the epileptic patterns, and it
is more stable within the pattern interval. If we assume that the brain switches from a
higher dimensional “normal” state to a lower dimensional “pathological” stationary
state in the epileptic pattern intervals, it can be stated that the FD, as a feature, better
reflects these changes in physiological state. Another advantage of FD is that it can be
used as a single measure without any weight coefficients in the adaptive segmentation
algorithm eq. (6.12). On the other hand, FD was observed to detect more segment
boundaries outside the pattern intervals than the VM. This was regularly observed in the
sample patterns (Fig. 8.1-Fig. 8.3). Further discussion and investigations are required in
order to determine whether these are redundant segment boundaries or really
significant state changes.
8.1.2 Supervised and Unsupervised Detections
For supervised detection, the performance of the measures also reflects the performance
of detection, since the patterns are assigned as “recognized” if the measures are within a
190 192 194 196 198 200 202 204 206 208 210
190 192 194 196 198 200 202 204 206 208 210
190 192 194 196 198 200 202 204 206 208 210
190 192 194 196 198 200 202 204 206 208 210
0.75
sec
(a)
190 192 194 196 198 200 202 204 206 208 210
190 192 194 196 198 200 202 204 206 208 210
190 192 194 196 198 200 202 204 206 208 210
0.5
sec
(b)

8 Results 78
range of tolerance. The decisive parameter of the method is the tolerance E, which
determines the recognition sensitivity.
In addition to the measures, the efficiency of clustering is important to the overall
performance in unsupervised quantification. Having concluded that FD is superior to
VM as a feature for extracting epileptic patterns, it was applied to unsupervised
quantification via fuzzy clustering. A sample analysis result is given for a channel of an
EEG recording, in which epileptic patterns were observed. The number of clusters is a
priori assigned as 6, according to experimental results on different data.
Fig. 8.4 Sample results of fuzzy clustering after adaptive segmentation based on FD on an EEG channel. Statistics (percentage occurrence) of the clusters which have the corresponding FD value as the center.
Based on the observation that FD decreases in epileptic pattern intervals, the clusters,
which have lower FD values as their centers, should be considered epileptic pattern
clusters: As seen in Fig. 8.4, cluster 6 (FD=1.82), cluster 4 (FD=1.99) and cluster 3
(FD=2.14) should be considered possible epileptic pattern clusters. The medical expert
must decide which clusters are to be accepted as such. Epileptic spike wave complexes
are clearly seen in cluster 6.

8 Results 79
The adaptive segmentation algorithm has three important parameters which need to be
discussed: the window width, the percentage overlapping of the successive windows,
and the threshold.
a. The window width should not be selected larger than 1.5 sec in order to more
accurately detect non-stationarities. It should also conform to the number of
data points required to sufficiently calculate the selected feature. On the other
hand, the smaller the window width, the higher the computational load.
b. The overlapping has a similar effect to the algorithm: The longer the overlapping
is (smaller step length), the greater the number of segments found. This means a
longer computation time and an increase in the number of redundant segments.
However, if the overlap is too small, the necessary segment boundaries to be
detected can be missed.
c. The threshold is the parameter which determines the sensitivity of the
algorithm. The higher the threshold is, the less sensitive the algorithm is to the
non-stationarities. If the threshold is too low, then the problem of redundant
segmentation appears.
The setting of all three parameters is a trade-off between topical sufficiency
(respectively redundancy) and computational complexity. In our software
development, these parameters can be input as desired so that their influence on the
performance of the algorithm can be observed. Based on our empirical results, we
recommend a window length of 1.1 sec at a sampling rate of 128 Hz, and a window
overlapping of 60%. The software also allows the automation of the analysis where we
assign the window width and the overlapping a priori according to experimental
results. For automated analysis, the threshold for the segment boundary detection (i.e.,
for function G see section 6.1.3.1) is determined adaptive recursively according to the
distribution of the normalized values of G through the data interval analyzed [87].

8 Results 80
8.2 Differences in the Contingent Negative Variation between Patients and Controls
The CNV measurements are analyzed according to the procedures presented in
section 6.2. In order to enlarge the statistical pool, additional measurements from
previous studies are integrated into the analysis. The data are analyzed for both the
patient group (n=12) and healthy controls (n=11). Sample results from a control subject
are illustrated in Fig. 8.5 for 28 EEG channels.
Fig. 8.5 Sample CNV results for 28 EEG channels. Initial measurement of subject S1JN. Time average of 20 sweeps.
According to our results, CNV occurs after presentation of the warning stimulus S1,
whereas positive DC shifts occur after the presentation of the stimulus S2 (Fig. 8.6).
The topology of dcnv is demonstrated for a control subject (Fig. 8.7 a) and a patient (Fig.
8.7 b). Comparisons of the central line electrodes Fcz, Cz, Cpz, and Pz between the
patient group and the controls indicate significant differences (Table 8-1) [89], [106]. In
the control group, the mean values of the CNV and the post-S2 level are significantly
different at all electrode positions with exception of Pz in the non-aversive case,
whereas in the patient group, these levels are significantly different only at the
electrode position Cz in the aversive case (Wilcoxon-Signed-Rank-Test, p<0.05). The

8 Results 81
dcnv for aversive stimuli is higher than for non-aversive stimuli in all subjects and
patients in all channels at which CNV is clearly observed.
-1 0 1 2 3 4 5 6 7 8 9 10 11 12
-12.01
0
8.67
Time [ s ]
Am
plitu
de [ µ
V ]
S2 S1
mean(PostS2)
mean(CNV)
dCNV=mean(CNV)-mean(PostS2)
Fig. 8.6 Quantification of CNV results, dcnv. Subject S5PT, initial measurement, channel Cz.
Fig. 8.7 Topological mapping of the measure dCNV from, a) control subject S2MN, initial measurement; b) epilepsy patient P4ES, pre-therapy measurement.
FP1 FP2
F3 F4
C3 C4
P3 P4
O1 O2
F7 F8
T4
T5
CZ
FZ
PZ
FCZ
CPZ CP3 CP4
FC3 FC4
TP7 TP8
OZ
18µV
-22µV
(a)
FP1 FP2
F3 F4
C3 C4
P3 P4
O1 O2
F7 F8
T4
T5
CZ
FZ
PZ
FCZ
CPZ CP3 CP4
FC3 FC4
TP7 TP8
OZ
18µV
-22µV
(b)

8 Results 82
Table 8-1 CNV Comparison between patients and control subjects. © IEEE Transactions on Information Technology in Biomedicine.
Results (p)
Wilcoxon Signed-Rank-Test, p<0.05
Channel
Patients
Aversive case
Patients
Non-aversive case
Controls
Aversive case
Controls
Non-aversive case
Fcz 0.077 0.204 0.001 0.005
Cz 0.042 0.569 0.003 0.024
Cpz 0.063 0.424 0.003 0.019
Pz 0.110 0.569 0.010 0.413
8.3 Differences in the Hyperventilation Induced DC-Shifts
Hyperventilation induced shifts in DC-potentials are analyzed via the method
introduced in section 6.3. In Fig. 8.8, a sample result of the DC analysis is given for a
standard measurement from a control subject:
Fig. 8.8 DC-level during a standard measurement for all EEG electrodes. Subject S5PT, initial measurement.
Triggers: F6=HV-start, F7=HV-end, F4=recovery-end.
As seen in Fig. 8.8, not all electrodes are stable (i.e., artifact free) along the
measurement (e.g., P3). Nevertheless, a pattern appears, which can be extracted from
the results within the hyperventilation interval and thereafter: The trigger F6 is the
beginning and F7 is the end of hyperventilation, which continues for three minutes. The

8 Results 83
trigger F4 points to three minutes after the end of hyperventilation. We define this
interval as recovery. If we select the central electrode positions (Fz, Cz, Pz, and Oz)
and also include other frontal (Fp1, Fp2) and occipital (O1, O2) electrodes, we obtain
the following pattern in Fig. 8.9 for a control subject and Fig. 8.10 for a patient.
0 188 372-100
-50
0
50
100
150
200
Time [s]
Am
plitu
de [µ
V]
HV-start HV-end Hyperventilation Recovery
Oz
O1
O2
Fp1 Fp2
Pz
Fz, Cz
Fig. 8.9 DC-shifts during and after hyperventilation at electrode positions Fp1, Fp2, Fz, Cz, Pz, Oz, O1, and O2.
t = 0, hyperventilation starts; t = 185 s, hyperventilation ends. Subject S5PT, 1st evaluation measurement.
0 176 360
-275
-250
-200
-150
-100
-50
0
25
Time [s]
Am
plitu
de [µ
V]
HV-start HV-end Hyperventilation Recovery
Pz
O2
Fp1
O1
Oz
Fz
Cz
Fp2
Fig. 8.10 DC-shifts during and after hyperventilation at electrode positions Fp1, Fp2, Fz, Cz, Pz, Oz, O1, O2. t = 0, hyperventilation starts; t = 176 s, hyperventilation ends. Patient P2WM, pre-therapy measurement.

8 Results 84
After the linear regression (Fig. 8.11), the quantitative parameters shv and srec are
extracted.
0 188 372
-50
0
50
Cz
Time [s]
Am
plitu
de [µ
V]
0 188 372
-50
0
50
Fz
Time [s]
Am
plitu
de [µ
V]
0 188 372
-50
0
50
Pz
Time [s]
Am
plitu
de [µ
V]
0 188 372
-50
0
50
Oz
Time [s]
Am
plitu
de [µ
V]
Hyperventilation Recovery
Fig. 8.11 Linear regression for determining the rate of change of DC-level within HV and recovery intervals.
The topographic distribution of the rate of change of DC-level at different electrode
positions can be mapped as in Fig. 8.12 and Fig. 8.13.
Fig. 8.12. Topological mapping of the rate of change of DC-level for a control subject (S1JN, initial measurement), a) hyperventilation (shv), and b) recovery (srec).
FP1 FP2
F3 F4
C3 C4
P3 P4
O1 O2
F7 F8
T3 T4
T5 T6
CZ
FZ
PZ
FCZ
CPZ CP3 CP4
FC3 FC4
TP7 TP8
OZ
0.48µV/s
-0.46µV/s
(b)
FP1 FP2
F3 F4
C3 C4
P3 P4
O1 O2
F7 F8
T3 T4
T5 T6
CZ
FZ
PZ
FCZ
CPZ CP3 CP4
FC3 FC4
TP7 TP8
OZ
0.19µV/s
-0.68µV/s
(a)

8 Results 85
Fig. 8.13 Topological mapping of the rate of change of DC-level for an epilepsy patient (P2WM, pre-therapy measurement), a) hyperventilation (shv), and b) recovery (srec).
As seen in Fig. 8.12 and Fig. 8.13, the highest DC-shifts, both in hyperventilation and
recovery, are observed either at Cz and/or Fz. Therefore, the rate of change of DC-levels
in HV and recovery intervals at the vertex (Cz) are compared between control subjects
and epilepsy patients for those measurements in which the stability of the electrodes
was satisfactory. The results at the central electrode positions (Fz, Cz, Pz and Oz) for
the control subjects (Table 8-2) and for the pre-therapy measurements of the patients
(Table 8-3) are given below:
Table 8-2 Rate of change of DC-level within HV and recovery intervals for control subjects.
Rate of Change of DC-level Subject Code
Hyperventilation shv (µV/s) Electrode
Fz Cz Pz Oz
Recovery srec (µV/s) Electrode
Fz Cz Pz Oz S1JN -0.56 -0.60 -0.56 -0.29 0.40 0.48 0.18 0.05 S2MN -0.18 -0.25 -0.16 0.01 0.21 0.31 0.20 0.04 S3AD -0.34 -0.73 -0.05 0.60 0.47 0.58 0.22 -0.83 S4OL -0.28 -0.43 -0.22 0.35 0.23 0.21 0.04 -0.35 S5PT -0.51 -0.47 -0.34 -0.08 0.30 0.41 0.08 -0.01 S6CR -0.57 -0.53 -0.53 -0.33 0.20 0.26 -0.00 0.03
FP1 FP2
F3 F4
C3 C4
P3 P4
O1 O2
F7 F8
T3 T4
T5 T6
CZ
FZ
PZ
FCZ
CPZ CP3 CP4
FC3 FC4
TP7 TP8
OZ
0.15µV/s
-0.35µV/s
(b)
FP1 FP2
F3 F4
C3 C4
P3 P4
O1 O2
F7 F8
T3 T4
T5 T6
CZ
FZ
PZ
FCZ
CPZ CP3 CP4
FC3 FC4
TP7 TP8
OZ
0.15µV/s
-0.75µV/s
(a)

8 Results 86
Table 8-3 Rate of change of DC-level within HV and recovery intervals for patients.
Rate of Change of DC-level Patient Code
Hyperventilation shv (µV/s) Electrode
Fz Cz Pz Oz
Recovery srec (µV/s) Electrode
Fz Cz Pz Oz P1MH -0.05 -0.17 -0.14 -0.09 0.10 0.27 0.29 0.09 P2WM -0.50 -0.59 -0.31 -0.37 -0.11 -0.07 0.09 0.02 P3GM 0.01 -0.50 -0.21 -0.12 0.22 -0.00 0.40 0.15 P4ES -0.10 -0.17 -0.19 0.35 0.32 0.26 -0.00 -0.73 P5RB -0.37 -0.40 -0.05 0.46 0.55 0.59 0.19 -0.90 P6MU -0.76 -0.80 -0.37 -0.08 0.09 -0.14 0.06 -0.11
Table 8-4 Percentage DC-recovery after hyperventilation in patients and controls.
Patient Code % DCIrec at the vertex (Cz)
Subject Code % DCIrec at the vertex (Cz)
P1MH 159% S1JN 80% P2WM -12%, negative shift, no recovery S2MN 124% P3GM -0.8%, negative shift, no recovery S3AD 80% P4ES 153% S4OL 49% P5RB 148% S5PT 87% P6MU -11%, negative shift, no recovery S6CR 49%
The results of the DC-level analysis during and after hyperventilation (Table 8-2, Table
8-3) indicate that [107]:
a. the observed negative DC shifts upon hyperventilation are highest at either Cz
or Fz electrode position in both groups;
b. positive DC shifts are observed at occipital electrodes in 3 control
subjects (50%), and 2 patients (33%);
c. the DC shifts tend to recover after the hyperventilation in the control group;
d. in three patients (P2WM, P3GM, P6MU) (50%), the shifts tend to continue in
negative direction (i.e., recovery is not observed) at the vertex (Cz). (Table 8-4);
e. in the other three patients (50%), the percentage recovery at the vertex is much
higher (Table 8-4, P1MH=159%, P4ES=153%, P5RB=148%) than the average of
control group (78%).

8 Results 87
8.4 Instantaneous Heart Rate and Hyperventilation
Changes in the IHR resulting from hyperventilation are analyzed according to the
procedure defined in section 6.4 in both groups. Sample results from a control subject
and a patient are illustrated in Fig. 8.14 and Fig. 8.15, respectively. The first observation
is that the increases in IHR resulting from hyperventilation have a non-linear character.
Similarly, the decreases in IHR within the recovery interval show a non-linear
character. Standard deviation of IHR within these intervals indicates subject specific
variety. The results of HRbsl, HRhv, and HRrec, as well as %HRrec/hv and %HRIhv, are listed for
control subjects in Table 8-5 and for patients in Table 8-6.
2 4 6 8 10 12 14
-400
-200
0
200
400
Time [min]
Am
plitu
de [µ
V]
Pre-processed ECG Channel
* * * * * * * * * * * * * * * * * * * * * * * * * *
-200
0
200
400R-Positions
Am
plitu
de [µ
V]
F6 (HV-start) F7 (HV-end) F4 (Recovery-end)
60
80
100
t' = 3 min
IHR
[bea
ts/m
in]
Hyperventilation Recovery
Time [s]270 291 IHRC
t' = 0 t' = 6 min
(a)
(b)
(c)
Fig. 8.14 IHR analysis result during HV and recovery for a control subject (S4OL). (a) the ECG channel after pre-processing from the standard I measurement, (b) the detected R peaks (an interval zoomed from (a)), (c) the corresponding IHRC.

8 Results 88
2 4 6 8 10 12 14 16 18 20 22
-200
0
200
400
Time [min]
Am
plitu
de [µ
V]
Pre-processed ECG Channel
* * * * * * * * * * * * * * * * * * * * * * * * *-100
0
100
200
300R-Positions
Am
plitu
de [µ
V]
F6 (HV-start) F7 (HV-end) F4 (Recovery-end)
65
70
75
80
t' = 3 min
IHR
[bea
ts/m
in]
Hyperventilation Recovery
Time [s] 124 145
IHRC
t' = 0 t' = 6 min
(a)
(b)
(c)
Fig. 8.15 IHR analysis result during HV and recovery for a patient (P2WM). (a) the ECG channel after pre-processing from the standard I measurement, (b) the detected R peaks (an interval zoomed from (a)), (c) the corresponding IHRC.
Table 8-5 Measures HRbsl, HRhv, HRrec and the indices %HRrec/hv and %HRIhv for control subjects in initial measurements.
Subject
Code
HRbsl
(beats/min)
HRhv
(beats/min)
HRrec
(beats/min)
%HRrec/hv %HRIhv
S1JN 93 107 93 13% 100%
S2MN 78 89 75 16% 127%
S3AD 84 129 95 36% 76%
S4OL 65 104 71 32% 85%
S5PT 71 109 90 17% 50%
S6CR 61 78 62 21% 94%

8 Results 89
Table 8-6 Measures HRbsl, HRhv, HRrec and the indices %HRrec/hv and %HRIhv for patients in pre-therapy measurements.
Patient
Code
HRbsl
(beats/min)
HRhv
(beats/min)
HRrec
(beats/min)
%HRrec/hv %HRrec
P1MH 68 71 69 3% 67%
P2WM 72 79 74 6% 71%
P3GM 67 76 71 7% 56%
P4ES 58 62 57 8% 125%
P5RB 68 85 73 14% 71%
P6MU 83 105 98 7% 32%
8.5 DC-Shifts and Instantaneous Heart Rate in Patients and Controls
Combining the quantitative measures of EEG/DC-shifts and of the changes in IHR
induced by hyperventilation, we obtain the following results illustrated in Fig. 8.16 and
Fig. 8.17 for patients and controls:
Fig. 8.16 srec at the vertex (Cz) versus %HRrec/hv in patients (PT) and controls (CS).
As seen in Fig. 8.16, where the measure srec is plotted versus the index %HRrec/hv, the
patients can be distinguished from the controls with a single exception.
-0,2
0
0,2
0,4
0,6
0,8
0 10 20 30 40
%HRrec/hv
Srec
[µV/
s]
Controls Patients
? PT CS

8 Results 90
Fig. 8.17 DCIrec at the vertex versus HRIhv in patients and controls.
Using the indices %DCIrec and %HRIhv, we obtain another view (Fig. 8.17). Two clusters
of patients (i.e., PT1 and PT2) can be distinguished from the controls (CS). There is a
fourth cluster (OG) which includes a patient and a control subject. If we set a range for
%DCIrec, for instance 30-130%, the controls can be placed in a zone between the patient
groups.
8.6 EEG-Biofeedback Adjustment and Learning
Depending on the results of the initial measurements, namely, according to the
amplitude and topology of the CNV, EEG-biofeedback sessions are configured subject
specifically: The training electrode position and the scaling of the feedback are assigned
accordingly. As defined in chapter 5, learning was accepted to be achieved, if at least
70% of the trials in successive sessions were successful. Hence, all the control subjects
(100%) learned to control the SCP at the assigned feedback electrode position. In the
patient group, learning was achieved in five patients (83%) in one case (i.e, P3GM) not.
The patient P3GM had strong visual and acoustic cognitive deficits which could not be
compensated by various configurations of the EEG-biofeedback system.
-50
0
50
100
150
200
0 50 100 150
% HRIhv
% D
CIrec
Controls Patients
OG? PT2
CS
PT1

8 Results 91
8.7 Application of the Methodology on Sample Cases for Pre- and Post-Therapy Comparisons
Two patients (P2WM and P5RB) were available for the longer follow-up of the applied
therapy. The developed methodology for therapy evaluation will be demonstrated next
with these two cases.
8.7.1 Case I – P2WM
P2WM is a 47 years old male focal epilepsy patient with complex focal and secondary
generalized tonic-clonic seizures. He has an intractable epilepsy history of 44 years.
Focus is diagnosed to be right temporal with interference to the contralateral region.
The feedback electrode was at the vertex (Cz electrode position) and the training was
carried out with different feedback types (i.e., visual, acoustic and combined). See
Table 5-2 for further details. The medication type and doses were kept constant
through the neurotherapy. Clinical success was achieved in two aspects in this case:
a. seizure frequency was reduced, b. the patient gained control over the seizures which
were accompanied by an aura. The results of feature quantification at the central line
EEG electrodes and the ECG channel are listed in Table 8-7 for all three evaluation
measurements (evaluation measurement 1 is the pre-therapy measurement) for the case.
Table 8-7 Results of follow-up for patient P2WM.
Patient P2WM Parameter
Evaluation Measurement 1 Electrode
Evaluation Measurement 2 Electrode
Evaluation Measurement 3 Electrode
Fz Cz Pz Oz Fz Cz Pz Oz Fz Cz Pz Oz
DC-hypervetilation shv (µV/s)
-0.50 -0.59 -0.31 -0.37 -0.24 -0.24 -0.13 -0.02 -0.30 -0.45 -0.33 -0.05
DC-recovery srec (µV/s)
-0.11 -0.07 0.09 0.02 0.41 0.27 0.31 0.14 0.22 0.23 0.21 0.27
CNV dCNV (µV)
6.67 -1.80 -0.66 11.83 0.56 -14.71 -6.75 4.54 -4.99 -6.09 -1.43 -18.30
Epileptic patterns %Opi
0.0 0.0 0.0 0.0 0.0 0.0 0.0 0.0 0.0 0.0 0.0 0.0
IHR %HR2rec
71% 60% Strong artifact in ECG channel

8 Results 92
In this patient, we observed changes in the quantitative parameters of the DC-shifts
associated with hyperventilation. The measure srec, which had negative values before
the therapy, has positive values in evaluation measurements in the follow up (compare
Fig. 8.10 and Fig. 8.18). These results indicate that the recovery, which was not
observed at the electrode positions Fz and Cz before the therapy, occurs after the
therapy.
0 168 360
-150
-100
-50
0
50
100
Time [s]
Am
plitu
de [ µ
V]
Hyperventilation Recovery HV-end HV-start
Fp2
O2
O1 Oz
Pz
Cz
Fz
Fp1
Fig. 8.18 DC-shifts during and after hyperventilation at electrode positions Fp1, Fp2, Fz, Cz, Pz, Oz, O1, and O2. t = 0, hyperventilation starts; t = 176 s, hyperventilation ends. Patient P2WM, evaluation measurement 3.
As seen in Table 8-7, the parameter %EPOi is 0.0 for all electrode positions, namely, no
epileptic patterns were observed in any measurements in this patient. The %HRIhv
decreases in the second measurement and cannot be computed due to strong artifacts
in the ECG channel in the third measurement.
Changes in terms of “normalization” were observed in the parameter of CNV. The
topological distribution of the measure dCNV is mapped using the same scale for all three
measurements in Fig. 8.19. When Fig. 8.19 (a), (b) and (c) are compared, the measure
dCNV, which was hardly observable in the pre-therapy measurement (at Cz=-1,80), is
seen to enlarge topologically and becomes more dominant at the fronto-central
electrode positions in the second (at Cz=-14,71) evaluation measurement. Although it
becomes less in the third evaluation (at Cz=-6,09) measurement, it is still much higher
than in the first measurement.

8 Results 93
Fig. 8.19 CNV results of evaluation measurements in patient P2WM, (a) evaluation measurement 1 (pre-therapy), (b) evaluation measurement 2, (c) evaluation measurement 3.
8.7.2 Case II – P6RB
P6RB is a 33 years old female focal epilepsy patient with focal and generalized seizures.
The focus is diagnosed to alternate in different measurements (i.e, left and right
temporal regions). She has 21 years of intractable epilepsy history accompanied with
organic psychosyndrome and depression. In neurotherapy, the feedback electrode
position was Fz and the patient was trained with different feedback types (i.e., visual,
acoustic and combined). See Table 5-2 for further details. In this patient medication
reduction was achieved. Although fewer seizures were registered, the decrease in
seizures was not significant.
FP1 FP2
F3 F4
C3 C4
P3 P4
O1 O2
F7 F8
T3 T4
T5 T6
CZ
FZ
PZ
FCZ
CPZ CP3 CP4
FC3 FC4
TP7 TP8
OZ
15µV
-15µV
(a)
FP1 FP2
F3 F4
C3 C4
P3 P4
O1 O2
F7 F8
T3 T4
T5 T6
CZ
FZ
PZ
FCZ
CPZ CP3 CP4
FC3 FC4
TP7 TP8
OZ
15µV
-15µV
(b)
FP1 FP2
F3 F4
C3 C4
P3 P4
O1 O2
F7 F8
T3 T4
T5 T6
CZ
FZ
PZ
FCZ
CPZ CP3 CP4
FC3 FC4
TP7 TP8
OZ
15µV
-15µV
(c)

8 Results 94
In Table 8-8, results of feature quantification at the central line EEG electrodes and the
ECG channel are presented for the evaluation measurements. The topological
distributions of the measure dCNV in different measurements are seen in Fig. 8.20.
Table 8-8 Results of follow-up for patient P5RB.
Comparing the maps of the measure dCNV, we see that the topology changes in the
course of the therapy. The frontal dominance at the Fz electrode in the pre-therapy
measurement moves to te central electrode Cz in the second evaluation measurement.
In the third evaluation measurement, dCNV is clearly more negative (i.e, higher absolute
value) again at Fz. The distribution is more circumscribed, with the central and fronto-
central electrode positions in the second and third evaluation measurements, than in
the pre-therapy measurement.
Changes in the srec do not conform to our expectations (Table 8-8): the DC-recovery
becomes slower in all mid-line electrodes in the second measurement. In the last
measurement, the percentage recovery even becomes significantly negative at the
vertex. As seen in Table 8-7 (parameter %EPOi), no epileptic patterns were observed in
the measurements from this patient. The %HRIhv measure, which is 71% in the first
measurement, decreases to 58% in the second one. In the third measurement, on the
Patient P5RB Parameter
Evaluation Measurement 1 Electrode
Evaluation Measurement 2 Electrode
Evaluation Measurement 3 Electrode
Fz Cz Pz Oz Fz Cz Pz Oz Fz Cz Pz Oz
DC-hypervetilation shv (µV/s)
-0.37 -0.40 -0.05 0.46 -0.61 -0.38 -0.04 0.91 -0.45 -0.61 -0.70 -0.81
DC-recovery srec (µV/s)
0.55 0.59 0.19 -0.90 -0.00 0.14 0.11 -0.34 0.07 -0.13 -0.00 -1.65
CNV dCNV (µV)
-16.97 -14.16 -1.79 -2.56 -5.50 -17.15 -6.07 17.05 -15.30 -9.42 15.96 4.69
Epileptic patterns %Opi
0.0 0.0 0.0 0.0 0.0 0.0 0.0 0.0 0.0 0.0 0.0 0.0
IHR %HR2rec
71% 58% 82%

8 Results 95
other hand, it is higher (i.e., 82%) than the first measurement, which indicates a faster
HR recovery.
Fig. 8.20 CNV results of evaluation measurements in patient P5RB, (a) evaluation measurement 1 (pre-therapy), (b) evaluation measurement 2, (c) evaluation measurement 3.
FP1 FP2
F3 F4
C3 C4
P3 P4
O1 O2
F7 F8
T3 T4
T5 T6
CZ
FZ
PZ
FCZ
CPZ CP3 CP4
FC3 FC4
TP7 TP8
OZ
15µV
-15µV
(a)
FP1 FP2
F3 F4
C3 C4
P3 P4
O1 O2
F7 F8
T3 T4
T5 T6
CZ
FZ
PZ
FCZ
CPZ CP3 CP4
FC3 FC4
TP7 TP8
OZ
15µV
-15µV
(b)
FP1 FP2
F3 F4
C3 C4
P3 P4
O1 O2
F7 F8
T3 T4
T5 T6
CZ
FZ
PZ
FCZ
CPZ CP3 CP4
FC3 FC4
TP7 TP8
OZ
15µV
-15µV
(c)

9 Discussion
In the present chapter we will inspect the results of our work, which had several facets.
It will be helpful to remember that the main objective was to develop a concept and a
methodology for objective diagnosis, (neuro)therapy planning and evaluation in
epilepsy. In chapter 3 (section 3.4), we had defined the major components of our
solution to the problem in terms of biomedical engineering as:
a. Development of a strategy for objective diagnosis and therapy evaluation,
b. Data acquisition corresponding to the strategy,
c. Signal processing for feature extraction and quantification,
d. Data management.
It will be our goal to appraise the findings and achievements in these major components
in a self-critical manner.
9.1 Clinical Tools for Decision Supporting in (Neuro)therapy Evaluation
The software concept, which has signal analysis (i.e, the neuroprofile extraction
module) and data management (i.e., the database) parts as main elements, is the first
step for an automation of the therapy planning and evaluation procedures. The aim is
increased objectivity in these procedures through quantitative parameters, which are
structured by the neuroprofile and managed by the database. It must be emphasized
that the system is not conceptualized as a biomedical signals database, which would
facilitate the storage of polygraphic signals, or an electronic patient record, but rather
as a clinical data warehouse that documents the elements of therapies, clinical findings
and the quantitative results of the analyses applied to the acquired signals of different
formats (e.g., formats of BrainQuick and NeuroScan systems).
Although there are nomenclatures and data dictionaries of certain biomedical
measurements and related data, for instance Vital Signs Information Representation
(VITAL) by the Technical Committee 251 of European Standardization Committee

9 Discussion 97
(CEN/TC251) or the Systematized Nomenclature of Medicine (SNOMED), and
standard formats for the acquired raw data such as European Data Format (EDF) or
Extensible Biosignal Format (EBS) for EEG; the efforts for standardization of the
quantitative parameters extracted from polygraphic signals are restricted to ECG11. To
our knowledge, there are no such efforts for the quantitative parameters of EEG signals
and event-related potentials (e.g., CNV), or for neurotherapy which is an emerging
unconventional treatment. Therefore, the majority of the objects and attribute
structures had to be designed specifically in this study.
As a result of the database development, several aspects arose that need to be
considered for improvement in the future:
9.1.1 Refinement of the Data Model
During the design process, the non-quantitative medical information proved to be more
complex than expected, and its structuring was not trivial. Some of the medical
information is stored in verbal phrases. This may suffice for the evaluation purposes of
one particular person, but it is insufficient for analyses affecting all persons included in
the database. Fruitful analysis requires the information to be stored in a structured way
and broken down into manageable quantities, rather than in verbal phrases. This is only
possible with extensive medical expertise. The refinement of the data model should be
considered in future versions of the data warehouse.
9.1.2 Integration of Existing Clinical Databases
At the current stage, the non-quantitative data have to be entered into the database
manually, even though they are, at least partially, included in other databases. A
medical-technical assistant is currently responsible for the task. This fact surely
complicates the sustainability of the system in the long run, since the physicians in
clinical practice are not willing to invest much time for data entry. Means of integrating
the already available information or importing it using standards for health informatics
11 Common Standards for Quantitative Electrocardiography (CSE), which is a part of the Open European
Data Interchange and Processing for Electrocardiography (OEDIPE) project.

9 Discussion 98
should be also considered for the future improvement of the system. Integration of
existing clinical databases will significantly enhance the long-term sustainability.
9.1.3 Forming a Normative Database, Data Mining and Decision Supporting
To gain knowledge not only on a particular person, but of a general nature, a
representative data stock is necessary. This requires the persons comprising to the
group to match certain criteria concerning factors such as age, sex, and handedness.
Such a normative data stock will enable the use of data mining techniques12 for an
automated discovery of correlations and patterns in vast amounts of existing data, and
thus, encourage the extraction of hidden knowledge in the stored data. The group of
control subjects involved in the study is too small to achieve necessary statistical
prerequisites. Further studies should be conducted to form a normative database.
Another future vision is the progression of the database to a decision support system
for an automated therapy evaluation. Via methods of Artificial Intelligence, suggestions
for therapy adaptation and/or modification can be produced from a set of existing facts
and insights, and presented to clinical experts.
9.2 Selected Quantitative Measures
The prerequisite for any quantitative measure to be accepted as a feature for therapy
evaluation is that it distinguishes between a certain pathological state and normal
functioning. The quantitative measures investigated in our work were selected either
because of their relevance to epilepsy (i.e, percentage occurrence of epileptic patterns)
or to SCP based neurotherapy (i.e, measures of CNV and hyperventilation induced DC-
shifts). Epileptic patterns are clinically established features, whereas other measures
had not been previously investigated in this context. Therefore, we had to test the novel
measures for their applicability, namely, compare them between patients and control
subjects. Our comparisons indicated statistically significant differences in measure dCNV
(Table 8-1) as well as measures srec and %DCIrec of hyperventilation induced DC-shifts
(Table 8-4). Although the measures of changes in the IHR during hyperventilation also
12 A comprehensive overview on current data mining techniques can be found in http://damit.dfki.de/.

9 Discussion 99
indicate differences between patients (Table 8-5) and controls (Table 8-6), conclusions
cannot be drawn from the results for these measures. Nevertheless, the method, in
which srec is plotted versus %HRrec/hv (Fig. 8.16), and %DCrec verus %HRIhv (Fig. 8.17)
demonstrate the usefulness of integrating the quantitative IHR measures in the analysis
for comparisons between patients and controls.
The findings of comparisons between patients and controls are primarily useful for
diagnostics. Going a step further, we tested and demonstrated the application of our
methodology and measures for pre- and post-therapy comparisons in those patients,
who were available for longer follow-up (section 8-7).
Changes in the measures dCNV and %DCIrec, which can be considered as “normalization”,
are observed in a single case (Case I, section 8.7.1). In the second sample case (Case II,
section 8.7.2), however, the results did not conform to those of Case I or to our
expectations. The measure %DCIrec, which was positive in the pre-therapy measurement
(i.e., recovery occurs), became less in the second evaluation measurement and was even
negative (i.e., no recovery) in the third measurement. These two sample cases are
insufficient to derive conclusions. Measurements and follow-up studies on new
epilepsy patients with a successful neurotherapy history are required for conclusions
based on statistical significance. The recruitment of a statistically significant number of
patients exceeds the scope of the current work, since, neurotherapy, as an
unconventional treatment does not yet have priority in the list of treatments, and
health insurance regulations prevent the compensation of the costs of the novel
treatment if a person is an outpatient. Therefore, the patients had to agree to cover their
own expenses for the training and evaluation measurements in the follow-up period, in
which they were outpatients.
Nevertheless, future data related to such measurements from new patients and/or
healthy controls can be analyzed using the methods developed in the current work, and
the quantitative results can be integrated into the data warehouse without any exertion
for further statistical comparisons. Yet, it is not until all the substantial components of
the neuroprofiles (e.g., additional measures related to odd-ball or photostimulation
measurements – see chapter 4, section 4.2) are entered into the database that the
information can be extensively exploited for diagnostics and therapy evaluation. The

9 Discussion 100
extension is a long-term process involving several clinical studies. This process will be
hastened by automation through the mathematical and software tools developed (i.e.,
neuroprofile, neuroprofile extraction module, and the database system).
Next, the selected measures will be discussed more in detail.
9.2.1 Graphoelements
The performance of the features for epileptic pattern extraction is tested on a set of
randomly chosen epileptic patterns from data acquired in previous studies. In these
comparisons, the new feature, FD, proved to perform superiorly to the previously used
VM. Although epileptic patterns in EEG are considered clinically more established
features in epilepsy, we did not commonly observe such activities in our measurements.
This is probably due to the fact that such patterns are infrequent in focal epilepsy
patients, who are considered to be more suitable for neurotherapy. The measure %EPOi
should be reserved as a quantitative parameter for those cases, in which such patterns
are observed.
9.2.2 Contingent Negative Variation
The quantitative parameter dCNV shows significant differences in amplitude and
topology between the patients and controls (Table 8-1). This information can be used
for diagnostics as well as therapy evaluation. In case P2WM, changes in this parameter
were observed in the follow up (Table 8-7 and Fig. 8.19). in order to be statistically
significant, data from further patients with a successful history of neurotherapy are
necessary.
9.2.3 Hyperventilation Induced DC-Shifts in EEG and Changes in IHR
Although hyperventilation is used as a provocation to induce epileptic discharges in
clinical examinations, the accompanying DC-shifts had not been considered for their
potential diagnostic relevance. The results presented in this study indicate differences
in the hyperventilation induced DC-shifts between patients and controls especially in
the recovery process (i.e., percentage recovery) (Table 8-4). In 3 patients (50%), the
recovery is not observed at the vertex, whereas in the remaining three patients the

9 Discussion 101
percentage increase in the DC-level is much higher than the average of the control
group. These differences can be exploited for diagnostics and therapy evaluation. In
terms of therapy evaluation, the results obtained are restricted to the single case
P2WM. The lack of recovery in P2WM in the pre-therapy measurement was observed
in the follow up (Table 8-7).
The observation, that in 3 controls (50%) and 2 patients (33%) the hyperventilation
induced DC-shifts are in positive direction in occipital electrodes, provokes the
question of whether hyperventilation builds a dipole (or amplifies an already existing
one, frontal being negative and occipital being positive) in the brain. This observation
also needs further investigations.
In the clinical practice, there is no quantitative monitoring of the rate of
hyperventilation. The instruction given to the patients is that they have to breathe
deeper with approximately the same number of cycles per minute. The subject is
motivated to continue three minutes of hyperventilation with further instructions
during the process. In order to have a reference for the changes in the vegetative
functions, the percentage changes in the average IHR is assigned in this study. The
parameters of IHR are commonly accepted parameters for autonomous physiological
functions.
The approach, in which the changes in IHR are additionally considered parallel with
the changes in the DC potentials during hyperventilation and recovery, is unique in its
form. The main aspect of the IHR analysis in a provocation such as hyperventilation is
quantification of the changes in the autonomous functions. Accordingly, changes in
brain activity and changes in the autonomous functions can be monitored
simultaneously. Our results (Fig. 8.16, Fig. 8.17) demonstrate the benefits of the
approach in a neurological disorder such as epilepsy. Integration of different
quantitative parameters for the changes in the IHR (i.e., %HRrec/hv and %HRIhv) adds a
new dimension to the analysis. In Fig. 8.16, the patients can be distinguished from the
controls by the parameter %HRrec/hv . In Fig. 8.17, two groups of patients, one with no DC
recovery at the vertex (i.e., PT1), and the other with a very high percentage DC
recovery (i.e., PT2), can be recognized. The control subjects, on the other hand, form
another cluster between the two patient clusters (i.e., CS). There is a fourth cluster

9 Discussion 102
(i.e., OG) with two members (a patient and a control subject). However, defining a
zone between %DCIrec values of, for instance, 30%-130% we can distinguish the controls
clearly from the two patient groups. These results suggest a “normal zone” in the
corresponding plot. This issue also needs further investigations in larger groups of
controls and patients.
In our method of quantifying the changes in IHR, we used first-order statistical
parameters; higher order analysis should be considered for describing the dynamics of
the changes in future investigations. Similarly, the presented results of parallel analysis
of the DC-shifts and the IHR are for a single EEG channel (i.e., Cz, the vertex), at which
the highest DC-shifts are commonly observed. Nevertheless, changes at the other EEG
channels can be integrated into the analysis via multivariate statistics. Such a statistical
analysis task is beyond the scope of the current study and should be addressed in a
study concentrating mainly on this issue.
Electrode stability is another critical issue in DC measurements that needs discussion.
There is a strong debate on whether or not such DC potentials are measurable by the
surface electrodes. It must be underlined that DC measurements are, indeed, very open
to movement artefacts. On the other hand, the very specific patterns we observe in our
measurements (i.e., triggered by stimuli S1 and S2 in CNV measurements, and by
hyperventilation) cannot be considered and explained via artefacts. A more detailed
discussion on sources of error in such measurements can be found in [67].
Another proposal for further research is the utilization of a quantifiable provocation
method such as oxygen stimulation instead of hyperventilation. The method, in which
the partial pressure of the applied oxygen can be assigned as a quantitative parameter,
will be more efficient, since the comparability of the results will be increased.
Subsequently, effects of oxygen stimulation on both IHR and the DC-shifts could be
examined with the methods of the current work in different patient and control groups.
Such a method would also reduce the possible movement artifacts encountered during
hyperventilation.

9 Discussion 103
9.3 Quantification of Learning
In this study, the subjects, or respectively the patients, are defined to have learned the
self-regulation of SCP, if a success rate of 70% was achieved in distinguishing between
the two tasks (i.e., negativation and positivation) in the training sessions. This is a
sufficient definition for the current state of research in EEG-biofeedback. Nevertheless,
a more detailed analysis of learning and its quantification should be addressed
additionally as a separate study in the future. Consequently, correlates between the
measures introduced in this study and the quantitative parameters of learning at
different stages (see section 5.3) could be investigated.
9.4 Understanding Neurotherapy
In the course of clinical applications with epilepsy patients as well as laboratory
studies with the controls, we encountered several phenomena which need discussion:
a. During the neurofeedback training process, the “intuitively” evolved varying
respiration patterns correlated to the DC-shifts recorded on the scalp. The
control of the DC-shifts, however, is not sustained via respiration feedback. An
interaction between the SCP generated upon neurofeedback process and the
respiration patterns was observed. The spectral power of the respiration curves
was higher during the task of negativation than during the task of positivation
(Fig. 9.1) [67], [109].
b. The SCP can be distorted by the spreading of the changes in the eye-potentials
caused not only by slow eye and head movements, but also by the lack of light
adaptation. These sources of error must be monitored during a neurofeedback
process [67]. On the other hand, a similar pattern (excluding the artifacts due to
ocular movements) is observed in the VEOG during the generation of CNV in
the modified S1-S2 paradigm.
c. Application of acoustical or visual stimuli for the S1-S2 paradigm results in
differences in the topological distribution of the resulting variations in the
SCPs [110]. Visual and acoustic components do not influence the process in the
same manner.

9 Discussion 104
Fig. 9.1 Results of an EEG-biofeedback session based on SCP (black: negativation task, red: positivation task), (a) feedback channel Fcz, (b) respiration channel ATHM, and corresponding spectral power of the respiration channel (c) negativation task, (b) positivation task. © RGESIM/ASIM Verlag-Proceedings of World Congress on Neuroinformatics.
These observations indicate that the complex interactions between the higher CNS
functions, such as perception and information processing, and vegetative physiological
functions of the body, such as respiration and heart beat, are crucial in the
(a)
(b)
(c) (d)

9 Discussion 105
neurofeedback process. These functions are inseparable in the context of training
self-regulation.
The CNS not only has a higher regulatory task to coordinate the functional subsystems
of the body as a whole system, but is itself a functional part of it, and depends on these
subsystems. Therefore, the process of neurotherapy cannot be considered as simply an
extra feedback loop to the brain. Furthermore, analyzing a complex process (i.e. the
neurofeedback) which causes changes on a very complex system (i.e., the nervous
system) exceeds the borders of conventional system analysis approaches.
9.4.1 Changing the Paradigm
The traditional control engineering approaches to the systems are mainly based on the
assumption of a “closed system”. In the recent decades, this approach has been seriously
debated, especially when the system considered has a biological nature. The “openness”
of biological systems was first stated by the biologist von Bertalanffy [111]. In terms of
thermodynamics, open systems are those which exchange energy, matter, and
information with their environment. Energy and matter can enter or leave the system or
be stored in a storage element (i.e., memory). Inside the system, they can interact with
each other. Living systems are open systems exchanging energy, matter and information
with their environment, thus maintaining their structures and functions.
Following these notions, we consider the human physiology, as well as the nervous
system, as a complex adaptive open system. Mainzer [112] states that the complex
system approach offers the possibility for modeling the neural interactions of the brain
processes on the microscopic scale and the emergence of the cognitive structures on the
macroscopic scale. Thus, it seems to be possible to bridge the gap between the
neurobiology and the cognitive sciences of the mind, which traditionally has been
considered an unsolvable problem.
Neurotherapy intervenes in the CNS at a macroscopic level: We do not go down into
the system to the level of neuronal interactions, but we use a macroscopic level
parameter; a parameter extracted from EEG (e.g., the DC-level).

9 Discussion 106
Our observations suggest that the neurofeedback process intervenes in this “gap”, at a
“mesoscopic” level. The neurofeedback process involves the interactions between the
psychological and neurobiological processes. We consider the extracted EEG
parameter used for the feedback as a parameter of the “mesoscopic” level (i.e., an
interface level) between the psychological (the macroscopic level) and neurobiological
levels (the microscopic level):
Psychological processes > MACROSCOPIC LEVEL
Extracted EEG parameter > MESOSCOPIC LEVEL
Neurobiological processes > MICROSCOPIC LEVEL
The definition of a certain level as being microscopic, mesoscopic or macroscopic is
relative. The defined mesoscopic level is a microscopic level with respect to the
psychological level, and at the same time a macroscopic level with respect to the level of
neurobiological processes. These levels can be regarded as representing the instability
hierarchies [10].
Another property of natural systems is that they are self-organizing. Self-organization
at the microscopic level is considered to be the fundamental mechanism of spontaneous
pattern formations at the macroscopic level in open systems, which are far from
equilibrium.
9.4.2 Self-Regulation and Self-Organization
According to Schwartz [113], the concept of self-regulation is fundamental to behavior
therapy, and the main adaptation mechanisms in living systems. It is, in this sense, not a
coincidence that EEG-biofeedback is also referred to as cortical self-regulation (though
it is not clear whether only cortical structures or many others are involved in the
process). A self-regulating system is able to maintain its essential variables within
limits acceptable to its own structure in case of unexpected disturbances. This can only
be achieved through feedback mechanisms which detect disturbances, and accordingly
activate (positive feedback loops) or inhibit (negative feedback loops) the related
subsystems. To our understanding, self-regulation and self-organization are two highly
interrelated phenomena, which are both determined by the nonlinear interactions at
the microscopic level.

9 Discussion 107
9.4.3 EEG-Biofeedback and Non-Linear Phase Transitions
Many processes of coordination and regulation in human physiology involve phase
transitions with nonlinear and non stationary properties, so does SCP based
neurofeedback. The results of a training session, in which the tasks of negativation and
postivation are successful (Fig. 9.1), indicate non-linear phase transitions to these two
states. Such spontaneous phase transitions are commonly observed where a system
changes its macroscopic state qualitatively [114]. For phase transitions of systems in
thermal equilibrium the adequate treatment of fluctuations could be solved by
renormalization group techniques. However, for systems far from thermal equilibrium
(i.e., non-equilibrium phase transitions), the phenomena and the problem get more
complex, and need novel approaches.
9.4.4 Concepts of Synergetics
Synergetics, as pioneered by Haken [9], [10], offers a theoretical framework for the
self-organization phenomenon giving rise to emergent new qualities at the macroscopic
level, and analyzing non-equilibrium phase transitions via the concepts of control
parameters, order parameters, slaving principle and circular causality. In synergetics,
the circular causal relations between different levels are explained via order parameters
and the slaving principle.
A control parameter is a parameter which is defined to be controlling the macroscopic
behavior of a system. The critical value of a control parameter leads to a bifurcation in
system behavior [115].
An order parameter is defined as a descriptor of the system at the macroscopic level.
Referring to [116]:“When one, or maybe several control parameters are changed, the system enters
instability. In other words, it leaves its former state and starts to form a qualitatively new macroscopic
state. Close to the instability point, different kinds of collective configurations occur; some of them grow
whereas others decay after generation by fluctuations. By a study of growing and decaying states, we
may distinguish between the unstable and stable configurations and are thus led to configurations which
are governed by the order parameters. The order parameters determine the behavior of the individual
parts via the slaving principle. Thus the behavior of complex systems can be described and understood in

9 Discussion 108
terms of order parameters. At the same time, we need no longer to consider the action or behavior of the
individual parts, but may instead describe the total system by means of the order parameters.”
The slaving principle states that not only the behavior of the growing configurations, but
also that of decaying configurations is uniquely determined by the order parameters
which give rise to compression of information needed to describe the behavior of the
system. The principle of circular causality defines the causality between the order
parameters and the behavior of the components (i.e, sub-systems) of a system. The
individual parts of the system cooperatively determine or generate the order
parameters, which in turn enslave the individual parts. Enslavement and consensus
finding can be regarded as similar principles [117].
9.4.5 Neurotherapy as a Process of Learning: Operant Conditioning and Coordination
EEG-biofeedback is a process of learning. In terms of psychology, it is defined as an
operant conditioning. At the microscopic level, according to the widely accepted
hypotheses of Hebb [118], learning is explained through strengthening synapses
between the neurons, which are repetitively activated simultaneously. Hebb also
suggests that learning should be understood as a kind of self-organization in a complex
brain model. At the macroscopic level, we encounter the studies in behavioral
psychology regarding different forms of conditioning. From the systems analysis point
of view, synergetics offers a theoretical framework and tools for analyzing a process of
learning via the effects of the learning process on the order parameters of a system.
According to [119], there may be several mechanisms by which the motion patterns
described by the order parameters can change upon learning:
a. The dynamics of the order parameters may change in that the potential
landscape undergoes a transition.
b. New order parameters may emerge by means of the cooperation of old order
parameters.
c. New order parameters may emerge from the microscopic parts as a consequence
of changes in the control parameters at the microscopic level.

9 Discussion 109
An important example of analyzing an operant conditioning process with the methods
of synergetics is the pedalo experiment [120], in which the movement patterns of the
subjects are analyzed during the process of learning to drive a pedalo. In this example,
it is demonstrated that as learning proceeds, fewer and fewer degrees of freedom
dominate the movement pattern , and that, eventually the movement is governed by a
single complex order parameter.
Although the EEG-biofeedback process is not concerned with motor movements, there
are analogies to the pedalo experiment in terms of learning a specific “coordination” of
the involved subsystems. In the pedalo experiment, the subsystems are motor units
such as parts of the arms and legs which are under our voluntary control, whereas in
the EEG-biofeedback process, these subsystems are units of the higher CNS functions
involving the cognitive functions, and the autonomous nervous system such as
respiration and heart beat. The analogies are that:
a. As a result of the learning process, a new specific coordination is achieved
among the subsystems in both cases.
b. This new coordination can be recalled and activated by the subject when the
corresponding situation is encountered (e.g., control of seizures in case of aura).
9.4.6 Is the DC-level an Order Parameter of the Brain Complex Open System?
Several characteristics of the DC-level or shifts in the DC-level suggest that it can be an
order parameter of the brain as a complex open system [121]:
Switching role of orders parameters and the DC-level
According to the synergetical approach, the critical value of a control parameter may
lead to a bifurcation where order parameter may play a switching function between
two (or more) possible states [122]. The results of SCP-based neurofeedback (Fig. 9.1)
can be considered as switching from a less excitable state to a more excitable one or
vice versa. Also in the S1-S2 paradigm, the changes (Fig. 8.6) can be similarly
interpreted.
9 Discussion 110
Order parameters are long lasting
The DC-level is preserved until the introduction of the succeeding stimulus in CNV
(Fig. 8.6) and in the neurofeedback session (Fig. 9.1). This observation suits the
property of order parameters being long-lasting.
Governing role order parameters
The observation that the respiration patterns may differ during the tasks of
negativation and positivation (Fig. 9.1) and that the voluntary DC-regulation is not
achieved by respiration feedback suggests the governing role of DC-level over other
sub-systems (i.e., in this case, functions of the autonomous nervous system).
An order parameter is a descriptor of the system at the macroscopic level
Referring to the definition of Caspers [44] that a DC-shift is an indicator of the cortical
excitability changes, with a negative shift showing an increased cortical excitability,
and a positive shift a decreased one, and to the different states (i.e., sleep-wake cycle,
seizure activity, information processing, hyperventilation –see chapter 2, section 2.3.3
for details) in which DC shifts are observed, the DC-potential shift can be defined as a
descriptor of the brain at macroscopic level.
One cannot claim that the DC-shifts observed at various states share the common
origin and generation mechanism without investigating their correlates (i.e., control
parameters) at the microscopic level. As explained in chapter 2, there is no consensus
on the origin(s)/generator(s) (i.e., neurons, glial cells, blood brain barrier and cerebral
blood flow) and generation mechanism(s) of the DC potentials. However, at the
macroscopic level, the concept of order parameter gives us a tool to consider these
DC-shifts observed at different states together, since there is a circular causal
relationship between the DC-level and the microscopic level: The microscopic level
generates the DC-level, which in turn determines the excitability of the microscopic
level, and excitability is a measure of firing rate at the neuronal level.

9 Discussion 111
9.4.7 Neurotherapy: An Interface of Psychology and Neurology via Synergetics?
Considering the brain as an open system interacting with other subsystems of the
human physiology and analyzing these interactions allows for new insights. Following
this paradigm, we can analyze simultaneous changes in the observables of processes
participating in neurofeedback, which appear not to be limited to the observables of
the brain functions. Excluding the higher macroscopic level psychology, Fig. 9.2
illustrates a synergetic representation of microscopic and macroscopic levels and the
corresponding parameters.
Synergetic effects on the macroscopic level
Control parameterspCO2, pO2,pH, light intensity, anaesthetic chemicals, information …
Order parameters (Macroscopic level)DC-level, frequency powers, phase ...
Microscopic level Neurons, glial cells, blood brain barrier ...
Enslaving Self-organization
Dynamical pattern(EEG)
Fig. 9.2 Synergetical representation of microscopic and macroscopic interactions, and corresponding parameters. Psychology as a higher macroscopic level is excluded for simplification.
The control parameters can be external as well as internal parameters. They define the
nature of interactions at the microscopic level. Examples of external control parameters
can be the intensity or frequency of an acoustic or visual stimulation, whereas
hormones or ional concentrations can be regarded as internal control parameters. A
control parameter can also be an abstract quantity such as information, as in the case of
CNV, where S1 in the paradigm carries the information of a “warning” for the
succeeding aversive or non-aversive stimulus S2.
The above discussions and considerations provide us with a theoretical framework at
the system level, which enables a deeper understanding of the neurotherapy process,

9 Discussion 112
and accordingly its diverse influences on human physiology, which shall be investigated
further in future studies.

10 Summary and Conclusion
… Wär nicht das Auge sonnenhaft,
Die Sonne könnt es nie erblicken; …13
Johann Wolfgang von Goethe 1749, Frankfurt (Main) – 1832, Weimar
The verb “to see” has a second meaning in many languages like it has in English, namely,
“to understand.” As Goethe describes using the eye, probably as a metaphor, there is the
need of a property of “seeing” that matches to its object of interest. Similarly, there is
the need of a matching paradigm to phenomena analyzed in the scientific context.
The present work includes several aspects spanning from engineering over neurology to
psychology. The main contributions and insights of this interdisciplinary work towards
an automated objective (neuro)therapy planning and evaluation in epilepsy can be
summarized as follows:
After a systematic overview of conventional methods and procedures of diagnosis and
therapy evaluation, EEG-biofeedback protocols proposed for epilepsy were elucidated
with an emphasis on slow cortical potentials based neurotherapy. The problem analysis
pointed out that the diversity of cases, the variety of treatment modalities, and the lack
of quantitative features complicate the objectivity in therapy planning and evaluation.
In order to increase the objectivity, a concept and a methodology were developed by
introducing:
a. An evaluation measurement protocol which brings a standardization to the
diagnosis and evaluation procedures;
13 Farbenlehre, The Divine is Spread Everywhere. …/ If the eye were not sun-like/ how could it ever spy the sun?/…
10 Summary and Conclusion 114
b. The neuroprofile as a concept and a tool for defining a structured set of
quantifiable measures which can be extracted from electrophysiological
signals;
c. A set of novel quantitative features (i.e., sub-set of the components of the
neuroprofile) extracted from EEG (or, respectively, ERP) and ECG:
i. Percentage epileptic pattern occurrence (EPO),
ii. CNV level difference measure (dCNV),
iii. Direct current recovery index (DCIrec),
iv. Heart rate recovery ratio (HRrec/hv),
v. Hyperventilation heart rate index (HRIhv); and
d. A software concept and the corresponding tools (i.e., the neuroprofile
extraction module and the database) to support the methodology as a basis
for automation.
The measurement protocol was applied to voluntary control subjects, and to epilepsy
patients, who received neurotherapy as a complementary treatment to pharmacological
therapy. The features introduced were investigated on these real data.
The EPO was extracted via methods of supervised and unsupervised epileptic pattern
quantification. The corresponding adaptive segmentation algorithm was modified by
introducing fractal dimension (FD) as a new feature for pattern characterization.
According to our results, FD was observed to be superior to the previously used Värri
measures in extracting epileptic patterns.
Analyzing the CNV acquired via a modified S1-S2 paradigm, and assigning dCNV as the
quantitative parameter, statistically significant differences were determined between
the epilepsy patients and the healthy controls.
Changes in the EEG/DC-level were analyzed during and after hyperventilation, which
is a commonly used clinical activation method to provoke epileptic patterns.
Differences between patients and controls were determined, especially in the recovery
process (i.e., in the quantitative measure srec defined in this study). Using the new
measures shv and srec, the DCIrec was defined.
10 Summary and Conclusion 115
The simultaneously acquired ECG signals were additionally analyzed during and after
hyperventilation for extracting IHR curves. Three quantitative parameters HRbsl, HRhv,
and HRrec were calculated. Using these parameters, two indices were assigned for
quantifying the hyperventilation induced changes in ECG: the HRrec/hv and the HRIhv.
The method, in which the measures of hyperventilation induced changes in IHR were
integrated to hyperventilation induced DC-shifts in EEG, is unique in its form. Our
results indicate the utility of the method in distinguishing the epilepsy patients from
the healthy controls. These findings are important, primarily in terms of diagnostics.
Going a step further, we demonstrated our methodology for therapy evaluation on two
sample cases, which were available for longer follow-up. Changes were observed in the
assigned new measures in sample cases. This is not sufficient to base conclusions on
whether or not the observed changes resulted from neurotherapy. Further clinical
studies on new epilepsy patients with a successful neurotherapy history are required
for such conclusions.
Nevertheless, the data to be acquired in future studies can be integrated into the
analysis without much exertion via the developed tools in this study: The defined
measures can be extracted by the neuroprofile extraction module and stored in the
developed database for further statistical investigations.
Based on the observations we gained in the course of EEG-biofeedback sessions, we
discussed the necessity of a change in paradigm for understanding neurotherapy.
Neurotherapy (i.e. EEG-biofeedback) is a complex process in which not only cognitive
functions, such as perception and information processing, but also vegetative functions,
such as respiration and heart beat, are involved. This process elicits alterations to the
human nervous system and physiology as a whole system. Therefore, it cannot be
regarded as a simplified control feedback loop as in the analysis of closed systems.
Hence, referring to Goethe once again, changing the paradigm is inevitable in order to
comprehend neurotherapy. The novel paradigm should comply with the intrinsic
complexity of the human physiology as well as that of the neurotherapy process.
10 Summary and Conclusion 116
As a process of learning, neurotherapy has analogies to the operant conditioning
experiments analyzed in the realm of synergetics. A synergetical approach can provide
further tools for understanding the dynamics of the neurofeedback process at a
macroscopic level. Accordingly, the process of neurotherapy can be regarded as learning
a specific coordination of cognitive and autonomous physiological functions. Such an
analogy results in further tasks such as determining the accurate control and order
parameters of the neurofeedback process and quantifying them. The DC-level and its
behavior show the properties of an order parameter at the macroscopic level.
The theoretical framework of synergetics leads us to investigating parameters of
interactions between different sub-systems of human physiology, which are not
necessarily considered to be interrelated in the context of neurotherapy or epilepsy,
such as the interactions between higher cognitive functions and the autonomous
nervous system. Future research in the field should be concentrated on these
interactions. Knowing that such an approach might not be comprehensible to
conventional thinking, it will be appropriate to end with a citation from the English
poet Francis Thompson describing the interconnectedness of the macroscopic and
microscopic levels:
All things by immortal power Near or far
Hiddenly To each other linked are,
That thou canst not stir a flower Without troubling a star.
Francis Thompson 1859, Preston Lancashire – 1907, London
References
[1] The NeuroCybernetics Research Group. [Online]. Available: http://www-bmti.tu-ilmenau.de/ncrg
[2] G. Ivanova-Haralampieva, G. Grießbach, G. Henning, M. E. Kirlangic, and S. Kudryavtseva, “Method and device for detecting neurological and psycho-physiological states,” applied international patent, Application No. PCT/DE00/03958, Nov. 11, 2000; Publication No. WO 02038049 A1, Oct. 30, 2002.
[3] G. Ivanova, M. E. Kirlangic, S. Kudryavtseva, G. Burns, S. Berkes, G. Henning, and G. Grießbach, “Home-device for self-regulation of psychophysiological processes,” in Proc. of 2nd European Medical and
Biological Engineering Conference (EMBEC), 2002, pp. 782-783.
[4] G. Ivanova, A. Fink, M. E. Kirlangic, M. Loesel, G. Henning, and G. Grießbach, “A system for patient specific cortical self-regulation,” in Proc. of 1st European Medical and Biological Engineering Conference
(EMBEC), 1999, pp. 492-493.
[5] E. R. John, L. S. Prichep, J. Fridman, and P. Easton, “Neurometrics: Computer assisted differential diagnosis of brain dysfunctions,” Science, vol. 293, pp. 162-169, 1988.
[6] L. S. Prichep and E. R. John, “QEEG profiles of psychiatric disorders,” Brain Topography, vol. 4, no. 4, pp. 249-257, 1992.
[7] D. S. Cantor, “An overview of quantitative EEG and its applications to neurofeedback,” in: (eds.) J. R. Evans and A. Abarbanel, Introduction to quantitative EEG and Neurofeedback, Academic Press, California, 1999, pp. 14-27.
[8] R. W. Thatcher, “EEG database-guided neurotherapy,” in: (eds.) J. R. Evans and A. Abarbanel, Introduction to quantitative EEG and Neurofeedback, Academic Press, California, 1999, pp. 29-64.
[9] H. Haken, Principles of Brain Functioning: A synergetic approach to brain activity, behavior and cognition, Springer, Berlin-Heidelberg, 1996.
[10] H. Haken, Advanced Synergetics: Instability hierarchies of self-organizing systems and devices, 3rd Edition, Springer, Berlin-Heidelberg, 1993.
[11] H. Stefan, Epilepsien. Diagnose und Behandlungen, Thieme, Stuttgart, 1999.
[12] G. Rabendig, “Klassifikation der Anfälle und der Epilepsien,” in: (eds.) W. Fröscher and F. Vassella, Die
Epilepsien- Grundlagen, Klinik, Behandlung, Walter de Gruyter, Berlin, 1994.

References 118
[13] H. Schneble, Epilepsie: Erscheinungsformen, Ursachen, Behandlung, Beck, München, 1996.
[14] M. Avoli and P. Gloor, “Epilepsy,” in: (ed.) J. A. Hobson, Abnormal States of the Brain and Mind, Birkhaueser, Boston, 1989, pp. 49-52.
[15] International League Against Epilepsy, “Proposal for the revised clinical and electroencephalographic classification of epileptic seizures,” Epilepsia, vol. 22, pp. 489-501, 1981.
[16] International League Against Epilepsy, “Proposal for the revised classification of epileptics and epileptic syndromes,” Epilepsia, vol. 30, pp. 389-399, 1989.
[17] L. S. Wolfe and N. M. van Gelder, “Biochemische Grundlagen,” in: (eds.) W. Fröscher and F. Vassella, Die
Epilepsien: Grundlagen, Klinik, Behandlung, Walter de Gruyter, Berlin, 1994, pp. 104-125.
[18] H. Stefan, Epilepsien. Diagnose und Behandlungen, Thieme, Stuttgart, 1999, pp. 169-216.
[19] H. Stefan, Epilepsien. Diagnose und Behandlungen, Thieme, Stuttgart, 1999, pp. 217-233.
[20] G. Wieser and A. M. Siegel, “Operative Therapie,” in: (eds.) W. Fröscher and F. Vassella, Die Epilepsien:
Grundlagen, Klinik, Behandlung, Walter de Gruyter, Berlin, 1994, pp. 615-627.
[21] S. C. Schachter and C. B. Saper, “Vagus nerve stimulation,” Epilepsia, vol. 39, pp. 677-686, 1998.
[22] W. Fröscher, “Weitere Therapiemaßnahmen, Lebensführung,” in: (eds.) W. Fröscher and F. Vassella, Die
Epilepsien: Grundlagen, Klinik, Behandlung, Walter de Gruyter, Berlin, 1994, pp. 628-633.
[23] B. Rockstroh, “Klinisch-psychologische Verfahren,” in: (eds.) W. Fröscher and F. Vassella, Die Epilepsien:
Grundlagen, Klinik, Behandlung, Walter de Gruyter, Berlin, 1994, pp. 612-615.
[24] J. R. Evans and A. Abarbanel (eds.), Introduction to quantitative EEG and Neurofeedback, Academic Press, California, 1999.
[25] B. Rockstroh, T. Elbert, N. Birbaumer, P. Wolf, A. Düchting-Röth, M. Reker, I. Daum, W. Lutzenberger, and J. Dichgans, “Cortical self-regulation in patients with epilepsies,” Epilepsy Research, vol. 14, pp. 63-72, 1993.
[26] B. Kotchoubey, V. Blankenhorn, W., Fröscher, U. Strehl, and N. Birbaumer, “Stability of cortical self-regulation in epilepsy patients,” NeuroReport, vol. 8, pp. 1867-1870, 1997.
[27] B. Kotchoubey, D. Schneider, H. Schleichert, U. Strehl, C. Uhlmann, V. Blankenhorn, W. Fröscher, and N. Birbaumer, “Self-regulation of slow cortical potentials in epilepsy: a retrial with analysis of influencing factors,” Epilepsy Research, vol. 25, pp. 269-276, 1996.
[28] N. Birbaumer, “Selbstregulation langsamer Hirnpotentiale,” Neuroforum, vol. 2, pp. 190-203, 1998.
[29] N. Birbaumer, “Slow cortical potentials: Plasticity, operant control, and behavioral effects,” The Neuroscientist, vol. 5, no. 2, pp. 74-78, 1999.

References 119
[30] T. Brownback and L. Mason, “Neurotherapy in the treatment of dissociation,” in: (eds.) J. R. Evans and A. Abarbanel, Introduction to quantitative EEG and Neurofeedback, Academic Press, California, 1999, pp. 145-156.
[31] J. Kamiya, “Operant control of EEG alpha rhythm and some of its reported effects on consciousness,” in: (ed.) C. Tart, Altered States of Consciousness, John Wiley, New York, 1969.
[32] M. B. Sterman, “Neurophysiologic and clinical studies of sensorimotor EEG biofeedback training: some effects on epilepsy,” in: (ed.) L. Birk, Biofeedback: Behavioral Medicine, Grune and Stratton, New York, 1973.
[33] M. B. Sterman, L. R. Macdonald, and R. K. Stone, “ Biofeedback training of the sensorimotor electroencephalogram rhythm in man: effects on epilepsy,” Epilepsia, vol. 14, pp. 295-416, 1974.
[34] J. F. Lubar and W. W. Bahler, “Behavioral management of epileptic seizures following EEG biofeedback training of the sensorimotor rhythm,” Biofeed. Self Reg., vol. 1, pp. 77-104, 1976.
[35] W. Wyrwicka and M. B. Sterman, “Instrumental conditioning of sensorimotor cortex EEG spindles in the waking cat,” Physiol. Behav., vol. 3, pp. 703-707, 1968.
[36] M. B. Sterman, R. C. Howe, and L. R. Macdonald, “Facilitation of spindle-burst sleep by conditioning of electroencephalographic activity while awake,” Science, vol. 167, pp. 1146-1148, 1970.
[37] M. B. Sterman, “EEG Biofeedback: Physiological behaviour modification,” Neuroscience and Behavioral
Reviews, vol. 5, pp. 405-412, 1981.
[38] M. B. Sterman, “The role of sensorimotor rhythmic EEG activity in the etiology and treatment of generalized motor seizures,” in: (eds.) T. Elbert, B. Rockstroh, W. Lutzenberger and N. Birbaumer, Self-regulation of the brain and behaviour, Springer, Berlin-Heidelberg, 1984, pp. 95-106.
[39] W. W. Finley, H. A. Smith, and M. D. Etherton, “Reduction of seizures and normalization of the EEG in a severe epileptic following sensorimotor biofeedback training,” Biol. Psychol., vol. 2, pp. 189-203, 1975.
[40] A. R. Wyler, J. S. Lockard, A. A. Ward, and A. A. Finch, “Conditioned EEG desynchronization and seizure occurrence in patients,” Electroenceph. Clin. Neurophysiol., vol. 41, pp. 501-512, 1976.
[41] E. J. Speckman and J. Elger, “Introduction to neurophysiological basis of EEG and DC potentials,” in: (eds.) E. Niedermeyer, F. Lopes da Silva, Electroencephalography, 2nd Ed., Urban & Schwarzenberg, Baltimore, 1987, pp. 1-14.
[42] B. Rockstroh, T. Elbert, and A. Canavan, Slow cortical potentials and behaviour, 2nd ed., Urban & Schwarzenberg, München, 1989.
[43] B. Rockstroh, “Regulation of cortical excitability and its manifestation by slow cortical potentials,” in: (ed.) W. C. McCallum, Slow Cortical Potentials- Current status and future prospects, NATO ARW Series, Plenum press, New York, 1993.

References 120
[44] H. Caspers, “DC potentials of the Brain,” in: (eds.) W. Haschke, E. J. Speckmann, and A. I. Roitbak, Slow
Potential Changes in the Brain, Birkhäuser, Boston, 1993, pp. 1-20.
[45] N. Birbaumer, T. Elbert, B. Rockstroh, I. Daum., P. Wolf, and A. Canavan, “Clinical-psychological treatment of epileptic seizures: a controlled study,” in: (ed.) A. Ehlers, Perspectives and Promises of
Clinical Psychology, Plenum Press, New York, 1991, pp. 81-94.
[46] I. Daum, B. Rockstroh, N. Birbaumer, T. Elbert, A. Canavan, and W. Lutzenberger, “Behavioral treatment of slow cortical potentials in intractable epilepsy: neurophysiological predictors of outcome,” J. Neurol.
Neurosurg. Psychiat., vol. 56, pp. 94-97, 1993.
[47] B. Kotchoubey, U. Strehl, H. Holzapfel, V. Blankenhorn, W. Fröscher, and N. Birbaumer, “Negative potential shifts and the prediction of the outcome of neurofeedback therapy in epilepsy,” Clinical
Neurophysiology, vol. 110, pp. 683-686, 1999.
[48] E. J. Speckmann, H. Caspers, and R. W. C. Janzen, “Relations between cortical DC shifts and membrane potential changes of cortical neurons associated with seizure activity,” in: (eds.) H. Petsche and M. A .B. Brazier, Synchronization of EEG Activity in Epilepsies, Springer, New York, 1972.
[49] E. J. Speckmann, H. Caspers, and R. W. C. Janzen, “Laminar distribution of cortical field potentials in relation to neuronal activities during seizure discharges,” in: (eds.) M. A .B. Brazier and H. Petsche, Architectonics of the Cerebral Cortex, Raven Press, New York, 1978.
[50] H. Korhuber and L. Deecke, “Hirnpotentialänderung bei Willkürbewegungen und passiven Bewegungen des Menschen: Bereitchaftspotential und reafferente Potentiale,” Pflügers Arch, vol. 284, pp. 1-17, 1965.
[51] W. C. McCallum, “Potentials related to expectancy, preparation and motor activity,” in: (ed.) T. W. Picton, Human Event-Related Potentials - Handbook of Electroencheph. Clin. Neurophysiol., vol. 3, Elsevier, Amsterdam, 1988.
[52] B. Röder, F. Rösler, and E. Henningshausen, “Different cortical activation patterns in blind and sighted subjects during encoding and mentally transforming tactile stimuli,” Psychophysiology, vol. 34, pp. 292-307, 1997.
[53] K. Saitou, Y. Washimi, Y. Koike, A. Takahashi, and Y. Kaneoke, “Slow negative cortical potential preceding the onset of postural adjustment,” Electroenceph. Clin. Neurophysiol., vol. 98, pp. 449-455, 1996.
[54] A. Yli-Hankala, H. Heikkilä, A. Värri, and V. Jäntti, “Correlation between the EEG and heart rate variation in deep enflurane anesthesia,” Acta. Anaesthesiol. Scand., vol. 34, pp. 138-143, 1990.
[55] B. S. Zaret, “Prognostic and neurophysiological implications of concurrent burst suppression and alpha pattern in the EEG of post-anoxic coma,” Electroenceph. Clin. Neurophysiol., vol. 61, pp. 199-209, 1985.
[56] D. L. Clark and B. S. Rosner, “Neurophysiologic effects of general anesthetics, The electroencephalogram and sensory evoked responses in man,” Anesthesiology, vol. 38, pp. 564-582, 1973.

References 121
[57] I. Rosen and M. Söderberg, “Electroencephalographic activity in children under enflurane anaesthesia,” Acta. Anaesthesiol. Scand., vol. 19, pp. 361-369, 1975.
[58] V. Jäntti and A. Yli-Hankala, “Correlation of instantaneous heart rate and EEG suppression during enflurane anaesthesia: synchronous inhibition of heart rate and cortical electrical activity?,” Electroenceph.
Clin. Neurophysiol., vol. 76, pp. 476-479, 1990.
[59] V. Jäntti, A. Yli-Hankala, G. A. Baer, and T. Porkkala, “Slow potentials of EEG burst suppression pattern during anaesthesia,” Acta. Anaesthesiol. Scand., vol. 37, pp. 121-123, 1993.
[60] U. Strehl, B. Kotchoubey, and N. Birbaumer, “Biofeedback von Hirnaktivität bei epileptischen Anfällen: ein verhaltensmedizinisches Behandlungsprogram,” in: (eds.) W. Rief and N. Birbaumer, Biofeedback-
Therapie – Grundlagen, Indikation und praktisches Vorgehen, Schattauer, Stuttgart, 2000, pp. 190-208.
[61] G. Rabendig and U. Runge, Behandlungsprotokolle bei Epilepsie, Gustav Fischer, Ulm, 1997, pp. 4-11.
[62] A. K. Baum and D. Müller, Elektroenzephalographie für technische Assistentinnen, Ciba-Geigy Verlag, Wehr, 1996.
[63] C. Logar, B. Walzl, and H. Lechner, “Role of long-term EEG monitoring in diagnosis and treatment of epilepsy,” Eur. Neurol., vol. 34, suppl. 1, pp. 29-32, 1994.
[64] S. Zschocke, Klinische Elektroenzephalographie, 2nd Ed., Springer, Berlin, 2002, pp. 195-214.
[65] M. B. Sterman and M. N. Shouse, “Quantitative analysis of training, sleep EEG and clinical response to EEG operant conditioning in epileptics,” Electroenceph. Clin. Neurophysiol., vol. 49, pp. 558-576, 1980.
[66] M. B. Sterman and D. Kaiser, “Comodulation: A new QEEG analysis metric for assessment of structural and functional disorders of the central nervous system,” Journal of Neurotherapy, vol. 4, no. 3, pp. 73-83, 2001.
[67] G. Ivanova, M. E. Kirlangic, S. Kudryavtseva, G. Henning, and G. Griessbach, “Sources of error in the self-regulation process of slow cortical potentials,” in Proc. of the World Congress on Neuroinformatics, 2001, pp. 112-116.
[68] T. Takahashi, “Activation methods,” in: (eds.) E. Niedermeyer, F. Lopes da Silva, Electroencephalography:
Basic principles, clinical applications and related fields, Williams& Wilkins, Philadelphia, 1999, p. 261.
[69] T. Takahashi, “Activation methods,” in: (eds.) E. Niedermeyer, F. Lopes da Silva, Electroencephalography:
Basic principles, clinical applications and related fields, Williams& Wilkins, Philadelphia, 1999, p. 262-266.
[70] R. G. Bickford, “Activation procedures and special electrodes,” in: (eds.) D. W. Klass and D. D. Daly, Current practice of clinical electroencephalography, Raven Press, New York, 1979, pp. 269-305.
[71] M. Fukai, N. Motomura, S. Kobayashi, H. Asaba, and T. Sakai, “Event-related potential (p300) in epilepsy,” Acta Neurol Scand., vol. 82, no. 3, pp. 197-202, 1990.

References 122
[72] M. Bhatia, M. Behari, S. Gupta, and G. K. Ahuja, “Cognition and p300 in epilepsy: an event related study,” Neurology India, vol. 43, no. 4, pp. 193-198, 1995.
[73] A. Soysal, A. Atakli, T. Atay, H. Altintas, S. Baybas, and B. Arpaci, “Auditory event-related potentials (p300) in partial and generalized epileptic patients,” Seizure, vol. 8, no. 2, pp. 107-110, 1999
[74] NeuroScan SynAmps Amplifier System. [Online]. Available: http://www.neuro.com/product.sstg?id=34
[75] G. Dumermuth, “Neurophysiologische Untersuchungen und Sonographie,” in: (eds.) W. Fröscher and F. Vassella, Die Epilepsien: Grundlagen, Klinik, Behandlung, Walter de Gruyter, Berlin, 1994, pp. 360-393.
[76] D. Y. Silin and K.M. Skrylev, “Avtomaticeskaja segmentacija EEG,” Zurnal vyssej nervnoj dejatelnosti, vol. 36, pp. 1152-1155, 1986.
[77] A. Värri, Digital Processing of the EEG in Epilepsy, Licentiate Thesis, Tampere University of Technology, Tampere, Finland, 1988.
[78] P. Grassberger and I. Procaccia, “Characterization of strange attractors,” Physical Review Letters, vol. 50, no. 5, pp. 346-349, 1983.
[79] A. Accardo, M. Affinito, M. Carrozzi, and F. Bouquet, “Use of fractal dimension for the analysis of electroencephalographic time series,” Biol. Cybern., vol. 77, pp 339-350, 1997.
[80] R. Esteller, J. Echauz, and G. Vachtsevanos, “Fractal dimension characterizes seizure onset in epileptic patients,” in Proc. of IEEE International Conference On Acoustics, Speech, and Signal Processing
(ICASSP), vol. 4, 1999, pp. 2343-2346.
[81] R. Esteller, G. Vachtsevanos, J. Echauz, and B. Litt, “A comparison of fractal dimension algorithms using synthetic and experimental data,” in Proc. IEEE International Symposium on Circuits and Systems
(ISCAS), vol. 3 Adaptive Digital Signal Processing, 1999, pp. 199-202.
[82] C. Tricot, Curves and Fractal Dimension, Springer-Verlag, New York, 1995, pp. 154-157.
[83] G. Bodenstein, W. Schneider, and C. von der Malsburg, “Computerized EEG pattern classification by adaptive segmentation and probability density function classification. Description of the method,” Comp.
Biol. Med., vol. 15, no. 5, pp. 297-313, 1985.
[84] V. Krajca, S. Petranek, I. Patakova, and A. Värri, “Automatic identification of significant graphoelements in multichannel EEG recordings by adaptive segmentation and fuzzy clustering,” Int. J. Biomed. Comput., vol. 28, pp. 71-89, 1991.
[85] O. Schmidt, Verfahren zur EEG-Segmentierung, Diplomarbeit, Technische Universität Ilmenau, 1997.
[86] M. Friedman and A. Kandel, Introduction to Pattern Recognition. Statistical, structural, neural and fuzzy
logic approaches, World Scientific, Singapore, 1999, pp. 192-201.
[87] M. E. Kirlangic, D. Pérez, and G. Ivanova, “Adaptive recursive threshold for unsupervised epileptic pattern

References 123
recognition,” 38. DGBMT Jahrestagung 2004, Sept. 22-24, Ilmenau. (to be published)
[88] M. Helbig, Entwicklung computergestützter Untersuchungsmethoden zur Diagnostik autonomer vegetativer Funktionsstoerungen in einem integrierten Mess- und Analysesystem, Diplomarbeit, Technische Universität Ilmenau, 1996, pp. 55-58.
[89] M. E. Kirlangic, J. Holetschek, C. Krause, and G. Ivanova, “A database for therapy evaluation in neurological disorders: application in epilepsy,” IEEE Transactions on Information Technology in
BioMedicine. (to be published in Sept. 2004 )
[90] D. Pérez, Automatic detection and statistical analysis of epileptic EEG-graphoelements, Final Degree Project, Technische Universität Ilmenau-Universidad Politécnica de Valencia, 2001.
[91] T. M. Connolly and C. E. Begg, Database Systems: A practical approach to design, implementation and
management, 3rd ed., Addison-Wesley, Harlow, 2002, pp. 33-39.
[92] G. Vossen, Datenmodelle, Datenbanksprachen und Datenbankmanagementsysteme, 4th ed., Oldenbourg, München, 2000, pp. 67-113.
[93] T. M. Connolly and C. E. Begg, Database Systems: A practical approach to design, implementation and
management, 3rd ed., Addison-Wesley, Harlow, 2002, pp. 418-422.
[94] T. M. Connolly and C. E. Begg, Database Systems: A practical approach to design, implementation and
management, 3rd ed., Addison-Wesley, Harlow, 2002, pp. 1045-1073.
[95] R. Ramakrishnan and J. Gehrke, Database Management Systems, 3rd ed., McGraw-Hill, New York, 2003, pp. 846-882.
[96] T. M. Connolly and C. E. Begg, Database Systems: A practical approach to design, implementation and
management, 3rd ed., Addison-Wesley, Harlow, 2002, pp. 422-437.
[97] T. M. Connolly and C. E. Begg, Database Solutions: A step-by-step guide to building databases, 3rd ed., Addison-Wesley, Harlow, 2000, pp. 119-196.
[98] P. Brown, Object-Relational Database Development, Informix Series, Prentice-Hall PTR, Upper Saddle River-New Jersey, 2001, pp. 49-58.
[99] T. M. Connolly and C. E. Begg, Database Solutions: A step-by-step guide to building databases, 3rd ed., Addison-Wesley, Harlow, 2000, pp. 211-282.
[100] Borland Inc.: Interbase Server 6.5 Data Sheet. [Online]. Available: http://www.borland.com/interbase
[101] Frontbase Inc.: Frontbase user’s guide. [Online]. Available: http://www.frontbase.com
[102] MySQL AB: The mySQL reference manual. [Online]. Available: http://www.mysql.com
[103] The PostgreSQL Global Development Group. The PostgreSQL documentation. [Online]. Available: http://www.postgres.org

References 124
[104] J. Holetschek, Entwurf einer biomedizinischen Datenbank zur Therapieevaluierung für neurologische Erkrankungen mit Applikation auf Epilepsie, Diplomarbeit, Technische Universität Ilmenau, 2002.
[105] M. E. Kirlangic, D. Pérez, S. Kudryavtseva, G. Griessbach, G. Henning, and G. Ivanova, “Fractal dimension as a feature for adaptive electroencephalogram segmentation in epilepsy,” in Proc. of the 23rd
IEEE Engineering in Medicine and Biology Conference (EMBC), 2001, pp. 1244-1247.
[106] M. E. Kirlangic, G. Ivanova, S. Kudryavtseva, G. Griessbach, and G. Henning, “Amplitude differences in variations of slow cortical potentials in epilepsy patients and healthy controls,” Epilepsia, vol. 42, suppl. 2, p. 159, in Proc. of the 24th International Epilepsy Congress, 2001.
[107] M. E. Kirlangic, G. Ivanova, D. Pérez, R. Both, and G. Henning, “Differences in the hyperventilation induced scalp DC-Shifts in epilepsy patients and healthy controls,” Epilepsia, vol. 44, suppl. 8, p. 142, in Proc. of the 25th International Epilepsy Congress, 2003.
[108] M. E. Kirlangic and G. Ivanova (2003, Oct.). Neurotherapy: More than an extra feedback loop to the pathological brain. Journal of Systemics, Cybernetics and Informatics. [Online]. Vol. 1, no. 5. ISSN: 1690-4524. Available: http://www.iiisci.org/Journal/SCI/Contents.asp?var=&Previous=ISS9582
[109] G. Ivanova, M. E. Kirlangic, S. Kudryavtseva, G. Henning, and G. Griessbach, “Interaction between slow cortical potentials and breathing during neurofeedback therapy in epilepsy,” Epilepsia, vol. 42, suppl. 2, p. 30, in Proc. of the 24th International Epilepsy Congress, 2001.
[110] M. E. Kirlangic, G. Ivanova, S. Kudryavtseva, G. Griessbach, and G. Henning, “Influences of visual and acoustical stimuli on variations in slow cortical potentials,” Clin. Neurophysiol., vol. 112, suppl. 1, p. 77, in Proc. of XV. International Congress of Clinical Neurophysiology, 2001.
[111] L. von Bertalanffy, General System Theory: Foundations, development, applications, rev. ed., George Braziller, New York, 1976.
[112] K. Mainzer, Thinking in Complexity - The complex dynamics of matter, mind, and mankind, 2nd rev. ed., Springer, Berlin-Heidelberg, 1996.
[113] G. E. Schwartz, “A systems analysis of psychobiology and behavior therapy – Implications for behavioral medicine”, in: (ed.) H. Leigh, Psychotherapy and Psychosomatics, Special book edition: Behavioral Medicine, Biofeedback, and Behavioral Approaches in Psychosomatic Medicine, vol. 36, no. 3-4, 1981.
[114] H. Haken, Principles of Brain Functioning: A synergetic approach to brain activity, behavior and cognition, Springer, Berlin-Heidelberg, 1996, p. 9.
[115] H. Haken, Principles of Brain Functioning: A synergetic approach to brain activity, behavior and cognition, Springer, Berlin-Heidelberg, 1996, p. 37.
[116] H. Haken, Principles of Brain Functioning: A synergetic approach to brain activity, behavior and cognition, Springer, Berlin-Heidelberg, 1996, p. 47.

References 125
[117] H. Haken, Principles of Brain Functioning: A synergetic approach to brain activity, behavior and cognition, Springer, Berlin-Heidelberg, 1996, pp. 39-43.
[118] D. O. Hebb, The organisation of behavior, Wiley, New York, 1949.
[119] H. Haken, Principles of Brain Functioning: A synergetic approach to brain activity, behavior and cognition, Springer, Berlin-Heidelberg, 1996, pp. 117-122.
[120] H. Haken, Principles of Brain Functioning: A synergetic approach to brain activity, behavior and cognition, Springer, Berlin-Heidelberg, 1996, pp. 173-191.
[121] M. E. Kirlangic, G. Ivanova, and G. Henning, “The DC-level: An order parameter of the brain complex open system?,” International Nonlinear Sciences Conference (INSC) Abstract Book, 2003, p. 20.
[122] H. Haken, Principles of Brain Functioning: A synergetic approach to brain activity, behavior and cognition, Springer, Berlin-Heidelberg, 1996, pp. 51-63.

Appendix A
Questionnaire for the Control Subjects

Appendix A 127
FRAGEBOGEN Name, Vorname :
Geburtsdatum :
Geschlecht : weibl. männl.
Sonstiges : Größe m Gewicht kg
Adresse Info (Email) :
Telefonnummer :
Beruf / Studium (Richtung):
Tag der GrM1: Tag der GrM2: Tag der GrM3:
Händigkeitstest: Zähne putzen links rechts Tennisschläger halten links rechts
Würfeln links rechts Messer u. Gabel halten links rechts
Blumen gießen (kl.Kanne) links rechts Essen links rechts
Schreiben links rechts Korkenzieher halten links rechts
Haben Sie schon einmal unter einer der folgenden Krankheiten/Funktionsstörungen gelitten? Herzerkrankungen ja, wann? nein
Anfälle (allgemein) ja, wann? nein
Kopfverletzung in der Vergangenheit ja, wann? nein
Gedächtnisschwierigkeiten ja, wann? nein
Attention Deficit Hyperactivity Disorder (ADHD)
ja, wann? nein
Attention Deficit Disorder (ADD) ja, wann? nein
Depression ja, wann? nein
Lernbehinderung ja, wann? nein
Schlaganfall ja, wann? nein
Hirnhautentzündung ja, wann? nein
Durcheinander, Halluzinationen ja, wann? nein
visuelle Erkrankungen (Brillenträger?) ja, was? nein
Sonstige was/wann? __________
Nehmen Sie zur Zeit Medikamente?
ja, was/wie viel? nein
Haben Sie gestern geschlafen?
ja, wie lange? nein
Welche Genußmittel gebrauchen Sie? (freiwillig antworten) Alkohol ja, was/wie viel? nein keine Antwort
Nikotin ja, was/wie viel? nein keine Antwort

Appendix B
Inventories for Patient Information

Appendix B 129
Technische Universität Ilmenau Institut für Biomedizinische Technik und Informatik
Name, Vorname Referenz-ID Geburtsdatum Geschlecht weibl. männl. Status Patient Proband Händigkeit rechts links beidseits
Anamnese
Familienanamnese (für relevante Erkrankungen)
idiopathisch symptomatisch kryptogen fokal generalisiert nicht klassif.
Region: Elektrodenposition:
Diagnosen - Epilepsietyp – Epilepsieklassifikation - Epilepsieherd (wenn focal, wo?) - Andere (welche?bitte spezifizieren)
Anfallstyp
visuell akustisch motorisch keine andere (welche?)
keine Aura vor Anfall Aura vor Anfall? Aurabeschreibung:

Appendix B 130
Symptombeschreibung eines Anfalls
Photosensibilität ja nein Beschreibung:
Therapie – neurochirurgisch (Datum) – andere (welche?/ von-bis)
Messungen – EEG (Datum / Befund)
Messungen – Andere (CT, EKG...) (Datum / Befund)
Neurologisch ja nein Psychologisch ja nein
Besonderheiten / Auffälligkeiten
Psychol.Beurteilung des Pat. (bezügl.Wahrnehmung u.Gedächtnis)
Datum: _____________ Unterschrift:_________________________

Technische Universität Ilmenau Institut für Biomedizinische Technik und Informatik
Medikation Patient: geb.:
Einnahme Dosierung Blutspiegelkonzentration Medikament von bis früh mittag abend nachts Datum Befund
Nebenwirkungen
Datum: ____________________________ Unterschrift: ______________________________
Appendix B
131

Thesen (Statements in German)
1. Neurotherapie (bzw. EEG-Biofeedback) ist eine komplementäre unkonventio-
nelle Behandlung, die bei Erkrankungen, welche im Zusammenhang mit
Regulationsproblemen des Zentralnervensystems stehen, angewandt wird.
2. Epilepsie ist eine komplexe neurologische Erkrankung, die auf biochemischer
und physiologischer Ebene nicht ausreichend geklärt ist.
3. Die objektive Validierung der neurotherapeutischen Wirksamkeit ist eine der
wichtigsten Aufgaben des Forschungsgebietes.
4. Die Vielfalt der epileptischen Krankheitsbilder und der Behandlungs-
modalitäten verursacht ein Defizit von quantitativen Validierungskenngrößen,
die die Objektivität und die Effizienz der Diagnose und der Therapieevaluierung
signifikant erhöhen können. Dies trifft sowohl auf die Neurotherapie, als auch
auf konventionelle Behandlungen zu.
5. Eine höhere Objektivität kann durch folgende vorgeschlagenen
komplementären Komponenten erreicht werden:
a. Ein für die klinische Routine anwendbares Messprotokoll, welches einen
standardisierten Ablauf und Vergleich ermöglicht;
b. Das Neuroprofil als ein signalanalytisches mehrdimensionales Modell,
welches einen strukturierten Satz quantifizierbarer Kenngrößen definiert,
die von elektrophysiologischen Signalen extrahiert werden können;
c. Ein Satz von neuartigen quantitativen Kenngrößen, die aus dem
Elektroenzephalogramm, den ereignisbezogenen Potentialen und dem
Elektrokardiogramm berechnet werden. Folgende Kenngrößen werden
vorgeschlagen:

Thesen (Statements in German)
i. Prozentuale epileptische Musterhäufigkeit: Percentage epileptic pattern
occurence (EPO);
ii. Maß des Niveauunterschiedes der kontingent negativen Variation:
Contingent Negative Variaton level difference measure (dCNV);
iii. Index der Gleichspannungsänderung während und nach
Hyperventilation: Direct current recovery index (DCIrec);
iv. Quotient der Herzschlagfrequenzänderung während und nach
Hyperventilation: Heart rate recovery ratio (HRrec/hv);
v. Index der Herzschlagfrequenz bei Hyperventilation: Hyperventilation
heart rate index (HRIhv).
6. Es wurden deutliche Unterschiede in den Datenparametern dCNV, DCIrec, HRrec/hv
von Epilepsie-Patienten und Probanden festgestellt.
7. Die Kombinierung von Kenngrößen des Elektroenzephalogramms (DCIrec) und
Elektrokardiogramms (HRIhv, HRrec/hv) unterstützt die Diskriminierung der
Patienten und der Probandengruppe.
8. Die prozentuale epileptische Musterhäufigkeit (EPO) wurde mit Hilfe der
Methoden der überwachten und nicht überwachten Mustererkennung
ermittelt. Der dazu gehörige adaptive Segmentierungsalgorithmus wurde
modifiziert, indem die bislang verwendeten Värri-Parameter durch den
nichtlinearen Parameter Fraktaldimension ersetzt wurden. Es wurde
festgestellt, dass die Fraktaldimension die epilepsiespezifischen Änderungen
des Elektroenzephalogramms, wie z.B. die epileptischen Graphoelemente,
effektiver beschreibt und damit die Segmentgrenzen präziser ermittelt werden
können.
9. Die entwickelten Software-Tools, das Neuroprofilextrahierungsmodul und die
Datenbank „Neurobase“, bilden eine Basis zur Automatisierung der Prozeduren
für die Diagnose und Therapieevaluierung.

Thesen (Statements in German)
10. Die Neurotherapie ist ein komplexer Lernprozess, bei dem höhere kognitive
Funktionen sowie das autonome Nervensystem beteiligt sind. Die Synergetik
bietet einen geeigneten theoretischen Rahmen für die Analyse der an einem
solchen Lernprozess beteiligten physiologischen bzw. psychophysiologischen
Subsystemen auf einer makroskopischen Ebene.
11. Basierend auf den gewonnenen Erkenntnissen wurde die Hypothese aufgestellt,
dass das Gleichspannungsniveau im Elektroenzephalogramm ein Ordnungs-
parameter des Gehirns ist, wobei das Gehirn als ein komplexes offenes System
betrachtet wird.
12. Diese Hypothese sowie die Wechselwirkungen zwischen der höheren
kognitiven Tätigkeit und dem autonomen Nervensystem sollten Gegenstand der
zukünftigen interdisziplinären Forschung auf den Gebieten Signalanalyse,
Systemtheorie, Epilepsiediagnostik und Neurotherapie sein.