Embed Size (px)
Citation preview
Equity Valuation and Analysis
Leanna Dennard: [email protected]
Gavin Heckman: [email protected]
Kristin King: [email protected]
Michael Perrien: [email protected]
Jason Sibley: [email protected]

2
Table of Contents Executive Summary……………………………………………………………………………………………….4
Business and Industry Analysis……………………………………………………………………….……..9
Company Overview……………………………………………………………………………………..9
Industry Overview………………………………………………………………………….………….11
Five Forces Model…………………………………………………………………………………………….…12
Rivalry Among Existing Firms………………………………………………………………….….13
Threat of New Entrants………………………………………………………………………………19
Threat of Substitute Products……………………………………………………………………..22
Bargaining Power of Customers…………………………………………………………………..23
Bargaining Power of Suppliers…………………………………………………………………….25
Value Chain Analysis…………………………………….……………………………………………………..27
Firm Competitive Advantage Analysis…………………………………………………………………….30
Accounting Analysis ……………………………………………………………………………………………33
Key Accounting Policies …………………………………………………………………….………34
Accounting Flexibility …………………………………………………………………………………40
Actual Accounting Strategy ….…………………………………………………………………….41
Quality of Disclosure …………………………………………………………………………………42
Qualitative Analysis …………………………………………………………………………42
Quantitative Analysis ………………………………………………………….……………44
Sales Manipulation Diagnostic ……………………………………………..…44
Expense Manipulation Diagnostic …………………………………..….……50
Potential Red Flags ……………………………………………………..……………………………57
Undo Accounting Distortion ……………………………………………………………………….60
Financial Analysis, Forecast Financials, and Cost of Capital Estimation………………………61
Financial Analysis………………………………………………………………………………………61
Liquidity Analysis……………………………………………………………………………………….61
Profitability Analysis…………………………………………………………………………………..70
Capital Structure Analysis……………………………………………………………………………75

3
IGR/SGR Analysis………………………………………………………………………………………78
Financial Statement Forecasting………………………………………………………………….81
Analysis of Valuations………………………………………………………………………………………….88
Methods of Comparables……………………………………………………………………………89
Cost of Equity……………………………………………………………………………………………95
Cost of Debt……………………………………………………………………………………………..98
Weighted Average Cost of Capital……………………………………………………………….98
Intrinsic Valuations………………………………………………………………………………………………99
Discount Dividends Model…………………………………………………………………………..99
Free Cash Flows Model…………………………………………………………………………….101
Residual Income Model…………………………………………………………………………….103
Long Run Return on Equity Residual Income Model…………………………………….104
Abnormal Earnings Growth Model……………………………………………………………..106
Credit Analysis…………………………………………………………………………………………………..108
Analyst Recommendation……………………………………………………………………………………109
Appendix………………………………………………………………………………………………………….111
Heinz’s Ratios…..……………………………………………………………………………………..111
Campbell’s Ratios…………………………………………………………………………………….111
Sara Lee’s Ratios……………………………………………………………………………………..112
ConAgra’sRatios………………………………………………………………………………………112
Regression…..…………………………………………………………………………………………114
Cost of Debt……………………………………………………………………………………………131
Weighted Average Cost of Capital……………………………………………………………..131
Discount Dividends Model…………………………………………………………………………132
Free Cash Flows Model…………………………………………………………………………….133
Residual Income Model……………………………………………………………………………134
Long Run Return on Equity Residual Income Model……………………………………135
Abnormal Earnings Growth Model……………………………………………………………..137
Method of Comparables……………………………………………………………………………138
Reference Page…………………………………………………………………………………………………139

4
Executive Summary: Investment Recommendation: Overvalued, Sell as of 11/1/2007
HNZ Stock Price (11/1/07): $45.61 Altman's Z-Score: 52 Week Range: $42.04 - 48.15 2003 2004 2005 2006 2007
Revenue: 9.19B 3.024 2.917 2.809 3.241 3.308
Market Capitalization: 15.1B Shares Outstanding: 319.15M Valuation Estimates:
Percent Institutional Ownership: 62.50% Actual Price (11/1/07): $45.61
Book Value per Share: 5.77 ROE: 40% Financial Based Valuations: ROA: 8% P/E Trailing: $54.82 P/E Forward: $36.76 Cost of Capital: D/P $14.37 Time Period (With 60 observation best) : R2: Beta: Ke: P.E.G.: $30.09 3-month: 0.1722 0.6588 8.5308% P/B: $30.79 1- year: 0.1872 0.6596 8.8368% P/EBITDA: $33.07 3-year: 0.1756 0.667 8.6822% P/FCF: $10.74 5-year: 0.17468 0.66286 8.9614% EV/EBITDA: $54.03 7-year: 0.17493 0.66365 9.1374% 10-year: 0.17524 0.66457 9.3543% Intrinsic Valuation: Discount Dividend: $19.76 Published Beta: 0.62 Free Cash Flows: $25.18 Ke: 11.293% Residual Income: $24.30 Kd (BT): 5.6492% LR ROE RI: $24.57 WACC (BT): 2.5342% AEG: $27.12 WACC (AT): 2.3728%

5
Industry Analysis:
Heinz is a producer in the food industry and has many competitors that have
great effects on their decisions and products. They are a leading processed foods
manufacturer and own more than 68 factories world-wide and employing over 33,000
people. Heinz produces in Europe, Asia, and Australia. Food processing factories are
scattered in order to keep shipping and distribution costs low.
Some major competitors for Heinz include Sara Lee, ConAgra, and Campbell’s.
These existing firms battle for more and more market share since the food industry
mostly competes on quantity, not necessarily quality. Based on this high level of
rivalry, the threat of new entrants are very moderate. Since most of the products
produced in the food industry are very simple to recreate, the threat of substitute
products is high, giving the buyer moderate power. Also, since there are a lot of places
to receive the goods needed in the food industry, at least in the United States, the
suppliers have a little power in demanding higher prices from such large companies.
In order to gain a competitive advantage against their competition, firms in the
food industry must continually find ways to save more and more money compared to
the others. Efficient production, economies of scale, low-cost distribution, and product
variety are all key success factors in the industry that a firm must achieve to have a
chance at increasing its market share. Without these major success factors, the firm
would not have the cost saving and product variation needed to stay ahead or even
keep up with the rest of the industry.
Accounting Analysis:
It is very important that companies disclose proper financial statements. Their
information not only portrays how their company is doing but is also shows investors
how the company is doing. This is important for the companies to get loans. It is also
important for the companies to disclose correct information so they do not get in
trouble with GAAP. Heinz’s key success factors are economies of scale, cost leadership,
and low-cost distribution. Economies of scale are used to measure its wealth and size
relative to its competitors, and observe its relationships with its buyers. As the level of

6
disclosure continues to increase the level of transparency will also increase to provide
solid information.
Cost leadership is important in the food industry in order to get a position with
buyers to supply the company’s products. The food industry is very price competitive
and having a better priced substitutable product can increase sales versus having fewer
sales due to the cheaper replaceable good. Heinz strives to have competitive prices
and offer promotions on their products, such as coupons. This gives the buyer
incentives over other substitute products.
Low-cost distribution is the last of the key success factors. Since Heinz and the
food industry have to compete on price, they have to make up costs some where. One
way to decrease this risk is to go into long term contract with not only supplier, but also
buyers. This will provide more stability for Heinz and less worry of the future. It will
allow for them to allocate prices more effectively if they know their set price of
transportation.
Heinz strives to be cost effective, continue with a high level of research and
development, price sensitivity, and product variety. They also disclose information in
their 10-K’s that let shareholders and investors know where the numbers came from
and what methods they used. Heinz does a good job of disclosing this information. We
did not find any “red flags” through this process, but we did adjust for goodwill. This
shows that Heinz has a fairly high level of transparency in their disclosures.
Financial Analysis, Forecast Financials, and Cost of Capital Estimation:
We have put together a number of ratios that compare Heinz with three
competitors. We then used different financial information to project what Heinz’s share
price should be and compared it to Heinz’s share price at November 1, 2007. Liquidity,
profitability, and capital structure are the categories of the ratios we ran. We then used
these ratios to construct a forecast for Heinz’s three financial statements. Then we ran
regressions to see which beta was the best to use. Having this beta allowed us to
calculate our cost of debt, cost of equity, and weighted average cost of capital all of
which we would use to value Heinz.

7
The liquidity analysis shows that Heinz is a liquid firm. The quick asset ratio,
inventory turnover, and working capital turn over all show this. Heinz is doing well
when looking at the industry especially in the current ratio and days supply of
inventory. The only concern we had with the liquidity analysis for Heinz was the days
sales outstanding. This number is currently in 2007 ok with consideration of the
industry but has come down from the highest number in the industry from the last four
years. This shows that they are aware of the problem and trying to fix it.
The profitability analysis shows that doing well in the food industry and most of
the time at the top of the industry. This is with the exception of Heinz’s ROE. They
have had a very unstable ROE over the past five years and have shown signs of
improvement, but not consistency. The ratios that we ran were gross profit margin,
operating profit margin, net profit margin, asset turnover ratio, ROA, and ROE.
The last analysis was the capital structure analysis. Heinz showed good debt to
equity, times interest earned, and debt service margin. They are in line or at the top of
their industry. Although, Heinz can always improve on their ratios.
We then forecasted Heinz’s financial statements for ten years, starting in 2008
using the last five years of statement information. After analysis of all financial
information, we predicted an average growth rate of 5.4% of net income. We then
forecasted out the balance sheet, income statement, and cash flows statement which
will all help when we do our valuations of the firm.
Valuations:
The next step is to value the firm. We did this by first computing the cost of
equity, cost of debt, and the weighted average cost of capital. To solve the cost of
equity we used the CAPM model. We found the risk free rate and market risk premium
and used the best beta we found during our regression analysis. After finding the cost
of equity, we then found the cost of debt by taking all the liabilities on Heinz’s balance
sheet for 2007 and multiplied them by their corresponding rates. We then added up all
these numbers to get Heinz’s cost of debt. With these two numbers we found the
weighted average cost of capital. We used the WACC equation with the value of

8
liabilities over the value of the firm times the cost of debt plus the value of equity over
the value of the firm times the cost of equity.
Then, we computed our method of comparables. This method would show what
Heinz’s stock price should be. Each ratio gave us a different stock price. We ran P/E
forward and trailing, D/P, P/B, P.E.G., P/EBITDA, P/FCF, and EV/EBITDA. We found a
wide range of price from $10.74 from the P/FCF to $54.82 from the P/E trailing. These
wide ranges show that these methods vary in efficiency and effectiveness.
Our final valuation was the intrinsic valuation. This was made up of the discount
dividend model, free cash flows model, residual income model, long run return on
equity residual income model, and the abnormal earnings growth model. Heinz’s share
price will be valued at each of these valuation models and compared to their actual
share price from 11-1-07 which was $45.61. The discounted dividends model and free
cash flows models are both inaccurate in their valuations. They valued Heinz at $19.76
and $25.18 respectively. These both showed large fluctuations where there was a
change in variables. The residual income model valued Heinz at $24.30 and is a more
stable model along with abnormal earnings growth model. And the long run return on
equity residual income model comes up with $24.57 which is also a stable valuation.
Over all, these valuations show that Heinz is an overvalued firm.

9
Business and Industry Analysis:
Company Overview:
H.J. Heinz Company, a multi-national corporation, is a major processed foods
manufacturer. In 1869, Henry John Heinz and partner L.C. Noble started selling their
first product, horseradish, to local grocers in Pittsburgh, Pennsylvania. After 31 years of
selling condiments to local grocery stores, the H.J. Heinz Company became a legal
corporation on July 27, 1900. Today, Heinz is a leading processed foods manufacturer
owning more than 68 factories world-wide and employing over 33,000 people. “The
company also owns and leases office space, warehouses, distribution centers and
research and other facilities throughout the world (Heinz 2007 10K).” Food processing
factories are located sporadically throughout the world to make distribution more
efficient. The headquarters for the company still resides in Pittsburgh.
Food Processing
Factories
Owned Leased
North America 23 4
Europe 22 0
Asia/Pacific 14 2
Rest of World 9 3
Total 68 9
*Heinz 2007 10K

10
Heinz is included in the food sector of the major-diversified food industry. “Heinz
Company and its subsidiaries manufacture and market an extensive line of processed
food products throughout out the world including the following principal products:
ketchup, condiments and sauces, frozen food, soups, beans and pasta meals, infant
food and other processed food products” (Heinz 2007 10K). Heinz ketchup and Heinz
57 are the two leading products in the condiments sector. Acquiring new companies
around the world helps the company to grow their product line and increase the shelf
space allotted to them. Food processing plants dispersed throughout the world produce
the ingredients needed to manufacture their products. Having plants in numerous
major distribution areas help to keep shipping and processing costs low. Raw materials
that cannot be made in the factories are either bought through contracts with farmers,
or purchased in local markets.
The consumer goods industry contains a large number of companies, but the
main competitors of Heinz include the following: Sara Lee (SLE), Campbell Soup Co.
(CPB), and ConAgra Foods Inc. (CAG). With a market cap of $14.77 billion, Heinz leads
all of their major competitors. Heinz stock performance from 2003 to 2005 was
relatively stable around $46. Although the stock performance of Heinz is not as great
as that of Campbell Soup Co., Heinz net sales are far higher. Heinz stock price has
improved from $33.87 in 2003 to $46.81 today (www.finance.yahoo.com). The S&P
500 has historically been higher than Heinz and their competitors, but Heinz continues
to close the gap more and more every year.
*www.Heinz.com

11
“The H.J. Heinz Company has been a pioneer in the food industry for 138 years
and possesses one of the world’s best and most recognizable brands-Heinz. While the
Company has prospered for a long time, we are constantly finding new ways to
capitalize on emerging consumer trends and better methods of doing business (Heinz
2007 10K).” Heinz is constantly looking for ways to improve their current operations
and expand into new factories as needed. With increasing net sales and overall
company growth, Heinz will be incorporating more factories and distribution centers as
they are needed. The increase in revenues and operations allows Heinz to grow their
business all over the world. Also, over 100 new products were introduced within the
past year and many more continue to be developed. A 24% increase in marketing and
a 20% increase in research and development are both helping Heinz to grow their core
portfolio.
2003 2004 2005 2006 2007
Total Assets 9,224,751 9,877,189 10,577,718 9,737,767 10,033,026
Net Sales 8,236,836 7,625,831 8,103,456 8,643,438 9,001,630
Sales Growth (8.5%) (7.42%) 6.26% 6.66% 4.14%
*Numbers from Heinz 2003-2007 10K.
Industry Overview:
The consumer goods sector contains 32 different industries within its sector,
including the Foods-major diversified industry, the industry which Heinz is classified.
Heinz is placed in the major diversified food industry because not just one specialty
item is produced; instead they manufacture numerous different types of processed
foods. Having a wide variety of different products is beneficial to companies due to the
fact that consumers have more to choose from and are more likely to pick one of their
products versus one of their competitors.

12
Heinz relies on price competition to be able to keep up with their competitors.
“The Company operates in the highly competitive food industry across its product lines
competing with other companies that have varying abilities to withstand changing
market conditions (Heinz 2007 10K).” Being able to consistently update products and
development strategies is crucial for a company to remain competitive in their industry.
Using a cost leadership strategy will help Heinz to sell their products over other
companies. By having the lowest price for the highest quality good Heinz will be able to
attract and keep more customers.
Risk factors affect the percent of shares Heinz has in the market, and also their
financial analysis. Heinz is a multi-national company and faces the challenge of
currency exchange when totaling their sales and financial statements. Exchanging the
currency to U.S. dollars can cause accounting and numerical errors that will have to be
fixed on the financial statements.
Five Forces Model:
The five forces model is an analysis mechanism to help identify industry
competition, power, and profitability. The degree of actual and potential competition is
the first issue that the five forces model addresses. This competition among firms is a
determinant for prices in the industry. It ranges from the perfect competition state,
where a company’s prices are equal to the marginal costs, to a monopolistic state.
Monopolies can charge any price for any item, hurting the buyer. The five forces model
then examines rivalry amongst existing firms, threat of new entrants, and the threat of
substitute products. These competitive forces are tied closely to firm prices, costs,
products, and competitive moves with industrial firms. The second issue is the
bargaining power of the firm. This is important to firms because it can be an insight to
growth, income, or problems. It allows firm analysts to understand the position of the
firm over the bargaining power to buyers and suppliers.

13
Food Industry:
Competitive Force Level
Rivalry Among Existing Firms High
Threat of New Entrants Moderate
Threat of Substitute Products High
Power of Buyers Moderate
Power of Suppliers Low
Rivalry Among Existing Firms:
Problems that firms encounter in the food industry are unpredictable growth,
high industry competition, minimal differentiation, high fixed costs, and exit barriers. In
this industry, there are very high competitive products and pricing pressures due to the
large number of firms. Changes in business factors like pricing, product, or quantity
could lead to major changes in a firm’s profit. As the retail grocery trade continues to
consolidate, the food industry has to modify prices in relation to other firms and
increase buyer relations to be able to remain profitable.
Industry Growth Rate:
A main factor in industrial growth is competition. Having a flat growth industry
creates competition between firms for shelf space in a buyer’s store. A high growing
industry would lead firms to compete highly where price equals marginal cost to stay in
business. Being in a slow growth industry could possibly lead to the expectation of
price wars between competing firms. Having a negative growth would lead to lowering
prices below production costs which would cause a decrease in income. Each growth

14
scenario is directly affecting a firm’s income either positively or negatively. This is why
it is important for an analyst to track and predict the growth of industries. Shown in
the chart below, Heinz went from a negative growth to a positive and has steady sales
growth since 2004. The industry shows volatile sales growth. Sara Lee and Conagra
had major problems with their sales in a couple of years.
Sales Growth:
*Numbers from annual sales of each firm.
Concentration of Competitors:
The number of firms in an industry strongly influences how a company is run.
With a high number of firms at any given level, a company will have to aggressively
compete to get business and market share over competitors. Lowering prices, cutting
costs, and changing product lines are possible actions that could be taken in a high
concentration industry. Just the opposite is a low concentration industry where there
are few companies that can agree to charge a high price and receive higher profits
without advertising. This is called collusion. It can be very beneficial to firms and
quickly increase profits and keep them high. It is also important that there is a high
demand for products. The food industry has many firms that compete for the

15
customers’ needs or wants. The size of the firm is also very important in the
competition. The smaller companies cannot compare to the larger companies with
numerous product lines and international products. The chart below shows a range
from 15% to 35% market share per firm. The greater a firm’s market share increases,
the more it takes from others in the industry.
Industry Market Share:
Heinz percent of the market has been relatively stable for the past five years.
Although, Heinz net sales have been higher than its competitors for every year.
Having more diversified products than the other companies may reduce the percent of
the market shares because consumers do not realize which products are all made by
Heinz.
*Percentages are from annual sales compared with total industry sales for each year.
Differentiation and Switching Costs:
Businesses in the food industry strive to differentiate themselves from their
competitors by diversifying their product lines. However, there are many food
substitutes for the consumer. Firms appropriate this issue and pursue innovative ideas
to appeal to the customer’s desires. Competing companies fielding similar products
compete primarily on price and shelf space. Having similar products and prices creates
% Market Share
0% 5%
10% 15% 20% 25% 30% 35% 40%
2003 2004 2005 2006 2007
Heinz Campbells Sara Lee Conagra

16
low switching costs for consumers. Switching cost is the price that consumers are
willing to pay to switch from one product to a similar product, usually to a cheaper
substitute. Most consumers are indifferent between products and are quickly moved to
switch their buying behavior. Since switching costs are low in this industry, businesses
engage in greater price competition. Companies can also appeal to consumers by
offering new, diversified, healthy products that catch the consumer’s attention.
Economies of Scale:
An economy of scale is a process where a firm increases their size of production
and reducing long run average costs. Any size firm can experience economies of
scales. Introducing businesses outside of the United States is one example of an
economy of scale. Companies would increase the demand for their products and create
more revenue while spreading out their costs. While going international, firms keep in
mind diversity. Diversity is realizing and understanding the differences in multicultural
life. Being diverse with products, advertising, tastes, and values will increase this
success for a company.
Industry Diversity- Gross Profit:
U.S. Europe Asia/Pacific Rest of World
Heinz $1,140,000 $1,240,000 $386,800 $610,722
Campbells $2,657,000 --- --- --- --- --- --- --- $150,000
Sara Lee $6,602,000 $5,458,000 $2,042,000 $3,728,000
Conagra $3,138,500 --- --- --- --- --- --- --- $179,000 * Numbers in thousands from 2007 annual reports. Gross Profit = Net Sales – COGS
The Food Industry has a large market share outside of the United States. Heinz
has shown that selling domestically can be profitable as well as foreign sales. Heinz’s
percentage sold in the U.S. is about 34%, in Europe is 37%, in Asia/Pacific is 11%, and

17
the rest of the world is 18%. The major problems that comes up when selling outside
of the U.S. is dealing with exchange rates which are unexpected and can be very
unpredictable. Another major problem is that there are major cultural changes that
have to be made when looking at other countries. People from different cultures might
like a different type of spice in their food or lack of spice. Heinz would have to change
their recipes in order to sell any of their products.
Fixed and Variable Costs:
Costs play a large role in all firms’ success in earning a profit. The larger the
costs are, the less the company receives at the end of the year. Costs also provided
analysts with insight into the future of a company in projecting profit/loss outcomes. A
company ideally would like to have a small fixed to variable cost ratio. Firms should
have incentives to lower prices to increase the capacity of their products. The chart
below shows the food industry’s cost ratios. The average of Heinz fixed cost to variable
cost ratio is about .44, which is the average of 2003 through 2007. This means
companies have about double the variable costs to their fixed costs. This is not
profitable, especially in a price competitive industry.
Fixed Cost to Variable Cost Ratios:
2003 2004 2005 2006 2007
Heinz 0.4235 0.4635 0.4746 0.3645 0.4754
Campbells 0.3023 0.1952 0.1304 0.2769 0.1359
Sara Lee 0.4096 0.4124 0.4355 0.6756 0.4626
Conagra 0.3389 0.4412 0.4450 0.4337 0.4992 *Numbers from annual costs. Capacity:
When considering the capacity of an industry, the optimal goal is to have
demand greater than the company’s product supply. In the food industry, this is not

18
the case. Supply is greater than demand which is said to have excess capacity causing
the firm to lower already low prices in order to increase demand. This creates a
decrease in profits while costs are staying the same and the end outcome is less than
expected. From 2005 to 2006, Heinz had an increase in investing which showed an
effect on net income in 2007 which increase from 2006. Excess capacity in the food
industry is just another indicator that new entrant firms will fail before they even get
started.
Exit Barriers:
Exit barriers are anything that holds a company back from shutting down and
leaving its industry. Regulations can be assigned to an industry that companies have to
comply with before leaving. This is important for the company to consider if the
regulations or barriers cost more than the companies fixed costs. It would not be
reasonable to shut down if the company would have to pay more than could be earned
staying in the industry. That is why exit barriers are important factors in a business’
life. The food industry has few exit barriers to none. Since they would not hold a lot of
food in inventory, this would not take a long time. The most important issue would be
to disperse or sell the entire company’s disposable inventory. Then, it would sell off the
rest of the assets to pay off all costs and close books.
Conclusion:
The food industry is a highly competitive market. The competitiveness stems
from the similarities between company’s products and prices. The industry has a
gradual increasing growth rate, mostly concentrates on prices, competes on gaining
market share domestically and internationally, and has minimal exit barriers. Because
of high price competition, companies switch attention to the financials of costs and
liabilities. By decreasing costs and liabilities, the company will increase its net income.

19
Threat of New Entrants:
The threat of new entrants into the food industry is moderate. This industry has
low prices because of competition, which would not attract many new entrants. It is
comprised of many different types of firms ranging from large multi-product companies
to single product small companies. The threat of new entrants depends greatly on the
firm’s size. A billion dollar company would not have to be worried about new firm entry
because of their sheer size, while a small company would suffer from the switching
costs of customers. Economies of scale, first mover advantage, and barriers help
determine new entries into an industry.
Economies of Scale:
When deciding to enter into any industry, there are many important factors to
analyze and consider. The new entering company should compare its capital to the
firms that have the greatest market share. By looking at competitor’s operations, what
it buys and sells, how it invests, and other financial information, a new entrant can
determine if entering would even be worth it. The entrant would start off at a
disadvantage to the older companies. This is due not only to experience, but
economies of scale. The older firms have a positive income, relations with customers
and suppliers, innovations that took years to create, and the research to create new
products. The chart on the next page shows one of the important parts of the balance
sheet a new entrant should look at. Assets take a long time to posses and can add
great value to the company. A lender looks at assets to see if the company can back
up loans and the greater the assets, the greater the loans can be. If the assets are not
large enough, the company would struggle to keep up with other big dogs in the
industry.

20
Total Assets:
2003 2004 2005 2006 2007
Heinz $9,224,751 $9,877,189 $10,577,718 $9,737,767 $10,033,026
Campbells $6,205,000 $6,662,000 $6,776,000 $7,870,000 $6,754,000
Sara Lee $15,496,000 $14,879,000 $14,412,000 $14,660,000 $12,190,000
Conagra $15,185,600 $14,310,500 $13,042,800 $11,970,400 $11,835,500
* Annual total assets in thousands of dollars.
First Mover Advantage:
In most industries, the first mover has an advantage over all followers. This is
due greatly to brand recognition, brand loyalty, and setting industry standards. The
first mover could also enter into agreements, especially in the food industry. If there
was a high demand for a product of a first mover, that company could negotiate with
buyers and sellers so that odds are in the first mover’s favor. If the first mover keeps
off new entrants long enough, it could gain revenues and grow to where other
companies are discouraged to try and enter. In the food industry this is very important.
A first mover could come out with a new idea or product and it is important for the
companies to be the first one who do this to get customers. Research and
development play a large role, especially in such a competitive industry as the food
industry.
Channels of Distribution and Relationships:
The grocery stores have been consolidating recently which limits selling capacity
in the industry. This could discourage any new entrants to enter the industry. Plus, the
low product prices could possibly be a flag to an entrant that they would have trouble
getting relationships with buyers and suppliers leading to no shelf space. Entry firms
also have to consider the channel fluctuations in costs, such as energy and fuel costs,
transportations costs, crop failures due to disease or insect infestation, weather
conditions that affect crops, changes in food or drug laws, health and safety matters,

21
export and import restrictions, and currency exchange rates. These would all lead to a
direct effect to the costs of production, transportation, and to an increase or decrease
of profits.
Barriers:
In the food industry, there are strict barriers dealing with obtaining, creating,
and selling a product that consumers put in their body. There is a strict health code
that each firm has to follow throughout its productions process. These barriers
differentiate healthy foods that consumers can trust and foods that could contain
harmful ingredients. Also in the food industry, sometimes there is a recall on food due
to ingredients or the production process. This is very costly to the companies who
produce these defected goods. These companies lose production costs along with the
profit loss and the cost of recalling all the products and disposing of them. These legal
rules could discourage new firms from entering the market due to the threat of major
capital lost.
Conclusion:
The foods industry has a low to moderate threat of new entrants. This is mainly
due to the large number of aged firms already in the industry. Their economies of scale
would be incomparable to a fresh firm. New firms would find difficulty if entered into
the food industry for three main reasons. The first is the first mover advantage. The
industry advantage usually always goes to the initial firm in any industry. The second
reason is the capacity of shrinking distribution channels of suppliers and especially
buyers. This makes it hard for entering firms to start out at equal to experienced firms
already in the industry. The final reason is the high responsibility of legal barriers.
These issues pose high income loss in extreme situations, but minimal in consideration
that people will be consuming the products. All this information listed above points to
limited entry into the foods industry in the near future.

22
Threat of Substitute Products:
There will always be a high degree of competition between substitutes in the
food products market. Due to the fact that there are many relevant substitutes for
industry products in this market targeting the same customers, there is a serious threat
of consumers switching to a competitively priced comparable product. The similarity
between product lines with others on the market directly correlates with a low switching
cost for consumers.
Buyers’ Willingness to Substitute:
Since many industry products are functionally as well as economically the same
as many competitor products, buyers have an exceedingly low switching cost for most
industry products. This further emphasizes the fact that the food products industry is a
highly competitive industry. The one exception to this rule is when a particular company
negotiates exclusive contracts with high visibility like restaurants, hotels, or hospitals. In
this case, the respective company may only carry company specific condiments or food
products. Presumably, these contracts are renegotiated on a routine basis, emphasizing
the importance of maintaining solid business relationships with buyers.
Relative Price and Performance:
In light of the fact that in certain instances industry products have superior
branding and name recognition, in some cases they do have a distinct competitive
advantage. However, the industry is flooded with many large and small competitors,
and substitute products remain a considerable threat directly affecting the company’s
bottom line. Therefore, it is important for competitors to charge a similar amount for
their products despite this competitive advantage. The industry’s business strategy is to
continue to reduce costs to increase company profit margins. Industry competitors can
also gain an advantage by having its various brokers and agents initiate new as well as

23
maintain existing relationships with its customers (www.finance.yahoo.com).
Maintaining a loyal base of customers is of the utmost importance to the company.
Conclusion:
There are plenty of substitutes readily available and in close proximity in the food
products industry. In this competitive environment, companies are concerned with
losing market share to competitors. Combine these aspects with extremely low
switching costs and it is easy to see why industry insiders focus their efforts on
reducing costs and selling as much product as possible. These efforts coupled with
sufficient brand recognition enable companies to stay ahead of the curve and maintain
increasing profit margins.
Bargaining Power of Customers:
The amount of bargaining power consumers have greatly affects how a firm runs
its operations. The main determinants of this are price sensitivity and relative
bargaining power. Price sensitivity directly affects the amount of bargaining between
buyers and sellers. Relative bargaining power directly affects the ends buyers’ decisions
in which product they end up buying. Major retail supermarket chains, large scale
grocers, hotels, and still smaller local stores are a sampling of the customers industry
competitors sell their products to. Some companies in the industry also have a highly
diverse international customer base, selling products to various food serving entities like
sports stadiums or airlines.
Price Sensitivity:
Price sensitivity is essentially the price customers are willing to pay for the value
they perceive in an item. The value for industry competitors in the food product
industry is largely based upon consumer taste preferences and competitor pricing. This
is mainly evidenced in products like steak sauce, where the recipe is unique and taste is

24
a vitally important factor. On the flip side, industry competitors have many products
such as ketchup and mustard that contain the same basic ingredients as competing
products. Due to the fact that these are also very popular items, there are a substantial
number of imitators in the industry trying to chip away at various competitors’ market
share. For these products in particular, brand recognition and price play more of a key
role in sales. To have their products offered in places like Wal-Mart, companies have to
compete on price. This is mainly due to outside pressure from Wal-Mart to maintain a
cheap and affordable price for its customers. This is a double edged sword because
keeping prices for buyers like Wal-Mart low means that companies must also fight to
keep their costs of production low.
Bargaining Power:
Relative bargaining power relates back to an earlier discussion of switching costs.
With low consumer switching costs, companies within the industry must advertise
creatively to set themselves apart with things like television commercials, placing
coupons in newspapers and other local periodicals, and setting up point of sale displays
to further gain brand recognition. The effects to individual companies of potentially
losing customers are also taken into account when discussing bargaining power. As was
previously stated, customers in the food products industry generally have a low
switching cost because the competition’s product can generally be found in the same
store on the same shelf. Companies also must worry about their other set of buyers,
stores they directly sell their products to. These are important negotiations because
they determine in-store shelf space and prices as discussed in the previous section.
Conclusion:
The two most important factors determining customer bargaining power are
price sensitivity and relative bargaining power. To a very large extent, companies
construct their appropriate business strategies in accordance with these factors.

25
Bargaining Power of Suppliers:
Relative bargaining power of suppliers is also a key component to companies
maintaining their past success. This is relatively the same as the discussion above on
bargaining power of buyers, except the focus is flipped around the other way now. If
suppliers are highly leveraged with bargaining power, companies may be forced to
comply with that supplier’s stipulations. This could potentially have the effect of
increasing input costs and lowering profit margins. In this case, the firm is at the mercy
of its suppliers. On the other hand, if there are many different suppliers to the
company, then that organization has the more powerful position. With this power they
can force suppliers to decrease their prices and perhaps even dictate more demanding
shipping standards.
Price Sensitivity:
With the food products industry being so large, it has a position of power over its
suppliers because there are a large number of commodities growers. Suppliers must
adapt to the demands made by large companies within the industry because if they do
not, other suppliers would be more than happy to take their place. There is generally a
market rate for the raw materials that companies purchase for their products. In certain
instances however, the company can be held hostage to the commodities markets it
purchases supplies from. Companies buy commodities such as tomatoes, potatoes,
dairy products, and meat to use in its food products. The availability or cost of such
commodities may fluctuate widely due to government policy and regulation, crop
failures or shortages due to plant disease or insect and other pest infestation, weather
conditions, or other unforeseen circumstances (Heinz 2007 10K). These fluctuations in
price and supply could have a detrimental effect on a company’s business. As an
example, Heinz raised its prices this year to offset higher costs of dairy sweeteners and
oils. “This was in response to the rising popularity of ethanol, which drove the price of
corn to record high prices earlier this year (www.forbes.com).”

26
Bargaining Power:
Due to the industry’s significant size, there is quite a bit of bargaining power with
suppliers in the industry. The supply chain is still a critical part of the operations
though. Any problem with the manufacturing or distribution sectors of a companies
supply chain could inhibit a company’s ability to make and distribute its products.
Keeping this in mind, it is important for companies to maintain a supply chain that can
consistently and economically purchase raw materials, manufacture, distribute, and sell
its products to customers in a timely manner.
Conclusion:
The bargaining power of suppliers to a very large extent determines how
competitive a company is able to be within a given industry. Maintaining relationships
conducive to consistent and cost effective means of production and delivery is essential
to the survival of any firm in the food products industry. Companies must continue to
find the right balance in maintaining relationships with its buyers and suppliers to stay
relevant within its industry and fully utilize its production capacities in hopes of
maximizing shareholder wealth.
27
Value Chain Analysis:
In summary, the food industry in which Heinz is a primary competitor is
characterized by high rivalry among existing firms, a moderate threat of new entrants
into the market, a high threat of substitute products, moderate bargaining power of
buyers, and low bargaining power of suppliers. The factors that contributed to these
conclusions were unpredictable growth, high industry competition, minimal
differentiation, high fixed costs, and exit barriers in the industry. For a firm seeking to
be competitive in the industry, focus must be maintained on various success factors.
Primary concern in the highly competitive food industry, with the variety of
substitutes available to consumers, should be placed on cost leadership, rather than
differentiation. It should be noted that no firm concentrates purely on cost leadership
or differentiation, so a successful competitor will have a combination of both, but
emphasis should be placed on cost leadership.
Competitive Strategies:
In an industry with high competition, many substitute products available, and
little consumer loyalty, a firm competes by becoming a cost leader. Factors involved
with becoming a cost leader include efficient production, low input costs, economies of
scale, and low-cost distribution. However, as mentioned earlier, no firm should be
purely cost-competitive, and in the food industry, firms who offer a great deal of
product variety also prosper.
Efficient Production:
Efficiency is important for any firm in any industry. Getting maximum output at
minimum cost is arguably the most important factor to meet in being competitive. In
the food industry, however, it is very important. Many of the input costs are highly
volatile for the firms in this industry, as they are based on agricultural commodities.
This leads two primary dilemmas for a firm in the industry, the first being that a firm

28
must be able to keep costs down when commodity prices are high. This requires
maintaining low costs for other inputs, and an efficient production set-up. The second
dilemma is that all of the firms in the industry are typically getting their agricultural
inputs at the same or very similar prices. For a firm to be competitive in this type of
environment, it must be efficient in its production. To determine whether or not a firm
is an efficient producer, one must monitor the costs of the firm. All costs should be
minimized, and those not directly related to the production process should virtually be
eliminated.
Economies of Scale:
Size matters in the food industry. In order for a firm to be competitive, it must
be large enough to market its product to a wide range of customers. To do this it must
be able to produce its products on a large scale, and distribute those products to many
different locations, in many cases world-wide, while keeping costs as low as possible.
This is difficult for smaller, younger firms to achieve, as it requires good relationships
with buyers, and large amounts of capital. Therefore, in this particular industry, it pays
to be big, wealthy, and established. Obviously, to measure an efficient economy of
scale would be to measure its wealth and size relative to its competitors, and observe
its relationships with its buyers. In this industry, the efficient economies of scale come
from the bigger companies.
Low-cost Distribution:
Another way for a firm to be competitive is to keep its distribution costs down.
This allows for higher profit margins down the line, which is critical in a cost-competitive
industry. In this instance, it helps to be large and experienced, again. Firms that have
the capital and the relationships with distributors have a better bargaining position than
smaller, less wealthy firms and can better keep the costs low. To get a good
measurement of this, one should measure how much the firm is spending on
distribution relative to what its competitors are spending.

29
Product Variety:
Product variety is not typically associated with a cost competitive market, as it is
usually more expensive for a firm to produce a multitude of products. In the food
industry, however, there are many different, closely-related products for a consumer to
choose from, and since there is less customer loyalty in this market, it is easy for a
consumer to choose one firm’s product over another’s. Therefore, the more products a
firm can offer a consumer to choose from, the more likely a consumer is to purchase
one of that firm’s products. Many firms in the industry do this either through various
brands, or by using a spin-off product, and in order for a firm to compete, it must do
the same. Efficiency in product variety can be measured the number of products
produced by a firm and the amount generated by each of those products.
Conclusion:
This is a highly competitive industry, as demonstrated by the wide availability of
substitute products, large number of competing firms, and volatility of inputs.
Maintaining a competitive advantage requires that a firm keep its costs as low as
possible. It must maintain efficient production, lowering as many of its input costs as it
can down, keep its distribution costs down, and market to as many consumers as
possible. It must also supply what the consumer is looking for, which requires offering
many different types of products, and yet maintaining low prices. Consumer loyalty is
extremely difficult to come by in this industry, so a firm seeking to be competitive must
cater to whatever a consumer may want.

30
Firm Competitive Advantage Analysis:
Heinz has been implementing a two year plan primarily to increase shareholder
value, but has also, helped increase net sales and operating income. This plan aims to
execute several key objectives in order to produce efficiently, grow economies of scale,
lower the cost of distribution, and increase the company’s product variety. These are
necessary for all companies in the food industry, and Heinz has made it a goal to lead
the industry in these aspects in order to stay ahead of the competition in the food
industry. According to Heinz’s most recent 10-K, thanks to the current two year plan,
“The Company achieved its targets for Fiscal 2007 and is well positioned for continued
growth in Fiscal 2008.”
Efficient Production:
In the food industry, it is essential to produce your product very efficiently to
increase profit by reducing cost of goods sold. Heinz in the past year has closed or
divested 16 plants in order to help lower production costs (www.heinz.com). This can
be seen as a precursor to “reducing cost of goods sold by 90 basis points as a
percentage of sales, and total gross profit exceeding the company’s expectations.” The
recent development of a “Global Supply Chain Task force” by Heinz has reduced the
cost of production in the recent fiscal year, and is expected to continue to help drive
production cost down. Since inputs such as agricultural inputs are hard to judge and
usually cost all companies in the food industry practically the same, Heinz is willing to
discard unproductive plants in order to help drive costs that they can more easily
control downwards, according to their most recent annual report.
Economies of Scale:
In this industry, being a large company is very important if you want to have
bargaining power over your suppliers. As stated earlier, the power of the suppliers in
this industry is low since most of the companies are large. For being one of the largest

31
companies in a large industry, Heinz is able to, for the most part, negotiate easily with
suppliers (www.finance.yahoo.com). Since Heinz produces so many of so many
different products, they can easily buy in massive quantities, which reduce the cost per
item significantly. By doing this, the company greatly reduces costs, and receives a
great, loyal supplier foundation. Staying with the same suppliers and signing long term
contracts can easily keep costs down as long as they are able to trust these suppliers.
Along with being a large company being able to “strong-arm” suppliers, Heinz, with its
two year plan which includes increasing cash flow and capital, has the ability to buy
certain suppliers so they can even supply some of their own necessities. In addition,
with an acquisition such as of IDF Corp., they can pick up suppliers through acquisitions
of competitors (www.heinz.com).
Low-cost Distribution:
In an industry that almost everyone receives the same products for the same
price, cost reduction is a key component in order to maximize profit margins. Another
way that Heinz is trying to achieve cost reduction is by lowering the cost of distributing
their products. This is a daunting task for a company who sells hundreds of products in
over 200 countries, but they understand they need to lower these costs in order to stay
as profitable as possible. One major way that Heinz has been able to control
distribution costs was by entering into “long-term agreement with ES3, LLC, a leading
national third-party logistics and distribution company, to be its lead logistics provider of
warehousing and distribution services for Heinz's ketchup, condiments and sauces
businesses” (www.es3.com). By signing this agreement, Heinz effectively has given the
task of distributing its goods to a large distribution company that has more distribution
centers in the United States that Heinz products can leave from and find their ways to
stores nationwide.
Product Variety:
In the food industry, firms must go beyond a simple one product in order to be
competitive. Heinz is no different in that they sell not only items such as ketchup and
32
mustard, but also meals, snacks, and infant foods. Though their top 15 brands grew
8.5% on the year, nearly 100 new products were launched (Heinz 10-K 2007). Heinz’s
current research and development teams are working on over 200 new products across
these several markets. In order to continue at varying the products that they produce,
Heinz has increased research and development nearly 20% in innovation and consumer
insight. By increasing consumer insight, the company will be able to continue to
research products that consumers actually want or need, making the whole innovation
process less expensive in the long run. The company is looking into “incremental
improvements in… convenience products like portable hand-held snacks… and
microwavable soups in the UK, Australia and New Zealand.”
Conclusion:
Heinz has positioned itself to increase market share by continuing growth
worldwide. By continuing to find ways to produce efficiently, increase economies of
scale by growing at a safe rate, lower the costs of distribution, and research and
develop new products, the company has established its future and put themselves in a
great situation to continue to lower costs and increase profits. Halfway through the
most recent two year plan, the numbers of the past year prove that Heinz has
implemented a great plan in order to stay competitive.

33
Accounting Analysis:
The balance sheet, income statement, and the statement of cash flows all show
the current standings of the firm and what it plans to do in the future. The
Management Discussions and Analysis section of the annual report provides insight into
the company’s performances, business conditions, and decisions. Financial statements
are important for numerous reasons. The main reason for presenting all necessary
financial statements is to provide information to investors. Investors are an important
part of any business. Without enough funding for operations, a company would be
forced to leave the industry. Investors fuel the firms operations leading directly to
profits. Another important reason to disclose financial statements is for shareholders.
A firm’s optimal goal is to maximize profits for the shareholders. The statements give
valuable insight to shareholders possibly creating a higher value for the company stock.
These financial statements must be prepared very diligently and properly. There
are many rules put into place so that firms cannot alter numbers or policies to make
their company look better. Firms must follow General Accepted Accounting Practices
(GAAP) that is put in place by the Securities and Exchange Commission (SEC). GAAP
sets the standards, conventions, rules, and procedures that firms must follow when
creating their financial statements. These rules also help investors to understand all of
the financial statements of the company so that they can know what they are investing
in.
Accounting allows managers to have room to modify their firm’s financial
statements to better fit the company. Having the ability to choose their own policies
creates the opportunity for managers to adjust the correct numbers to different
numbers that would make the company appear better off and have higher profits. An
accounting analysis is necessary to look at the financial statements to see if there is
purposeful wrong doings and correct them.
Accounting analysis evaluates the degree to which a company’s financial
statements capture its business principles. Analysts can follow these rules to evaluate

34
the firm’s financial statements and undo the mistakes. The first step is to identify key
accounting policies. A company’s industry characteristics and strategies help to
determine their key success factors. “One of the goals of financial statement analysis is
to evaluate how well these success factors and risks are being managed by the firm
(Palepu & Healy 3-7). The second step is to assess the degree of potential accounting
flexibility. This step connects key accounting policies to potential accounting flexibility
to see where the company can separate from the general structuring of financial
statements. The third step is to evaluate actual accounting strategies. This is where
the analysts can determine true performance from mistakes or changes in financial
statements. The fourth step is to evaluate the quality of disclosure with a qualitative
and quantitative analysis. This step shows how well the financial statements were put
together and how close they are to the actual numbers. The fifth step is to identify
potential red flags. A red flag is anything that the analysis cannot explain and is
directly related to what was found in step four. Any red flags that are found are good
indicators that the manager changed the numbers indicating no explanation. And the
last step in accounting analysis is to undo the accounting distortions that were found in
the previous steps. This is important so firms are transparent and not misleading to
their investors or stockholders. When firms do unknowingly make mistakes they would
be brought to the company’s attention and corrected at this point.
Key Accounting Principles:
When evaluating a company’s key accounting principles it is important to know
the key success factors. Understanding these factors can help the company to decide
which accounting principles to use to keep a competitive edge over their competition.
As stated earlier in the five forces model, the key success factors of Heinz are
economies of scale, cost leadership, and low-cost distribution. Heinz is in an industry
with a large amount of product substitutes, and must go the extra distance to keep
them ahead of their competitors. Setting the costs low will persuade consumers to
purchase their product instead of a higher priced alternative. In order to keep the costs

35
low and maintain cost leadership, Heinz must be efficient in their production and
purchasing of raw materials. When trying to keep the inputs as inexpensive as possible
it allows Heinz to keep their prices low. Product variety is also very important for Heinz
to be able to beat their competition. With so many different products to choose from in
this industry, Heinz must have as many products on the shelves as possible to ensure
success. The more products that Heinz can distribute the more likely the consumer is
to purchase from their line of products. The key success factors help to establish the
following key accounting policies used by Heinz.
Sales Growth:
Due to the highly competitive food processing industry, Heinz has to remain a
cost leader to continue the growth of both the company and net sales. Through
acquisitions and mergers, Heinz continues to expand their operations throughout the
world, and better manage fixed costs. With larger companies it is easier to mass
produce and distribute which keeps costs low. Since Heinz has food processing
factories and distribution centers world-wide, distribution costs are lower. “Gross profit
increased $299.8 million, or 9.7%, to $3.39 billion. These improvements reflect higher
volume, productivity improvements and favorable foreign exchange, partially offset by
commodity cost increases (Heinz 2007 10K).” Heinz is constantly trying to find ways to
increase productivity and decrease costs to raise the gross profit. Over the past five
years net sales of Heinz has been rising except for in 2006 where the sales were
comparable with that of 2005. The net sales growth is shown in the table on the
following page.

36
*Heinz 2007 10K
Heinz continues to look forward to new mergers and expansions that will
increase the net sales of the company. “In fiscal 2008, the Company will continue to
invest in improved business systems in order to boost the efficiency of its promotional
programs, particularly in Europe (Heinz 2007 10K).”
Post-Retirement Benefit Plans:
Heinz offers post-retirement health care and benefit plans for those employees
that are eligible. Benefit plans make it difficult for any cost leadership company to keep
their costs low while still following the key success factors. Heinz has to try to
accurately estimate the liabilities and discount rates that will be utilized by their
employees at a future date. It does become hard trying to keep the pension rates
competitive with other companies while still keeping overheads low for the cost
competition in the industry. Heinz has stated in the 2007 10K that “Several statistical
and other factors that attempt to anticipate future events are used in calculation the
expense and obligations related to the plans including assumptions about the discount
rate, expected return on plan assets, turnover rates and rate of future compensation
increases as determined by the Company, within certain guidelines.” Often times this

37
type of aggressiveness in accounting strategies can make it hard for the investor to see
what is really true about the company.
Pension Discount Rates
2003 2004 2005 2006 2007
Heinz 5.90% 5.80% 5.50% 5.30% 5.50%
Campbell’s 6.39% 6.19% 5.44% 6.05% N/A*
Sara Lee N/A* N/A* N/A* N/A* N/A*
Conagra 7.25% 6.50% 6.00% 5.75% 5.75%
*Numbers from 10K’s of companies
The table above shows the pension discount rates of Heinz and their
competitors. Decreasing rates means that the numbers are becoming more transparent
to the company and investors. Keeping the discount rates relatively consistent shows
that Heinz is confident in their key success factors. The key success factors are often
used when setting these rates to help keep the costs low.
Operating and Capital Leases:
An operating lease is “A lease for which the lessee acquires the property for only
a small portion of its useful life (www.investorwords.com).” Operating leases are not
recorded on the balance sheet because they are not owned by Heinz, but are usually
included in the income statement as an expense. This can cause the financial reports
to not be transparent as it makes liabilities seem lower than they really are. Operating
leases are utilized by Heinz to gain access to production and office facilities,
warehouses, and equipment that are necessary in production and distribution of
products. These lease obligations “amounted to approximately $104.3 million in 2007,
$97.6 million in 2006, and $101.2 million in 2005 (Heinz 2007 10K).” This is a relatively
small amount compared to the total liabilities.
Capital leases are defined by www.investorwords.com as “A lease that meets one
or more of the following criteria, meaning it is classified as a purchase by the lessee:
the lease term is greater than 75% of the property's estimated economic life; the lease
contains an option to purchase the property for less than fair market value; ownership

38
of the property is transferred to the lessee at the end of the lease term; or the present
value of the lease payments exceeds 90% of the fair market value of the property.”
Capital leases are used by Heinz, but not as often as operational leases. This type of
lease is stated on the balance sheet and is amortized over the asset’s useful life. The
table below illustrates the total long term debt versus operational and capital leases.
< 1 year 1-3 years 3-5 years > 5 years Total
Long Term Debt $538,236 $1,521,200 $1,873,122 $3,259,179 $7,191,737
Capital Leases $10,046 $19,423 $54,391 $33,581 $117,441
Operating Leases $67,002 $108,994 $71,476 $188,163 $435,635
*Heinz 2007 10 K (amounts in thousands)
Operating and capital leases are important in a cost leadership industry. Most
firms will want to keep most of their obligations classified as operating leases to make
the financials more appealing to investors.
Currency Rate Risk:
International companies face numerous market risk factors due to the conversion
of currency into U.S. dollars. Market risk numbers are not included on the balance
sheet because they are not believed to have an affect on the financial situation of the
company. The risks can be somewhat diversified since Heinz owns factories throughout
the world and not just in one market. “The Company may attempt to limit its exposure
to changing foreign exchange rates through both operational and financial market
actions including entering into forward contracts, option contracts, or cross currency
swaps to hedge existing exposures, firm commitments and forecasted transactions
(Heinz 2007 10k).” Maintaining low costs is vital in following the key success factors.
Although some market risks cannot be avoided, it is necessary for Heinz to try and
decrease whatever risks they can.

39
Research and Development:
Heinz is constantly looking for new and innovative products that can increase
company value. This requires that a large amount of money be spent on research and
development. R&D is reported in the income statement under the selling, general, and
administrative expenses and not as an asset. Expensing this out ensures that the net
income level is not temporarily higher than the real number.
Recently, Heinz has set out a goal for the company to grow the core portfolio
including the largest brands. The Heinz 2007 10K states that, “This strategy
established targets for increased marketing spending of $50 million and double digit
increases in research and development costs.” This was almost a 20% increase in
research and development in 2007 alone. Continually increasing R&D costs can make it
difficult to remain a cost leader, but Heinz expenses them which help to keep their fixed
costs low.
Heinz is very reliable about following the proper accounting methods of
expensing these costs, and not recording them as an asset. Although this might not be
the best option for cost leadership competition, it is the correct way to report R&D.
This keeps the company in stride with the key success factors and investors.
Conclusion:
With the accounting policies constantly changing, it is important for any company
to keep up with them and make sure that they are following their own key success
factors. Having clear, transparent financial reports is the best way to achieve this.
Heinz does a good job of disclosing all of the information necessary in reporting the
firm’s position. The accounting policies above followed the Heinz’s key success factors
of economies of scale, cost leadership, and low-cost distribution. As the level of
disclosure continues to increase the level of transparency will also increase to provide
solid information.

40
Accounting Flexibility:
Firms provide financial statements so that investors can have an accurate
assessment of the firm’s financial position when making investment decisions. The
information provided should be dependable and consistent over time in accordance with
Generally Accepted Accounting Principles (GAAP). The accounting flexibility given by
GAAP allows firms to either accurately depict their current financial position or to
disguise certain shortcomings.
Operating & Capital Leases:
Capital and operating leases are a major area where Heinz has accounting
flexibility. With its operating leases, Heinz leases the right to use a particular property
for operating its business. When the lease is up, Heinz then has the option to either
renew the lease for an additional term or abandon the premises. “The monthly rent
expenses associated with operating leases only show up on the income statement and
not the balance sheet (http://pages.stern.nyu.edu).” This alludes to the fact that
assets and liabilities can be understated by the company when using operating leases.
This does not necessarily reflect the true financial state of the company. This is
problematic because investors will be more inclined to invest if they perceive a company
to be more profitable than it is in reality.
“In a capital lease, the lessee assumes some of the risks of ownership and
enjoys some of the benefits. In this case, the leases are listed as both an asset and
liability on the balance sheet (http://pages.stern.nyu.edu).” Firms usually choose
operating leases over capital leases since capital leases recognize expenses sooner.
Since both lease type amounts are relatively small for Heinz, they maintain accounting
flexibility when choosing which lease style to apply.
Post-Retirement Benefits:
Post-retirement benefits can be very large liabilities for firms. Heinz must
determine the present value of future cash flows they will have to pay out to employees

41
with benefits through careful calculations based on employee base, the discount rate,
expected asset returns, and future compensation rates. “The lower the discount rate,
the more conservative the pension accounting; the higher the discount rate, the more
aggressive (http://beginnersinvest.about.com).” Lower discount rates obviously
represent higher assets for a company because expenses associated with pensions
would be less. Lower discount rates will also cause higher rates of return, thus
increasing the attractiveness of investment within a given company. Heinz has
consistently maintained a lower discount rate than that of its competitors. This
conservative style illustrates Heinz’ supreme confidence in the performance of their core
portfolio of products and acquired businesses enables them to have the flexibility of
lower pension discount rates.
Conclusion:
Accounting flexibility, as provided by GAAP, enables firms to best display their
financial realities in a way they see relevant to their line of business. This power can
also be used to disguise investors into thinking a firm is more valuable than it is in
actuality. Heinz relays helpful insider information on its company in a way that
contributes to the ability of investors to get a fair picture of its financial position.
Actual Accounting Strategy:
The leeway provided by GAAP will cause companies to resort to either aggressive
or conservative accounting styles when making their financial statements. The style
chosen depends upon whether the company wants to give a realistic or unfairly
optimistic view of their current business setting. Heinz appears to have chosen a mix of
conservative and aggressive accounting in formulating its financial statements.
Heinz had $104.3 million worth of operating leases in fiscal 2007. While this
number may seem high, it is a relatively small amount when compared with the
company’s total liabilities. Treating this lease expense as an operating expense on the
income statement enables Heinz to leave these leases off the balance sheet. This could

42
appear to be an aggressive accounting technique when considered on its own, but the
amount is small relative to total liabilities and Heinz’s direct competitors within the
industry use similar accounting methods. This bit of aggressiveness is also offset by the
disclosure of these facts in the financials.
Heinz has pension plans available to eligible employees. “The company sponsors
pension and other retirement plans in various forms covering substantially all
employees who meet eligibility requirements. Several statistical and other factors that
attempt to anticipate future events are used in calculating the expense and obligations
related to the plans (Heinz 2007 10K).” This is used with estimated pension withdrawal
and mortality rates to estimate the company’s future benefits expenses. Heinz has
used a discount rate consistently lower than its competitors, though competitor rates
are essentially in the same ballpark. Heinz has kept its discount rate consistent
between 5.3 and 5.9% for the last 5 fiscal years. This along with an overall lowering of
industry rates when information is available can be seen in the pension discount rates
chart above. “These lowering rates in the industry are viewed as a conservative
accounting measure by respective firms because these lower discount rates will in effect
cause pension costs to rise (http://beginnersinvest.about.com).”
Quality of Disclosure:
A firm’s management can make an outside analyst’s job more or less difficult
when deciding to put together the financials. Managers have a certain amount of
wiggle room in disclosing accounting policies. This makes management’s quality of
disclosure in the financial statements an important part of the firm’s accounting policies.
Qualitative Analysis of Disclosure:
The quality of disclosure provided by the company should be adequate in giving
a realistic view of the current business position without giving away information that
could deplete a firm’s competitive advantage within its industry. The quality of the
disclosed information is crucial for outside analysts to maintain their confidence in the
43
credibility of the company’s management. Misrepresented information, if discovered,
can do unknown amounts of harm to the company in all undertaken future business
endeavors. Heinz makes an effort to disclose and explain much of the information in its
annual reports. Some things like the goodwill mentioned above, however, are not
explained in a concise way that would give the average person a true understanding of
Heinz’s financial reality.
Post-Retirement Benefits:
Heinz does a fairly good job of informing investors about the affairs of both
existing and upcoming product lines and how these will directly affect the financials.
Heinz proves its financial transparency by discussing at length the implications of its
post retirement benefits. This is important to analysts who know that companies have
a large amount of flexibility when it comes to distorting financial statements based on
unsound handling of pension plan accounting. Heinz discusses the importance of
setting the discount rate and summarizes the process of how post-retirement benefits
are accounted for. The company also discusses the sensitivity of these assumptions
and provides examples of how small changes in pension plan assumptions can greatly
influence the expenses associated with the plan. This amount of disclosure is different
with certain Heinz competitors who do not even disclose respective pension discount
rates.
Business Segment Breakdown:
Heinz is also helpful in breaking down the sales of differing product sections by
country. This is especially helpful to outside analysts since Heinz conducts business
worldwide. The percentages on the following page represent fiscal year sales operating
results for 2006 and 2007 taken from the 2007 Heinz 10K.

44
Business Segment Operating Results
2006 2007
North American Consumer Products $2.6B $2.74B
U.S. Foodservice $1.6B $1.56B
Europe $3.0B $3.08B
Asia/Pacific $1.1B $1.20B
Rest of World $330M $427.1M
*Numbers from Heinz 2007 10K
Quantitative Analysis of Disclosure:
Quantitative analysis is used to evaluate a firm’s performance using ratios to put
several different numbers into easy to understand ratios. Based on these ratios,
analysts can gauge how a firm’s accounting policies are affecting their numbers and
possibly misleading investors. Since managers are given flexibility with their accounting
procedures, some numbers may be distorted to help further their personal goals.
There are two different types of diagnostics to check for discrepancies. Analysts
look at both sales manipulation and expense manipulation diagnostics. Comparing
sales numbers such as net sales, inventory, and accounts receivables will show whether
or not there are any uncommon increases or decreases in certain sales numbers which
could overstate sales, while comparing expense diagnostics show whether managers
have tried to understate expenses.
Sales Manipulation Diagnostics:
Since GAAP gives flexibility to managers who have incentives to try to
increase profits, analysts use certain ratios to determine if there are large
inconsistencies in a firms sales ratios. Analysts can look at companies based on their
industry and competition to see if a firm’s performance and sales growth is questionable

45
according to their annual reports. The following sales manipulation diagnostics
compare Heinz with their competitors, Campbell’s, ConAgra, and Sara Lee.
Net Sales/Cash from Sales:
Net Sales/Cash from Sales
0.9
0.95
1
1.05
1.1
2003 2004 2005 2006 2007
Year
HeinzCampbell'sConAgraSara Lee
*Numbers from company’s 10Ks
The ratio net sales to cash from sales are meant to show how much cash is
being received from a company’s net sales. In a perfect situation, the ratio would be
one, meaning that every dollar sold would be turned into cash. However, with
companies being allowed a “tab,” or given sometime before they must pay the bill, the
ratio can easily deviate from that perfect world situation. Since Heinz has kept this
ratio consistently between .99 and 1, they have ensured that they might not lose a
large portion of their sales due to companies not being able to pay them. This ratio is
significant in that cash collection activity supports a firms selling activity. Since the ratio
has remained somewhat constant, it can be said that Heinz has not overstated net sales
based on cash from sales activity.

46
Net Sales/Net Accounts Receivable:
Net Sales/Net Accounts Receivable
0
4
8
12
16
20
2003 2004 2005 2006 2007
Year
HeinzCampbell'sConAgraSara Lee
The ratio net sales compared to net accounts receivable shows analysts just how
much more net sales is compared to accounts receivable. For a specific company, their
ratio would be hopefully at or slightly above the industry level. This would mean that
their net sales would be larger compared to their accounts receivable then the rest of
the industry. Heinz has the lowest net sales to net accounts receivable ratios for the
industry based on these four companies. According to this ratio, Heinz has been
increasing their ratio, trying to get away from accounts receivables since they can
sometimes be risky. It is still troubling that they have the lowest ratio, but they seem
to be gaining ground compared to the other competitors.
*Based on 10-K and Annual Reports of their respective companies

47
Net Sales/Inventory:
Net Sales/Inventory
0
2
4
6
8
10
12
14
2003 2004 2005 2006 2007
Year
HeinzCampbell'sConAgraSara Lee
The net sales to inventory ratio shows exactly how quickly inventory of a company is
sold. A low ratio could indicate that the company has a higher inventory level, while a
higher ratio could show a lower inventory. Inventory turnover shows how often
inventory is sold off and replaced (www.investopedia.com). Since Heinz has kept a
relatively consistent ratio, there is no indication that net sales are overstated based on
their inventory levels.
Net Sales/Unearned Revenues:
No firms out of Heinz, Campbell’s, ConAgra, and Sara Lee have disclosed in their 10-K
or their annual reports if they have any unearned revenues. It would be safe to
assume that they do have some unearned revenues considering their large industry and
the many companies they serve. However, this ratio cannot be determined without
exact figures and those are not given to the analysts.
*Based on 10-K and Annual Reports of their respective companies

48
Net Sales/Warranty Liabilities:
As with the above ratio, warranty liabilities are not disclosed for any of the
competitors in this industry. Either analyst’s should assume that the companies do not
provide warranties on their products since they can easily spoil, or the companies have
just decided not to disclose this information. It is probably safe to say that the
companies do not offer warranties for their products.
The sales manipulation ratios for the above graphs are listed below for Heinz,
Campbell’s, ConAgra, and Sara Lee.
Conclusion:
Overall, Heinz has been very forthcoming about their accounting numbers. Though
they did not disclose unearned revenue or warranty liabilities neither did any of their
competitors. Since their net sales compared to cash from sales, net accounts
receivable, and inventory are consistent and lack any major volatility such as Sara Lee’s
net sales/inventory ratio, Heinz does not manipulate their sales numbers.

49
Sales Manipulation Diagnostics
Heinz
2003 2004 2005 2006 2007
Net Sales/Cash from Sales 0.99 0.99 1.00 0.99 1.00
Net Sales/Net Accounts Receivable 6.49 6.98 7.42 8.63 9.03
Net Sales/Inventory 6.56 6.59 6.45 8.05 7.51
Net Sales/Unearned Revenue n/a n/a n/a n/a n/a
Net Sales/Warranty liability n/a n/a n/a n/a n/a
Campbell’s
Net Sales/Cash from Sales 1.00 1.01 1.00 1.00 1.01
Net Sales/Net Accounts Receivable 15.18 13.59 13.89 14.86 13.54
Net Sales/Inventory 8.84 8.52 9.39 10.09 10.15
Net Sales/Unearned Revenue n/a n/a n/a n/a n/a
Net Sales/Warranty liability n/a n/a n/a n/a n/a
ConAgra
Net Sales/Cash from Sales 0.97 1.05 1.00 0.99 1.00
Net Sales/Net Accounts Receivable 16.55 8.38 9.03 9.75 10.00
Net Sales/Inventory 5.40 4.34 5.29 5.39 5.12
Net Sales/Unearned Revenue n/a n/a n/a n/a n/a
Net Sales/Warranty liability n/a n/a n/a n/a n/a
Sara Lee
Net Sales/Cash from Sales 1.00 1.00 0.99 0.96 1.01
Net Sales/Net Accounts Receivable 8.35 8.60 6.77 9.42 9.39
Net Sales/Inventory 5.63 5.72 5.27 12.47 11.69
Net Sales/Unearned Revenue n/a n/a n/a n/a n/a
Net Sales/Warranty liability n/a n/a n/a n/a n/a
*Based on 10-K and Annual Reports of their respective companies

50
Expense Manipulation Diagnostics:
Analyzing the following expense ratios over several years allows the analyst to
view trends in the reporting of the firm, and identify potential accounting discrepancies
in the year to year reporting. Using each firm’s own financial statements, we derived
the following ratios and their respective graphs which show these reporting trends.
Because these companies are within one industry, their respective graphs should follow
a similar trend. Therefore, any significant volatility could signal a red flag in the firm’s
reporting, especially of their expenses with respect to these specific ratios.
Asset Turnover:
0
0.2
0.4
0.6
0.8
1
1.2
1.4
2003 2004 2005 2006 2007
Heinz
Campbells
Sara Lee
ConAgra
The asset turnover ratio shows the relationship between sales and assets. It is
essentially a figure that reveals the sales per asset for a firm. Significant volatility in
this graph, suggests inconsistencies between total sales and total assets, neither of
which should sharply change in a short period of time. For instance, a sharp increase in
the ratio would suggest that assets had been consistently overstated over time, and a
sharp adjustment was necessary. Consistently overstating assets would also mean
consistently overstated retained earnings through overstated net income. In essence,
this ratio should be consistent over time, with no volatile jumps or drops.
The above graph reveals that consistency is present in the industry. Heinz is
especially consistent compared to its competitors, suggesting accurate reporting of their

51
income and assets over time, and indicating that no future major adjustments will be
necessary, and therefore net income should remain fairly constant.
Cash Flow from Operations/Operating Income:
00.5
11.5
22.5
33.5
2003 2004 2005 2006 2007
HeinzCampbellsSara LeeConAgra
This ratio shows the relationship between cash flow from operating activities and
operating income. Essentially, this ratio tells how much cash is generated from one
dollar of operating income. A low ratio is preferred as it suggests that more cash is
generated from operating activities than from financing or investing activities, which is
important as it means they are profitable in accomplishing their core business, and
aren’t outweighed by their expenses. In the food industry, the ratio is fairly consistent
across the board, as each of the firms have been in the business for a while, and have
continuously improved their efficiency over time. This is especially true of Heinz, as it
appears to be the most consistent over the last five years, suggesting that it is well
practiced at managing its expenses and maintaining decent cash flow over time.
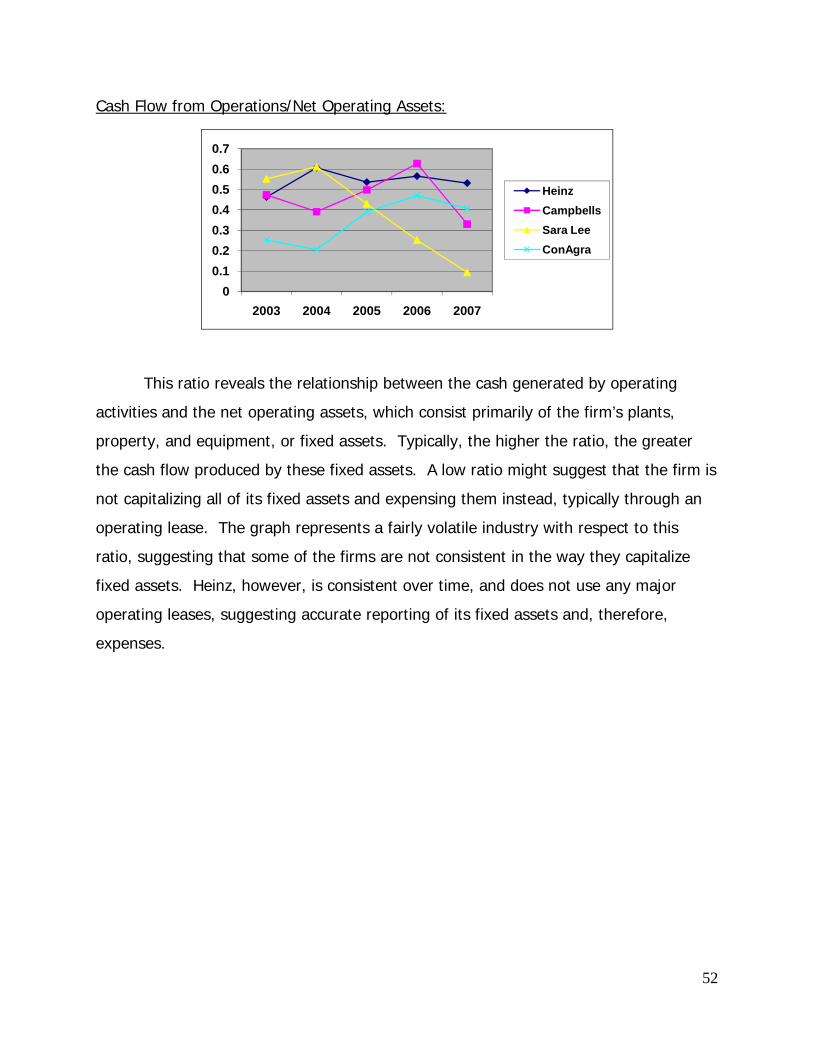
52
Cash Flow from Operations/Net Operating Assets:
00.10.20.30.40.50.60.7
2003 2004 2005 2006 2007
HeinzCampbellsSara LeeConAgra
This ratio reveals the relationship between the cash generated by operating
activities and the net operating assets, which consist primarily of the firm’s plants,
property, and equipment, or fixed assets. Typically, the higher the ratio, the greater
the cash flow produced by these fixed assets. A low ratio might suggest that the firm is
not capitalizing all of its fixed assets and expensing them instead, typically through an
operating lease. The graph represents a fairly volatile industry with respect to this
ratio, suggesting that some of the firms are not consistent in the way they capitalize
fixed assets. Heinz, however, is consistent over time, and does not use any major
operating leases, suggesting accurate reporting of its fixed assets and, therefore,
expenses.

53
Total Accruals/Change in Sales:
-8-6-4-202468
10
2003 2004 2005 2006 2007
HeinzCampbellsSara LeeConAgra
This ratio shows the relationship between the total accruals and the change in
sales from the previous year. Total accruals are the net income of the firm less the
cash flow from operations, and consist of liabilities and non-cash assets, like goodwill,
future tax liability and future interest expense. This ratio is essentially a measure of
how much of your increase in sales will be needed to cover future expenses. The
industry appears to be fairly volatile, suggesting that accruals for several of the firms in
the industry are not consistent over time. This is a red flag for these firms, suggesting
that much of their future sales will have to be spent on expenses they are accruing at
the present, which is not a good practice. Heinz, however, is consistent, yet again,
which is a good sign that they are controlling their expected future expenses, and most
their sales will not already be spent for them. This means that Heinz will be able to
allocate the revenue generated from their sales to increase efficiency, rather than to
pay off accrued debt occurred in the past.

54
Pension Expense/Selling, General, and Administrative Expenses:
00.050.1
0.150.2
0.250.3
0.350.4
2003 2004 2005 2006 2007
HeinzCampbellsSara LeeConAgra
This ratio shows the relationship between the amounts spent on pension with
respect to the administrative expenses. It is essentially a measure of the percentage of
their total selling, general, and administrative expenses that is pension expense.
Obviously a lower ratio would suggest lower spending on pensions, or employees who
no longer work for the company, which is preferable. The food industry, being both old
and large, has considerable pension expenses. The graph indicates, however, that the
amount being spent on pensions is fairly low with respect to the total administrative
costs. This means that future earnings for the firms will not be weighed down by high
pension expenses. Heinz has decreased over time, signaling that less income is being
spent on pensions, opening it up for investment in efficiency.
Conclusion:
In the industry as a whole, there are several discrepancies in the ratios that
deserve attention and concern. However, Heinz demonstrated consistency in each of
the ratios and graphs, which can be relieving for an analyst. Though there may be
some minor discrepancies in their accounting and reporting, there is nothing that
generates an immediate red flag, suggesting inaccurate reporting of expenses or net
income. With the ratios and their respective graphs as guides, Heinz appears to use
generally fair and honest reporting standards, and does not generate much concern.

55
Certainly, some skepticism should be exercised, but Heinz’s consistency throughout the
past five years indicates to us that their numbers are not lying.
The following table shows the amounts for the ratios used in the above graphs
for each firm.

56
Expense Manipulation Diagnostics
Heinz 2003 2004 2005 2006 2007
Asset Turnover 0.89 0.85 0.84 0.89 0.90
CFFO/OI 0.77 0.91 0.86 0.97 0.73
CFFO/NOA 0.46 0.61 0.54 0.57 0.53
Total Accruals/Change in sales -0.55 -2.51 -0.82 1.60 -0.77
Pension Expense/SG&A 0.13 0.12 0.04 0.04 0.02
Campbell’s
Asset Turnover 1.08 1.07 1.04 0.95 1.22
CFFO/OI 0.72 0.61 0.81 0.97 0.49
CFFO/NOA 0.47 0.39 0.50 0.63 0.33
Total Accruals/Change in sales -0.51 -0.23 7.65 -1.69 0.34
Pension Expense/SG&A 0.02 0.03 0.03 0.03 0.02
Sara Lee
Asset Turnover 0.64 0.75 0.78 0.78 1.01
CFFO/OI 2.31 1.95 1.43 3.00 0.88
CFFO/NOA 0.55 0.61 0.43 0.25 0.09
Total Accruals/Change in sales -1.31 -0.70 -6.92 -6.23 0.01
Pension Expense/SG&A 0.03 0.05 0.05 0.05 0.04
ConAgra
Asset Turnover 1.10 0.99 0.89 0.96 1.02
CFFO/OI 0.45 0.42 1.00 1.20 0.77
CFFO/NOA 0.25 0.20 0.39 0.47 0.41
Total Accruals/Change in sales -0.02 -0.09 -0.97 -5.44 -0.33
Pension Expense/SG&A 0.31 0.32 0.36 0.36 0.28
*Based on 10-K and Annual Reports of their respective companies

57
Potential Red Flags:
When firms create their financial statements, mistakes or purposeful errors can
be made. This is the job of the analyst to find and correct these “errors.” They look at
all the numbers in the statements, especially the previous data stated above. This
gives in depth insight into the company and can also help to see how well the company
is doing. Analysts should also look for numbers that do not make since or
unexplainable. This is a very good indicator, or flag, that the numbers need to be
corrected.
When examining Heinz, we have looked at six years of moving data of 10-Ks to
understand and compute possible errors that might be in the financial statements.
Heinz has shown a conservative and aggressive mix in accounting policies. They
comply with all of GAAP. The only issue that we found on the six years of financial
statements is the inconsistency of numbers between each year’s statements. After
discovering these errors, the first thing that we looked at was the financial notes to see
if there was an explanation to this inconsistency. In our understanding, this could
happen for several reasons. The first could be that the company changed their
numbers from previous years to better project actuality in those years or if the
company changed the type of accounting style of preparation of the statements. This is
the less likely of the two due to rules from GAAP, which would force them to state the
change in accounting methods, which indeed they did not. Leaving the conclusion that
Heinz changed some of the numbers from previous statements because of adjustments.
On the following page is an example from Heinz 10-K in 2007.

58
H. J. Heinz Company and Subsidiaries
Consolidated Statements of Income
Fiscal Year Ended May 2, 2007 May 3, 2006 April 27, 2005 (52 Weeks) (53 Weeks) (52 Weeks) (In thousands, except per share amounts)
Sales $ 9,001,63 $ 8,643,43 $ 8,103,45Cost of products sold 5,608,73 5,550,36 5,069,92Gross profit 3,392,90 3,093,07 3,033,53Selling, general and administrative expenses 1,946,18 1,979,46 1,752,05Operating income 1,446,71 1,113,61 1,281,47Interest income 41,869 33,190 26,939Interest expense 333,270 316,296 232,088Asset impairment charges for cost and equity
investments — 110,994 73,842 Other expense, net 30,915 26,051 14,966Income from continuing operations before
income taxes 1,124,39
9 693,461 987,515 Provision for income taxes 332,797 250,700 299,511Income from continuing operations 791,602 442,761 688,004(Loss)/income from discontinued operations,
net of tax (5,856) 202,842 64,695 Net income $ 785,746 $ 645,603 $ 752,699
On the next page is the 10-K from 2005. Consider the numbers that are
highlighted, related to the 10-K above, and notice that they are not the same.

59
H. J. HEINZ COMPANY AND SUBSIDIARIES CONSOLIDATED STATEMENTS OF INCOME Fiscal Year Ended -------------------------------------------- April 27, 2005 April 28, 2004 April 30, 2003 (52 Weeks) (52 Weeks) (52 Weeks) -------------- -------------- -------------- (In thousands, except per share amounts) Sales............................................ $8,912,297 $8,414,538 $8,236,836 Cost of products sold............................ 5,705,926 5,326,281 5,304,362 ---------- ---------- ---------- Gross profit..................................... 3,206,371 3,088,257 2,932,474 Selling, general and administrative expenses..... 1,851,529 1,709,000 1,758,658 ---------- ---------- ---------- Operating income................................. 1,354,842 1,379,257 1,173,816 Interest income.................................. 27,776 23,312 31,083 Interest expense................................. 232,431 211,826 223,532 Asset impairment charges for cost and equity investments..................................... 73,842 -- -- Other expense, net............................... 17,731 22,192 112,636 ---------- ---------- ---------- Income from continuing operations before income taxes and cumulative effect of change in accounting principle............................ 1,058,614 1,168,551 868,731 Provision for income taxes....................... 322,792 389,618 313,372 ---------- ---------- ---------- Income from continuing operations before cumulative effect of change in accounting principle........ 735,822 778,933 555,359 Income from discontinued operations, net of tax... 16,877 25,340 88,738 ---------- ---------- ---------- Income before cumulative effect of change in accounting principle............................ 752,699 804,273 644,097 Cumulative effect of change in accounting principle...................................... -- -- (77,812) ---------- ---------- ---------- Net income....................................... $ 752,699 $ 804,273 $ 566,285
After our considerations, Heinz 10-K from 2007 states that “The preparation of
financial statements, in conformity with accounting principles generally accepted in the
United States of America, requires management to make estimates and assumptions
that affect the reported amounts of assets and liabilities, the disclosure of contingent
assets and liabilities at the date of the financial statements, and the reported amounts
of revenues and expenses during the reporting period. Actual results could differ from
these estimates.” By making these estimates, they find out at a later date that those
estimates were wrong, they go back through the numbers and correct the previous
year’s statements. This is why there was a difference in numbers for the year 2005
above. This shows that Heinz obeys and complies with all of SEC and GAAP rules.

60
Undo Accounting Distortions:
If we were to find any mistakes in Heinz’s financial statements, here is where we
would correct them. It would be impossible to correct all of the mistakes even with all
the provided information by the firm. Analysts would focus on corrections that would
have a major impact on the company and the understandings of investors. If the effect
is minimal in terms of overall or long term picture, analysts would not mind the
correction.
Since Heinz has not shown any misstated material, we are unable to correct or
“undo” any of the financial statements. Heinz’s financial statements have proven to be
clear and transparent of it disclosures. This is represented mainly by the notes given
about any numbers or change in numbers. The only thing Heinz would have to adjust
for is goodwill because it is a distortion to total assets. Goodwill is the excess purchase
price of another business over its true market value. This is an intangible asset that
Heinz reassesses the value of annually. The company should amortize goodwill over
five years. This allows for the assets to decrease creating lower liabilities. Goodwill for
Heinz amounts to $2.8 billion out of the company’s total assets of $10 billion. This
means that roughly 28% of the company’s assets are merely intangible assets. This is
a high number that definitely distorts the true financial standpoint of Heinz. Heinz has
also proven to be a moderately conservative and aggressive on their accounting
policies, showing where they lead to lower reported earnings and sometimes to higher
reported earnings.

61
Financial Analysis, Financial Forecasts, and
Cost of Capital Estimation
Financial Analysis:
Evaluating a company’s financial statements is a critical step in valuing a firm,
and has been made possible through ratio analysis. Ratio analysis allows for a
complete view of the profitability of a firm while comparing it to the competitors in their
industry. This analysis is a way to compare of all the financial statements of a company
including their balance sheets, income statements, and statement of cash flows.
Liquidity Ratios, Profitability Ratios, and Capital Structure Ratios are the three
classifications of ratios that determine the overall value of the company. These ratios
can be used to forecast a company’s future performance based on their own historical
performance and that of their competitors. This portion of the report will show how
Heinz performs relative to the competition.
Liquidity Analysis:
Liquidity ratios are a class of financial metrics that are used to determine a
company's ability to pay off its short-terms debts obligations (www.answers.com). The
credit risk of a company is often determined by the liquidity ratios associated with the
company. Higher liquidity ratios are preferred because it shows the lender or investors
that the company has the means to pay off their short-term debt if necessary. The
liquidity ratios most commonly used include the following: current ratio, quick ratio,
inventory turnover, receivables turnover, and working capital turnover. The inventory,
receivables, and working capital turnover ratios also show how fast capital gets into the
company and how fast it goes out.

62
Current Ratio:
This ratio shows the difference between a company’s current assets (cash, cash
equivalents, short-term investments, receivables, and inventory, and their current
liabilities (short-term payables and debt)). A ratio of 1:1 would mean that for every $1
of current assets the company had $1 of current liabilities. This would mean that the
company would be able to pay off all of their current liabilities immediately if that ever
became necessary. In order for companies to make their current ratios better they
would need to increase their current assets or decrease current liabilities. A higher ratio
is wanted by companies because it shows that they are a more liquid company which is
attractive to investors. Banks usually look for a 2:1 ratio just for this reason. The
lenders are making sure that the company will have the loan covered by assets or
capital.
Heinz had a ratio that was strong in 2003, but has decreased through the years
as it approached 2007 closing the gap between themselves and Sara Lee. They ended
up a little about .6, which still is fairly high compared to its competitors and the
industry. Campbells has the lowest ratio of around .3. Overall, the companies in this
industry are all relatively close and can most likely pay off their debt. The choice of

63
more debt to finance the current debt might be a decision, or sell off assets. Heinz
continues to stay in close proximity of their competitors and in line with the industry.
Quick Asset Ratio:
The quick ratio, also known as the acid-test, relates the current assets (cash,
cash equivalents, short-term investments, and receivables) to the current liabilities.
Inventory is not included in this calculation because it is hard to easily convert to cash.
This ratio is usually more conservative than the current ratio, and shows the true shape
of the firm if they needed to pay off short-term liabilities within fairly quickly terms.
Heinz has been increasing their quick ratio over the years which will make it
more difficult to pay off short-term debt if they needed to. This declining number of
the competitors in the industry may be alarming to potential investors, but Heinz is
within proximity of their competitors and could easily raise this number by increasing
quick assets. This is a common problem among the processed foods industry due to
the fact that they have large inventories.

64
Receivables Turnover:
The receivables turnover ratio is the net sales divided by the accounts
receivables at a specific year. This ratio tends to be higher if a company efficiently
collects their accounts receivables, or collects most of their sales on a cash basis. The
receivables turnover ratio assesses how proficiently the assets are being used by the
company. A higher ratio means that the company is not collecting their accounts
receivables in a timely manner. This would not be ideal, because the longer a company
does not collect receivables, the higher the risk of uncollectable leading to lower end
profits. A lower ratio would tell investors that the company is effectively collecting from
their customers and closing receivable accounts.
Heinz historically has an accounts receivables turnover ratio average of 7.8. This
number has steadily increased over the five year period. This shows that Heinz has
been collecting their receivables faster than previous years. This is very beneficial to
Heinz because it could appeal to potential investors or potential stock holders.

65
Days Sales Outstanding:
Days sales outstanding is a means of measuring how long it takes for a company
to collect the money for the credit they extended. This ratio is the number of days in a
year (365) over the receivables turnover from above. This ratio is also used in
calculating the cash-to-cash cycle for the company. The typical range for days
outstanding is 30 days to 90 days. Historically, the processed foods industry is much
lower because of their large inventories and the quick turnover rate. These companies
need to keep the shelves stocked in their retailer which requires a faster turn-around
rate in all areas. Historically, Heinz has had a day’s outstanding ratio higher than that
of their competitors. This could be higher due to numerous reasons; one being that
Heinz is a bigger company than their competitors and will most likely have a higher
accounts receivable number. Another reason could be that Heinz is a multi-national
company and has a larger scale of operations than its competitors. But Heinz has
started to decrease back down to the industry average which is better for Heinz. This
normal return shows that Heinz can put the revenue back into the production merry-go-
round.

66
Inventory Turnover:
Inventory turnover is the difference between companies’ cost of goods sold and
their inventory. This ratio measures how often a company sells and produces its
inventory during a year. A high inventory turnover ratio means that the products are
being sold quickly. A company wants a higher number for inventory turnover because
this means that the products are selling and being replaced faster.
The average for Heinz over the past five years has been 4.52:1. This number
means that the company replaces its inventory about 4 ½ times per year. If Heinz
wanted to be more productive they could find ways to increase this number which
would make them more competitive. Selling products at a faster rate would increase
this number, and make Heinz comparable to Sara Lee and Campbells. Conagra is the
only company that is consistently lower than the other companies in the industry.
Overall, Heinz is keeping up with the industry average but could increase their turnover
to help lower costs and increase profits.

67
Days Supply of Inventory:
The days supply of inventory ratio is calculated by taking 365 days in a year and
dividing it by the previously mentioned inventory turnover ratio. A smaller ratio is
sought after because this means that the inventory is not sitting in a warehouse or
store a long time before it is sold. The standard ratio for this industry is between 90
and 120 days. Heinz has a days supply of inventory average of 81.52 days for the past
five years. Heinz is consistently in the middle of the ratios of their competitors, but has
been decreasing slightly in recent years. As seen in the graph this ratio for the food
processing industry is very volatile.
This ratio is also used to calculate the cash-to-cash cycle mentioned earlier.
Taking the days supply of inventory ratio and adding it to the days sales outstanding
yields this cycle. The cash-to-cash cycle is a metric that expresses the length of time,
in days, a company takes in order to convert resource inputs into actual cash flows
(investopedia.com). This number signifies how quickly a company can convert its
inventory into cash through sales.

68
Working Capital Turnover:
Working capital turnover is measured by taking the net sales divided by working
capital. A company’s working capital is the current assets minus the current liabilities.
Companies want a higher working capital turnover because it shows that the company
has larger revenues than the money being used to create the sales. Heinz has been
increasing their working capital turnover meaning that they are making more money
through sales than they are spending on the products sold. The industry average for
the past five years is 10.80. Although Heinz has not always had the highest working
capital turnover, they have recently started increasing their turnover, making them the
stable against their competitors. Currently, in 2007, Heinz is tied with Campbells for
leading the food industry in the working capital turnover.

69
Cash-to-Cash Cycle:
The cash-to-cash cycle measures how many days it takes for a company to
convert their products into a cash flow. Investopedia.com says “that this cycle attempts
to measure the amount of time each net input dollar is tied up in the production and
sales process before it is converted into cash through sale to customers.” This cycle is
calculated by adding the account receivables turnover in days and the inventory
turnover in days. A shorter cycle shows that the company can turn over products faster
and get cash to reinvest in more products quicker. Heinz is around the industry
average for number of days in the cash conversion cycle. If Heinz wants to have more
money to put back into new products they will need to decrease their cash cycle.
Conclusion:
Overall, the liquidity ratios of Heinz show that they are a liquid firm. They have
the highest current ratio amongst their competitors and a quick asset ratio comparable
with their competitors. Heinz continues to remain in step with their competitors in the
other ratios including inventory turnover, receivables turnover, working capital turnover,
and the cash-to-cash cycle.

70
Profitability Analysis:
Profitability analysis uses gross profit margin, operating expense ratio, net profit
margin, return on assets, return on equity, and asset turnover to evaluate a firm’s
efficiency in generating profits. These measure the firm’s operating efficiency and
productivity of the firm.
Gross profit margin:
“A financial metric used to assess a firm's financial health by revealing
the proportion of money left over from revenues after accounting for the cost of goods
sold. Gross profit margin serves as the source for paying additional expenses and future
saving (www.investopedia.com).” Gross profit margin is computed by taking the
company’s gross profit (sales- COGS) and dividing it by sales. Companies prefer a
higher gross profit margin, because it means that the company will have more money
left in retained earnings. Over the past five years Heinz has averaged a gross profit
margin of 36.89%. This number appears to be consistent with the industry average
over the same time period. The one exception to this is Conagra, which has an
unusually low ratio.

71
Operating profit margin:
Operating profit margin is the ratio between operating income and net sales.
Operating margin gives analysts an idea of how much a company makes (before
interest and taxes) on each dollar of sales (www.investopedia.com). This relationship is
important because it allows investors to see if expenses are decreasing and net sales
are increasing. Ideally, firms would prefer to have a higher operating margin. Heinz’s
profit margin has been around 15.04% along with Campbells. The other extreme is
Sara Lee and Conagra’s low margin. This splits the industry in two. And Sara Lee’s
lower than normal average due to a negative operating income in 2007 gives a possible
future hazard. Heinz has remained at the upper end of the industry average in recent
years but could improve their operating profit margin ratio to be more competitively
aligned.

72
Net profit margin:
Net profit margin is derived by placing net income over sales. This assesses the
amount of each dollar of sales preserved in earnings. When this number is compared
with the industry average, it can give an analyst keen insight into the profitability of the
firm. Heinz’s profit margin of 8.58 has been relatively high compared to industry
standards. But again we see an industry split occurring between Heinz and Campbells
and Sara Lee and Conagra.
Asset turnover ratio:

73
The asset turnover ratio shows the relationship between assets and revenue. It
is the ratio of revenue to total assets. As evidenced by the graph above, Heinz’s five
year asset turnover ratio of .84 is clearly lower than the industry average, but has
increased in the last three years. “Companies with high profit margins usually have low
asset turnover thus indicating pricing strategy (www.investopedia.com).” This is
consistent when Heinz’s cost competitive strategy is taken into account.
ROA:
Return on assets is the ratio of net income to total assets of the previous year.
This percentage ratio gives an idea of how profitable a company is in comparison to its’
assets. Heinz’s five year average ROA is 7.17%. It is at the upper end of the industry
along with Campbells. This shows that Heinz management has done a fair job of
utilizing its assets to generate earnings.
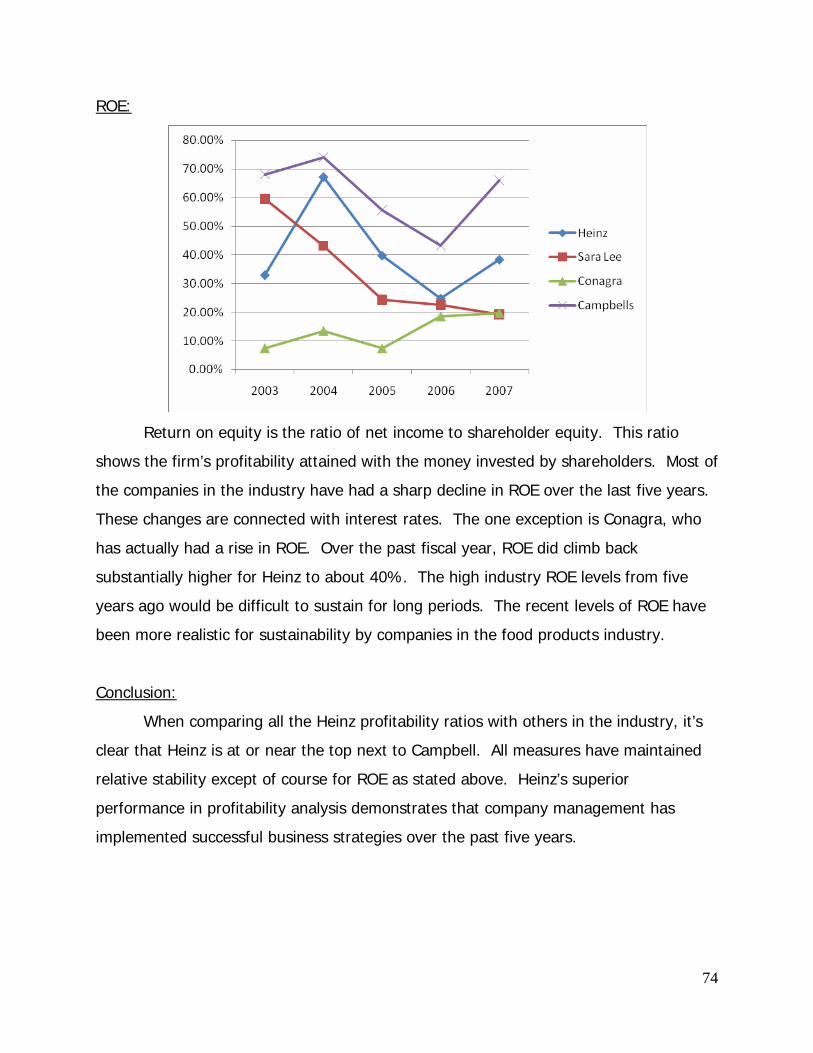
74
ROE:
Return on equity is the ratio of net income to shareholder equity. This ratio
shows the firm’s profitability attained with the money invested by shareholders. Most of
the companies in the industry have had a sharp decline in ROE over the last five years.
These changes are connected with interest rates. The one exception is Conagra, who
has actually had a rise in ROE. Over the past fiscal year, ROE did climb back
substantially higher for Heinz to about 40%. The high industry ROE levels from five
years ago would be difficult to sustain for long periods. The recent levels of ROE have
been more realistic for sustainability by companies in the food products industry.
Conclusion:
When comparing all the Heinz profitability ratios with others in the industry, it’s
clear that Heinz is at or near the top next to Campbell. All measures have maintained
relative stability except of course for ROE as stated above. Heinz’s superior
performance in profitability analysis demonstrates that company management has
implemented successful business strategies over the past five years.

75
Capital Structure Analysis:
Capital structure analysis focuses on a company’s ability to cover debt with
shareholder’s equity. Debt to equity, times interest earned, and debt service margin all
provide insight into how well a company is accomplishing this task. Heinz is compared
to its industry competitors below.
Debt to Equity:
The debt to equity ratio is total liabilities to shareholder equity. “This ratio
indicates what proportion of equity and debt the company is using to finance its assets.
A high ratio means that a company has been aggressive in financing its growth with
debt (www.investopedia.com).” Heinz is near the top of the industry average in this
respect, especially in 2007 when they had the highest ratio for the industry. The chart
indicates Heinz has had a high debt to equity ratio over the past 5 years when
compared to the industry average.

76
Times Interest Earned:
Times interest earned is used to measure a firm’s ability to meet its debt
obligations. “It’s calculated by taking earnings before interest and taxes and dividing it
by the total interest payable on bonds and other contractual debt
(www.investopedia.com).” This shows how many times a company can cover its
interest charges before taxes. Heinz’s average of 4.93 over the past five years is
around the middle of the pack for its industry. This number has been down from
around 6 over the past couple of years. A low number would indicate the company may
be at risk of bankruptcy because they may not be able to cover their interest charges to
debtors. On the flip side, too high of a ratio would indicate a lack of debt. “The rationale
is the company would yield greater returns by investing earnings into other projects and
borrowing at a lower cost of capital than what it is currently paying for its debt to meet
debt obligations (www.investopedia.com)” This ratio indicates that Heinz has plenty of
earnings to support its interest payments to debt holders. At the same time the number
is not at a level that would indicate an unwanted lack of debt.

77
Debt Service Margin:
Debt service margin shows how well a firm pays debt service with cash flows
from operations. The higher the margin, the better it is for the company. Heinz has a
debt service margin a bit above the industry average of about 1. Heinz is much lower
than Conagra and only marginally greater than Sara Lee in this respect. This says that
Heinz can cover its current notes payable and have cash left over at year’s end. But
they can always increase to be the leader of the industry.
Conclusion:
After taking into consideration Heinz capital structure ratios with the averages of
the industry, it’s clear that Heinz is better than average in most cases. This indicates
Heinz’s favorable ability to pay debt to its creditors and would not raise any red flags in
analysis. In any case, Heinz can always improve.

78
IGR/SGR Analysis:
Growth rate analysis is valuable to a company by showing the amount of profits
they can expect in the future if continued at current rates. Obtaining these rates give
an idea of the possible profits and financial influence the firm has. Using the previously
stated return on assets, the debt-to-equity ratio, and the dividend payout ratios this
analysis can be computed.
Internal Growth Rate:
“Internal Growth Rate (IGR) is the highest level of growth achievable for a
business without obtaining outside financing (www.investopedia.com).” This involves
finding ways to increase the total assets without having to use external financing.
Being able to finance future projects without having debt in the capital structure is
valuable for any company. The internal growth rate is found by multiplying the return
on assets by one minus the dividend payment. A higher IGR is wanted by companies
and also shows that they are able to grow the company while maintaining low debt
levels.
Year 2003 2004 2005 2006 2007
Heinz IGR 1.425%
1.673% 1.581% 1.288% 1.552%

79
Heinz has an IGR much lower than the average of the competitors of their
industry. This number shows that Heinz finances mostly through external financing and
not their own assets. Averages of the competitors could also be higher than Heinz
because both Sara Lee and Conagra have not paid dividends within the past five years.
This number could also be lower because our net income forecasting is too progressive
compared to our dividend growth rate. This would cause a smaller ROA and therefore
a smaller IGR. Overall, Heinz would need to increase their IGR by using more internal
financing to keep in line with their competitors.
Sustainable Growth Rate:
Sustainable Growth Rate (SGR) allows the company to evaluate the maximum
growth rate possible without adding debt to their existing capital structure. SGR is
determined by using the IGR and adding the debt-to equity ratio to it. This rate should
remain at the same growth rate as the IGR since it is used in the calculation. “The SGR
is a measure of how much a firm can grow without borrowing more money. After the
firm has passed this rate, it must borrow funds from another source to facilitate growth
(www.investopedia.com).” If the maximum SGR is surpassed then the company will

80
have to use leverage to keep their current growth level. Therefore, the higher the IGR
is the higher the SGR will be.
Year 2003 2004 2005 2006 2007
Heinz SGR 6.697% 4.257% 3.098% 3.777% 4.481%
Heinz has a SGR that is competitive with the industry, and in recent years Heinz
has increased their growth rate to above the average. Although the SGR has been
decreasing, this is not a big concern for the company because of the mergers and
buyouts that they often have. Heinz is constantly growing their company and this
would cause for a lower SGR.
Conclusion:
Heinz has an IGR below the industry average but an SGR that is better than
average. These rates determine the amount of debt a company will need to finance
future projects. External financing could affect the level of profitability the firm is able
to make. If a firm has to increase their debt it will ultimately decrease the profits due
to the increase in liabilities. Heinz has a low IGR which means that projects are
financed more through external sources versus internal sources. To help increase
future profits the IGR needs to increase by reducing the financing through debt. The

81
SGR rate is in-line with the industry and Heinz needs to keep up the ratio growing. An
increasing SGR would relay to investors that Heinz is a forward looking company and
wants to improve the numbers now for the future. Also, the sales growth average we
used to forecast the growth was based off of the SGR because it has been increasing in
the last few years and is sustainable over time.
Financial Statement Forecasting:
When analyzing a firm, it helps to get a general idea of where that firm may be
going in the future. Using historical information as starting point, one can predict a
company’s future performance. We assumed a general stability in performance for
Heinz, as demand for its products is relatively stable, and it is practiced in its operations
due to its age. Under this assumption, and using its historical performance derived
from its previous five years of financial statements, we were able to come up with
forecasts for Heinz’s income statement, balance sheet, and statement of cash flows for
the next ten years.
Income Statement Analysis:
Our income statement forecasting method consisted of analyzing the historical
average growth rates for Heinz, and comparing those numbers to the averages for the
food industry. First, we derived the common size income statement by setting all of the
numbers as a percent of net sales. This revealed some noticeable trends in Heinz’s
numbers. We then set about finding the averages for all of the percentages over the
past five years, and calculating the growth rate between each year. We determined
that the growth rate for net sales for Heinz will be approximately 5.4% per year for the
next 10 years. Since this average growth rate is just above the SGR and well below the
IGR, we felt that this average would be fairly accurate, especially since the SGR has
steadily increased over the past 3 years.
We excluded some of the percentages from our forecasts, as they appeared to
be one or two time occurrences, or they showed no trend. We compared the averages

82
we found for Heinz to the averages of the industry, and assumed a value between the
two, but closer to the Heinz value. We did this for two reasons: first, because the
values were so close together, and second, since over time we assume they will head
towards the industry average. For example, we assumed that the net income for each
of the forecasted years was about 8% of the net sales that we forecasted out based on
the 5.4% sales growth rate per year for the next 10 years.

81
2003 2004 2005 2006 2007 Ind. Avg. Avg Assume 2008 2009 2010 2011 2012 2013 2014 2015 2016 2017
Net Sales $8,236,836 $7,625,831 $8,103,456 $8,643,438 $9,001,630 $9,488,064 $10,000,785 $10,541,212 $11,110,843 $11,711,256 $12,344,114 $13,011,171 $13,714,274 $14,455,373 $15,236,519
Cost of Goods Sold $5,304,362 $4,733,314 $5,069,926 $5,550,364 $5,608,730 65.5% 63.11% 64.00% $6,072,361 $6,400,502 $6,746,376 $7,110,939 $7,495,204 $7,900,233 $8,327,149 $8,777,136 $9,251,439 $9,751,372
Gross Profit $2,932,474 $2,892,517 $3,033,530 $3,093,074 $3,392,900 34.16% 36.89% 36.00% $3,415,703 $3,600,282 $3,794,836 $3,999,903 $4,216,052 $4,443,881 $4,684,021 $4,937,139 $5,203,934 $5,485,147
Selling, Administrative and General Expense $1,758,658 $1,616,428 $1,752,058 $1,979,462 $1,946,185 23.5% 21.74% 22.00% $2,087,374 $2,200,173 $2,319,067 $2,444,385 $2,576,476 $2,715,705 $2,862,458 $3,017,140 $3,180,182 $3,352,034
Operating Income $1,173,816 $1,276,089 $1,281,472 $1,113,612 $1,446,715 10.2% 15.15% 13.00% $1,233,448 $1,300,102 $1,370,358 $1,444,410 $1,522,463 $1,604,735 $1,691,452 $1,782,856 $1,879,198 $1,980,747
Interest income $31,083 $24,547 $26,939 $33,190 $41,869 -0.3% 0.38% 0.00%
Interest Expense (Note 14) $223,532 $211,382 $232,088 $316,296 $333,270 2.2% 3.14% 3.00% $284,642 $300,024 $316,236 $333,325 $351,338 $370,323 $390,335 $411,428 $433,661 $457,096
Asset Impairment Charges for Cost & Equity Investments $0 $0 $73,842 $110,994 $0 0.44% 0.00%
Other Expense, net $112,636 $21,686 $30,915 $26,051 $14,966 0.50% 0.00% Income from Continuing Operations before Taxes $868,731 $1,067,568 $987,515 $693,461 $1,124,399 9.0% 11.45% 10.00%
Provision for Income Taxes $313,372 $352,117 $299,511 $250,700 $332,797 2.7% 3.74% 3.25%
Income from Continuing Operations $555,359 $715,451 $688,004 $442,761 $791,602 6.3% 7.71% 6.75%
(Loss)/Income from Discontinued Operations $88,738 $88,822 $64,695 $202,842 ($5,856) 0.4% 1.06% 1.00%
Income before Change in Accounting Principles $644,097 $804,273 $752,699 $645,603 $785,746 8.77% 8.00% Cumulative Effect of Change in Accounting Principle ($77,812) $0 $0 $0 $0 0.00% 0.00%
Net Income (Loss) $566,285 $804,273 $752,699 $645,603 $785,746 7.0% 8.77% 8.00% $759,045 $800,063 $843,297 $888,867 $936,900 $987,529 $1,040,894 $1,097,142 $1,156,430 $1,218,922
Common Size Income Statement 2003 2004 2005 2006 2007 Ind. Avg. Avg Assume 2008 2009 2010 2011 2012 2013 2014 2015 2016 2017
Sales Growth Percent -7.42% 6.26% 6.66% 4.14% 5.40% 5.40% 5.40% 5.40% 5.40% 5.40% 5.40% 5.40% 5.40% 5.40% 5.40% 5.40%
Net Sales 100.00% 100.00% 100.00% 100.00% 100.00%
Cost of Goods Sold 64.40% 62.07% 62.56% 64.21% 62.31% 65.5% 63.11% 64.00% 64.00% 64.00% 64.00% 64.00% 64.00% 64.00% 64.00% 64.00% 64.00% 64.00%
Gross Profit 35.60% 37.93% 37.44% 35.79% 37.69% 34.16% 36.89% 36.00% 36.00% 36.00% 36.00% 36.00% 36.00% 36.00% 36.00% 36.00% 36.00% 36.00%
Selling, Administrative and General Expense 21.35% 21.20% 21.62% 22.90% 21.62% 23.5% 21.74% 22.00% 22.00% 22.00% 22.00% 22.00% 22.00% 22.00% 22.00% 22.00% 22.00% 22.00%
Operating Income 14.25% 16.73% 15.81% 12.88% 16.07% 10.2% 15.15% 13.00% 13.00% 13.00% 13.00% 13.00% 13.00% 13.00% 13.00% 13.00% 13.00% 13.00%
Interest Income 0.38% 0.32% 0.33% 0.38% 0.47% -0.3% 0.38% 0.00% 0.00% 0.00% 0.00% 0.00% 0.00% 0.00% 0.00% 0.00% 0.00% 0.00%
Interest Expense 2.71% 2.77% 2.86% 3.66% 3.70% 2.2% 3.14% 3.00% 3.00% 3.00% 3.00% 3.00% 3.00% 3.00% 3.00% 3.00% 3.00% 3.00%
Asset Impairment Charges for Cost & Equity Investments 0.00% 0.00% 0.91% 1.28% 0.00% 0.44% 0.00% 0.00% 0.00% 0.00% 0.00% 0.00% 0.00% 0.00% 0.00% 0.00% 0.00%
Other Expense, net 1.37% 0.28% 0.38% 0.30% 0.17% 0.50% 0.00% 0.00% 0.00% 0.00% 0.00% 0.00% 0.00% 0.00% 0.00% 0.00% 0.00%
Income from Continuing Operations before Taxes 10.55% 14.00% 12.19% 8.02% 12.49% 9.0% 11.45%
Provision for Income Taxes 3.80% 4.62% 3.70% 2.90% 3.70% 2.7% 3.74%
Income from Continuing Operations 6.74% 9.38% 8.49% 5.12% 8.79% 6.3% 7.71%
(Loss)/Income from Discontinued Operations 1.08% 1.16% 0.80% 2.35% -0.07% 0.4% 1.06%
Income before Change in Accounting Principles 7.82% 10.55% 9.29% 7.47% 8.73% 8.77%
Cumulative Effect of Change in Accounting Principle -0.94% 0.00% 0.00% 0.00% 0.00% -0.19% 0.00% 0.00% 0.00% 0.00% 0.00% 0.00% 0.00% 0.00% 0.00% 0.00% 0.00%
Net Income (Loss) 6.88% 10.55% 9.29% 7.47% 8.73% 7.0% 8.58% 8.00% 8.00% 8.00% 8.00% 8.00% 8.00% 8.00% 8.00% 8.00% 8.00% 8.00%

82
Balance sheet analysis:
We analyzed the balance sheet in much the same way as the income statement.
We derived a common size balance sheet for Heinz, calculated averages for the last five
years, and compared the numbers to those of the food industry. We then assumed a
value between the two, but closer to Heinz. Again, this was because the two numbers
were so similar and because we wanted to adjust for Heinz eventually meeting the
industry average.
To forecast our total assets out 10 years, we divided the net sales we found from
the income statement forecasts by our average asset turnover of 0.84, since the asset
turnover was very consistent for Heinz. Once we had calculated total assets, we were
able to compute current and non-current total assets by multiplying the total assets we
found by the averages we computed in our initial analysis, as we found about 33% of
assets were current and 67% were noncurrent. We also forecasted our receivables,
cash and cash equivalents, total inventories, and net property, plant and equipment
based on their percentages of total assets, as these values appeared to be the most
consistent over the previous five years.
Once we had found the total assets, we set our total liabilities and stockholder’s
equity equal to the total assets. Since Heinz appears to be consistent over time with its
dividend payout and growth, we forecasted dividends by steadily increasing the
dividends, and multiplying the DPS by the shares outstanding currently. With the
dividends forecasted out, in order to find retained earnings we added last year’s
retained earnings, subtracted the dividends from the current year, and added the
current year’s net income in order to get the current year’s retained earnings. Then, for
total stockholder’s equity, we took the retained earnings we just forecasted, subtracted
the last year’s retained earnings and added that to the total equity of last year and that
gave us the total equity for the current year.
After stockholders equity was found, we subtracted the total equity from the
total liabilities and equity, which gave us the total liabilities. Then we assumed that
35% of total liabilities were current and 65% were noncurrent. Then we forecasted out
accounts payable as well as long term debt by approximately how much the averages

83
of the last 5 years on the common sized balance sheet were compared to total
liabilities.

84
2003 2004 2005 2006 2007 2008 2009 2010 2011 2012 2013 2014 2015 2016 2017
2001/12/31 2002/12/31 2003/12/31 2004/12/31 2005/12/31 Assets Current Assets: Cash and cash equivalents $801,732 $1,140,039 $1,083,749 $445,427 $652,896 $960,102 $1,011,984 $1,066,670 $1,124,311 $1,185,068 $1,249,107 $1,316,607 $1,387,754 $1,462,746 $1,541,791 Short-term investments $0 $40,000 $0 $0 $0 Receivables $1,165,460 $1,093,155 $1,092,394 $1,002,125 $996,852 $1,186,008 $1,250,098 $1,317,651 $1,388,855 $1,463,907 $1,543,014 $1,626,396 $1,714,284 $1,806,922 $1,904,565 Inventories: Finished goods and WIP $902,186 $897,778 $974,974 $817,037 $943,449 Packing material and ingredients $250,767 $259,154 $281,802 $256,645 $254,508 Total Inventories $1,152,953 $1,156,932 $1,256,776 $1,073,682 $1,197,957 $1,581,344 $1,666,797 $1,756,869 $1,851,807 $1,951,876 $2,057,352 $2,168,528 $2,285,712 $2,409,229 $2,539,420 Prepaid expenses $147,656 $165,177 $174,818 $139,714 $132,561 Other current assets $16,519 $15,493 $37,839 $42,987 $38,736 Total Current Assets $3,284,320 $3,610,796 $3,645,576 $2,703,935 $3,019,002 $3,727,454 $3,928,880 $4,141,190 $4,364,974 $4,600,850 $4,849,473 $5,111,531 $5,387,751 $5,678,896 $5,985,775 Property, plant and equipment: Land $61,870 $65,836 $67,000 $55,167 $51,950 Buildings and leasehold improvements $752,799 $796,966 $844,056 $762,735 $788,053 Equipment, furniture and other $2,598,184 $2,864,422 $3,111,663 $2,946,574 $3,214,860 Less accumulated depreciation $1,454,987 $1,669,938 $1,858,781 $1,863,919 $2,056,710 Total property, plant and equipment, net $1,957,866 $2,057,286 $2,163,938 $1,900,557 $1,998,153 $2,372,016 $2,500,196 $2,635,303 $2,777,711 $2,927,814 $3,086,028 $3,252,793 $3,428,569 $3,613,843 $3,809,130 Other non-current assets: Goodwill $1,849,389 $1,959,914 $2,138,499 $2,822,567 $2,834,639 Trademarks, net $610,063 $643,901 $651,552 $776,857 $892,749 Other intangibles, net $134,897 $149,920 $171,675 $269,564 $412,484 Other non-current assets $1,388,216 $1,455,372 $1,806,478 $1,264,287 $875,999 Total Non-Current Assets $5,940,431 $6,266,393 $6,932,142 $7,033,832 $7,014,024 $7,567,861 $7,976,816 $8,407,871 $8,862,220 $9,341,120 $9,845,900 $10,377,958 $10,938,767 $11,529,881 $12,152,938 Total Assets $9,224,751 $9,877,189 $10,577,718 $9,737,767 $10,033,026 $11,295,315 $11,905,696 $12,549,062 $13,227,194 $13,941,971 $14,695,374 $15,489,489 $16,326,517 $17,208,777 $18,138,713
Liabilities Current Liabilities: Short-term debt $146,838 $11,434 $28,471 $54,052 $165,054 Portion of long-term debt due w/in one year $7,948 $425,016 $544,798 $917 $303,189 Accounts Payable $938,168 $1,063,113 $1,181,652 $1,035,084 $1,181,078 $1,194,605 $1,240,479 $1,291,243 $1,346,826 $1,407,153 $1,472,142 $1,541,710 $1,615,768 $1,694,222 $1,776,974 Salaries and wages $43,439 $50,101 $76,020 $84,815 $85,818 Accrued marketing $210,945 $230,495 $260,550 $216,267 $262,217 Other accrued liabilities $387,130 $361,596 $365,022 $476,683 $414,130 Income taxes $200,666 $327,313 $130,555 $150,413 $93,620 Total Current Liabilities $1,926,134 $2,469,068 $2,587,068 $2,018,231 $2,505,106 $3,216,244 $3,339,750 $3,476,424 $3,626,071 $3,788,488 $3,963,460 $4,150,759 $4,350,145 $4,561,368 $4,784,160 Long-term debt and other liabilities: Long-term debt $4,776,143 $4,537,980 $4,121,984 $4,357,013 $4,413,641 $4,594,634 $4,771,071 $4,966,319 $5,180,102 $5,412,126 $5,662,086 $5,929,655 $6,214,493 $6,516,240 $6,834,514 Deferred income taxes $183,998 $313,343 $508,639 $518,724 $463,666 Non-pension postretirement benefits $192,663 $192,599 $196,686 $207,840 $253,117 Minority interest $415,559 $104,645 $114,833 $120,152 $98,309 Other liabilities $531,097 $365,365 $445,935 $466,984 $457,504 Total Non-Current Liabilities $6,099,460 $5,513,932 $5,388,077 $5,670,713 $5,686,237 $5,973,025 $6,202,393 $6,456,215 $6,734,132 $7,035,764 $7,360,711 $7,708,552 $8,078,841 $8,471,112 $8,884,869
Total Liabilities $8,025,594 $7,983,000 $7,975,145 $7,688,944 $8,191,343 $9,189,269 $9,542,143 $9,932,639 $10,360,203 $10,824,253 $11,324,171 $11,859,311 $12,428,987 $13,032,479 $13,669,029
Shareholders' Equity Capital Stock: Third cumulative preferred $106 $94 $83 $82 $77 Common stock $107,774 $107,774 $107,774 $107,774 $107,774 Additional capital $376,542 $403,043 $430,073 $502,235 $580,606 Dividends paid ($521,611) ($379,926) ($398,869) ($408,151) ($461,237) -$494,683 -$542,555 -$590,428 -$638,300 -$686,173 -$734,045 -$781,918 -$829,790 -$877,663 -$925,535 Retained earnings $4,432,571 $4,856,918 $5,210,748 $5,454,108 $5,778,617 $6,042,980 $6,300,487 $6,553,357 $6,803,924 $7,054,652 $7,308,136 $7,567,112 $7,834,464 $8,113,232 $8,406,618
Less: Treasury shares $2,879,506 $2,927,839 $3,140,586 $3,852,220 $4,406,126 Unearned compensation $21,195 $32,275 $31,141 $32,773 $0 Accumulated other comprehensive loss $817,135 $513,526 ($25,622) $130,383 $219,265
Total Shareholders’ Equity $1,199,157 $1,894,189 $2,602,573 $2,048,823 $1,841,683 $2,106,046 $2,363,553 $2,616,423 $2,866,990 $3,117,718 $3,371,202 $3,630,178 $3,897,530 $4,176,298 $4,469,684
Total Liabilities and Shareholders’ Equity $9,224,751 $9,877,189 $10,577,718 $9,737,767 $10,033,026 $11,295,315 $11,905,696 $12,549,062 $13,227,194 $13,941,971 $14,695,374 $15,489,489 $16,326,517 $17,208,777 $18,138,713

85
2003 2004 2005 2006 2007 Avg.
2001/12/31 2002/12/31 2003/12/31 2004/12/31 2005/12/31 Assets
Current Assets:
Cash and cash equivalents 8.69% 11.54% 10.25% 4.57% 6.51% 8.31%
Short-term investments 0.00% 0.40% 0.00% 0.00% 0.00% 0.08%
Receivables 12.63% 11.07% 10.33% 10.29% 9.94% 10.85%
Inventories: 0.00% 0.00% 0.00% 0.00% 0.00% 0.00%
Finished goods and WIP 9.78% 9.09% 9.22% 8.39% 9.40% 9.18%
Packing material and ingredients 2.72% 2.62% 2.66% 2.64% 2.54% 2.64%
Total Inventories 12.50% 11.71% 11.88% 11.03% 11.94% 11.81%
Prepaid expenses 1.60% 1.67% 1.65% 1.43% 1.32% 1.54%
Other current assets 0.18% 0.16% 0.36% 0.44% 0.39% 0.30%
Total Current Assets 35.60% 36.56% 34.46% 27.77% 30.09% 32.90%
Property, plant and equipment:
Land 0.67% 0.67% 0.63% 0.57% 0.52% 0.61%
Buildings and leasehold improvements 8.16% 8.07% 7.98% 7.83% 7.85% 7.98%
Equipment, furniture and other 28.17% 29.00% 29.42% 30.26% 32.04% 29.78%
Less accumulated depreciation 15.77% 16.91% 17.57% 19.14% 20.50% 17.98%
Total property, plant and equipment, net 21.22% 20.83% 20.46% 19.52% 19.92% 20.39%
Other non-current assets: 0.00% 0.00% 0.00% 0.00% 0.00% 0.00%
Goodwill 20.05% 19.84% 20.22% 28.99% 28.25% 23.47%
Trademarks, net 6.61% 6.52% 6.16% 7.98% 8.90% 7.23%
Other intangibles, net 1.46% 1.52% 1.62% 2.77% 4.11% 2.30%
Other non-current assets 15.05% 14.73% 17.08% 12.98% 8.73% 13.72%
Total Non-Current Assets 64.40% 63.44% 65.54% 72.23% 69.91% 67.10%
Total Assets 100.00% 100.00% 100.00% 100.00% 100.00% 100.00%
Liabilities
Current Liabilities:
Short-term debt 1.83% 0.14% 0.36% 0.70% 2.01% 1.01%
Portion of long-term debt due w/in one year 0.10% 5.32% 6.83% 0.01% 3.70% 3.19%
Accounts Payable 11.69% 13.32% 14.82% 13.46% 14.42% 13.54%
Salaries and wages 0.54% 0.63% 0.95% 1.10% 1.05% 0.85%
Accrued marketing 2.63% 2.89% 3.27% 2.81% 3.20% 2.96%
Other accrued liabilities 4.82% 4.53% 4.58% 6.20% 5.06% 5.04%
Income taxes 2.50% 4.10% 1.64% 1.96% 1.14% 2.27%
Total Current Liabilities 24.00% 30.93% 32.44% 26.25% 30.58% 28.84%
Long-term debt and other liabilities: 0.00% 0.00% 0.00% 0.00% 0.00% 0.00%
Long-term debt 59.51% 56.85% 51.69% 56.67% 53.88% 55.72%
Deferred income taxes 2.29% 3.93% 6.38% 6.75% 5.66% 5.00%
Non-pension postretirement benefits 2.40% 2.41% 2.47% 2.70% 3.09% 2.61%
Minority interest 5.18% 1.31% 1.44% 1.56% 1.20% 2.14%
Other liabilities 6.62% 4.58% 5.59% 6.07% 5.59% 5.69%
Total Non-Current Liabilities 76.00% 69.07% 67.56% 73.75% 69.42% 71.16%
Total Liabilities 100.00% 100.00% 100.00% 100.00% 100.00% 100.00%
Shareholders' Equity
Capital Stock:
Third cumulative preferred 0.01% 0.00% 0.00% 0.00% 0.00% 0.01%
Common stock 8.99% 5.69% 4.14% 5.26% 5.85% 5.99%
Additional capital 31.40% 21.28% 16.52% 24.51% 31.53% 25.05%
Dividends paid -43.50% -20.06% -15.33% -19.92% -25.04% -24.77%
Retained earnings 369.64% 256.41% 200.22% 266.21% 313.77% 281.25%
Less:
Treasury shares 240.13% 154.57% 120.67% 188.02% 239.24% 188.53%
Unearned compensation 1.77% 1.70% 1.20% 1.60% 0.00% 1.25%
Accumulated other comprehensive loss 68.14% 27.11% -0.98% 6.36% 11.91% 22.51%
Total Shareholders Equity 100.00% 100.00% 100.00% 100.00% 100.00% 100.00%

86
Statement of Cash Flows Analysis:
On our forecasted statement of cash flows, we derived our common size cash
flow statement by setting everything as a percentage of cash flow from operations. We
then took the net income that we previously forecasted on the income statement and
divided it by the average of the industry average percent net income to the company
specific average percent net income over the past five years. This calculation gives us
the forecasted cash flow from operations, which we carried forward 10 years. We also
forecasted depreciation by multiplying the previous year’s value by the average percent
depreciation with respect to CFFO.
When deriving our common sized statement of cash flows averages for the past
five years, we excluded the numbers from 2003, since in that year, Heinz had negative
cash flows from operations, severely distorting the percentages.

87
Operating activities: 4/30/2003 4/28/2004 4/27/2005 5/3/2006 5/2/2007 Ind. Avg. Assume 2008 2009 2010 2011 2012 2013 2014 2015 2016 2017
Net income 566,285 $804,273 $752,699 645,603 785,746 74.46% 70.14% $759,045 $800,063 $843,297 $888,867 $936,900 $987,529 $1,040,894 $1,097,142 $1,156,430 $1,218,922
Adjustments to reconcile net income to (88,738)
cash provided by operating activities:
Depreciation 477,547 210,158 227,187 227,454 233,374 19.88% $215,167 $226,795 $239,050 $251,968 $265,584 $279,936 $295,063 $311,008 $327,815 $345,529
Amortization 23,785 25,265 36,384 32,823
Deferred tax provision/(benefit) 97,542 53,857 (57,693) 52,244 (Gains)/losses on disposals and impairment 194,328 100,818 48,023 (1,391)
charges 20,434 (26,338)
Other items, net 133,320 (105,559) 43,989 39,066 11,066
Changes in current assets and liabilities,
excluding effects of acquisitions and
divestitures: 77,812
Receivables 177,979 97,228 45,851 115,583 10,987
Inventories (133,696) 77,636 (25,315) (47,401) (82,534) Prepaid expenses and other current assets (5,161) 2,633 13,555 14,208
Accounts payable 46,525 8,140 56,545 56,524
Accrued liabilities 53,177 (39,751) 25,077 57,353 (4,489)
Income taxes 66,351 68,669 (99,408) (59,511) (46,270)
Cash provided by operating activities (1,665) 1,249,007 1,160,793 1,074,961 1,062,288 $1,082,250 $1,140,733 $1,202,376 $1,267,351 $1,335,836 $1,408,023 $1,484,110 $1,564,309 $1,648,842 $1,737,943
Cash flow from investing activity 961,088 -301,102 -264,054 -451,817 -326,244 -423183 -446051 -470155 -495561 -522341 -550567 -580319 -611679 -644733 -679573
CFFO/sales -0.02% 16.38% 14.32% 12.44% 11.80% 11.41% 11.41% 11.41% 11.41% 11.41% 11.41% 11.41% 11.41% 11.41% 11.41%
CFFO/OI -0.14% 97.88% 90.58% 96.53% 73.43% 87.74% 87.74% 87.74% 87.74% 87.74% 87.74% 87.74% 87.74% 87.74% 87.74%
CFFO/NI -0.29% 155.30% 154.22% 166.50% 135.19% 142.58% 142.58% 142.58% 142.58% 142.58% 142.58% 142.58% 142.58% 142.58% 142.58%
Avg. Net income 64% 65% 60% 408% 74% 2252% 66% Adjustments to reconcile net income to cash provided by operating activities:
Depreciation 17% 20% 21% 117% 22% 666% 20%
Amortization 2% 2% 3% 21% 3% 98% 3%
Deferred tax provision/(benefit) 8% 5% -5% -83% 5% -60% 3%
(Gains)/losses on disposals and impairment 9% 4% 0% 4%
charges -2% 0% 0% -1%
Other items, net -8% 4% 4% -4% 1% 19% 0%
Changes in current assets and liabilities,
excluding effects of acquisitions and
divestitures:
Receivables 8% 4% 11% 14% 1% -256% 6%
Inventories 6% -2% -4% -5% -8% -804% -2%
Prepaid expenses and other current assets 0% 0% 1% -66% 1% -341% 1%
Accounts payable 4% 1% 5% -112% 5% 62% 4%
Accrued liabilities -3% 2% 5% -291% 0% -1616% 1%
Income taxes 5% -9% -6% 102% -4% 81% -3%
Cash provided by operating activities 100% 100% 100% 100% 100% 100% 100%

88
Conclusion:
When comparing Heinz to the industry average, one can see that Heinz is very
close to the mark in each respect. Our forecasted sales and income, which steadily
increased over time, appear to indicate that, provided there are no unexpected,
disastrous events, Heinz will continue to grow steadily along with its competitors in the
food industry.
Analysis of Valuations: With the method of comparables (valuations), the main goal is to back into the
price for the firm using industry averages. This is a ratio based valuation of the food
industry. It uses pricing on averages and provides and uses no fundamental
understanding. Also the degree of desirability is measured. The models have variance
of usefulness and the relevance needs to be determined. The relevant information
excluded negative numbers or possible large outliers and excludes the firm that is being
analyzed when computing averages. These model help determine if a firm is correctly
valued, overvalued, or undervalued. The intrinsic models are better at truly valuing the
firm better than price per share to earnings per share (forward and trailing), price per
share to book value per share, and dividends per share to price per share. The
intrinsic models are price per share to earnings per share over the one year ahead
earnings growth rate, price per share to earnings before interest, taxes, depreciation,
and amortization, price per share to future cash flows per share, and enterprise value to
earnings before interest, taxes, depreciation, and amortization.

89
Method of Comparables:
2007 Actual Price $45.61 P/E Trailing $54.82 P/E Forward $36.76 P/B $30.79 D/P $14.37 P.E.G. $30.09 P/EBITDA $33.07 P/FCF $10.74 EV/EBITDA $54.03
In order to compute these ratios, we first had to get the data for Heinz and their
competitor’s earnings, book value, dividends, and price and put them in a per share
basis. This allows us to compute the following ratios. We also had to consider negative
or not applicable numbers in our calculations.
Forward Price to Earnings
P/E Forward Heinz
Company PPS EPS P/E Ind. Avg.
Share Price
Heinz 45.61 2.38 19.16 15.45 $36.76 Campbells 36.42 2.22 16.38 Sara Lee 16.06 0.696 23.09 Conagra 23.29 1.75 13.29
To compute the forward price to earnings ratio, which uses forecast future
earnings and an industry average to back into a price for a firm, one needs the
competitors average forward price to earnings to compute the industry average, and a
forecast for future earnings. We took the forward price to earnings ratios for
Campbell’s, Sara Lee, and ConAgra and took their average. We then took this average

90
and multiplied it by the future earnings we forecasted previously for Heinz to derive a
current estimated price per share of Heinz at $36.76. This estimation is open to being
highly inaccurate in that it relies on an average computed on estimated future earnings,
and estimated future earnings for Heinz itself. Nonetheless, using the forward price to
earnings ratio alone, Heinz is overvalued.
Trailing Price to Earnings
P/E Trailing Heinz
Company PPS EPS P/E Ind. Avg
Share Price
Heinz 45.61 2.46 18.53 22.28 54.82 Campbells 36.42 2.22 17.27 Sara Lee 16.06 0.696 33.33 Conagra 23.29 1.75 16.25
The trailing price to earnings ratio is the least consistent of the theories. It uses
actual past earnings in its computation, rather than estimates of future earnings. To
compute this ratio, we took the trailing price to earnings ratio for the same three
competitors to compute the industry average. We then multiplied this average by
Heinz’s previous year’s earnings per share to derive an estimated price of $54.82. This
is much closer to Heinz’s actual price per share of $45.61, but still may contain some
degree of error, since it is relying on past performance of the firm, rather than looking
at what the firm is doing at the present. Using this ratio, we find that the share price
for Heinz is undervalued.

91
Price to Book
P/B Heinz
Company PPS BPS P/B Ind. Avg.
Share Price
Heinz 45.61 5.77 7.90 5.34 30.79 Campbells 36.42 3.37 10.80 Sara Lee 16.06 3.61 4.45 Conagra 23.29 9.41 2.48
The price to book ratio compares the price of the share to the book value of
equity from the firm’s financial statements. We backed into our price estimate using
the price to book ratio in a similar way as the previous two methods. First we took the
price to book industry average of our competitors. We multiplied that industry average
by our book value per share, computed by taking our total shareholder’s equity from
the balance sheet and dividing it by the total number of shares outstanding. This
yielded an estimated per share price of $30.79 for Heinz. The fallacy in this price
estimate lies in the fact that the market value of a company, which is determined by the
market, is not often directly linked to its shareholder’s equity balance, which is an
accounting ‘snap-shot’ at a particular point in time. And also, the average of the
industry is priced against something that does not exist in the industry. Using this ratio,
however, Heinz’s price per share is overvalued.
Dividends to Price
D/P Heinz
Company DPS PPS D/P Ind. Avg
Share Price
Heinz 1.49 45.61 0.033 0.026 14.37 Campbells 0.84 36.42 0.023 Sara Lee 0.40 16.06 0.025 Conagra 0.73 23.29 0.031

92
The dividends to price ratio compares the dividends per share to the price per
share of a firm, and relies on the theory that dividends play a large role in determining
the price of a stock. To derive this for Heinz, we computed the ratio for the
competitors and took the average. This time, however, instead of multiplying, we
divided the $1.49 dividend per share of the previous year by this industry average to
back into a per share price of $14.37. This ratio, like the trailing price to earnings ratio,
relies on what Heinz has done in the past, rather than what it is doing at present, which
can lead to some degree of error. It also relies heavily on the thought that the price of
a share of stock is highly correlated with the dividends paid on that stock, which is not
necessarily true. For instance, many firms do not even pay dividends, but maintain
relatively high prices per share. Also when using this ratio, if you compute 1/ (P/D),
this shows how long till a company gets investments of dividends back which is a very
useful number for a lender. Heinz has a ratio of .0327 and 1/.0327 equal 30.6 years till
Heinz would get back their invested dividends. Using the dividends to price ratio, the
current price per share of Heinz stock is, yet again, highly overvalued.
Price Earnings Growth
P.E.G. Heinz
Company PPS EPS P.E.G. Ind. Avg.
Share Price
Heinz 45.61 2.46 2.45 2.34 30.09 Campbells 36.42 2.22 2.6 Sara Lee 16.06 0.696 2.42 Conagra 23.29 1.75 2
The P.E.G. ratio is price per share over earnings per share over the one year
ahead earnings growth rate. This ratio shows a scale of growth opportunities for the
firm. If the P.E.G. ratio is greater than one, the firm is overvalued. If the P.E.G. ratio is
equal to one, then the firm is fairly valued. If the P.E.G. ratio is less than one, the firm
is undervalued and is in an ideal state to buy. The P.E.G. ratio should be scaled
between one to ten in order to determine this. We calculated our P.E.G. ratio by taking
the industry average from Campbell, Sara Lee, and Conagra, then multiplying it by

93
Heinz’s earnings per share to get their share price which equals $30.09. The industry
all showed overvalued firms. This also shows that Heinz is overvalued.
Price to EBITDA
P/EBITDA Heinz
Company PPS EBITDA P/EBITDA Ind. Avg.
Share Price
Heinz 45.61 1.76 25.91 18.79 33.07 Campbells 36.42 1.15 31.67 Sara Lee 16.06 1.37 11.72 Conagra 23.29 1.8 12.94
*EBITDA stated in Billions of Dollars
This ratio is price per share to earnings before interest, taxes, depreciation, and
amortization. This ratio shows how money creates values for the firms. For each dollar
of earnings creates value for the stockholders. We calculated our P/EBITDA by taking
the three competitors P/EBITDA and averaging them to get an industry average, where
we then set Heinz equal to the industry average times Heinz’s EBITDA to get the prices
per share which came out to be $33.07. $33.07 is under the share price of $45.61
where we are valuing Heinz meaning that they are overvalued. The rest of the industry
also shows an overvalued trend when comparing their P/EBITDA to their actual stock
prices.
Price to Future Cash Flows
P/FCF Heinz
Company PPS FCF P/FCF Ind. Avg.
Share Price
Heinz 45.61 4.46 10.24 2.41 10.74 Campbells 36.42 3.96 9.20 Sara Lee 16.06 -0.09 -187.68 Conagra 23.29 0.86 26.99
*Future Cash Flows are stated in Millions of Dollars
This ratio is price per share to future cash flows of the firm. Free cash flows are
calculated by taking the cash flows from operations and adding the cash flows from

94
investing. A company must have cash flows to drive value of the firm. This ratio shows
how the cash flows are related to the stock price. We calculated Heinz’s P/FCF by
taking the industry average of Heinz’s competitors which was 2.41. Then we set
Heinz’s share price equal to the industry average times Heinz’s FCF. We got that
Heinz’s share price should equal $10.74. Heinz is very overvalued in the P/FCF ratio.
Enterprise Value to EBITDA
EV/EBITDA Heinz
Company EV EBITDA EV/EBITDA Ind. Avg.
Share Price
Heinz 19.63 1.76 11.1534091 9.97 54.93 Campbells 16.73 1.51 11.0794702 Sara Lee 14.05 1.37 10.2554745 Conagra 15.46 1.8 8.58888889
*EBITDA is stated in Billions of Dollars
This ratio is the enterprise value to earnings before interest, taxes, depreciation,
and amortization. Enterprise value is found from the market value of equity (price per
share times the number of shares outstanding) plus the value of liabilities minus the
total of cash and financial investments. A company would want the EV/EBITDA to be
less than ten, because it would be a better buy. Having an EV/EBITDA greater than ten
would be over paying for a firm’s stock. We calculated Heinz’s EV/EBITDA by taking
three competitors and averaging them to get the industry average. We then set Heinz’s
share price equal to the industry average times Heinz’s EBITDA and we got that Heinz’s
share price equals $54.93. This shows that according to the EV/EBITDA ratio, Heinz’s
stock price is undervalued.
Conclusion:
These ratios have shown there is a vary inconsistency between the different
ratios. The prices vary from about $10 to about $55. Most of the ratios show that
Heinz is overvalued, but with EV/EBITDA and P/E trailing show that Heinz is
undervalued. These valuations will be taken into consideration as a broad view but the

95
next set of valuations will provide a better evaluation for the firms share price and the
value of the firm.
Cost of Equity:
The cost of equity, Ke, is the return to the shareholders of the company. The
model used in computing the cost of equity is the capital asset pricing model (CAPM).
This model states that the cost of equity equals the riskless rate of return plus the beta
risk times the market risk premium. We first ran regressions in order to get the betas
that would be used for the computations. We got the S&P 500 closing monthly prices
for the past seven years. Then we computed the returns on the S&P 500 monthly
prices by subtracting the current month’s price by its previous month’s closing price
then dividing both of them by the previous month. This gave us the returns of the S&P
500 for those seven years. We then computed the interest rates for the related series.
We got this information from the St. Louis Fed Fred 2 data base
(research.stlouisfed.org/fred2). From here we calculated our market risk premium by
subtracting the interest rates from the S&P 500 returns. We then ran a regression
between this market risk premium and Heinz market return computed from monthly
stock prices with dividends taken into consideration. We ran these regressions for five
time periods. 72, 60, 48, 36, and 24 month time periods. These five regressions were
run six times for different time periods of interest rates. The time periods were three
months, one year, three years, five years, seven years, and ten years treasury bonds.
We did this to see which regression to see which time period gave us the best beta.
From these regressions, we chose the highest adjusted r squared. This is
because adjusted r squared shows how much is explained by beta. The ideal beta is
the highest. We had a constant high beta in the 60 month regression over the six time
periods it was ran. This shows that our beta that we ran was constant over time.
We then computed the cost of equity. We used the constant 6.8% plus Heinz’s
market value premium of .7 for the size premium. For the risk free rate, we used
treasury bonds from each corresponding time period (finance.yahoo.com). The market

96
risk premium, beta, and the risk free rate are how CAPM was computed for all of the
episodes. “Firms whose earnings and cash flows are less sensitive to economic changes
will have betas lower than one (8-3, Palepu & Healy).” The related beta found on
yahoo finance is .62, which is close to the beta numbers that we computed. The best
beta found was .6596 from the one year treasury bonds interest rate, with a risk free
rate of 3.89%, and a given adjusted r squared of .1872. This CAPM gave us a cost of
equity of 8.84%, which means that it only measures 8.84% of the firm’s risk. These
results were to low so we decided to approach the answer from a different strategy.
We took the price to book ratio and set it equal to one plus the ROE minus the cost of
equity over the cost of equity minus the growth rate. We then got that the cost of
equity equal 11.29%. We decided to use this cost of equity because it better
represented our market.

97
Regression analysis:
72 60 48 36 24 3 month Beta 0.4158 0.6588 0.6153 0.5910 0.3730 R2 Adj 0.0963 0.1722 0.1101 0.1286 -0.0041 Ke 6.7086% 8.5308% 8.2048% 8.0224% 6.3872% RF 3.59% 3.59% 3.59% 3.59% 3.59% 72 60 48 36 24 1 year Beta 0.4156 0.6596 0.6179 0.5936 0.3753 R2 Adj 0.0965 0.1872 0.1116 0.1300 -0.0035 Ke 7.0067% 8.8368% 8.5240% 8.3423% 6.7044% RF 3.89% 3.89% 3.89% 3.89% 3.89% 72 60 48 36 24 3 year Beta 0.4197 0.6670 0.6252 0.6020 0.3763 R2 Adj 0.0985 0.1756 0.1144 0.1076 -0.0035 Ke 6.8276% 8.6822% 8.3692% 8.1951% 6.5023% RF 3.68% 3.68% 3.68% 3.68% 3.68% 72 60 48 36 24 5 year Beta 0.41633 0.66286 0.62217 0.59753 0.37708 R2 Adj 0.09753 0.17468 0.11369 0.10651 -0.0029 Ke 7.1125% 8.9614% 8.6563% 8.4714% 6.8181% RF 3.99% 3.99% 3.99% 3.99% 3.99% 72 60 48 36 24 7 year Beta 0.41683 0.66365 0.62304 0.59856 0.37758 R2 Adj 0.09784 0.17493 0.11405 0.10689 -0.0028 Ke 7.2863% 9.1374% 8.8328% 8.6492% 6.9919% RF 4.16% 4.16% 4.16% 4.16% 4.16% 72 60 48 36 24 10 year Beta 0.41737 0.66457 0.62392 0.59984 0.37843 R2 Adj 0.09808 0.17524 0.11442 0.10738 -0.0027 Ke 7.5003% 9.3543% 9.0494% 8.8688% 7.2082% RF 4.37% 4.37% 4.37% 4.37% 4.37%

98
Cost of debt:
The cost of debt, Kd, is calculated by taking all liabilities for the most recent year
and comparing them to their corresponding interest rates. We found the interest rates
from Heinz’s 10-K. For the interest rates for accounts payable, accrued marketing, and
other current liabilities we used 4.63%. This number comes from St. Louis Fed Fred
data base. The percent is a three month non-financial commercial paper rate. And for
deferred taxes we used 4.14% which is the risk free rate. With all of these rates, which
were multiplied by the percentage of total liabilities to compute the value weighted rate.
Those totals were then added up with taxes in consideration. We computed this total
with and without taxes so that we would have the appropriate number to plug into the
WACC equation. We also state a net of tax cost of debt because it is after tax cash
flows that are being discounted (8-2, Palepu & Healy). To get this after tax number,
we tax one minus the tax rate, which is 35%, and multiply it by the net of tax number.
Our cost of debt before taxes was 5.65% and cost of debt after taxes was
3.67%. Knowing these debt numbers allows the analysts to see if the company has
enough cash or assets to back up the next year of debt and the rest of the future debt
plus possible extra debt that the company will have. It is also important to know that
both of the cost of debt percentages will change overtime because the fluctuating
interest rates of the market.
Weighted Average Cost of Capital:
The weighted average cost of capital (WACC) is computed to value the firm’s
assets by using the cost of equity and debt. We used the values of equity and debt
from above and also pulled the numbers for the value of debt, value of equity, and the
value of the firm from Heinz’s 10-K. We used with the average cost of equity of
11.29% and we used the cost of debt before taxes of 5.65%. We calculated the WACC
before tax and after tax. WACC before tax was 2.53% and WACC after taxes was
2.37% and was calculated similarly to WACC before tax but the cost of debt was
multiplied by one minus the tax rate of 35%.

99
Weighted Average Cost of Debt: Liabilities
Current Liabilities: 2007 TL Percent of TL Rates Value Weighted Rate of Debt
Short-term debt $165,054 2.01% 5.40% 0.10881% Portion of long-term debt due w/in one year $303,189 3.70% 6.14% 0.22726%
Accounts Payable $1,181,078 14.42% 4.63% 0.66758%
Salaries and wages $85,818 1.05% 0.0% 0.0%
Accrued marketing $262,217 3.20% 4.63% 0.1%
Other accrued liabilities $414,130 5.06% 4.6% 0.2%
Income taxes $93,620 1.14% 35.00% 0.4%
Total Current Liabilities $2,505,106 30.58%
Long-term debt and other liabilities:
Long-term debt $4,413,641 53.88% 6.14% 3.30834%
Deferred income taxes $463,666 5.66% 4.14% 0.23434%
Non-pension postretirement benefits $253,117 3.09% 6.10% 0.18849%
Minority interest $98,309 1.20% 0% 0.0%
Other liabilities $457,504 5.59% 11.00% 0.614373%
Total Non-Current Liabilities $5,686,237 69.42%
Total Liabilities $8,191,343 100.00%
Total Kd before taxes: 5.649193% Total Kd after taxes: 3.67198% = 5.649193% * (1-.35) *Rates are from Heinz 10-k and from St. Louis Fed Fred 2
Intrinsic Valuations:
Intrinsic valuations utilize the forecasts and analysis derived above to assess the
true value of a firm. The discounted dividend model, the free cash flows model, the
residual income model, and the long run return on equity residual income model are the
four main models used in firm valuations. These models look at all aspects of the
business to estimate the true value of a firm. A detailed description of the methods
used and the valuation results for Heinz are explained below.
Discounted Dividend Model:
Dividends can be good insight into a company for potential investors. Whether
or not a company distributes dividends can be a deciding factor when choosing
investments. This model takes the future dividends and discounts them back to the
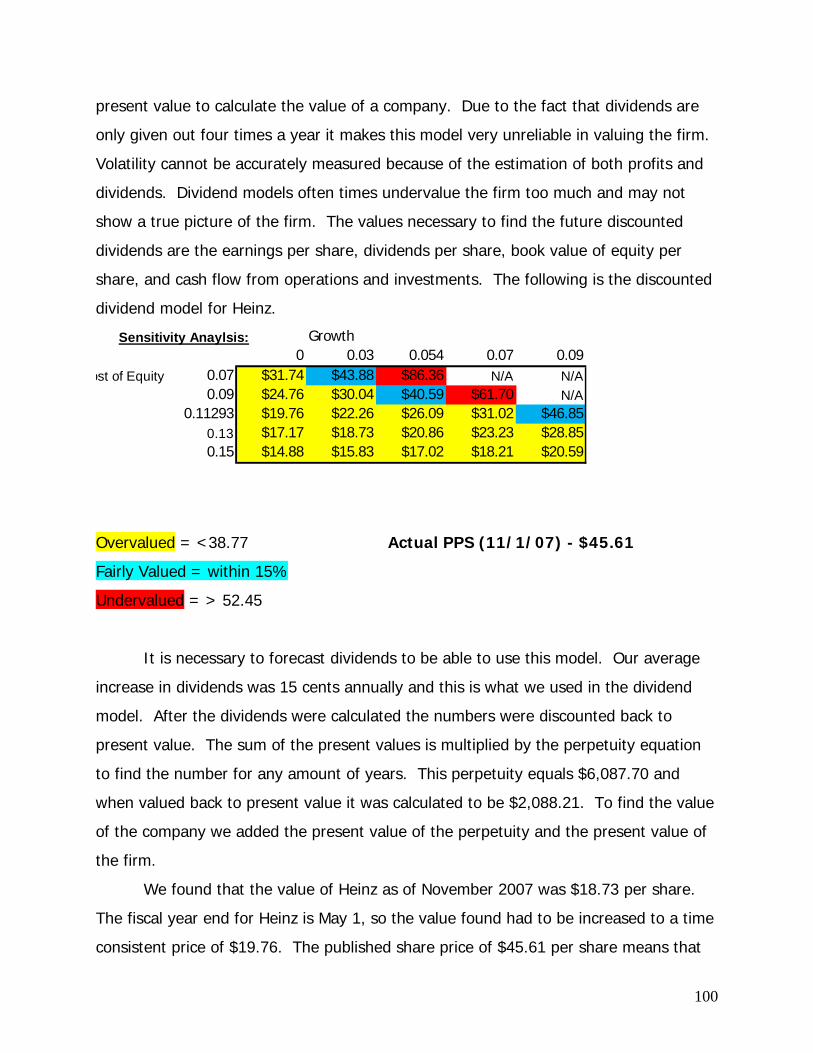
100
present value to calculate the value of a company. Due to the fact that dividends are
only given out four times a year it makes this model very unreliable in valuing the firm.
Volatility cannot be accurately measured because of the estimation of both profits and
dividends. Dividend models often times undervalue the firm too much and may not
show a true picture of the firm. The values necessary to find the future discounted
dividends are the earnings per share, dividends per share, book value of equity per
share, and cash flow from operations and investments. The following is the discounted
dividend model for Heinz.
Sensitivity Anaylsis: Growth0 0.03 0.054 0.07 0.09
ost of Equity 0.07 $31.74 $43.88 $86.36 N/A N/A0.09 $24.76 $30.04 $40.59 $61.70 N/A
0.11293 $19.76 $22.26 $26.09 $31.02 $46.850.13 $17.17 $18.73 $20.86 $23.23 $28.850.15 $14.88 $15.83 $17.02 $18.21 $20.59
Overvalued = <38.77 Actual PPS (11/1/07) - $45.61 Fairly Valued = within 15%
Undervalued = > 52.45
It is necessary to forecast dividends to be able to use this model. Our average
increase in dividends was 15 cents annually and this is what we used in the dividend
model. After the dividends were calculated the numbers were discounted back to
present value. The sum of the present values is multiplied by the perpetuity equation
to find the number for any amount of years. This perpetuity equals $6,087.70 and
when valued back to present value it was calculated to be $2,088.21. To find the value
of the company we added the present value of the perpetuity and the present value of
the firm.
We found that the value of Heinz as of November 2007 was $18.73 per share.
The fiscal year end for Heinz is May 1, so the value found had to be increased to a time
consistent price of $19.76. The published share price of $45.61 per share means that

101
Heinz is overvalued. This proves that the discounted dividend model is not an accurate
estimate of the price per share because of all the estimations used in calculating the
price. Calculated prices are much lower than they actually are.
Our sensitivity analysis showed that if Heinz wanted to be fairly valued they
could do a few things. One is to decrease both their cost of equity and growth rate.
Another option would be to either increase the growth rate or decrease the cost of
equity. This growth does not currently seem attainable based on the past trends of
Heinz. We believe that Heinz would have a hard time increasing their growth rate or
decreasing the cost of equity that much due to their past dividend trends. The
discounted dividend model shows that Heinz is overvalued compared to the current
share price of $45.61 and that this model would not be the best to use when valuing a
firm with small dividends.
Free Cash Flows Model:
The future cash flows model shows the difference between the accounting
earnings and the free cash flows to the firm. This calculation uses the weighted
average cost of capital mentioned earlier and compares it to the perpetuity growth rate.
This model is often inaccurate due to the fact that the number is based off of the
present value of future cash flows and the terminal value of the perpetuity. The inputs
needed to find the future cash flows model are the same as those used in the
discounted dividends model plus the before-tax weighted average cost of capital. The
WACC used for Heinz was 2.534% and the growth rate was set at 5.4% per year.
Sensitivity analysis on the next page shows how the numbers for Heinz changed when
the WACC and growth rate were manipulated.

102
g
0 0.02 0.054 0.07 0.090 N/A N/A N/A N/A N/A
0.01 80.23 N/A N/A N/A N/AWACC 0.0253 25.24 162.37 N/A N/A N/A
0.03 19.59 81.02 N/A N/A N/A0.04 11.97 35.12 N/A N/A N/A
Overvalued = <38.77 Actual PPS (11/1/07) - $45.61 Undervalued = > 52.45
Annual free cash flows are the first thing that needed to be calculated by taking
the cash flow from operations minus the investing cash flows. Then the free cash flows
are multiplied by the present value factor to bring them to the value they would be
today. The sum of the total present value of dividends and the present value of the
terminal perpetuity yield a value of the firm of $16,128. The value of the firm minus
the book value of liabilities equals the market value of equity. This market value of
equity is then divided by the number of shares outstanding to get an estimated share
price of $24.87. Like the discounted dividend model, this number also has to be time
consistent with the fiscal year end value which is $25.18.
Many of the numbers calculated in the sensitivity analysis came up negative or
were unable to be calculated. This could be due to the fact that the WACC used was
too low or the growth rate estimated was too aggressive. The results that did work
show that Heinz needs to have a small growth rate and a higher WACC in order for this
model to be reliable. This model shows that Heinz is once again overvalued as of
November, 2007.

103
Residual Income Model:
The residual income model is based off of the earnings of the firm versus the
perpetuity used in the last two models. This model is more accurate than the other
models because the earnings are usually better estimated than the perpetuity. Residual
income is a good indicator of the value of the firm. Results from the residual income
model for Heinz are shown below.
0 0.02 0.054 0.07 0.09Ke 0.07 40.88 48.07 101.5 N/A N/A
0.09 31.17 34.26 47.36 68.95 N/A0.11293 24.29 25.66 30.13 34.68 49.29
0.13 20.77 21.57 23.90 25.9 30.670.15 17.68 18.13 19.31 20.22 22.03
Overvalued = <38.77 Actual PPS (11/1/07) - $45.61 Fairly Valued = within 15%
Undervalued = > 52.45
To find the values used in the residual income we started with the earnings
minus the benchmark earnings, which are found by multiplying the book value of equity
for the previous year by the cost of equity. This equals the annual residual income and
it needs to be grown back to present value. Residual income tells whether the
company is adding or destroying the value of their firm. Eventually the PV of residual
incomes should get closer to zero because not many firms can keep their growth at a
rate higher than the market for long periods. The present value trends of Heinz are
shown below.
0 1 2 3 4 5 6 7 8 9 10
2007 2008 2009 2010 2011 2012 2013 2014 2015 2016 2017
PV
Annual
RI 495.21 453.99 418.21 386.88 359.20 334.51 312.28 292.07 273.56 256.45
After finding the residual income, the initial book value of equity, the PV or
annual residual income, and the PV of terminal value perpetuity are all added together

104
and divided by the total number of shares outstanding to give the estimated price per
share of $23.04. The time consistent price per share is $24.30.
By using sensitivity analysis it further shows that Heinz is overvalued. In this
model the company would have to decrease both the cost of equity and the growth rate
to have a chance at being fairly valued. Heinz would have to have a drastic change in
both the growth rate and the cost of equity to bring the share value closer to what it
really should be. The residual income model is thought to be one of the best of all the
intrinsic valuation models in determining the market price of stock and it says that
Heinz is overvalued at a stock price of $45.61.
Long Run Return on Equity Residual Income Model:
The long run return on equity residual income model is also a very good model
for valuing a firm. A perpetuity value from the residual income model is used to derive
the valuation. This model is very effective due to the fact that it compares the long run
return on equity, the long run growth rate of equity, and the cost of equity. The results
for Heinz are listed below.
ROE = .2919 g0 0.03 0.054 0.07 0.09
Ke 0.07 $24.73 $38.80 $88.04 N/A N/A0.09 $19.41 $26.10 $39.49 66.26$ N/A
0.1129 $15.63 $19.08 $24.38 31.19$ 53.09$ 0.13 $13.68 $15.95 $19.05 22.49$ 30.67$ 0.15 $11.96 $13.41 $15.21 17.02$ 20.63$

105
g = .054 ROE0.25 0.27 0.2919 0.31 0.33
Ke 0.07 $73.11 $80.58 $88.74 95.50$ 102.96$ 0.09 $32.80 $36.14 $39.81 42.84$ 46.18$
0.11293 $20.25 $22.31 $24.57 26.44$ 28.51$ 0.13 $15.82 $17.43 $19.20 20.66$ 22.27$ 0.15 $12.63 $13.92 $15.33 16.50$ 17.79$
Ke = .1129 g
0 0.03 0.054 0.07 0.09ROE 0.25 $13.48 $16.15 $20.25 25.52$ 42.47$
0.27 $14.55 $17.62 $22.31 28.36$ 47.78$ 0.2919 $15.73 $19.22 $20.25 31.46$ 53.60$
0.31 $16.71 $20.55 $24.57 34.03$ 58.40$ 0.33 $17.79 $22.02 $28.51 36.87$ 63.71$
Overvalued = <38.77 Actual PPS (11/1/07) - $45.61 Fairly Valued = within 15%
Undervalued = > 52.45
We started by calculating the long run return on equity by dividing the book
value of equity of the previous year by this year’s earnings. The ROE for Heinz is
shown in the table below.
2008 2009 2010 2011 2012 2013 2014 2015 2016 2017 ROE 41.21% 37.99% 35.68% 33.97% 32.68% 31.67% 30.88% 30.22% 29.67% 29.19%
The ROE for Heinz has been steadily decreasing very little every year. Knowing
the ROE helps to get a better picture of what the long run return on equity will be. The
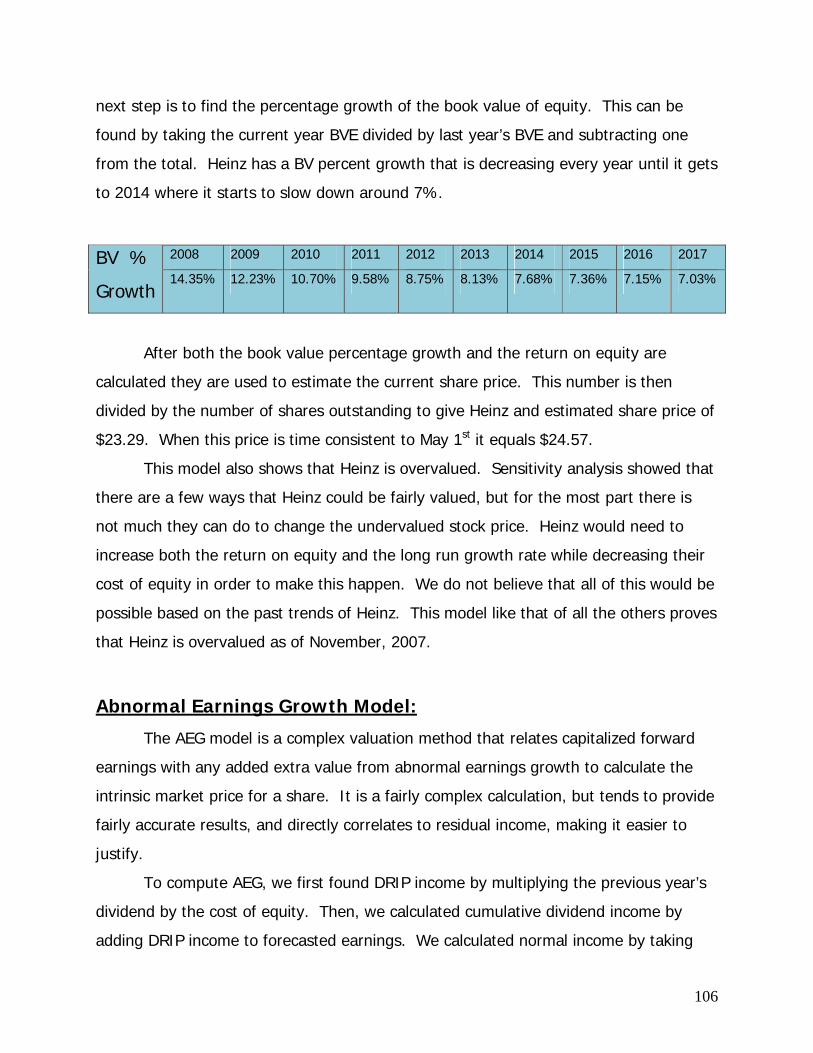
106
next step is to find the percentage growth of the book value of equity. This can be
found by taking the current year BVE divided by last year’s BVE and subtracting one
from the total. Heinz has a BV percent growth that is decreasing every year until it gets
to 2014 where it starts to slow down around 7%.
2008 2009 2010 2011 2012 2013 2014 2015 2016 2017 BV %
Growth 14.35% 12.23% 10.70% 9.58% 8.75% 8.13% 7.68% 7.36% 7.15% 7.03%
After both the book value percentage growth and the return on equity are
calculated they are used to estimate the current share price. This number is then
divided by the number of shares outstanding to give Heinz and estimated share price of
$23.29. When this price is time consistent to May 1st it equals $24.57.
This model also shows that Heinz is overvalued. Sensitivity analysis showed that
there are a few ways that Heinz could be fairly valued, but for the most part there is
not much they can do to change the undervalued stock price. Heinz would need to
increase both the return on equity and the long run growth rate while decreasing their
cost of equity in order to make this happen. We do not believe that all of this would be
possible based on the past trends of Heinz. This model like that of all the others proves
that Heinz is overvalued as of November, 2007.
Abnormal Earnings Growth Model:
The AEG model is a complex valuation method that relates capitalized forward
earnings with any added extra value from abnormal earnings growth to calculate the
intrinsic market price for a share. It is a fairly complex calculation, but tends to provide
fairly accurate results, and directly correlates to residual income, making it easier to
justify.
To compute AEG, we first found DRIP income by multiplying the previous year’s
dividend by the cost of equity. Then, we calculated cumulative dividend income by
adding DRIP income to forecasted earnings. We calculated normal income by taking
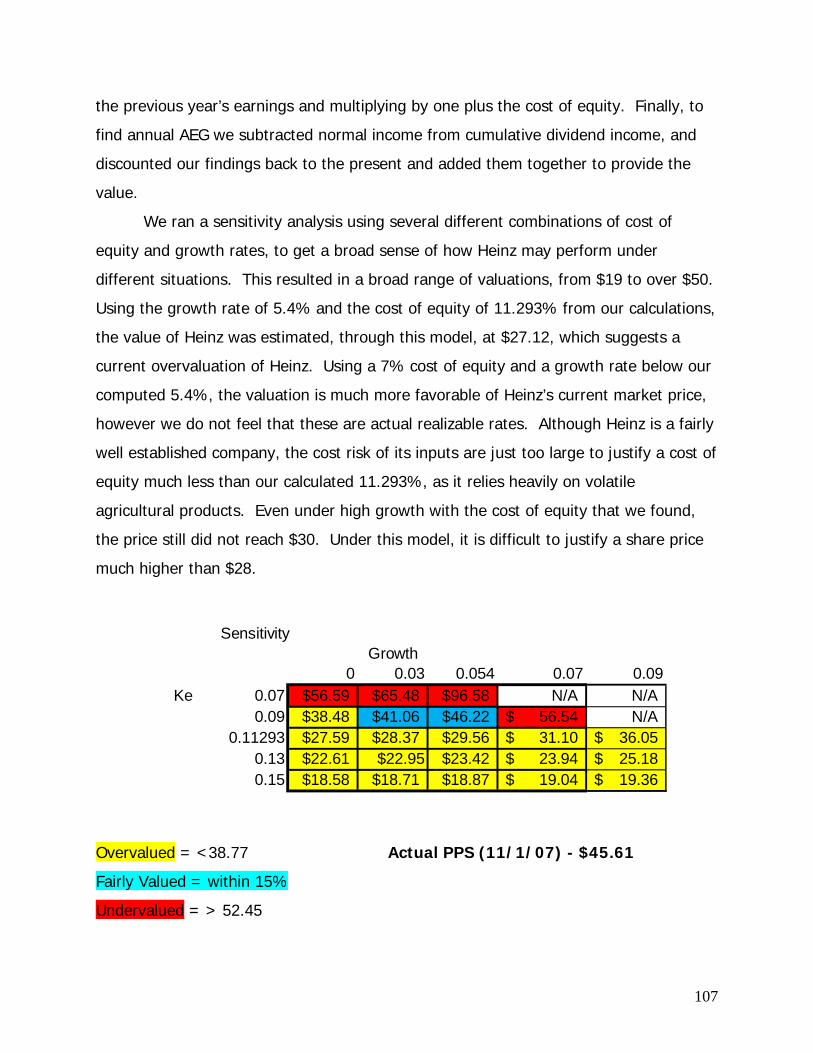
107
the previous year’s earnings and multiplying by one plus the cost of equity. Finally, to
find annual AEG we subtracted normal income from cumulative dividend income, and
discounted our findings back to the present and added them together to provide the
value.
We ran a sensitivity analysis using several different combinations of cost of
equity and growth rates, to get a broad sense of how Heinz may perform under
different situations. This resulted in a broad range of valuations, from $19 to over $50.
Using the growth rate of 5.4% and the cost of equity of 11.293% from our calculations,
the value of Heinz was estimated, through this model, at $27.12, which suggests a
current overvaluation of Heinz. Using a 7% cost of equity and a growth rate below our
computed 5.4%, the valuation is much more favorable of Heinz’s current market price,
however we do not feel that these are actual realizable rates. Although Heinz is a fairly
well established company, the cost risk of its inputs are just too large to justify a cost of
equity much less than our calculated 11.293%, as it relies heavily on volatile
agricultural products. Even under high growth with the cost of equity that we found,
the price still did not reach $30. Under this model, it is difficult to justify a share price
much higher than $28.
SensitivityGrowth
0 0.03 0.054 0.07 0.09Ke 0.07 $56.59 $65.48 $96.58 N/A N/A
0.09 $38.48 $41.06 $46.22 56.54$ N/A0.11293 $27.59 $28.37 $29.56 31.10$ 36.05$
0.13 $22.61 $22.95 $23.42 23.94$ 25.18$ 0.15 $18.58 $18.71 $18.87 19.04$ 19.36$
Overvalued = <38.77 Actual PPS (11/1/07) - $45.61 Fairly Valued = within 15%
Undervalued = > 52.45

108
Credit Analysis: We derived Heinz’s credit worthiness from the Altman Z-score, a model
combining 5 different financial ratios using 8 variables from the income statement and
balance sheet. In general, the lower the score for a particular company, the higher the
probability that company will go bankrupt. Companies with Z-scores of 3 or above are
considered safe and unlikely to go bankrupt. Z-scores between 1.8 and 3 are
considered to be in jeopardy of bankruptcy. For Z-scores below 1.8 bankruptcy is
considered imminent. “Studies measuring the effectiveness of the Z-score have shown
the model is often accurate in predicting bankruptcy with 72 to 80% reliability
(http://www.valuebasedmanagement.net)” This model effectively rates the credit of
companies like Heinz that have a relevant history of financials to properly compute a Z-
score.
The Altman Z-score is computed from the following:
Z-score = 1.2(Working Capital/Total Assets) + 1.4(Retained Earnings/Total Assets) +
3.3(Earnings Before Interest and Taxes/Total Assets) + .6(Market Value of Equity/Book
Value of Debt) + 1.0(Sales/Total Assets)
Altman Z-score
2003 2004 2005 2006 2007 3.024 2.917 2.809 3.241 3.308
The current Z-score for Heinz is very healthy at 3.3. The company has a fairly
consistent Z-score right around 3 over the past 5 years.

109
Analyst Recommendation: After having rigorously analyzed virtually everything having to do with Heinz,
through an industry analysis, accounting analysis, financial analysis, credit analysis,
several different valuation models, and forecasting future financial statements, we have
come to the conclusion that in the current market, Heinz is overvalued. Therefore, we
give it a sell rating.
To analyze the industry, we took what we believed to be the three largest
competitors of Heinz, based on size and maturity in the market. Campbell’s, ConAgra,
and Sara Lee, we decided, best fit the profile for firms with the right cost efficiency,
size, and experience in the market. We used there financial statements along with
Heinz’s to derive the current status of the food industry, and discover what the norms
were among the firms in the industry.
In our accounting analysis, we found that Heinz was very consistent over time,
more so than its competitors. We analyzed its performance, and the competitors’, with
respect to several sales and expense diagnostic ratios designed to detect potential
errors or hidden items in their financial statement reporting. What we found was that
Heinz was fairly consistent in each of the diagnostics, which led us to little concern over
its reported financials. In the financial analysis ratios, Heinz appeared to closely follow
the industry trends, which we took to mean that its performance was as good as can be
expected from an industry with such volatile costs.
Our forecasts of Heinz’s future financial statements were based on five years of
the company’s own previous financial statements, plus the financial statements of its
competitors compiled show industry trends. In many cases, we assumed that Heinz
would steadily grow to meet certain industry averages, while in other cases, we noticed
trends in its performance over the past five years and chose to carry those forward. In
the end, we feel our forecast is thoughtfully based on solid financial information and
financial theory.
When we began to use our forecasts to compute various valuations, from the
less reliable methods of comparables to the highly complex intrinsic valuation models,

110
we continually ran into the fact that our valuations were not consistent with those of
the market. We have confidence in our forecasts and in our valuation methodologies,
and therefore must come to the conclusion that the market’s valuation of Heinz is
erroneous. Our valuation of Heinz, even when we allowed for excessively optimistic
growth, was still less than the value assigned by the market.
It is for this reason we recommend that Heinz stock be sold. The markets over
enthusiasm may be a result of strong consumer spending over the past several years;
however, even under these circumstances we do not believe Heinz has the kind of
growth potential necessary to make the market’s valuation plausible. We feel the stock
price must inevitably go down.

111
Appendix:
Heinz's Trend Analysis 2003 2004 2005 2006 2007
LIQUIDITY Current Ratio 1.71 1.46 1.41 1.34 1.21 Quick Asset Ratio 1.02 0.92 0.84 0.72 0.66 A/R Turnover 7.07 6.98 7.42 8.63 9.03 A/R Days 51.65 52.32 49.20 42.32 40.42 Inventory Turnover 4.60 4.09 4.03 5.17 4.68 Inventory Days 79.34 89.21 90.48 70.61 77.96 Working Capital Turnover 6.06 6.68 7.66 12.61 17.52 PROFITABILITY Gross Profit Margin 35.60% 37.93% 37.44% 35.79% 37.69% Operating Profit Margin 14.25% 16.73% 15.81% 12.88% 15.52% Operating Expense Ratio 1.50 1.27 1.37 1.78 1.42 Net Profit Margin 6.88% 10.55% 9.29% 7.47% 8.73% Asset Turnover 0.89 0.77 0.77 0.89 0.90 Return on Assets 5.51% 8.14% 7.12% 6.63% 8.07% Return on Equity 32.95% 67.07% 39.74% 24.81% 38.35% CAPITAL STRUCTURE Debt to equity ratio 6.69 4.21 3.06 3.75 4.45 Times interest earned 5.25 6.04 5.52 3.52 4.34 Debt service margin 2.75 1.68 15.62 2.24 1.46
Campbell's Trend Analysis 2003 2004 2005 2006 2007
LIQUIDITY Current Ratio 0.63 0.63 0.76 0.73 0.78 Quick Asset Ratio 0.22 0.22 0.27 0.40 0.32 A/R Turnover 13.63 14.51 13.89 14.86 13.54 A/R Days 26.78 25.16 26.27 24.56 26.96 Inventory Turnover 4.79 5.35 5.34 5.87 5.90 Inventory Days 76.26 68.17 68.30 62.19 61.88 Working Capital Turnover 7.78 8.29 14.43 9.55 17.40 PROFITABILITY Gross Profit Margin 43.02% 41.10% 40.91% 41.81% 41.90% Operating Profit Margin 16.55% 15.68% 16.01% 15.67% 16.44% Operating Expense Ratio 0.26 0.25 0.25 0.26 0.25 Net Profit Margin 8.91% 9.10% 10.00% 10.43% 10.86% Asset Turnover 1.00 1.07 1.04 0.95 1.22

112
Return on Assets 8.91% 9.71% 10.43% 9.89% 13.25% Return on Equity 68.08% 74.03% 55.67% 43.33% 65.95% CAPITAL STRUCTURE Debt to equity ratio 6.64 6.62 4.34 3.38 3.98 Times interest earned 5.94 6.41 6.15 6.98 Debt service margin Sara Lee's Trend Analysis 9/22/20
03 9/3/2004
9/2/2005
9/14/2006
8/29/2007
LIQUIDITY Current Ratio 1.15 1.06 1.17 1.08 1.31 Quick Asset Ratio 0.55 0.47 0.52 0.54 0.89 A/R Turnover 1.18 1.31 0.79 0.78 1.01 A/R Days 308.31 277.64 463.63 466.92 362.38 Inventory Turnover 4.09 4.32 2.52 7.64 7.19 Inventory Days 89.30 84.41 144.71 47.75 50.75 Working Capital Turnover 24.26 60.58 13.46 23.10 9.15 PROFITABILITY Gross Profit Margin 39.58% 38.58% 40.11% 38.70% 33.15% Operating Profit Margin 9.20% 8.81% 8.34% 3.68% -0.81% Operating Expense Ratio 3.30 3.38 3.81 9.51 -41.70 Net Profit Margin 6.68% 6.50% 6.34% 4.84% 4.10% Asset Turnover 1.18 1.31 0.79 0.78 1.01 Return on Assets 7.90% 8.55% 4.99% 3.79% 4.13% Return on Equity 59.50% 43.15% 24.47% 22.66% 19.27% CAPITAL STRUCTURE Debt to equity ratio 6.51 4.05 3.91 4.99 3.66 Times interest earned 6.61 7.54 4.73 4.15 1.86 Debt service margin 0.35 0.49 0.33 0.33 0.18 Conagra Trend Analysis 2003 2004 2005 2006 2007
LIQUIDITY Current Ratio 2.51 2.21 2.21 1.49 1.49 Quick Asset Ratio 1.08 1.01 1.10 0.94 0.27 A/R Turnover 1.00 1.00 1.00 1.01 1.07 A/R Days 364.91 364.08 364.67 362.57 340.56 Inventory Turnover 4.66 2.87 3.67 3.87 3.83 Inventory Days 78.29 127.28 99.50 94.42 95.31 Working Capital Turnover 2.61 2.98 2.93 5.61 5.96

113
PROFITABILITY Gross Profit Margin 20.49% 25.53% 24.59% 23.63% 26.09% Operating Profit Margin 2.43% 3.54% 1.61% 2.87% 3.42% Operating Expense Ratio 1.24 1.28 1.56 1.55 2.50 Net Profit Margin 1.65% 3.71% 2.07% 4.35% 5.70% Asset Turnover 0.91 0.96 0.95 0.94 0.92 Return on Assets 1.70% 3.56% 1.96% 4.07% 5.27% Return on Equity 7.41% 13.42% 7.34% 18.44% 19.64% CAPITAL STRUCTURE Debt to equity ratio 2.28 1.93 2.02 3.53 2.73 Times interest earned 5.41 3.96 3.75 3.14 5.46 Debt service margin 21.86 21.60 36.39 125.56 94.34

114
Summary Output for 3 month Regressions:
Regression Statistics
Multiple R 0.33014575
7
R Square 0.10899622
1 Adjusted R Square
0.096267596
Standard Error 0.04162928
5
Observations 72
ANOVA
df SS MS F Significance
F
Regression 1 0.01483979
3 0.014839
8 8.56307
9 0.00462247
1
Residual 70 0.12130981
4 0.001733
Total 71 0.13614960
6
Coefficients Standard
Error t Stat P-value Lower 95% Upper 95% Lower 95.0% Upper 95.0%
Intercept 0.00353533
4 0.00493294
6 0.716678 0.47595
7 -
0.00630312 0.013373785 -0.006303117 0.013373785
X Variable 1 0.41581988
1 0.14209875
8 2.926273
9 0.00462
2 0.13241284
8 0.699226914 0.132412848 0.699226914
X Variable 1 0.65877180
1 0.18080081
7 3.643632
9 0.00057
5 0.29685964
8 1.020683955 0.296859648 1.020683955
SUMMARY OUTPUT
Regression Statistics
Multiple R 0.43158144
9
R Square 0.18626254
7 Adjusted R Square
0.172232591
Standard Error 0.03638345
5
Observations 60
ANOVA
df SS MS F Significance
F
Regression 1 0.01757426
2 0.017574
3 13.2760
6 0.00057538
4
Residual 58 0.07677783
4 0.001323
8
Total 59 0.09435209
6
Coefficients Standard
Error t Stat P-value Lower 95% Upper 95% Lower 95.0% Upper 95.0%
Intercept 0.00485879
5 0.00487730
1 0.996205
6 0.32328
8 -
0.00490418 0.014621774 -0.004904184 0.014621774
X Variable 1 0.65877180
1 0.18080081
7 3.643632
9 0.00057
5 0.29685964
8 1.020683955 0.296859648 1.020683955
Regression Statistics
Multiple R 0.35863644
1

115
R Square 0.12862009
7 Adjusted R Square
0.102991276
Standard Error 0.03377150
2
Observations 36
ANOVA
df SS MS F Significance
F
Regression 1 0.00572375
4 0.005723
8 5.01857
3 0.03172141
5
Residual 34 0.03877748
7 0.001140
5
Total 35 0.04450124
1
Coefficients Standard
Error t Stat P-value Lower 95% Upper 95% Lower 95.0% Upper 95.0%
Intercept 0.00641588
8 0.00581946
4 1.102487
8 0.27799
3 -
0.00541069 0.018242461 -0.005410685 0.018242461
X Variable 1 0.59098269
9 0.26380599
6 2.240217
1 0.03172
1 0.05486441
6 1.127100982 0.054864416 1.127100982
Regression Statistics
Multiple R 0.19898610
3
R Square 0.03959546
9 Adjusted R Square
-0.00405928
Standard Error 0.03843242
4
Observations 24
ANOVA
df SS MS F Significance
F
Regression 1 0.00133970
6 0.001339
7 0.90701
4 0.35125515
8
Residual 22 0.03249512
6 0.001477
1
Total 23 0.03383483
2
Coefficients Standard
Error t Stat P-value Lower 95% Upper 95% Lower 95.0% Upper 95.0%
Intercept 0.01190824
7 0.00826791
5 1.440296
2 0.16386
4 -
0.00523836 0.029054853 -0.00523836 0.029054853
X Variable 1 0.37296545 0.39161707
1 0.952372
8 0.35125
5 -
0.43919864 1.185129543 -0.439198644 1.185129543

116
Summary Output for 1 year Regression:
Regression Statistics
Multiple R 0.33043278
R Square 0.10918583 Adjusted R Square 0.09645991
Standard Error 0.04162486
Observations 72
ANOVA
df SS MS F Significance F
Regression 1 0.014865607 0.01486561 8.57980033 0.004584871
Residual 70 0.121283999 0.00173263
Total 71 0.136149606
Coefficients Standard
Error t Stat P-value Lower 95% Upper 95% Lower 95.0% Upper 95.0%
Intercept 0.00363162 0.004929059 0.73677697 0.46372023 -0.006199081 0.01346231 -
0.006199081 0.013462315
X Variable 1 0.41555599 0.141870127 2.92912962 0.00458487 0.132604948 0.69850703 0.132604948 0.698507032
SUMMARY OUTPUT
Regression Statistics
Multiple R 0.43262613
R Square 0.18716537 Adjusted R Square 0.17315098
Standard Error 0.03636327
Observations 60
ANOVA
df SS MS F Significance F
Regression 1 0.017659445 0.01765944 13.3552275 0.000555993
Residual 58 0.076692651 0.00132229
Total 59 0.094352096
Coefficients Standard
Error t Stat P-value Lower 95% Upper 95% Lower 95.0% Upper 95.0%
Intercept 0.00499059 0.004864175 1.02598982 0.30915646 -0.00474611 0.0147273 -0.00474611 0.014727297
X Variable 1 0.65956936 0.180482388 3.65448047 0.00055599 0.298294614 1.02084411 0.298294614 1.020844112
SUMMARY OUTPUT
Regression Statistics
Multiple R 0.36118966
R Square 0.13045797 Adjusted R Square 0.11155489
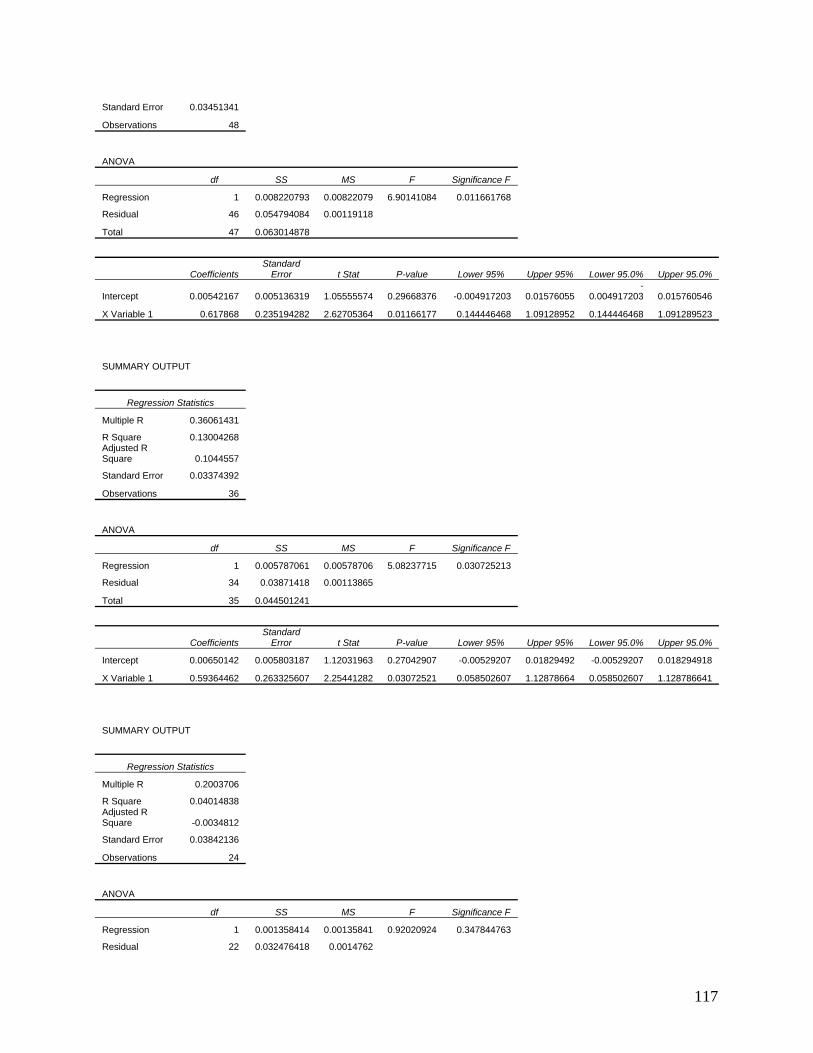
117
Standard Error 0.03451341
Observations 48
ANOVA
df SS MS F Significance F
Regression 1 0.008220793 0.00822079 6.90141084 0.011661768
Residual 46 0.054794084 0.00119118
Total 47 0.063014878
Coefficients Standard
Error t Stat P-value Lower 95% Upper 95% Lower 95.0% Upper 95.0%
Intercept 0.00542167 0.005136319 1.05555574 0.29668376 -0.004917203 0.01576055 -
0.004917203 0.015760546
X Variable 1 0.617868 0.235194282 2.62705364 0.01166177 0.144446468 1.09128952 0.144446468 1.091289523
SUMMARY OUTPUT
Regression Statistics
Multiple R 0.36061431
R Square 0.13004268 Adjusted R Square 0.1044557
Standard Error 0.03374392
Observations 36
ANOVA
df SS MS F Significance F
Regression 1 0.005787061 0.00578706 5.08237715 0.030725213
Residual 34 0.03871418 0.00113865
Total 35 0.044501241
Coefficients Standard
Error t Stat P-value Lower 95% Upper 95% Lower 95.0% Upper 95.0%
Intercept 0.00650142 0.005803187 1.12031963 0.27042907 -0.00529207 0.01829492 -0.00529207 0.018294918
X Variable 1 0.59364462 0.263325607 2.25441282 0.03072521 0.058502607 1.12878664 0.058502607 1.128786641
SUMMARY OUTPUT
Regression Statistics
Multiple R 0.2003706
R Square 0.04014838 Adjusted R Square -0.0034812
Standard Error 0.03842136
Observations 24
ANOVA
df SS MS F Significance F
Regression 1 0.001358414 0.00135841 0.92020924 0.347844763
Residual 22 0.032476418 0.0014762

118
Total 23 0.033834832
Coefficients Standard
Error t Stat P-value Lower 95% Upper 95% Lower 95.0% Upper 95.0%
Intercept 0.01192293 0.008255068 1.44431675 0.16274194 -0.00519703 0.0290429 -0.00519703 0.029042897
X Variable 1 0.37525802 0.391189048 0.95927537 0.34784476 -0.436018408 1.18653445 -
0.436018408 1.186534448

119
Summary Output for 3 years Regression:
Regression Statistics
Multiple R 0.33342359
R Square 0.11117129 Adjusted R Square
0.098473737
Standard Error 0.04157844
2
Observations 72
ANOVA
df SS MS F Significance
F
Regression 1 0.01513592
7 0.0151359
3 8.75533186
9 0.004208904
Residual 70 0.12101367
9 0.0017287
7
Total 71 0.13614960
6
Coefficients Standard
Error t Stat P-value Lower 95% Upper 95% Lower 95.0%
Upper 95.0%
Intercept 0.00257862
4 0.00497019
8 0.5188171
5 0.60552461
4 -
0.007334123 0.01249137
1
-0.00733412
3 0.01249137
1
X Variable 1 0.41967605
5 0.14183319
5 2.958941 0.00420890
4 0.136798672 0.70255343
8 0.13679867
2 0.70255343
8
SUMMARY OUTPUT
Regression Statistics
Multiple R 0.43536422
3
R Square 0.18954200
6 Adjusted R Square
0.175568593
Standard Error 0.03631006
6
Observations 60
ANOVA
df SS MS F Significance
F
Regression 1 0.01788368
6 0.0178836
9 13.5644739
8 0.00050795
Residual 58 0.07646841 0.0013184
2
Total 59 0.09435209
6
Coefficients Standard
Error t Stat P-value Lower 95% Upper 95% Lower 95.0%
Upper 95.0%
Intercept 0.00320077
3 0.00500351
7 0.6397047
2 0.52488343
7 -
0.006814854 0.01321640
1
-0.00681485
4 0.01321640
1
X Variable 1 0.66695586
6 0.18109047
9 3.6829979
6 0.00050795 0.30446389 1.02944784
2 0.30446389 1.02944784
2
SUMMARY OUTPUT
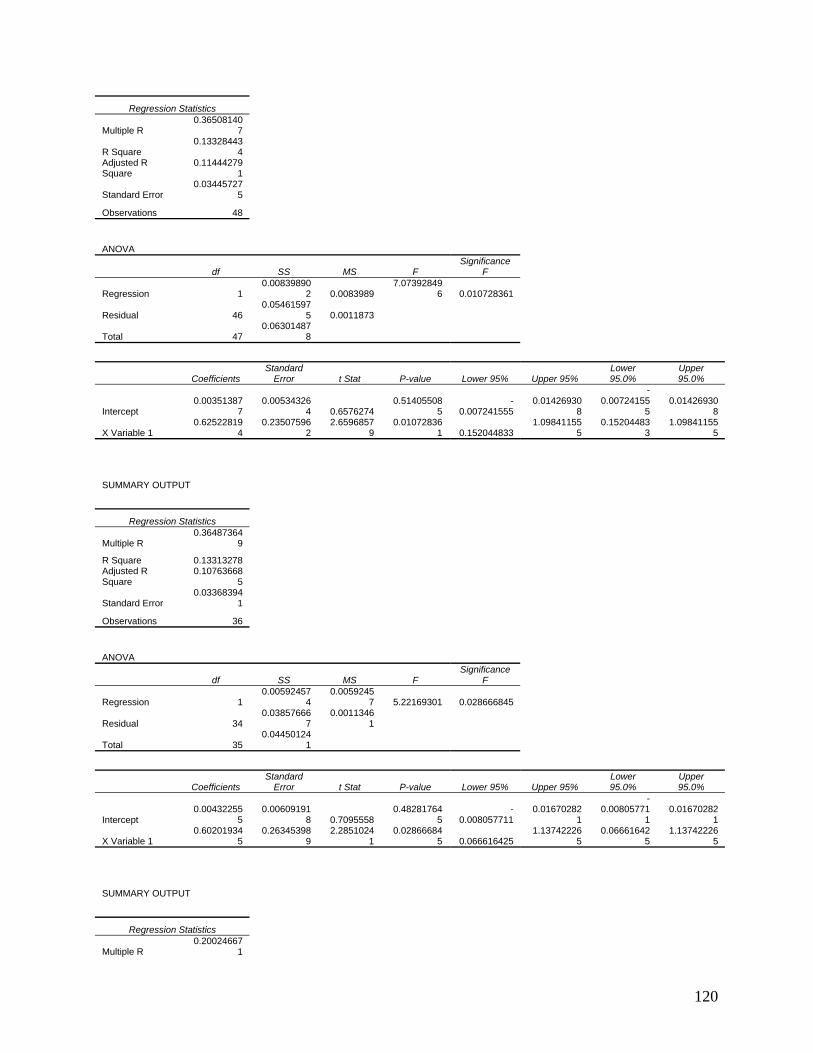
120
Regression Statistics
Multiple R 0.36508140
7
R Square 0.13328443
4 Adjusted R Square
0.114442791
Standard Error 0.03445727
5
Observations 48
ANOVA
df SS MS F Significance
F
Regression 1 0.00839890
2 0.0083989 7.07392849
6 0.010728361
Residual 46 0.05461597
5 0.0011873
Total 47 0.06301487
8
Coefficients Standard
Error t Stat P-value Lower 95% Upper 95% Lower 95.0%
Upper 95.0%
Intercept 0.00351387
7 0.00534326
4 0.6576274 0.51405508
5 -
0.007241555 0.01426930
8
-0.00724155
5 0.01426930
8
X Variable 1 0.62522819
4 0.23507596
2 2.6596857
9 0.01072836
1 0.152044833 1.09841155
5 0.15204483
3 1.09841155
5
SUMMARY OUTPUT
Regression Statistics
Multiple R 0.36487364
9
R Square 0.13313278 Adjusted R Square
0.107636685
Standard Error 0.03368394
1
Observations 36
ANOVA
df SS MS F Significance
F
Regression 1 0.00592457
4 0.0059245
7 5.22169301 0.028666845
Residual 34 0.03857666
7 0.0011346
1
Total 35 0.04450124
1
Coefficients Standard
Error t Stat P-value Lower 95% Upper 95% Lower 95.0%
Upper 95.0%
Intercept 0.00432255
5 0.00609191
8 0.7095558 0.48281764
5 -
0.008057711 0.01670282
1
-0.00805771
1 0.01670282
1
X Variable 1 0.60201934
5 0.26345398
9 2.2851024
1 0.02866684
5 0.066616425 1.13742226
5 0.06661642
5 1.13742226
5
SUMMARY OUTPUT
Regression Statistics
Multiple R 0.20024667
1

121
R Square 0.04009872
9 Adjusted R Square -0.00353315
Standard Error 0.03842235
3
Observations 24
ANOVA
df SS MS F Significance
F
Regression 1 0.00135673
4 0.0013567
3 0.91902372
8 0.348149241
Residual 22 0.03247809
8 0.0014762
8
Total 23 0.03383483
2
Coefficients Standard
Error t Stat P-value Lower 95% Upper 95% Lower 95.0%
Upper 95.0%
Intercept 0.01041089 0.00887570
2 1.1729651
9 0.25335392
7 -0.00799619 0.02881796
9 -0.00799619 0.02881796
9
X Variable 1 0.37630349
8 0.39253184
2 0.9586572
5 0.34814924
1 -
0.437757715 1.19036471
-0.43775771
5 1.19036471

122
Summary Output for 5 year Regression:
Regression Statistics
Multiple R 0.3320197
6
R Square 0.1102371
2 Adjusted R Square
0.09752622
Standard Error 0.0416002
9
Observations 72
ANOVA
df SS MS F Significance
F
Regression 1 0.01500874 0.01500874 8.67264587 0.00438182
7
Residual 70 0.12114086
6 0.00173058
4
Total 71 0.13614960
6
Coefficients Standard
Error t Stat P-value Lower 95% Upper 95% Lower 95.0%
Upper 95.0%
Intercept 0.0039553
1 0.00491646
8 0.80450308
6 0.42383044
-0.00585027
3 0.0137609
-0.00585027
3 0.0137609
X Variable 1 0.4163288
4 0.14137111
7 2.94493563
1 0.004381827 0.13437304
1 0.69828463
7 0.13437304
1 0.69828463
7
SUMMARY OUTPUT
Regression Statistics
Multiple R 0.4343632
5
R Square 0.1886714
3 Adjusted R Square
0.17468301
Standard Error 0.0363295
6
Observations 60
ANOVA
df SS MS F Significance
F
Regression 1 0.01780154
5 0.01780154
5 13.48768383 0.00052505
8
Residual 58 0.07655055
1 0.00131983
7
Total 59 0.09435209
6
Coefficients Standard
Error t Stat P-value Lower 95% Upper 95% Lower 95.0%
Upper 95.0%
Intercept 0.0053803
8 0.00483173
6 1.11355055
5 0.270065675
-0.00429138
8 0.01505215
4
-0.00429138
8 0.01505215
4
X Variable 1 0.6628582
1 0.18048950
3 3.67255821
3 0.000525058 0.30156921
6 1.0241472 0.30156921
6 1.0241472
SUMMARY OUTPUT

123
Regression Statistics
Multiple R 0.3640733
7
R Square 0.1325494
2 Adjusted R Square 0.1136918
Standard Error 0.0344718
8
Observations 48
ANOVA
df SS MS F Significance
F
Regression 1 0.00835258
5 0.00835258
5 7.028957399 0.01096374
7
Residual 46 0.05466229
2 0.00118831
1
Total 47 0.06301487
8
Coefficients Standard
Error t Stat P-value Lower 95% Upper 95% Lower 95.0%
Upper 95.0%
Intercept 0.0056751 0.00510546
6 1.11157308
3 0.272097852
-0.00460167
2 0.01595186
9
-0.00460167
2 0.01595186
9
X Variable 1 0.6221678
7 0.23467245
9 2.65121809
7 0.010963747 0.14979671
8 1.09453902
2 0.14979671
8 1.09453902
2
SUMMARY OUTPUT
Regression Statistics
Multiple R 0.3633691
7
R Square 0.1320371
6 Adjusted R Square
0.10650884
Standard Error 0.0337052
2
Observations 36
ANOVA
df SS MS F Significance
F
Regression 1 0.00587581
7 0.00587581
7 5.172183749 0.02938054
Residual 34 0.03862542
4 0.00113604
2
Total 35 0.04450124
1
Coefficients Standard
Error t Stat P-value Lower 95% Upper 95% Lower 95.0%
Upper 95.0%
Intercept 0.0065398 0.00578975
9 1.12954687
9 0.266573568
-0.00522640
2 0.01830601
1
-0.00522640
2 0.01830601
1
X Variable 1 0.5975265
1 0.26273637
8 2.27424355
5 0.02938054 0.06358195
6 1.13147107
4 0.06358195
6 1.13147107
4
SUMMARY OUTPUT

124
Regression Statistics
Multiple R 0.2016909
R Square 0.0406792
2
Adjusted R Square
-0.0029262
7
Standard Error 0.0384107
3
Observations 24
ANOVA
df SS MS F Significance
F
Regression 1 0.00137637
5 0.00137637
5 0.932892187 0.34461081
8
Residual 22 0.03245845
7 0.00147538
4
Total 23 0.03383483
2
Coefficients Standard
Error t Stat P-value Lower 95% Upper 95% Lower 95.0%
Upper 95.0%
Intercept 0.0118638
3 0.00826673 1.43512920
6 0.165315371
-0.00528032
3 0.02900797
3
-0.00528032
3 0.02900797
3
X Variable 1 0.3770760
3 0.39040304
4 0.96586344
1 0.344610818
-0.43257032
8 1.18672238
4
-0.43257032
8 1.18672238
4

125
Summary Output for 7 years Regression:
Regression Statistics
Multiple R 0.3324827
R Square 0.1105447 Adjusted R Square 0.0978382
Standard Error 0.0415931
Observations 72
ANOVA
df SS MS F Significance
F
Regression 1 0.015050619 0.01505062 8.699852584 0.004324125
Residual 70 0.121098987 0.00172999
Total 71 0.136149606
Coefficients Standard
Error t Stat P-value Lower 95% Upper 95% Lower 95.0% Upper 95.0%
Intercept 0.0040547 0.004913173 0.82526785 0.412023183 -
0.005744331 0.013853699 -
0.005744331 0.013853699
X Variable 1 0.4168339 0.141321135 2.94955125 0.004324125 0.134977818 0.698690043 0.134977818 0.698690043
SUMMARY OUTPUT
Regression Statistics
Multiple R 0.4346462
R Square 0.1889173 Adjusted R Square 0.1749331
Standard Error 0.0363241
Observations 60
ANOVA
df SS MS F Significance
F
Regression 1 0.017824741 0.01782474 13.5093522 0.00052017
Residual 58 0.076527355 0.00131944
Total 59 0.094352096
Coefficients Standard
Error t Stat P-value Lower 95% Upper 95% Lower 95.0% Upper 95.0%
Intercept 0.0055178 0.004821982 1.14429281 0.257202748 -
0.004134486 0.015170006 -
0.004134486 0.015170006
X Variable 1 0.6636547 0.180561412 3.67550707 0.00052017 0.302221813 1.025087676 0.302221813 1.025087676
SUMMARY OUTPUT
Regression Statistics
Multiple R 0.3645577
R Square 0.1329023 Adjusted R Square 0.1140523

126
Standard Error 0.0344649
Observations 48
ANOVA
df SS MS F Significance
F
Regression 1 0.008374821 0.00837482 7.05053793 0.010850112
Residual 46 0.054640056 0.00118783
Total 47 0.063014878
Coefficients Standard
Error t Stat P-value Lower 95% Upper 95% Lower 95.0% Upper 95.0%
Intercept 0.0057642 0.005096683 1.13096721 0.263931022 -
0.004494909 0.016023271 -
0.004494909 0.016023271
X Variable 1 0.6230428 0.234642549 2.65528491 0.010850112 0.150731872 1.095353766 0.150731872 1.095353766
SUMMARY OUTPUT
Regression Statistics
Multiple R 0.3638731
R Square 0.1324036 Adjusted R Square 0.1068861
Standard Error 0.0336981
Observations 36
ANOVA
df SS MS F Significance
F
Regression 1 0.005892126 0.00589213 5.188729985 0.029139883
Residual 34 0.038609115 0.00113556
Total 35 0.044501241
Coefficients Standard
Error t Stat P-value Lower 95% Upper 95% Lower 95.0% Upper 95.0%
Intercept 0.0065737 0.005784493 1.13642674 0.263724715 -
0.005181851 0.018329156 -
0.005181851 0.018329156
X Variable 1 0.5985578 0.262769886 2.2778784 0.029139883 0.064545191 1.132570502 0.064545191 1.132570502
SUMMARY OUTPUT
Regression Statistics
Multiple R 0.2019222
R Square 0.0407726 Adjusted R Square -0.0028287
Standard Error 0.0384089
Observations 24
ANOVA
df SS MS F Significance
F
Regression 1 0.001379533 0.00137953 0.935124048 0.344046128

127
Residual 22 0.032455299 0.00147524
Total 23 0.033834832
Coefficients Standard
Error t Stat P-value Lower 95% Upper 95% Lower 95.0% Upper 95.0%
Intercept 0.0118681 0.008263963 1.43613257 0.165032745 -
0.005270264 0.029006557 -
0.005270264 0.029006557
X Variable 1 0.3775847 0.39046293 0.96701812 0.344046128 -
0.432185821 1.187355279 -
0.432185821 1.187355279

128
Summary Output for 10 years Regression:
Regression Statistics
Multiple R 0.33283841
R Square 0.11078141 Adjusted R Square 0.09807828
Standard Error 0.04158756
Observations 72
ANOVA
df SS MS F Significance
F
Regression 1 0.015082845 0.0150828 8.72080108 0.004280236
Residual 70 0.121066761 0.0017295
Total 71 0.136149606
Coefficients Standard
Error t Stat P-value Lower 95% Upper 95% Lower 95.0% Upper 95.0%
Intercept 0.00414008 0.004910615 0.8430871 0.4020514 -
0.005653837 0.013933989 -
0.005653837 0.013933989
X Variable 1 0.41737099 0.141333161 2.9531002 0.00428024 0.135490895 0.699251089 0.135490895 0.699251089
SUMMARY OUTPUT
Regression Statistics
Multiple R 0.43498746
R Square 0.18921409 Adjusted R Square 0.17523502
Standard Error 0.03631741
Observations 60
ANOVA
df SS MS F Significance
F
Regression 1 0.017852746 0.0178527 13.5355301 0.000514329
Residual 58 0.07649935 0.001319
Total 59 0.094352096
Coefficients Standard
Error t Stat P-value Lower 95% Upper 95% Lower 95.0% Upper 95.0%
Intercept 0.00564822 0.004812767 1.1735917 0.24535547 -
0.003985576 0.015282022 -
0.003985576 0.015282022
X Variable 1 0.66456822 0.180635014 3.6790665 0.00051433 0.302987961 1.026148486 0.302987961 1.026148486
SUMMARY OUTPUT
Regression Statistics
Multiple R 0.36505652
R Square 0.13326626 Adjusted R Square 0.11442422

129
Standard Error 0.03445764
Observations 48
ANOVA
df SS MS F Significance
F
Regression 1 0.008397757 0.0083978 7.07281569 0.01073412
Residual 46 0.054617121 0.0011873
Total 47 0.063014878
Coefficients Standard
Error t Stat P-value Lower 95% Upper 95% Lower 95.0% Upper 95.0%
Intercept 0.00585903 0.005087653 1.1516172 0.25542894 -
0.004381885 0.016099942 -
0.004381885 0.016099942
X Variable 1 0.62392236 0.234603442 2.6594766 0.01073412 0.151690132 1.09615459 0.151690132 1.09615459
SUMMARY OUTPUT
Regression Statistics
Multiple R 0.36453186
R Square 0.13288347 Adjusted R Square 0.10738005
Standard Error 0.03368878
Observations 36
ANOVA
df SS MS F Significance
F
Regression 1 0.00591348 0.0059135 5.21041637 0.02882772
Residual 34 0.038587761 0.0011349
Total 35 0.044501241
Coefficients Standard
Error t Stat P-value Lower 95% Upper 95% Lower 95.0% Upper 95.0%
Intercept 0.00661857 0.005777625 1.1455518 0.25998012 -
0.005122978 0.018360114 -
0.005122978 0.018360114
X Variable 1 0.59983644 0.262782616 2.2826336 0.02882772 0.065797916 1.133874966 0.065797916 1.133874966
SUMMARY OUTPUT
Regression Statistics
Multiple R 0.20229437
R Square 0.04092301 Adjusted R Square -0.0026714
Standard Error 0.03840585
Observations 24
ANOVA
df SS MS F Significance
F
Regression 1 0.001384623 0.0013846 0.93872155 0.343138657
Residual 22 0.032450209 0.001475

130
Total 23 0.033834832
Coefficients Standard
Error t Stat P-value Lower 95% Upper 95% Lower 95.0% Upper 95.0%
Intercept 0.0118796 0.008258076 1.4385428 0.16435543 -
0.005246605 0.029005795 -
0.005246605 0.029005795
X Variable 1 0.37842671 0.390583046 0.9688764 0.34313866 -
0.431592945 1.188446365 -
0.431592945 1.188446365

131
Cost of Debt: P/B = 1 + (ROE – Ke/ Ke – g) 33.874/5.77 = 1 + (.4 – Ke/Ke - .054) Ke = 11.293% Weighted Average Cost of Capital- WACC:
• WAAC (Before Tax) = Vd/Vf * Kd + Ve/Vf * Ke o = $8,191,343/$10,033,026 * 5.649193% +
$1,841,683/$10,033,026 * 11.293% = 2.5342% • WAAC (After Tax) = Vd/Vf * Kd (1-T) + Ve/Vf * Ke
o = $8,191,343/$10,033,026 * 5.649193% (1-.35) + $1,841,683/$10,033,026 * 11.293% = 2.3728%

132
Discounted Dividends Model:
Discounted Dividends Approach WACC(BT) 2.5342% Kd 3.67198% Ke 11.2930% 319.15 0 1 2 3 4 5 6 7 8 9 10 2007 2008 2009 2010 2011 2012 2013 2014 2015 2016 2017 Earnings 785.75 759.04 800.06 843.30 888.87 936.90 987.53 1040.90 1097.14 1156.43 1218.92 Dividends $461.24 $494.68 $542.56 $590.43 $638.30 $686.17 $734.05 $781.92 $829.79 $877.66 $925.54 687.48 Book Value of Equity $1,841.68 2106.04 2363.55 2616.42 2866.99 3117.71 3371.20 3630.18 3897.53 4176.30 4469.68 Cash From Operations- in millions $1,082.25 $1,140.73 $1,202.38 $1,267.35 $1,335.84 $1,408.02 $1,484.11 $1,564.31 $1,648.84 $1,737.94 Cash Investments- in millions- outflow 423 446 470 496 522 551 580 612 645 680 PV Factor 0.899 0.807 0.725 0.652 0.586 0.526 0.473 0.425 0.382 0.343 PV Dividends Year by Year 444.487 438.034 428.315 416.058 401.878 386.292 369.731 352.554 335.056 317.479 Total PV of Annual Dividends 3889.88 Continuing (Terminal) Value Perpetuity $6,087.70 PV of Terminal Value Perpetuity $2,088.21 Estimated Price per Share (end of 2007) 18.73 Time Consistency- Imp as of 5/1/07 $19.76 Observed Share Price $45.61 Initial Cost of Equity 0.11293 Perpetuity Growth Rate (g) 0
OUR ASSUMPTIONS: WACC(BT) = 2.5342%, Kd = 3.67198%, Ke = 11.293%, 319.15 million SHARES OUTSTANDING, HAVE A DIVIDEND INCREASE OF 15 CENTS PER YEAR
Sensitivity Analysis: Growth
0 0.03 0.054 0.07 0.09
Cost of Equity 0.07 $31.74 $43.88 $86.36 N/A N/A 0.09 $24.76 $30.04 $40.59 $61.70 N/A 0.11293 $19.76 $22.26 $26.09 $31.02 $46.85 0.13 $17.17 $18.73 $20.86 $23.23 $28.85
0.15 $14.88 $15.83 $17.02 $18.21 $20.59

133
Free Cash Flows Model:
WACC(BT) 2.5342% Kd 3.67198% Ke 11.2930% 0 1 2 3 4 5 6 7 8 9 10 2007 2008 2009 2010 2011 2012 2013 2014 2015 2016 2017 Earnings 785.75 759.04 800.06 843.30 888.87 936.90 987.53 1040.90 1097.14 1156.43 1218.92 Dividends $461.24 $494.68 $542.56 $590.43 $638.30 $686.17 $734.05 $781.92 $829.79 $877.66 $925.54 Book Value of Equity $1,841.68 2106.04 2363.55 2616.42 2866.99 3117.71 3371.20 3630.18 3897.53 4176.30 4469.68 Cash From Operations $1,082.25 $1,140.73 $1,202.38 $1,267.35 $1,335.84 $1,408.02 $1,484.11 $1,564.31 $1,648.84 $1,737.94 Cash Investments 423 446 470 496 522 551 580 612 645 680 Book Value of Debt and Preferred Stock $8,191.42 Annual Free Cash Flow $659 $695 $732 $772 $813 $857 $904 $953 $1,004 $1,058 $845 PV Factor 0.899 0.807 0.725 0.652 0.586 0.526 0.473 0.425 0.382 0.343 PV of Free Cash Flows $592 $561 $531 $503 $476 $451 $427 $405 $383 $363 Total PV of Annual Free Cash Flows $4,693
Continuing (Terminal) Value Perpetuity $ 33,334
PV of Terminal Value Perpetuity $ 11,434
Value of Firm $16,128
Book Value of Liabilities $8,191.42 g
Estimated Market Value of Equity $7,936 Number of Shares 319.15 0 0.02 0.054 0.07 0.09 Estimated Price per Share (end of 2007) $24.87 0 N/A N/A N/A N/A N/A FV of Time consistent model $25.18 0.01 80.23 N/A N/A N/A N/A WACC 0.0253 25.24 162.37 N/A N/A N/A Observed Share Price $45.61 0.03 19.59 81.02 N/A N/A N/A Initial WACC 2.5342% 0.04 11.97 35.12 N/A N/A N/A Perpetuity Growth Rate (g) 0.0%
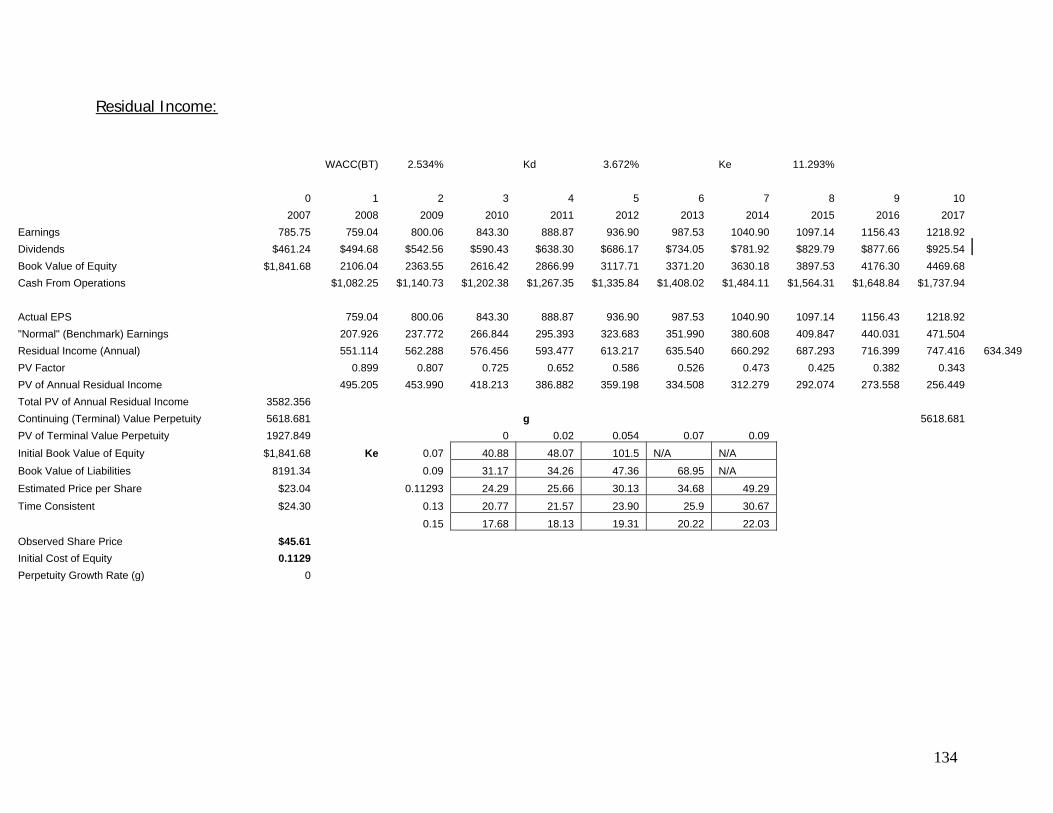
134
Residual Income:
WACC(BT) 2.534% Kd 3.672% Ke 11.293% 0 1 2 3 4 5 6 7 8 9 10 2007 2008 2009 2010 2011 2012 2013 2014 2015 2016 2017 Earnings 785.75 759.04 800.06 843.30 888.87 936.90 987.53 1040.90 1097.14 1156.43 1218.92 Dividends $461.24 $494.68 $542.56 $590.43 $638.30 $686.17 $734.05 $781.92 $829.79 $877.66 $925.54 Book Value of Equity $1,841.68 2106.04 2363.55 2616.42 2866.99 3117.71 3371.20 3630.18 3897.53 4176.30 4469.68 Cash From Operations $1,082.25 $1,140.73 $1,202.38 $1,267.35 $1,335.84 $1,408.02 $1,484.11 $1,564.31 $1,648.84 $1,737.94 Actual EPS 759.04 800.06 843.30 888.87 936.90 987.53 1040.90 1097.14 1156.43 1218.92 "Normal" (Benchmark) Earnings 207.926 237.772 266.844 295.393 323.683 351.990 380.608 409.847 440.031 471.504 Residual Income (Annual) 551.114 562.288 576.456 593.477 613.217 635.540 660.292 687.293 716.399 747.416 634.349 PV Factor 0.899 0.807 0.725 0.652 0.586 0.526 0.473 0.425 0.382 0.343 PV of Annual Residual Income 495.205 453.990 418.213 386.882 359.198 334.508 312.279 292.074 273.558 256.449 Total PV of Annual Residual Income 3582.356 Continuing (Terminal) Value Perpetuity 5618.681 g 5618.681 PV of Terminal Value Perpetuity 1927.849 0 0.02 0.054 0.07 0.09 Initial Book Value of Equity $1,841.68 Ke 0.07 40.88 48.07 101.5 N/A N/A Book Value of Liabilities 8191.34 0.09 31.17 34.26 47.36 68.95 N/A Estimated Price per Share $23.04 0.11293 24.29 25.66 30.13 34.68 49.29 Time Consistent $24.30 0.13 20.77 21.57 23.90 25.9 30.67 0.15 17.68 18.13 19.31 20.22 22.03 Observed Share Price $45.61 Initial Cost of Equity 0.1129 Perpetuity Growth Rate (g) 0

135
Long Run Return on Equity Residual Income Model:
Book Value of Equity 5.77 Long Run Return on Equity 0.2919 Long Run Growth Rate in Equity 0.054 Cost of Equity 0.11293 Estimated Price per Share (end of 2007) 23.29 Time Consistent Price 24.57 Observed Share Price $45.61 WACC(BT) 0.02534 Kd 0.0367 Ke 0.11293 0 1 2 3 4 5 6 7 8 9 10 2007 2008 2009 2010 2011 2012 2013 2014 205 2016 2017 Earnings 785.75 759.04 800.06 843.30 888.87 936.90 987.53 1040.90 1097.14 1156.43 1218.92 Dividends $461.24 $494.68 $542.56 $590.43 $638.30 $686.17 $734.05 $781.92 $829.79 $877.66 $925.54 Book Value of Equity $1,841.68 2106.04 2363.55 2616.42 2866.99 3117.71 3371.20 3630.18 3897.53 4176.30 4469.68 Return on Equity 41.21% 37.99% 35.68% 33.97% 32.68% 31.67% 30.88% 30.22% 29.67% 29.19% BVE Growth 14.35% 12.23% 10.70% 9.58% 8.75% 8.13% 7.68% 7.36% 7.15% 7.03% Average ROE 33.32% Average BE Growth 9.30%

136
g
0 0.03 0.054 0.07 0.09
Ke 0.07 $24.73 $38.80 $88.04 N/A N/A
0.09 $19.41 $26.10 $39.49 $ 66.26 N/A
0.11293 $15.63 $19.08 $24.38 $ 31.19
$ 53.09
0.13 $13.68 $15.95 $19.05 $ 22.49
$ 30.67
0.15 $11.96 $13.41 $15.21 $ 17.02
$ 20.63
ROE
0.25 0.27 0.2919 0.31 0.33
Ke 0.07 $73.11 $80.58 $88.74 $ 95.50
$ 102.96
0.09 $32.80 $36.14 $39.81 $ 42.84
$ 46.18
0.11293 $20.25 $22.31 $24.57 $ 26.44
$ 28.51
0.13 $15.82 $17.43 $19.20 $ 20.66
$ 22.27
0.15 $12.63 $13.92 $15.33 $ 16.50
$ 17.79
g
0 0.03 0.054 0.07 0.09
ROE 0.25 $13.48 $16.15 $20.25 $ 25.52
$ 42.47
0.27 $14.55 $17.62 $22.31 $ 28.36
$ 47.78
0.2919 $15.73 $19.22 $20.25 $ 31.46
$ 53.60
0.31 $16.71 $20.55 $24.57 $ 34.03
$ 58.40
0.33 $17.79 $22.02 $28.51 $ 36.87
$ 63.71

137
1 2 3 4 5 6 7 8 9 Perp
Forecast Years
2007 2008 2009 2010 2011 2012 2013 2014 2015 2016 2017 EPS 785.75 759.04 800.06 843.30 888.87 936.90 987.53 1040.90 1097.14 1156.43 1218.92 DPS $461.24 $494.68 $542.56 $590.43 $638.30 $686.17 $734.05 $781.92 $829.79 $877.66 $925.54 DPS invested at 15% (Drip) 55.865 61.271 66.677 72.083 77.490 82.896 88.302 93.708 99.114 Cum-Dividend Earnings $855.925 $904.571 $955.547 $1,008.983 $1,065.020 $1,123.796 $1,185.442 $1,250.138 $1,318.034 Normal Earnings $844.758 $890.411 $938.534 $989.250 $1,042.704 $1,099.052 $1,158.449 $1,221.040 $1,287.026 Abnormal Earning Growth (AEG) $11.17 $14.16 $17.01 $19.73 $22.32 $24.74 $26.99 $29.10 $31.01 $21.80
PV Factor $0.899 $0.807 $0.725 $0.652 $0.586 $0.526 $0.473 $0.425 $0.382 PV of AEG $10.033 $11.432 $12.342 $12.862 $13.070 $13.022 $12.764 $12.363 $11.838 Residual Income Check Figure $11.17 $14.17 $17.02 $19.74 $22.32 $24.75 $27.00 $29.11 $31.02
Core EPS $759.04 Total PV of AEG $109.73 Continuing (Terminal) Value $193.07 PV of Terminal Value $73.71 Total PV of AEG $183.43 Total Average EPS Perp (t+1) $942.47
Capitalization Rate (perpetuity) 0.11293 Intrinsic Value Per Share (end 1987) $26.15 time consistent implied price 27.59 Nov 1, 1988 observed price $45.61 Ke 0.11293 G 0 Sensitivity Actual Price per share $45.61 Growth
0 0.03 0.054 0.07 0.09
Ke 0.07 $56.59 $65.48 $96.58 N/A N/A
0.09 $38.48 $41.06 $46.22 $ 56.54 N/A
0.11293 $27.59 $28.37 $29.56 $ 31.10 $ 36.05
0.13 $22.61 $22.95 $23.42 $ 23.94 $ 25.18
0.15 $18.58 $18.71 $18.87 $ 19.04 $ 19.36
Abnormal Earnings Growth Model:

138
Methods of Comparables:
2007
Company EPS BPS DPS PPS share size
Heinz 2.46 5.77 1.49 45.61 319.15
Campbells 2.22 3.37 0.84 36.42 384.11
Sara Lee 0.70 3.61 0.40 16.06 724.53
Conagra 1.75 9.41 0.73 23.29 487.25
Company P/E Forward P/E trailing P/B D/P P.E.G. Heinz 19.16 18.53 7.90 0.03 2.45 Campbells 16.38 17.27 10.80 0.02 2.60 Sara Lee 23.09 33.33 4.45 0.02 2.42 Conagra 13.29 16.25 2.48 0.03 2.00
EBITDA P/EBITDA FCF P/FCF EV EV/EBITDA 1.76 25.91 4.46 10.24 19.63 11.15 1.15 31.67 3.96 9.20 16.73 11.08 1.37 11.72 -0.09 -187.68 14.05 10.26 1.80 12.94 0.86 26.99 15.46 8.59
2007 Actual Price $45.61 P/E Trailing $54.82 P/E Forward $36.76 P/B $30.79 D/P $14.37 P.E.G. $30.09 P/EBITDA $33.07 P/FCF $10.74 EV/EBITDA $54.03
139
References: 1. Heinz Website: www.heinz.com
2007 Annual Report
2003-2007 10K
2. Campbell’s Website: www.campbells.com
2003-2007 10K
3. ConAgra Website: www.conagrafoods.com
2003-2007 10K
4. Sara Lee Website: www.saralee.com
2003-2007 10K
5. Business Analysis and Valuation- Fourth Edition by Palepu and Healy
6. Investor Words: www.investorwords.com
7. http://beginnersinvest.about.com
8. http://pages.stern.nyu.edu
9. Yahoo Finance: www.finance.yahoo.com
10. ES3 LLC.: www.es3.com
11. www.investopedia.com
12. www.answers.com
13. research.stlouisfed.org/fred2