Embed Size (px)
Citation preview
20
GNGTS 2014 sessione 1.1
EStIMAtInG thE EXPECtEd SEISMICIty RAtES of voLCAno-tECtonIC EARthqUAkES At Mt. EtnA �ItALy�� by A GEoMEtRIC-kInEMAtIC APPRoAChEtnA �ItALy�� by A GEoMEtRIC-kInEMAtIC APPRoAChR. Azzaro1, S. D’Amico1, B. Pace2, L. Peruzza3
1 INGV Istituto Nazionale di Geofisica e Vulcanologia, Osservatorio Etneo, Catania, Italy2 DiSPUTer Università degli Studi “G. d’Annunzio”, Chieti-Pescara, Italy3 OGS Istituto Nazionale di Oceanografia e di Geofisica Sperimentale, Sgonico (TS), Italy
Introduction. Seismic hazard studies have been undertaken at Etna volcano in the lastSeismic hazard studies have been undertaken at Etna volcano in the last years with the aim of estimating the potential of local fault’s activity in generating destructive earthquakes. The target is the mid-term assessment (30, 20, 10 and 5 yrs), as the identification of zones that are exposed to the recurrent seismic shaking may be important for land planning at a local scale, and it represents a valuable complement to establish priority criteria for seismic risk reduction action.
The methodologies applied at Mt. Etna area include probabilistic approaches based on the use of historical macroseismic data (the “site approach” by the software code SASHA, see Azzaro et al., 2008) and fault-based time-dependent models in which occurrence probabilities of major earthquakes are estimated through the Brownian Passage Time (BPT) function and the time lapsed since the last event (Azzaro et al., 2012b, 2013b). Mean return period of major earthquakes - strong to destructive events with epicentral intensity I0 ≥ VIII EMS, considered as “proxies” of “characteristic” earthquakes – have been obtained by the fault seismic histories, i.e. the associations “earthquake-seismogenic fault” derived from the historical catalogue of Etnean earthquakes (CMTE Working Group, 2014). Inter-time statistics of major earthquakes have been applied to the Timpe tectonic system, considered as a homogeneous seismotectonic domain (Azzaro et al., 2013b), obtaining a mean recurrence time (Tmean) of 71.3 years, and an aperiodicity factor α (σTmean/Tmean) = 0.42, typical of semi-periodic processes.
In the present study we present the preliminary results of an analysis aimed at verifying the variability of the mean occurrence times of major earthquakes generated by the main tectonic systems at Etna (Pernicana and Timpe faults) by using a geological approach based on geometric-kinematic parameters (3D dimensions, slip-rates etc) representative of fault activity.
Method and input data. The analysis has been carried out through the software codeThe analysis has been carried out through the software code ErrorProPAgAtion (hereinafter EP), a Matlab® routine produced in the framework of the projects DPC-INGV S2 in order to quantify the seismic activity from geometry and slip-rates of a fault (Peruzza et al., 2010; Pace et al., 2013). We used the Beta version 0.15 implemented for this work with new earthquake scaling relationships for volcanic contexts.
The adopted approach is based on the assumption of seismic moment conservation. It imposes the condition that the total amount of seismic moment released by an individual seismogenic fault does not exceed the seismic moment released by the maximum expected magnitude alone. The budget is obtained by fixing the seismic moment rate of the maximum expected earthquake and by scaling the occurrence of each magnitude class properly, and can be adopted for both gaussian and G-R linear distributions.
In the probabilistic procedure for calculating the seismic hazard, the mean recurrence time (Tmean) of the maximum magnitude (Mmax) expected on a fault, together with the quantification of its variability, are the basic ingredients to compute occurrence earthquake probabilities, both under Poissonian assumptions as well as in a time-dependent perspective. The best situation for a given fault segment is to have a long list of associated events, so that mean and variability derive directly from observations. The real situations in Italy of multiple characteristic events occurring on the same fault segment are definitely few, mostly represented by recent active sources along the central Apennines (e.g., Paganica fault, Galli et al., 2010; Cinti et al., 2011; Moro et al., 2013). More favourable conditions are present at Etna, where some ten major earthquakes (M
l 4.3-5.2) repeatedly occurred along fault segments of the Timpe system (Azzaro
et al., 2012b).
001-260 volume 1 20 24-10-2014 16:52:05

GNGTS 2014 sessione 1.1
21
A widely used practice invokes the criterion of “segment seismic moment conservation” proposed by Field et al. (1999), where the Tmean can be obtained by estimating the Mmax, provided that three-dimensional geometry and slip rate of a seismogenic structure are known. Peruzza et al. (2010) extended this approach by introducing the estimated Tmean and α via errors propagation which occur in estimating maximum magnitude and slip-rate. Applying this methodology, Peruzza et al. (2011) demonstrated that the probability of occurrence of an event with M> 6 for the Paganica fault before the April 6, 2009 earthquake, considering an exposure time of 5 years, was the highest of central Apennines (~3.5%).
Actually the EP code uses as input information for each seismogenic source the following parameters:
1) fault name,2) kinematics, 3) length along strike, 4) width along dip,5) minimum and maximum slip-rate,6) observed characteristic/maximum magnitude (optional),7) standard deviation of the observed characteristic/maximum magnitude (optional),8) elapsed time since the last characteristic/maximum earthquake (optional).In detail the code uses different empirical and analytical relationships between the geometry
of each input source and the characteristics of the expected earthquake, in order to quantify several values of Mmax and associated Tmean. The EP code, therefore, formally propagates the errors of magnitude and slip-rate obtaining, for each seismogenic source, the most likely value of recurrence interval and the associated error. Finally, it uses the selected values to calculate the hazard rates, for a given exposure time, following a BPT probability density function (time-dependent) and a Poissonian distribution.
Fault parameters and earthquake scaling relationships. The analysis and integration ofThe analysis and integration of different types of data such as tectonics, active faulting and long-term seismicity have produced a first seismotectonic model of the Etna region including information on segmentation, kinematics and seismic behaviour (Azzaro, 2004). Later, geometry and slip-rates of active faults have been constrained by geological/geomorphological field investigations (Azzaro et al., 2012a), while geodetic data modelling provided information on the extension at depth of faults as well as slip-rates and kinematics in the short-term (Azzaro et al., 2013a). Finally, the magnitude of the historical earthquakes has been calibrated by means of newnew ad-hoc relationships in terms of M
l
and Mw (Azzaro et al., 2011). In short, most of the input parameters needed for the EP code are
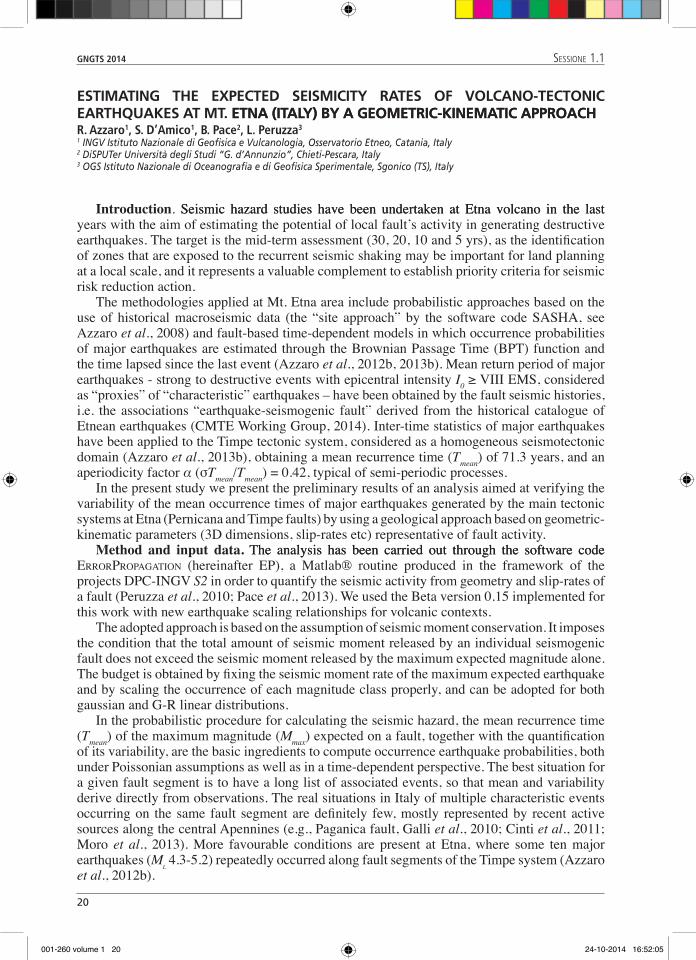
available. A scheme of the faults considered in our analysis is shown in Fig. 1, while the values of
input parameters are reported in Tab. 1.
Tab. 1 - Fault and seismic parameters used in the analysis. Abbreviations: FF = Fiandaca fault; STF = S. Tecla fault; SVF = S. Venerina fault; MF = Moscarello fault; SLF = S. Leonardello fault; PF2 = Pernicana fault, central segment; kinematics 8 = extensional volcanic context.
Fault Kinematics Length Width Min slip-rate Max slip-rate Mmax σ Elapsed time (km) (km) (mm/yr) (mm/yr) (observed) Mmax (yrs)
FF � �.� 3.� 0.� 1.1 4.� 0.3� 120
STF � �.� � 4.2 4.4 �.3 0.3� 100
SVF � �.� � 0.� 1.1 4.� 0.3� 13�
MF � � 3.� 1.4 2.� �.1 0.3� 14�
SLF � 4 3.� 2.� 2.� 4.4 0.3� 113
PF2 � 4.� �.� 3.3 �.2 4.3 0.3 4
001-260 volume 1 21 24-10-2014 16:52:05
22
GNGTS 2014 sessione 1.1
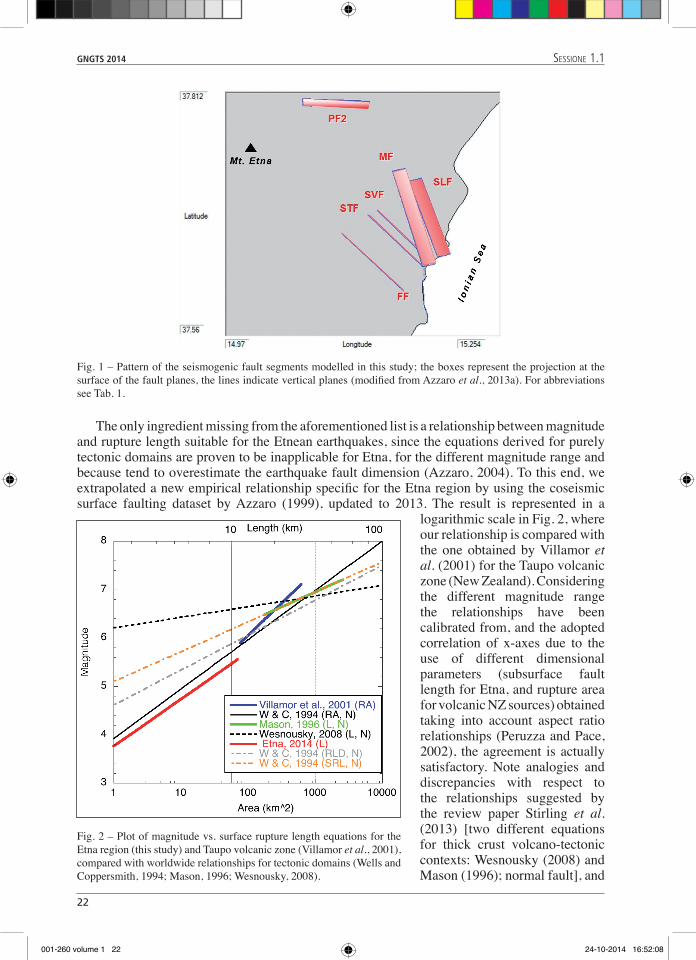
The only ingredient missing from the aforementioned list is a relationship between magnitude and rupture length suitable for the Etnean earthquakes, since the equations derived for purely tectonic domains are proven to be inapplicable for Etna, for the different magnitude range and because tend to overestimate the earthquake fault dimension (Azzaro, 2004). To this end, we extrapolated a new empirical relationship specific for the Etna region by using the coseismic surface faulting dataset by Azzaro (1999), updated to 2013. The result is represented in a
logarithmic scale in Fig. 2, where our relationship is compared with the one obtained by Villamor et al. (2001) for the Taupo volcanic zone (New Zealand). Considering the different magnitude range the relationships have been calibrated from, and the adopted correlation of x-axes due to the use of different dimensional parameters (subsurface fault length for Etna, and rupture area for volcanic NZ sources) obtained taking into account aspect ratio relationships (Peruzza and Pace, 2002), the agreement is actually satisfactory. Note analogies and discrepancies with respect to the relationships suggested by the review paper Stirling et al. (2013) [two different equations for thick crust volcano-tectonic contexts: Wesnousky (2008) and Mason (1996); normal fault], and
Fig. 1 – Pattern of the seismogenic fault segments modelled in this study; the boxes represent the projection at the surface of the fault planes, the lines indicate vertical planes (modified from Azzaro et al., 2013a). For abbreviations see Tab. 1.
Fig. 2 – Plot of magnitude vs. surface rupture length equations for the Etna region (this study) and Taupo volcanic zone (Villamor et al., 2001), compared with worldwide relationships for tectonic domains (Wells and Coppersmith, 1994; Mason, 1996; Wesnousky, 2008).
001-260 volume 1 22 24-10-2014 16:52:08

GNGTS 2014 sessione 1.1
23
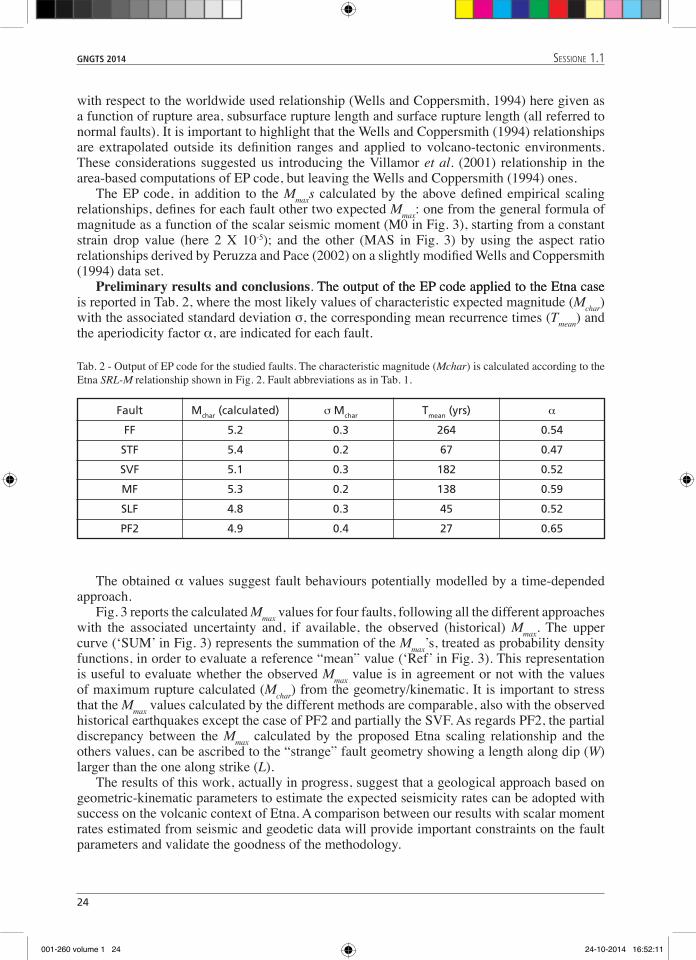
Fig. 3 – Maximum magnitudes (Mmax) estimated by the EP code for some of the studied faults (abbreviations as in Tab. 1); the dimensions of the curves are in agreement with the relative uncertainties.
001-260 volume 1 23 24-10-2014 16:52:11
24
GNGTS 2014 sessione 1.1
with respect to the worldwide used relationship (Wells and Coppersmith, 1994) here given as a function of rupture area, subsurface rupture length and surface rupture length (all referred to normal faults). It is important to highlight that the Wells and Coppersmith (1994) relationships are extrapolated outside its definition ranges and applied to volcano-tectonic environments. These considerations suggested us introducing the Villamor et al. (2001) relationship in the area-based computations of EP code, but leaving the Wells and Coppersmith (1994) ones.
The EP code, in addition to the Mmaxs calculated by the above defined empirical scaling relationships, defines for each fault other two expected Mmax: one from the general formula of magnitude as a function of the scalar seismic moment (M0 in Fig. 3), starting from a constant strain drop value (here 2 X 10⁻⁵); and the other (MAS in Fig. 3) by using the aspect ratio relationships derived by Peruzza and Pace (2002) on a slightly modified Wells and Coppersmith (1994) data set.
Preliminary results and conclusions. The output of the EP code applied to the Etna caseThe output of the EP code applied to the Etna case is reported in Tab. 2, where the most likely values of characteristic expected magnitude (Mchar) with the associated standard deviation σ, the corresponding mean recurrence times (Tmean) and the aperiodicity factor α, are indicated for each fault.
The obtained α values suggest fault behaviours potentially modelled by a time-depended approach.
Fig. 3 reports the calculated Mmax values for four faults, following all the different approaches with the associated uncertainty and, if available, the observed (historical) Mmax. The upper curve (‘SUM’ in Fig. 3) represents the summation of the Mmax’s, treated as probability density functions, in order to evaluate a reference “mean” value (‘Ref’ in Fig. 3). This representation is useful to evaluate whether the observed Mmax value is in agreement or not with the values of maximum rupture calculated (Mchar) from the geometry/kinematic. It is important to stress that the Mmax values calculated by the different methods are comparable, also with the observed historical earthquakes except the case of PF2 and partially the SVF. As regards PF2, the partial discrepancy between the Mmax calculated by the proposed Etna scaling relationship and the others values, can be ascribed to the “strange” fault geometry showing a length along dip (W) larger than the one along strike (L).
The results of this work, actually in progress, suggest that a geological approach based on geometric-kinematic parameters to estimate the expected seismicity rates can be adopted with success on the volcanic context of Etna. A comparison between our results with scalar moment rates estimated from seismic and geodetic data will provide important constraints on the fault parameters and validate the goodness of the methodology.
Tab. 2 - Output of EP code for the studied faults. The characteristic magnitude (Mchar) is calculated according to the Etna SRL-M relationship shown in Fig. 2. Fault abbreviations as in Tab. 1.
Fault Mchar (calculated) σ Mchar Tmean (yrs) α
FF �.2 0.3 2�4 0.�4
STF �.4 0.2 �� 0.4�
SVF �.1 0.3 1�2 0.�2
MF �.3 0.2 13� 0.��
SLF 4.� 0.3 4� 0.�2
PF2 4.� 0.4 2� 0.��
001-260 volume 1 24 24-10-2014 16:52:11

GNGTS 2014 sessione 1.1
2�
Acknowledgments. This study has benefited from funding provided by the Italian Presidenza del Consiglio deiThis study has benefited from funding provided by the Italian Presidenza del Consiglio dei Ministri - Dipartimento della Protezione Civile (DPC), in the frame of the 2014-2015 Agreement with Istituto Nazionale di Geofisica e Vulcanologia - INGV, project V3: “Multi-disciplinary analysis of the relationships between tectonic structures and volcanic activity ‘’. This paper does not necessarily represent DPC official opinion and policies.
ReferencesAzzaro R.; 1999: Earthquake surface faulting at Mount Etna volcano (Sicily) and implications for active tectonics.
Journal of Geodynamics, 28, 193-213.Azzaro R.; 2004: Seismicity and active tectonics in the Etna region: constraints for a seismotectonic model. In:In:
Bonaccorso A., Calvari S., Coltelli M., Del Negro C., Falsaperla S., (Eds.), Mt. Etna: volcano laboratory. AmericanAmerican Geophysical Union, Geophysical monograph, 143, pp. 205-220, doi: 10.1029/1436M13.
Azzaro R., Barbano M.S., D’Amico S., Tuvè T., Albarello D. and V. D’Amico; 2008: First studies of probabilistic seismic hazard assessment in the volcanic region of Mt. Etna (Southern Italy) by means of macroseismic intensities. Bollettino di Geofisica Teorica e Applicata, 49 (1), 77-91.
Azzaro R., D’Amico S. and T. Tuvè; 2011: Estimating the magnitude of historical earthquakes from macroseismic intensity data: new relationships for the volcanic region of Mount Etna (Italy). Seismological Research Letters, 82, 4, 533-544.
Azzaro R., Branca S., Gwinner K. and M. Coltelli; 2012a: The volcano-tectonic map of Etna volcano, 1:100.000 scale: an integrated approach based on a morphotectonic analysis from high-resolution DEM constrained by geologic, active faulting and seismotectonic data. Italian Journal of Geosciences, 131 (1), 153-170.
Azzaro R., D’Amico S., Peruzza L. and T. Tuvè; 2012b: Earthquakes and faults at Mt. Etna (Southern Italy): problems and perspectives for a time-dependent probabilistic seismic hazard assessment in a volcanic region. Bollettino Geofisica Teorica e Applicata, 53 (1), 75-88.
Azzaro R., Bonforte A., Branca S. and F. Guglielmino; 2013a: Geometry and kinematics of the fault systems controlling the unstable flank of Etna volcano (Sicily). Journal of Volcanology and Geothermal Researches, 251, 5-15.
Azzaro R., D’Amico S., Peruzza L. and T. Tuvè; 2013b: Probabilistic seismic hazard at Mt. Etna (Italy): the contribution of local fault activity in mid-term assessment. Journal of Volcanology and Geothermal Research, 251, 158-169.
CMTE Working Group; 2014: Catalogo Macrosismico dei Terremoti Etnei dal 1832 al 2013. INGV, Catania,INGV, Catania, http://www.ct.ingv.it/macro/etna/html_index.php.
Cinti F. R., D. Pantosti, P.M. De Martini, S Pucci, R. Civico, S. Pierdominici, L. Cucci, C.A. Brunori, S. Pinzi and A. Patera.; 2011: Evidence for surface faulting events along the Paganica fault prior to the 6 April 2009 L’Aquila earthquake (central Italy). J. Geoph. Res., 116, B07308, doi:10.1029/2010JB007988.
Field E.H., D.D. Johnson and J.F. Dolan; 1999: A mutually consistent seismic-hazard source model for Southern California. Bulletin of the Seismological Society of America, 89, 559-578.
Galli P., B. Giaccio and P. Messina; 2010: The 2009 central Italy earthquake seen through 0.5 Myr- long tectonic history of the L’Aquila faults system. Quaternary Science Reviews, 29, 3768–3789.
Moro M., S. Gori, E. Falcucci, M. Saroli, F. Galadini and S. Salvi; 2013: Historical earthquakes and variable kinematic behaviour of the 2009 L’Aquila seismic event (central Italy), causative fault, revealed by paleoseismological investigations. Tectonophysics, 583, 131-144.
Pace B., F. Visini and L. Peruzza; 2013: D5.1 Numerical simulation of earthquake recurrence time for selected fault. DPC-INGV Project S2-2102 “Constraining Observations into Seismic Hazard”, https://sites.google.com/site/ingvdpc2012progettos2/deliverables/d5_1, v. 0.15 released online on 30 Aug 2013.
Peruzza L. and B. Pace; 2002: Sensitivity analysis for seismic source characteristics to probabilistic seismica hazard assessment in Central Apennines (Abruzzo area). Bollettino di Geofisica Teorica ed Applicata, 43, 79-100.
Peruzza L., B. Pace, and F. Cavallini; 2010: Error propagation in time-dependent probability of occurrence for characteristic earthquakes in Italy. Journal of Seismology, 14,119-141, DOI 10.1007/s10950-008-9131-1, online eds 1573-157X, 2008
Peruzza L., B. Pace, and F. Visini; 2011: Fault-based earthquake rupture forecast in Central Italy: remarks after the L’Aquila Mw 6.3 event. Bulletin of the Seismological Society of America,Bulletin of the Seismological Society of America,101, 404-412.
Stirling M., T. Godet, K. Berryman and N. Litchfield; 2013: Selection of earthquake scaling relationships for seismic-hazard analysis. Bulletin of the Seismological Society of America, 103 (6), 2993-3011.
Villamor P., Berryman R.K.R., Webb T., Stirling M., McGinty P., Downes G., Harris J. and N. Litchfield; 2001: Waikato Seismic Loads: revision of Seismic Source Characterisation. GNS Client Report 2001/59.
Wells D.L. and K.J. Coppersmith; 1994: New empirical relationships among magnitude, rupture lenght, rupture area, and surface displacement. Bulletin of the Seismological Society of America, 84 (4), 974-1002.
Wesnousky S.G.; 2008: Displacement and geometrical characteristics of earthquake surface ruptures: issues and implications for seismic-hazard analysis and the process of earthquake rupture. Bulletin of the Seismological Society of America, 98 (4), 1609-1632..
001-260 volume 1 25 24-10-2014 16:52:12