Embed Size (px)
Citation preview
sensors
Article
Artificial-Intelligence-Based Prediction of ClinicalEvents among Hemodialysis Patients UsingNon-Contact Sensor Data
Saurabh Singh Thakur 1 ID , Shabbir Syed Abdul 2,3,* ID , Hsiao-Yean (Shannon) Chiu 4,5,Ram Babu Roy 1, Po-Yu Huang 6, Shwetambara Malwade 3, Aldilas Achmad Nursetyo 2,3 ID
and Yu-Chuan (Jack) Li 2,3,7
1 Rajendra Mishra School of Engineering Entrepreneurship, Indian Institute of Technology Kharagpur,Kharagpur 721302, India; [email protected] (S.S.T.); [email protected] (R.B.R.)
2 Graduate Institute of Biomedical Informatics, Taipei Medical University, Taipei 110, Taiwan;[email protected] (A.A.N.); [email protected] (Y.-C.L.)
3 International Center for Health Information Technology (ICHIT), Taipei Medical University,Taipei 110, Taiwan; [email protected]
4 School of Nursing, College of Nursing, Taipei Medical University, Taipei 110, Taiwan;[email protected]
5 School of Medicine, Research Center of Sleep Medicine, Taipei Medical University, Taipei 110, Taiwan6 School of Medicine, Taipei Medical University, Taipei 110, Taiwan; [email protected] TMU Research Center of Cancer Translational Medicine, Taipei Medical University, Taipei 110, Taiwan* Correspondence: [email protected]; Tel.: +886-2-6638-2736 (ext. 1514)
Received: 3 July 2018; Accepted: 23 August 2018; Published: 27 August 2018�����������������
Abstract: Non-contact sensors are gaining popularity in clinical settings to monitor the vitalparameters of patients. In this study, we used a non-contact sensor device to monitor vital parameterslike the heart rate, respiration rate, and heart rate variability of hemodialysis (HD) patients fora period of 23 weeks during their HD sessions. During these 23 weeks, a total number of 3237 HDsessions were observed. Out of 109 patients enrolled in the study, 78 patients reported clinical eventssuch as muscle spasms, inpatient stays, emergency visits or even death during the study period.We analyzed the sensor data of these two groups of patients, namely an event and no-event group.We found a statistically significant difference in the heart rates, respiration rates, and some heartrate variability parameters among the two groups of patients when their means were comparedusing an independent sample t-test. We further developed a supervised machine-learning-basedprediction model to predict event or no-event based on the sensor data and demographic information.A mean area under curve (ROC AUC) of 90.16% with 96.21% mean precision, and 88.47% meanrecall was achieved. Our findings point towards the novel use of non-contact sensors in clinicalsettings to monitor the vital parameters of patients and the further development of early warningsolutions using artificial intelligence (AI) for the prediction of clinical events. These models couldassist healthcare professionals in taking decisions and designing better care plans for patients byearly detecting changes to vital parameters.
Keywords: artificial intelligence; supervised machine learning; predictive analytics; hemodialysis;non-contact sensor; heart rate; respiration rate; heart rate variability
1. Introduction
Hemodialysis (HD) has been one treatment of choice for renal replacement therapy among patientswith possible renal dysfunction [1]. Hemodialysis uses an apparatus to filter blood that can be carried
Sensors 2018, 18, 2833; doi:10.3390/s18092833 www.mdpi.com/journal/sensors
Sensors 2018, 18, 2833 2 of 16
out either in a dialysis center or at home. By doing so, it replaces the natural function of the kidneys toremove waste and maintain blood pressure among renal failure patients [2]. Hemodialysis has proved toprolong survival of end-stage renal disease patients aged more than 75 with multiple comorbidities [3].Typically, HD consists of three sessions per week and each session lasts around 4 h [4,5].
Despite its function in terms of prolonging patients’ life expectancy and increasing the quality oflife, patients may undergo several clinical events during HD. Among them are infection, cardiovascularevents, muscle spasm, and even death [6]. Research by Han [7] successfully predicted cardiovascularevents using echocardiographic parameters, but not other non-cardiovascular and cerebrovascularevents. Similarly, some studies have been conducted to predict cardiovascular events in livertransplant patients [8,9].
Ambient intelligence (AmI) is an evolving research area that attempts to bring intelligence to ourenvironment and make it much sensitive to our day-to-day life [10]. Various technologies like sensors,sensor networks, pervasive computing, and artificial intelligence (AI) are used in AmI to make ourenvironment more sensitive to living. AmI attempts to make our life easier and safer and is beingdeployed in many areas that affect human life. It is becoming more significant in healthcare in bothclinical and non-clinical settings like telemedicine, home automation, health behavior informatics andpatient monitoring [11–17]. For instance, AmI interacts with humans (e.g., patients) using sensors andmight be able to predict upcoming events before they occur.
Research has been done in the past into which sensors can be used to monitor or detect somehealth conditions or parameters. However, the use of artificial intelligence using sensor data topredict an upcoming event is rarely found. Research has been carried out by Tereul et al. [18] utilizingan ultrasonic sensor to measure blood flow during dialysis sessions. Trebbels et al. [19] measuredhematocrit levels by designing impedance-spectroscopy-based sensors for dialysis apparatus. Yi-ChunDu et al. [20] proposed a wearable device to monitor blood leakage during HD using an array sensingpatch. However, these studies did not embed the technology with an artificial intelligence feature.Artificial intelligence has been used to improve anemia management during dialysis treatment [21].
Methods or devices using physical contact with patients during their clinical care do not offerround-the-clock monitoring of their vital signs. On the other hand, data on vital signs, like bloodpressure, heart rate, respiration rate, and body temperature are very important factors when a decisionis being taken by the physician and healthcare professional. Nowadays, non-contact sensor devices areavailable that offer round-the-clock monitoring of the various vital signs of patients [22,23]. Further,this data can also be useful in predicting clinical events in patients for several clinical processes likeHD, liver transplants, kidney transplants, etc. Various studies predicting cardiovascular events inliver transplant patients have been carried out in the past using contact or non-contact sensor data.However, there have been very few studies conducted to predict clinical events in HD patients usingnon-contact sensors.
In this study, a prediction model was developed based on supervised machine learning (ML)algorithms to predict clinical events during dialysis sessions. We used the data from a non-contactsensor device [24] that records vital signs like the heart rate, respiration rate, and heart rate variability.In the following sections, we present our methodology, results, discussion, limitations and conclusion.
2. Materials and Methods
2.1. Study Details
In this observational study, we included 109 patients who were undergoing HD at TaipeiMedical University (TMU) hospital, Taipei, Taiwan. To conduct this study, ethical clearance wastaken from the Joint Institutional Review Board (JIRB) of Taipei Medical University, Taipei, Taiwan(JIRB No. N201512031). During the period of HD, some patients experienced clinical events of certaintypes and a few patients did not report any clinical event. A clinical event can be defined as anymedical problem experienced and reported by the patient. The clinical events suffered by the patients
Sensors 2018, 18, 2833 3 of 16
and considered in this study were sudden death (SD), emergency visit (ER), muscle spasm (MS),inpatient (IP), emergency visit and inpatient (ERIP).
2.2. Data Collection
Patient data were collected using a piezo-electric non-contact sensor system that measuredrespiration rate (RR), heart rate (HR), and body movement data (MD). These vital parameters of thepatients were captured during the HD sessions for a period of 23 weeks from March 2016 to August2016. The sensor unit was placed under the mattress and had no direct contact with the patient.The sensor system used in this study was developed by EarlySense Ltd., Ramat Gan, Israel [24].When this sensor is kept under the mattress, a force is applied to the sensor that comes from threesources. These sources are gross body movement, chest wall movement, and recoil of the body due tothe cardio-ballistic effect. The latter two are related to respiration effort and stroke volume. The signalsgenerated by the sensor can be separated into motion, respiration and ballistocardiogram (BCG)waveforms, from which MD, RR and HR can be obtained, respectively [24]. The sensor system forpatient monitoring in hospital settings has been validated and used in many clinical studies [22,25–27].Similarly, the heart rate variability parameters like high frequency (HF), low frequency (LF),the ratio of HF–LF (HF/LF), and very low frequency (VLF) were also obtained from the raw BCGwaveforms [28,29]. The heart rate variability (HRV) parameters including HR, RR, and MD wereprocessed from the raw data and provided to us by a data scientist from EarlySense Ltd. The finaldataset we received contained the mean of every 30 s for HR, RR, MD, and all the HRV parameters alongwith the date and patient ID (without revealing the personal identity of the patient). The demographicdata like gender, age, height, and weight of the patients was also obtained during the study usinga predesigned form.
2.3. Data Cleaning and Feature Extraction
There were some errors, missing values, and duplicate data files in the raw dataset. The rawdata was cleaned to remove all the errors, missing values, and duplicate data files. This was doneprogrammatically in the Python programming language and using the library pandas. The errors werethe presence of the values 0 and −1 or missing values in some data fields. The entire row was deletedif it had either of these errors in any of its data fields. In the case of duplicate data files for the sameHD session, the file which had the lesser number of data readings was ignored and that with datareadings was selected. We had the following data variables after data cleaning and arranging the datafrom different files into a single data file:
Patient ID, date of session, RR, MD, HR, and HRV parameters like HF, LF, HF/LF, VLF,and (VLF+LF)/HF. We also had demographic details of the patients like the gender, age, height,and weight of the patients.
Since HRV parameters will be accurate only when the patient is relaxed and stable, we consideredonly those data samples in the analysis when the patient was in a stable and non-moving condition [30].Therefore, we utilized the body movement data and further shortlisted only those data samples wherethe value of MD was less than a threshold of 30 amplitudes. Further, we extracted data samples forthe vital parameters from the first five minutes (FFM) and last five minutes (LFM) of HD sessions.The reason for extracting FFM and LFM was to see the change in the vital parameters as the HDsession progresses. The FFM data was extracted from the early period of the HD session and LFM wasextracted from the end period of the session, since the short-term recording (5 min) of HRV is sufficientfor monitoring the autonomic nervous system [31]. Therefore, in this study, instead of consideringHRV and other recorded vital parameters for a complete length of the HD session, only 5 min of datasamples from the beginning and end of the HD session were considered. We also extracted the totalnumber of HD sessions a patient had attended and the total number of clinical events reported bya patient. In addition, the body mass index (BMI) of each patient was calculated from the height,weight and gender data information of the patient. Finally, we had the following variables:
Sensors 2018, 18, 2833 4 of 16
Patient ID, Number of Sessions, Number of Events, Time_FFM, HR_FFM, RR_FFM, MD_FFM,HF_FFM, LF_FFM, HF/LF_FFM, VLF_FFM, (VLF+LF)/HF_FFM, Time_LFM, HR_LFM, RR_LFM,MD_LFM, HF_LFM, LF_LFM, HF/LF_LFM, VLF_LFM, (VLF+LF)/HF_LFM, Gender, Age, Weight,Height, BMI, and Class. Here, the variable “Class” represents the two categories of patients, one inwhich the patient had reported any of the five mentioned clinical events and the other in which patienthad not reported any clinical event. We selected a subset of features from the above-mentioned featuresas input variables. The backward elimination method was used to select an optimal subset of features.
2.4. Model Development
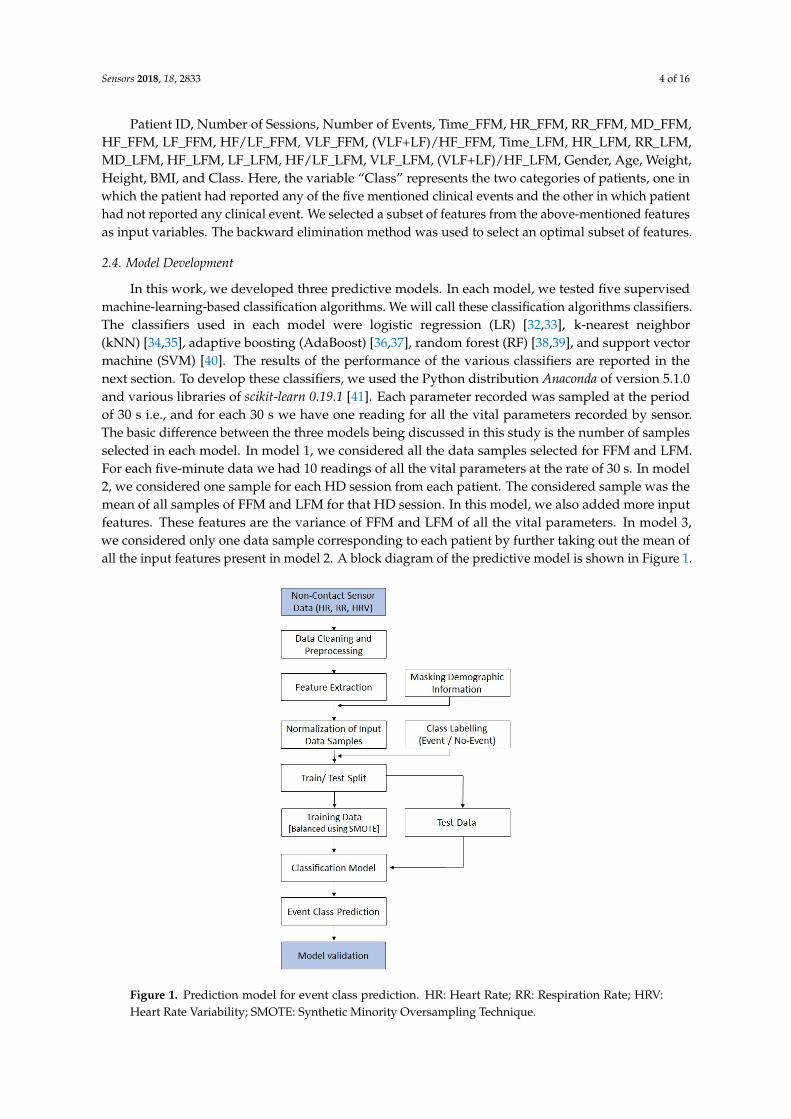
In this work, we developed three predictive models. In each model, we tested five supervisedmachine-learning-based classification algorithms. We will call these classification algorithms classifiers.The classifiers used in each model were logistic regression (LR) [32,33], k-nearest neighbor(kNN) [34,35], adaptive boosting (AdaBoost) [36,37], random forest (RF) [38,39], and support vectormachine (SVM) [40]. The results of the performance of the various classifiers are reported in thenext section. To develop these classifiers, we used the Python distribution Anaconda of version 5.1.0and various libraries of scikit-learn 0.19.1 [41]. Each parameter recorded was sampled at the periodof 30 s i.e., and for each 30 s we have one reading for all the vital parameters recorded by sensor.The basic difference between the three models being discussed in this study is the number of samplesselected in each model. In model 1, we considered all the data samples selected for FFM and LFM.For each five-minute data we had 10 readings of all the vital parameters at the rate of 30 s. In model2, we considered one sample for each HD session from each patient. The considered sample was themean of all samples of FFM and LFM for that HD session. In this model, we also added more inputfeatures. These features are the variance of FFM and LFM of all the vital parameters. In model 3,we considered only one data sample corresponding to each patient by further taking out the mean ofall the input features present in model 2. A block diagram of the predictive model is shown in Figure 1.
Sensors 2018, 18, x 4 of 16
Patient ID, Number of Sessions, Number of Events, Time_FFM, HR_FFM, RR_FFM, MD_FFM, HF_FFM, LF_FFM, HF/LF_FFM, VLF_FFM, (VLF+LF)/HF_FFM, Time_LFM, HR_LFM, RR_LFM, MD_LFM, HF_LFM, LF_LFM, HF/LF_LFM, VLF_LFM, (VLF+LF)/HF_LFM, Gender, Age, Weight, Height, BMI, and Class. Here, the variable “Class” represents the two categories of patients, one in which the patient had reported any of the five mentioned clinical events and the other in which patient had not reported any clinical event. We selected a subset of features from the above-mentioned features as input variables. The backward elimination method was used to select an optimal subset of features.
2.4. Model Development
In this work, we developed three predictive models. In each model, we tested five supervised machine-learning-based classification algorithms. We will call these classification algorithms classifiers. The classifiers used in each model were logistic regression (LR) [32,33], k-nearest neighbor (kNN) [34,35], adaptive boosting (AdaBoost) [36,37], random forest (RF) [38,39], and support vector machine (SVM) [40]. The results of the performance of the various classifiers are reported in the next section. To develop these classifiers, we used the Python distribution Anaconda of version 5.1.0 and various libraries of scikit-learn 0.19.1 [41]. Each parameter recorded was sampled at the period of 30 s i.e., and for each 30 s we have one reading for all the vital parameters recorded by sensor. The basic difference between the three models being discussed in this study is the number of samples selected in each model. In model 1, we considered all the data samples selected for FFM and LFM. For each five-minute data we had 10 readings of all the vital parameters at the rate of 30 s. In model 2, we considered one sample for each HD session from each patient. The considered sample was the mean of all samples of FFM and LFM for that HD session. In this model, we also added more input features. These features are the variance of FFM and LFM of all the vital parameters. In model 3, we considered only one data sample corresponding to each patient by further taking out the mean of all the input features present in model 2. A block diagram of the predictive model is shown in Figure 1.
Figure 1. Prediction model for event class prediction. HR: Heart Rate; RR: Respiration Rate; HRV: Heart Rate Variability; SMOTE: Synthetic Minority Oversampling Technique. Figure 1. Prediction model for event class prediction. HR: Heart Rate; RR: Respiration Rate; HRV:Heart Rate Variability; SMOTE: Synthetic Minority Oversampling Technique.
Sensors 2018, 18, 2833 5 of 16
The models developed in this study are being trained and tested on two datasets. Since,the number of HD sessions undergone by each patient was different, there were chances of overfittingthe classifiers. As some patients had a greater number of HD sessions, they had more data samples incomparison with other patients. Therefore, we selected data samples from 15 recent HD sessions foreach patient. In this process, data samples of 105 patients who had undergone at least 15 HD sessionswere selected and we discarded the data samples of the remaining four patients. Of these 105 patients,76 had reported an event during the study period and 29 had not reported any event. In this way,we separated two datasets, one with data samples from all the HD sessions for all the patients and onewith data samples taken only from the most-recent 15 HD sessions.
The dataset in which data samples from all HD sessions was considered had 109 patients whounderwent a total number of 3237 HD sessions. Therefore, for this dataset, model 1 had a total numberof 32,370 data samples. Model 2 had 3237 data samples and model 3 had 109 data samples. The data setin which data samples from the 15 recent HD sessions were selected had a total number of 105 patientswith 1575 HD sessions. Therefore, model 1 had 15,750 data samples, model 2 had 1575 data samplesand model 3 had 105 data samples.
2.5. Model Validation
There is unequal representation of the two classes because the number of patients from theevent class is much higher than the number of patients from the no event class. To overcome thisimbalance in the data we used the synthetic minority over-sampling technique (SMOTE) [42]. In thistechnique, the minority class is over-sampled to balance the representation of both the classes.This is done by “taking each minority class data point and introducing synthetic examples alongthe line segments joining any or all of the k-minority class nearest neighbors” [43]. The process isrepeated until the representation of both classes becomes approximately equal. This approach can beimplemented in several open-source software (e.g., the R Programming Language, Python, and Weka).More information on SMOTE is available in reference [42]. In this study, SMOTE was applied only tothe training dataset and the testing dataset was left unchanged. To validate the model, we used thestratified k-fold cross-validation method [44]. In stratified cross-validation, the folds are selected suchthat the percentage of samples is preserved for each class. In each fold of the validation, the testingdataset was first balanced using SMOTE and then the classifier was trained.
In this study, the precision, recall, accuracy and receiver operating characteristic area under curve(ROC AUC) were used as evaluation measures to evaluate the performance of the various classifiersbeing developed [45]. A brief description of all these measures are given below:
2.5.1. Precision
Precision (P) is the fraction of true positives (TP) predicted to the total predicted positives i.e., truepositives plus false positives (FP). In some scenarios, it is also called as confidence. Precision isdefined as:
P =TP
TP + FP. (1)
2.5.2. Recall
The recall is the fraction of TP predicted from the total of real positives i.e., true positive plusfalse negatives. It is also sometimes referred to as sensitivity. The recall is an important measure in thecontext of medical or clinical studies because it identifies all real positive cases. It is also important inROC analysis in which it is referred to as the true positive rate. It is defined as:
R =TP
TP + FN. (2)
Sensors 2018, 18, 2833 6 of 16
2.5.3. Accuracy
Accuracy is one of the most intuitive and basic performance measures for any ML model. It isnot a good criterion by which to evaluate any model when the dataset is imbalanced. However, it isa good measure for a balanced dataset where all the classes to be classified are equally represented.It can be defined as:
Accuracy =TP + TN
TP + FP + TN + FN. (3)
2.5.4. Receiver Operating Characteristic
This is one of the most important and widely accepted evaluation criteria. It compares the truepositive rate (TPR) and the false positive rate (FPR). It is created by plotting the TPR against the FPR.TPR i.e., sensitivity or recall is already defined above and FPR can be defined as follows:
FPR =FP
FP + TN. (4)
2.5.5. Descriptive Analyses and Independent t-Test
We used SPSS 22.0 (IBM, Armonk, NY, USA) to carry out basic statistical analyses of the data.Descriptive analyses were used to examine the baseline characteristics. Differences in the HR, RR andHRV parameters between the event and no-event groups were examined using the independentsamples t-test. The P value is described in terms of rejecting the null hypothesis when it is true.The null hypothesis is usually a hypothesis of no difference (i.e., no difference in a variable amongthe two groups). The term alpha refers to a pre-chosen probability and the term “p value” is thecalculated probability. The choice of the significance level at which the null hypothesis can be rejectedis subjective. Conventionally, the 5%, 1% and 0.1% (p < 0.05, 0.01 and 0.001) levels have been used.
In this study, the statistical significance (alpha) was set at p < 0.05. We selected the level ofsignificance i.e., alpha = 0.05 so that the probability of making a wrong decision is at most 5% whenthe null hypothesis is true and also to balance the tradeoff between type 1 and type 2 errors. It alsokeeps the type 2 errors within acceptable limit and does not reject a null hypothesis (even if thereis a significant difference when it is false). A type I error is the false rejection of the null hypothesisand a type II error is the false acceptance of the null hypothesis. While testing the hypothesis onthe difference in mean for the event and no-event samples, we had two samples (for the event andno-event group) with different sizes. However, the differences in sample size have been accounted forin the computation of t-statistics (that is, in the estimation of the standard error of difference) for thehypothesis testing.
2.6. Sample Size
Since this study is in the medical domain, we have inherent limitations on our sample size due toproblems associated with data collection from patients. We validated the sample size requirementsfor this study statistically. We determined the sample size requirement based on our assumption ofa 50% prevalence rate and an error margin of 10% at the 95% confidence level. The required samplesize turned out to be, n = 96. We used the standard formula for sample size determination used incross-sectional studies [46].
3. Results
The baseline characteristics of the data used in this study are presented in Table 1. The valuesare presented for both the datasets considered in the study, namely the one that had 109 patients withdata for all HD sessions and the other which had 105 patients with data from the most recent 15 HDsessions. Of 109 patients, 78 patients suffered from clinical event(s) and 31 patients did not report anyclinical event during the whole period of HD. The total number of clinical events reported by patients
Sensors 2018, 18, 2833 7 of 16
during the study period was 166 and the frequency of events reported per patient ranged from 1–9.The distribution of different types of events is presented in Table 2. Patients were 30–89 years old withmean age 66.3 and standard deviation (std.) ± 12.2. There were 58 (53.2%) male and 51 (46.8%) femalepatients in the study. The BMI of patients ranged from 17.4 to 42.3, with a mean of 24.1 and std. ± 12.2.
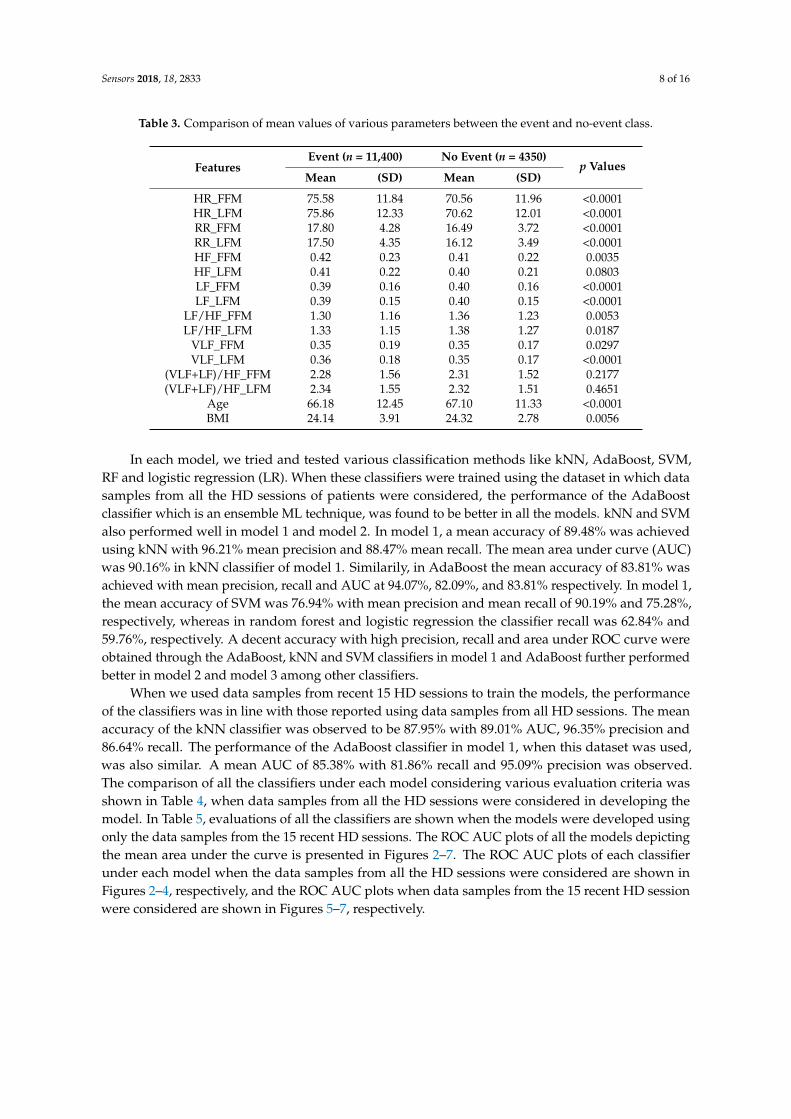
A descriptive analysis was carried out in which the mean of all the variables was comparedbetween the event group and the no-event group and are shown in Table 3. This was carried out ondata samples selected from 15 recent HD sessions. A total number of n = 11,400 data samples werefrom the event group of patients and n = 4350 were from the no-event group of patients. We found thatthe mean heart rate, respiration rate and some HRV parameters were significantly different betweenthe two groups. The mean heart rate and respiration rate of both the first five minutes and the last fiveminutes were different in the two groups with p < 0.0001. The mean heart rate of the first five minutesand last five minutes in the event group were found to be higher than those in the non-event group(FFM: 75.58 vs. 70.56 and LFM: 75.85 vs 70.61). Similarly, the respiration rate was also observed tobe different among the two groups. It is also higher in the event group as compared to the no-eventgroup (FFM: 17.80 vs. 16.48 and LFM: 17.49 vs. 16.11).
A statistically significant difference was found in the mean values of the vital parameters amongevent and no-event patients. Therefore, it became the basis for proceeding with further data analytics.As mentioned in the previous section, three predictive models were developed to predict the clinicalevent. The models were validated using the stratified k-fold cross validation method where k = 10.In model 1 and model 2, the dataset was divided into a training and validation set in each fold at theobservation level, and at the patient level in model 3. In models 1 and 2, a single patient had manydata samples, i.e., observations, therefore data splitting in these models occurred at observation level.However, each patient had a single corresponding data sample in model 3, therefore the data splittingoccurred at the patient level in this model.
Table 1. Baseline characteristics of the study data (n = number of patients).
Characteristics Values(n = 109, All HD Sessions)
Values(n = 105, 15 HD Sessions)
Number of Male participants (%) 58 (53.2) 54 (51.4)Number of Female participants (%) 51 (46.8) 51(48.6)
Age Range 30–89 30–89Mean Age (±std.) 66.3 (±12.2) 66.4 (±12.2)
BMI Range 17.4–42.3 17.4–42.3Mean BMI (±std.) 24.1 (± 3.6) 24.1 (±3.6)
Total Number of Hemodialysis Sessions 3237 1575HD Sessions Range 7–52 15
Average No. of Sessions (±std.) 29.69 (±9.97) 15
HD: Hemodialysis; BMI: Body Mass Index.
Table 2. Details of events reported during study period.
Event Details Values
Number of different events 5Number of sessions with events 166
Number of patients reporting the event 78Number of patients who did not report the event 31
Number of patients with sudden death 6Number of patients reporting an ER visit 33
Number of patients reporting inpatient (IP) 32Number of patients reporting ERIP 28
Number of patients reporting muscle spasm 45
ER: Emergency Room visit; ERIP: Emergency Room visit and Inpatient.
Sensors 2018, 18, 2833 8 of 16
Table 3. Comparison of mean values of various parameters between the event and no-event class.
FeaturesEvent (n = 11,400) No Event (n = 4350)
p ValuesMean (SD) Mean (SD)
HR_FFM 75.58 11.84 70.56 11.96 <0.0001HR_LFM 75.86 12.33 70.62 12.01 <0.0001RR_FFM 17.80 4.28 16.49 3.72 <0.0001RR_LFM 17.50 4.35 16.12 3.49 <0.0001HF_FFM 0.42 0.23 0.41 0.22 0.0035HF_LFM 0.41 0.22 0.40 0.21 0.0803LF_FFM 0.39 0.16 0.40 0.16 <0.0001LF_LFM 0.39 0.15 0.40 0.15 <0.0001
LF/HF_FFM 1.30 1.16 1.36 1.23 0.0053LF/HF_LFM 1.33 1.15 1.38 1.27 0.0187
VLF_FFM 0.35 0.19 0.35 0.17 0.0297VLF_LFM 0.36 0.18 0.35 0.17 <0.0001
(VLF+LF)/HF_FFM 2.28 1.56 2.31 1.52 0.2177(VLF+LF)/HF_LFM 2.34 1.55 2.32 1.51 0.4651
Age 66.18 12.45 67.10 11.33 <0.0001BMI 24.14 3.91 24.32 2.78 0.0056
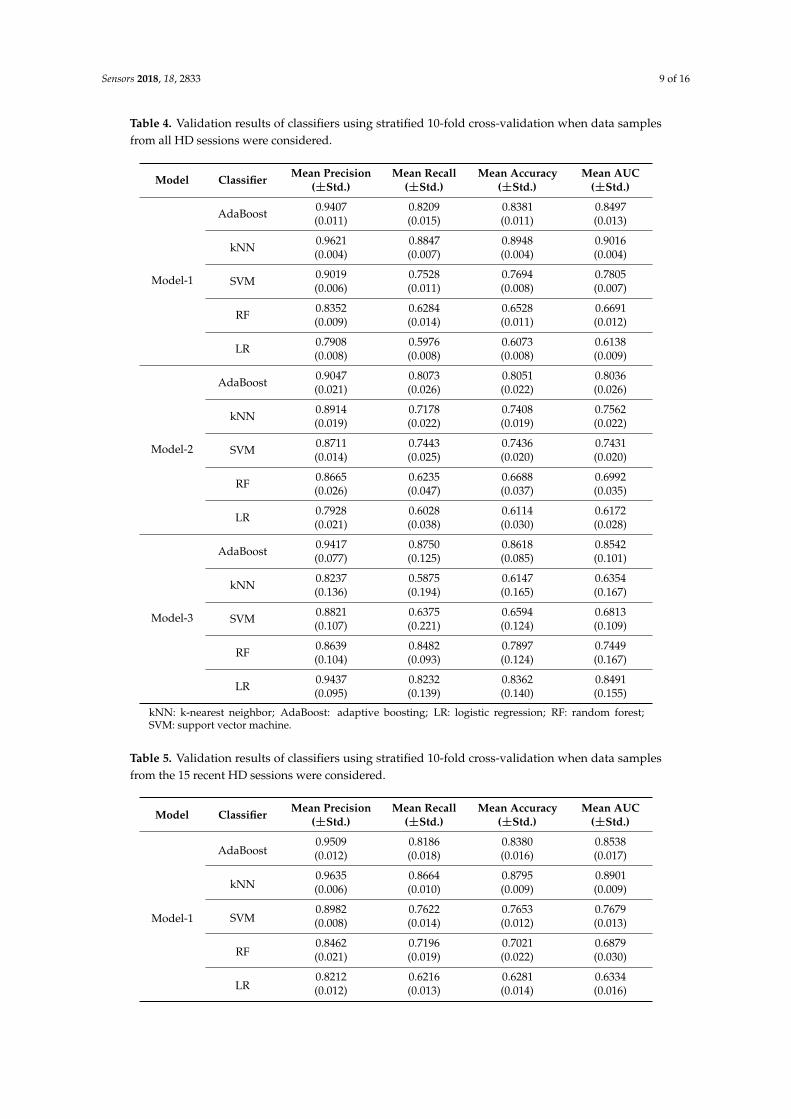
In each model, we tried and tested various classification methods like kNN, AdaBoost, SVM,RF and logistic regression (LR). When these classifiers were trained using the dataset in which datasamples from all the HD sessions of patients were considered, the performance of the AdaBoostclassifier which is an ensemble ML technique, was found to be better in all the models. kNN and SVMalso performed well in model 1 and model 2. In model 1, a mean accuracy of 89.48% was achievedusing kNN with 96.21% mean precision and 88.47% mean recall. The mean area under curve (AUC)was 90.16% in kNN classifier of model 1. Similarily, in AdaBoost the mean accuracy of 83.81% wasachieved with mean precision, recall and AUC at 94.07%, 82.09%, and 83.81% respectively. In model 1,the mean accuracy of SVM was 76.94% with mean precision and mean recall of 90.19% and 75.28%,respectively, whereas in random forest and logistic regression the classifier recall was 62.84% and59.76%, respectively. A decent accuracy with high precision, recall and area under ROC curve wereobtained through the AdaBoost, kNN and SVM classifiers in model 1 and AdaBoost further performedbetter in model 2 and model 3 among other classifiers.
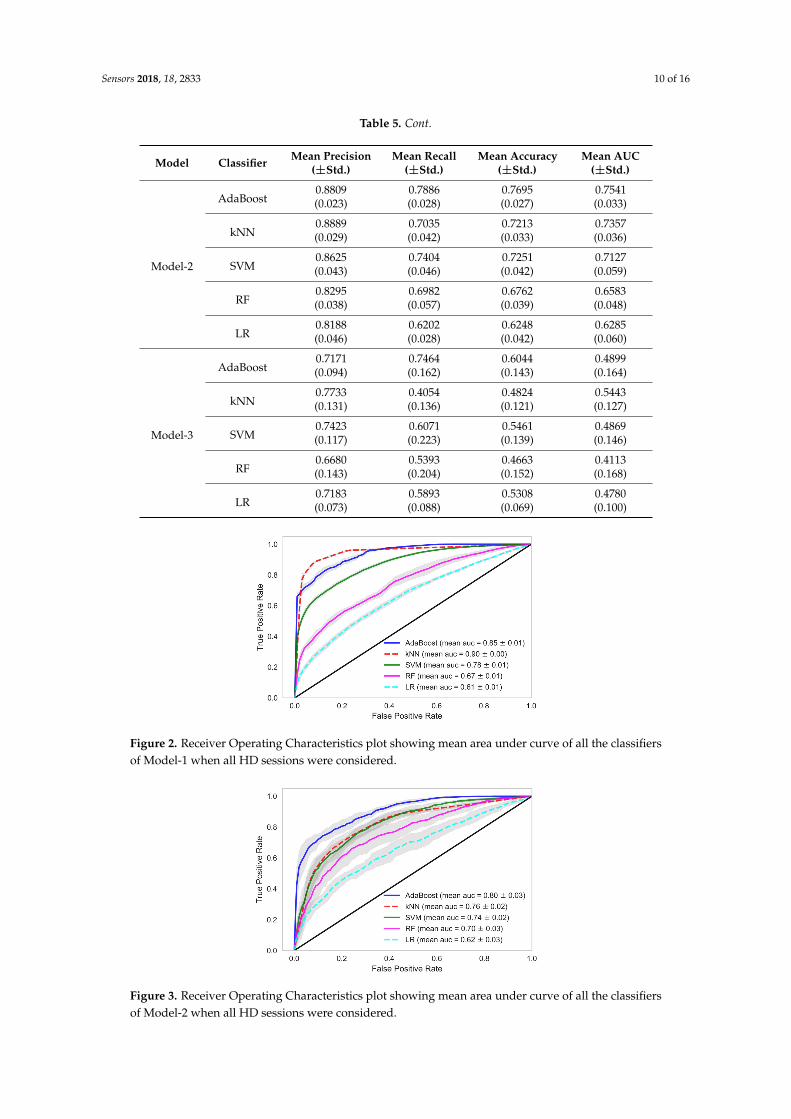
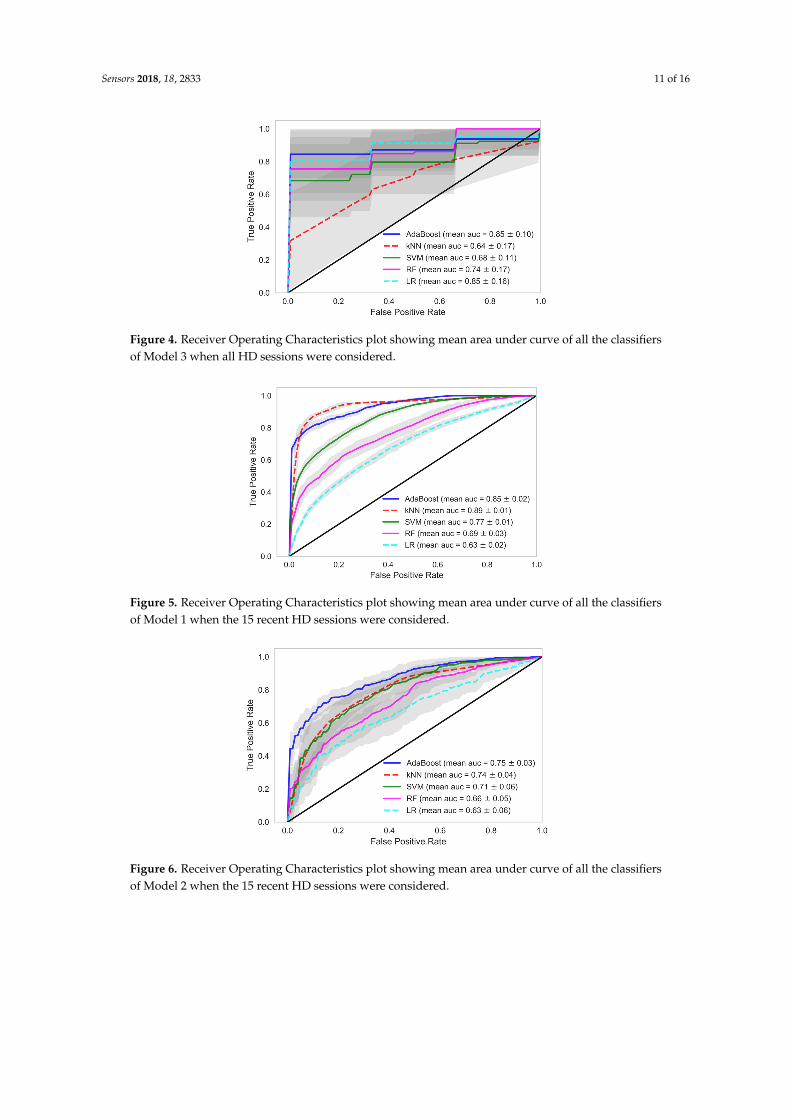
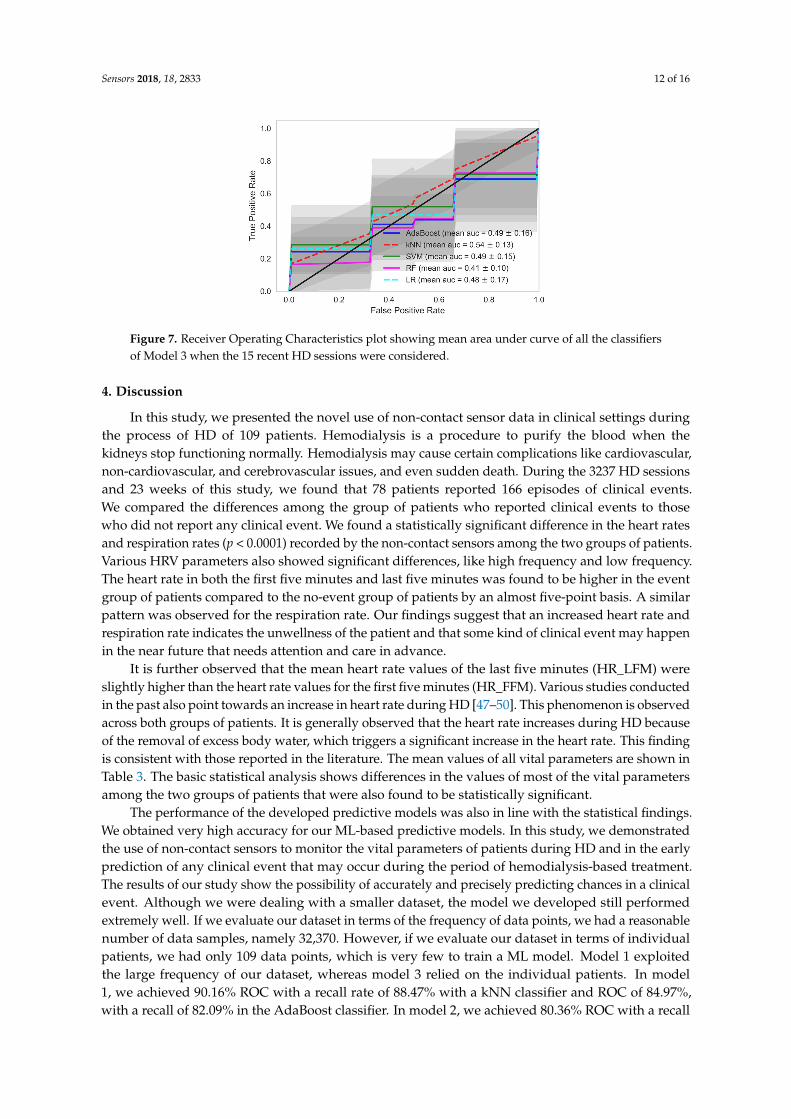
When we used data samples from recent 15 HD sessions to train the models, the performanceof the classifiers was in line with those reported using data samples from all HD sessions. The meanaccuracy of the kNN classifier was observed to be 87.95% with 89.01% AUC, 96.35% precision and86.64% recall. The performance of the AdaBoost classifier in model 1, when this dataset was used,was also similar. A mean AUC of 85.38% with 81.86% recall and 95.09% precision was observed.The comparison of all the classifiers under each model considering various evaluation criteria wasshown in Table 4, when data samples from all the HD sessions were considered in developing themodel. In Table 5, evaluations of all the classifiers are shown when the models were developed usingonly the data samples from the 15 recent HD sessions. The ROC AUC plots of all the models depictingthe mean area under the curve is presented in Figures 2–7. The ROC AUC plots of each classifierunder each model when the data samples from all the HD sessions were considered are shown inFigures 2–4, respectively, and the ROC AUC plots when data samples from the 15 recent HD sessionwere considered are shown in Figures 5–7, respectively.
Sensors 2018, 18, 2833 9 of 16
Table 4. Validation results of classifiers using stratified 10-fold cross-validation when data samplesfrom all HD sessions were considered.
Model Classifier Mean Precision(±Std.)
Mean Recall(±Std.)
Mean Accuracy(±Std.)
Mean AUC(±Std.)
Model-1
AdaBoost 0.9407(0.011)
0.8209(0.015)
0.8381(0.011)
0.8497(0.013)
kNN 0.9621(0.004)
0.8847(0.007)
0.8948(0.004)
0.9016(0.004)
SVM 0.9019(0.006)
0.7528(0.011)
0.7694(0.008)
0.7805(0.007)
RF 0.8352(0.009)
0.6284(0.014)
0.6528(0.011)
0.6691(0.012)
LR 0.7908(0.008)
0.5976(0.008)
0.6073(0.008)
0.6138(0.009)
Model-2
AdaBoost 0.9047(0.021)
0.8073(0.026)
0.8051(0.022)
0.8036(0.026)
kNN 0.8914(0.019)
0.7178(0.022)
0.7408(0.019)
0.7562(0.022)
SVM 0.8711(0.014)
0.7443(0.025)
0.7436(0.020)
0.7431(0.020)
RF 0.8665(0.026)
0.6235(0.047)
0.6688(0.037)
0.6992(0.035)
LR 0.7928(0.021)
0.6028(0.038)
0.6114(0.030)
0.6172(0.028)
Model-3
AdaBoost 0.9417(0.077)
0.8750(0.125)
0.8618(0.085)
0.8542(0.101)
kNN 0.8237(0.136)
0.5875(0.194)
0.6147(0.165)
0.6354(0.167)
SVM 0.8821(0.107)
0.6375(0.221)
0.6594(0.124)
0.6813(0.109)
RF 0.8639(0.104)
0.8482(0.093)
0.7897(0.124)
0.7449(0.167)
LR 0.9437(0.095)
0.8232(0.139)
0.8362(0.140)
0.8491(0.155)
kNN: k-nearest neighbor; AdaBoost: adaptive boosting; LR: logistic regression; RF: random forest;SVM: support vector machine.
Table 5. Validation results of classifiers using stratified 10-fold cross-validation when data samplesfrom the 15 recent HD sessions were considered.
Model Classifier Mean Precision(±Std.)
Mean Recall(±Std.)
Mean Accuracy(±Std.)
Mean AUC(±Std.)
Model-1
AdaBoost0.9509(0.012)
0.8186(0.018)
0.8380(0.016)
0.8538(0.017)
kNN0.9635(0.006)
0.8664(0.010)
0.8795(0.009)
0.8901(0.009)
SVM0.8982(0.008)
0.7622(0.014)
0.7653(0.012)
0.7679(0.013)
RF0.8462(0.021)
0.7196(0.019)
0.7021(0.022)
0.6879(0.030)
LR0.8212(0.012)
0.6216(0.013)
0.6281(0.014)
0.6334(0.016)
Sensors 2018, 18, 2833 10 of 16
Table 5. Cont.
Model Classifier Mean Precision(±Std.)
Mean Recall(±Std.)
Mean Accuracy(±Std.)
Mean AUC(±Std.)
Model-2
AdaBoost0.8809(0.023)
0.7886(0.028)
0.7695(0.027)
0.7541(0.033)
kNN0.8889(0.029)
0.7035(0.042)
0.7213(0.033)
0.7357(0.036)
SVM0.8625(0.043)
0.7404(0.046)
0.7251(0.042)
0.7127(0.059)
RF0.8295(0.038)
0.6982(0.057)
0.6762(0.039)
0.6583(0.048)
LR0.8188(0.046)
0.6202(0.028)
0.6248(0.042)
0.6285(0.060)
Model-3
AdaBoost0.7171(0.094)
0.7464(0.162)
0.6044(0.143)
0.4899(0.164)
kNN0.7733(0.131)
0.4054(0.136)
0.4824(0.121)
0.5443(0.127)
SVM0.7423(0.117)
0.6071(0.223)
0.5461(0.139)
0.4869(0.146)
RF0.6680(0.143)
0.5393(0.204)
0.4663(0.152)
0.4113(0.168)
LR0.7183(0.073)
0.5893(0.088)
0.5308(0.069)
0.4780(0.100)
Sensors 2018, 18, x 10 of 16
SVM 0.8625 (0.043)
0.7404 (0.046)
0.7251 (0.042)
0.7127 (0.059)
RF 0.8295 (0.038)
0.6982 (0.057)
0.6762 (0.039)
0.6583 (0.048)
LR 0.8188 (0.046)
0.6202 (0.028)
0.6248 (0.042)
0.6285 (0.060)
Model-3
AdaBoost 0.7171 (0.094)
0.7464 (0.162)
0.6044 (0.143)
0.4899 (0.164)
kNN 0.7733 (0.131)
0.4054 (0.136)
0.4824 (0.121)
0.5443 (0.127)
SVM 0.7423 (0.117)
0.6071 (0.223)
0.5461 (0.139)
0.4869 (0.146)
RF 0.6680 (0.143)
0.5393 (0.204)
0.4663 (0.152)
0.4113 (0.168)
LR 0.7183 (0.073)
0.5893 (0.088)
0.5308 (0.069)
0.4780 (0.100)
Figure 2. Receiver Operating Characteristics plot showing mean area under curve of all the classifiers of Model-1 when all HD sessions were considered.
Figure 3. Receiver Operating Characteristics plot showing mean area under curve of all the classifiers of Model-2 when all HD sessions were considered.
Figure 2. Receiver Operating Characteristics plot showing mean area under curve of all the classifiersof Model-1 when all HD sessions were considered.
Sensors 2018, 18, x 10 of 16
SVM 0.8625 (0.043)
0.7404 (0.046)
0.7251 (0.042)
0.7127 (0.059)
RF 0.8295 (0.038)
0.6982 (0.057)
0.6762 (0.039)
0.6583 (0.048)
LR 0.8188 (0.046)
0.6202 (0.028)
0.6248 (0.042)
0.6285 (0.060)
Model-3
AdaBoost 0.7171 (0.094)
0.7464 (0.162)
0.6044 (0.143)
0.4899 (0.164)
kNN 0.7733 (0.131)
0.4054 (0.136)
0.4824 (0.121)
0.5443 (0.127)
SVM 0.7423 (0.117)
0.6071 (0.223)
0.5461 (0.139)
0.4869 (0.146)
RF 0.6680 (0.143)
0.5393 (0.204)
0.4663 (0.152)
0.4113 (0.168)
LR 0.7183 (0.073)
0.5893 (0.088)
0.5308 (0.069)
0.4780 (0.100)
Figure 2. Receiver Operating Characteristics plot showing mean area under curve of all the classifiers of Model-1 when all HD sessions were considered.
Figure 3. Receiver Operating Characteristics plot showing mean area under curve of all the classifiers of Model-2 when all HD sessions were considered.
Figure 3. Receiver Operating Characteristics plot showing mean area under curve of all the classifiersof Model-2 when all HD sessions were considered.
Sensors 2018, 18, 2833 11 of 16
Sensors 2018, 18, x 11 of 16
Figure 4. Receiver Operating Characteristics plot showing mean area under curve of all the classifiers of Model 3 when all HD sessions were considered.
Figure 5. Receiver Operating Characteristics plot showing mean area under curve of all the classifiers of Model 1 when the 15 recent HD sessions were considered.
Figure 6. Receiver Operating Characteristics plot showing mean area under curve of all the classifiers of Model 2 when the 15 recent HD sessions were considered.
Figure 4. Receiver Operating Characteristics plot showing mean area under curve of all the classifiersof Model 3 when all HD sessions were considered.
Sensors 2018, 18, x 11 of 16
Figure 4. Receiver Operating Characteristics plot showing mean area under curve of all the classifiers of Model 3 when all HD sessions were considered.
Figure 5. Receiver Operating Characteristics plot showing mean area under curve of all the classifiers of Model 1 when the 15 recent HD sessions were considered.
Figure 6. Receiver Operating Characteristics plot showing mean area under curve of all the classifiers of Model 2 when the 15 recent HD sessions were considered.
Figure 5. Receiver Operating Characteristics plot showing mean area under curve of all the classifiersof Model 1 when the 15 recent HD sessions were considered.
Sensors 2018, 18, x 11 of 16
Figure 4. Receiver Operating Characteristics plot showing mean area under curve of all the classifiers of Model 3 when all HD sessions were considered.
Figure 5. Receiver Operating Characteristics plot showing mean area under curve of all the classifiers of Model 1 when the 15 recent HD sessions were considered.
Figure 6. Receiver Operating Characteristics plot showing mean area under curve of all the classifiers of Model 2 when the 15 recent HD sessions were considered.
Figure 6. Receiver Operating Characteristics plot showing mean area under curve of all the classifiersof Model 2 when the 15 recent HD sessions were considered.
Sensors 2018, 18, 2833 12 of 16
Sensors 2018, 18, x 12 of 16
Figure 7. Receiver Operating Characteristics plot showing mean area under curve of all the classifiers of Model 3 when the 15 recent HD sessions were considered.
4. Discussion
In this study, we presented the novel use of non-contact sensor data in clinical settings during the process of HD of 109 patients. Hemodialysis is a procedure to purify the blood when the kidneys stop functioning normally. Hemodialysis may cause certain complications like cardiovascular, non-cardiovascular, and cerebrovascular issues, and even sudden death. During the 3237 HD sessions and 23 weeks of this study, we found that 78 patients reported 166 episodes of clinical events. We compared the differences among the group of patients who reported clinical events to those who did not report any clinical event. We found a statistically significant difference in the heart rates and respiration rates (p < 0.0001) recorded by the non-contact sensors among the two groups of patients. Various HRV parameters also showed significant differences, like high frequency and low frequency. The heart rate in both the first five minutes and last five minutes was found to be higher in the event group of patients compared to the no-event group of patients by an almost five-point basis. A similar pattern was observed for the respiration rate. Our findings suggest that an increased heart rate and respiration rate indicates the unwellness of the patient and that some kind of clinical event may happen in the near future that needs attention and care in advance.
It is further observed that the mean heart rate values of the last five minutes (HR_LFM) were slightly higher than the heart rate values for the first five minutes (HR_FFM). Various studies conducted in the past also point towards an increase in heart rate during HD [47–50]. This phenomenon is observed across both groups of patients. It is generally observed that the heart rate increases during HD because of the removal of excess body water, which triggers a significant increase in the heart rate. This finding is consistent with those reported in the literature. The mean values of all vital parameters are shown in Table 3. The basic statistical analysis shows differences in the values of most of the vital parameters among the two groups of patients that were also found to be statistically significant.
The performance of the developed predictive models was also in line with the statistical findings. We obtained very high accuracy for our ML-based predictive models. In this study, we demonstrated the use of non-contact sensors to monitor the vital parameters of patients during HD and in the early prediction of any clinical event that may occur during the period of hemodialysis-based treatment. The results of our study show the possibility of accurately and precisely predicting chances in a clinical event. Although we were dealing with a smaller dataset, the model we developed still performed extremely well. If we evaluate our dataset in terms of the frequency of data points, we had a reasonable number of data samples, namely 32,370. However, if we evaluate our dataset in terms of individual patients, we had only 109 data points, which is very few to train a ML model. Model 1 exploited the large frequency of our dataset, whereas model 3 relied on the individual patients. In model 1, we achieved 90.16% ROC with a recall rate of 88.47% with a kNN classifier and ROC of 84.97%, with a recall of 82.09% in the AdaBoost classifier. In model 2, we achieved 80.36% ROC with a recall rate of 80.73% with an AdaBoost classifier. Recall or sensitivity analysis was an
Figure 7. Receiver Operating Characteristics plot showing mean area under curve of all the classifiersof Model 3 when the 15 recent HD sessions were considered.
4. Discussion
In this study, we presented the novel use of non-contact sensor data in clinical settings duringthe process of HD of 109 patients. Hemodialysis is a procedure to purify the blood when thekidneys stop functioning normally. Hemodialysis may cause certain complications like cardiovascular,non-cardiovascular, and cerebrovascular issues, and even sudden death. During the 3237 HD sessionsand 23 weeks of this study, we found that 78 patients reported 166 episodes of clinical events.We compared the differences among the group of patients who reported clinical events to thosewho did not report any clinical event. We found a statistically significant difference in the heart ratesand respiration rates (p < 0.0001) recorded by the non-contact sensors among the two groups of patients.Various HRV parameters also showed significant differences, like high frequency and low frequency.The heart rate in both the first five minutes and last five minutes was found to be higher in the eventgroup of patients compared to the no-event group of patients by an almost five-point basis. A similarpattern was observed for the respiration rate. Our findings suggest that an increased heart rate andrespiration rate indicates the unwellness of the patient and that some kind of clinical event may happenin the near future that needs attention and care in advance.
It is further observed that the mean heart rate values of the last five minutes (HR_LFM) wereslightly higher than the heart rate values for the first five minutes (HR_FFM). Various studies conductedin the past also point towards an increase in heart rate during HD [47–50]. This phenomenon is observedacross both groups of patients. It is generally observed that the heart rate increases during HD becauseof the removal of excess body water, which triggers a significant increase in the heart rate. This findingis consistent with those reported in the literature. The mean values of all vital parameters are shown inTable 3. The basic statistical analysis shows differences in the values of most of the vital parametersamong the two groups of patients that were also found to be statistically significant.
The performance of the developed predictive models was also in line with the statistical findings.We obtained very high accuracy for our ML-based predictive models. In this study, we demonstratedthe use of non-contact sensors to monitor the vital parameters of patients during HD and in the earlyprediction of any clinical event that may occur during the period of hemodialysis-based treatment.The results of our study show the possibility of accurately and precisely predicting chances in a clinicalevent. Although we were dealing with a smaller dataset, the model we developed still performedextremely well. If we evaluate our dataset in terms of the frequency of data points, we had a reasonablenumber of data samples, namely 32,370. However, if we evaluate our dataset in terms of individualpatients, we had only 109 data points, which is very few to train a ML model. Model 1 exploitedthe large frequency of our dataset, whereas model 3 relied on the individual patients. In model1, we achieved 90.16% ROC with a recall rate of 88.47% with a kNN classifier and ROC of 84.97%,with a recall of 82.09% in the AdaBoost classifier. In model 2, we achieved 80.36% ROC with a recall
Sensors 2018, 18, 2833 13 of 16
rate of 80.73% with an AdaBoost classifier. Recall or sensitivity analysis was an important measure inthe context of our study. It tells us the rate of predicting true positives. A high recall rate was achievedin this study, which validates the practicality of an early warning system based predictive analyticsusing non-contact sensor data in hospital settings. This type of system can alert the healthcare provider,physicians, and healthcare professionals so that they provide extra care to the patient and the patientcan be saved from any forthcoming life-threatening clinical events.
In our model, we selected a subset of variables from the available variables. We used heart rateand respiration rate, two features that had HF and LF from the HRV along with age, gender and BMI asinput features in our models. The rest of the available variables were not considered as input featuresfor the models. The notion behind selecting HR and RR is that they are the two main vital parametersused for continuous patient monitoring. The objective of this study was to understand whether we canmake early predictions of clinical events by monitoring these vital parameters. The HRV parametersare basically variables derived from the heart rate. HRV is related to the autonomic nervous system.High frequency is linked to the parasympathetic nervous system (PSNS) and LF is linked to thesympathetic nervous system (SNS), as reported in the literature [51]. The other HRV variables werenot considered as input features because they did not have enough influence on the outcome of theclassifiers. Therefore, we considered these variables as important markers for the prediction of thephysiological health of patients. Further, there are various methods for deciding the best subset offeatures [52] reported in the literature, namely the filter method, wrapper method, and embeddedmethod. We used the backward elimination technique of the wrapper method for feature selection,which showed optimum performance for the predictive models developed in this study.
We found that under real circumstances the use of non-contact sensors is highly beneficial in twoways. Firstly, it provides the continuous monitoring of the vital parameters of the patient during theHD session. It can help the physician or the care provider to take a decision in providing better careand comfort to the patients. Secondly, this data can be used for analyses and the prediction of anyclinical emergency. It could predict event occurrences based on the increased heart rate and respirationrate during HD. Although it would be early to say that the proposed supervised ML-based predictivemodel could be used in real life, on the basis of the obtained results we suggest that more such studiesare conducted using non-contact sensors in clinical settings. These proposed studies could validate thefindings of this study and further be useful in the development of a more robust predictive applicationto predict clinical events in advance.
5. Limitations of This Study
We had certain limitations in this study in terms of the clinical variables available for analysis.We had only three critical parameters in our dataset to build our model, i.e., heart rate, respirationrate, and HRV parameters. The inclusion of other vital parameters like blood pressure and patient’smedical history could add more weight to such predictive modeling approaches. One of the majorissues observed in HD is the sudden death of patients, including various other events like ER visits orinpatient stays due to cardiovascular problems, infection, renal problems, etc. During this study, sixpeople suffered sudden death. It was one of our objectives to develop a multi-class prediction modelthat is able to predict chances of different events occurring in advance. We had details of the medicalissues reported during the clinical event in the form of International Classification of Diseases (ICD)codes, but the number of cases reported was very low. Therefore, in this study we limited our analysisto a binary classification model instead of building a multi-class classification model.
6. Conclusions
The initial findings and the performance of the predictive model developed using this data arehighly encouraging. It is also a novel application for non-contact sensors in clinical settings, especiallyfor HD patients. The authors found very few studies that used AI for the prediction of events in livertransplant patients, but could not find any study using AI on sensor data to predict clinical events in
Sensors 2018, 18, 2833 14 of 16
HD patients. On the basis of our findings, we recommend further studies using non-contact sensorsto monitor the vital parameters of chronic kidney disease (CKD) patients during HD. This can beutilized to predict the possibility of medical problems in HD patients in advance. In addition, as a partof future work, we are further interested in analyzing this data more specifically using the availableICD code information reported during clinical events. This will enable us to identify whether there isany difference in the recordings when the event is reported as compared to when it is not reported.Furthermore, a patient might have reported several issues during the reporting of clinical events.It will be intriguing to learn whether there is any association between the different types of medicalissues reported by the patients and the trends between different patients as far as the association ofdifferent medical issues are concerned. We also plan to check the importance of each feature variableused in the ML models. It will be intriguing to learn which feature variable has greater impact on theefficiency of the developed predictive ML models.
Author Contributions: Conceptualization: S.S.A.; Data curation: P.-Y.H; Formal analysis: S.S.T and H.-Y.C;Investigation: S.S.T.; Methodology: S.S.T.; Supervision, S.S.A., R.B.R. and Y.-C.L.; Validation: S.S.T., R.B.R.;Visualization, S.S.T.; Writing—original draft, S.S.T.; Writing—review & editing: S.S.T., S.S.A., R.B.R., S.M., A.A.N.
Funding: This research is funded by the Ministry of Science and Technology (MOST) under grant MOST106-2221-E-038-005 and the Tatung Medical and Healthcare Technologies under grant number A-105-010.This project has been sponsored in part by MOST under grant 106-2923-E-038-001-MY2, 107-2923-E-038 -001-MY2, Taipei Medical University under grant number 106-3805-004-111 and Wanfang hospital under grantnumber 106TMU-WFH-01-4.
Acknowledgments: We are thankful to the Ministry of Science and Technology (MOST), Tatung Medical andHealthcare Technologies, and Taipei Medical University for providing the necessary funding to carry out thisresearch work. We are thankful to Taipei Medical University Hospital for facilitating the data collection on HDpatients. We are also thankful to EarlySense Ltd., Israel for providing us with the non-contact sensor and rawHRV data. We also acknowledge Rajendra Mishra School of Engineering Entrepreneurship, Indian Institute ofTechnology Kharagpur, India for this collaboration and enabling student exchange with partial financial supportto facilitate this research work.
Conflicts of Interest: The authors declare no conflicts of interest.
References
1. Villa, G.; Ricci, Z.; Ronco, C. Renal Replacement Therapy. Crit. Care Clin. 2015, 31, 839–848. [CrossRef][PubMed]
2. NIDDK. Choosing a Treatment for Kidney Failure | NIDDK. National Institute of Diabetes and Digestiveand Kidney Diseases, 2016. Available online: https://www.niddk.nih.gov/health-information/kidney-disease/kidney-failure/choosing-treatment (accessed on 10 June 2018).
3. Lin, Y.C.; Hsu, C.Y.; Kao, C.C.; Chen, T.W.; Chen, H.H.; Hsu, C.C.; Wu, M.S. Incidence and Prevalence ofESRD in Taiwan Renal Registry Data System (TWRDS): 2005–2012. Acta Nephrol. 2014, 28, 65–68.
4. Shafiee, M.A.; Chamanian, P.; Shaker, P.; Shahideh, Y.; Broumand, B. The Impact of Hemodialysis Frequencyand Duration on Blood Pressure Management and Quality of Life in End-Stage Renal Disease Patients.Healthcare 2017, 5, 52. [CrossRef] [PubMed]
5. Susantitaphong, P.; Koulouridis, I.; Balk, E.M.; Madias, N.E.; Jaber, B.L. Effect of Frequent or ExtendedHemodialysis on Cardiovascular Parameters: A Meta-analysis. Am. J. Kidney Dis. 2012, 59, 689–699.[CrossRef] [PubMed]
6. Ravani, P.; Palmer, S.C.; Oliver, M.J.; Quinn, R.R.; MacRae, J.M.; Tai, D.J.; Pannu, N.I.; Thomas, C.;Hemmelgarn, B.R.; Craig, J.C.; et al. Associations between Hemodialysis Access Type and Clinical Outcomes:A Systematic Review. J. Am. Soc. Nephrol. 2013, 24, 465–473. [CrossRef] [PubMed]
7. Han, S.S.; Cho, G.Y.; Park, Y.S.; Baek, S.H.; Ahn, S.Y.; Kim, S.; Chin, H.J.; Chae, D.W.; Na, K.Y. Predictivevalue of echocardiographic parameters for clinical events in patients starting hemodialysis. J. Korean Med. Sci.2015, 30, 44–53. [CrossRef] [PubMed]
8. Raszeja-Wyszomirska, J.; Glowczynska, R.; Kostrzewa, K.; Janik, M.; Zygmunt, M.; Zborowska, H.;Krawczyk, M.; Niewinski, G.; Galas, M.; Krawczyk, M.; et al. Evaluation of liver graft recipient work-upin predicting of early cardiovascular events during liver transplantation—A single-center experience.Transplant. Proc. 2018, in press. [CrossRef]
Sensors 2018, 18, 2833 15 of 16
9. Gallegos-Orozco, J.F.; Charlton, M.R. Predictors of Cardiovascular Events After Liver Transplantation.Clin. Liver Dis. 2017, 21, 367–379. [CrossRef] [PubMed]
10. Cook, D.J.; Augusto, J.C.; Jakkula, V.R. Ambient intelligence: Technologies, applications, and opportunities.Pervasive Mob. Comput. 2009, 5, 277–298. [CrossRef]
11. Barsocchi, P.; Cimino, M.G.C.A.; Ferro, E.; Lazzeri, A.; Palumbo, F.; Vaglini, G. Monitoring elderly behaviorvia indoor position-based stigmergy. Pervasive Mob. Comput. 2015, 23, 26–42. [CrossRef]
12. Chan, M.; Estève, D.; Fourniols, J.-Y.; Escriba, C.; Campo, E. Smart wearable systems: Current status andfuture challenges. Artif. Intell. Med. 2012, 56, 137–156. [CrossRef] [PubMed]
13. Dobbins, C.; Rawassizadeh, R.; Momeni, E. Detecting physical activity within lifelogs towards preventingobesity and aiding ambient assisted living. Neurocomputing 2016, 230, 110–132. [CrossRef]
14. Pavel, M.; Jimison, H.; Spring, B. Behavioral Informatics: Dynamical Models for Measuring and AssessingBehaviors for Precision Interventions. In Proceedings of the 2016 38th Annual International Conferenceof the IEEE Engineering in Medicine and Biology Society (EMBC), Orlando, FL, USA, 16–20 August 2016;pp. 190–193.
15. Yang, J.J.; Li, J.; Mulder, J.; Wang, Y.; Chen, S.; Wu, H.; Wang, Q.; Pan, H. Emerging information technologiesfor enhanced healthcare. Comput. Ind. 2015, 69, 3–11. [CrossRef]
16. Liu, L.; Stroulia, E.; Nikolaidis, I.; Miguel-Cruz, A.; Rincon, A.R. Smart homes and home health monitoringtechnologies for older adults: A systematic review. Int. J. Med. Inform. 2016, 91, 44–59. [CrossRef] [PubMed]
17. Chan, M.; Estève, D.; Escriba, C.; Campo, E. A review of smart homes—Present state and future challenges.Comput. Methods Programs Biomed. 2008, 91, 55–81. [PubMed]
18. Teruel, J.L.; Lucas, M.F.; Marcen, R.; Rodriguez, J.R.; Sánchez, J.L.; Rivera, M.; Liano, F.; Ortuno, J. Differencesbetween Blood Flow as Indicated by the Hemodialysis Blood Roller Pump and Blood Flow Measured byan Ultrasonic Sensor. Nephron 2000, 85, 142–147. [CrossRef] [PubMed]
19. Trebbels, D.; Hradetzky, D.; Zengerle, R. Capacitive on-line hematocrit sensor design based on impedancespectroscopy for use in hemodialysis machines. Ann. Int. Conf. IEEE Eng. Med. Biol. Soc. 2009, 2009, 1208–1211.
20. Du, Y.-C.; Lim, B.-Y.; Ciou, W.-S.; Wu, M.-J. Novel Wearable Device for Blood Leakage Detection duringHemodialysis Using an Array Sensing Patch. Sensors 2016, 16, 849. [CrossRef] [PubMed]
21. Barbieri, C.; Molina, M.; Ponce, P.; Tothova, M.; Cattinelli, I.; Titapiccolo, J.I.; Mari, F.; Amato, C.; Leipold, F.;Wehmeyer, W.; et al. An international observational study suggests that artificial intelligence for clinicaldecision support optimizes anemia management in hemodialysis patients. Kidney Int. 2016, 90, 422–429.[CrossRef] [PubMed]
22. Tal, A.; Shinar, Z.; Shaki, D.; Codish, S.; Goldbart, A. Validation of Contact-Free Sleep Monitoring Devicewith Comparison to Polysomnography. J. Clin. Sleep Med. 2017, 13, 517–522. [CrossRef] [PubMed]
23. Hall, T.; Lie, D.Y.; Nguyen, T.Q.; Mayeda, J.C.; Lie, P.E.; Lopez, J.; Banister, R.E. Non-Contact Sensor forLong-Term Continuous Vital Signs Monitoring: A Review on Intelligent Phased-Array Doppler SensorDesign. Sensors 2017, 17, 2632. [CrossRef] [PubMed]
24. Klap, T.; Shinar, Z. Using piezoelectric sensor for continuous-contact-free monitoring of heart and respirationrates in real-life hospital settings. In Proceedings of the Computing in Cardiology Conference (CinC),Zaragoza, Spain, 22–25 September 2013.
25. Zimlichman, E.; Szyper-Kravitz, M.; Shinar, Z.; Klap, T.; Levkovich, S.; Unterman, A.; Rozenblum, R.;Rothschild, J.M.; Amital, H.; Shoenfeld, Y. Early recognition of acutely deteriorating patients in non-intensivecare units: Assessment of an innovative monitoring technology. J. Hosp. Med. 2012, 7, 628–633. [CrossRef][PubMed]
26. Ben-Ari, J.; Zimlichman, E.; Adi, N.; Sorkine, P. Contactless respiratory and heart rate monitoring: Validationof an innovative tool. J. Med. Eng. Technol. 2010, 34, 393–398. [CrossRef] [PubMed]
27. Davidovich, M.L.Y.; Karasik, R.; Tal, A.; Shinar, Z. Sleep Apnea Screening with a Contact-Free Under-the-Mattress Sensor. In Proceedings of the Computing in Cardiology Conference (CinC), Vancouver, BC, Canada,11–14 September 2016.
28. Lahdenoja, O.; Hurnanen, T.; Tadi, M.J.; Pänkäälä, M.; Koivisto, T. Heart Rate Variability Estimation with JointAccelerometer and Gyroscope Sensing. In Proceedings of the 2016 Computing in Cardiology Conference(CinC), Vancouver, BC, Canada, 11–14 September 2016.
Sensors 2018, 18, 2833 16 of 16
29. Malik, M.; Bigger, J.T.; Camm, A.J.; Kleiger, R.E.; Malliani, A.; Moss, A.J.; Schwartz, P.J. Heart rate variability:Standards of measurement, physiological interpretation, and clinical use. Eur. Heart J. 1996, 17, 354–381.[CrossRef]
30. Sinnreich, R.; Kark, J.D.; Friedlander, Y.; Sapoznikov, D.; Luria, M.H. Five minutes recordings of heartrate variability for population studies: Repeatability and age-sex characteristics. Heart 1998, 80, 156–162.[CrossRef] [PubMed]
31. Min, K.B.; Min, J.-Y.; Paek, D.; Cho, S.-I.; Son, M. Is 5-minute heart rate variability a useful measure formonitoring the autonomic nervous system of workers? Int. Heart J. 2008, 49, 175–181. [CrossRef] [PubMed]
32. Cox, D.R. The Regression Analysis of Binary Sequences. J. R. Stat. Soc. Ser. B Methodol. 1958, 20, 215–242.33. Walker, S.H.; Duncan, D.B. Estimation of the Probability of an Event as a Function of Several Independent
Variables. Biometrika 1967, 54, 167. [CrossRef] [PubMed]34. Altman, N.S. An Introduction to Kernel and Nearest-Neighbor Nonparametric Regression. Am. Stat. 1992,
46, 175–185.35. Burba, F.; Ferraty, F.; Vieu, P. k-Nearest Neighbour method in functional nonparametric regression.
J. Nonparametr. Stat. 2009, 21, 453–469. [CrossRef]36. Freund, Y.; Schapire, R.E. A Short Introduction to Boosting. J. Jpn. Soc. Artif. Intell. 1999, 14, 771–780.37. Freund, Y.; Schapire, R.E. A Decision-Theoretic Generalization of On-Line Learning and an Application to
Boosting. J. Comput. Syst. Sci. 1997, 55, 119–139. [CrossRef]38. Hastie, T.; Tibshirani, R.; Friedman, J. Random Forests. In The Elements of Statistical Learning: Data Mining,
Inference, and Prediction; Springer: New York, NY, USA, 2009; pp. 587–604.39. Hastie, T.; Tibshirani, R.; Friedman, J. The Elements of Statistical Learning; Springer: New York, NY, USA, 2009.40. Cristianini, N.; Shawe-Taylor, J. An Introduction to Support Vector Machines: And Other Kernel-Based Learning
Methods; Cambridge University Press: Cambridge, UK, 2000.41. Pedregosa, F.; Varoquaux, G.; Gramfort, A.; Michel, V.; Thirion, B.; Grisel, O.; Blondel, M.; Prettenhofer, P.;
Weiss, R.; Dubourg, V.; et al. Scikit-learn: Machine Learning in Python. J. Mach. Learn. Res. 2011, 12,2825–2830.
42. Chawla, N.V.; Bowyer, K.W.; Hall, L.O.; Kegelmeyer, W.P. SMOTE: Synthetic Minority Over-samplingTechnique. J. Artif. Intell. Res. 2002, 16, 321–357. [CrossRef]
43. Das, B.; Krishnan, N.C.; Cook, D.J. RACOG and wRACOG: Two Probabilistic Oversampling Techniques.IEEE Trans. Knowl. Data Eng. 2015, 27, 222–234. [CrossRef] [PubMed]
44. Arlot, S.; Celisse, A. A survey of cross-validation procedures for model selection. Stat. Surv. 2010, 4, 40–79.[CrossRef]
45. Powers, D.M. Evaluation: from precision, recall and F-measure to ROC, informedness, markednesscorrelation. J. Mach. Learn. Technol. ISSN 2011, 2, 2229–3981.
46. Charan, J.; Biswas, T. How to calculate sample size for different study designs in medical research? Indian J.Psychol. Med. 2013, 35, 121–126. [CrossRef] [PubMed]
47. Severi, S.; Cavalcanti, S.; Mancini, E.; Santoro, A. Heart rate response to hemodialysis-induced changes inpotassium and calcium levels. J. Nephrol. 2001, 14, 488–496. [PubMed]
48. Lertdumrongluk, P.; Streja, E.; Rhee, C.M.; Sim, J.J.; Gillen, D.; Kovesdy, C.P.; Kalantar-Zadeh, K. Changesin pulse pressure during hemodialysis treatment and survival in maintenance dialysis patients. Clin. J.Am. Soc. Nephrol. 2015, 10, 1179–1191. [CrossRef] [PubMed]
49. Iseki, K.; Nakai, S.; Yamagata, K.; Tsubakihara, Y. Tachycardia as a predictor of poor survival in chronichaemodialysis patients. Nephrol. Dial. Transplant. 2011, 26, 963–969. [CrossRef] [PubMed]
50. Chan, C.T.; Chertow, G.M.; Daugirdas, J.T.; Greene, T.H.; Kotanko, P.; Larive, B.; Pierratos, A.; Stokes, J.B.Effects of daily hemodialysis on heart rate variability: Results from the Frequent Hemodialysis Network(FHN) Daily Trial. Nephrol. Dial. Transplant. 2014, 29, 168–178. [CrossRef] [PubMed]
51. Billman, G.E. The LF/HF ratio does not accurately measure cardiac sympatho-vagal balance. Front. Physiol.2013, 4, 26. [CrossRef] [PubMed]
52. Guyon, I.; Andre, E. An Introduction to Variable and Feature Selection. J. Mach. Learn. Res. 2003, 3, 1157–1182.
© 2018 by the authors. Licensee MDPI, Basel, Switzerland. This article is an open accessarticle distributed under the terms and conditions of the Creative Commons Attribution(CC BY) license (http://creativecommons.org/licenses/by/4.0/).