Embed Size (px)
Citation preview
27
FACTORS INFLUENCING INVESTMENT DECISION
MAKING IN SWIFTLET RANCHING INDUSTRY: THE CASE
OF GUA MUSANG AND JOHOR BAHRU
Fatin F. Ya’acob1
Faculty of Economic and Management,
Universiti Putra Malaysia.
(Email: [email protected])
Mohd Shahwahid Haji Othman2
Professor, Faculty of Economic and Management,
Universiti Putra Malaysia.
(Email: [email protected])
Rabiatul Munirah Alpandi3
Faculty of Economic and Management,
Universiti Putra Malaysia.
(Email: [email protected])
Siti Mariam Mellisa Abdullah4
Faculty of Economic and Management,
Universiti Putra Malaysia.
(Email: [email protected])
Mohd Hafiz Ghazali5
Faculty of Economics and Management,
University Putra Malaysia.
(Email: [email protected])
Received date: 02-07-2019
Revised date: 04-07-2019
Accepted date: 11-08-2019
Published date: 11-09-2019
To cite this document: Ya’acob, F. F., Haji Othman, M. S., Alpandi, R. M., Abdullah, S. M.
M., & Ghazali, M. H. (2019). Factors Influencing Investment Decision Making in Swiftlet
Ranching Industry: The Case of Gua Musang and Johor Bahru. Journal of Tourism, Hospitality
and Environment Management, 4(16), 27-38.
DOI: 10.35631/JTHEM.416003 ________________________________________________________________________________________
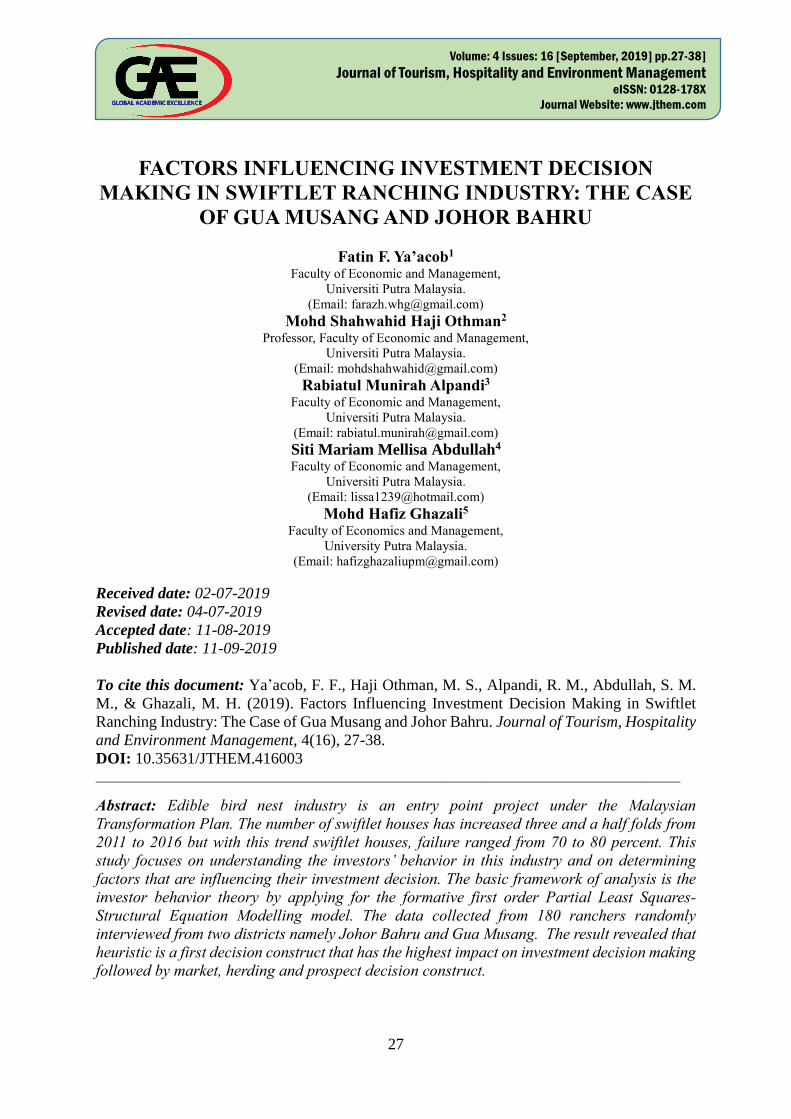
Abstract: Edible bird nest industry is an entry point project under the Malaysian
Transformation Plan. The number of swiftlet houses has increased three and a half folds from
2011 to 2016 but with this trend swiftlet houses, failure ranged from 70 to 80 percent. This
study focuses on understanding the investors’ behavior in this industry and on determining
factors that are influencing their investment decision. The basic framework of analysis is the
investor behavior theory by applying for the formative first order Partial Least Squares-
Structural Equation Modelling model. The data collected from 180 ranchers randomly
interviewed from two districts namely Johor Bahru and Gua Musang. The result revealed that
heuristic is a first decision construct that has the highest impact on investment decision making
followed by market, herding and prospect decision construct.
Volume: 4 Issues: 16 [September, 2019] pp.27-38] Journal of Tourism, Hospitality and Environment Management
eISSN: 0128-178X
Journal Website: www.jthem.com
28
Keywords: Edible Bird Nest; Swiftlet Industry; Investor Behavior Theory; Partial Least
Squares-Structural Equation Modelling; Johor Bharu and Gua Musang
___________________________________________________________________________
Introduction
The swiftlet industry is listed among the twelve Entry Point Projects (EPP) under the
Agricultural national key economic area (NKEA) which is one of the cores of the Malaysian
economic transformation programmes (ETP). The industry is seen as one promising income
generation that has a high growth potential to be developed into a major industry for the
Malaysian economy. This will enable Malaysia to tap a large global market that is rapidly
expanding. The world demand for edible bird nest (EBN) is flourishing and not all countries
can produce EBN because of the differences in climate. Although the production of the bird
nest takes a long time, but the returns received are very encouraging and can be highlighted as
one of the country’s future sources of income if full attention is given to it and all parties are
willing to cooperate together. Hence, with the encouragement from the Malaysian government,
the number of swiftlet house increase from 6,048 swiftlet houses in 2011 to 21,421 until the
end of 2016.
However, even though the number of swiftlet houses increase from year to year, about 70 to
80 percent of these houses have failed to attract the swiftlets to nest (Alias et al, 2013). An
important reason provided is the lack of understanding and knowledge on how to manage the
swiftlet houses. The low figure of success should not be ignored by forthcoming investors.
Given this quandary this leads to the question of what behavioral factors are influencing
investors to continue investing in the swiftlet ranching. Therefore, the objective of this study
is to to identify factors that influence investors to invest in swiftlet ranching industry. In
addition, this study will provide a comprehensive understanding of the investors’ behavior in
this industry and how these factors influence their investment decision is needed. It will be
useful for investors to understand common behaviors from which to justify their reactions for
better returns.
The scope of this study seeks to know the factors that influence investors to invest in this
industry eventhough they alert that this industry is unpredictable and the number of inefficient
swiftlet house increase simultaneously with the increasing number of swiftlet house year by
year. The rising investments in swiftlet ranching although welcome, have to be understood and
monitored by potential investors and the Department of Veterinary Services (DVS), the agency
licensing and managing the swiftlet industry. This is necessary to ensure a healthy and
sustainable development of the industry. Potential investors have to be provided with a clear
understanding of what factors are influencing existing investors. In this way a clear
understanding of what factors are influencing existing investors. In this way decisions to be
maddecisions to be made by potential investors are guided with appropriate knowledge. e by
potential investors are guided with appropriate knowledge. For cater this objective, the investor
behavioural theory was applied which have 4 factors namely heuristic, prospect, market and
herding in order to study the behavioral factors influencing decision making by using Partial
Least Squares Structural Equation Modeling (PLS-SEM).
Literature Review
Several behavioral factors have been put forth to explain human decision making. Among them
heuristics, prospects, market and herding. Heuristics are defined as the rules of thumb, which
make decision making easier, especially in complex and uncertain environments by reducing
29
the complexity of assessing probabilities (Ritter, 2003). According to (Waweru et al., 2008)
generally, these heuristics are quite useful, particularly when time is limited however,
sometimes it led to biases (Kahneman & Tversky, 1974; Ritter, 2003). In investigating factors
belonging to heuristic theory, Kahneman & Tversky (1974) studied and introduced
representativeness, availability bias, and anchoring as being influential while Waweru et al.
(2007) introduced two alternative factors of gambler’s fallacy and overconfidence. In property
investment decision making, Waweru et al., (2008) suggested that heuristic is the major
behavioural factors of influence. Kengatharan (2014) further agreed that heuristic variables
have a positive impact on investment decision. Kimeu et al., (2016) revealed that heuristic
factors such as an individual trust and confidence in their skills and knowledge can help in
outperforming market, dependence on previous experience and future forecasted changes of
price on investment decisions.
Prospect theory focuses on subjective decision-making whereby decisions are influenced by
the investors’ value system (Filbeck, Hatfield &Horvath, 2005). Theory of prospect described
some of the effective mental conditions on the decision making process such as loss aversion,
regret aversion, and mental accounting (Waweru et al., 2008). Kahneman & Tversky (1979)best
describes the prospect theory in economic psychology phenomena whereby people have an
irrational tendency to be less willing to gamble with profits than with losses. People tend to
under-weigh probable outcomes over certain ones and they response differently to similar
situations depending on the context of losses or gains in which they are presented. Kengatharan
(2014) identified that loss aversion and regret aversion tended to have a moderate impact on
investment decision making.
Waweru et al. (2008) identified the market as having an impact on investors’ decision making.
Among these market variables include price changes, market information, past trends,
customer preference, over-reaction to price changes, and fundamentals of underlying
investment. It is believed that changes in market information, fundamentals of the underlying
market and changes in price empirically proved to have the high influence on decision-making
behavior of investors.
Herding effect in financial market is identified as the tendency of investors’ behaviors to follow
the actions of others. Investors may prefer herding if they believe that herding can help them
to extract useful and reliable information. Herding can contribute to the evaluation of
professional performance because low-ability individuals may mimic the behavior of their
high-ability peers in order to develop their professional reputation (Kallinterakis, Munir &
Markovic, 2010).
As seen above, behavioral factors impact the investment decisions of investors in both financial
and property markets. The four behavioral factor groups of heuristic, prospect, market and
herding could be used to recognize individual swiftlet ranching business decision makings.
Given the above, the following hypotheses are proposed:
H1: Heuristic will have positive effect to investment decision making in swiftlet ranching
H2: Prospect will have positive effect to investment decision making in swiftlet ranching
H3: Market factor will have positive effect to investment decision making in swiftlet ranching
H4: Herding will have positive effect to investment decision making in swiftlet ranching
The above sets of hypotheses on behavioral factors could be applied into decisions of individual
investors in the swiftlet ranching business.

30
Methodology
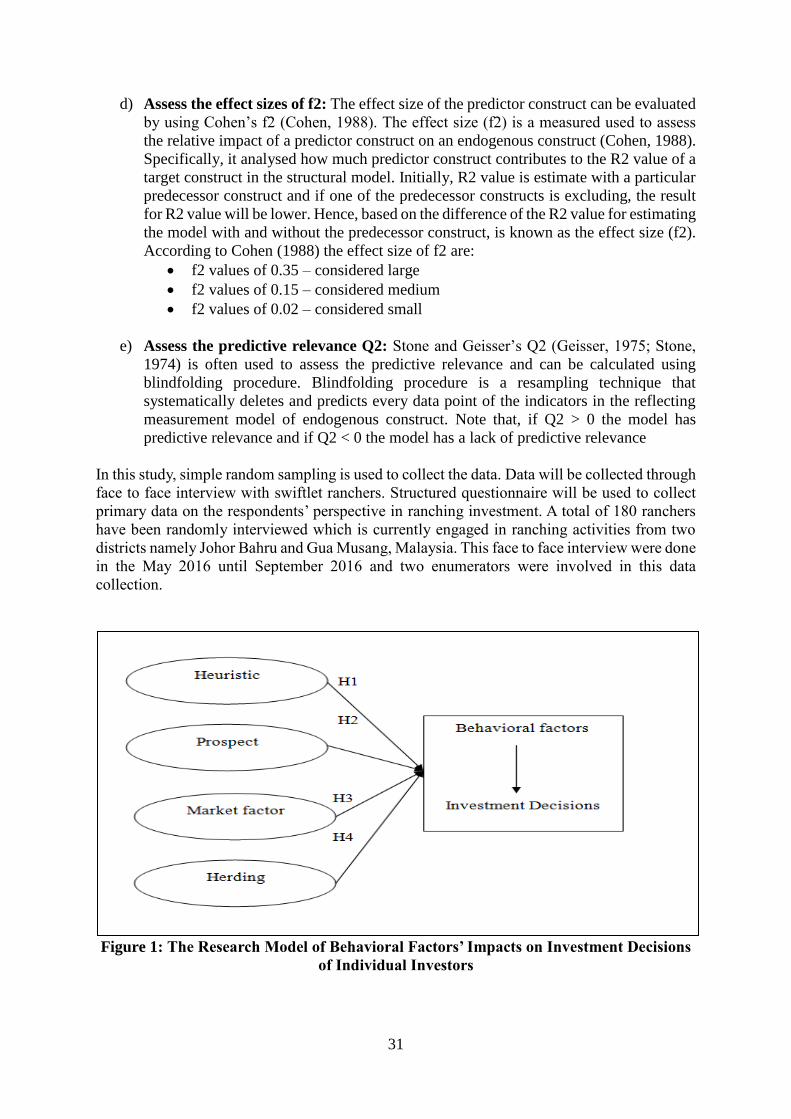
In light of the aforementioned, the research model of the study is developed as shown in Figure
1 below. This approach uses five-point likert scale to gather the independent and dependent
variable data. All instruments were adapted and modified from previous literatures to answer
the objective of the study. The questionnaire was adapted from previous research namely by
Luong and Ha, (2011). Formative first order in PLS-SEM was used to cater the behavioral
factor influencing investment decision making. There are few assessments of formative
measurement model need to test which are convergent validity, collinearity issues and
significance and relevance of the formative indicators.
There are several assessments need to be fulfill for measurement model (outer model).
a) Convergent validity: The minimum path coefficient linking the two constructs is 0.70
and above.
b) Collinearity Assessment: In order to check the collinearity issues, the variance
inflation factor (VIF) need to be check. The value of VIF must be below than 3.3
(Diamantopoulus and Siguaw, 2006). According to Hair, Ringle and Sarstedt (2011),
the value of VIF not more than 5 can be accepted.
c) Significance and relevance of the indicators: This assessment wants to confirm
whether formative indicators contribute to forming the construct. This study using
bootstrapping to know if the outer weights in formative measurement model are
significantly difference from zero. If the outer weight is significant, the interpretation
of the outer weight can be continued.
After all assessment of measurement model (outer model) are completed, then the structural
model (inner model) need to be examined. There are several assessments need to fulfil.
a) Assess structural model for collinearity issues: To assess collinearity, the same
measure as in evaluation formative measurement model which is VIF can be applied.
Again, if VIF > 5 and higher, respectively indicate a potential collinearity problem
(Hair, Ringle and Sarstedt, 2011). A more stringent criteria by Diamantopoulos and
Sigouw (2006), says that where VIF ≥ 3.3 and higher, it respectively indicates a
potential collinearity problem.
b) Assess the significance and relevance of the structural model relationship (path
coefficient, Ƥ): The significance test will be conducted by using bootstrapping
procedure in order to determine t-value and p-value.
c) Assess the level of R2: To evaluate the predictive power of the research model, it is a
need to examine the explained variance (R2) of the endogenous constructs. Using R2
to assess the structural model is consistent with the objective of PLS to maximize
variance explained in the endogenous variables. The literature suggests that R2values
of 0.67 (substantial), 0.33 (moderate), and 0.19 (weak) respectively by Chin (1998b).
Importantly, R2 should be high enough for the model to achieve a minimum level of
explanatory power (Urbach and Ahlemann, 2010). However, Falk and Miller (1992)
recommended that R2 values should be equal to or greater than 0.10 in order to show
the variance explained of a particular endogenous construct to be deemed adequate.
31
d) Assess the effect sizes of f2: The effect size of the predictor construct can be evaluated
by using Cohen’s f2 (Cohen, 1988). The effect size (f2) is a measured used to assess
the relative impact of a predictor construct on an endogenous construct (Cohen, 1988).
Specifically, it analysed how much predictor construct contributes to the R2 value of a
target construct in the structural model. Initially, R2 value is estimate with a particular
predecessor construct and if one of the predecessor constructs is excluding, the result
for R2 value will be lower. Hence, based on the difference of the R2 value for estimating
the model with and without the predecessor construct, is known as the effect size (f2).
According to Cohen (1988) the effect size of f2 are:
• f2 values of 0.35 – considered large
• f2 values of 0.15 – considered medium
• f2 values of 0.02 – considered small
e) Assess the predictive relevance Q2: Stone and Geisser’s Q2 (Geisser, 1975; Stone,
1974) is often used to assess the predictive relevance and can be calculated using
blindfolding procedure. Blindfolding procedure is a resampling technique that
systematically deletes and predicts every data point of the indicators in the reflecting
measurement model of endogenous construct. Note that, if Q2 > 0 the model has
predictive relevance and if Q2 < 0 the model has a lack of predictive relevance
In this study, simple random sampling is used to collect the data. Data will be collected through
face to face interview with swiftlet ranchers. Structured questionnaire will be used to collect
primary data on the respondents’ perspective in ranching investment. A total of 180 ranchers
have been randomly interviewed which is currently engaged in ranching activities from two
districts namely Johor Bahru and Gua Musang, Malaysia. This face to face interview were done
in the May 2016 until September 2016 and two enumerators were involved in this data
collection.
Figure 1: The Research Model of Behavioral Factors’ Impacts on Investment Decisions
of Individual Investors
32
Findings and Discussion
Assessment of Measurement Model (outer Model)
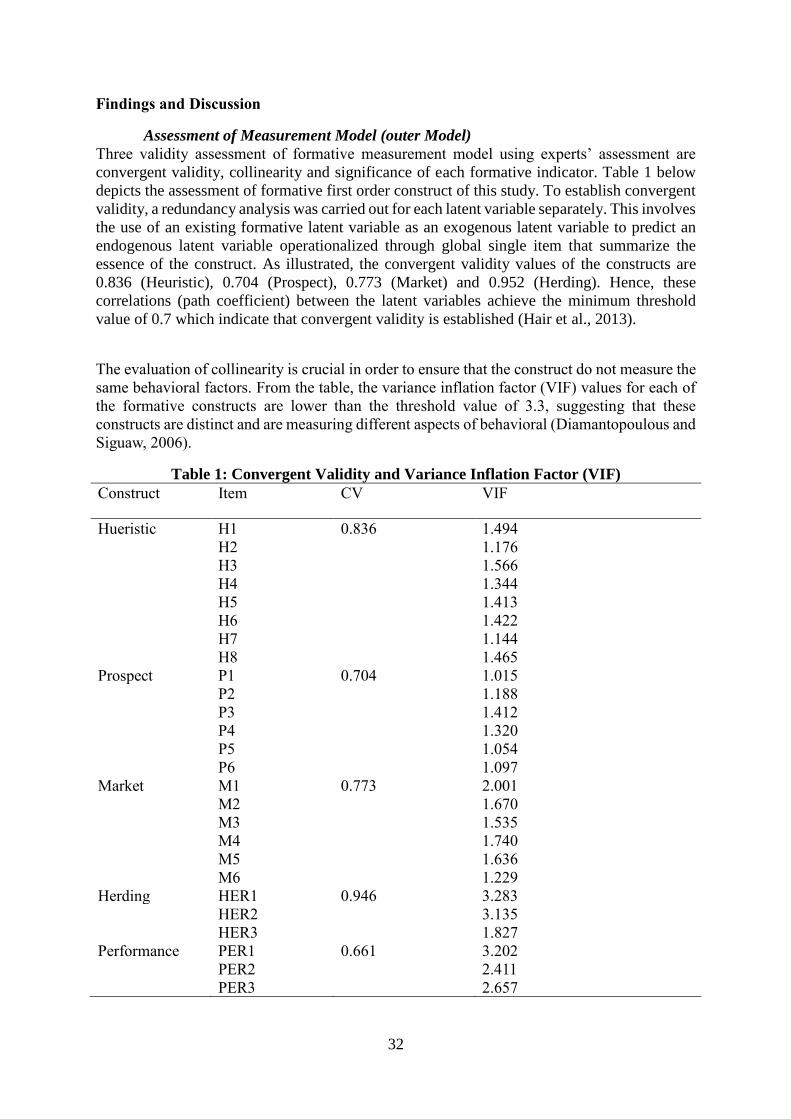
Three validity assessment of formative measurement model using experts’ assessment are
convergent validity, collinearity and significance of each formative indicator. Table 1 below
depicts the assessment of formative first order construct of this study. To establish convergent
validity, a redundancy analysis was carried out for each latent variable separately. This involves
the use of an existing formative latent variable as an exogenous latent variable to predict an
endogenous latent variable operationalized through global single item that summarize the
essence of the construct. As illustrated, the convergent validity values of the constructs are
0.836 (Heuristic), 0.704 (Prospect), 0.773 (Market) and 0.952 (Herding). Hence, these
correlations (path coefficient) between the latent variables achieve the minimum threshold
value of 0.7 which indicate that convergent validity is established (Hair et al., 2013).
The evaluation of collinearity is crucial in order to ensure that the construct do not measure the
same behavioral factors. From the table, the variance inflation factor (VIF) values for each of
the formative constructs are lower than the threshold value of 3.3, suggesting that these
constructs are distinct and are measuring different aspects of behavioral (Diamantopoulous and
Siguaw, 2006).
Table 1: Convergent Validity and Variance Inflation Factor (VIF)
Construct Item CV VIF
Hueristic H1 0.836 1.494
H2 1.176
H3 1.566
H4 1.344
H5 1.413
H6 1.422
H7 1.144
H8 1.465
Prospect P1 0.704 1.015
P2 1.188
P3 1.412
P4 1.320
P5 1.054
P6 1.097
Market M1 0.773 2.001
M2 1.670
M3 1.535
M4 1.740
M5 1.636
M6 1.229
Herding HER1 0.946 3.283
HER2 3.135
HER3 1.827
Performance PER1 0.661 3.202
PER2 2.411
PER3 2.657

33
The significance of weight of each of the formative construct is subsequently assessed in
explaining the first order constructs. Table 2 depicts the bootstrapping result of the outer weight
for each of the formative first order constructs. The bootstrapping result shows that all
behavioral factors are found to be significantly related to prospect, market, herding and
heuristic (except H1 and H3). Heuristics indicator (H1) was considered valid as their outer
loadings were above 0.5 and were significant (Hair et al., 2017). Although the outer weight for
H3 was insignificant and the outer loading was relatively low (0.465), this item was retained,
as the outer loading was significant and the indicator is theoretically relevant to the heuristic
construct (Hair et al., 2017).
Table 2: The Significance and Relevance of the Indicators
Construct Item Outer weight T-statistic p-value
Heuristic H1 Heuristic 0.033 0.757 0.450
H2 Heuristic 0.118 2.008 0.045
H3 Heuristic 0.078 1.012 0.312
H4 Heuristic 0.149 2.916 0.004
H5 Heuristic 0.775 13.463 0.000
H6 Heuristic 0.163 2.955 0.003
H7 Heuristic 0.125 2.520 0.012
H8 Heuristic 0.152 2.887 0.004
Prospect P1 Prospect 0.162 1.643 0.101
P2 Prospect 0.313 4.089 0.000
P3 Prospect 0.359 4.322 0.000
P4 Prospect 0.391 4.785 0.000
P5 Prospect 0.312 4.023 0.000
P6 Prospect 0.281 3.544 0.000
Market M1 Market 0.430 5.529 0.000
M2 Market 0.233 3.258 0.001
M3 Market 0.231 2.020 0.028
M4 Market 0.281 3.780 0.000
M5 Market 0.127 2.009 0.044
M6 Market 0.362 4.550 0.000
Herding HER1 Herding 0.646 11.822 0.000
HER2 Herding 0.245 4.345 0.000
HER3 Herding 0.197 6.456 0.000
Performance PER1 Performance 0.231 1.595 0.111
PER2 Performance 0.030 0.256 0.798
PER3 Performance 0.788 7.639 0.000 **p<0.01, *p<0.05 (two tailed)
Assessment of structural model (inner model)
Prior to assessing the structural model, it is important to ensure that there are no collinearity
issues in the inner model of the study. Table 3 presents the outcome of collinearity test of the
model. The VIF values below 3.3 for each of the constructs show that collinearity is not a
concern (Diamantopoulous and Siguaw, 2006).
34
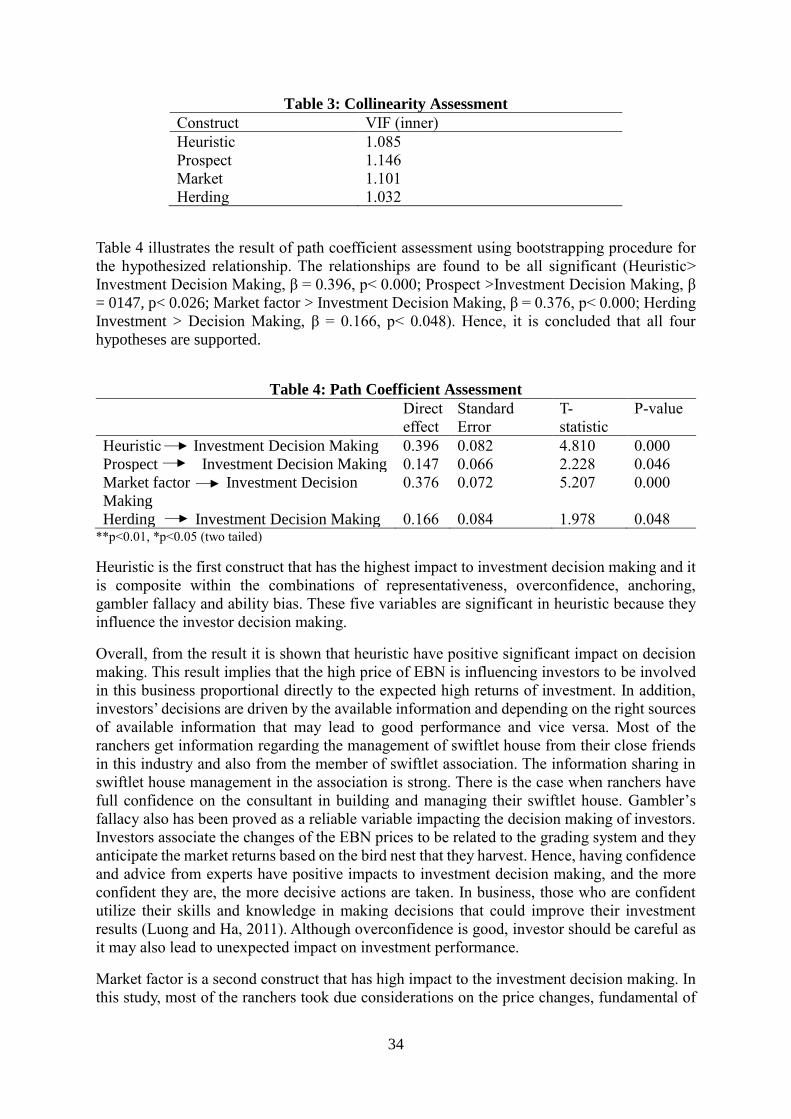
Table 3: Collinearity Assessment
Construct VIF (inner)
Heuristic 1.085
Prospect 1.146
Market 1.101
Herding 1.032
Table 4 illustrates the result of path coefficient assessment using bootstrapping procedure for
the hypothesized relationship. The relationships are found to be all significant (Heuristic>
Investment Decision Making, β = 0.396, p< 0.000; Prospect >Investment Decision Making, β
= 0147, p< 0.026; Market factor > Investment Decision Making, β = 0.376, p< 0.000; Herding
Investment > Decision Making, β = 0.166, p< 0.048). Hence, it is concluded that all four
hypotheses are supported.
Table 4: Path Coefficient Assessment
Direct
effect
Standard
Error
T-
statistic
P-value
Heuristic Investment Decision Making 0.396 0.082 4.810 0.000
Prospect Investment Decision Making 0.147 0.066 2.228 0.046
Market factor Investment Decision
Making
0.376 0.072 5.207 0.000
Herding Investment Decision Making 0.166 0.084 1.978 0.048 **p<0.01, *p<0.05 (two tailed)
Heuristic is the first construct that has the highest impact to investment decision making and it
is composite within the combinations of representativeness, overconfidence, anchoring,
gambler fallacy and ability bias. These five variables are significant in heuristic because they
influence the investor decision making.
Overall, from the result it is shown that heuristic have positive significant impact on decision
making. This result implies that the high price of EBN is influencing investors to be involved
in this business proportional directly to the expected high returns of investment. In addition,
investors’ decisions are driven by the available information and depending on the right sources
of available information that may lead to good performance and vice versa. Most of the
ranchers get information regarding the management of swiftlet house from their close friends
in this industry and also from the member of swiftlet association. The information sharing in
swiftlet house management in the association is strong. There is the case when ranchers have
full confidence on the consultant in building and managing their swiftlet house. Gambler’s
fallacy also has been proved as a reliable variable impacting the decision making of investors.
Investors associate the changes of the EBN prices to be related to the grading system and they
anticipate the market returns based on the bird nest that they harvest. Hence, having confidence
and advice from experts have positive impacts to investment decision making, and the more
confident they are, the more decisive actions are taken. In business, those who are confident
utilize their skills and knowledge in making decisions that could improve their investment
results (Luong and Ha, 2011). Although overconfidence is good, investor should be careful as
it may also lead to unexpected impact on investment performance.
Market factor is a second construct that has high impact to the investment decision making. In
this study, most of the ranchers took due considerations on the price changes, fundamental of
35
industry, past trend of EBN market, market information, and EBN demand before making
investment decision. It indicates that individuals tend to consider the information of EBN
market such as general information, past trend of EBN price and current EBN price changes
carefully before making their investment. Price changes influence investor decision making.
The existing ranchers stated that the embargo imposed by China caused them to postpone their
intention to build another swiftlet house because of the price of EBN dropped drastically. Most
of the responding ranchers have at least 5 years of experience in this business. Before starting
investing, they studied the swiftlet ranching business carefully. Some of the ranchers have taken
courses concerning this industry organized by DVS and also engage in knowledge sharing with
swiftlet association and close members in this industry. They admit that knowledge regarding
the management of swiftlet house is important to increase EBN productivity. Besides that, they
also consider the past trend of EBN market such as the lucrative profit made by existing
ranchers before them and the encouraging development of this industry. Both of these matters
have influence them to invest in swiftlet ranching business. Most of the ranchers reacted to the
changes in the price of EBN. Any price decline will delay the breakeven point as they need to
pay the loan to bank. Market information is also important for ranchers in making their
decisions to invest. When the government announced that the swiftlet industry was one of the
12 NKEAs which are the core of the EPP, this has given positive impression to the potential
investors. In addition, in the year 2016, Malaysia and China set an export protocol agreement
regarding the exportation of raw uncleaned EBN (RUCEBN) directly to China. This news has
indirectly contributed to the increasing number of swiftlet house from 1590 to 2022 houses in
Johor and 181 to 351 houses in Kelantan. Ranchers also see the opportunity that can be grabbed
from this industry in term of domestic and international demand. There is another 70 percent
of unfulfilled demand and South East Asian has the suitable climate for swiftlet habitat.
The third construct is prospect. When ranchers see their swiftlet, houses are producing birdnests
with good quality, they have more confident and motivated to invest further in another swiftlet
house. However, ranchers tend to be more risk averse after a loss. These are normal reaction of
investors because successful prior investment encourages them whereas any failure depresses
them. Mental accounting also has impact on decision making of the ranchers. This result
confirms that the lucrative profit raises their interest to involve in this business. On the other
hand, failure discourages ranchers into regrets when their swiftlet house could not attract
swiftlets to nest. This will result in low returns to investment.
The last construct that have a significant influence on the investment decision making is
herding. The result implies that ranchers are influenced by the other investors’ decision making
regarding additional investments in this business. Ranchers are influenced either to make new
investment decisions, as well as additional reinvestments to build another swiftlet house.
According to ranchers, when they see the successful of other ranchers, they believe that they
also can be success as long as they have capital to start up the business and someone are willing
to share knowledge regarding the management of swiftlet houses. This study is in line with
Chen, Rui & Xu (2003) which argue that herding is more likely to happen in emerging markets
than in developed ones as the quality of information disclosure is low.
36
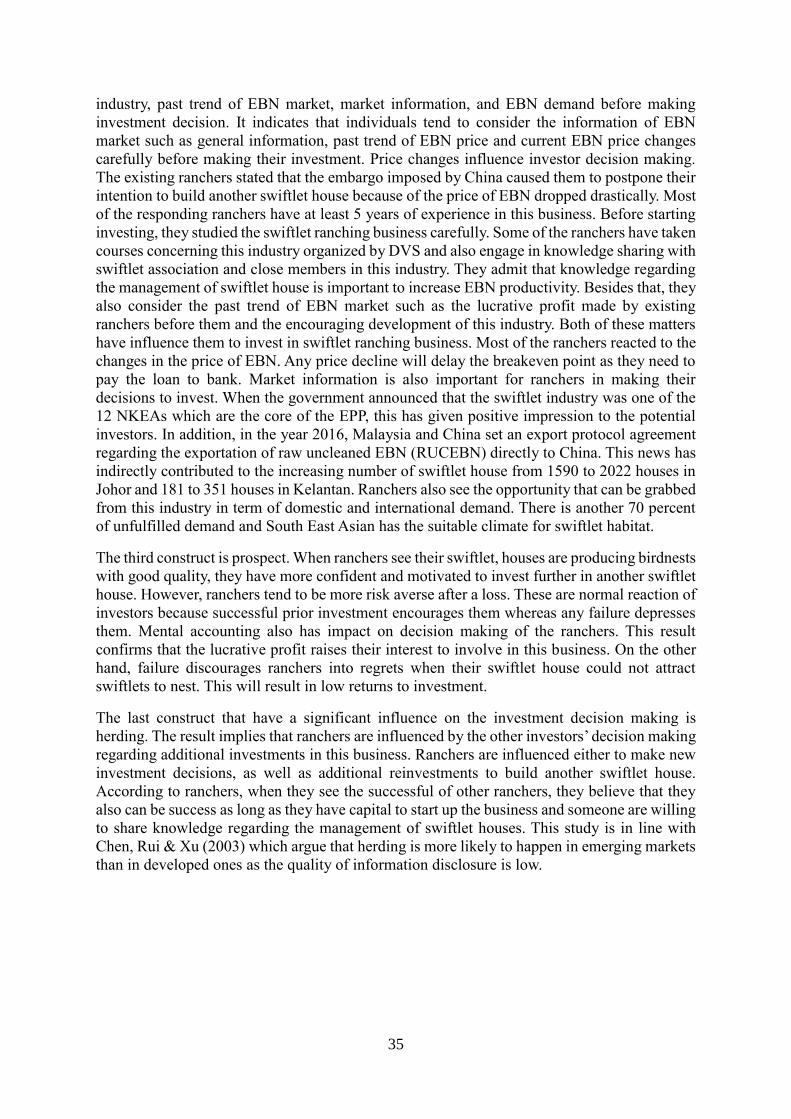
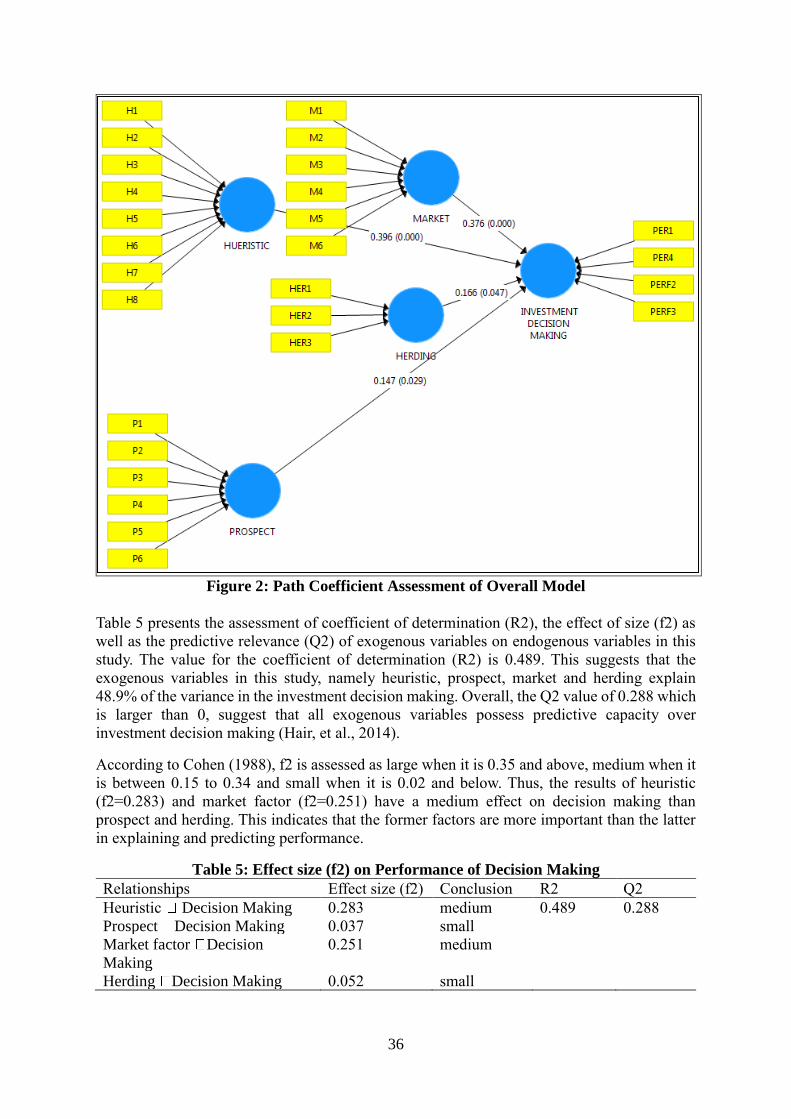
Figure 2: Path Coefficient Assessment of Overall Model
Table 5 presents the assessment of coefficient of determination (R2), the effect of size (f2) as
well as the predictive relevance (Q2) of exogenous variables on endogenous variables in this
study. The value for the coefficient of determination (R2) is 0.489. This suggests that the
exogenous variables in this study, namely heuristic, prospect, market and herding explain
48.9% of the variance in the investment decision making. Overall, the Q2 value of 0.288 which
is larger than 0, suggest that all exogenous variables possess predictive capacity over
investment decision making (Hair, et al., 2014).
According to Cohen (1988), f2 is assessed as large when it is 0.35 and above, medium when it
is between 0.15 to 0.34 and small when it is 0.02 and below. Thus, the results of heuristic
(f2=0.283) and market factor (f2=0.251) have a medium effect on decision making than
prospect and herding. This indicates that the former factors are more important than the latter
in explaining and predicting performance.
Table 5: Effect size (f2) on Performance of Decision Making
Relationships Effect size (f2) Conclusion R2 Q2
Heuristic Decision Making 0.283 medium 0.489 0.288
Prospect Decision Making 0.037 small
Market factor Decision
Making
0.251 medium
Herding Decision Making 0.052 small

37
Conclusion
There is ample opportunities for new entrants and investors to explore in the swiftlet house
industry. Due to the fact that people are not always rational, their financial decisions may be
driven by preconceived behaviors. Thus, studying behavioral factors plays an important role in
decision making, in which cognitive psychology is employed to understand human behaviors.
There are four behavioral factors that impact the investment decisions of individual investors
in swiftlet ranching: Heuristic, Herding, Market and Prospect. The heuristic factor includes five
variables which are representativeness, overconfidence, anchoring, gambler’s fallacy and
availability bias. Prospect consist of three variables; loss aversion, regret aversion and mental
accounting. Market factor possesses six variables; price changes, over-reaction to price
changes, market information, past trends of EBN market, customers’ preferences and
fundamental of industry. The last factor is herding which consists of three behavioral variables:
following the decisions of the other investors (choice of ranching business; number of swiftlet
house; speed of herding). The findings suggest that all the hypotheses (H1, H2, H3, and H4)
are supported.
Heuristic construct has the highest impact to investment decision making followed by market,
herding and prospect constructs. The findings correspond to past findings that heuristic, market
factor, herding and prospect influence the investor decision makings (Ritter (2003); Waweru,
(2008); Wamae (2013); Aziz B. & Khan M. A. (2016).
In spite of the magnitude of the present study from theoretical, methodology and empirical
standpoint, there exist a few limitations which underscore the need for further investigation.
Firstly, this study is limited to looking at two districts. Secondly, this study is limited to the
behavioral factors of investors rather than the other factors such as financial, and demographic
factors. Hence, further studies could be suggested to delve into other additional factors as to
broaden the study.
Biographical Notes
Fatin F. Ya’acob is a Ph.D student at the Faculty of Economics and Management, Universiti
Putra Malaysia (UPM), Serdang Selangor, Malaysia majoring in Economic. Her expertise is in
Natural Resource Economics. Notable project and research include Data Envelopment
Analysis and PLS-SEM.
Mohd Shawahid H.O is a Professor at the Faculty of Economics and Management, Universiti
Putra Malaysia (UPM), Serdang Selangor, Malaysia and a research associate to the Institute of
Tropical Forestry and Forest Products and the Institute of Agriculture and Food Policy Studies,
UPM. He plays an active role in the implementation of the Environmental Impact Assessment
(EIA) processes at the Malaysian Department of Environment, either as an EIA government
panel or as an EIA subject specialist consultant. He is also a committee member of the National
Professorial Council’s Natural Resource and Environment Cluster. He has expertise in the area
of Economic Valuation and Natural Resource and Environmental Economics.
Rabiatul Munirah Alpandi is a Ph.D student at the Faculty of Economics and Management,
Universiti Putra Malaysia (UPM), Serdang Selangor, Malaysia majoring in Environmental
Economics at UPM. Notable project and research include Socio Economic Analysis, Data
Envelopment Analysis and Social Network Analysis.
Siti Mariam Mellisa Abdullah is is a Ph.D student at the Faculty of Economics and
Management, Universiti Putra Malaysia (UPM), Serdang Selangor, Malaysia majoring in

38
Environmental Economics at UPM. Notable project and research include Social Network
Analysis, Structural Equation Modelling Analysis and Economic Valuation.
Mohd Hafiz Ghazali is a Ph.D student at the Faculty of Economics and Management, Universiti
Putra Malaysia (UPM), Serdang Selangor, Malaysia majoring in Tourism Economics. He has
expertise in the area of Economic Valuation, Tourism and Environmental Economics.
References
Anuar Alias, Ang Yew Poh, Nurul Zahirah M.A & Mokhtar Azizi M.D (2013). Investment in
swiftlet hotels in Malaysia – Does ROI compensate investment risks? African Journal
of Business Management, Vol. 7(38), pp. 3936-3943.
Bilal Aziz & Muhammad Abdullah khan (2016). Behavioral factors influencing individual
investor’s investment decision and performance, Evidence from Pakistan Stock
Exchange. International Journal of Research in Finance and Marketing (IJRFM), Vol.
6 Issue 7.
Chen, G., Rui, O. M., Xu, Y. (2003). When Will Investors Herd? Evidence from the Chinese
Stock Markets. Working Paper, University of Texas, Dallas.
Cohen, J. (1988). Statistical Power Analysis for the Behavioral Sciences, 2nd edn Lawrence
Erlbaum Associates: Hillsdale. NJ, USA.
Diamantopoulous, A. & Siguaw, J. A. (2006). Formative Versus Reflective Indicators in
Organizational Measure Development: A Comparison and Empirical Illustration.
British Journal of Management, Vol. 17 No. 4, pp. 263.
Filbeck, G., Hatfield, P. & Horvath, P. (2005). Risk aversion and personality type. Journal of
Behavioral Finance, 6 (4), 170–180.
Hair Jr, J. F., Hult, G. T. M., Ringle, C. & Sarstedt, M. (2013). A primer on partial least squares
structural equation modelling (PLS-SEM), Sage Publications.
Hair, J. F., Hult, G. T. M., Ringle, C. M., & Sarstedt, M. (2017b). A primer on partial least
squares structural equation modeling (PLS-SEM) (2nd ed.). Thousand Oaks: Sage.
Kahneman, D. & Tversky, A. (1974). Judgment under Uncertainty: Heuristics and Biases,
Science, 85 (4157), 1124-1131.
Kimeu C.N., Anyango W. & Rotich G., (2016). Behavioural Factors influencing Investment
Decisions among individual investors in Nairobi Securities Exchange. The Strategic
Journal of Business & Change Management, 3(4):1243-1258.
Luong, L. P., & Ha, D. T. (2011). Behavioral Factors Influencing Individual Investors'
Decision Making and Performance. Survey of the Ho Chi Minh Stock Exchange, Umea
School of Business Spring semester.
Kengatharan, L., & Kengatharan, N. (2014). The influence of behavioral factors in making
investment decisions and performance: Study on investors of Colombo Stock
Exchange, Sri Lanka. Asian Journal of Finance & Accounting, 6(1), 1.
Ritter, J. R. (2003). Behavioral Finance. Pacific-Basin Finance Journal, 11 (4), 429-437.
Wamae, J. N., (2013). Behavioural factors influencing investment decision in stock market: A
survey of investment banks in Kenya. International Journal of Social Sciences and
Entrepreneurship 1(6), 68-83
Waweru, N. M., Munyoki, E., & Uliana, E. (2008). The effects of behavioural factors in
investment decision-making: a survey of institutional investors operating at the Nairobi
Stock Exchange. International Journal of Business and Emerging Markets, 1(1), 24-
41.