Embed Size (px)
Citation preview
Reykjavíkurborg(City of Reykjavik)
Financial Statements2016
Reykjavíkurborg(City of Reykjavik)
Reg. no. 530269‐7609City hall
Tjarnargötu 11101 Reykjavík

.
Reykjavíkurborg(City of Reykjavik)
Financial Statements 2016
Table of contentsPage
Mayor and Executive Committee's report and endorsement ............................................................................ 2Endorsement by the City Council ......................................................................................................................... 3Independent Auditor's report .............................................................................................................................. 4‐7Income Statement ................................................................................................................................................ 8Statement of Financial Position ........................................................................................................................... 9‐10Statement of Cash Flows ...................................................................................................................................... 11Notes .................................................................................................................................................................... 12‐38Unaudited attachment:Statement on governance and non‐financial information ................................................................................... 39
Please note:This is an English translation of the Icelandic Financial Statements of Reykjavíkurborg(the City of Reykjavik). In the event of any discrepancy between the English and Icelandic versions the original Icelandic text shall prevail.

.
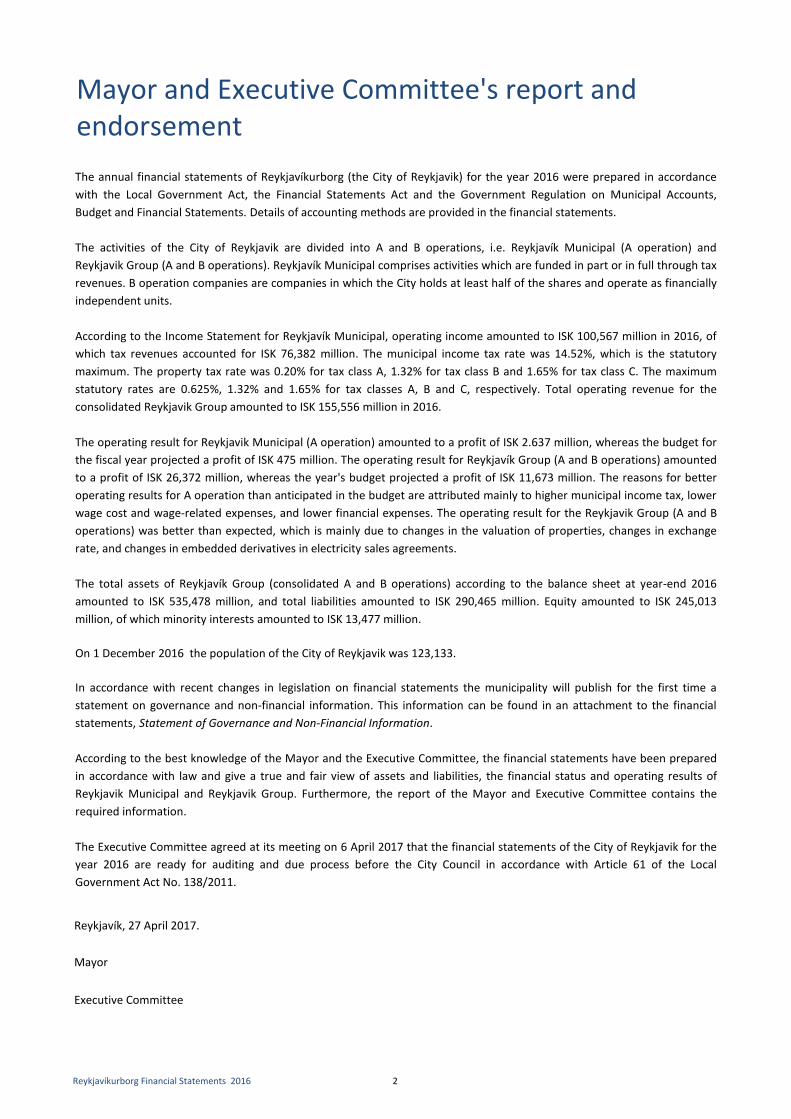
Mayor and Executive Committee's report andendorsement
Reykjavík, 27 April 2017.
Mayor
Executive Committee
The annual financial statements of Reykjavíkurborg (the City of Reykjavik) for the year 2016 were prepared in accordancewith the Local Government Act, the Financial Statements Act and the Government Regulation on Municipal Accounts,Budget and Financial Statements. Details of accounting methods are provided in the financial statements.
The activities of the City of Reykjavik are divided into A and B operations, i.e. Reykjavík Municipal (A operation) andReykjavik Group (A and B operations). Reykjavík Municipal comprises activities which are funded in part or in full through taxrevenues. B operation companies are companies in which the City holds at least half of the shares and operate as financiallyindependent units.
According to the Income Statement for Reykjavík Municipal, operating income amounted to ISK 100,567 million in 2016, ofwhich tax revenues accounted for ISK 76,382 million. The municipal income tax rate was 14.52%, which is the statutorymaximum. The property tax rate was 0.20% for tax class A, 1.32% for tax class B and 1.65% for tax class C. The maximumstatutory rates are 0.625%, 1.32% and 1.65% for tax classes A, B and C, respectively. Total operating revenue for theconsolidated Reykjavik Group amounted to ISK 155,556 million in 2016.
The operating result for Reykjavik Municipal (A operation) amounted to a profit of ISK 2.637 million, whereas the budget forthe fiscal year projected a profit of ISK 475 million. The operating result for Reykjavík Group (A and B operations) amountedto a profit of ISK 26,372 million, whereas the year's budget projected a profit of ISK 11,673 million. The reasons for betteroperating results for A operation than anticipated in the budget are attributed mainly to higher municipal income tax, lowerwage cost and wage‐related expenses, and lower financial expenses. The operating result for the Reykjavik Group (A and Boperations) was better than expected, which is mainly due to changes in the valuation of properties, changes in exchangerate, and changes in embedded derivatives in electricity sales agreements.
The total assets of Reykjavík Group (consolidated A and B operations) according to the balance sheet at year‐end 2016amounted to ISK 535,478 million, and total liabilities amounted to ISK 290,465 million. Equity amounted to ISK 245,013million, of which minority interests amounted to ISK 13,477 million.
On 1 December 2016 the population of the City of Reykjavik was 123,133.
In accordance with recent changes in legislation on financial statements the municipality will publish for the first time astatement on governance and non‐financial information. This information can be found in an attachment to the financialstatements, Statement of Governance and Non‐Financial Information.
According to the best knowledge of the Mayor and the Executive Committee, the financial statements have been preparedin accordance with law and give a true and fair view of assets and liabilities, the financial status and operating results ofReykjavik Municipal and Reykjavik Group. Furthermore, the report of the Mayor and Executive Committee contains therequired information.
The Executive Committee agreed at its meeting on 6 April 2017 that the financial statements of the City of Reykjavik for theyear 2016 are ready for auditing and due process before the City Council in accordance with Article 61 of the LocalGovernment Act No. 138/2011.
Reykjavíkurborg Financial Statements 2016 2

.
Reykjavík, 9 May 2017.
City Council:
Endorsement by the City Council
The financial statements of Reykjavíkurborg (the City of Reykjavík) for the year 2016 have been addressed by the CityCouncil in accordance with Article 61 of the Local Government Act No. 138/2011 and are confirmed and endorsed atthe second debate in the City Council.
Reykjavíkurborg Financial Statements 2016 3

.
Independent Auditor's Report
Report on the Audit of the Financial Statements
How the matter was addressed in the audit
Reference is made to Note 44, “Pension obligations”.
The municipality bears obligations due to pension rights of current and former employees of the municipality. The pension obligations for A and B operations amounted to ISK 31.5 billion at year end 2016 and increased by ISK 3 billion during the year.
In evaluating the pension obligations of A operations, assumptions about mortality rate and life expectancy are made in accordance with a proposal from the Icelandic Actuarial Society dated 1 March 2015. These assume that the mortality rate will continue to decrease and that average life expectancy will increase instead of using the experience of previous years. It is the assessment of management that this methodology provides a clearer view of the pension obligations of A operations and that these should be taken into consideration with reference to the Financial Statements Act. The municipality’s pension obligations are estimated by management and are based on a recommendation from actuaries instead of being based on provisions in the Regulation No. 391/1998 on pension obligations and operations of pension funds which specifies assumptions regarding life expectancy and other items.
Our audit included among other things the following procedures:
We reviewed and evaluated the methods used by management in evaluating pension obligations.
We applied data analytic procedures where we set forth expectations regarding the balance of the obligations at year end, including regarding the development of the index for pension obligations for governmental employees, pension right earnings of active members of pension funds and payments to pension recipients, and compared these to the results of the actuary.
We reviewed management controls regarding calculation of the obligations, their approach and evaluation of assumptions, e.g. classification of beneficiaries and salary benchmarks.
We checked that the parties creating the obligations were classified correctly in the actuary’s calculations.
A meeting was held with the actuary, his methods regarding the calculations were reviewed and his competence evaluated.
To the City Council of Reykjavíkurborg
OpinionWe have audited the accompanying financial statements of Reykjavíkurborg for the year 2016 which comprise thefinancial statements of A operations and the financial statements of A and B operations. The financial statementscomprise income statement, balance sheet, statement of cash flows, information on significant accounting policies andother explanatory information.
In our opinion, the financial statements give a true and fair view of the municipality’s financial position as at 31 December2016, its financial performance in the year 2016, and of its cash flows for the year then ended in accordance with theIcelandic Financial Statements Act and the Local Government Act.
Basis for OpinionWe conducted our audit in accordance with International Standards on Auditing (ISAs). Our responsibilities under thosestandards are further described in the Auditor’s Responsibilities for the Audit of the Financial Statements section of ourreport. We are independent of the municipality in accordance with the Code of ethics for Icelandic auditors and we havefulfilled other ethical requirements of those rules. We believe that the audit evidence we have obtained is sufficient andappropriate to provide a basis for our opinion.
Key Audit MattersKey audit matters are those matters that, in our professional judgment, were of most significance in our audit of thefinancial statements. These matters were addressed in the context of our audit of the financial statements as a whole, andin forming our opinion thereon, and we do not provide a separate opinion on these matters.
Key Audit Matters
Evaluation of pension obligations
Reykjavíkurborg Financial Statements 2016 4
Independent auditor's report, contd.How the matter was addressed in the audit
Reference is made to Note 25 “Salaries and salary related expenses”.
Salaries and salary related expenses of A operations were ISK 56.6 billion for the year 2016. Labour cost is a large portion of expenses and amounts to 56% of operating revenue of A operations.
A new SAP HR and salary system was implemented for A operations during 2016. This was an extensive implementation and the system affects all parts of the A operations' salary processes. In such implementation there is increased risk of misstatement in items related to salary expenses.
Thus, salaries and salary related expenses are one of the key audit matters in our audit of the municipality's financial statements.
Our audit work included among other things procedures aimed at determining the accuracy, integrity and reliability of HR and salary related data during the relevant period.
The design, implementation and operating effectiveness of controls relating to the payroll process were assessed.
We reviewed segregation of duties, authorizations and security configuration of the system. We tested controls with data link connection between systems.
Extensive data analytical procedures were performed in addition to routine analytical procedures.
Valuation of production systems (power plants)Reference is made to Notes 7 and 30 "Property, plant and equipment".
At end of year 2016 the carrying value of property, plant and equipment of A and B operations amounted to ISK 467,1 billion. Thereof the carrying value of electricity and hot water production system of Orkuveita Reykjavíkur amounted to ISK 135,6 billion. The fair value is determined by discounting future cash flow of the cash generating units where the assets belong. On regular basis the carrying amount is compared to the fair value or recoverable amount which is calculated by performing an impairment test.
When impairment tests show that fair value of production systems are considerable above or below carrying amount then the assets are adjusted to fair value taken into consideration the sensitivity of the impairment test, but never exceeding depreciated replacement cost.
KPMG's valuation specialists were involved in the work and assessed the valuation models and assumptions used by management in their calculation of fair value of production systems.
We assessed the management assumptions by comparing them to both internal information from the municipality and external industry information.
We assessed if the design and implementation of the impairment tests used by management was appropriate.
We assessed the reasonableness of the discount rates and risk free interest applied.
We assessed the reasonableness of general assumptions, such as population projections, price level and future growth.
Key Audit Matters
Evaluation of pension obligations, contd. These are complicated calculations. Thus, evaluation of pension obligations are one of the key audit matters in our audit of the municipality’s financial statements.
Confirmation of the actuary’s independence towards the municipality and the pension fund was obtained.
We reviewed the presentation in the financial statements, classification into long‐term and short‐term liabilities and information in the Notes.
Payroll expenses
Reykjavíkurborg Financial Statements 2016 5
Independent auditor's report, contd.How the matter was addressed in the audit
Other information
Responsibilities of the City Council and Mayor for the Financial Statements
Auditor's Responsibilities for the Audit of the Financial Statements
•
•
Identify and assess the risks of material misstatement of the financial statements, whether due to fraud or error,design and perform audit procedures responsive to those risks, and obtain audit evidence that is sufficient andappropriate to provide a basis for our opinion. The risk of not detecting a material misstatement resulting fromfraud is higher than for one resulting from error, as fraud may involve collusion, forgery, intentional omissions,misrepresentations, or the override of internal control.
Obtain an understanding of internal control relevant to the audit in order to design audit procedures that areappropriate in the circumstances, but not for the purpose of expressing an opinion on the effectiveness of themunicipality’s internal control.
The City Council and Mayor are responsible for the preparation and fair presentation of the financial statements inaccordance with the Financial Statements Act and Local Government Act, and for such internal control as they determineis necessary to enable the preparation of financial statements that are free from material misstatement, whether due tofraud or error.
In preparing the financial statements, the City Council and Mayor are responsible for assessing the municipality's ability tocontinue as a going concern, disclosing, as applicable, matters related to going concern and using the going concern basisof accounting unless it is no longer a realistic alternative.
Our objectives are to obtain reasonable assurance about whether the financial statements as a whole are free frommaterial misstatement, whether due to fraud or error, and to issue an auditor’s report that includes our opinion.Reasonable assurance is a high level of assurance, but is not a guarantee that an audit conducted in accordance with ISAswill always detect a material misstatement when it exists. Misstatements can arise from fraud or error and are consideredmaterial if, individually or in the aggregate, they could reasonably be expected to influence the economic decisions ofusers taken on the basis of these financial statements.
As part of an audit in accordance with ISAs, we exercise professional judgment and maintain professional skepticismthroughout the audit. We also:
Key Audit Matters
Valuation of production systems (power plants), contd.Due to the significance to the municipality's statement of financial position or 25% of total assets of A and B operations, valuation of production systems is a key audit matter in our audit of the financial statements of the municipality. Also due to inherent uncertainty involved in management forecasting of changes in price level, changes of volume, price changes and other management assumptions used for discounting estimated future cash flow for the production and due to the sensitivity of the impairment tests is for changes in assumptions.
Management calculation of the impairment test was compared to KPMG calculations. Current sensitive analysis was reviewed for each cash generating unit where effects of changes in EBITDA, future growth and/or yield on the results of the impairment test are shown.
We reviewed the disclosures in the financial statements and that all the information is included which is required in accordance with accounting standards.
The City Council and Mayor are responsible for the other information. The other information comprises the informationincluded in the report of the municipality's finance office. Our opinion on the financial statements does not cover theother information and we do not express any form of assurance conclusion thereon.
In connection with our audit of the financial statements, our responsibility is to read the other information and, in doingso, consider whether the other information is materially inconsistent with the financial statements or our knowledgeobtained in the audit or otherwise appears to be materially misstated. If, based on the work we have performed, weconclude that there is a material misstatement of this other information, we are required to report that fact. We havenothing to report in this regard.
Reykjavíkurborg Financial Statements 2016 6
Independent auditor's report, contd.•
•
•
•
KPMG ehf.
The engagement partners on the audit resulting in this independent auditor’s report are Auðunn Guðjónsson and GuðnýHelga Guðmundsdóttir.
Reykjavik 9 May 2017.
We communicate with the City Council and Audit Committee, among other matters, the planned scope and timing of theaudit and significant audit findings, including any significant deficiencies in internal control that we identify during ouraudit.
We also provide the City Council and Audit Committee with a statement that we have complied with relevant ethicalrequirements regarding independence, and communicate with them all relationships and other matters that mayreasonably be thought to bear on our independence, and where applicable, related safeguards.
From the matters communicated with the City Council and Audit Committee, we determine those matters that were ofmost significance in the audit of the financial statements of the current period and are therefore the key audit matters.We describe these matters in our auditor’s report unless law or regulation precludes public disclosure about the matter orwhen, in extremely rare circumstances, we determine that a matter should not be communicated in our report becausethe adverse consequences of doing so would reasonably be expected to outweigh the public interest benefits of suchcommunication.
Report on Other Legal and Regulatory RequirementsPursuant to the legal requirement under Article 104, Paragraph 2 of the Icelandic Financial Statement Act No. 3/2006, weconfirm that, to the best of our knowledge, the report of the Mayor and City Council accompanying the financialstatements includes the information required by the Financial Statement Act if not disclosed elsewhere in the financialstatements.
Evaluate the appropriateness of accounting policies used and the reasonableness of accounting estimates andrelated disclosures made by management.Conclude on the appropriateness of management’s use of the going concern basis of accounting and, based on theaudit evidence obtained, whether a material uncertainty exists related to events or conditions that may castsignificant doubt on the municipality’s ability to continue as a going concern. If we conclude that a materialuncertainty exists, we are required to draw attention in our auditor’s report to the related disclosures in thefinancial statements or, if such disclosures are inadequate, to modify our opinion. Our conclusions are based onthe audit evidence obtained up to the date of our auditor’s report. However, future events or conditions may havenegative effect on the municipality's ability to continue as a going concern.
Evaluate the overall presentation, structure and content of the financial statements, including the disclosures, andwhether the financial statements represent the underlying transactions and events in a manner that achieves fairpresentation.
Obtain sufficient appropriate audit evidence regarding the financial information of the operating units under the Aand B section of operations of the municipality to express an opinion on the financial statements. We areresponsible for the direction, supervision and performance of the audit of the municipality and we remain solelyresponsible for our audit opinion.
Reykjavíkurborg Financial Statements 2016 7
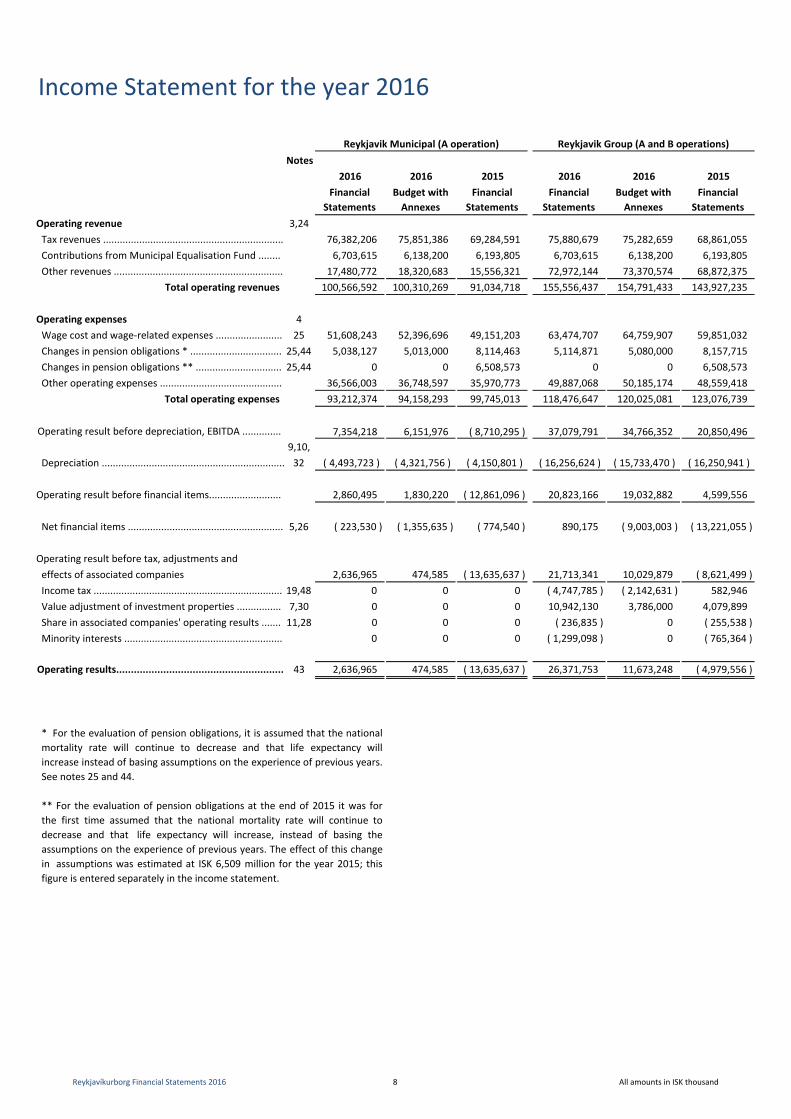
Income Statement for the year 2016
Notes2016 2016 2015 2016 2016 2015
Financial Budget with Financial Financial Budget with Financial Statements Annexes Statements Statements Annexes Statements
Operating revenue 3,24Tax revenues ................................................................. 76,382,206 75,851,386 69,284,591 75,880,679 75,282,659 68,861,055 Contributions from Municipal Equalisation Fund ........ 6,703,615 6,138,200 6,193,805 6,703,615 6,138,200 6,193,805 Other revenues ............................................................. 17,480,772 18,320,683 15,556,321 72,972,144 73,370,574 68,872,375
Total operating revenues 100,566,592 100,310,269 91,034,718 155,556,437 154,791,433 143,927,235
Operating expenses 4Wage cost and wage‐related expenses ........................ 25 51,608,243 52,396,696 49,151,203 63,474,707 64,759,907 59,851,032 Changes in pension obligations * ................................. 25,44 5,038,127 5,013,000 8,114,463 5,114,871 5,080,000 8,157,715 Changes in pension obligations ** ............................... 25,44 0 0 6,508,573 0 0 6,508,573 Other operating expenses ............................................ 36,566,003 36,748,597 35,970,773 49,887,068 50,185,174 48,559,418
Total operating expenses 93,212,374 94,158,293 99,745,013 118,476,647 120,025,081 123,076,739
7,354,218 6,151,976 ( 8,710,295 ) 37,079,791 34,766,352 20,850,496 9,10,
Depreciation .................................................................. 32 ( 4,493,723 ) ( 4,321,756 ) ( 4,150,801 ) ( 16,256,624 ) ( 15,733,470 ) ( 16,250,941 )
2,860,495 1,830,220 ( 12,861,096 ) 20,823,166 19,032,882 4,599,556
Net financial items ........................................................ 5,26 ( 223,530 ) ( 1,355,635 ) ( 774,540 ) 890,175 ( 9,003,003 ) ( 13,221,055 )
Operating result before tax, adjustments andeffects of associated companies 2,636,965 474,585 ( 13,635,637 ) 21,713,341 10,029,879 ( 8,621,499 )Income tax .................................................................... 19,48 0 0 0 ( 4,747,785 ) ( 2,142,631 ) 582,946 Value adjustment of investment properties ................ 7,30 0 0 0 10,942,130 3,786,000 4,079,899 Share in associated companies' operating results ....... 11,28 0 0 0 ( 236,835 ) 0 ( 255,538 )Minority interests ......................................................... 0 0 0 ( 1,299,098 ) 0 ( 765,364 )
43 2,636,965 474,585 ( 13,635,637 ) 26,371,753 11,673,248 ( 4,979,556 )
Reykjavik Group (A and B operations)
Operating result before financial items..........................
Operating results.........................................................
Reykjavik Municipal (A operation)
** For the evaluation of pension obligations at the end of 2015 it was forthe first time assumed that the national mortality rate will continue todecrease and that life expectancy will increase, instead of basing theassumptions on the experience of previous years. The effect of this changein assumptions was estimated at ISK 6,509 million for the year 2015; thisfigure is entered separately in the income statement.
* For the evaluation of pension obligations, it is assumed that the nationalmortality rate will continue to decrease and that life expectancy willincrease instead of basing assumptions on the experience of previous years.See notes 25 and 44.
Operating result before depreciation, EBITDA ..............
Reykjavíkurborg Financial Statements 2016 8 All amounts in ISK thousand
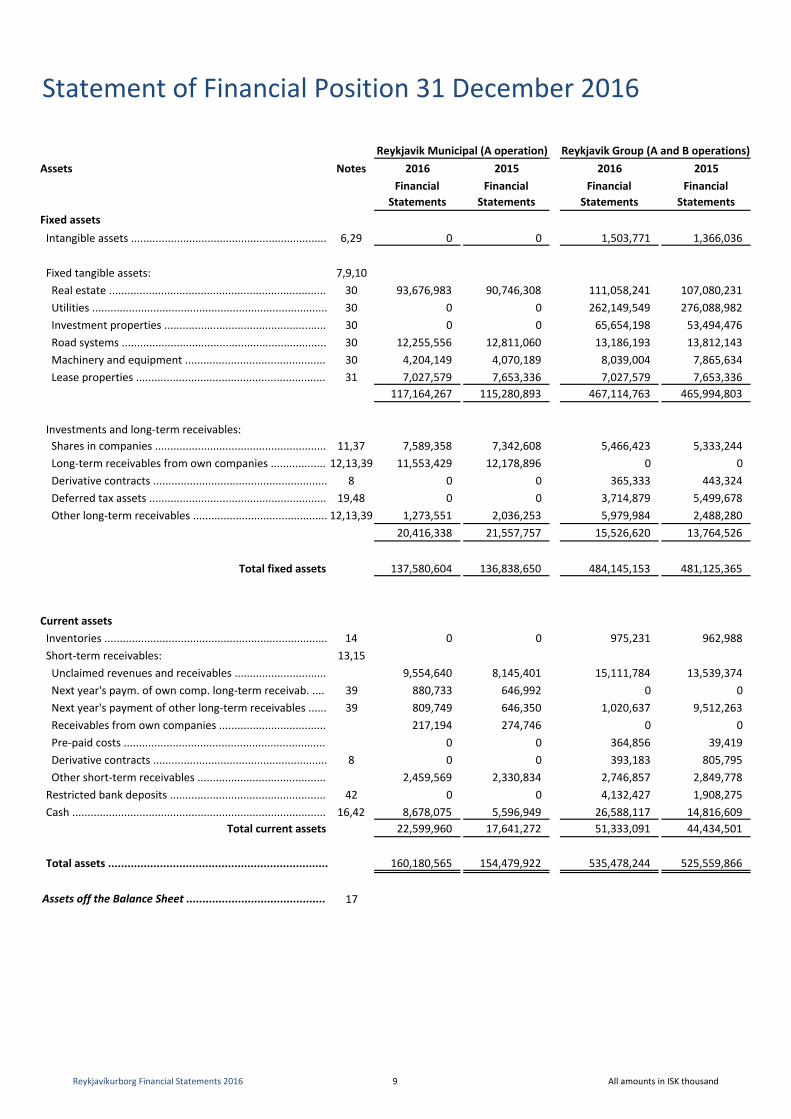
Statement of Financial Position 31 December 2016
Assets Notes 2016 2015 2016 2015Financial Financial Financial Financial
Statements Statements Statements StatementsFixed assetsIntangible assets ................................................................ 6,29 0 0 1,503,771 1,366,036
Fixed tangible assets: 7,9,10 Real estate ....................................................................... 30 93,676,983 90,746,308 111,058,241 107,080,231 Utilities ............................................................................. 30 0 0 262,149,549 276,088,982 Investment properties ..................................................... 30 0 0 65,654,198 53,494,476 Road systems ................................................................... 30 12,255,556 12,811,060 13,186,193 13,812,143 Machinery and equipment .............................................. 30 4,204,149 4,070,189 8,039,004 7,865,634 Lease properties .............................................................. 31 7,027,579 7,653,336 7,027,579 7,653,336
117,164,267 115,280,893 467,114,763 465,994,803
Investments and long‐term receivables: Shares in companies ........................................................ 11,37 7,589,358 7,342,608 5,466,423 5,333,244 Long‐term receivables from own companies .................. 12,13,39 11,553,429 12,178,896 0 0 Derivative contracts ......................................................... 8 0 0 365,333 443,324 Deferred tax assets .......................................................... 19,48 0 0 3,714,879 5,499,678 Other long‐term receivables ............................................ 12,13,39 1,273,551 2,036,253 5,979,984 2,488,280
20,416,338 21,557,757 15,526,620 13,764,526
Total fixed assets 137,580,604 136,838,650 484,145,153 481,125,365
Current assetsInventories ......................................................................... 14 0 0 975,231 962,988 Short‐term receivables: 13,15 Unclaimed revenues and receivables .............................. 9,554,640 8,145,401 15,111,784 13,539,374 Next year's paym. of own comp. long‐term receivab. .... 39 880,733 646,992 0 0 Next year's payment of other long‐term receivables ...... 39 809,749 646,350 1,020,637 9,512,263 Receivables from own companies ................................... 217,194 274,746 0 0 Pre‐paid costs .................................................................. 0 0 364,856 39,419 Derivative contracts ......................................................... 8 0 0 393,183 805,795 Other short‐term receivables .......................................... 2,459,569 2,330,834 2,746,857 2,849,778 Restricted bank deposits ................................................... 42 0 0 4,132,427 1,908,275 Cash ................................................................................... 16,42 8,678,075 5,596,949 26,588,117 14,816,609
Total current assets 22,599,960 17,641,272 51,333,091 44,434,501
Total assets .................................................................... 160,180,565 154,479,922 535,478,244 525,559,866
17
Reykjavik Municipal (A operation) Reykjavik Group (A and B operations)
Assets off the Balance Sheet ...........................................
Reykjavíkurborg Financial Statements 2016 9 All amounts in ISK thousand
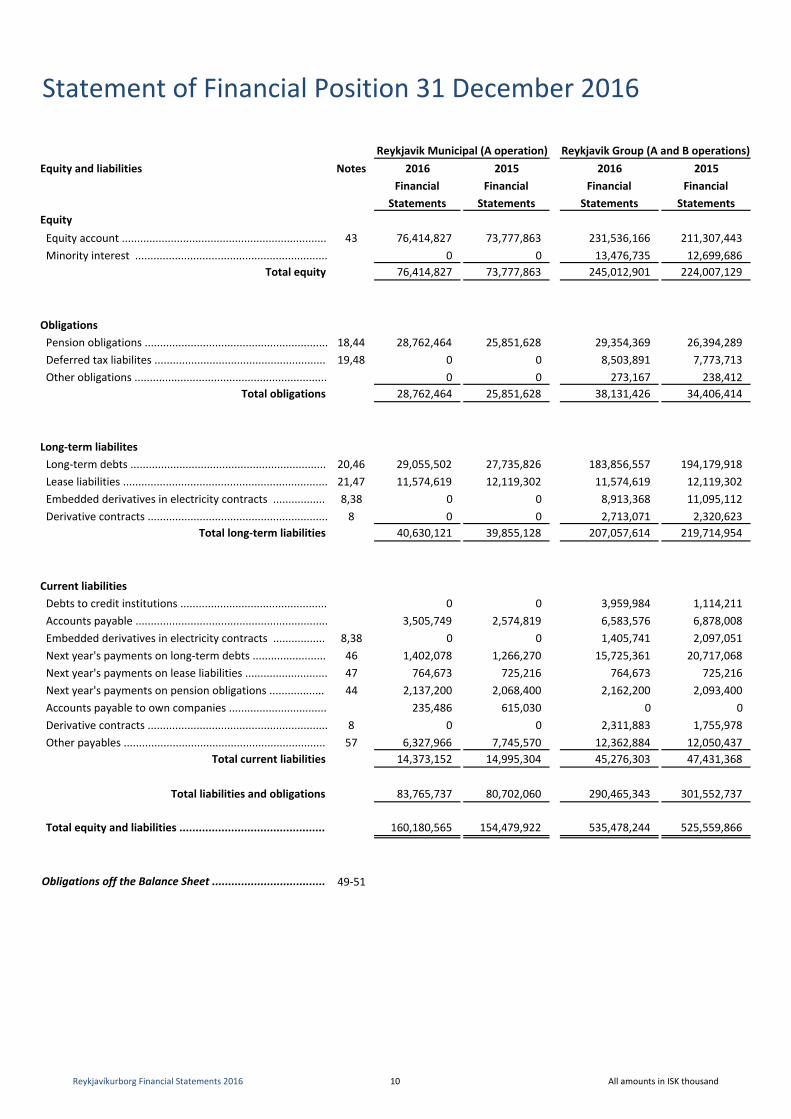
Statement of Financial Position 31 December 2016
Equity and liabilities Notes 2016 2015 2016 2015Financial Financial Financial Financial
Statements Statements Statements StatementsEquityEquity account ................................................................... 43 76,414,827 73,777,863 231,536,166 211,307,443 Minority interest ............................................................... 0 0 13,476,735 12,699,686
Total equity 76,414,827 73,777,863 245,012,901 224,007,129
Obligations Pension obligations ............................................................ 18,44 28,762,464 25,851,628 29,354,369 26,394,289 Deferred tax liabilites ........................................................ 19,48 0 0 8,503,891 7,773,713 Other obligations ............................................................... 0 0 273,167 238,412
Total obligations 28,762,464 25,851,628 38,131,426 34,406,414
Long‐term liabilitesLong‐term debts ................................................................ 20,46 29,055,502 27,735,826 183,856,557 194,179,918 Lease liabilities ................................................................... 21,47 11,574,619 12,119,302 11,574,619 12,119,302 Embedded derivatives in electricity contracts ................. 8,38 0 0 8,913,368 11,095,112 Derivative contracts ........................................................... 8 0 0 2,713,071 2,320,623
Total long‐term liabilities 40,630,121 39,855,128 207,057,614 219,714,954
Current liabilitiesDebts to credit institutions ................................................ 0 0 3,959,984 1,114,211 Accounts payable ............................................................... 3,505,749 2,574,819 6,583,576 6,878,008 Embedded derivatives in electricity contracts ................. 8,38 0 0 1,405,741 2,097,051 Next year's payments on long‐term debts ........................ 46 1,402,078 1,266,270 15,725,361 20,717,068 Next year's payments on lease liabilities ........................... 47 764,673 725,216 764,673 725,216 Next year's payments on pension obligations .................. 44 2,137,200 2,068,400 2,162,200 2,093,400 Accounts payable to own companies ................................ 235,486 615,030 0 0 Derivative contracts ........................................................... 8 0 0 2,311,883 1,755,978 Other payables .................................................................. 57 6,327,966 7,745,570 12,362,884 12,050,437
Total current liabilities 14,373,152 14,995,304 45,276,303 47,431,368
Total liabilities and obligations 83,765,737 80,702,060 290,465,343 301,552,737
Total equity and liabilities ............................................. 160,180,565 154,479,922 535,478,244 525,559,866
49‐51
Reykjavik Municipal (A operation) Reykjavik Group (A and B operations)
Obligations off the Balance Sheet ...................................
Reykjavíkurborg Financial Statements 2016 10 All amounts in ISK thousand
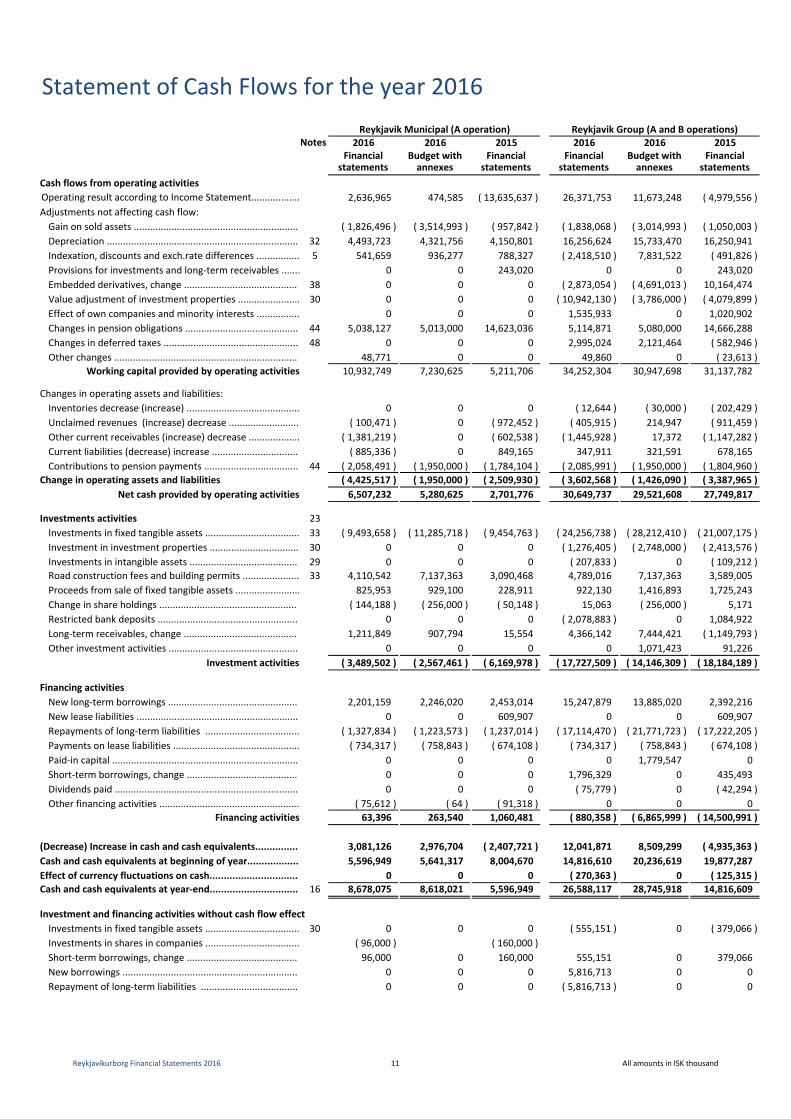
Statement of Cash Flows for the year 2016
2016 2016 2015 2016 2016 2015Financial Budget with Financial Financial Budget with Financial
statements annexes statements statements annexes statementsCash flows from operating activities
2,636,965 474,585 ( 13,635,637 ) 26,371,753 11,673,248 ( 4,979,556 )Adjustments not affecting cash flow:Gain on sold assets ............................................................. ( 1,826,496 ) ( 3,514,993 ) ( 957,842 ) ( 1,838,068 ) ( 3,014,993 ) ( 1,050,003 )Depreciation ....................................................................... 32 4,493,723 4,321,756 4,150,801 16,256,624 15,733,470 16,250,941 Indexation, discounts and exch.rate differences ................ 5 541,659 936,277 788,327 ( 2,418,510 ) 7,831,522 ( 491,826 )Provisions for investments and long‐term receivables ....... 0 0 243,020 0 0 243,020 Embedded derivatives, change .......................................... 38 0 0 0 ( 2,873,054 ) ( 4,691,013 ) 10,164,474 Value adjustment of investment properties ....................... 30 0 0 0 ( 10,942,130 ) ( 3,786,000 ) ( 4,079,899 )Effect of own companies and minority interests ................ 0 0 0 1,535,933 0 1,020,902 Changes in pension obligations .......................................... 44 5,038,127 5,013,000 14,623,036 5,114,871 5,080,000 14,666,288 Changes in deferred taxes .................................................. 48 0 0 0 2,995,024 2,121,464 ( 582,946 )Other changes .................................................................... 48,771 0 0 49,860 0 ( 23,613 )
Working capital provided by operating activities 10,932,749 7,230,625 5,211,706 34,252,304 30,947,698 31,137,782
Changes in operating assets and liabilities:Inventories decrease (increase) .......................................... 0 0 0 ( 12,644 ) ( 30,000 ) ( 202,429 )Unclaimed revenues (increase) decrease .......................... ( 100,471 ) 0 ( 972,452 ) ( 405,915 ) 214,947 ( 911,459 )Other current receivables (increase) decrease ................... ( 1,381,219 ) 0 ( 602,538 ) ( 1,445,928 ) 17,372 ( 1,147,282 )Current liabilities (decrease) increase ................................ ( 885,336 ) 0 849,165 347,911 321,591 678,165 Contributions to pension payments ................................... 44 ( 2,058,491 ) ( 1,950,000 ) ( 1,784,104 ) ( 2,085,991 ) ( 1,950,000 ) ( 1,804,960 )
Change in operating assets and liabilities ( 4,425,517 ) ( 1,950,000 ) ( 2,509,930 ) ( 3,602,568 ) ( 1,426,090 ) ( 3,387,965 )Net cash provided by operating activities 6,507,232 5,280,625 2,701,776 30,649,737 29,521,608 27,749,817
Investments activities 23Investments in fixed tangible assets ................................... 33 ( 9,493,658 ) ( 11,285,718 ) ( 9,454,763 ) ( 24,256,738 ) ( 28,212,410 ) ( 21,007,175 )Investment in investment properties ................................. 30 0 0 0 ( 1,276,405 ) ( 2,748,000 ) ( 2,413,576 )Investments in intangible assets ........................................ 29 0 0 0 ( 207,833 ) 0 ( 109,212 )Road construction fees and building permits ..................... 33 4,110,542 7,137,363 3,090,468 4,789,016 7,137,363 3,589,005 Proceeds from sale of fixed tangible assets ........................ 825,953 929,100 228,911 922,130 1,416,893 1,725,243 Change in share holdings ................................................... ( 144,188 ) ( 256,000 ) ( 50,148 ) 15,063 ( 256,000 ) 5,171 Restricted bank deposits .................................................... 0 0 0 ( 2,078,883 ) 0 1,084,922 Long‐term receivables, change .......................................... 1,211,849 907,794 15,554 4,366,142 7,444,421 ( 1,149,793 )Other investment activities ................................................ 0 0 0 0 1,071,423 91,226
Investment activities ( 3,489,502 ) ( 2,567,461 ) ( 6,169,978 ) ( 17,727,509 ) ( 14,146,309 ) ( 18,184,189 )
Financing activitiesNew long‐term borrowings ................................................ 2,201,159 2,246,020 2,453,014 15,247,879 13,885,020 2,392,216 New lease liabilities ............................................................ 0 0 609,907 0 0 609,907 Repayments of long‐term liabilities ................................... ( 1,327,834 ) ( 1,223,573 ) ( 1,237,014 ) ( 17,114,470 ) ( 21,771,723 ) ( 17,222,205 )Payments on lease liabilities ............................................... ( 734,317 ) ( 758,843 ) ( 674,108 ) ( 734,317 ) ( 758,843 ) ( 674,108 )Paid‐in capital ..................................................................... 0 0 0 0 1,779,547 0 Short‐term borrowings, change ......................................... 0 0 0 1,796,329 0 435,493 Dividends paid .................................................................... 0 0 0 ( 75,779 ) 0 ( 42,294 )Other financing activities .................................................... ( 75,612 ) ( 64 ) ( 91,318 ) 0 0 0
Financing activities 63,396 263,540 1,060,481 ( 880,358 ) ( 6,865,999 ) ( 14,500,991 )
3,081,126 2,976,704 ( 2,407,721 ) 12,041,871 8,509,299 ( 4,935,363 )5,596,949 5,641,317 8,004,670 14,816,610 20,236,619 19,877,287
0 0 0 ( 270,363 ) 0 ( 125,315 )16 8,678,075 8,618,021 5,596,949 26,588,117 28,745,918 14,816,609
Investment and financing activities without cash flow effectInvestments in fixed tangible assets ................................... 30 0 0 0 ( 555,151 ) 0 ( 379,066 )Investments in shares in companies ................................... ( 96,000 ) ( 160,000 )Short‐term borrowings, change ......................................... 96,000 0 160,000 555,151 0 379,066 New borrowings ................................................................. 0 0 0 5,816,713 0 0 Repayment of long‐term liabilities .................................... 0 0 0 ( 5,816,713 ) 0 0
Cash and cash equivalents at beginning of year..................Effect of currency fluctuations on cash...............................Cash and cash equivalents at year‐end...............................
Operating result according to Income Statement..................
(Decrease) Increase in cash and cash equivalents...............
Reykjavik Municipal (A operation) Reykjavik Group (A and B operations)Notes
Reykjavíkurborg Financial Statements 2016 11 All amounts in ISK thousand
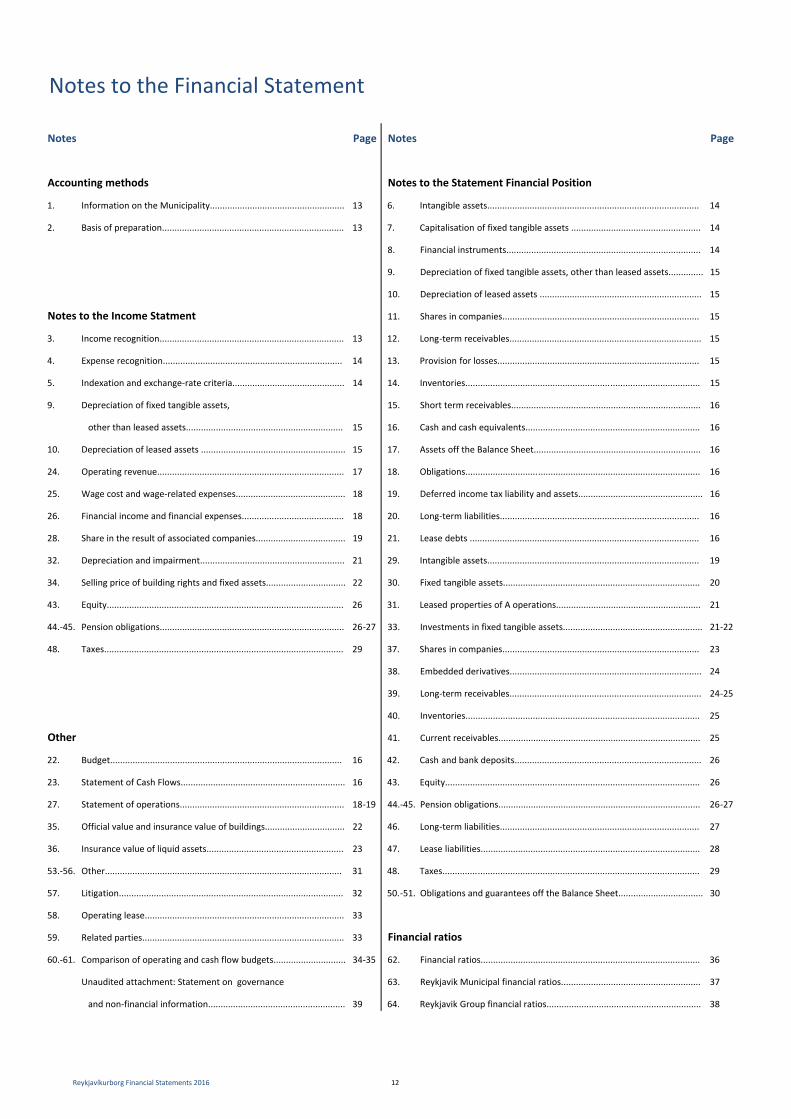
Notes Page Notes Page
Accounting methods Notes to the Statement Financial Position
1. Information on the Municipality...................................................... 13 6. Intangible assets..................................................................................... 14
2. Basis of preparation......................................................................... 13 7. Capitalisation of fixed tangible assets .................................................... 14
8. Financial instruments.............................................................................. 14
9. Depreciation of fixed tangible assets, other than leased assets.............. 15
10. Depreciation of leased assets ................................................................. 15
Notes to the Income Statment 11. Shares in companies............................................................................... 15
3. Income recognition.......................................................................... 13 12. Long‐term receivables............................................................................. 15
4. Expense recognition........................................................................ 14 13. Provision for losses................................................................................. 15
5. Indexation and exchange‐rate criteria............................................. 14 14. Inventories.............................................................................................. 15
9. Depreciation of fixed tangible assets, 15. Short term receivables............................................................................ 16
other than leased assets............................................................... 15 16. Cash and cash equivalents...................................................................... 16
10. Depreciation of leased assets .......................................................... 15 17. Assets off the Balance Sheet................................................................... 16
24. Operating revenue........................................................................... 17 18. Obligations.............................................................................................. 16
25. Wage cost and wage‐related expenses............................................ 18 19. Deferred income tax liability and assets.................................................. 16
26. Financial income and financial expenses......................................... 18 20. Long‐term liabilities................................................................................ 16
28. Share in the result of associated companies.................................... 19 21. Lease debts ............................................................................................ 16
32. Depreciation and impairment.......................................................... 21 29. Intangible assets..................................................................................... 19
34. Selling price of building rights and fixed assets................................ 22 30. Fixed tangible assets............................................................................... 20
43. Equity............................................................................................... 26 31. Leased properties of A operations.......................................................... 21
44.‐45. Pension obligations.......................................................................... 26‐27 33. Investments in fixed tangible assets........................................................ 21‐22
48. Taxes................................................................................................ 29 37. Shares in companies............................................................................... 23
38. Embedded derivatives............................................................................. 24
39. Long‐term receivables............................................................................. 24‐25
40. Inventories.............................................................................................. 25
Other 41. Current receivables................................................................................. 25
22. Budget............................................................................................. 16 42. Cash and bank deposits........................................................................... 26
23. Statement of Cash Flows.................................................................. 16 43. Equity...................................................................................................... 26
27. Statement of operations.................................................................. 18‐19 44.‐45. Pension obligations................................................................................. 26‐27
35. Official value and insurance value of buildings................................ 22 46. Long‐term liabilities................................................................................ 27
36. Insurance value of liquid assets....................................................... 23 47. Lease liabilities........................................................................................ 28
53.‐56. Other............................................................................................... 31 48. Taxes....................................................................................................... 29
57. Litigation.......................................................................................... 32 50.‐51. Obligations and guarantees off the Balance Sheet.................................. 30
58. Operating lease................................................................................ 33
59. Related parties................................................................................. 33 Financial ratios
60.‐61. Comparison of operating and cash flow budgets............................. 34‐35 62. Financial ratios........................................................................................ 36
Unaudited attachment: Statement on governance 63. Reykjavik Municipal financial ratios........................................................ 37
and non‐financial information....................................................... 39 64. Reykjavik Group financial ratios.............................................................. 38
Notes to the Financial Statement
Reykjavíkurborg Financial Statements 2016 12
1. Information on the Municipality
2. Basis of preparation
Accounting methods
3. Income recognition
Notes
The financial statements of Reykjavíkurborg (the City of Reykjavik) include annual accounts for the operating units pertaining toReykjavík Municipal (A operations) and a consolidated statement for the City’s entire operations, Reykjavik Group (i.e. consolidated Aand B operations), as stipulated in Article 60 of the Local Government Act No. 138/2011.
Reykjavik Municipal comprises activities which are partly or entirely funded by tax revenues. These include Aðalsjóður (the City’sOperation Fund), Eignasjóður (Real Estate Fund) and Bílastæðasjóður (Parking Fund). B operations comprise financially independentcompanies where the City holds 50% of the shares or more. These companies are largely funded by income generated by the servicesthey provide. The companies in B operations are Aflvaki hf. (development/investment agency), Faxaflóahafnir sf. (Associated IcelandicPorts), Félagsbústaðir hf. (Reykjavik Social Housing), Íþrótta‐ og sýningahöllin ehf. (Sport and Exhibition Centre), Jörundur ehf. (realestate), Malbikunarstöðin Höfði hf. (Asphalt Station Hofdi), Orkuveita Reykjavíkur (Reykjavik Energy), Slökkviliðhöfuðborgarsvæðisins bs. (Capital District Fire and Rescue Service), Sorpa bs. (Capital Area Waste Disposal Company) and Strætó bs.(Metropolitan Bus Transportation Company).
The financial statements have been prepared on the historical cost basis and comply with the Local Government Act, the FinancialStatements Act No. 3/2006, Regulation No. 696/1996 on the presentation and contents of financial statements and consolidatedfinancial statements, and Regulation No. 1212/2015 on the accounting, budgeting and financial statements of municipalities.Included in the consolidated financial statements for Reykjavik Group are the financial statements of Orkuveita Reykjavíkur andFélagsbústaðir hf., which have been prepared in accordance with International Financial Reporting Standards (IFRS). The mostsignificant deviations from the accounting policies for municipalities are:‐ a part of fixed tangible assets has been restated at fair market value;‐ embedded derivatives are stated at fair market value;‐ shares in companies are stated at fair market value;‐ other assets and liabilities are stated at fair market value;‐ the operating lease agreement of Orkuveita Reykjavikur for its headquarters is not included in the balance sheet.
The financial statements of Orkuveita Reykjavíkur and Félagsbústaðir hf. are included unchanged in the consolidated financialstatements of Reykjavik Group. The financial statements are largely based on the same accounting policies as the previous year.
Balances between Reykjavik Municipal entities and inter‐unit transactions are eliminated in the financial statements for ReykjavikMunicipal. Balances between A operation and B operation entities and inter‐unit transactions are eliminated in the consolidatedfinancial statements. Balances between operating entities and inter‐unit transactions include real estate tax levies, rent collected bythe Real Estate Fund and other inter‐unit transactions relating to purchases of goods and services. They also include interestcalculated on balances and long‐term liabilities resulting from transfers of assets and investments.
Reykjavíkurborg (the City of Reykjavík), the capital of Iceland, is a municipality with a population of 123,133, as at 1 December 2016.The municipality’s offices are located in Reykjavík City Hall.The principles of administration and operation of local governments are provided for in the Local Government Act No. 138/2011.
Tax revenues are recognised on the date of levying, but balancing provisions are made for uncollected tax revenues. Tax revenuesinclude municipal income tax, property tax and contributions to and from the Municipal Equalisation Fund, in addition to otherrevenues which are equivalent to taxes, such as plot rents.Capital expenditure and collection of construction fees are recognised in the Income Statement as decrease to construction costsand are recognised as a deduction from depreciation over the assets' anticipated useful life. Proceeds from sale of goods andservices are generally recognised in the Income Statement at the time that ownership and the right to claim have been transferredto the buyer. The same applies to grants.Accrued interest income is recognised in the Income Statement based on the principal of debt and the terms of interest‐bearingclaims. Dividends are recognised in the Income Statement on the date of dividend declaration.Profit or loss on the sale of fixed tangible assets is the calculated difference between their selling price and book value. Thedifference is recognised in the Income Statement as operating revenues or expenses accordingly.
Reykjavíkurborg Financial Statements 201613 All amounts in ISK thousand
4. Expense recognition
5. Indexation and exchange‐rate criteria
6. Intangible assets
7. Capitalisation of fixed tangible assets
8. Financial instruments
Notes
Expenses are recognised in the Income Statement at the time that they are incurred and the right to claim has been transferred tothe seller.
Assets and liabilities which are indexed or denominated in foreign currency are recognised in the financial statements at theindexation or exchange rate applying at year‐end 2016. Accrued indexation and exchange‐rate differeces are recognised in theIncome Statement.
Geothermal rights are capitalised in the Balance Sheet as an intangible asset at their depreciated cost price. Geothermal rights areseparated from land on acquisition. Preparation costs are capitalised in the Balance Sheet as intangible assets if there is a reasonableprobability that the work will generate revenues later. Cost is expensed over the projected utilisation time. Other intangible assetsare assessed at cost value, net of accrued depreciation and impairment
Fixed tangible assets, other than plots and land for which the municipality receives lease income, are recognised as assets at cost netof depreciation based on their estimated useful life. The cost of operational assets consists of their purchasing price and the costsincurred from their acquisition and improvements. Purchases of tools and equipment for Reykjavik A operation under ISK 2.5 millionare expensed, with the exception that equipment which is subject to compulsory registration is capitalised.
Leased assets are real estate that the municipality leases pursuant to lease agreements with a minimum term of three years and nooption of termination by the municipality within a year from their starting date. Orkuveita Reykjavikur applies IFRS accounting policieswhen assessing whether assets leased by the company are recorded as leased assets.
The cost of a leased asset is regarded as its fair value on the date of the contract or the net present value of the minimum leasepayments under the lease agreement, if lower.
Plots and land for which the municipality receives lease income are entered at fair value or net present value of future revenuespursuant to the current lease agreements, if lower. Plots and land are revalued on a regular basis. Revaluation of plots and land isrecognised as equity.
The distribution and production systems of Orkuveita Reykjavikur and operational assets of Íþrótta‐ og sýningahöllin ehf. arerecognised at restated value in the Balance Sheet for Reykjavik Group, which is their fair market value on the restatement date, net ofany additional depreciation from that time. Revaluation of these assets is undertaken on a regular basis. All increases in valuation arerecognised as equity. Depreciation on the restated value is entered in the Income Statement.
Investment properties are real estate of Félagsbústaðir hf. owned by the company with the object of raising rent revenue. Investmentproperties are recognised at fair value in accordance with International Financial Reporting Standards (IFRS). The evaluation ofinvestment properties is based on the official real estate evaluation of the Icelandic National Registry. According to information fromthe National Registry, the official real estate evaluation is fair value estimated in real estate market transactions. The evaluation isperformed in May each year based on pricing in February of the same year. The newly calculated evaluation comes into effect at theend of the year. The real estate evaluation covers both the buildings and the plots and is divided into building evaluation and plotevaluation. The real estate evaluation is extrapolated based on the building cost index until the end of the year. Changes in theevaluation of investment properties are recognised under the item value adjustment of investment properties income statement.
Financial instrument is categorised as financial asset or liability at fair value in the Income Statement in the case of trading assets ortrading liabilities, or if they are recognised as financial instruments at fair value in the Income Statement at their initial entry in theaccounts. Financial assets and liabilities at fair value in Orkuveita Reykjavikur's Income Statement are recognised at fair value in theBalance Sheet. Changes in fair value are recognised in the Income Statement.Embedded derivatives are separated from the host contract and recognised separately if the economic characteristics and risks of thehost contract and the embedded derivative are not closely related, another instrument with the same provisions as the embeddedderivative would be defined as a derivative, and the mixed contract is not recognised at fair value in the income statement. OrkuveitaReykjavikur uses derivatives to hedge against currency, interest and aluminium price risk. Derivative contracts are recognised at fairvalue in the Balance Sheet, and changes in fair value are recognised in the Income Statement.
Reykjavíkurborg Financial Statements 201614 All amounts in ISK thousand
9. Depreciation of fixed tangible assets, other than leased assets
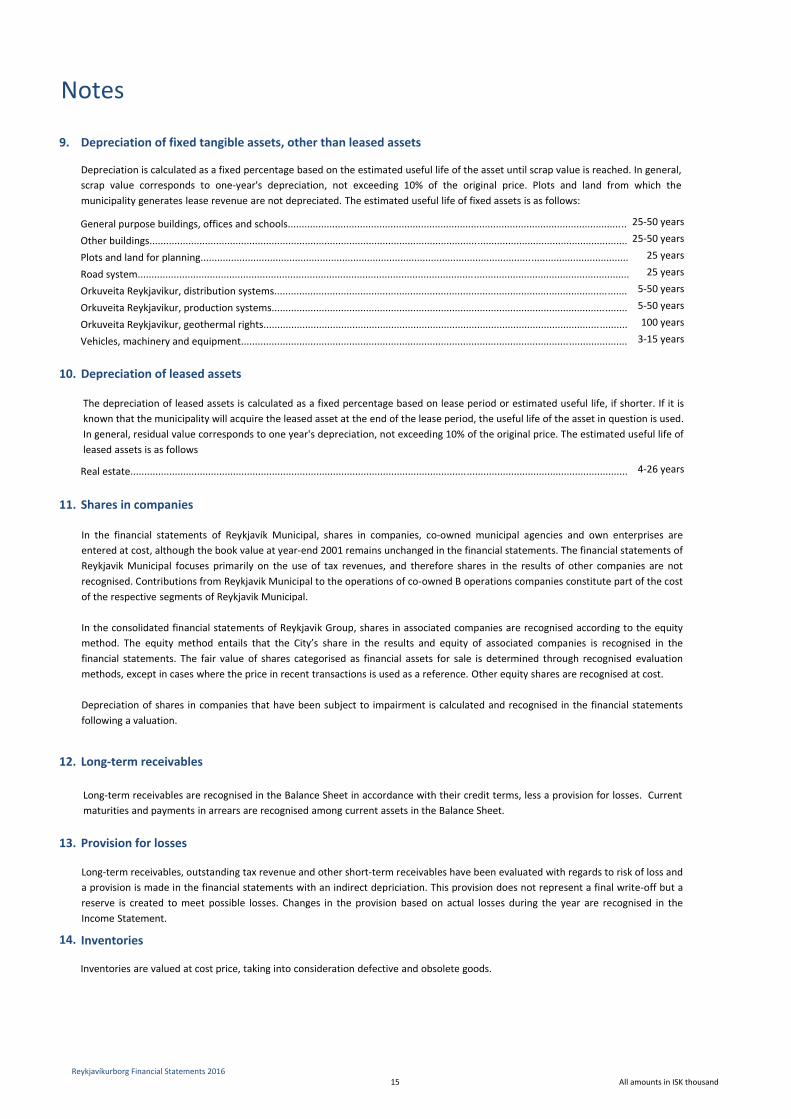
25‐50 years25‐50 years
25 years25 years
5‐50 years5‐50 years100 years3‐15 years
10. Depreciation of leased assets
4‐26 years
11. Shares in companies
12. Long‐term receivables
13. Provision for losses
14. Inventories
Notes
Real estate...................................................................................................................................................................................
General purpose buildings, offices and schools..........................................................................................................................Other buildings............................................................................................................................................................................Plots and land for planning..........................................................................................................................................................Road system.................................................................................................................................................................................Orkuveita Reykjavikur, distribution systems...............................................................................................................................Orkuveita Reykjavikur, production systems................................................................................................................................Orkuveita Reykjavikur, geothermal rights...................................................................................................................................Vehicles, machinery and equipment...........................................................................................................................................
Depreciation is calculated as a fixed percentage based on the estimated useful life of the asset until scrap value is reached. In general,scrap value corresponds to one‐year's depreciation, not exceeding 10% of the original price. Plots and land from which themunicipality generates lease revenue are not depreciated. The estimated useful life of fixed assets is as follows:
The depreciation of leased assets is calculated as a fixed percentage based on lease period or estimated useful life, if shorter. If it isknown that the municipality will acquire the leased asset at the end of the lease period, the useful life of the asset in question is used.In general, residual value corresponds to one year's depreciation, not exceeding 10% of the original price. The estimated useful life ofleased assets is as follows
In the financial statements of Reykjavík Municipal, shares in companies, co‐owned municipal agencies and own enterprises areentered at cost, although the book value at year‐end 2001 remains unchanged in the financial statements. The financial statements ofReykjavik Municipal focuses primarily on the use of tax revenues, and therefore shares in the results of other companies are notrecognised. Contributions from Reykjavik Municipal to the operations of co‐owned B operations companies constitute part of the costof the respective segments of Reykjavik Municipal.
In the consolidated financial statements of Reykjavik Group, shares in associated companies are recognised according to the equitymethod. The equity method entails that the City’s share in the results and equity of associated companies is recognised in thefinancial statements. The fair value of shares categorised as financial assets for sale is determined through recognised evaluationmethods, except in cases where the price in recent transactions is used as a reference. Other equity shares are recognised at cost.
Depreciation of shares in companies that have been subject to impairment is calculated and recognised in the financial statementsfollowing a valuation.
Long‐term receivables are recognised in the Balance Sheet in accordance with their credit terms, less a provision for losses. Currentmaturities and payments in arrears are recognised among current assets in the Balance Sheet.
Long‐term receivables, outstanding tax revenue and other short‐term receivables have been evaluated with regards to risk of loss anda provision is made in the financial statements with an indirect depriciation. This provision does not represent a final write‐off but areserve is created to meet possible losses. Changes in the provision based on actual losses during the year are recognised in theIncome Statement.
Inventories are valued at cost price, taking into consideration defective and obsolete goods.
Reykjavíkurborg Financial Statements 201615 All amounts in ISK thousand
15. Short term receivables
16. Cash and cash equivalents
17. Assets off the Balance Sheet
18. Obligations
19. Deferred income tax liability and assets
20. Long‐term liabilities
21. Lease debts
22. Budget
23. Statement of Cash Flows
Notes
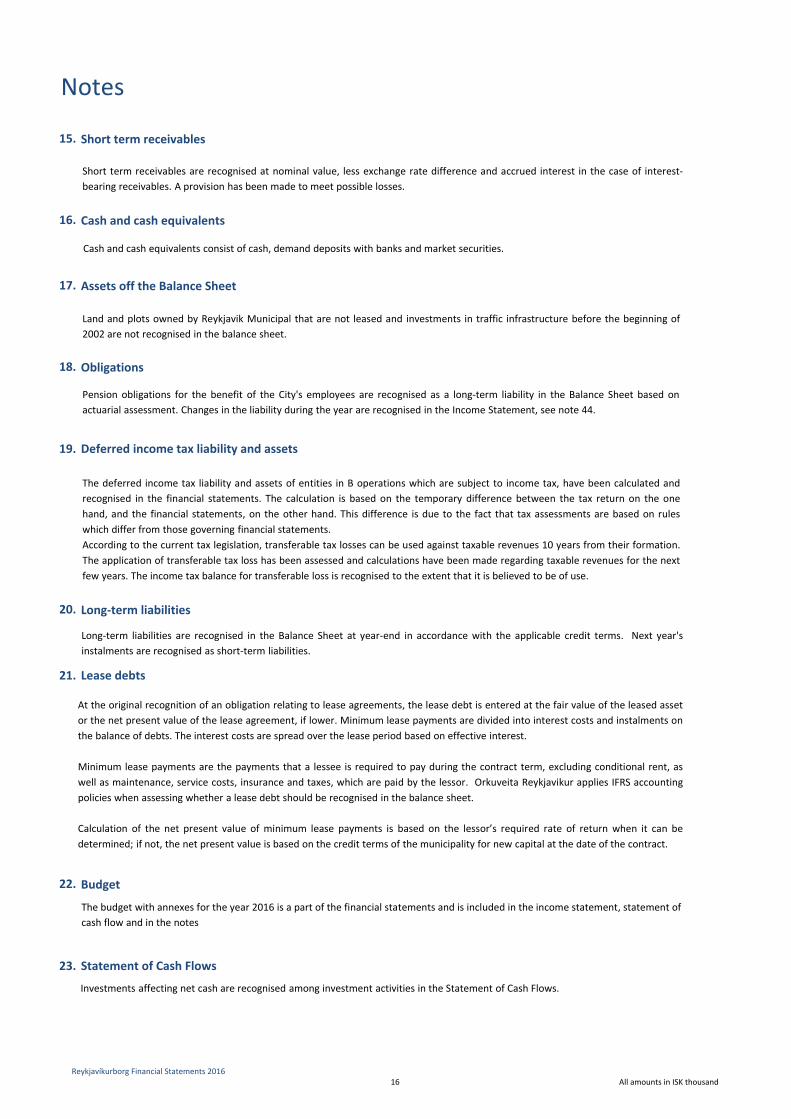
Short term receivables are recognised at nominal value, less exchange rate difference and accrued interest in the case of interest‐bearing receivables. A provision has been made to meet possible losses.
Cash and cash equivalents consist of cash, demand deposits with banks and market securities.
Land and plots owned by Reykjavik Municipal that are not leased and investments in traffic infrastructure before the beginning of2002 are not recognised in the balance sheet.
Pension obligations for the benefit of the City's employees are recognised as a long‐term liability in the Balance Sheet based onactuarial assessment. Changes in the liability during the year are recognised in the Income Statement, see note 44.
The deferred income tax liability and assets of entities in B operations which are subject to income tax, have been calculated andrecognised in the financial statements. The calculation is based on the temporary difference between the tax return on the onehand, and the financial statements, on the other hand. This difference is due to the fact that tax assessments are based on ruleswhich differ from those governing financial statements.According to the current tax legislation, transferable tax losses can be used against taxable revenues 10 years from their formation.The application of transferable tax loss has been assessed and calculations have been made regarding taxable revenues for the nextfew years. The income tax balance for transferable loss is recognised to the extent that it is believed to be of use.
Long‐term liabilities are recognised in the Balance Sheet at year‐end in accordance with the applicable credit terms. Next year'sinstalments are recognised as short‐term liabilities.
At the original recognition of an obligation relating to lease agreements, the lease debt is entered at the fair value of the leased assetor the net present value of the lease agreement, if lower. Minimum lease payments are divided into interest costs and instalments onthe balance of debts. The interest costs are spread over the lease period based on effective interest.
Minimum lease payments are the payments that a lessee is required to pay during the contract term, excluding conditional rent, aswell as maintenance, service costs, insurance and taxes, which are paid by the lessor. Orkuveita Reykjavikur applies IFRS accountingpolicies when assessing whether a lease debt should be recognised in the balance sheet.
Calculation of the net present value of minimum lease payments is based on the lessor’s required rate of return when it can bedetermined; if not, the net present value is based on the credit terms of the municipality for new capital at the date of the contract.
The budget with annexes for the year 2016 is a part of the financial statements and is included in the income statement, statement ofcash flow and in the notes
Investments affecting net cash are recognised among investment activities in the Statement of Cash Flows.
Reykjavíkurborg Financial Statements 201616 All amounts in ISK thousand
24. Operating revenue
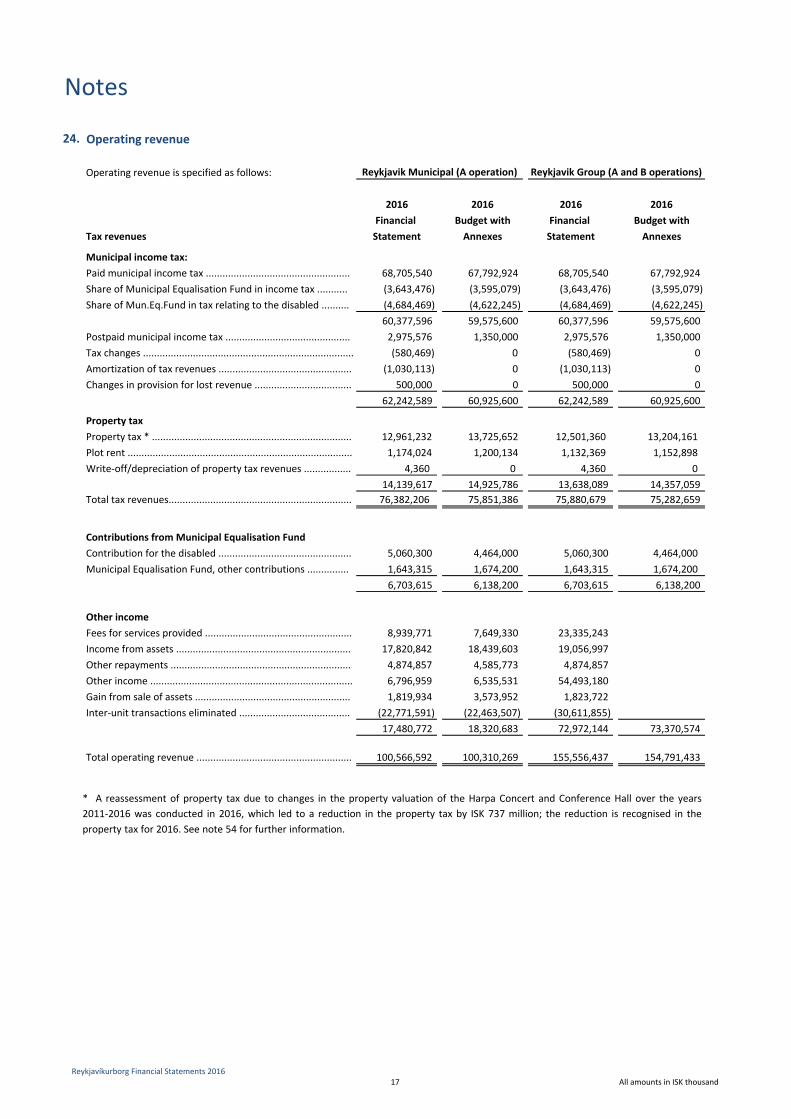
Operating revenue is specified as follows:
2016 2016 2016 2016Financial Budget with Financial Budget with
Tax revenues Statement Annexes Statement Annexes
Municipal income tax:Paid municipal income tax .................................................... 68,705,540 67,792,924 68,705,540 67,792,924 Share of Municipal Equalisation Fund in income tax ........... (3,643,476) (3,595,079) (3,643,476) (3,595,079)Share of Mun.Eq.Fund in tax relating to the disabled .......... (4,684,469) (4,622,245) (4,684,469) (4,622,245)
60,377,596 59,575,600 60,377,596 59,575,600 Postpaid municipal income tax ............................................. 2,975,576 1,350,000 2,975,576 1,350,000 Tax changes ............................................................................ (580,469) 0 (580,469) 0 Amortization of tax revenues ................................................ (1,030,113) 0 (1,030,113) 0 Changes in provision for lost revenue ................................... 500,000 0 500,000 0
62,242,589 60,925,600 62,242,589 60,925,600
Property taxProperty tax * ........................................................................ 12,961,232 13,725,652 12,501,360 13,204,161 Plot rent ................................................................................. 1,174,024 1,200,134 1,132,369 1,152,898 Write‐off/depreciation of property tax revenues ................. 4,360 0 4,360 0
14,139,617 14,925,786 13,638,089 14,357,059 Total tax revenues.................................................................. 76,382,206 75,851,386 75,880,679 75,282,659
Contributions from Municipal Equalisation FundContribution for the disabled ................................................ 5,060,300 4,464,000 5,060,300 4,464,000 Municipal Equalisation Fund, other contributions ............... 1,643,315 1,674,200 1,643,315 1,674,200
6,703,615 6,138,200 6,703,615 6,138,200
Other incomeFees for services provided ..................................................... 8,939,771 7,649,330 23,335,243 Income from assets ............................................................... 17,820,842 18,439,603 19,056,997 Other repayments ................................................................. 4,874,857 4,585,773 4,874,857 Other income ......................................................................... 6,796,959 6,535,531 54,493,180 Gain from sale of assets ........................................................ 1,819,934 3,573,952 1,823,722 Inter‐unit transactions eliminated ........................................ (22,771,591) (22,463,507) (30,611,855)
17,480,772 18,320,683 72,972,144 73,370,574
Total operating revenue ........................................................ 100,566,592 100,310,269 155,556,437 154,791,433
Notes
Reykjavik Group (A and B operations)Reykjavik Municipal (A operation)
* A reassessment of property tax due to changes in the property valuation of the Harpa Concert and Conference Hall over the years2011‐2016 was conducted in 2016, which led to a reduction in the property tax by ISK 737 million; the reduction is recognised in theproperty tax for 2016. See note 54 for further information.
Reykjavíkurborg Financial Statements 201617 All amounts in ISK thousand
25. Wage cost and wage‐related expenses
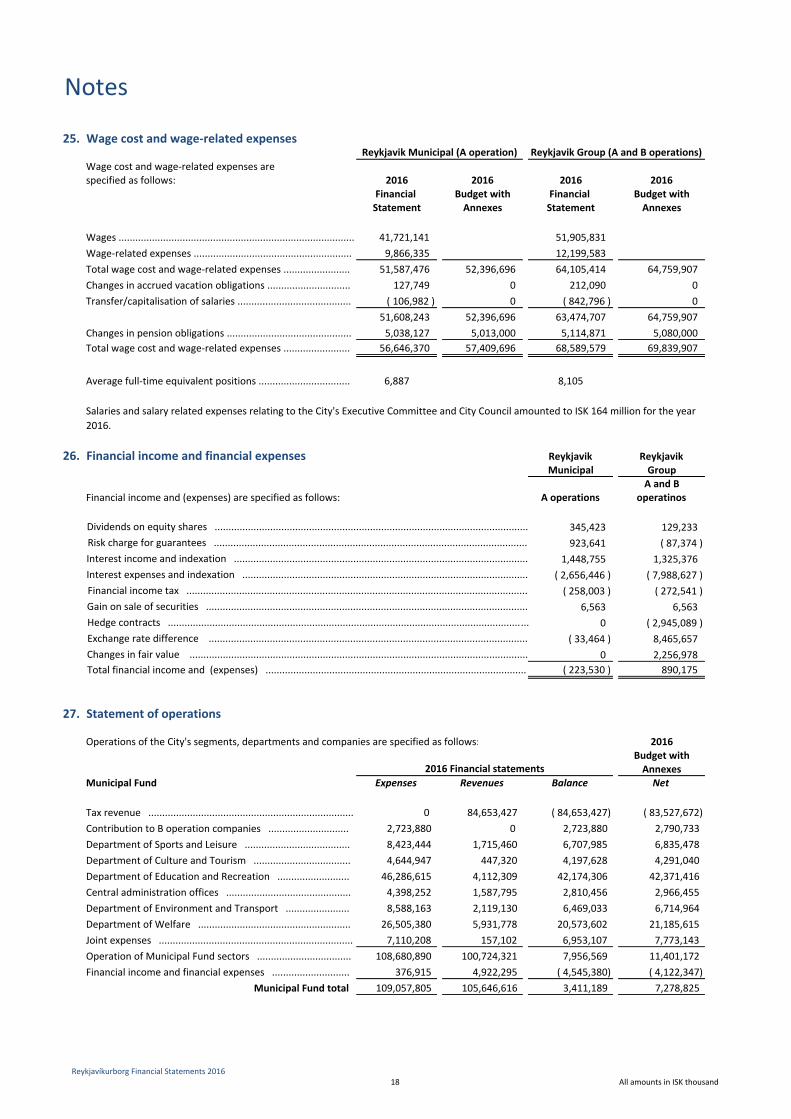
Wage cost and wage‐related expenses are specified as follows: 2016 2016 2016 2016
Financial Budget with Financial Budget withStatement Annexes Statement Annexes
Wages ..................................................................................... 41,721,141 51,905,831 Wage‐related expenses ......................................................... 9,866,335 12,199,583 Total wage cost and wage‐related expenses ........................ 51,587,476 52,396,696 64,105,414 64,759,907 Changes in accrued vacation obligations .............................. 127,749 0 212,090 0 Transfer/capitalisation of salaries ......................................... ( 106,982 ) 0 ( 842,796 ) 0
51,608,243 52,396,696 63,474,707 64,759,907 Changes in pension obligations ............................................. 5,038,127 5,013,000 5,114,871 5,080,000 Total wage cost and wage‐related expenses ........................ 56,646,370 57,409,696 68,589,579 69,839,907
Average full‐time equivalent positions ................................. 6,887 8,105
26. Financial income and financial expenses Reykjavik Reykjavik Municipal Group
A and BFinancial income and (expenses) are specified as follows: A operations operatinos
345,423 129,233 923,641 ( 87,374 )
1,448,755 1,325,376 ( 2,656,446 ) ( 7,988,627 )( 258,003 ) ( 272,541 )
6,563 6,563 0 ( 2,945,089 )
( 33,464 ) 8,465,657 0 2,256,978
( 223,530 ) 890,175
27. Statement of operations
Operations of the City's segments, departments and companies are specified as follows: 2016Budget withAnnexes
Municipal Fund Expenses Revenues Balance Net
Tax revenue .......................................................................... 0 84,653,427 ( 84,653,427) ( 83,527,672)Contribution to B operation companies ............................. 2,723,880 0 2,723,880 2,790,733Department of Sports and Leisure ...................................... 8,423,444 1,715,460 6,707,985 6,835,478Department of Culture and Tourism ................................... 4,644,947 447,320 4,197,628 4,291,040Department of Education and Recreation .......................... 46,286,615 4,112,309 42,174,306 42,371,416Central administration offices ............................................. 4,398,252 1,587,795 2,810,456 2,966,455Department of Environment and Transport ....................... 8,588,163 2,119,130 6,469,033 6,714,964Department of Welfare ....................................................... 26,505,380 5,931,778 20,573,602 21,185,615Joint expenses ...................................................................... 7,110,208 157,102 6,953,107 7,773,143Operation of Municipal Fund sectors .................................. 108,680,890 100,724,321 7,956,569 11,401,172Financial income and financial expenses ............................ 376,915 4,922,295 ( 4,545,380) ( 4,122,347)
Municipal Fund total 109,057,805 105,646,616 3,411,189 7,278,825
Total financial income and (expenses) ..............................................................................................Changes in fair value ..........................................................................................................................Exchange rate difference ...................................................................................................................
Financial income tax ...........................................................................................................................
Dividends on equity shares .................................................................................................................Risk charge for guarantees .................................................................................................................
Interest expenses and indexation .......................................................................................................Interest income and indexation ..........................................................................................................
2016 Financial statements
Reykjavik Group (A and B operations)Reykjavik Municipal (A operation)
Gain on sale of securities ....................................................................................................................Hedge contracts ..................................................................................................................................
Salaries and salary related expenses relating to the City's Executive Committee and City Council amounted to ISK 164 million for the year 2016.
Notes
Reykjavíkurborg Financial Statements 201618 All amounts in ISK thousand
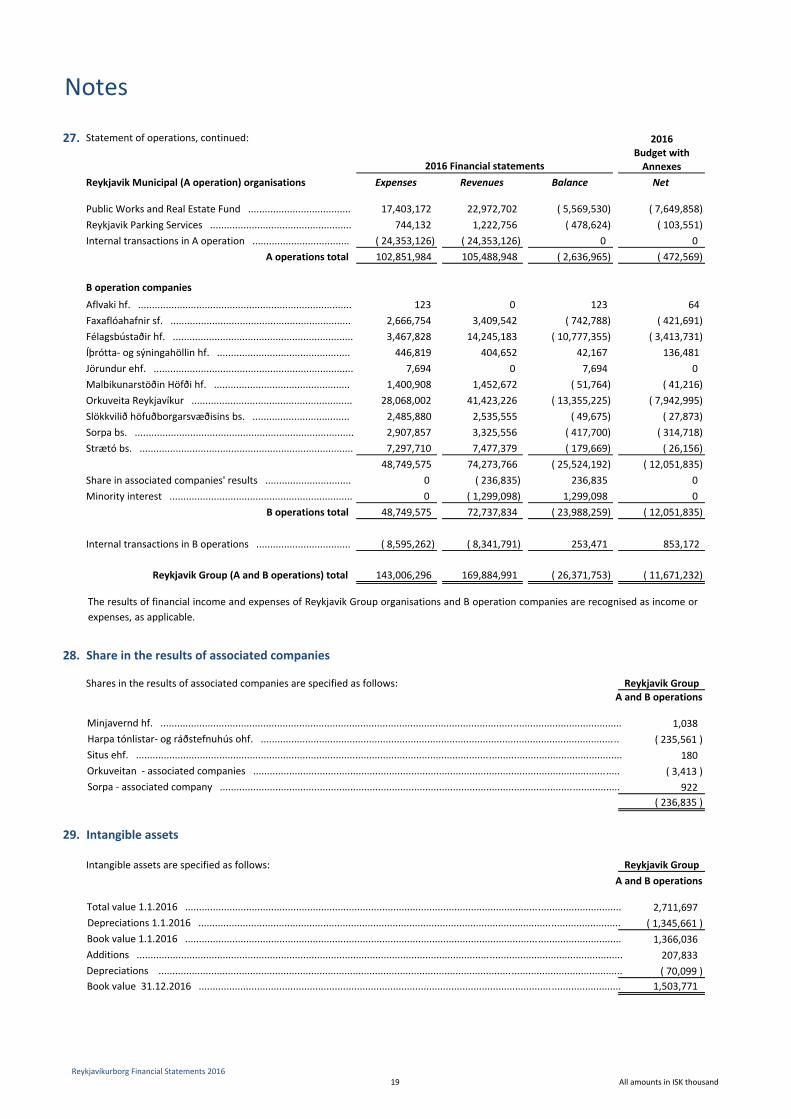
27. Statement of operations, continued: 2016Budget withAnnexes
Reykjavik Municipal (A operation) organisations Expenses Revenues Balance Net
Public Works and Real Estate Fund ..................................... 17,403,172 22,972,702 ( 5,569,530) ( 7,649,858)Reykjavik Parking Services ................................................... 744,132 1,222,756 ( 478,624) ( 103,551)Internal transactions in A operation ................................... ( 24,353,126) ( 24,353,126) 0 0
A operations total 102,851,984 105,488,948 ( 2,636,965) ( 472,569)
B operation companies
Aflvaki hf. ............................................................................. 123 0 123 64Faxaflóahafnir sf. ................................................................. 2,666,754 3,409,542 ( 742,788) ( 421,691)Félagsbústaðir hf. ................................................................. 3,467,828 14,245,183 ( 10,777,355) ( 3,413,731)Íþrótta‐ og sýningahöllin hf. ................................................ 446,819 404,652 42,167 136,481Jörundur ehf. ........................................................................ 7,694 0 7,694 0 Malbikunarstöðin Höfði hf. ................................................. 1,400,908 1,452,672 ( 51,764) ( 41,216)Orkuveita Reykjavíkur .......................................................... 28,068,002 41,423,226 ( 13,355,225) ( 7,942,995)Slökkvilið höfuðborgarsvæðisins bs. ................................... 2,485,880 2,535,555 ( 49,675) ( 27,873)Sorpa bs. ............................................................................... 2,907,857 3,325,556 ( 417,700) ( 314,718)Strætó bs. ............................................................................. 7,297,710 7,477,379 ( 179,669) ( 26,156)
48,749,575 74,273,766 ( 25,524,192) ( 12,051,835)Share in associated companies' results ............................... 0 ( 236,835) 236,835 0 Minority interest .................................................................. 0 ( 1,299,098) 1,299,098 0
B operations total 48,749,575 72,737,834 ( 23,988,259) ( 12,051,835)
Internal transactions in B operations .................................. ( 8,595,262) ( 8,341,791) 253,471 853,172
Reykjavik Group (A and B operations) total 143,006,296 169,884,991 ( 26,371,753) ( 11,671,232)
28. Share in the results of associated companies
Shares in the results of associated companies are specified as follows: Reykjavik GroupA and B operations
1,038 ( 235,561 )
180 ( 3,413 )
922 ( 236,835 )
29. Intangible assets
Intangible assets are specified as follows: Reykjavik GroupA and B operations
2,711,697 ( 1,345,661 )1,366,036 207,833 ( 70,099 )
1,503,771
2016 Financial statements
Notes
Minjavernd hf. ......................................................................................................................................................................
Orkuveitan ‐ associated companies ....................................................................................................................................Sorpa ‐ associated company ................................................................................................................................................
Situs ehf. ...............................................................................................................................................................................
Total value 1.1.2016 .............................................................................................................................................................
Additions ...............................................................................................................................................................................
Depreciations 1.1.2016 ........................................................................................................................................................Book value 1.1.2016 .............................................................................................................................................................
Depreciations .......................................................................................................................................................................Book value 31.12.2016 ........................................................................................................................................................
Harpa tónlistar‐ og ráðstefnuhús ohf. .................................................................................................................................
The results of financial income and expenses of Reykjavik Group organisations and B operation companies are recognised as income orexpenses, as applicable.
Reykjavíkurborg Financial Statements 201619 All amounts in ISK thousand
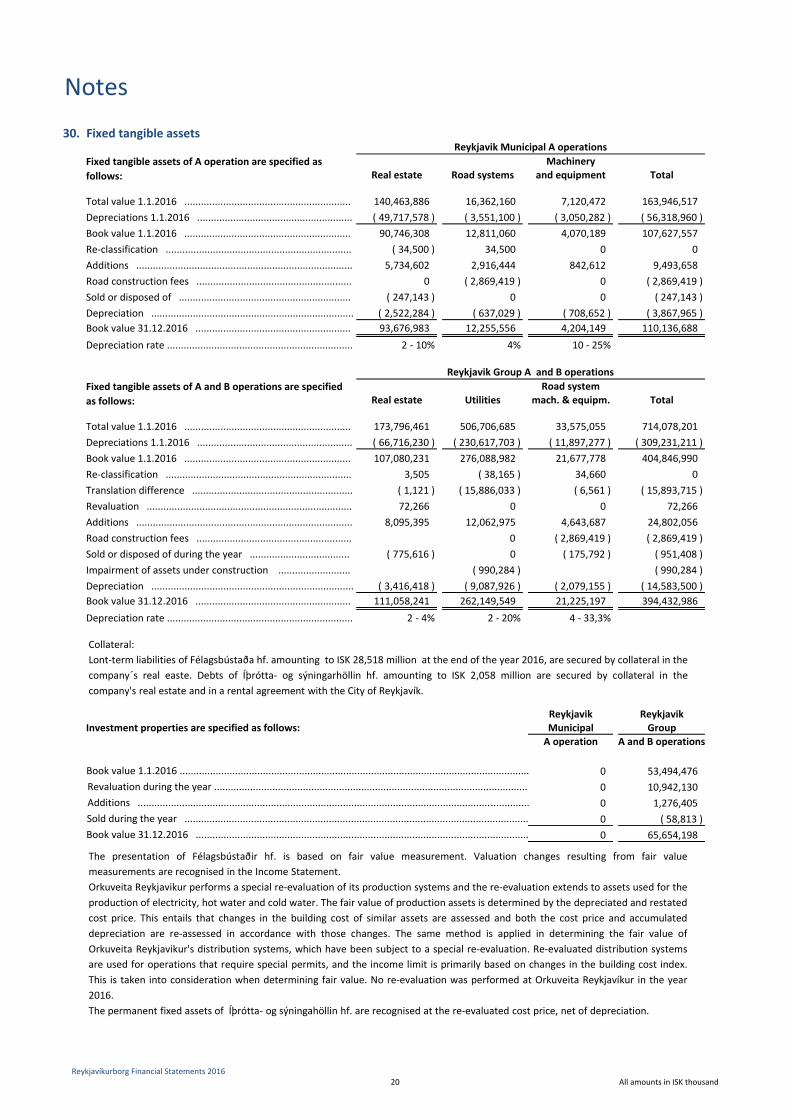
30. Fixed tangible assets
MachineryReal estate Road systems and equipment Total
Total value 1.1.2016 ............................................................ 140,463,886 16,362,160 7,120,472 163,946,517 Depreciations 1.1.2016 ........................................................ ( 49,717,578 ) ( 3,551,100 ) ( 3,050,282 ) ( 56,318,960 )Book value 1.1.2016 ............................................................ 90,746,308 12,811,060 4,070,189 107,627,557 Re‐classification ................................................................... ( 34,500 ) 34,500 0 0 Additions .............................................................................. 5,734,602 2,916,444 842,612 9,493,658 Road construction fees ........................................................ 0 ( 2,869,419 ) 0 ( 2,869,419 )Sold or disposed of .............................................................. ( 247,143 ) 0 0 ( 247,143 )Depreciation ......................................................................... ( 2,522,284 ) ( 637,029 ) ( 708,652 ) ( 3,867,965 )Book value 31.12.2016 ........................................................ 93,676,983 12,255,556 4,204,149 110,136,688 Depreciation rate ................................................................... 2 ‐ 10% 4% 10 ‐ 25%
Road systemReal estate Utilities mach. & equipm. Total
Total value 1.1.2016 ............................................................ 173,796,461 506,706,685 33,575,055 714,078,201 Depreciations 1.1.2016 ........................................................ ( 66,716,230 ) ( 230,617,703 ) ( 11,897,277 ) ( 309,231,211 )Book value 1.1.2016 ............................................................ 107,080,231 276,088,982 21,677,778 404,846,990 Re‐classification ................................................................... 3,505 ( 38,165 ) 34,660 0 Translation difference .......................................................... ( 1,121 ) ( 15,886,033 ) ( 6,561 ) ( 15,893,715 )Revaluation .......................................................................... 72,266 0 0 72,266 Additions .............................................................................. 8,095,395 12,062,975 4,643,687 24,802,056 Road construction fees ........................................................ 0 ( 2,869,419 ) ( 2,869,419 )Sold or disposed of during the year .................................... ( 775,616 ) 0 ( 175,792 ) ( 951,408 )Impairment of assets under construction .......................... ( 990,284 ) ( 990,284 )Depreciation ......................................................................... ( 3,416,418 ) ( 9,087,926 ) ( 2,079,155 ) ( 14,583,500 )Book value 31.12.2016 ........................................................ 111,058,241 262,149,549 21,225,197 394,432,986 Depreciation rate ................................................................... 2 ‐ 4% 2 ‐ 20% 4 ‐ 33,3%
Reykjavik ReykjavikInvestment properties are specified as follows: Municipal Group
A operation A and B operations
0 53,494,476 0 10,942,130 0 1,276,405 0 ( 58,813 )0 65,654,198
Reykjavik Group A and B operations
Reykjavik Municipal A operations
Notes
Sold during the year ............................................................................................................................
Fixed tangible assets of A operation are specified as follows:
Fixed tangible assets of A and B operations are specified as follows:
Additions .............................................................................................................................................
Book value 31.12.2016 ........................................................................................................................
Book value 1.1.2016 ..............................................................................................................................Revaluation during the year .................................................................................................................
The presentation of Félagsbústaðir hf. is based on fair value measurement. Valuation changes resulting from fair valuemeasurements are recognised in the Income Statement.Orkuveita Reykjavikur performs a special re‐evaluation of its production systems and the re‐evaluation extends to assets used for theproduction of electricity, hot water and cold water. The fair value of production assets is determined by the depreciated and restatedcost price. This entails that changes in the building cost of similar assets are assessed and both the cost price and accumulateddepreciation are re‐assessed in accordance with those changes. The same method is applied in determining the fair value ofOrkuveita Reykjavikur's distribution systems, which have been subject to a special re‐evaluation. Re‐evaluated distribution systemsare used for operations that require special permits, and the income limit is primarily based on changes in the building cost index.This is taken into consideration when determining fair value. No re‐evaluation was performed at Orkuveita Reykjavíkur in the year2016.The permanent fixed assets of Íþrótta‐ og sýningahöllin hf. are recognised at the re‐evaluated cost price, net of depreciation.
Collateral:Lont‐term liabilities of Félagsbústaða hf. amounting to ISK 28,518 million at the end of the year 2016, are secured by collateral in thecompany´s real easte. Debts of Íþrótta‐ og sýningarhöllin hf. amounting to ISK 2,058 million are secured by collateral in thecompany's real estate and in a rental agreement with the City of Reykjavík.
Reykjavíkurborg Financial Statements 201620 All amounts in ISK thousand
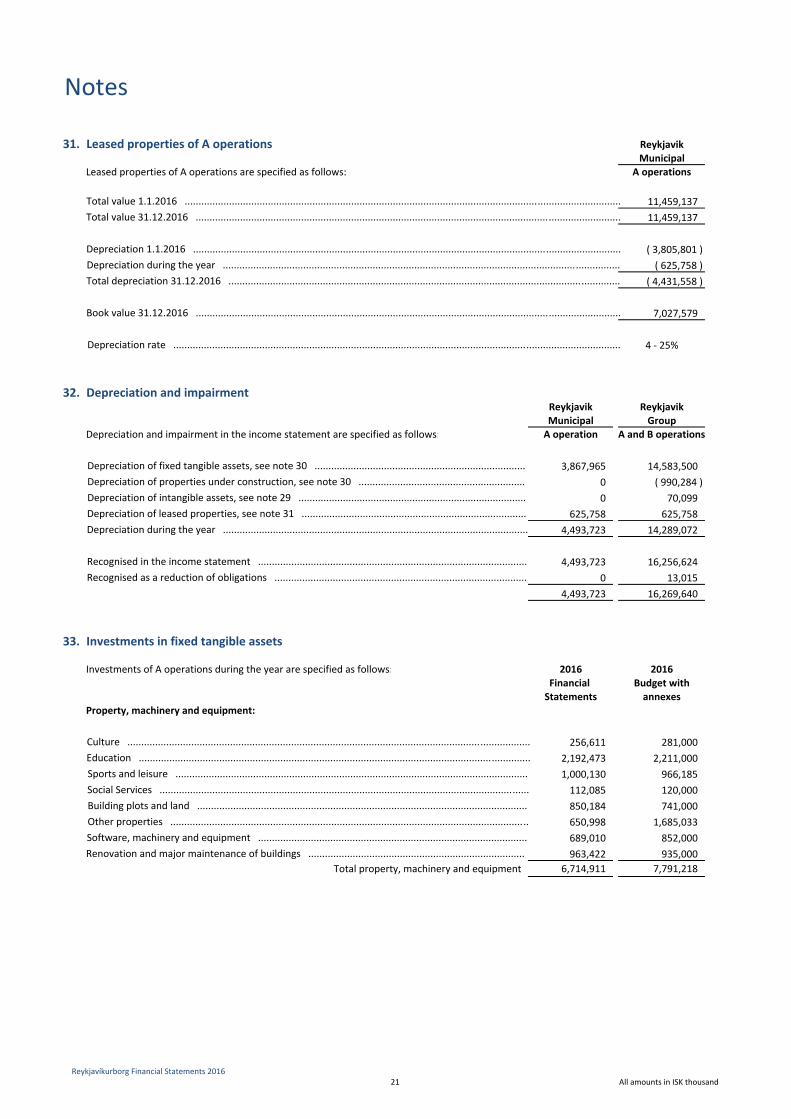
31. Leased properties of A operations ReykjavikMunicipal
Leased properties of A operations are specified as follows: A operations
11,459,137 11,459,137
( 3,805,801 )( 625,758 )
( 4,431,558 )
7,027,579
4 ‐ 25%
32. Depreciation and impairmentReykjavik ReykjavikMunicipal Group
Depreciation and impairment in the income statement are specified as follows: A operation A and B operations
3,867,965 14,583,500 0 ( 990,284 )0 70,099
625,758 625,758 4,493,723 14,289,072
4,493,723 16,256,624 0 13,015
4,493,723 16,269,640
33. Investments in fixed tangible assets
Investments of A operations during the year are specified as follows: 2016 2016Financial Budget withStatements annexes
Property, machinery and equipment:
256,611 281,000 2,192,473 2,211,000 1,000,130 966,185 112,085 120,000 850,184 741,000 650,998 1,685,033 689,010 852,000 963,422 935,000
Total property, machinery and equipment 6,714,911 7,791,218
Depreciation 1.1.2016 ..........................................................................................................................................................
Notes
Depreciation during the year ...............................................................................................................................................
Education .............................................................................................................................................
Building plots and land .......................................................................................................................Other properties .................................................................................................................................
Renovation and major maintenance of buildings ..............................................................................
Sports and leisure ...............................................................................................................................
Culture .................................................................................................................................................
Social Services .....................................................................................................................................
Software, machinery and equipment .................................................................................................
Total value 31.12.2016 .........................................................................................................................................................Total value 1.1.2016 .............................................................................................................................................................
Depreciation of leased properties, see note 31 .................................................................................
Depreciation of fixed tangible assets, see note 30 ............................................................................
Recognised in the income statement .................................................................................................
Depreciation of intangible assets, see note 29 ..................................................................................
Depreciation during the year ..............................................................................................................
Total depreciation 31.12.2016 .............................................................................................................................................
Book value 31.12.2016 .........................................................................................................................................................
Depreciation of properties under construction, see note 30 ............................................................
Recognised as a reduction of obligations ...........................................................................................
Depreciation rate .................................................................................................................................................................
Reykjavíkurborg Financial Statements 201621 All amounts in ISK thousand
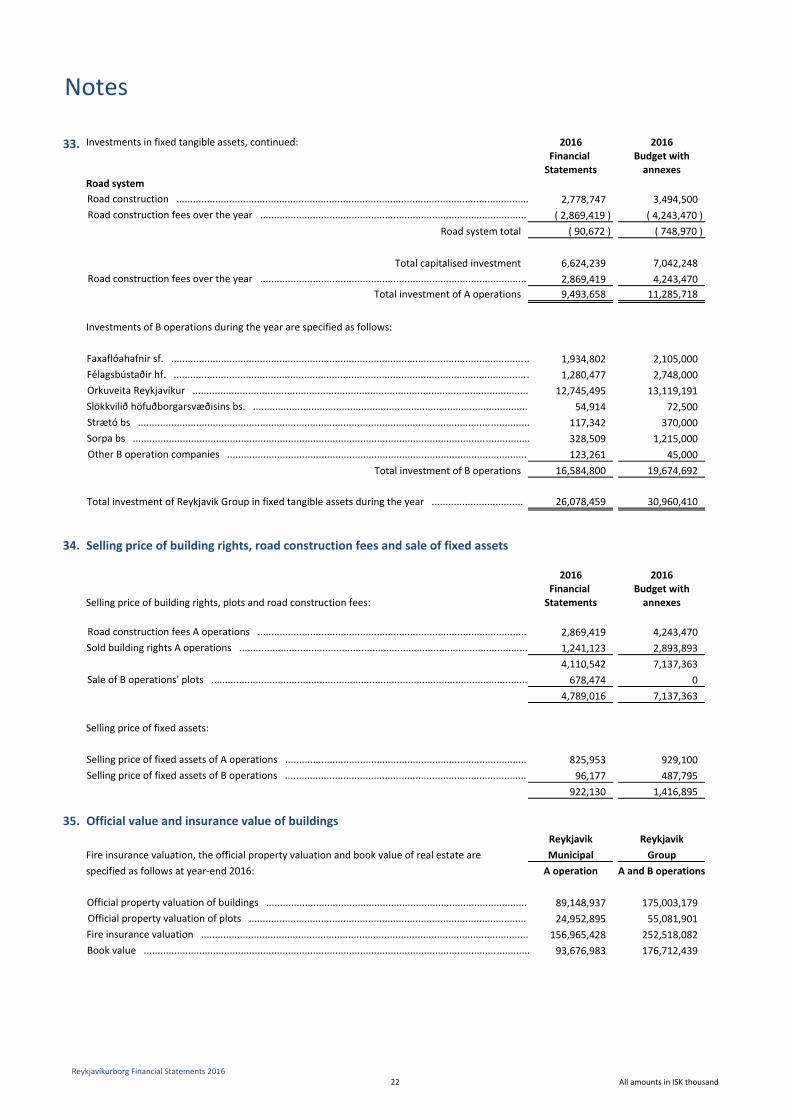
33. Investments in fixed tangible assets, continued: 2016 2016Financial Budget withStatements annexes
Road system2,778,747 3,494,500
( 2,869,419 ) ( 4,243,470 )Road system total ( 90,672 ) ( 748,970 )
Total capitalised investment 6,624,239 7,042,248 2,869,419 4,243,470
Total investment of A operations 9,493,658 11,285,718
Investments of B operations during the year are specified as follows:
1,934,802 2,105,000 1,280,477 2,748,000
12,745,495 13,119,191 54,914 72,500
117,342 370,000 328,509 1,215,000 123,261 45,000
Total investment of B operations 16,584,800 19,674,692
26,078,459 30,960,410
34. Selling price of building rights, road construction fees and sale of fixed assets
2016 2016Financial Budget with
Selling price of building rights, plots and road construction fees: Statements annexes
2,869,419 4,243,470 1,241,123 2,893,893 4,110,542 7,137,363 678,474 0
4,789,016 7,137,363
Selling price of fixed assets:
825,953 929,100 96,177 487,795
922,130 1,416,895
35. Official value and insurance value of buildingsReykjavik Reykjavik
Fire insurance valuation, the official property valuation and book value of real estate are Municipal Groupspecified as follows at year‐end 2016: A operation A and B operations
89,148,937 175,003,179 24,952,895 55,081,901
156,965,428 252,518,082 93,676,983 176,712,439
Selling price of fixed assets of A operations .......................................................................................
Fire insurance valuation ......................................................................................................................
Road construction fees over the year ................................................................................................
Road construction ...............................................................................................................................
Strætó bs .............................................................................................................................................Sorpa bs ...............................................................................................................................................Other B operation companies ............................................................................................................
Sale of B operations' plots ..................................................................................................................
Selling price of fixed assets of B operations .......................................................................................
Total investment of Reykjavik Group in fixed tangible assets during the year .................................
Road construction fees A operations .................................................................................................
Road construction fees over the year ................................................................................................
Sold building rights A operations ........................................................................................................
Faxaflóahafnir sf. .................................................................................................................................Félagsbústaðir hf. ................................................................................................................................Orkuveita Reykjavíkur .........................................................................................................................
Book value ...........................................................................................................................................
Official property valuation of buildings ..............................................................................................Official property valuation of plots ....................................................................................................
Notes
Slökkvilið höfuðborgarsvæðisins bs. ...................................................................................................
Reykjavíkurborg Financial Statements 201622 All amounts in ISK thousand
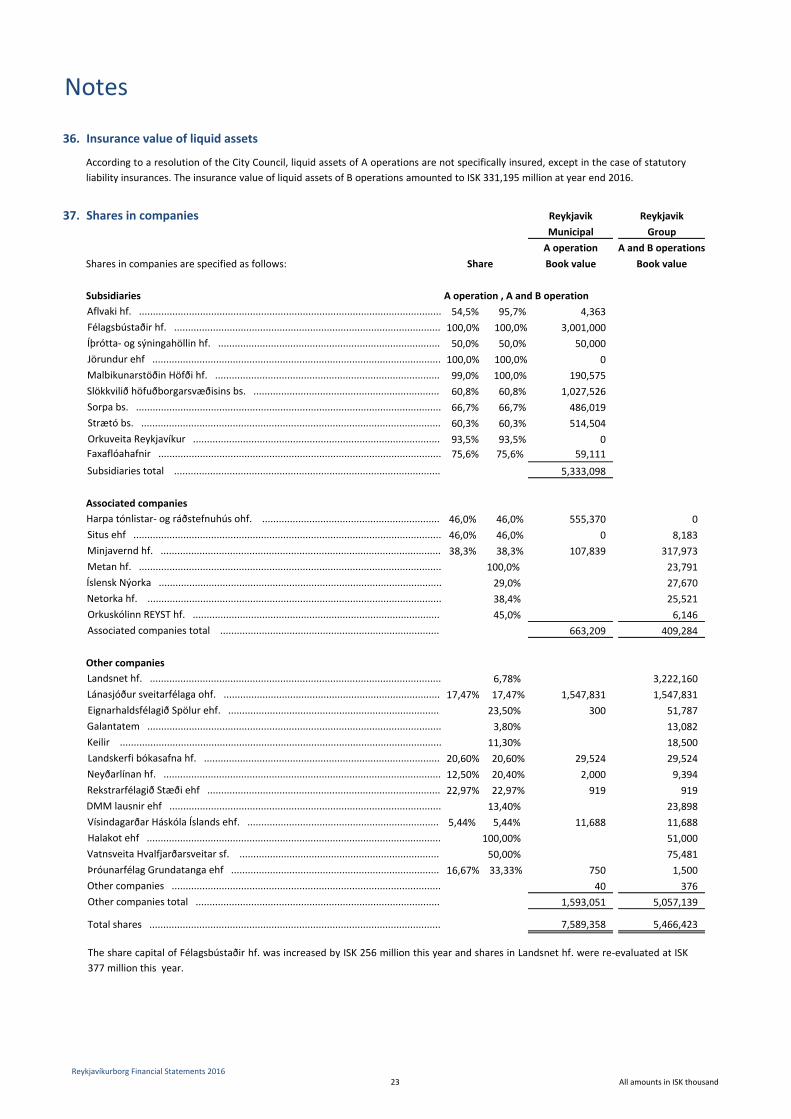
36. Insurance value of liquid assets
37. Shares in companies Reykjavik ReykjavikMunicipal GroupA operation A and B operations
Shares in companies are specified as follows: Share Book value Book value
Subsidiaries A operation , A and B operation 54,5% 95,7% 4,363 100,0% 100,0% 3,001,000 50,0% 50,0% 50,000 100,0% 100,0% 0 99,0% 100,0% 190,575 60,8% 60,8% 1,027,526 66,7% 66,7% 486,019 60,3% 60,3% 514,504 93,5% 93,5% 0 75,6% 75,6% 59,111
5,333,098
Associated companies 46,0% 46,0% 555,370 0 46,0% 46,0% 0 8,183 38,3% 38,3% 107,839 317,973 100,0% 23,791
29,0% 27,670 38,4% 25,521 45,0% 6,146
663,209 409,284
Other companies6,78% 3,222,160
17,47% 17,47% 1,547,831 1,547,831 23,50% 300 51,787 3,80% 13,082
11,30% 18,500 20,60% 20,60% 29,524 29,524 12,50% 20,40% 2,000 9,394 22,97% 22,97% 919 919
13,40% 23,898 5,44% 5,44% 11,688 11,688
100,00% 51,000 50,00% 75,481
16,67% 33,33% 750 1,500 40 376
1,593,051 5,057,139
7,589,358 5,466,423
DMM lausnir ehf ..................................................................................................
Neyðarlínan hf. ....................................................................................................
Galantatem ..........................................................................................................
Other companies total ........................................................................................
Associated companies total ...............................................................................
Landskerfi bókasafna hf. .....................................................................................
Rekstrarfélagið Stæði ehf ....................................................................................
Other companies .................................................................................................
Total shares .........................................................................................................
Aflvaki hf. .............................................................................................................
Eignarhaldsfélagið Spölur ehf. ............................................................................
Metan hf. .............................................................................................................
Strætó bs. ............................................................................................................
Situs ehf ...............................................................................................................
Faxaflóahafnir ......................................................................................................
Lánasjóður sveitarfélaga ohf. ..............................................................................
Íslensk Nýorka ......................................................................................................
Jörundur ehf ........................................................................................................
Slökkvilið höfuðborgarsvæðisins bs. ...................................................................
Minjavernd hf. .....................................................................................................
Subsidiaries total ................................................................................................
Notes
Orkuveita Reykjavíkur .........................................................................................
Harpa tónlistar‐ og ráðstefnuhús ohf. ................................................................
Félagsbústaðir hf. ................................................................................................
Sorpa bs. ..............................................................................................................
Íþrótta‐ og sýningahöllin hf. ................................................................................
Malbikunarstöðin Höfði hf. .................................................................................
Orkuskólinn REYST hf. .........................................................................................Netorka hf. ..........................................................................................................
Landsnet hf. .........................................................................................................
Keilir ....................................................................................................................
Vísindagarðar Háskóla Íslands ehf. .....................................................................
Þróunarfélag Grundatanga ehf ...........................................................................
Halakot ehf ..........................................................................................................Vatnsveita Hvalfjarðarsveitar sf. ........................................................................
According to a resolution of the City Council, liquid assets of A operations are not specifically insured, except in the case of statutoryliability insurances. The insurance value of liquid assets of B operations amounted to ISK 331,195 million at year end 2016.
The share capital of Félagsbústaðir hf. was increased by ISK 256 million this year and shares in Landsnet hf. were re‐evaluated at ISK377 million this year.
Reykjavíkurborg Financial Statements 201623 All amounts in ISK thousand
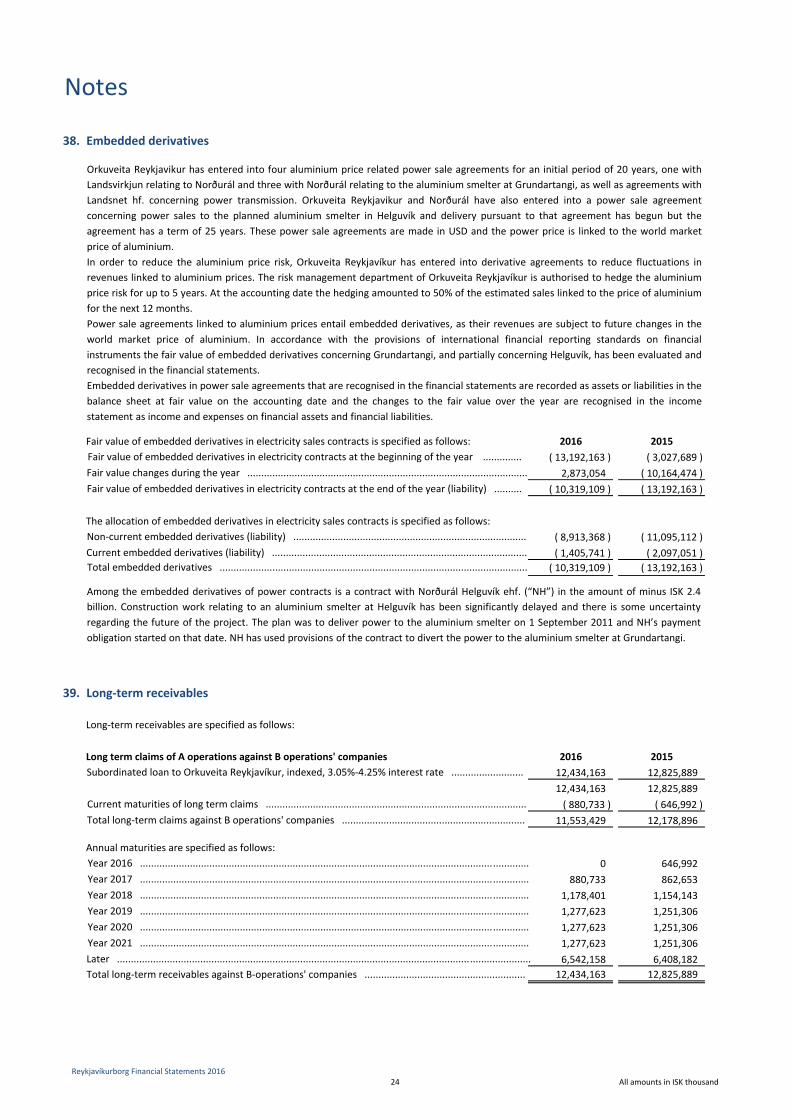
38. Embedded derivatives
Fair value of embedded derivatives in electricity sales contracts is specified as follows: 2016 2015( 13,192,163 ) ( 3,027,689 )
2,873,054 ( 10,164,474 )( 10,319,109 ) ( 13,192,163 )
The allocation of embedded derivatives in electricity sales contracts is specified as follows:( 8,913,368 ) ( 11,095,112 )( 1,405,741 ) ( 2,097,051 )
( 10,319,109 ) ( 13,192,163 )
39. Long‐term receivables
Long‐term receivables are specified as follows:
Long term claims of A operations against B operations' companies 2016 201512,434,163 12,825,889 12,434,163 12,825,889 ( 880,733 ) ( 646,992 )
11,553,429 12,178,896
Annual maturities are specified as follows:0 646,992
880,733 862,653 1,178,401 1,154,143 1,277,623 1,251,306 1,277,623 1,251,306 1,277,623 1,251,306 6,542,158 6,408,182
12,434,163 12,825,889
Year 2021 ............................................................................................................................................Later .....................................................................................................................................................
Current maturities of long term claims ..............................................................................................
Total embedded derivatives ...............................................................................................................Current embedded derivatives (liability) ............................................................................................
Subordinated loan to Orkuveita Reykjavíkur, indexed, 3.05%‐4.25% interest rate ..........................
Total long‐term claims against B operations' companies ..................................................................
Year 2016 ............................................................................................................................................
Total long‐term receivables against B‐operations' companies ..........................................................
Fair value of embedded derivatives in electricity contracts at the end of the year (liability) ..........
Year 2020 ............................................................................................................................................
Fair value of embedded derivatives in electricity contracts at the beginning of the year ..............Fair value changes during the year .....................................................................................................
Notes
Year 2018 ............................................................................................................................................Year 2017 ............................................................................................................................................
Year 2019 ............................................................................................................................................
Non‐current embedded derivatives (liability) ....................................................................................
Orkuveita Reykjavikur has entered into four aluminium price related power sale agreements for an initial period of 20 years, one withLandsvirkjun relating to Norðurál and three with Norðurál relating to the aluminium smelter at Grundartangi, as well as agreements withLandsnet hf. concerning power transmission. Orkuveita Reykjavikur and Norðurál have also entered into a power sale agreementconcerning power sales to the planned aluminium smelter in Helguvík and delivery pursuant to that agreement has begun but theagreement has a term of 25 years. These power sale agreements are made in USD and the power price is linked to the world marketprice of aluminium.In order to reduce the aluminium price risk, Orkuveita Reykjavíkur has entered into derivative agreements to reduce fluctuations inrevenues linked to aluminium prices. The risk management department of Orkuveita Reykjavíkur is authorised to hedge the aluminiumprice risk for up to 5 years. At the accounting date the hedging amounted to 50% of the estimated sales linked to the price of aluminiumfor the next 12 months.Power sale agreements linked to aluminium prices entail embedded derivatives, as their revenues are subject to future changes in theworld market price of aluminium. In accordance with the provisions of international financial reporting standards on financialinstruments the fair value of embedded derivatives concerning Grundartangi, and partially concerning Helguvík, has been evaluated andrecognised in the financial statements.Embedded derivatives in power sale agreements that are recognised in the financial statements are recorded as assets or liabilities in thebalance sheet at fair value on the accounting date and the changes to the fair value over the year are recognised in the incomestatement as income and expenses on financial assets and financial liabilities.
Among the embedded derivatives of power contracts is a contract with Norðurál Helguvík ehf. (“NH”) in the amount of minus ISK 2.4billion. Construction work relating to an aluminium smelter at Helguvík has been significantly delayed and there is some uncertaintyregarding the future of the project. The plan was to deliver power to the aluminium smelter on 1 September 2011 and NH’s paymentobligation started on that date. NH has used provisions of the contract to divert the power to the aluminium smelter at Grundartangi.
Reykjavíkurborg Financial Statements 201624 All amounts in ISK thousand
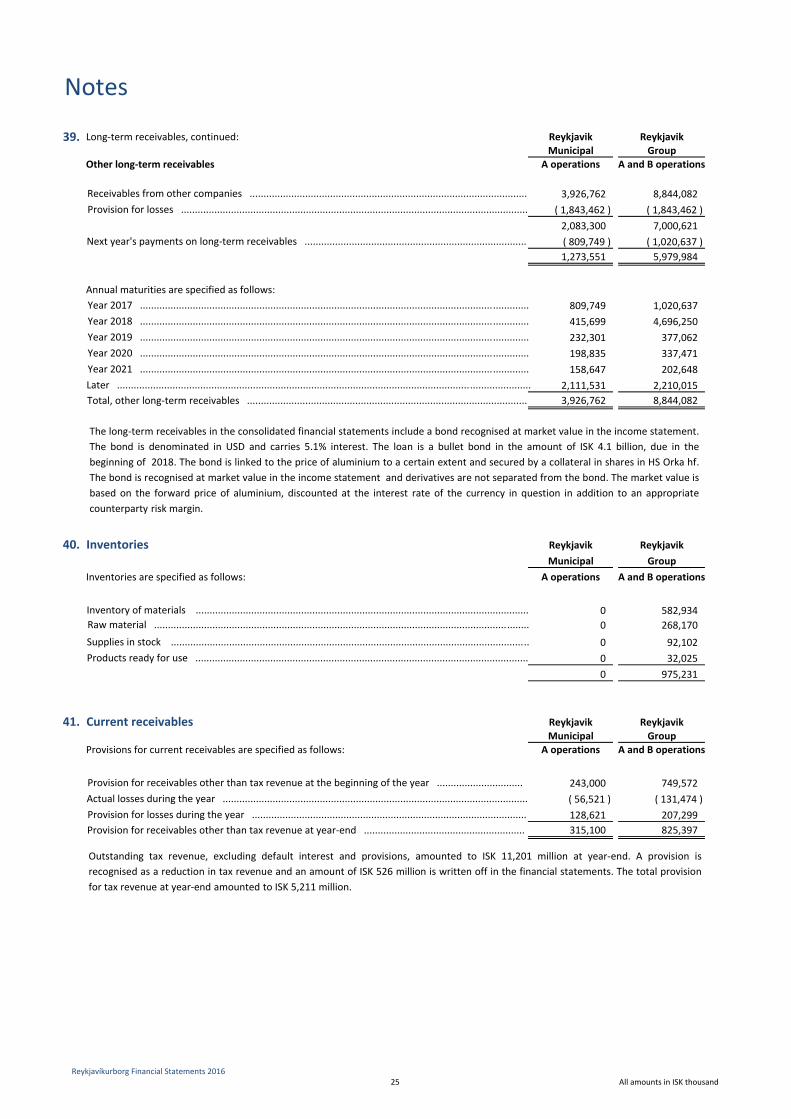
39. Long‐term receivables, continued: Reykjavik ReykjavikMunicipal Group
Other long‐term receivables A operations A and B operations
3,926,762 8,844,082 ( 1,843,462 ) ( 1,843,462 )2,083,300 7,000,621 ( 809,749 ) ( 1,020,637 )1,273,551 5,979,984
Annual maturities are specified as follows:809,749 1,020,637 415,699 4,696,250 232,301 377,062 198,835 337,471 158,647 202,648
2,111,531 2,210,015 3,926,762 8,844,082
40. Inventories Reykjavik ReykjavikMunicipal Group
Inventories are specified as follows: A operations A and B operations
0 582,934 0 268,170
0 92,102 0 32,025 0 975,231
41. Current receivables Reykjavik ReykjavikMunicipal Group
Provisions for current receivables are specified as follows: A operations A and B operations
243,000 749,572 ( 56,521 ) ( 131,474 )128,621 207,299 315,100 825,397
Provision for losses .............................................................................................................................
Inventory of materials ........................................................................................................................Raw material .......................................................................................................................................
Total, other long‐term receivables .....................................................................................................
Year 2017 ............................................................................................................................................
Supplies in stock .................................................................................................................................
Provision for losses during the year ...................................................................................................
Provision for receivables other than tax revenue at the beginning of the year ...............................
Receivables from other companies ....................................................................................................
Year 2018 ............................................................................................................................................
Year 2020 ............................................................................................................................................
Notes
Next year's payments on long‐term receivables ................................................................................
Products ready for use ........................................................................................................................
Provision for receivables other than tax revenue at year‐end ..........................................................
Year 2021 ............................................................................................................................................
Actual losses during the year ..............................................................................................................
Year 2019 ............................................................................................................................................
Later .....................................................................................................................................................
Outstanding tax revenue, excluding default interest and provisions, amounted to ISK 11,201 million at year‐end. A provision isrecognised as a reduction in tax revenue and an amount of ISK 526 million is written off in the financial statements. The total provisionfor tax revenue at year‐end amounted to ISK 5,211 million.
The long‐term receivables in the consolidated financial statements include a bond recognised at market value in the income statement.The bond is denominated in USD and carries 5.1% interest. The loan is a bullet bond in the amount of ISK 4.1 billion, due in thebeginning of 2018. The bond is linked to the price of aluminium to a certain extent and secured by a collateral in shares in HS Orka hf.The bond is recognised at market value in the income statement and derivatives are not separated from the bond. The market value isbased on the forward price of aluminium, discounted at the interest rate of the currency in question in addition to an appropriatecounterparty risk margin.
Reykjavíkurborg Financial Statements 201625 All amounts in ISK thousand
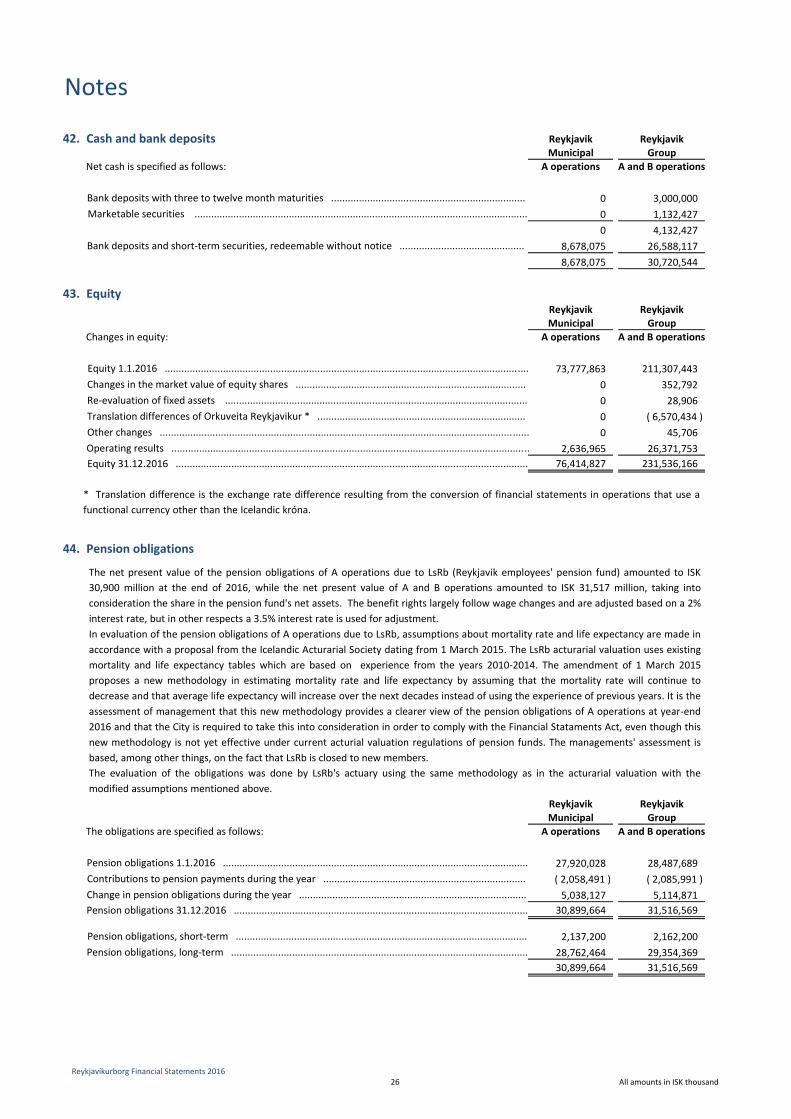
42. Cash and bank deposits Reykjavik ReykjavikMunicipal Group
Net cash is specified as follows: A operations A and B operations
0 3,000,000 0 1,132,427 0 4,132,427
8,678,075 26,588,117 8,678,075 30,720,544
43. EquityReykjavik ReykjavikMunicipal Group
Changes in equity: A operations A and B operations
73,777,863 211,307,443 0 352,792 0 28,906 0 ( 6,570,434 )0 45,706
2,636,965 26,371,753 76,414,827 231,536,166
44. Pension obligations
Reykjavik ReykjavikMunicipal Group
The obligations are specified as follows: A operations A and B operations
27,920,028 28,487,689 ( 2,058,491 ) ( 2,085,991 )5,038,127 5,114,871
30,899,664 31,516,569
2,137,200 2,162,200 28,762,464 29,354,369 30,899,664 31,516,569
Change in pension obligations during the year ..................................................................................Contributions to pension payments during the year .........................................................................
Equity 1.1.2016 ...................................................................................................................................Changes in the market value of equity shares ...................................................................................
Bank deposits with three to twelve month maturities ......................................................................
Bank deposits and short‐term securities, redeemable without notice .............................................
Pension obligations, long‐term ...........................................................................................................
Re‐evaluation of fixed assets .............................................................................................................
Marketable securities ........................................................................................................................
Operating results .................................................................................................................................Other changes .....................................................................................................................................
Pension obligations, short‐term .........................................................................................................
Pension obligations 31.12.2016 ..........................................................................................................
Translation differences of Orkuveita Reykjavikur * ...........................................................................
Notes
Pension obligations 1.1.2016 ..............................................................................................................
Equity 31.12.2016 ...............................................................................................................................
The net present value of the pension obligations of A operations due to LsRb (Reykjavik employees' pension fund) amounted to ISK30,900 million at the end of 2016, while the net present value of A and B operations amounted to ISK 31,517 million, taking intoconsideration the share in the pension fund's net assets. The benefit rights largely follow wage changes and are adjusted based on a 2%interest rate, but in other respects a 3.5% interest rate is used for adjustment.In evaluation of the pension obligations of A operations due to LsRb, assumptions about mortality rate and life expectancy are made inaccordance with a proposal from the Icelandic Acturarial Society dating from 1 March 2015. The LsRb acturarial valuation uses existingmortality and life expectancy tables which are based on experience from the years 2010‐2014. The amendment of 1 March 2015proposes a new methodology in estimating mortality rate and life expectancy by assuming that the mortality rate will continue todecrease and that average life expectancy will increase over the next decades instead of using the experience of previous years. It is theassessment of management that this new methodology provides a clearer view of the pension obligations of A operations at year‐end2016 and that the City is required to take this into consideration in order to comply with the Financial Stataments Act, even though thisnew methodology is not yet effective under current acturial valuation regulations of pension funds. The managements' assessment isbased, among other things, on the fact that LsRb is closed to new members.The evaluation of the obligations was done by LsRb's actuary using the same methodology as in the acturarial valuation with themodified assumptions mentioned above.
* Translation difference is the exchange rate difference resulting from the conversion of financial statements in operations that use afunctional currency other than the Icelandic króna.
Reykjavíkurborg Financial Statements 201626 All amounts in ISK thousand
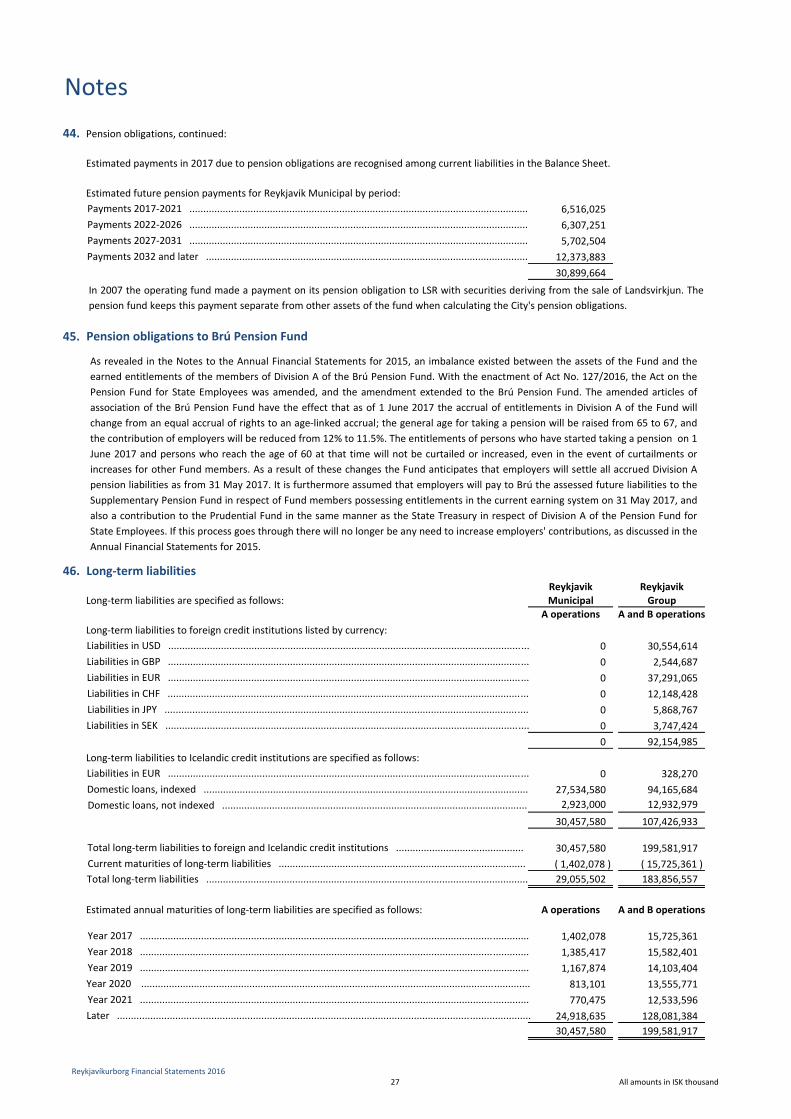
44. Pension obligations, continued:
Estimated payments in 2017 due to pension obligations are recognised among current liabilities in the Balance Sheet.
Estimated future pension payments for Reykjavik Municipal by period:6,516,025 6,307,251 5,702,504
12,373,883 30,899,664
45. Pension obligations to Brú Pension Fund
46. Long‐term liabilities Reykjavik Reykjavik
Long‐term liabilities are specified as follows: Municipal GroupA operations A and B operations
Long‐term liabilities to foreign credit institutions listed by currency:0 30,554,614 0 2,544,687 0 37,291,065 0 12,148,428 0 5,868,767 0 3,747,424 0 92,154,985
Long‐term liabilities to Icelandic credit institutions are specified as follows:0 328,270
27,534,580 94,165,684 2,923,000 12,932,979
30,457,580 107,426,933
30,457,580 199,581,917 ( 1,402,078 ) ( 15,725,361 )29,055,502 183,856,557
Estimated annual maturities of long‐term liabilities are specified as follows: A operations A and B operations
1,402,078 15,725,361 1,385,417 15,582,401 1,167,874 14,103,404 813,101 13,555,771 770,475 12,533,596
24,918,635 128,081,384 30,457,580 199,581,917
Total long‐term liabilities to foreign and Icelandic credit institutions ..............................................
Liabilities in EUR ..................................................................................................................................
Liabilities in JPY ...................................................................................................................................Liabilities in SEK ...................................................................................................................................
Total long‐term liabilities ....................................................................................................................
Payments 2017‐2021 ..........................................................................................................................Payments 2022‐2026 ..........................................................................................................................
Payments 2032 and later ....................................................................................................................Payments 2027‐2031 ..........................................................................................................................
Year 2019 ............................................................................................................................................Year 2020 ............................................................................................................................................Year 2021 ............................................................................................................................................
Liabilities in EUR ..................................................................................................................................
Liabilities in USD ..................................................................................................................................
Liabilities in CHF ..................................................................................................................................
Liabilities in GBP ..................................................................................................................................
Domestic loans, indexed .....................................................................................................................
Year 2017 ............................................................................................................................................Year 2018 ............................................................................................................................................
Current maturities of long‐term liabilities .........................................................................................
Later .....................................................................................................................................................
Notes
Domestic loans, not indexed ..............................................................................................................
As revealed in the Notes to the Annual Financial Statements for 2015, an imbalance existed between the assets of the Fund and theearned entitlements of the members of Division A of the Brú Pension Fund. With the enactment of Act No. 127/2016, the Act on thePension Fund for State Employees was amended, and the amendment extended to the Brú Pension Fund. The amended articles ofassociation of the Brú Pension Fund have the effect that as of 1 June 2017 the accrual of entitlements in Division A of the Fund willchange from an equal accrual of rights to an age‐linked accrual; the general age for taking a pension will be raised from 65 to 67, andthe contribution of employers will be reduced from 12% to 11.5%. The entitlements of persons who have started taking a pension on 1June 2017 and persons who reach the age of 60 at that time will not be curtailed or increased, even in the event of curtailments orincreases for other Fund members. As a result of these changes the Fund anticipates that employers will settle all accrued Division Apension liabilities as from 31 May 2017. It is furthermore assumed that employers will pay to Brú the assessed future liabilities to theSupplementary Pension Fund in respect of Fund members possessing entitlements in the current earning system on 31 May 2017, andalso a contribution to the Prudential Fund in the same manner as the State Treasury in respect of Division A of the Pension Fund forState Employees. If this process goes through there will no longer be any need to increase employers' contributions, as discussed in theAnnual Financial Statements for 2015.
In 2007 the operating fund made a payment on its pension obligation to LSR with securities deriving from the sale of Landsvirkjun. Thepension fund keeps this payment separate from other assets of the fund when calculating the City's pension obligations.
Reykjavíkurborg Financial Statements 201627 All amounts in ISK thousand
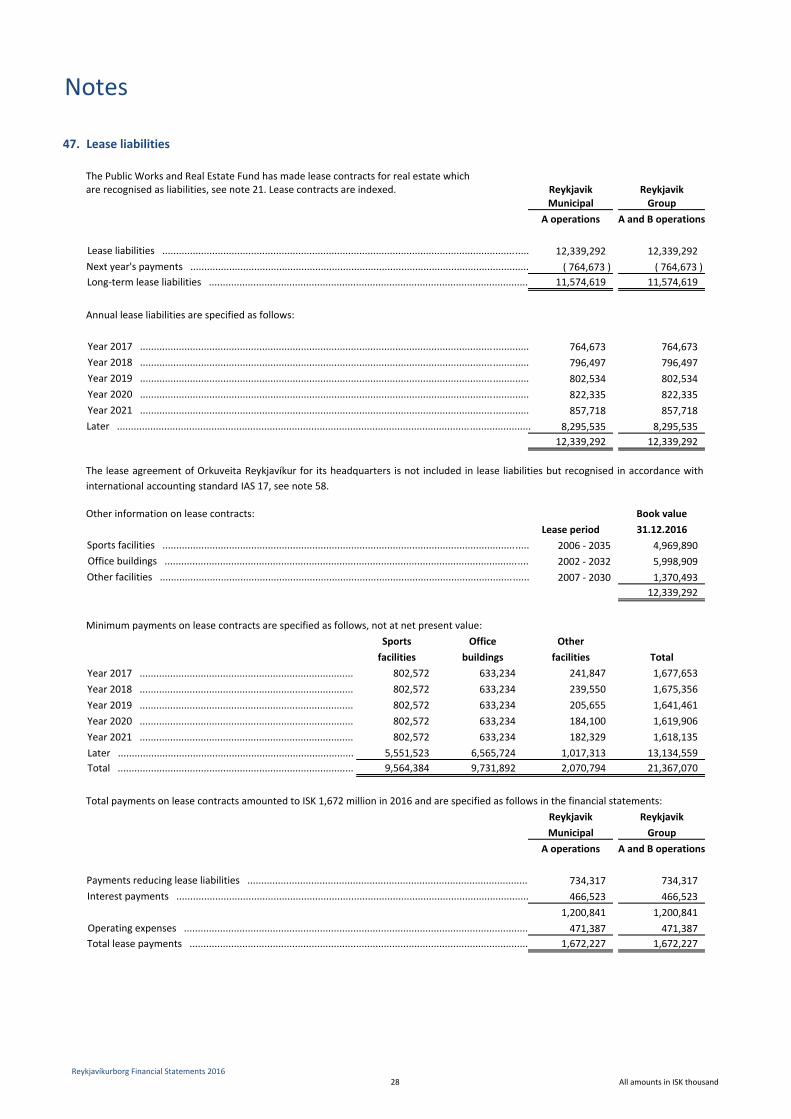
47. Lease liabilities
are recognised as liabilities, see note 21. Lease contracts are indexed. Reykjavik ReykjavikMunicipal Group
A operations A and B operations
12,339,292 12,339,292 ( 764,673 ) ( 764,673 )
11,574,619 11,574,619
Annual lease liabilities are specified as follows:
764,673 764,673 796,497 796,497 802,534 802,534 822,335 822,335 857,718 857,718
8,295,535 8,295,535 12,339,292 12,339,292
Other information on lease contracts: Book valueLease period 31.12.2016
2006 ‐ 2035 4,969,890 2002 ‐ 2032 5,998,909 2007 ‐ 2030 1,370,493
12,339,292
Minimum payments on lease contracts are specified as follows, not at net present value:Sports Office Otherfacilities buildings facilities Total
Year 2017 ............................................................................. 802,572 633,234 241,847 1,677,653 Year 2018 ............................................................................. 802,572 633,234 239,550 1,675,356 Year 2019 ............................................................................. 802,572 633,234 205,655 1,641,461 Year 2020 ............................................................................. 802,572 633,234 184,100 1,619,906 Year 2021 ............................................................................. 802,572 633,234 182,329 1,618,135 Later ..................................................................................... 5,551,523 6,565,724 1,017,313 13,134,559 Total ..................................................................................... 9,564,384 9,731,892 2,070,794 21,367,070
Total payments on lease contracts amounted to ISK 1,672 million in 2016 and are specified as follows in the financial statements:Reykjavik ReykjavikMunicipal Group
A operations A and B operations
734,317 734,317 466,523 466,523
1,200,841 1,200,841 471,387 471,387
1,672,227 1,672,227
The Public Works and Real Estate Fund has made lease contracts for real estate which
Year 2019 ............................................................................................................................................
Year 2017 ............................................................................................................................................
Long‐term lease liabilities ...................................................................................................................
Interest payments ...............................................................................................................................
Operating expenses ............................................................................................................................
Year 2021 ............................................................................................................................................Later .....................................................................................................................................................
Office buildings ...................................................................................................................................Sports facilities ....................................................................................................................................
Year 2020 ............................................................................................................................................
Year 2018 ............................................................................................................................................
Other facilities .....................................................................................................................................
Next year's payments ..........................................................................................................................Lease liabilities ....................................................................................................................................
Payments reducing lease liabilities .....................................................................................................
Total lease payments ..........................................................................................................................
Notes
The lease agreement of Orkuveita Reykjavíkur for its headquarters is not included in lease liabilities but recognised in accordance withinternational accounting standard IAS 17, see note 58.
Reykjavíkurborg Financial Statements 201628 All amounts in ISK thousand
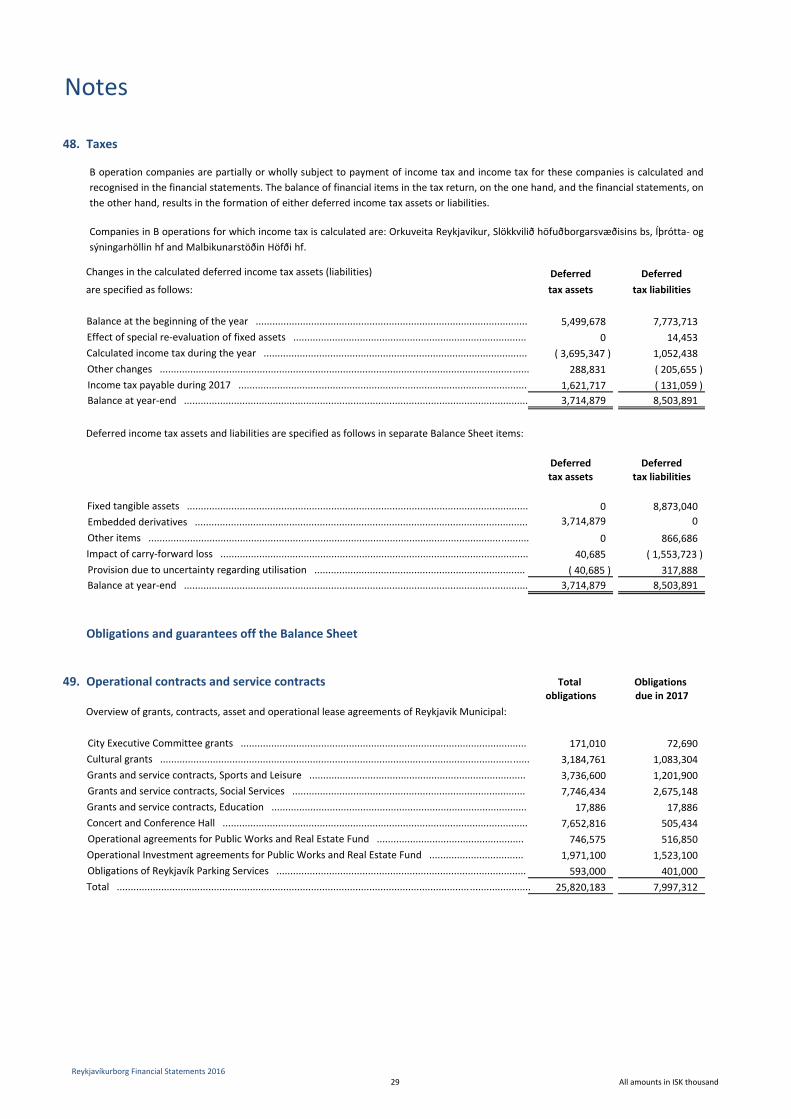
48. Taxes
Deferred Deferredare specified as follows: tax assets tax liabilities
5,499,678 7,773,713 0 14,453
( 3,695,347 ) 1,052,438 288,831 ( 205,655 )
1,621,717 ( 131,059 )3,714,879 8,503,891
Deferred income tax assets and liabilities are specified as follows in separate Balance Sheet items:
Deferred Deferredtax assets tax liabilities
0 8,873,040 3,714,879 0
0 866,686 40,685 ( 1,553,723 )
( 40,685 ) 317,888 3,714,879 8,503,891
Obligations and guarantees off the Balance Sheet
49. Operational contracts and service contracts Total Obligations obligations due in 2017
Overview of grants, contracts, asset and operational lease agreements of Reykjavik Municipal:
171,010 72,690 3,184,761 1,083,304 3,736,600 1,201,900 7,746,434 2,675,148
17,886 17,886 7,652,816 505,434 746,575 516,850
1,971,100 1,523,100 593,000 401,000
25,820,183 7,997,312
Balance at the beginning of the year ..................................................................................................
Balance at year‐end ............................................................................................................................
Calculated income tax during the year ...............................................................................................
Changes in the calculated deferred income tax assets (liabilities)
Other items .........................................................................................................................................
Operational agreements for Public Works and Real Estate Fund .....................................................
Obligations of Reykjavík Parking Services ..........................................................................................Operational Investment agreements for Public Works and Real Estate Fund ..................................
Concert and Conference Hall ..............................................................................................................
Effect of special re‐evaluation of fixed assets ....................................................................................
Provision due to uncertainty regarding utilisation ............................................................................
Fixed tangible assets ...........................................................................................................................
Other changes .....................................................................................................................................
Balance at year‐end ............................................................................................................................
Impact of carry‐forward loss ...............................................................................................................
Notes
Cultural grants .....................................................................................................................................Grants and service contracts, Sports and Leisure ..............................................................................Grants and service contracts, Social Services ....................................................................................Grants and service contracts, Education ............................................................................................
Income tax payable during 2017 ........................................................................................................
Embedded derivatives ........................................................................................................................
City Executive Committee grants .......................................................................................................
Total .....................................................................................................................................................
B operation companies are partially or wholly subject to payment of income tax and income tax for these companies is calculated andrecognised in the financial statements. The balance of financial items in the tax return, on the one hand, and the financial statements, onthe other hand, results in the formation of either deferred income tax assets or liabilities.
Companies in B operations for which income tax is calculated are: Orkuveita Reykjavikur, Slökkvilið höfuðborgarsvæðisins bs, Íþrótta‐ ogsýningarhöllin hf and Malbikunarstöðin Höfði hf.
Reykjavíkurborg Financial Statements 201629 All amounts in ISK thousand
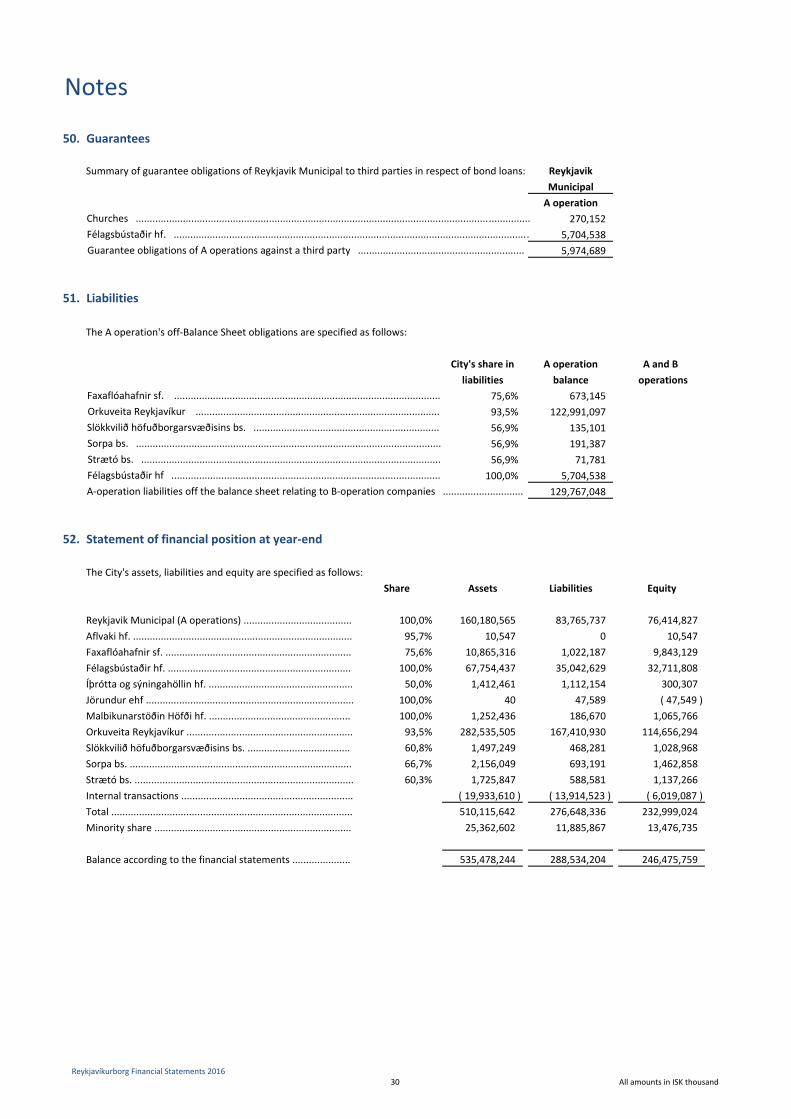
50. Guarantees
Summary of guarantee obligations of Reykjavik Municipal to third parties in respect of bond loans: ReykjavikMunicipalA operation
270,152 5,704,538 5,974,689
51. Liabilities
The A operation's off‐Balance Sheet obligations are specified as follows:
City's share in A operation A and B liabilities balance operations
75,6% 673,145 93,5% 122,991,097 56,9% 135,101 56,9% 191,387 56,9% 71,781
100,0% 5,704,538 129,767,048
52. Statement of financial position at year‐end
The City's assets, liabilities and equity are specified as follows:Share Assets Liabilities Equity
Reykjavik Municipal (A operations) ....................................... 100,0% 160,180,565 83,765,737 76,414,827 Aflvaki hf. ............................................................................... 95,7% 10,547 0 10,547 Faxaflóahafnir sf. ................................................................... 75,6% 10,865,316 1,022,187 9,843,129 Félagsbústaðir hf. .................................................................. 100,0% 67,754,437 35,042,629 32,711,808 Íþrótta og sýningahöllin hf. .................................................... 50,0% 1,412,461 1,112,154 300,307 Jörundur ehf ........................................................................... 100,0% 40 47,589 ( 47,549 )Malbikunarstöðin Höfði hf. ................................................... 100,0% 1,252,436 186,670 1,065,766 Orkuveita Reykjavíkur ............................................................ 93,5% 282,535,505 167,410,930 114,656,294 Slökkvilið höfuðborgarsvæðisins bs. ..................................... 60,8% 1,497,249 468,281 1,028,968 Sorpa bs. ................................................................................ 66,7% 2,156,049 693,191 1,462,858 Strætó bs. ............................................................................... 60,3% 1,725,847 588,581 1,137,266 Internal transactions .............................................................. ( 19,933,610 ) ( 13,914,523 ) ( 6,019,087 )Total ....................................................................................... 510,115,642 276,648,336 232,999,024 Minority share ....................................................................... 25,362,602 11,885,867 13,476,735
Balance according to the financial statements ..................... 535,478,244 288,534,204 246,475,759
Slökkvilið höfuðborgarsvæðisins bs. ...................................................................
Guarantee obligations of A operations against a third party ............................................................
Churches ..............................................................................................................................................Félagsbústaðir hf. ................................................................................................................................
A‐operation liabilities off the balance sheet relating to B‐operation companies .............................
Strætó bs. ............................................................................................................Sorpa bs. ..............................................................................................................
Orkuveita Reykjavíkur ........................................................................................Faxaflóahafnir sf. ................................................................................................
Félagsbústaðir hf .................................................................................................
Notes
Reykjavíkurborg Financial Statements 201630 All amounts in ISK thousand
Other
53. Electricity sales contracts with Norðurál Helguvík
54. Property valuation of Harpa
55. Value‐added tax encumbrance.
56. Real estate sold to Félagsbústaðir hf.
Notes
Orkuveita Reykjavíkur will perform the first part of the power purchase agreement with Norðurál Helguvík ehf. (NH) notwithstanding adisagreement since 2009 on whether Orkuveita Reykjavíkur is required to deliver more energy than already delivered. NH has not takenany legal action, but reserves the right to require Orkuveita Reykjavíkur to supply additional energy and/or pay compensation for allegeddamage suffered as a result of failure to deliver energy. Orkuveita Reykjavíkur has categorically rejected such claims against thecompany. The potential amounts or consequences of a potential court case are unknown, but the company's managemet is of theopinion that the risk of any such proceedings has now receded. An arbitration court has reached a conclusion in proceedings between HSOrka and NH, which concerns a similar situation. The conclusion of the arbitration court, according to reports from the parties, is that noobligation remains on HS Orka´s part. Also, NH's compensation claims have been rejected. Orkuveita Reykjavíkur's management believesthere is no reason to enter a liability in the financial statements with respect to this situation.
Last 28 October the Icelandic National Register revised its real estate assessment of the Harpa Reykjavik Concert Hall and ConferenceCentre at Austurbakki 2 in Reykjavik; the new assessment is based, among other things, on a judgment rendered by the Supreme Courtof Iceland on 25 February 2016, where the ruling of the State Appeals Committee on Property Valuation of May 2012 was overturned. Areassessment of the real estate tax on the property for the years 2011 ‐ 2016 has now been completed with a resulting reduction in thetax by ISK 737 million; the real estate tax entry for the year 2016 has been reduced by a corresponding amount. Harpa ohf. has appealedthe National Register's reassessment of 28 October to the Appeals Committee on Property Valuation.
Reykjavík Parking Services own a share in Harpa's parking garage. The parking garage is recorded in a special provision pursuant to Art.6(4) of Act no. 50/1998 on value‐added tax. The total value‐added tax encumbrance at year‐end 2016 amounts to approximately ISK 211million.
In December 2016 the City of Reykjavik concluded an agreement with Félagsbústaðir hf. for the purchase of 88 residential units in 16properties for the amount of ISK 1,703 million. Delivery and payments will take place in 2017.
Reykjavíkurborg Financial Statements 201631 All amounts in ISK thousand
57. Litigation
Notes
Other payables of A and B operations include matured derivative contracts of Orkuveita Reykajvikur. The contracts have not beensettled and are the subject of litigation. The process of their settlement is subject to significant uncertainty. In earlier accountingperiods a total of ISK 740 million have been credited in Orkuveita Reykjavikur's accounts in respect of these contracts. These entries donot imply any admission of the debt on the part of Orkuveita Reykjavíkur, and the amount may increase or decrease on final settlementof the contracts.
Strætó bs. (Metropolitan Bus Transportation Company) was sued by two parties that were not awarded a contract following a tenderprocedure for transportation in the capital area in 2010. In the first suit the plaintiff called for an admission of liability on the part ofStrætó for alleged unlawful and criminal conduct in the tender procedure. Judgment was rendered last 31 March. The judgment of theDistrict Court upheld the entitlement of the plaintiff to damages from the respondent for lost profit and cost of participation in the pre‐selection process. The case has been appealed to the Supreme Court, where hearings are anticipated next 23 May. It is the assessmentof Strætó's management that there is no reason to enter a liability in the financial statements relating to this lawsuit. In the secondcase the plaintiff claimed damages in the amount of ISK 530 million for damage in the form of lost profit and cost of participation in thetender process. Judgment was rendered last 16 June. The District Court held that the conditions for liability for damages were met inthe case and assessed the financial damage of the plaintiff for lost profit at ISK 100 million. The judgment has been appealed to theSupreme Court, where hearings are anticipated next 23 May. A liability in the amount of ISK 152 million for potential damages anddefault interest has been entered under other payables in the balance sheet.
Several holders of framework contracts for driving services for the disabled and handicapped school children reported Strætó bs. to thePublic Procurement Complaints Commission in November 2015. The applicants called on the Commission to express an opinionregarding Strætó's liability for damages for violations of the terms of a framework agreement on the performance of the drivingservices. Last 21 June the Public Procurement Complaints Commission concluded that Strætó bs. had violated its obligations under theframework contract in its ranking of framework contract holders in the performance of the driving services and purchases of drivingservices from parties external to the framework contract. The Commission returned the opinion that Strætó bs. was liable for damagesto the applicants, but no position was taken regarding the extent of the potential financial loss of the applicants. The conclusion of theCommission is being reviewed, but the position taken by Strætó bs. is that the applicants suffered no financial loss.
The Public Procurement Complaints Commission received a complaint from BL ehf. dated 16 February 2017 with respect to a decisionmade by Strætó bs. regarding the acceptance of a bid following Mini‐competition III, grounded in the specifications of a negotiatedprocedure and Terms No. 13002 on the renewal of buses. The Decision of the Commission dated 9 March 2017 concluded that thedeadline for complaints had passed when the complaint was received. Accordingly, it is likely that the final ruling of the Commission willbe to dismiss the case.
On 20 April 2016 the District Court of Reykjavík rendered its judgment in a lawsuit of the Metropolitan Area Fire Department againstÍslandsbanki in relation to three loan agreements. The Court rejected the Fire Department's claims. The Supreme Court overturned theDistrict Court's judgment on 6 April 2017 and approved the main claim in the case amounting to ISK 260 million.
The Competition Authority published a Decision on 21 December 2012 with the conclusion that Sorpa bs. had abused its dominantposition in the market for the operation of refuse collection centres, on the one hand, and landfills or final disposals of waste, on theother hand. Sorpa appealed the decision to the Competition Appeals Committee, which confirmed the decision of the CompetitionAuthority by a ruling issued on 18 March 2013. Sorpa did not accept the conclusion of the Appeals Committee and initiated legalproceedings for the invalidation of the ruling. The claims made by Sorpa were denied by a judgment of the District Court of Reykjavik.Sorpa appealed to the Supreme Court. A judgment of the Supreme Court issued on 2 February 2017 upheld the District Court's decision.Sorpa has not entered the resulting liability in its accounts.
Reykjavíkurborg Financial Statements 201632 All amounts in ISK thousand
58. Operating lease
Orkuveita Reykjavíkur as lessee
Operating lease payments and income for the year 2016 2015
257,040 257,040 10,106 6,084
( 41,172 ) ( 48,048 )225,974 215,076
Rent for non‐terminable operating lease agreement257,040 257,040
1,028,160 1,028,160 3,146,615 3,370,505 4,431,815 4,655,705
137,986 197,442
Orkuveita Reykjavikur as lessor
Expected future revenues from non‐terminable operating lease agreements44,848 48,437 93,137 140,535
0 8,470 137,985 197,442
59. Related parties
Forward lease entered as income.........................................................................................................Conditional lease ...................................................................................................................................Rent entered as expenses......................................................................................................................
Notes
After 5 years...........................................................................................................................................
Within the year......................................................................................................................................
Expected future revenues from sub‐leasing.........................................................................................
After 5 years...........................................................................................................................................In 1 to 5 years.........................................................................................................................................Within the year......................................................................................................................................
In 1 to 5 years.........................................................................................................................................
Arrangement of the operating lease agreement of Orkuveita Reykjavíkur.Orkuveita Reykjavikur concluded a 20‐year lease agreement with Foss Fasteignafélag ehf. for the Group's headquarters at Bæjarháls 1and Réttarháls at the end of 2013. The agreement includes an option to buy that Orkuveita Reykjavíkur can exercise after 10 years and20 years. The rent for the first 10 years is ISK 223.9 million per year, indexed. If the option to buy is not exercised after 10 years, theminimum rent for the next 10 years will be ISK 290.2 million per year, indexed. The rent does not include any operating expenses andthe amounts presented in the following tables have not been calculated at present value.In the financial statements of the City of Reykjavík the operating lease agreement between Orkuveita Reykjavikur and FossFasteignafélag ehf. is treated in accordance with international accounting standard IAS 17.
Impact on the financial statements if opinion 1/2010 were to be applied to the lease agreementThe non‐terminable lease debt under the lease agreement calculated to present value was on 31 December 2016 approximately ISK 1,408million, and the value of the leased property was ISK 1,255 million. Interest expense and indexation during the year would haveamounted to approximately ISK 91 million and depreciation of the leased property would have amounted to ISK 184 million.
The City Council and the highest‐ranking directors of the municipality are defined as parties related to the municipality. The spouses ofthese parties, financially dependent children and other financially dependent parties also fall within this definition, as well as companiesowned or controlled by these parties. The municipality has engaged in business with related parties during the year. Business withrelated parties included, among other things, general services provided by the municipality and public charges levied on related parties.The transactions are carried out on the same basis as in the case of unrelated parties and the terms and conditions of the transactionsare similar as in the case of unrelated parties. The determination of business between related parties is subject to the competence rulesof Art. 20 of the Local Government Act.
Orkuveita Reykjavikur has entered into an agreement for the sub‐lease of a part of leased real estate for a period of five years with anoption to extend to ten years.
Reykjavíkurborg Financial Statements 201633 All amounts in ISK thousand
60.Comparison of operating budgets
2016 2016 2016 Orginal 2016 2016 2016 OrginalOrginal Annexes to Budget with Orginal Annexes to Budget withBudget Budget annexes Budget Budget annexes
Operating revenueTax revenues...................................................................... 74,551,386 1,300,000 75,851,386 73,982,659 1,300,000 75,282,659 Contributions to Municipal Equalisation Fund................. 6,048,200 90,000 6,138,200 6,048,200 90,000 6,138,200 Other revenues.................................................................. 17,695,705 624,978 18,320,683 72,745,597 624,978 73,370,574
98,295,292 2,014,978 100,310,269 152,776,456 2,014,978 154,791,433
Operationg expensesWage cost and wage‐related expenses............................. 57,333,983 75,713 57,409,696 69,764,195 75,713 69,839,908 Other operating expenses................................................. 34,925,867 1,822,730 36,748,597 48,362,444 1,822,730 50,185,174 Depreciation....................................................................... 4,335,403 (13,647) 4,321,756 15,747,117 (13,647) 15,733,470
96,595,254 1,884,796 98,480,049 133,873,757 1,884,796 135,758,551
Operating result before financial items............................ 1,700,038 130,182 1,830,220 18,902,699 130,182 19,032,882
Financial income and (financial expenses)........................ (1,355,635) 0 (1,355,635) (9,003,003) 0 (9,003,003)
Operating result before tax .............................................. 344,403 130,182 474,585 9,899,696 130,182 10,029,879
Income tax.......................................................................... 0 0 0 (2,142,631) 0 (2,142,631)Changes in valuation of investment properties................ 0 0 0 3,786,000 0 3,786,000
Operating result............................................................ 344,403 130,182 474,585 11,543,065 130,182 11,673,248
Notes
Reykjavik Municipal A operation Reykjavik Group A and B operations
The overview below explains the operating budget for 2016 pursuant to the originally approved budget of the municipality, approved annexes andoriginal budget with annexes. The budget with annexes is shown in the Income Statement and other notes to the financial statements forcomparison with the year’s actual figures.
* In the approved budget changes to the valuation of investment properties were recognised with financial income and financial expenses.
Reykjavíkurborg Financial Statements 201634 All amounts in ISK thousand
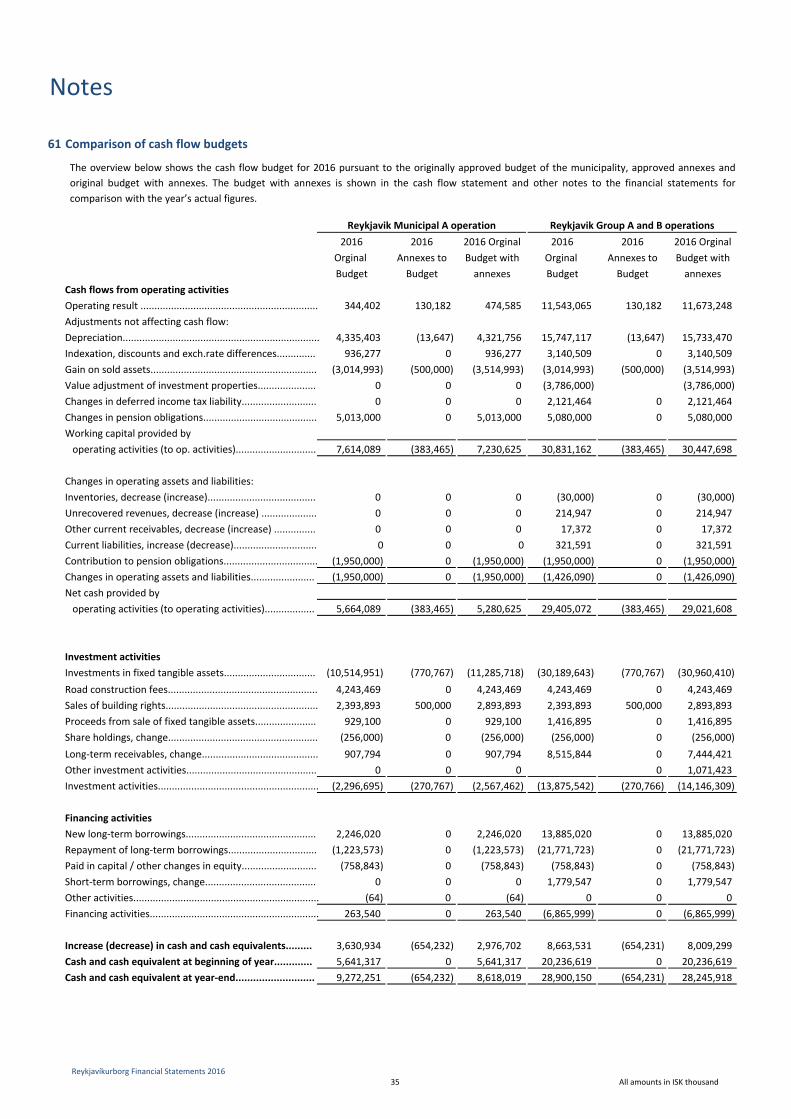
61.Comparison of cash flow budgets
2016 2016 2016 Orginal 2016 2016 2016 OrginalOrginal Annexes to Budget with Orginal Annexes to Budget withBudget Budget annexes Budget Budget annexes
Cash flows from operating activitiesOperating result ................................................................ 344,402 130,182 474,585 11,543,065 130,182 11,673,248 Adjustments not affecting cash flow:Depreciation....................................................................... 4,335,403 (13,647) 4,321,756 15,747,117 (13,647) 15,733,470 Indexation, discounts and exch.rate differences.............. 936,277 0 936,277 3,140,509 0 3,140,509 Gain on sold assets............................................................ (3,014,993) (500,000) (3,514,993) (3,014,993) (500,000) (3,514,993)Value adjustment of investment properties..................... 0 0 0 (3,786,000) (3,786,000)Changes in deferred income tax liability........................... 0 0 0 2,121,464 0 2,121,464 Changes in pension obligations......................................... 5,013,000 0 5,013,000 5,080,000 0 5,080,000 Working capital provided by operating activities (to op. activities)............................. 7,614,089 (383,465) 7,230,625 30,831,162 (383,465) 30,447,698
Changes in operating assets and liabilities:Inventories, decrease (increase)....................................... 0 0 0 (30,000) 0 (30,000)Unrecovered revenues, decrease (increase) .................... 0 0 0 214,947 0 214,947 Other current receivables, decrease (increase) ............... 0 0 0 17,372 0 17,372 Current liabilities, increase (decrease).............................. 0 0 0 321,591 0 321,591 Contribution to pension obligations.................................. (1,950,000) 0 (1,950,000) (1,950,000) 0 (1,950,000)Changes in operating assets and liabilities....................... (1,950,000) 0 (1,950,000) (1,426,090) 0 (1,426,090)Net cash provided by operating activities (to operating activities).................. 5,664,089 (383,465) 5,280,625 29,405,072 (383,465) 29,021,608
Investment activitiesInvestments in fixed tangible assets................................. (10,514,951) (770,767) (11,285,718) (30,189,643) (770,767) (30,960,410)Road construction fees...................................................... 4,243,469 0 4,243,469 4,243,469 0 4,243,469 Sales of building rights....................................................... 2,393,893 500,000 2,893,893 2,393,893 500,000 2,893,893 Proceeds from sale of fixed tangible assets...................... 929,100 0 929,100 1,416,895 0 1,416,895 Share holdings, change...................................................... (256,000) 0 (256,000) (256,000) 0 (256,000)Long‐term receivables, change.......................................... 907,794 0 907,794 8,515,844 0 7,444,421 Other investment activities............................................... 0 0 0 0 1,071,423 Investment activities.......................................................... (2,296,695) (270,767) (2,567,462) (13,875,542) (270,766) (14,146,309)
Financing activitiesNew long‐term borrowings............................................... 2,246,020 0 2,246,020 13,885,020 0 13,885,020 Repayment of long‐term borrowings................................ (1,223,573) 0 (1,223,573) (21,771,723) 0 (21,771,723)Paid in capital / other changes in equity........................... (758,843) 0 (758,843) (758,843) 0 (758,843)Short‐term borrowings, change........................................ 0 0 0 1,779,547 0 1,779,547 Other activities................................................................... (64) 0 (64) 0 0 0 Financing activities............................................................. 263,540 0 263,540 (6,865,999) 0 (6,865,999)
Increase (decrease) in cash and cash equivalents......... 3,630,934 (654,232) 2,976,702 8,663,531 (654,231) 8,009,299 Cash and cash equivalent at beginning of year............. 5,641,317 0 5,641,317 20,236,619 0 20,236,619 Cash and cash equivalent at year‐end........................... 9,272,251 (654,232) 8,618,019 28,900,150 (654,231) 28,245,918
Reykjavik Municipal A operation Reykjavik Group A and B operations
Notes
The overview below shows the cash flow budget for 2016 pursuant to the originally approved budget of the municipality, approved annexes andoriginal budget with annexes. The budget with annexes is shown in the cash flow statement and other notes to the financial statements forcomparison with the year’s actual figures.
Reykjavíkurborg Financial Statements 201635 All amounts in ISK thousand
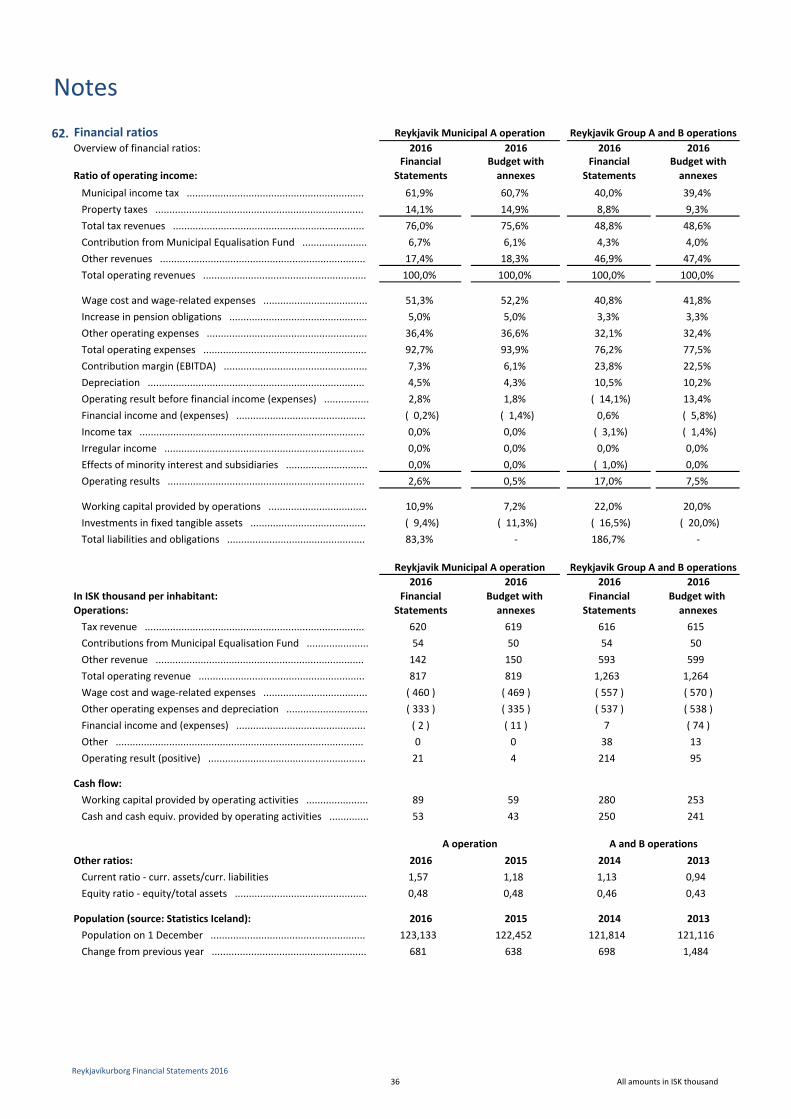
62. Financial ratiosOverview of financial ratios: 2016 2016 2016 2016
Financial Budget with Financial Budget withRatio of operating income: Statements annexes Statements annexesMunicipal income tax ............................................................... 61,9% 60,7% 40,0% 39,4% Property taxes .......................................................................... 14,1% 14,9% 8,8% 9,3% Total tax revenues .................................................................... 76,0% 75,6% 48,8% 48,6% Contribution from Municipal Equalisation Fund ....................... 6,7% 6,1% 4,3% 4,0% Other revenues ......................................................................... 17,4% 18,3% 46,9% 47,4% Total operating revenues .......................................................... 100,0% 100,0% 100,0% 100,0%
Wage cost and wage‐related expenses ..................................... 51,3% 52,2% 40,8% 41,8% Increase in pension obligations ................................................. 5,0% 5,0% 3,3% 3,3% Other operating expenses ......................................................... 36,4% 36,6% 32,1% 32,4% Total operating expenses .......................................................... 92,7% 93,9% 76,2% 77,5% Contribution margin (EBITDA) ................................................... 7,3% 6,1% 23,8% 22,5% Depreciation ............................................................................. 4,5% 4,3% 10,5% 10,2% Operating result before financial income (expenses) ................ 2,8% 1,8% ( 14,1%) 13,4% Financial income and (expenses) .............................................. ( 0,2%) ( 1,4%) 0,6% ( 5,8%)Income tax ................................................................................ 0,0% 0,0% ( 3,1%) ( 1,4%)Irregular income ....................................................................... 0,0% 0,0% 0,0% 0,0% Effects of minority interest and subsidiaries ............................. 0,0% 0,0% ( 1,0%) 0,0% Operating results ...................................................................... 2,6% 0,5% 17,0% 7,5%
Working capital provided by operations ................................... 10,9% 7,2% 22,0% 20,0% Investments in fixed tangible assets ......................................... ( 9,4%) ( 11,3%) ( 16,5%) ( 20,0%)Total liabilities and obligations ................................................. 83,3% ‐ 186,7% ‐
2016 2016 2016 2016In ISK thousand per inhabitant: Financial Budget with Financial Budget with Operations: Statements annexes Statements annexesTax revenue .............................................................................. 620 619 616 615 Contributions from Municipal Equalisation Fund ...................... 54 50 54 50 Other revenue .......................................................................... 142 150 593 599 Total operating revenue ........................................................... 817 819 1,263 1,264 Wage cost and wage‐related expenses ..................................... ( 460 ) ( 469 ) ( 557 ) ( 570 )Other operating expenses and depreciation ............................. ( 333 ) ( 335 ) ( 537 ) ( 538 )Financial income and (expenses) .............................................. ( 2 ) ( 11 ) 7 ( 74 )Other ........................................................................................ 0 0 38 13 Operating result (positive) ........................................................ 21 4 214 95
Cash flow:Working capital provided by operating activities ...................... 89 59 280 253 Cash and cash equiv. provided by operating activities .............. 53 43 250 241
Other ratios: 2016 2015 2014 2013Current ratio ‐ curr. assets/curr. liabilities 1,57 1,18 1,13 0,94 Equity ratio ‐ equity/total assets ............................................... 0,48 0,48 0,46 0,43
Population (source: Statistics Iceland): 2016 2015 2014 2013Population on 1 December ....................................................... 123,133 122,452 121,814 121,116 Change from previous year ....................................................... 681 638 698 1,484
A operation A and B operations
Notes
Reykjavik Municipal A operation Reykjavik Group A and B operations
Reykjavik Municipal A operation Reykjavik Group A and B operations
Reykjavíkurborg Financial Statements 201636 All amounts in ISK thousand
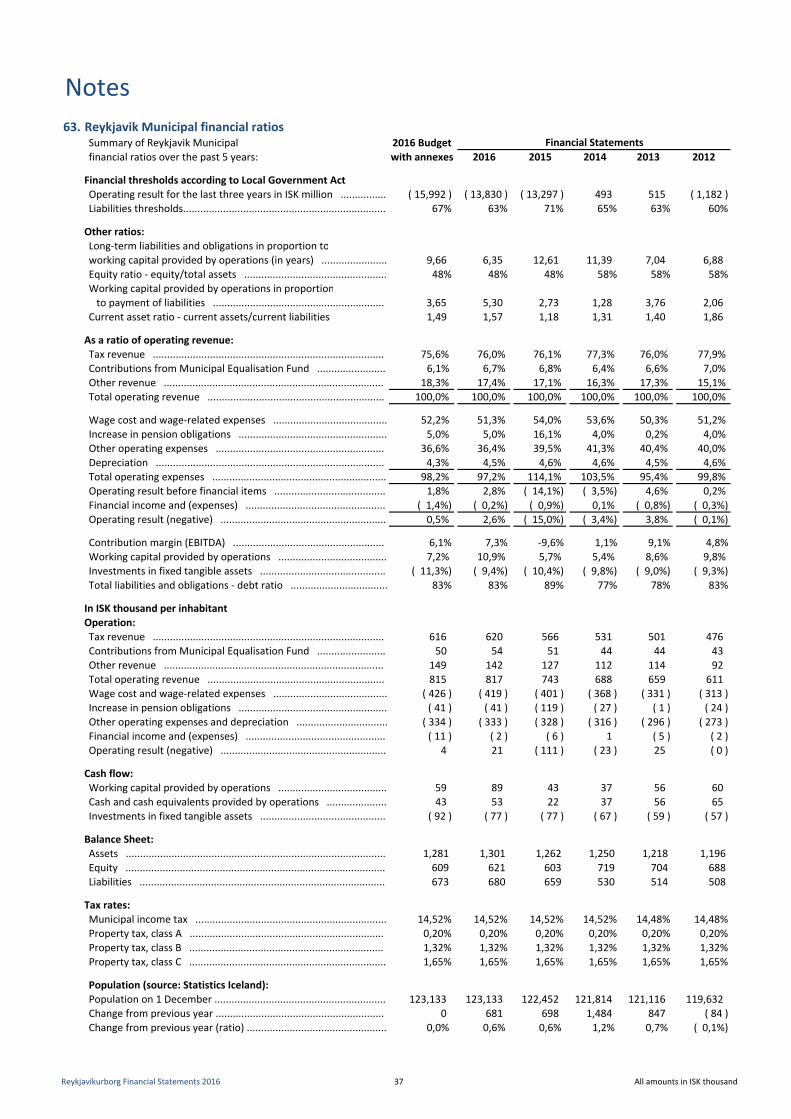
Notes63. Reykjavik Municipal financial ratios
Summary of Reykjavik Municipal 2016 Budgetfinancial ratios over the past 5 years: with annexes 2016 2015 2014 2013 2012
Financial thresholds according to Local Government ActOperating result for the last three years in ISK million ................ ( 15,992 ) ( 13,830 ) ( 13,297 ) 493 515 ( 1,182 )Liabilities thresholds....................................................................... 67% 63% 71% 65% 63% 60%
Other ratios:Long‐term liabilities and obligations in proportion toworking capital provided by operations (in years) ....................... 9,66 6,35 12,61 11,39 7,04 6,88 Equity ratio ‐ equity/total assets .................................................. 48% 48% 48% 58% 58% 58%Working capital provided by operations in proportion to payment of liabilities ............................................................ 3,65 5,30 2,73 1,28 3,76 2,06 Current asset ratio ‐ current assets/current liabilities 1,49 1,57 1,18 1,31 1,40 1,86
As a ratio of operating revenue:Tax revenue ................................................................................. 75,6% 76,0% 76,1% 77,3% 76,0% 77,9% Contributions from Municipal Equalisation Fund ........................ 6,1% 6,7% 6,8% 6,4% 6,6% 7,0% Other revenue ............................................................................. 18,3% 17,4% 17,1% 16,3% 17,3% 15,1% Total operating revenue .............................................................. 100,0% 100,0% 100,0% 100,0% 100,0% 100,0%
Wage cost and wage‐related expenses ........................................ 52,2% 51,3% 54,0% 53,6% 50,3% 51,2% Increase in pension obligations .................................................... 5,0% 5,0% 16,1% 4,0% 0,2% 4,0% Other operating expenses ........................................................... 36,6% 36,4% 39,5% 41,3% 40,4% 40,0% Depreciation ................................................................................ 4,3% 4,5% 4,6% 4,6% 4,5% 4,6% Total operating expenses ............................................................. 98,2% 97,2% 114,1% 103,5% 95,4% 99,8% Operating result before financial items ....................................... 1,8% 2,8% ( 14,1%) ( 3,5%) 4,6% 0,2% Financial income and (expenses) ................................................. ( 1,4%) ( 0,2%) ( 0,9%) 0,1% ( 0,8%) ( 0,3%)Operating result (negative) .......................................................... 0,5% 2,6% ( 15,0%) ( 3,4%) 3,8% ( 0,1%)
Contribution margin (EBITDA) ..................................................... 6,1% 7,3% ‐9,6% 1,1% 9,1% 4,8%Working capital provided by operations ...................................... 7,2% 10,9% 5,7% 5,4% 8,6% 9,8% Investments in fixed tangible assets ............................................ ( 11,3%) ( 9,4%) ( 10,4%) ( 9,8%) ( 9,0%) ( 9,3%)Total liabilities and obligations ‐ debt ratio .................................. 83% 83% 89% 77% 78% 83%
In ISK thousand per inhabitantOperation:Tax revenue ................................................................................. 616 620 566 531 501 476 Contributions from Municipal Equalisation Fund ........................ 50 54 51 44 44 43 Other revenue ............................................................................. 149 142 127 112 114 92 Total operating revenue .............................................................. 815 817 743 688 659 611 Wage cost and wage‐related expenses ........................................ ( 426 ) ( 419 ) ( 401 ) ( 368 ) ( 331 ) ( 313 )Increase in pension obligations .................................................... ( 41 ) ( 41 ) ( 119 ) ( 27 ) ( 1 ) ( 24 )Other operating expenses and depreciation ................................ ( 334 ) ( 333 ) ( 328 ) ( 316 ) ( 296 ) ( 273 )Financial income and (expenses) ................................................. ( 11 ) ( 2 ) ( 6 ) 1 ( 5 ) ( 2 )Operating result (negative) .......................................................... 4 21 ( 111 ) ( 23 ) 25 ( 0 )
Cash flow:Working capital provided by operations ...................................... 59 89 43 37 56 60 Cash and cash equivalents provided by operations ..................... 43 53 22 37 56 65 Investments in fixed tangible assets ............................................ ( 92 ) ( 77 ) ( 77 ) ( 67 ) ( 59 ) ( 57 )
Balance Sheet:Assets ........................................................................................... 1,281 1,301 1,262 1,250 1,218 1,196 Equity ........................................................................................... 609 621 603 719 704 688 Liabilities ...................................................................................... 673 680 659 530 514 508
Tax rates:Municipal income tax ................................................................... 14,52% 14,52% 14,52% 14,52% 14,48% 14,48%Property tax, class A .................................................................... 0,20% 0,20% 0,20% 0,20% 0,20% 0,20%Property tax, class B .................................................................... 1,32% 1,32% 1,32% 1,32% 1,32% 1,32%Property tax, class C ..................................................................... 1,65% 1,65% 1,65% 1,65% 1,65% 1,65%
Population (source: Statistics Iceland):Population on 1 December ............................................................ 123,133 123,133 122,452 121,814 121,116 119,632 Change from previous year ........................................................... 0 681 698 1,484 847 ( 84 )Change from previous year (ratio) ................................................. 0,0% 0,6% 0,6% 1,2% 0,7% ( 0,1%)
Financial Statements
Reykjavíkurborg Financial Statements 2016 37 All amounts in ISK thousand
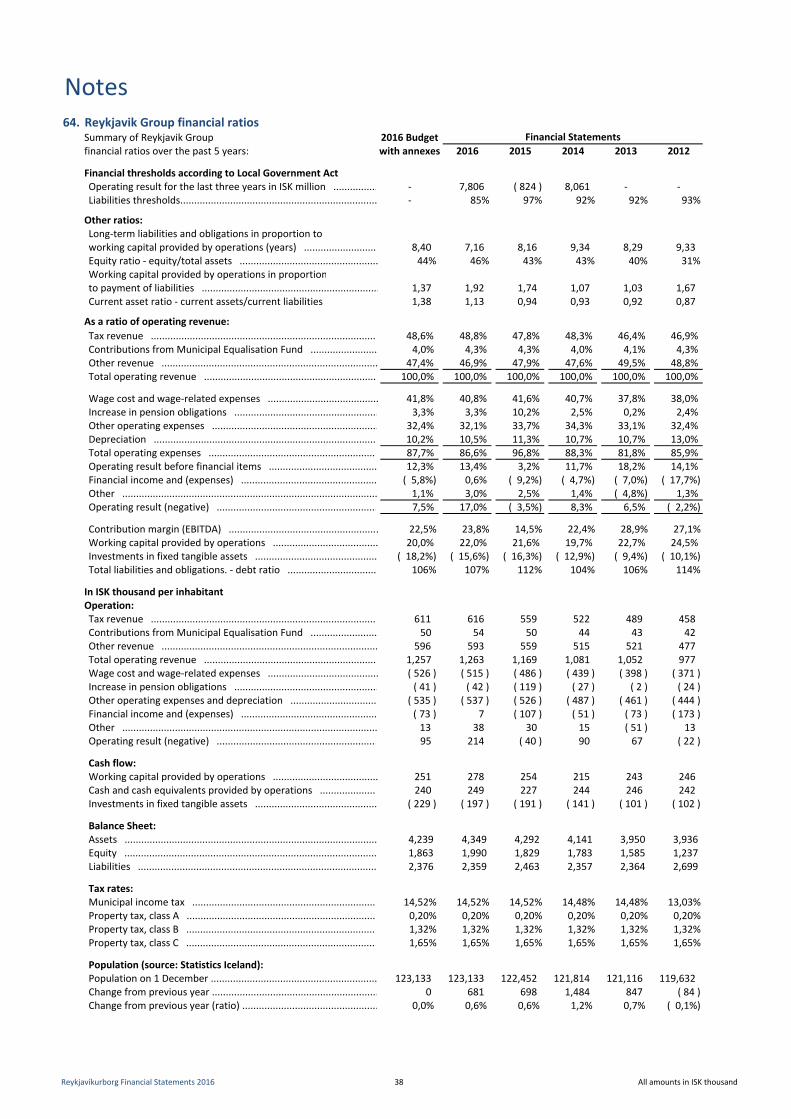
64. Reykjavik Group financial ratiosSummary of Reykjavik Group 2016 Budgetfinancial ratios over the past 5 years: with annexes 2016 2015 2014 2013 2012
Financial thresholds according to Local Government ActOperating result for the last three years in ISK million ................ ‐ 7,806 ( 824 ) 8,061 ‐ ‐Liabilities thresholds....................................................................... ‐ 85% 97% 92% 92% 93%
Other ratios:Long‐term liabilities and obligations in proportion toworking capital provided by operations (years) .......................... 8,40 7,16 8,16 9,34 8,29 9,33 Equity ratio ‐ equity/total assets .................................................. 44% 46% 43% 43% 40% 31%Working capital provided by operations in proportionto payment of liabilities ................................................................ 1,37 1,92 1,74 1,07 1,03 1,67 Current asset ratio ‐ current assets/current liabilities 1,38 1,13 0,94 0,93 0,92 0,87
As a ratio of operating revenue:Tax revenue ................................................................................. 48,6% 48,8% 47,8% 48,3% 46,4% 46,9% Contributions from Municipal Equalisation Fund ......................... 4,0% 4,3% 4,3% 4,0% 4,1% 4,3% Other revenue .............................................................................. 47,4% 46,9% 47,9% 47,6% 49,5% 48,8% Total operating revenue ............................................................... 100,0% 100,0% 100,0% 100,0% 100,0% 100,0%
Wage cost and wage‐related expenses ........................................ 41,8% 40,8% 41,6% 40,7% 37,8% 38,0% Increase in pension obligations .................................................... 3,3% 3,3% 10,2% 2,5% 0,2% 2,4% Other operating expenses ............................................................ 32,4% 32,1% 33,7% 34,3% 33,1% 32,4% Depreciation ................................................................................ 10,2% 10,5% 11,3% 10,7% 10,7% 13,0% Total operating expenses ............................................................. 87,7% 86,6% 96,8% 88,3% 81,8% 85,9% Operating result before financial items ....................................... 12,3% 13,4% 3,2% 11,7% 18,2% 14,1% Financial income and (expenses) ................................................. ( 5,8%) 0,6% ( 9,2%) ( 4,7%) ( 7,0%) ( 17,7%)Other ............................................................................................ 1,1% 3,0% 2,5% 1,4% ( 4,8%) 1,3% Operating result (negative) .......................................................... 7,5% 17,0% ( 3,5%) 8,3% 6,5% ( 2,2%)
Contribution margin (EBITDA) ...................................................... 22,5% 23,8% 14,5% 22,4% 28,9% 27,1%Working capital provided by operations ...................................... 20,0% 22,0% 21,6% 19,7% 22,7% 24,5% Investments in fixed tangible assets ............................................ ( 18,2%) ( 15,6%) ( 16,3%) ( 12,9%) ( 9,4%) ( 10,1%)Total liabilities and obligations. ‐ debt ratio ................................ 106% 107% 112% 104% 106% 114%
In ISK thousand per inhabitantOperation:Tax revenue ................................................................................. 611 616 559 522 489 458 Contributions from Municipal Equalisation Fund ......................... 50 54 50 44 43 42 Other revenue .............................................................................. 596 593 559 515 521 477 Total operating revenue ............................................................... 1,257 1,263 1,169 1,081 1,052 977 Wage cost and wage‐related expenses ........................................ ( 526 ) ( 515 ) ( 486 ) ( 439 ) ( 398 ) ( 371 )Increase in pension obligations .................................................... ( 41 ) ( 42 ) ( 119 ) ( 27 ) ( 2 ) ( 24 )Other operating expenses and depreciation ............................... ( 535 ) ( 537 ) ( 526 ) ( 487 ) ( 461 ) ( 444 )Financial income and (expenses) ................................................. ( 73 ) 7 ( 107 ) ( 51 ) ( 73 ) ( 173 )Other ............................................................................................ 13 38 30 15 ( 51 ) 13 Operating result (negative) .......................................................... 95 214 ( 40 ) 90 67 ( 22 )
Cash flow:Working capital provided by operations ...................................... 251 278 254 215 243 246 Cash and cash equivalents provided by operations ..................... 240 249 227 244 246 242 Investments in fixed tangible assets ............................................ ( 229 ) ( 197 ) ( 191 ) ( 141 ) ( 101 ) ( 102 )
Balance Sheet:Assets ........................................................................................... 4,239 4,349 4,292 4,141 3,950 3,936 Equity ........................................................................................... 1,863 1,990 1,829 1,783 1,585 1,237 Liabilities ...................................................................................... 2,376 2,359 2,463 2,357 2,364 2,699
Tax rates:Municipal income tax ................................................................... 14,52% 14,52% 14,52% 14,48% 14,48% 13,03%Property tax, class A ..................................................................... 0,20% 0,20% 0,20% 0,20% 0,20% 0,20%Property tax, class B ..................................................................... 1,32% 1,32% 1,32% 1,32% 1,32% 1,32%Property tax, class C ..................................................................... 1,65% 1,65% 1,65% 1,65% 1,65% 1,65%
Population (source: Statistics Iceland):Population on 1 December ............................................................. 123,133 123,133 122,452 121,814 121,116 119,632 Change from previous year ............................................................ 0 681 698 1,484 847 ( 84 )Change from previous year (ratio) ................................................. 0,0% 0,6% 0,6% 1,2% 0,7% ( 0,1%)
Financial Statements
Notes
Reykjavíkurborg Financial Statements 2016 38 All amounts in ISK thousand
Statement on governance and non‐financial information
The number of members of the City Council and committees and boards working under the auspices of the Municipality is specified in a Decisionon the government of the Municipality, which can be accessed on its website. Information can also be accessed on the website regarding themembership of individual committees, councils and boards.
Point 2 of Article 44 of the Local Government Act lays down a rule on the gender ratio of committees appointed by the City Council. TheMunicipality observes these rules in appointing committees. As regards the City Council, its composition is determined by ranking of candidateson ballots and the results of local elections. Six members of the City Council are men and five are women. The members of the current Councilhave various backgrounds and education.
Codes of conduct and good government practices are provided for in Article 29 of the Local Government Act. The Municipality has adopted aCode of Conduct, dated 10 January 2017, which is accessible on the City's website.
The governance of municipalities is subject to the Local Government Act No. 138/2011, as amended, and Decision No. 715 of 8 July 2013 on thegovernment of the Municipality. The City of Reykjavík has listed bonds in a stock exchange and is therefore subject to the Rules for issuers offinancial instruments published by the Iceland Stock Exchange. The City Council is elected in a general election by the residents of theMunicipality every four years.
The City Council is responsible for the functioning of an effective internal control, which is formal, documented and regularly verified. Internalcontrol has the purpose of providing assurance that the Municipality achieves results and efficiency it its work in accordance with the targets setby the Municipality, that reliable and proper financial information is provided to external parties and that compliance is observed with the lawsand regulations that apply to its activities.
As regards risk management, reference is made to Chapter VII of the Local Government Act, e.g. on powers of financial management, the bindingnature of decisions on the financial budget for the year, responsible use of funds, large investments and financial obligations and restrictionsregarding mortgages and issuances of guarantees. The Municipality observes the provisions or the Local Government Act in these respects.
According to the Local Government Act No. 138/2011, municipalities are independent public entities governed by democratically electedmunicipal governments representing the residents of the municipality. The Municipality carries out the tasks assigned to it by law, inter aliaregarding education and youth, social services, sport and leisure, culture, sanitation matters and environmental affairs. Furthermore, theMunicipality observes the requirements relating to its activities under other acts of law, including the Administrative Procedure Act, the Act onthe equal rights and equal position of men and women and the Act on public procurement. Also in force is a Code of Conduct dated 10 January2017, which was adopted on the basis of Article 29 of the Local Government Act and can be accessed on the City's website.
No significant deviations have been identified by public regulatory bodies or auditors regarding the activities of the Municipality relating toenvironmental affairs, social and employment affairs, human rights affairs or corruption or bribery.
Internal audit is charged with oversight of the finances and governance of the City of Reykjavík under the auspices of the Executive Committee. Inits work, Internal Audit assesses and improves the effectiveness of the risk management, control strategies and governance of agencies andcompanies in which the City of Reykjavik has a majority holding. Working procedures for Internal audit, which have been approved by theExecutive Committee, are accessible on the City's website.
The City of Reykjavík's Audit Committee works under the auspices of the City Council in accordance with Chapter IX of the Financial StatementsAct No. 3/2006 and in accordance with the statutes of the government of the City of Reykjavík and the standing orders of the City Council No.715/2013 and in accordance with law. The City Council has approved working procedures for the Audit Committee which are accessible on theCity's website along with information on committee members.
Statement on governance
Non‐financial information
A regular part of the Municipality's activities is to monitor main components in the Municipality's operations and thus ensure continuum in theoperations and minimise risk. Risk management is integrated with responsibility for daily operations of the City. In order to ensure that theMunicipality's accounts are in accordance with the Local Government Act and relevant accounting standards, the Municipality has emphasisedwell defined areas of responsibilities, acceptable segregation of duties and regular reporting. Monthly reporting processes and analysis forindividual segments are an important factor in monitoring the results and adherance to the approved budget. Monthly reports are prepared anddelivered to the Executive Committee.
Reykjavíkurborg Financial Statements 2016 39