Embed Size (px)
Citation preview
Further Development of Tieto Software
Product Quality Analysis System
Teemu Moisio
Master’s thesis December 2012 Degree Programme in Information Technology
TIIVISTELMÄ
Tampereen ammattikorkeakoulu Degree Programme in Information Technology TEEMU MOISIO: Tiedon ohjelmistotuotteen laadun analysointijärjestelmän jatkokehitys Opinnäytetyö 61 sivua, joista liitteitä 2 sivua Joulukuu 2012 Ohjelmistojen laatu on käsitteenä ja kokemuksena hyvin monimuotoinen ja yleensä täy-sin riippuvainen käyttäjäryhmästä, joka havainnoi laatua erilaisista näkökulmista. Ylei-nen tapa tarkastella ohjelmistotuotteiden laatua on mitata ohjelmistotuotteiden ominai-suuksia, kuten käytettävyyttä, luotettavuutta, tehokkuutta, laajennettavuutta, testatta-vuutta ja ylläpidettävyyttä. Laadun tarkasteluun on myös kehitetty erilaisia prosesseja, joita käyttämällä ja mukailemalla on mahdollista parantaa laatua. Erilaisten ohjelmisto-tuotteiden laadun vertaileminen voi yleensä olla mahdotonta, jos laatua on mitattu käyt-tämällä erilaisia prosesseja tai mittareita. Tiedon ohjelmistotuotteen laadun analysointijärjestelmää voi kuvata konseptiksi, jonka tarkoitus on mahdollistaa täysin erilaisten ohjelmistotuotteiden laadun vertaileminen keskenään. Analysointijärjestelmän perustaksi on valittu ISO/IEC 25000 Software Quality Requirements Evaluation -standardiperhe, jonka on tarkoitus korvata aikaisem-mat ISO/IEC 9126 Information Technology – Software Product Quality ja ISO/IEC 14598 Information Technology – Software Product Evaluation -standardit. Tiedon ohjelmistotuotteen laadun analysointijärjestelmän konseptin kehittäminen on aloitettu jo vuonna 2009 Mika Immosen kirjoittamassa ylemmän ammattikorkeakoulun opinnäytetyössä. Immosen opinnäytetyötä voi kuvailla Tiedon ohjelmistotuotteen laa-dun analysointijärjestelmän arkkitehtuurin kuvaukseksi. Aikaisemman ja tämän opin-näytetyön välisenä aikana Tiedon ohjelmistotuotteen laadun analysointijärjestelmää ei ole kehitetty eteenpäin siitä, mihin ensimmäinen opinnäytetyö jäi. Tämän opinnäytetyön pääasiallinen tarkoitus on jatkaa edellä mainitussa opinnäytetyös-sä määritellyn arkkitehtuurin pohjalta määrittelemällä yksityiskohtaisemmin ohjelmis-tokomponentit ja ohjelmistokehys, joilla Tiedon ohjelmistotuotteen laadun analysointi-järjestelmä voidaan rakentaa. Tässä työssä esitellään myös opinnäytetyön kirjoittamisen aikana syntynyttä prototyyppitoteutusta, jonka tarkoitus on havainnollistaa määriteltyjen asioiden toimivuutta. Opinnäytetyön alkuosuudessa käsitellään ohjelmistojen jatkuvaan integroimiseen (continuous integration) liittyviä teorioita ja ISO/IEC 25000 -standardia.
Asiasanat: ohjelmistotuotteiden laatu, laadun analysointijärjestelmä
ABSTRACT
Tampereen ammattikorkeakoulu Tampere University of Applied Sciences Degree Programme in Information Technology TEEMU MOISIO: Further Development of Tieto Software Product Quality Analysis System Master’s thesis 61 pages, appendices 2 pages December 2012
The definition of software quality and how one experiences quality is a multifaceted matter and usually totally dependent on the user group that observes the quality from different perspectives. A common way to analyse software product’s quality is to meas-ure software product’s characteristics like usability, reliability, efficiency, expandabil-ity, testability and maintainability. For analysing software product’s quality, many pro-cesses have been developed. Using these processes and acting according to them im-proves the software product’s quality. It is not usually possible to compare different software products if the quality of those products has been measured using different processes and measurements. Tieto Software Product Quality analysis system can be described as a concept which enables the comparison of totally different software products from the quality perspec-tive. The ISO/IEC 25000 Software Quality Requirements Evaluation standard family that replaces the ISO/IEC 9126 Information Technology – Software Product Quality and ISO/IEC 14598 Information Technology – Software Product Evaluation standards was selected as a template for the Tieto Software Product Quality analysis system. Developing the Tieto Software Product Quality analysis system concept began in a Master’s thesis written by Mika Immonen in 2009. Immonen’s Master’s thesis can be described as an architecture description of the Tieto Software Product Quality analysis system. Between the earlier thesis and this thesis the Tieto Software Product Quality Analysis system has not been developed further. The main purpose for this thesis is to continue from the architecture definition that was done in Immonen’s thesis to a phase were the components and the framework for the Tieto Software Product Quality analysis system are designed on a more detailed level. A proof of concept implementation that was implemented as a part of this thesis is also explained, thus clarifying the functionality of the design. The theories related to contin-uous integration and the general parts of ISO/IEC 25000 are explained in the first part of this thesis.
Key words: software product quality, quality analysis system

FOREWORD
I want to thank Tarja Sarvi and Hannu Hytönen from Tieto for providing me the oppor-tunity to write this Master’s thesis. I want to give credit to my colleagues who work in my project team in Tieto. Their pro-fessional and innovative attitude towards work has motivated me while writing this the-sis and splitting time between it and my day job. I also want to thank Pekka Pöyry from Tampere University of Applied Sciences for guiding me through the writing process. Tampere, December 2012 ____________ Teemu Moisio
5
CONTENTS
1 INTRODUCTION ....................................................................................................... 7 2 DESCRIPTION OF MASTER’S THESIS .................................................................. 9
2.1 Background information ...................................................................................... 9 2.2 Purposes and goals ............................................................................................. 10 2.3 Scope of the Master’s thesis .............................................................................. 10
3 CONTINUOUS INTEGRATION ............................................................................. 11 3.1 The fundamentals of continuous integration systems ........................................ 12
3.1.1 Maintain a single source repository ........................................................ 13 3.1.2 Automate the build .................................................................................. 15 3.1.3 Make your build self-testing ................................................................... 16 3.1.4 Everyone commits to the code baseline as often as possible .................. 17 3.1.5 Every code commit to the baseline should build the baseline ................ 17 3.1.6 Keep the build fast .................................................................................. 19 3.1.7 Test in a clone of the production environment........................................ 19 3.1.8 Make it easy for anyone to get the latest executable ............................... 20 3.1.9 Everybody can see what is happening .................................................... 20 3.1.10 Automate deployment ............................................................................. 21
3.2 Continuous integration tools .............................................................................. 22 3.2.1 Build automation tool Apache Ant ......................................................... 22 3.2.2 Apache Subversion version control ........................................................ 23 3.2.3 Software project management tool Apache Maven ................................ 23
3.3 Jenkins continuous integration system .............................................................. 24 3.3.1 How to extend Jenkins ............................................................................ 25 3.3.2 How to create an extension plug-in to Jenkins ....................................... 25
3.4 Tieto SPQ analysis system and continuous integration ..................................... 27 4 SQUARE - ISO/IEC 25000 STANDARD FAMILY ................................................ 29
4.1 Division and overview of separate parts of ISO/IEC 25000 standard ............... 30 4.2 Quality models ................................................................................................... 31
4.2.1 Quality in use quality model ................................................................... 33 4.2.2 System and software product quality model ........................................... 34
4.3 Quality measure elements .................................................................................. 36 4.4 Using the quality models for measurement ....................................................... 37
5 TIETO SOFTWARE PRODUCT QUALITY ANALYSIS SYSTEM ..................... 40 5.1 General architecture ........................................................................................... 41 5.2 Design and overall implementation principles .................................................. 43
5.2.1 Database architecture .............................................................................. 45 5.2.2 Architecture of quality data handler components ................................... 46 5.2.3 Architecture of quality data application interface components............... 50 5.2.4 Architecture of quality data collector components ................................. 51 5.2.5 Architecture of quality data presentation components ............................ 52
5.3 Quality data collected by using the proof of concept implementation .............. 54 6 CONCLUSIONS ....................................................................................................... 59 REFERENCES ................................................................................................................ 61 APPENDICES ................................................................................................................ 62
Appendix 1. Example of Maven configuration file ................................................... 62 Appendix 2. Tieto SPQ analysis system database ..................................................... 63

6
ABBREVIATIONS AND TERMS
CI Continuous integration
IEC International Electrotechnical Commission
ISO International Organization for Standardization
SPQ Software Product Quality
SQuaRE Software Quality Requirements and Evaluation
7
1 INTRODUCTION
In Agile software development or in any other method for software development, auto-
mated building and testing has become a common standard, but usually it is not possible
to compare different software components or products from the quality perspective. The
Tieto Software Product Quality (SPQ) analysis system concept was designed to unify
the way in which different software quality, build and test result analyses could be
measured internally by Tieto or by any other company.
Tieto SPQ analysis system architecture and general principles were studied by Mika
Immonen in his Master’s thesis for Tieto in December 2009. Since the previous study,
the Tieto SPQ analysis system has not been implemented or developed further.
My personal development task for Degree Programme in Information Technology was
to continue the development of the Tieto SPQ analysis system. This Master’s thesis
concentrates on explaining the architecture of the Tieto SPQ analysis system defined by
Mika Immonen in his thesis as well as the relevant theories around it. Another thing this
thesis documents is the overall design of the Tieto SPQ analysis system proof of con-
cept implementation and the key components that were implemented in it.
This thesis consists of five separate chapters. Description of Master’s thesis chapter
explains the history and the background of this thesis. Overall goals and the scope of
this thesis are also defined in this chapter.
The third chapter, Continuous integration, introduces the main principle of continuous
integration (CI) and some of the most commonly used continuous integration tools that
are also used in the proof of concept implementation of the Tieto SPQ analysis system.
This chapter also explains the general outline of the Jenkins continuous integration sys-
tem and its architecture. Jenkins is presented because it was used in the proof of con-
cept. The possibility to extend Jenkins’s functionalities by creating extension plug-ins
was the main reason behind its selection.
SQuaRE – ISO/IEC 25000 standard family chapter contains a theoretical study of the
Software Quality Requirements and Evaluation (SQuaRE) ISO/IEC 25000 standard
8
family and its main concepts which are used in this thesis and in the Tieto SPQ analysis
system. This chapter also explains the quality measures and the quality models of the
Software Quality Requirements and Evaluation ISO/IEC 25000 standard and how those
can be used and extended according to user’s own needs.
The fifth chapter, Tieto Software product quality analysis system, describes the key
concepts and the architecture of the Tieto SPQ analysis system which was defined by
Mika Immonen in his Master’s thesis. The chapter explains also the key architecture
decisions that were used in this thesis and in the proof of concept implementation of the
Tieto SPQ analysis system. It wraps up how the continuous integration system Jenkins
and the Software Quality Requirements and Evaluation ISO/IEC 25000 standard family
are associated with the proof of concept of the Tieto SPQ analysis system. This chapter
can be used as a design document that describes the general principles of the proof of
concept implementation. The proof of concept implementation was used to do software
quality analysis, and the data collected by this analysis is also presented in this chapter.
The last chapter sums up the results and findings of this thesis and defines the next steps
of how the Tieto SPQ analysis system can be developed and expanded further. This
concluding chapter also defines some effort estimates of how much work would be
needed for further development and for finalizing the different components of the Tieto
SPQ analysis system.
9
2 DESCRIPTION OF MASTER’S THESIS
2.1 Background information
Tieto SPQ analysis system definition process started in 2008 when Mika Immonen se-
lected it as his development task for Master’s Degree Programme in Information Tech-
nology. At that time, there was no unified way to measure the quality of software prod-
ucts in Tieto, and that was the reason why the development task was seen as important
(Immonen 2009, 11). In 2009 the first Tieto SPQ analysis system Master’s thesis was
finished, but despite it, the actual Tieto SPQ analysis system remained in the architec-
ture and design definition phase.
In the early 2011, I wanted to apply for the Master’s Degree Programme in Information
Technology. When searching for a suitable development task for Master’s degree pro-
gram I heard about the earlier study done for the Tieto SPQ analysis system. At this
time, I was quite unfamiliar with the subject, but I was interested in it and felt that I
wanted to study it more. As the earlier Tieto SPQ analysis study was left to the architec-
ture and design definition phase, it was seen that it would be beneficial to see the Tieto
SPQ analysis system in action. That was the reason why the further development of the
Tieto SPQ analysis system was still seen as important.
In May 2011 I applied for Master’s Degree Programme in Information Technology and
I selected for my personal development task the further development of Tieto SPQ
analysis system. The courses in the autumn 2011 and in the 2012 spring took most of
my free time. When participating to Master’s degree courses I was able to collect back-
ground information and study the Tieto SPQ analysis system more. In the spring 2012 I
also participated to a SQuaRE Software Product Quality Course held by Finnish Soft-
ware Measurement Association (FiSMA). That course gave me ideas of how the
ISO/IEC 25000 standard family could be used in the Tieto SPQ analysis system. The
actual proof of concept implementation of Tieto SPQ analysis system and writing of this
thesis started in the summer 2012.
10
2.2 Purposes and goals
The main purpose and goal of this thesis is to continue the development of the Tieto
SPQ analysis system concept. Another aim of this thesis is to explain the key concepts
and to document the design of the proof of concept of Tieto SPQ analysis system. This
system collects quality data from different software quality tools and then shows these
results in a unified way to the end-user of Tieto SPQ analysis system. Last goal for this
thesis is to define the next steps how the Tieto SPQ analysis could be developed and
expanded even more.
2.3 Scope of the Master’s thesis
The whole Tieto SPQ analysis system consists of many different components, for ex-
ample quality data presentation and quality data handler component. Tieto SPQ analysis
system concept also provides different services such as the installation and analysing
tools integration service. All the different components and services of Tieto SPQ analy-
sis system are explained briefly in the fifth chapter but this thesis and my further devel-
opment task of Tieto SPQ analysis system mainly concentrates on the key software
components which are quality data handler, quality data collector, database and quality
data application interface components.
11
3 CONTINUOUS INTEGRATION
Continuous integration in software product development is a way of working that fo-
cuses on the code quality, software integration, and software building and testing
throughout the development cycle of a software product. Key project members, such as
end-users, managers, architects, product owners, testers and developers, can get a better
sense of the whole software development process and progress when continuous inte-
gration is used.
Using continuous integration in software product development tries to solve and address
many problems and issues that might come up when components of a software product
are integrated. If continuous integration is not used, and the software product is devel-
oped in long development iterations with the software integrations only happening be-
tween these iterations, it then usually leads to an integration phase that can cause delays,
software errors and certainly unhappy developers. Continuous integration tries to solve
these problems, however it cannot be described as the easiest way to solve all software
integration problems because setting up a fully working continuous integration system
from a scratch can take a quite a lot of effort from the software developers’ and from the
whole software development organization’s side.
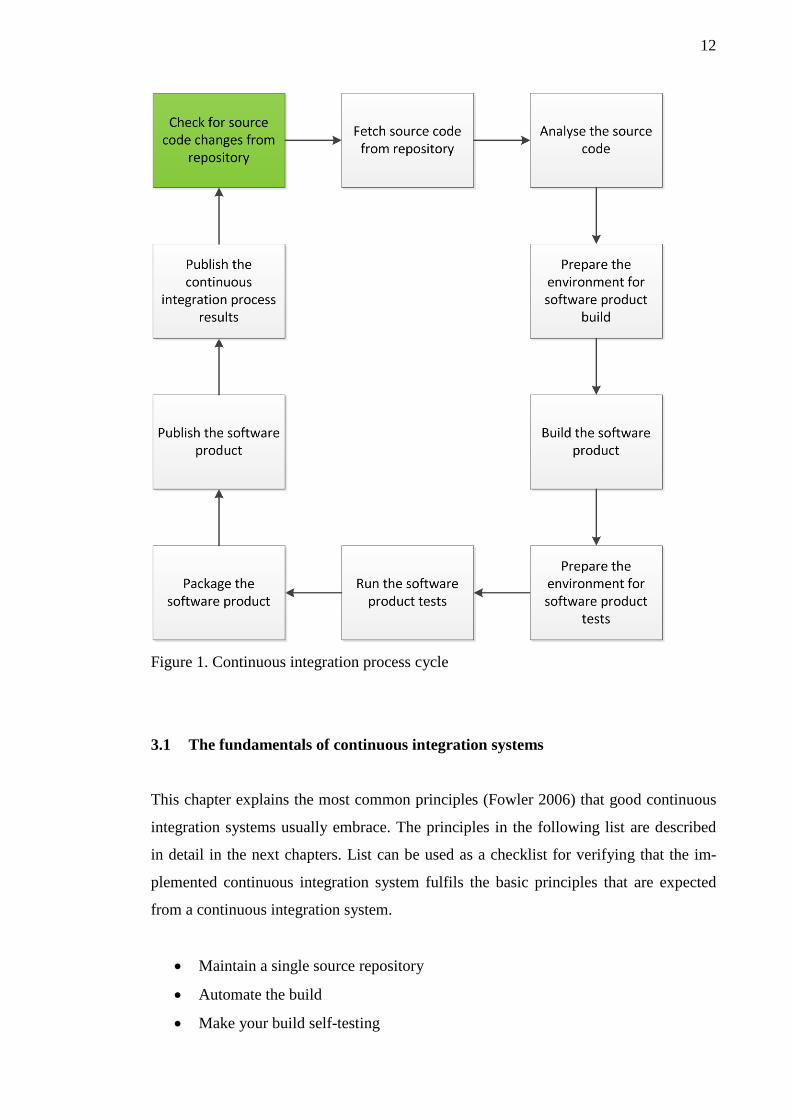
Figure 1 represents one example of a continuous integration process cycle. The source
code changes polling element, marked green in the figure, is usually the task which
starts the continuous integration cycle and to which the cycle returns. Figure 1 also
shows some of the other possible continuous integration process tasks and the possible
flow between those tasks. The continuous integration process can in general consist of
many cycles that are described in figure 1. Cycles can also trigger other, similar or dif-
ferent cycles depending on the integration steps that are needed to create a fully working
software product.
12
Figure 1. Continuous integration process cycle
3.1 The fundamentals of continuous integration systems
This chapter explains the most common principles (Fowler 2006) that good continuous
integration systems usually embrace. The principles in the following list are described
in detail in the next chapters. List can be used as a checklist for verifying that the im-
plemented continuous integration system fulfils the basic principles that are expected
from a continuous integration system.
• Maintain a single source repository
• Automate the build
• Make your build self-testing
13
• Everyone commits to the code baseline as often as possible
• Every code commit to the baseline should build the baseline
• Keep the build fast
• Test in a clone of the production environment
• Make it easy for anyone to get the latest executable
• Everybody can see what is happening
• Automate deployment
There are many other principles and some of them might even be more important than
those in the previous list. One reason why these principles have been selected is that
they play a major role in the support functions of the Tieto SPQ analysis system. Also
they are explained so that it would be easier to understand and setup the base setup for
the Tieto SPQ analysis system. If the continuous integration system that is linked to the
Tieto SPQ analysis system fulfils all of these principles, the quality analyses that the
Tieto SPQ analysis system does can be executed in a very efficient manner.
3.1.1 Maintain a single source repository
Almost every small or big software project has a lot of configuration, source code and
other files which have to be kept in order and put together correctly to make a functional
software product. Also, software projects can be developed by many developers or
teams that are spread around the globe. (Fowler 2006) If the project files are not main-
tained in a single source repository in described conditions, it then usually leads to a
development situation that is an uncontrolled chaos.
A version control or configuration management system as a source repository is needed
because when the software product is developed, it must be possible to track the differ-
ent changes, so that it is possible for example to identify the developer who made the
changes, or it is possible to roll back the made changes to earlier point. The version con-
trol and configuration management system also takes care of those situations when de-
velopers create, edit or delete same software project’s files or a single file at the same
time. Multiple changes to a same file are handled in the version control or configuration
management system by noticing both modifications and giving the possibility to merge
14
these modifications when the code is committed to the repository. In configuration
management systems, it is also possible to store both changes to the repository and then
decide in the build phase which of the changed file objects is used. Also, it is possible to
merge both changes to new repository file objects that can be then used in the building
of a software product.
The continuous integration systems usually use version control or a configuration man-
agement system as the main trigger for starting new continuous integration processes. In
many cases, the continuous integration system is made to poll the version control or
configuration management system and to notice when the new code is stored to it, and
then the continuous integration system starts a new build and integration process. Con-
tinuous integration systems can also use configuration management systems to build
different products by obtaining the desired repository objects which can in turn be used
for building completely different products, depending for example on the changes made
to different repository objects.
The best practise for using a version control or configuration management system,
which is linked to a continuous integration system, is that the changes implemented to
source code are uploaded often to the version control or configuration management sys-
tem. This way the different changes are integrated with each other as often as possible.
Build breaks and integrations errors can usually be avoided by integrating the source
code as often as possible. The continuous integration system will of course do the inte-
gration automatically for the developer. In chapter 3.1.4 the principle of integrating the
code as often as possible is explained in more detailed level.
There are many free open source tools available for setting up a source repository, so
using a version control or configuration management system in software projects should
not be trivialized (Fowler 2006). It is almost a mandatory requirement when using con-
tinuous integration system to integrate changes made to the software.
15
3.1.2 Automate the build
Sometimes building different software components can be quite tricky if the compo-
nents depend on other components that also need to be built to create a whole working
software product (Fowler 2006). Automating the build process of a software product is
a good practise in general because it eases the general development process and makes
it more efficient. For the continuous integration systems, automating the build is a man-
datory requirement, because building and integration in the continuous integration sys-
tem should happen as often as the source code of the software product changes, and in
continuous integration systems this cannot be gained by doing the building manually.
The build scripts are usually used for creating the build automation for a software prod-
uct. Often build scripts’ functionality is to setup the basic environment that is needed for
building, to integrate source code and to compile the software to a binary output that is
then packaged as a software product. A good build script could be described as a script
that creates the environment for building, does all the necessary steps to build the soft-
ware product and can be easily started, for example by using a simple single line com-
mand. Developers who can easily integrate their own changes and build the whole soft-
ware product automatically can do it more often, than those developers who need to do
all the integration and build steps manually. If the building of a software product is au-
tomated and made as simple as possible, the developers usually do fewer mistakes in the
building process than they would if they had to do everything manually.
When the build automation has been implemented in a way that allows developers to
use it with ease, the automation is usually quite easy to take in use in the continuous
integration systems. Another good practise, when setting up the build automation, is to
create the build automation so that the automated builds are always executed the same
way in the continuous integration system and in the developer’s environment. Using the
same automated build process in all different environments makes the build process
very efficient and removes the doubt that the automated build process would produce
different binaries or different software products, regardless of whether it is used for ex-
ample in the continuous integration system or in the developer’s development environ-
ment.
16
3.1.3 Make your build self-testing
After the software product has been put together by using an automated build process,
and without any build failures, it still does not mean that the software product would
work correctly (Fowler 2006). When using the continuous integration system, it is
strongly recommended that the software product’s continuous integration build process
should include automated testing to verify the functionality of the software product.
Automated testing can be used to notice, if the earlier functionalities of the program are
not working anymore. In the Agile software development, automating the tests can be
described almost as a standard way of doing things. If the software product’s functional-
ities evolve rapidly, there is a huge possibility that the old implemented functionalities
will break up from time to time. Without automated testing these break ups are much
more difficult to find.
Automated testing should be implemented so that the tests can be triggered easily and
the tests set up the testing environment themselves. Also, it should be possible to exe-
cute tests similarly in the development environment, in the target environment and in
the environment used by the continuous integration system.
For creating the automated test, there are many unit test frameworks available. These
frameworks can be called collectively as XUnit frameworks (Fowler). XUnit frame-
works usually test classes or functions and are implemented for a certain coding lan-
guage. XUnit tests cannot usually cover the whole functionality of a software product,
but still they can be very efficient in finding bugs and catching regression errors. Ac-
ceptance testing or some other exhaustive testing should not be usually implemented in
a unit testing level. Automated testing phase should be made as quick as possible so that
the whole continuous integration process is also fast.
When running the automated tests, a good practise is to monitor the coverage of testing
and this should not be forgotten. For monitoring the coverage, there are usually free
open source tools available depending on the language used in the implementation.
17
Automated testing is not used only for verifying the functionality or the coverage of
testing but it can also be used for verifying the performance, reliability, stability or en-
durance. Performance, reliability, stability and endurance testing might be quite time
consuming. If executing of the tests start to take up too much time, then the long run-
ning tests could be moved to a parallel testing scheme, which can be executed outside
the actual continuous integration build and testing process (Fowler 2006).
3.1.4 Everyone commits to the code baseline as often as possible
There is no absolute minimum or maximum amount of for example days when the code
should be committed to the software code repository. But a good practise is to split big
implementation items into a smaller, sensible whole or to separate tasks which can be
uploaded more often to the source code repository (Fowler 2006). The Agile software
development method helps creating sensible implementation tasks since Agile proce-
dures define that the big implementation items need to be split to smaller tasks that form
separate, manageable parts. The implementation progress of these parts can for example
be monitored or controlled.
If code is not committed to the baseline as often enough, it usually leads to code con-
flicts with other new code commits. Solving commit clashes with other developers usu-
ally takes some time, and resolving and merging two different implementation items is
not a very rewarding job from the developer’s perspective. The version control or con-
figuration management systems help developers to solve conflicts with other develop-
ers, but when there are lots of conflicts, some of them might not be solved correctly. If
those conflicts stay undetected for weeks, they can become even harder to detect or
solve. (Fowler 2006)
3.1.5 Every code commit to the baseline should build the baseline
Triggering new builds when new code is uploaded to the repository is a good way to
ensure that the code baseline stays in good shape. Checking that the integration build
has completed without any errors is a quite easy way for the developers to check that
18
their own new implemented code has not caused any build or other regression errors.
(Fowler 2006) If the new build with the new modification has no errors and if the auto-
mated tests have verified the old functionality, then it in many cases proves that the new
implementation has not broken the earlier functionalities of the software product.
Continuous integration system should automatically trigger new builds every time new
code is added to the source code repository (Fowler 2006). If builds are not triggered
automatically, there is always a possibility that someone in the project team forgets to
start the integration build or is not following the process after adding new code to the
source code repository.
Sometimes only nightly or weekly builds are used for integration builds, but usually that
is not enough. That is because if there are many code commits during the period be-
tween builds, it is harder to find the code commit that broke the software integration
when the baseline build fails. In big software projects, the software integration builds
are usually executed by integrating the different parts of the software on separate builds
that could be describes as staging builds. (Fowler 2006) For example, when the devel-
oper does the commit, the new code is first only integrated with the layer where the new
implemented code is located. If the first build is executed without any errors then the
new implementation can be integrated to the whole software product using a second
integration build. This kind of approach can save time in large software products that
consist of many components located in separated layers.
For the developers, a good practise is to check that the latest build has been done with-
out any errors before the developers commit their new code to the code repository. If the
build is broken, the best approach is to fix it as soon as possible, because all the devel-
opment should happen on a stable base. If the build is broken, the developers who added
the new functionality to that build should be notified so that the build break can be re-
solved by the person who modified the original working code baseline. (Fowler 2006)
19
3.1.6 Keep the build fast
For developers and other users of continuous integration system, it is very important
that the result from the continuous integration process comes in a very fast interval
(Fowler 2006). If the build takes a lot of time, it might be frustrating to wait for the re-
sult in a situation where the build fails over and over again.
In big projects, if the whole integration process needs a couple of hours to complete, the
build should be divided into multiple parts (Fowler 2006). For example, the first build
stage could only integrate and build the code and show the result from that. Then the
later, separate stages could handle the packaging and testing parts. If the continuous
integration process fails on some stage and the later stages depend on the first stage, the
whole process would be discontinued. Stages that do not depend on other stages could
be run simultaneously to save time. For example, unit tests and packaging processes can
usually be executed at the same time. The continuous integration system can also be
implemented as a build farm where processes which take time can be divided to differ-
ent computers to make the process as fast as possible.
3.1.7 Test in a clone of the production environment
The best result from continuous integration testing process is usually achieved by using
for testing an environment similar to the actual production environment. Testing in a
clone production environment also makes the test results more accurate. (Fowler 2006)
Usually developer’s development environment differs from the actual production envi-
ronment. Therefore it is a very good approach to use a clone production environment in
the continuous integration process to ensure that the software product is tested against
the real environment at least when the continuous integration cycle is executed.
The operating system, the network configuration, the database and the third party soft-
ware used in testing should be the same ones that are used in the production environ-
ment (Fowler 2006). If the product is designed for multiple operating systems, then
testing should also be executed in all of those environments. It is a good practise to de-
20
velop test cases that can be used in or ported to other environments, so that in automatic
testing phase it is possible to propagate tests to those other environments as well.
3.1.8 Make it easy for anyone to get the latest executable
Everybody in the project should know where to get the latest version of the software
product that is under development, so it can be easily used for example in testing or for
evaluating the new implemented features (Fowler 2006). The continuous integration
systems are usually implemented in such way that the project members are notified
when there are new versions available.
The continuous integration process should produce executable software product that is
available for anyone (Fowler 2006). If the building process has failed for example in the
testing phase, the produced executable can be unusable. If the build process always pro-
duces executable software product, even when the testing fails, then that software prod-
uct should be marked to warn the users to use it with caution.
The project members should also have an easy way to figure out what are the latest
changes in the software product acquired from the continuous integration build process.
Including for example the latest source code repository revision information and com-
ments to the build output is a good way to tell what new implementation items are in-
cluded in the latest software product that has been produced from the continuous inte-
gration process.
3.1.9 Everybody can see what is happening
For all the project members there should be a simple procedure which gives up to date
information about the status of the on-going project. Getting project related information
should be implemented so that all project members can obtain that information with an
extreme ease (Fowler 2006). Normally the relevant information for the project members
contains for example project metrics data, requirements, Scrum backlogs, progress on
21
Scrum backlog items, closed Scrum backlog items, open errors, closed errors, the build
results and test results.
Relevant information could be made available through intranet dashboard or other simi-
lar user interface. Continuous integration builds and tests results are usually shown in
the continuous integration system’s user interface. Many continuous integration systems
provide an application interface that can be used for collecting build and test result in-
formation to some other system. That other system can in turn be used for collecting all
the relevant project data to a same place.
3.1.10 Automate deployment
Automating the software product’s deployment helps when the latest software product
is needed by the developers or other project members to quickly test something with it
(Fowler 2006). Automatic deployment can also verify the deployment, in other words, it
checks that the product works correctly when it has been deployed to the target envi-
ronment. For example in the web development projects it is quite common for the con-
tinuous integration system to build the product and then to deploy it to the web server,
and that way make the new software product available for testing after the completion
of the integration process.
In big software products, the best way to implement the automated deployment is to
build the software product in such a manner that the smaller parts of the whole product
can be deployed to the whole product without reinstalling the whole product every time
when some different parts of the product are changed (Fowler 2006). Updatable plug-in
architectures or runtimes that only load the changed binary parts normally help to build
this kind of automated deployment scenario. In this scenario, the latest product is al-
ways available for testing, and new features are added to the product while the product
is running and accessible for the end-users.
22
3.2 Continuous integration tools
There are many open source and commercial applications available for setting up a con-
tinuous integration system. In this chapter I will present the tools that were used in de-
veloping the Tieto SPQ analysis system, and in building and analysing code for the
proof of concept implementation of the Tieto SPQ analysis system. The same tools are
used widely in software development in general.
3.2.1 Build automation tool Apache Ant
Apache Ant is a Java library that can be used with its command line interface. Ant is
used for executing processes that are described in the build files used by the Ant. The
process descriptions of the build files consist of a list of targets which can depend on
other targets. Ant built-in tasks provide support for compiling code, packaging applica-
tions, and for testing and running applications. Ant build files can have different proper-
ties which can be defined in the build files or passed as parameters to the build files.
Usually Ant is used for building Java applications, but it can also be used effectively to
build other applications such as C or C++ applications. Ant can be extended by creating
own build file tasks or tags that can have various meanings. In short, if a necessary pro-
cess can be described in terms of targets and tasks then Ant can be used for automating
that process. (Apache Ant: Welcome page 2012.)
Developing Ant scripts and building the automated processes using those Ant scripts is
quite simple, and since Ant has been available for quite a long time it is easy to find
very good examples of how to take Ant in use. The Ant build scripts are extensible
mark-up language (XML) files, where build properties, tasks and targets are defined
using XML syntax. Different build targets can be defined in script files and the defined
targets execute tasks that are also defined in the same XML script files.
23
3.2.2 Apache Subversion version control
Apache Subversion (SVN) is an open source version control system developed as a pro-
ject of the Apache Software Foundation. Subversion project started in 2000 and the Col-
labNet, Inc. was the original founder of the Subversion project. At the time of writing
this thesis Subversion version control system was in the transition phase to move under
Apache Software Foundation. (Apache Subversion: Welcome page 2012.)
Subversion is very widely used in the open source communities and in the commercial
software projects, because it is free and quite easy to host and maintain after the setup
phase. Using Subversion as a version control system is quite straightforward and devel-
opers usually quickly adapt to the main principles of how to use Subversion. There are
also many developer tools available that ease the use of Subversion version control sys-
tem in software development.
3.2.3 Software project management tool Apache Maven
Maven is a software project management and build automation tool. It uses project ob-
ject model (POM) to describe and build projects. Furthermore, it can be used for man-
aging project documentation and for reporting information about the project. Maven can
be used for building own, not shared projects or for building projects that can be shared
by other projects that are using Maven. (Apache Maven: Welcome page 2012.)
Maven repositories make it possible to share a software project with other projects. Ma-
ven uses repositories for publishing the build output. Beside this Maven repository can
hold other build dependencies of varying types. Maven local repositories usually store
the software that is needed in developers own software project. Remote repositories can
be used for offering one’s own implemented solutions to other developers.

24
3.3 Jenkins continuous integration system
Jenkins continuous integration system is an extendable open source continuous integra-
tion server implemented using Java. Jenkins can be used for monitoring executions of
repeated jobs and for reporting result information from those jobs. Monitored jobs can
be for example software builds, software test runs or UNIX-like cron tasks. Jenkins
mainly focuses on building and testing software projects continuously. Jenkins also fo-
cuses on monitoring executions of externally executed jobs. Builds and other jobs can
be started manually, by using scheduling or by using triggers. For example a Jenkins
continuous integration process cycle trigger can be a code commit to the version control
system that is polled by the Jenkins continuous integration server. (Jenkins: Meet Jen-
kins page 2012.)
Jenkins has an interesting background since originally it was named Hudson and was a
hobby project of Kohsuke Kawakuchi when he was working at Sun. At some point Ora-
cle bought Sun and inherited the code base of Hudson. After some period of time, ten-
sion emerged between Oracle and the open source community. After that Jenkins was
born as a separate project developed by most of the original developers of Hudson.
(Smart 2011, 3.)
Jenkins has many good features that are useful when using it as continuous integration
server. One good example of these useful features is the easy installation. Jenkins can be
installed with only executing two simple steps. First the Java Runtime Environment
(JRE) needs to be installed. After JRE installation, Jenkins can be started by just obtain-
ing the packaged Java file and then starting it from the command prompt. With Jenkins
there is no need for example to setup any database because Jenkins can use local con-
figuration and data files that are stored to the local computer.
Jenkins was selected to be part of this thesis because it can be extended via external
plug-ins. For example, when Jenkins lacks some necessary feature, then the user can
make a plug-in which once implemented can make Jenkins support those wanted fea-
tures.
25
3.3.1 How to extend Jenkins
Jenkins can be expanded by creating tailored Java Jenkins plug-ins that extends the ex-
tension points offered by the Jenkins application interface. User interface contributions
to the Jenkins web user interface are implemented by using Jelly scripts in tailored Jen-
kins plug-ins. (Jenkins: Architecture 2012.) A Jelly script is an XML document which
gets parsed into an executable code in a Jelly engine which is a Java and XML based
script processing engine developed by the Apache Software Foundation.
Usually the Java extension points in Java applications are Java interfaces and abstract
classes that the actual Java extension class will implement so that it can contribute to the
system where the extension is loaded. The extension points of a system can be described
as contracts that need to be implemented in the extension. Jenkins extension points
model aspects of a build system. (Jenkins: Plug-in tutorial 2012.)
3.3.2 How to create an extension plug-in to Jenkins
The environment for developing Jenkins plug-ins consists of Java Software Develop-
ment Kit (SDK), Maven and Integrated Development Environment (IDE). Java SDK is
used for building the byte code from Java classes; Maven is used for managing the de-
pendencies of the software components and for the build automation; IDE is used for
editing the code.
At the time of writing this thesis the Jenkins plug-in tutorial defined that Maven 2 and
JDK 6.0 or later versions are needed for developing Jenkins extension plug-ins (Jenkins:
Plug-in tutorial 2012.). As for the IDE the developer can choose to use NetBeans, Intel-
liJ IDEA or Eclipse. NetBeans, IntelliJ IDEA and Eclipse are very common and popular
Java development tools among Java developers. NetBeans and IntelliJ IDEA could be
considered as the most suitable for Jenkins plug-in development because those have full
Maven project support. Eclipse is also a good IDE, but for Maven projects it needs
some external plug-ins for handling the Maven projects.
26
Jenkins plug-in development consists of setting up the environment, coding the plug-in,
deploying the plug-in to Jenkins and testing tasks. The details of these tasks for Win-
dows operating systems are described in the next chapters. All the tools used in the Jen-
kins plug-in development are available for free and can be obtained from the manufac-
turers’ web pages.
Setting up the environment has to start from the Java SDK installation because all the
other tools need Java. There are Java SDK installers for every major operating system,
and they can be installed using the default installation options. After the Java SDK has
been installed the JAVA_HOME environment variable value needs to be defined as the
Java SDK installation folder. After the installation of Java SDK the next step is to in-
stall Maven.
Maven is installed by unpacking its binary distribution to a desired folder. After un-
packing Maven, the following configuration steps need to be done. First M2_HOME
environment variable must be defined and its value set as the directory where Maven
package was unpacked. Second step is to define M2 environment variable and define its
value as %M2_HOME%\bin. Third step is to add Maven bin folder to the path environment
variable so that the Maven tools are available in the Windows command prompt. Last
step is to check Maven installation by opening new command prompt and running mvn –
version command. If the correct version is shown in the output of the command, then
you must create and edit Maven configuration file ~/.m2/settings.xml. In appendix 1
there is an example of how to define the settings file. After Maven has been installed,
the next step is to install the preferred IDE.
In this example NetBeans Java Enterprise Edition (Java EE) package is used as pre-
ferred IDE. It can be installed with its installation media using the default options. After
IDE installation, it is possible to start developing Jenkins plug-ins.
Jenkins plug-in development is started by creating a skeleton plug-in project by running
mvn -cpu hpi:create command in the selected directory that is used as a base folder for
the Jenkins plug-in projects. This command will download the needed Maven plug-ins,
and after that it will ask a few questions that define the configuration for the plug-in
project. The resulting skeleton project is a plug-in which source code contains a “Hello
27
World” example. After creating the skeleton project, open the created directory in
command prompt and run mvn package command to build the plug-in. Command will
download more necessary plug-ins and produce an .hpi file that can be installed to the
Jenkins.
Now the plug-in project can be opened in NetBeans IDE and developed further. Imple-
ment the desired functionality to the plug-in in NetBeans IDE by extending the neces-
sary classes from Jenkins API. Then write your own Java contributions to your classes
and implement your user interface contributions using the Jelly scripts. When develop-
ing the plug-in it can be tested in Jenkins by running a mvn hpi:run command in the
created plug-in directory. This command will create a local Jenkins instance including
the developed plug-in. When the plug-in implementation is ready, the next step is to test
the plug-in in a real Jenkins installation.
Jenkins is installed by acquiring the Jenkins package file and then storing it to the de-
sired folder. After the file is in place, Jenkins can be started by running a java –jar
jenkin.war command in a command prompt in the same folder where the Jenkins pack-
age is stored. After Jenkins is running, create an installation package from the plug-in
project by running a mvn package command in a command prompt in the created plug-
in directory. Produced .hpi file can be installed via Jenkins user interface and tested
from the user interface after the plug-in installation is complete.
3.4 Tieto SPQ analysis system and continuous integration
Tieto SPQ analysis system is strongly linked to a continuous integration system. One
reason why Tieto SPQ analysis system needs the continuous integration system is that if
software is continuously integrated, analysed and tested as the code base changes then
the analysis of how quality evolves becomes more accurate.
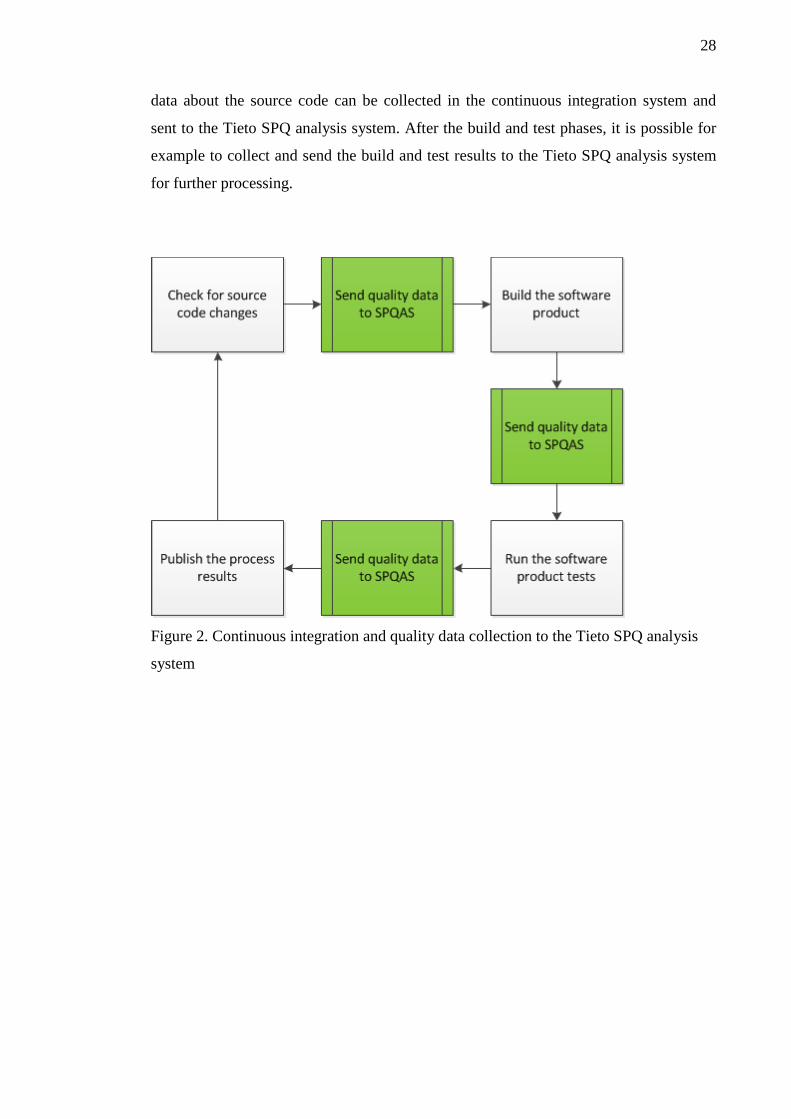
Figure 2 shows a simplified continuous integration process cycle example and explains
how data from the continuous integration process is collected and aggregated to the Tie-
to SPQ analysis system between the different continuous integration process steps.
When changes in the source code are detected and the cycle moves forward, statistical
28
data about the source code can be collected in the continuous integration system and
sent to the Tieto SPQ analysis system. After the build and test phases, it is possible for
example to collect and send the build and test results to the Tieto SPQ analysis system
for further processing.
Figure 2. Continuous integration and quality data collection to the Tieto SPQ analysis
system

29
4 SQUARE - ISO/IEC 25000 STANDARD FAMILY
According to the ISO/IEC 25000 standard (2005, vi), the Software Quality Require-
ments Evaluation standard family, also known as SQuaRE, is a standard family that
combines and replaces the older ISO/IEC 9126 Information Technology – Software
Product Quality and the ISO/IEC 14598 Information Technology – Software Product
Evaluation standard families.
Before the ISO/IEC 25000 and the ISO/IEC 14598 standards the ISO/IEC 9126 Soft-
ware engineering – Product Quality standard was its own standard. In 1994 the ISO/IEC
9126 was split to the ISO/IEC 9126 Information Technology – Software product quality
and to the ISO/IEC 14598 Information Technology – Software product evaluation
standards. After it was noticed that the ISO/IEC 9126 and the ISO/IEC 14598 standards
started to have inconsistencies between them because of their independent life cycles,
the creation of the ISO/IEC 25000 standard family was started as a way to solve this
problem. The ISO/IEC 25000 standard family’s main purpose is to create a unified
software quality related standard family that covers both of the earlier standards.
(ISO/IEC 25000 2005, vi.)
The ISO/IEC 25000 standard family covers two main software processes: software
quality requirements specification and software quality evaluation. These two processes
are supported by software quality measurement process that is also covered in the
ISO/IEC 25000 standard family. The ISO/IEC 25000 standard family is meant for those
who develop, test, analyse, evaluate and acquire different software products. The
ISO/IEC 25000 standard family can assist in specifying and evaluating the quality re-
quirements. The ISO/IEC 25000 standard family offers benefits to its predecessors like
the coordination of guidance on software product quality measurement and evaluation
and guidance for the specification of software product quality requirements. (ISO/IEC
25000 2005, vi.)
30
4.1 Division and overview of separate parts of ISO/IEC 25000 standard
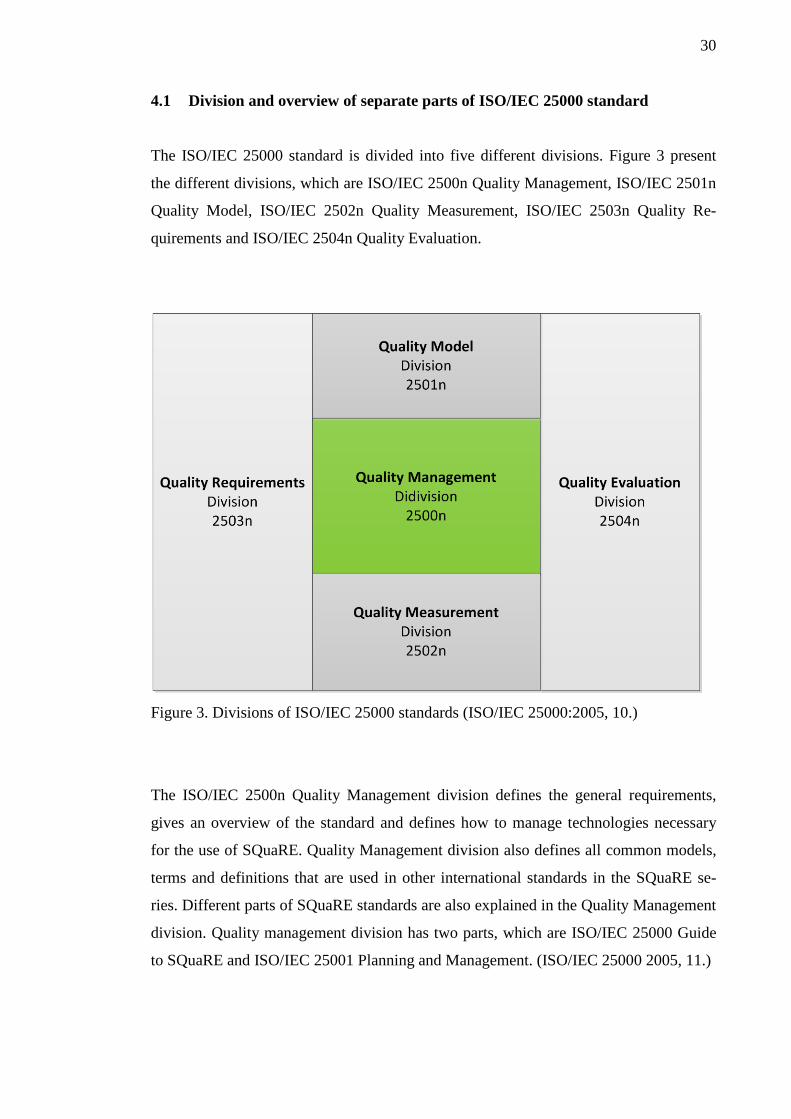
The ISO/IEC 25000 standard is divided into five different divisions. Figure 3 present
the different divisions, which are ISO/IEC 2500n Quality Management, ISO/IEC 2501n
Quality Model, ISO/IEC 2502n Quality Measurement, ISO/IEC 2503n Quality Re-
quirements and ISO/IEC 2504n Quality Evaluation.
Figure 3. Divisions of ISO/IEC 25000 standards (ISO/IEC 25000:2005, 10.)
The ISO/IEC 2500n Quality Management division defines the general requirements,
gives an overview of the standard and defines how to manage technologies necessary
for the use of SQuaRE. Quality Management division also defines all common models,
terms and definitions that are used in other international standards in the SQuaRE se-
ries. Different parts of SQuaRE standards are also explained in the Quality Management
division. Quality management division has two parts, which are ISO/IEC 25000 Guide
to SQuaRE and ISO/IEC 25001 Planning and Management. (ISO/IEC 25000 2005, 11.)
31
The ISO/IEC 2501n Quality Model division defines the general requirements for quality
models and guides the users in customizing and using the different quality models.
Quality Model division has two separate parts, the ISO/IEC 25010 System and software
quality models and the ISO/IEC 25012 Data Quality model. (ISO/IEC 25000 2005, 11.)
The ISO/IEC 2502n Quality Measurement division defines general requirements for
quality metrics and guides the users to use those metrics. Quality measurement division
has five different parts, which are ISO/IEC 25020 Measurement reference model and
guide, ISO/IEC 25021 Quality measure elements, ISO/IEC 25022 Measurement of
quality in use, ISO/IEC 25023 Measurement of system and software product quality and
ISO/IEC 25024 Measurement of data quality. (ISO/IEC 25000 2005, 11.)
The ISO/IEC 2503n Quality requirements division defines requirements and recom-
mendations for the specification of software product quality requirements. Quality re-
quirements division has only one part, the ISO/IEC 25030 Quality requirements.
(ISO/IEC 25000 2005, 12.)
The ISO/IEC 2504n Quality evaluation division defines general requirements for speci-
fication and for evaluation of the software quality. Quality evaluation division has two
parts, the ISO/IEC 25040 Quality evaluation process and the ISO/IEC 25041 Evaluation
guide for developer, acquirers and independent evaluators. (ISO/IEC 25000 2005, 12.)
4.2 Quality models
The quality of the system, according to the ISO/IEC 25010 standard (2010, 2), is the
degree to which the system satisfies the stated and implied needs of its various stake-
holders, and thus provides value. Different stakeholders are for example the primary
users who interact with the system to achieve the primary goals, or the secondary users
who provide support for the primary users to achieve the primary goals (ISO/IEC
25010:2010, 5). Different stakeholders can also be defined as user roles such as: soft-
ware developers, system integrators, acquirers, owners, maintainers, contractors, quality
assurance and control professionals, and end-users (ISO/IEC 25010:2010, 2).
32
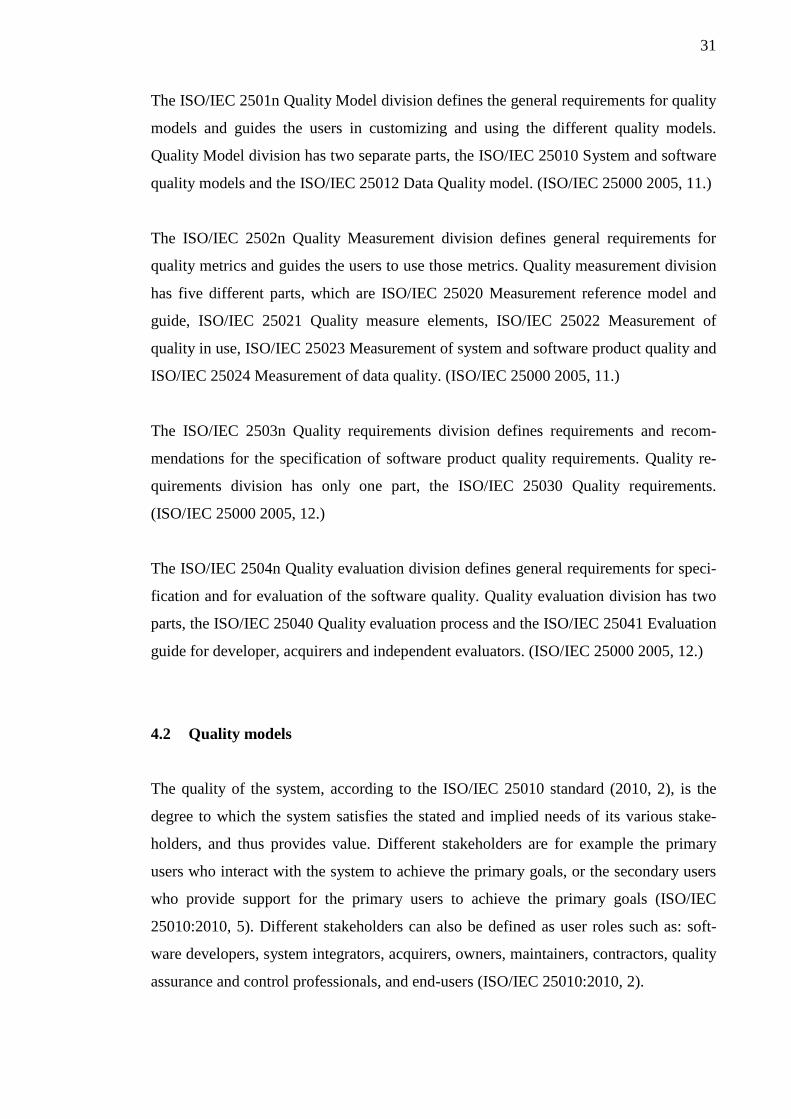
Quality models defined in the SQuaRE series of international standards are frameworks
that represent the quality of software as a categorized characteristics and sub-
characteristics. For example, the product quality model defines a maintainability charac-
teristic that has a sub-characteristic called modifiability. According to the standard, the
sub-characteristics can be divided further to sub-sub-characteristics if necessary, but in
the available quality models of the standard there are no examples from this kind of
characteristics breakdown. Figure 4 clarifies how the quality is divided into characteris-
tics and sub-characteristics. Figure 4 also shows that for characteristics or sub-
characteristics of the software there are quality attributes or a collection of those quality
attributes that can be measured. (ISO/IEC 25010:2010, 2.)
Quality models’ main functionality is to illustrate the different aspects of the software
that can be analysed from different stakeholders’ perspective. Quality models can be
also used as a checklist to verify that all the relevant characteristics are considered when
quality requirements are defined for the software that is under evaluation. (ISO/IEC
25010:2010, 5.)
Figure 4. Structure of the quality models (ISO/IEC 25010:2010, 2)
33
There are three quality models in the SQuaRE series: the quality in use model, the
product quality model, and the data quality model. The data quality model that is in the
ISO/IEC 25012 standard is not explained in this thesis because the characteristics from
that quality model are not used in the proof concept implementation of the Tieto SPQ
analysis system. Quality in use model can be seen as an important quality model be-
cause it contains characteristics that could be used in the Tieto SPQ analysis system, but
for the proof of concept implementation those were not used. Software product quality
is the most important quality model from point of view of the proof of concept imple-
mentation, because all of the quality characteristics that are used in the proof of concept
come from that model. Software product quality and quality in use models are explained
in the next chapters.
4.2.1 Quality in use quality model
According to the ISO/IEC 25010 standard (2010, 8), the quality in use means the degree
to which the product or system can be used by specific users to meet their needs in
achieving specific goals in a specific context of use. In the quality in use model, there
are five different characteristics. They are effectiveness, efficiency, satisfaction, free-
dom from risk, and context coverage. These characteristics and their sub-characteristics
are presented in figure 5.
34
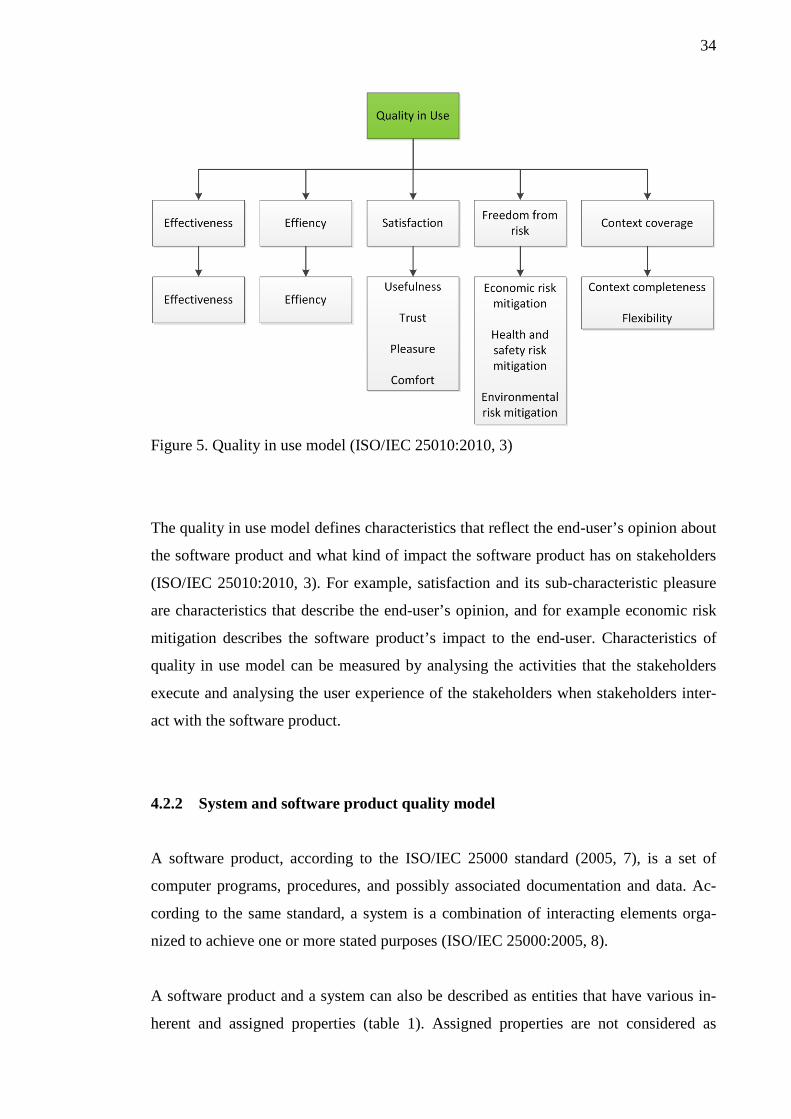
Figure 5. Quality in use model (ISO/IEC 25010:2010, 3)
The quality in use model defines characteristics that reflect the end-user’s opinion about
the software product and what kind of impact the software product has on stakeholders
(ISO/IEC 25010:2010, 3). For example, satisfaction and its sub-characteristic pleasure
are characteristics that describe the end-user’s opinion, and for example economic risk
mitigation describes the software product’s impact to the end-user. Characteristics of
quality in use model can be measured by analysing the activities that the stakeholders
execute and analysing the user experience of the stakeholders when stakeholders inter-
act with the software product.
4.2.2 System and software product quality model
A software product, according to the ISO/IEC 25000 standard (2005, 7), is a set of
computer programs, procedures, and possibly associated documentation and data. Ac-
cording to the same standard, a system is a combination of interacting elements orga-
nized to achieve one or more stated purposes (ISO/IEC 25000:2005, 8).
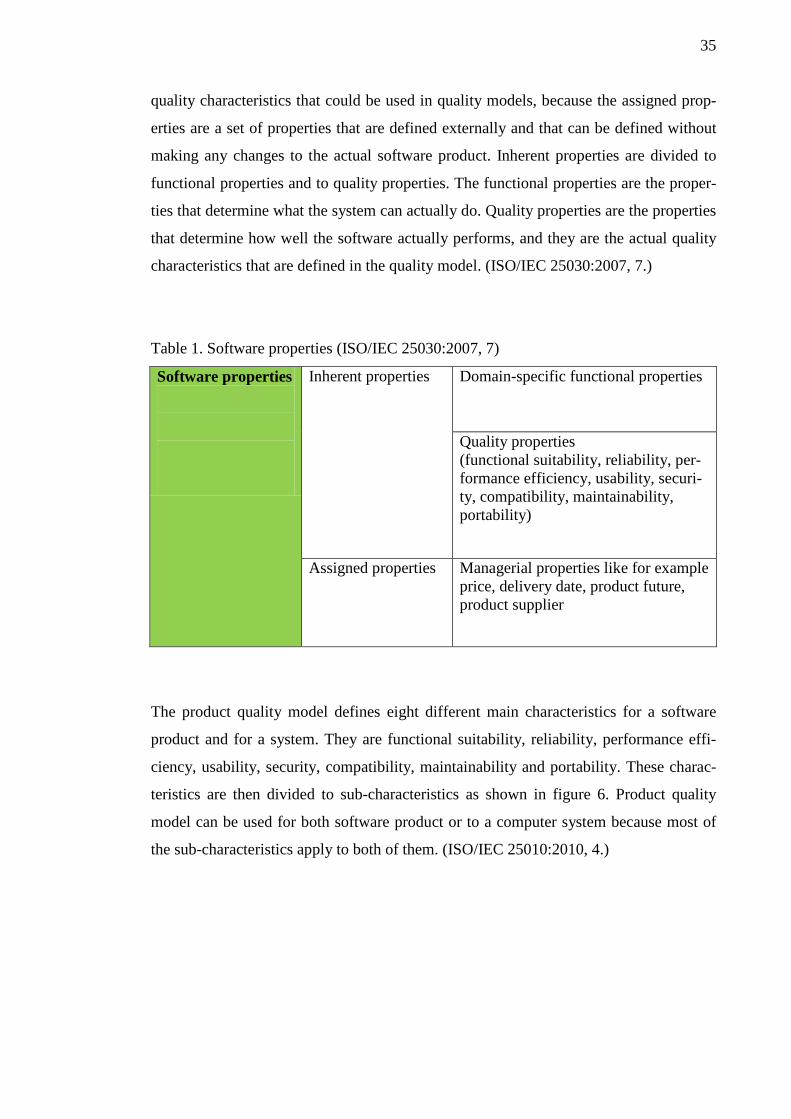
A software product and a system can also be described as entities that have various in-
herent and assigned properties (table 1). Assigned properties are not considered as
35
quality characteristics that could be used in quality models, because the assigned prop-
erties are a set of properties that are defined externally and that can be defined without
making any changes to the actual software product. Inherent properties are divided to
functional properties and to quality properties. The functional properties are the proper-
ties that determine what the system can actually do. Quality properties are the properties
that determine how well the software actually performs, and they are the actual quality
characteristics that are defined in the quality model. (ISO/IEC 25030:2007, 7.)
Table 1. Software properties (ISO/IEC 25030:2007, 7)
Software properties
Inherent properties Domain-specific functional properties
Quality properties (functional suitability, reliability, per-formance efficiency, usability, securi-ty, compatibility, maintainability, portability)
Assigned properties Managerial properties like for example price, delivery date, product future, product supplier
The product quality model defines eight different main characteristics for a software
product and for a system. They are functional suitability, reliability, performance effi-
ciency, usability, security, compatibility, maintainability and portability. These charac-
teristics are then divided to sub-characteristics as shown in figure 6. Product quality
model can be used for both software product or to a computer system because most of
the sub-characteristics apply to both of them. (ISO/IEC 25010:2010, 4.)

36
Figure 6. Product quality model (ISO/IEC 25010:2010, 4)
4.3 Quality measure elements
Quality measurement elements (QMEs) in ISO/IEC 25020 (2007, 5) are defined as ele-
ments that include the measurement method which is used to quantify the properties
belonging to the target entity that is under quality analysis. When the properties are
quantified in the quality measure elements, those elements can be then used to construct
the actual quality measures. Quality measures can indicate the quality value of a certain
quality characteristic belonging to a certain quality model that is used to measure the
quality.
37
The ISO/IEC 25021 and the ISO/IEC 9126 standards define a number of definition ex-
amples of quality measurement elements that can be used when quality measurement
elements are selected. If these definition examples do not define the necessary quality
measurement elements, then the ISO/IEC 25020 standard offers a template that can be
used for defining other quality measurement elements that suits the user’s own needs.
4.4 Using the quality models for measurement
The ISO/IEC 25010 standard advices (2010, 5) that the quality models especially prod-
uct quality and quality in use models, can be very useful for specifying quality require-
ments for a software product. When the quality requirements are specified for the soft-
ware product, the quality characteristics defined in the quality models can be used as a
starting point for defining one’s own quality requirements. For the product that is under
evaluation, it is possible to check which of the quality characteristics are the most essen-
tial for the software product. If all of the different quality characteristics that are provide
in the standard are evaluated in the quality requirements design phase, it will ensure that
the software quality requirements are analysed thoroughly. Using the quality models
characteristics for quality requirements’ specification can also help to estimate what
kind of quality or other activities need to be executed in the different software develop-
ment phases.
Quality characteristics which will be measured, has to be selected carefully because
usually it is not practical or it might be too time consuming to try to measure all of the
sub-characteristics for all the different parts of a software product. Quality characteris-
tics should be selected by analysing the high-level goals and targets for those software
projects that are under analysis. Different stakeholders’ perspectives, goals and objec-
tives should also be considered when quality characteristics are selected. (ISO/IEC
25010:2010, 5.)

38
Figure 7. Software Quality Measurement Model (ISO/IEC 25010:2010, 32)
Figure 7 clarifies the process of forming the software product quality by using charac-
teristics and quality measures. Quality measure elements, which were explained in
chapter 4.3, are used in measurement functions to create quality measures. Measurement
functions are algorithms that use the measurement elements results to calculate quality
results. These results are the quality measures that indicate quality of a certain quality
characteristics or sub-characteristics. (ISO/IEC 25010:2010, 26.)
Quality measures can be done for software processes, internal properties, and external
properties and for the actual usage of the software. Internal properties are the properties
that can be evaluated by evaluating the software products static metrics like code modi-
fiability. External properties, on the other hand, are properties that can be evaluated by
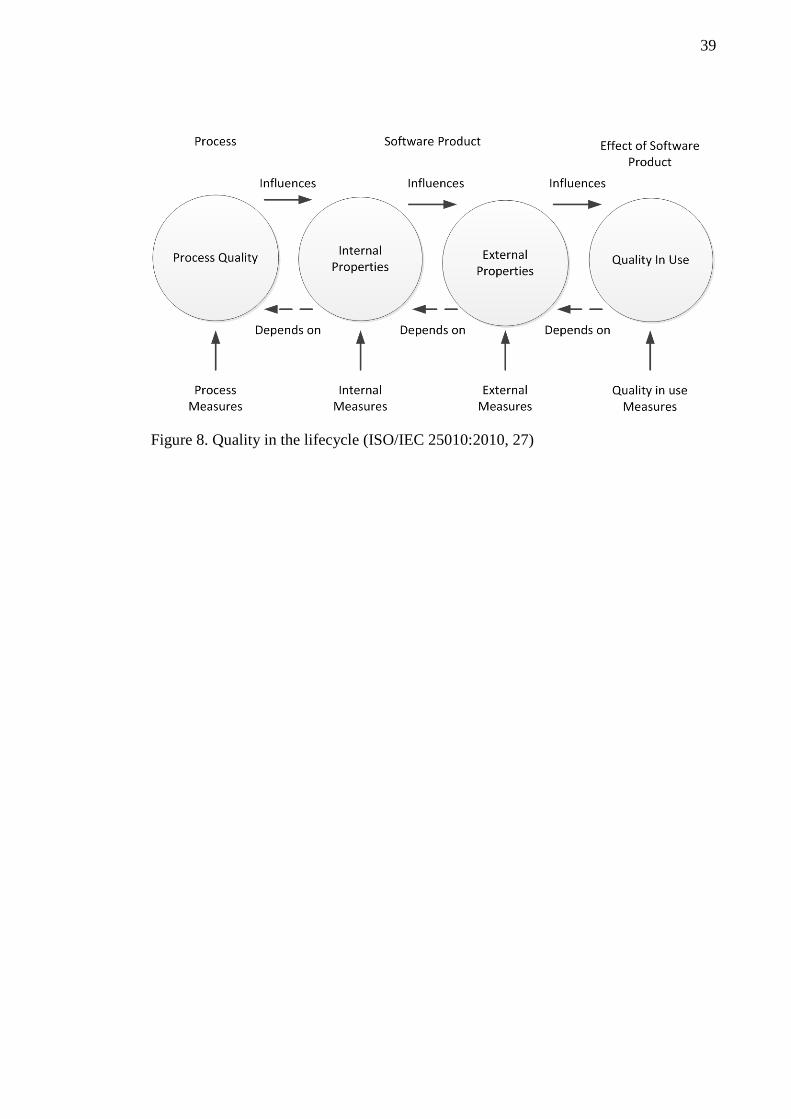
inspecting for example the behaviour of the software under testing. Figure 8 describes
how quality measures and quality perspectives interact between each other. Evaluating
software development processes and improving those processes can have a positive im-
pact on the quality of the software products. When the software product’s quality is
evaluated by studying the internal properties of a product, that may improve the quality
of the external properties. Improvement of the external properties influences on the
quality in use. (ISO/IEC 25010:2010, 27.)
39
Figure 8. Quality in the lifecycle (ISO/IEC 25010:2010, 27)
40
5 TIETO SOFTWARE PRODUCT QUALITY ANALYSIS SYSTEM
The Tieto SPQ analysis system can be described as a concept that combines general
parts and the way in which the software product’s quality can be analysed according to
the ISO/IEC 25000 standards. It is also a software product that handles and stores quali-
ty metrics data and presents quality results to the end-user of the Tieto SPQ analysis
system. Besides that the Tieto SPQ analysis system defines service concepts which ex-
tend the Tieto SPQ analysis system’s offering and which can be offered to the Tieto
SPQ analysis system’s customers.
The software components of the Tieto SPQ analysis system are explained in detail in
the next two chapters. The services of the Tieto SPQ analysis system are explained only
briefly in this chapter because those do not fall in the scope of this thesis. Services of
the Tieto SPQ analysis system are explained in detailed level in Mika Immonen’s earlier
Master’s thesis on this subject.
The services that the Tieto SPQ analysis system can provide for the end-user and for the
target organization that is using the Tieto SPQ analysis system are Installation and Con-
figuration (ICS), Analysing Tools Integration (ATIS), Help Desk and Training (HDTS)
and Quality Consultation (QCS) service (Immonen 2009, 56).
When the Tieto SPQ analysis system is delivered to the customer, the Installation and
Configuration service can be used for setting up the system. Installation and configura-
tion service is used for installing the system, setting up the database, creating the neces-
sary access rights and connections to the system, and for delivering the analysing tools
and configurations of those tools. In short, the Installation and configuration service will
ease the process of taking the Tieto SPQ analysis system in use for the first time. (Im-
monen 2009, 56.)
The Analysing Tools Integration service is used when new analysing tools and quality
metrics are added to the Tieto SPQ analysis system’s offering. New analysing tools and
quality metrics must go through an evaluation process that is handled by the Analysing
Tools Integration service. The service provides a centralized way of handling the sys-
tem’s analysing tools offering. (Immonen 2009, 56.)
41
Customer support of the Tieto SPQ analysis system is handled by the Help Desk and
Training service. Customer support handles the creation and updating of user manuals
and help material. Furthermore, it provides training services and responses and solves
service tickets concerning the usage of the Tieto SPQ analysis system. (Immonen 2009,
58.)
Process improvements that relate to the Tieto SPQ analysis system and to the software
development support functions are handled by the Quality Consultation service. The
Quality Consultation service can also be used in resolving common quality issues and
performance improvements in the target software development organization where the
Tieto SPQ analysis system is used. (Immonen 2009, 59.)
5.1 General architecture
The Tieto SPQ analysis system consists of a database and the following components: an
application interface, a quality data handler, a quality data collector and a quality data
presentation component. The database, application interfaces and quality data handler
components create the core system of the Tieto SPQ analysis system that runs in the
Tieto SPQ analysis system server. Quality data presentation and quality data collector
components that communicate with the core system components run in external systems
that are not part of the core system.
The core system of the Tieto SPQ analysis system is responsible for processing the
quality data and storing it to its database. The core system also provides an application
interface for external components that need to communicate with the core system. The
core system can be described as a standalone system that does not depend on any other
system.
Quality data collector components are components which are hooked to other systems
where raw quality data is produced. The quality data collector components are responsi-
ble for collecting and pre-processing the data and sending it to the core system. Contin-
uous integration server is a good example of a location where a quality data collector
component can be placed to collect raw quality data. Another good location for these
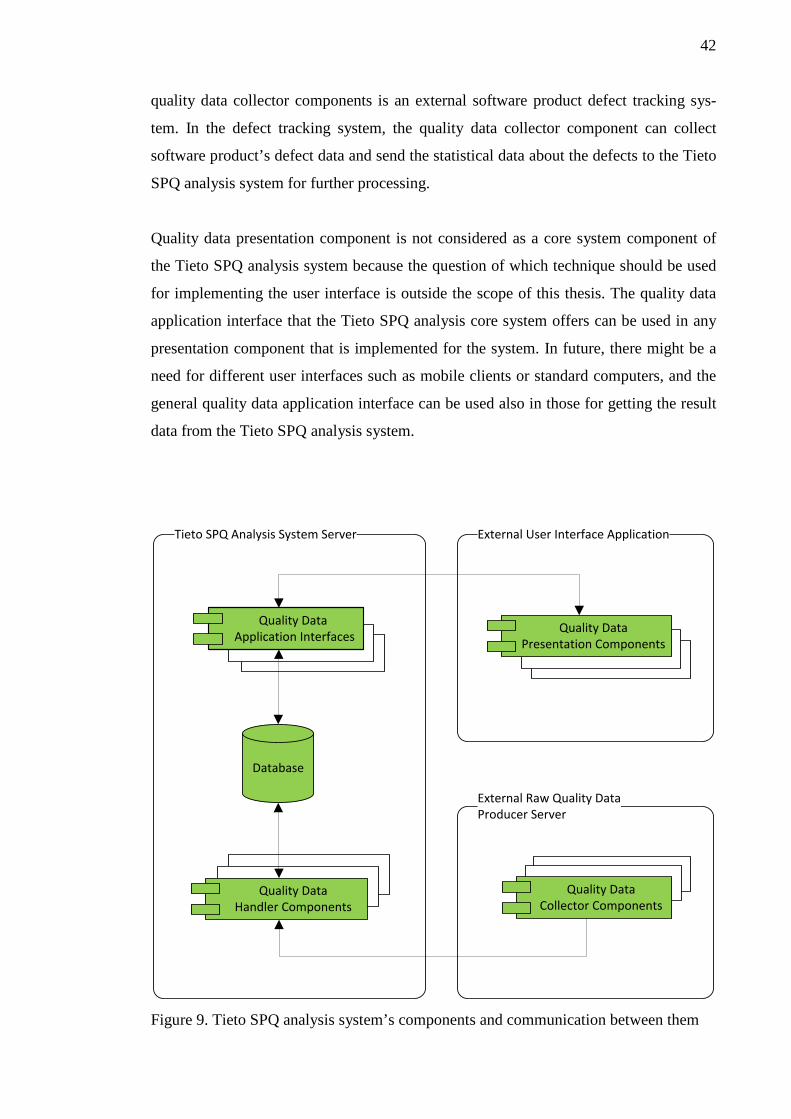
42
quality data collector components is an external software product defect tracking sys-
tem. In the defect tracking system, the quality data collector component can collect
software product’s defect data and send the statistical data about the defects to the Tieto
SPQ analysis system for further processing.
Quality data presentation component is not considered as a core system component of
the Tieto SPQ analysis system because the question of which technique should be used
for implementing the user interface is outside the scope of this thesis. The quality data
application interface that the Tieto SPQ analysis core system offers can be used in any
presentation component that is implemented for the system. In future, there might be a
need for different user interfaces such as mobile clients or standard computers, and the
general quality data application interface can be used also in those for getting the result
data from the Tieto SPQ analysis system.
Tieto SPQ Analysis System Server
Database
Quality Data Application Interfaces
Quality Data Handler Components
External User Interface Application
Quality DataPresentation Components
External Raw Quality Data Producer Server
Quality Data Collector Components
Figure 9. Tieto SPQ analysis system’s components and communication between them
43
Figure 9 clarifies how the Tieto SPQ analysis system components (marked green in the
figure) are divided between different systems. Figure 9 also presents the data flow be-
tween components. The Tieto SPQ analysis system server, external user interface appli-
cation and external raw quality data producer server presented in the figure 9 do not
need to be divided between different computers, but the figure illustrates how these sys-
tems and their components have clear process boundaries between each other. For spe-
cific needs, every component can be divided to multiple pluggable components that
implement the desired functionality. In the Tieto SPQ analysis system proof of concept
implementation, continuous integration server is used as an external raw quality data
producer server.
5.2 Design and overall implementation principles
Overall implementation of the Tieto SPQ analysis system components has to follow the
principle that the database and its design is the only static and persistent component of
the implemented Tieto SPQ analysis system. Database can be expanded or modified,
but after the modifications, it is still the key component that holds the analysis and con-
figuration data and cannot be completely removed from the implementation of the Tieto
SPQ analysis system.
All the other components implemented for the Tieto SPQ analysis system are consid-
ered as pluggable components that can be replaced, updated or removed depending on
the functionality that is needed from the delivered Tieto SPQ analysis system. Pluggable
components can have dependencies to other components, and if a component that is
used in other components is removed from the system, the depending components will
also need to be removed.
Pluggable components, such as quality data application interfaces and quality data han-
dler components, which are considered as core components of the Tieto SPQ analysis
system, can contribute their own tables to the database. These database contribution
tables can have dependencies to the Tieto SPQ analysis system’s database tables, but
the Tieto SPQ analysis system’s database tables cannot have dependencies to the plug-
gable components’ database tables.
44
The Tieto SPQ analysis system server’s core components are Open Grid Services Infra-
structure (OGSi) bundles that run inside OGSi runtime. Apache Karaf is the OGSi
runtime that is used in the proof of concept implementation of the Tieto SPQ analysis
system. Apache Karaf is a lightweight OGSi based runtime which provides a container
where components and applications can be deployed. Apache Karaf was selected be-
cause it is available for free from the Apache Foundation and it can provide an applica-
tion framework for the Tieto SPQ analysis system server’s core components. Applica-
tion framework is needed because it keeps the Tieto SPQ analysis system server’s core
components and the service they offer up and available for the software clients and for
the end-users.
Communication between the core components of the Tieto SPQ analysis system server
and between the core system and external Tieto SPQ analysis system components is
handled using Java Message Service (JMS). Apache ActiveMQ is the messaging server
that is used for sending the messages between the Tieto SPQ analysis system compo-
nents. Message routing between components is handled using Apache Camel. The pos-
sibility to communicate with the Tieto SPQ analysis system from external components
using the application interfaces is implemented by using the Apache CXF framework.
Apache CXF can be used for building for example web services for the end-user clients.
Apache Camel, Karaf, CXF and ActiveMQ frameworks can be obtained together by
using the Apache ServiceMix integration container, so for the proof of concept imple-
mentation of the Tieto SPQ analysis system it was logical to select the Apache Ser-
viceMix as a base platform for the Tieto SPQ analysis system. Apache ServiceMix is an
open source integration container that can be obtained and used for free from the
Apache Foundation. Using the Apache ServiceMix in the Tieto SPQ analysis system
brings many benefits to the core components’ implementation, for example it provides a
dynamic configuration support and a logging framework that can be directly used in the
core components.
45
5.2.1 Database architecture
MySQL database is used as data storage for the Tieto SPQ analysis system. MySQL
database was selected because it is used widely and it can be acquired and used for free.
Tieto SPQ analysis system tables are MySQL InnoDB tables. InnoDB is used as data-
base engine because it supports transactions and foreign key constraints between tables.
Foreign key relationships between tables are heavily used in the Tieto SPQ analysis
system’s database to maintain the data integrity and relationships between the tables.
The Tieto SPQ analysis system core tables are divided into five different layers. Every
layer is a logical entity that holds relevant data to that entity. Different layers of the Tie-
to SPQ analysis system’s database are the Software Product Layer (SPL), the Software
Product Quality Model Layer (SPQML), the Software Quality Library Layer (SQLL),
the Software Product Quality Analysis Layer (SPQAL) and the Analysis Configuration
Layer (ACL) (Immonen 2009, 63). Appendix 2 presents all of these layers and the rela-
tionships between the different tables in the different layers.
The database tables in the Software Product Layer hold the identity data for the projects
and for the products the quality of which is analysed in the Tieto SPQ analysis system.
In brief, this layer holds the object’s identity data that is being analysed. The identity
data that is stored to this layer contains common attributes such as name, description
and other relevant data attributes which can be defined for projects and products. Soft-
ware Product Layer also has a user table for storing user’s identity data. User table can
be used for implementing a lightweight user management and for attaching users to cer-
tain projects in the database.
Software Product Quality Model Layer’s database tables contain the quality models
identity data that are used in the system. This layer also holds weight values for the var-
ious stored quality models, so that in the analysis result calculation, a certain quality
model can be more or less important than the others. Software Quality Library Layer
holds the quality models characteristics data and the configuration for the characteris-
tics. In this layer, it is also possible to categorize the used quality libraries and define
weight values to them so that a certain library can be more or less important than others.
Software Product Quality Analysis Layer stores the actual, collected and analysed quali-
46
ty results. The last Analysis Configuration Layer holds the configuration and identity
data for the different analysing tools that are used in the Tieto SPQ analysis system.
The product table in the Software Product Layer is linked to the Software Product Qual-
ity Model Layer so that the system can store the information on what kind of quality
models are used for different products. Product table is also linked to the Software
Product Quality Analysis Layer, allowing the system to maintain the information on
which analysis results belong to which product. The analysis result table in the Software
Product Quality Analysis Layer is linked to the Analysis Configuration Layer so that it
is possible to link certain analysis result values to the tool that has produced those val-
ues. Software Product Quality Model (SPQM) table in the Software Product Quality
Model Layer has a relationship with the Software Product Quality Analysis Layer mak-
ing it possible to calculate the analysis result values for the software product’s quality
models stored in the database. The Software Product Quality Model Layer also has a
relationship with the Software Quality Library Layer to store which quality libraries are
used in the quality models.
A simple database trigger was also implemented for the proof of concept. The database
trigger is used to calculate the Software Product Quality Model Value (SPQMV) by
using a formula defined by Mika Immonen in his Master’s thesis. The Software Product
Quality Model Value represents the software product’s quality on a scale of 0 to 100,
where 100 is the best possible quality result (Immonen 2009, 54). Storing analysis re-
sults to the database will activate the database trigger. Basically in the proof of concept,
the database trigger first calculates the average of all the relevant analyses results in the
Software Product Quality Analysis Layer and then multiplies it with the emphasis fac-
tors which are stored in the Software Product Quality Model Layer. The resulting value
is then stored to the Software Product Quality Analysis Layer.
5.2.2 Architecture of quality data handler components
The quality data handler components are OGSi bundles that run in OGSi runtime. Qual-
ity data handler components receive data from the quality data collector components
and store it to the database. Data from the quality data collector components is received
47
as messages sent through Java Message Service (JMS). The messages are processed,
and the result from the processing is stored to the database or sent to other quality data
handler components for further processing. Different quality data handler components
can be implemented for specific processing tasks and for certain needs. The communi-
cation between the quality data handler components takes place through XML messag-
es. The structure of the messages is defined in the Tieto SPQ analysis system’s common
XML schema. The definitions in the schema can be used also in other components, so
that the communication model is the same for every component.
Four quality data handler components were implemented for the proof of concept. Three
of the components handle data from external quality data collector components. After
the data has been processed, it is sent to the fourth quality data handler aggregator com-
ponent which in turn stores the data to the Tieto SPQ analysis system’s database. Ag-
gregator component handles the database connections and the necessary database table
modifications. The quality data handler components, which receive data from the quali-
ty data collector components, have their own configuration data which is used for calcu-
lating and normalizing the quality data values. The results of the calculations and nor-
malisations are called analysis result values. After the calculations and normalizations,
the analysis result values are sent to the quality data handler aggregator component.
Figure 10 presents the quality data handler components used in the proof of concept.
The quality data handler components are marked green. Figure 10 also presents the data
flow between the quality data handler components. The quality data handler compo-
nents that were implemented to the proof of concept are build result, code volume and
code duplication quality data handler components. These quality data handler compo-
nents were selected because it is quite easy to produce the needed metrics in the contin-
uous integration server from the different software products that are built in the same
server.
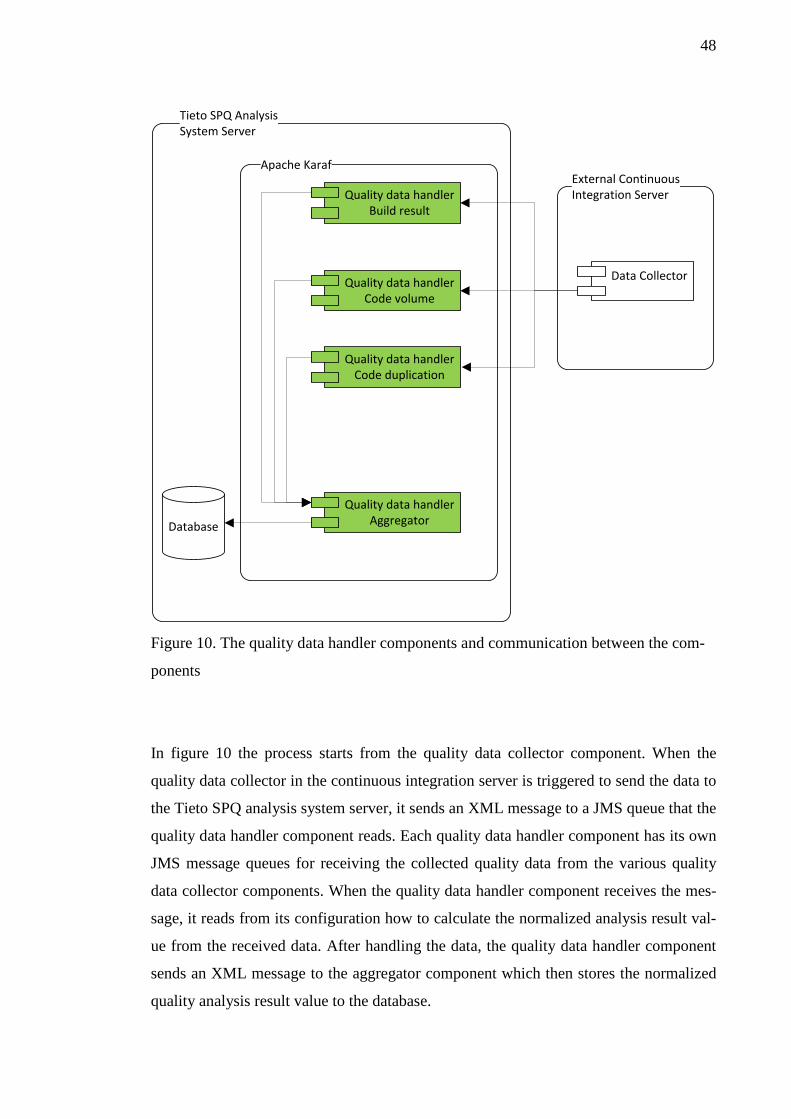
48
Tieto SPQ Analysis System Server
Apache Karaf
Database
External Continuous Integration Server
Data Collector
Quality data handlerAggregator
Quality data handlerBuild result
Quality data handlerCode volume
Quality data handlerCode duplication
Figure 10. The quality data handler components and communication between the com-
ponents
In figure 10 the process starts from the quality data collector component. When the
quality data collector in the continuous integration server is triggered to send the data to
the Tieto SPQ analysis system server, it sends an XML message to a JMS queue that the
quality data handler component reads. Each quality data handler component has its own
JMS message queues for receiving the collected quality data from the various quality
data collector components. When the quality data handler component receives the mes-
sage, it reads from its configuration how to calculate the normalized analysis result val-
ue from the received data. After handling the data, the quality data handler component
sends an XML message to the aggregator component which then stores the normalized
quality analysis result value to the database.
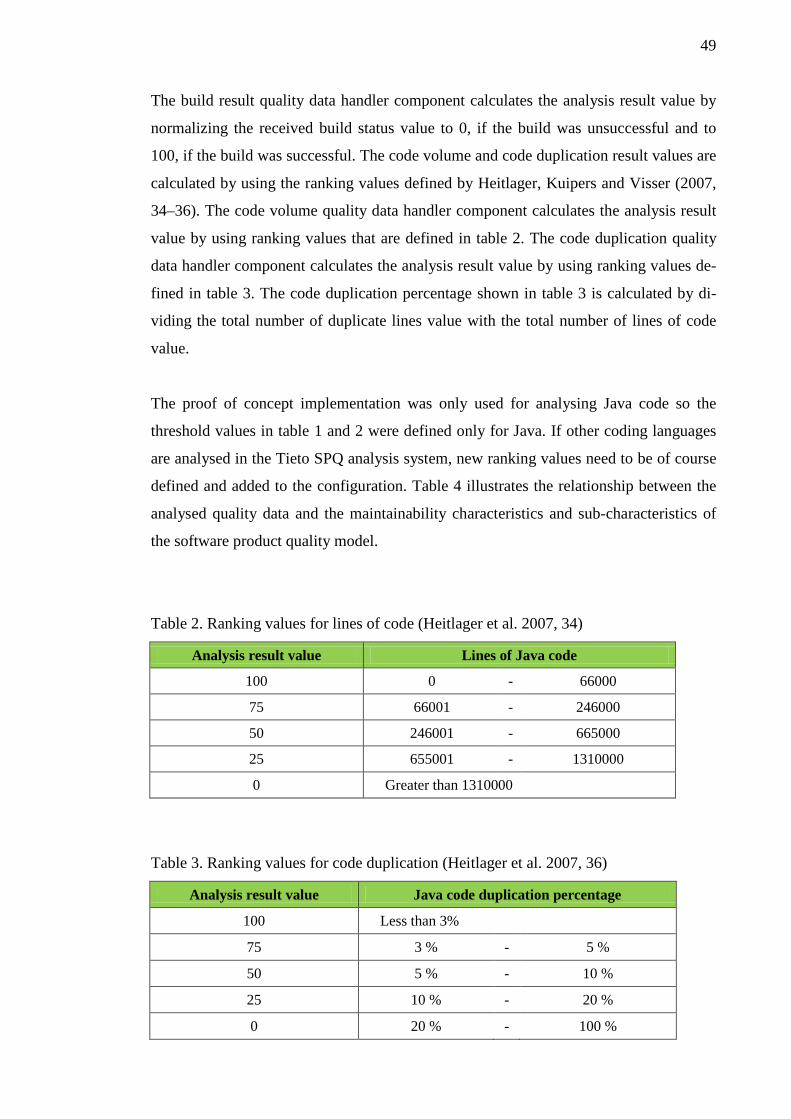
49
The build result quality data handler component calculates the analysis result value by
normalizing the received build status value to 0, if the build was unsuccessful and to
100, if the build was successful. The code volume and code duplication result values are
calculated by using the ranking values defined by Heitlager, Kuipers and Visser (2007,
34–36). The code volume quality data handler component calculates the analysis result
value by using ranking values that are defined in table 2. The code duplication quality
data handler component calculates the analysis result value by using ranking values de-
fined in table 3. The code duplication percentage shown in table 3 is calculated by di-
viding the total number of duplicate lines value with the total number of lines of code
value.
The proof of concept implementation was only used for analysing Java code so the
threshold values in table 1 and 2 were defined only for Java. If other coding languages
are analysed in the Tieto SPQ analysis system, new ranking values need to be of course
defined and added to the configuration. Table 4 illustrates the relationship between the
analysed quality data and the maintainability characteristics and sub-characteristics of
the software product quality model.
Table 2. Ranking values for lines of code (Heitlager et al. 2007, 34)
Analysis result value Lines of Java code
100 0 - 66000
75 66001 - 246000
50 246001 - 665000
25 655001 - 1310000
0 Greater than 1310000
Table 3. Ranking values for code duplication (Heitlager et al. 2007, 36)
Analysis result value Java code duplication percentage
100 Less than 3%
75 3 % - 5 %
50 5 % - 10 %
25 10 % - 20 %
0 20 % - 100 %
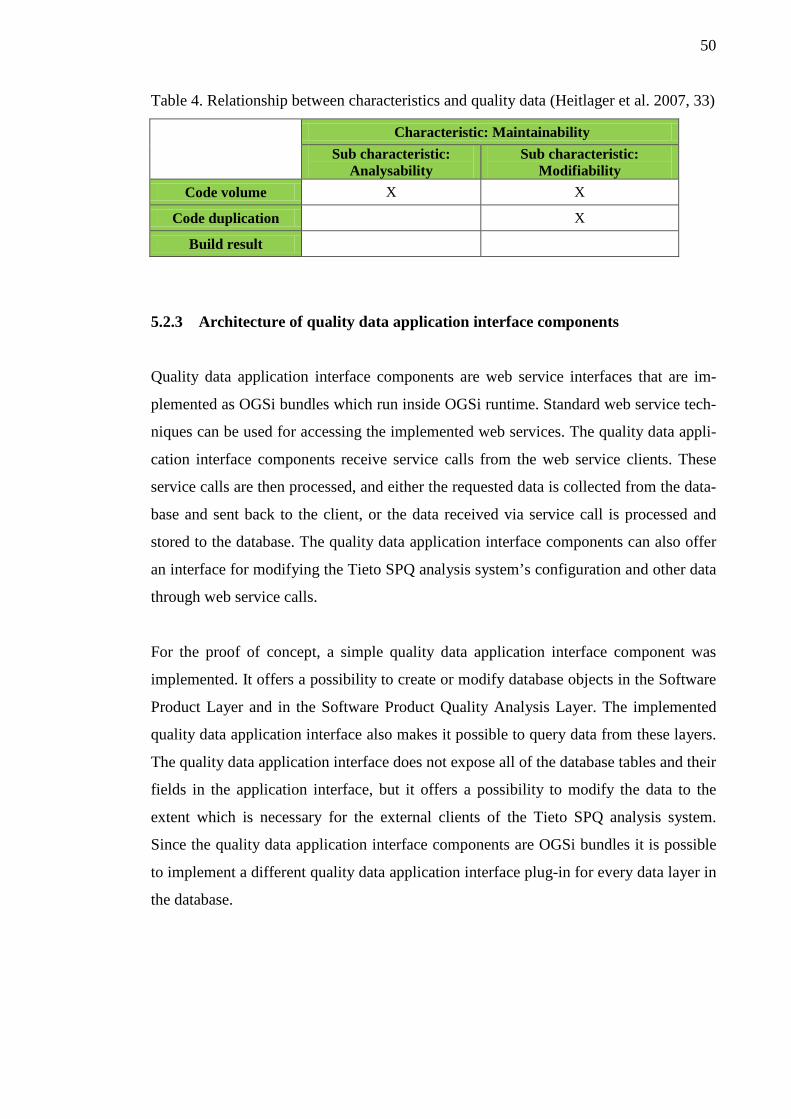
50
Table 4. Relationship between characteristics and quality data (Heitlager et al. 2007, 33)
Characteristic: Maintainability
Sub characteristic:
Analysability Sub characteristic:
Modifiability Code volume X X
Code duplication X
Build result
5.2.3 Architecture of quality data application interface components
Quality data application interface components are web service interfaces that are im-
plemented as OGSi bundles which run inside OGSi runtime. Standard web service tech-
niques can be used for accessing the implemented web services. The quality data appli-
cation interface components receive service calls from the web service clients. These
service calls are then processed, and either the requested data is collected from the data-
base and sent back to the client, or the data received via service call is processed and
stored to the database. The quality data application interface components can also offer
an interface for modifying the Tieto SPQ analysis system’s configuration and other data
through web service calls.
For the proof of concept, a simple quality data application interface component was
implemented. It offers a possibility to create or modify database objects in the Software
Product Layer and in the Software Product Quality Analysis Layer. The implemented
quality data application interface also makes it possible to query data from these layers.
The quality data application interface does not expose all of the database tables and their
fields in the application interface, but it offers a possibility to modify the data to the
extent which is necessary for the external clients of the Tieto SPQ analysis system.
Since the quality data application interface components are OGSi bundles it is possible
to implement a different quality data application interface plug-in for every data layer in
the database.
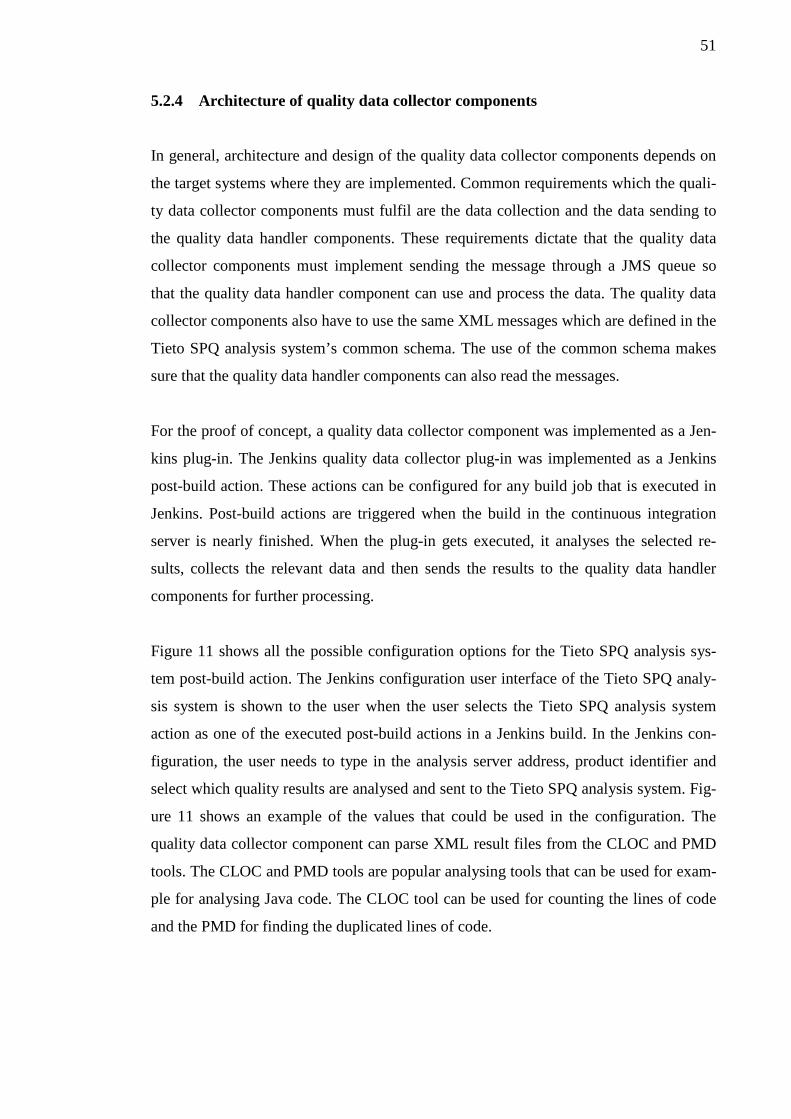
51
5.2.4 Architecture of quality data collector components
In general, architecture and design of the quality data collector components depends on
the target systems where they are implemented. Common requirements which the quali-
ty data collector components must fulfil are the data collection and the data sending to
the quality data handler components. These requirements dictate that the quality data
collector components must implement sending the message through a JMS queue so
that the quality data handler component can use and process the data. The quality data
collector components also have to use the same XML messages which are defined in the
Tieto SPQ analysis system’s common schema. The use of the common schema makes
sure that the quality data handler components can also read the messages.
For the proof of concept, a quality data collector component was implemented as a Jen-
kins plug-in. The Jenkins quality data collector plug-in was implemented as a Jenkins
post-build action. These actions can be configured for any build job that is executed in
Jenkins. Post-build actions are triggered when the build in the continuous integration
server is nearly finished. When the plug-in gets executed, it analyses the selected re-
sults, collects the relevant data and then sends the results to the quality data handler
components for further processing.
Figure 11 shows all the possible configuration options for the Tieto SPQ analysis sys-
tem post-build action. The Jenkins configuration user interface of the Tieto SPQ analy-
sis system is shown to the user when the user selects the Tieto SPQ analysis system
action as one of the executed post-build actions in a Jenkins build. In the Jenkins con-
figuration, the user needs to type in the analysis server address, product identifier and
select which quality results are analysed and sent to the Tieto SPQ analysis system. Fig-
ure 11 shows an example of the values that could be used in the configuration. The
quality data collector component can parse XML result files from the CLOC and PMD
tools. The CLOC and PMD tools are popular analysing tools that can be used for exam-
ple for analysing Java code. The CLOC tool can be used for counting the lines of code
and the PMD for finding the duplicated lines of code.
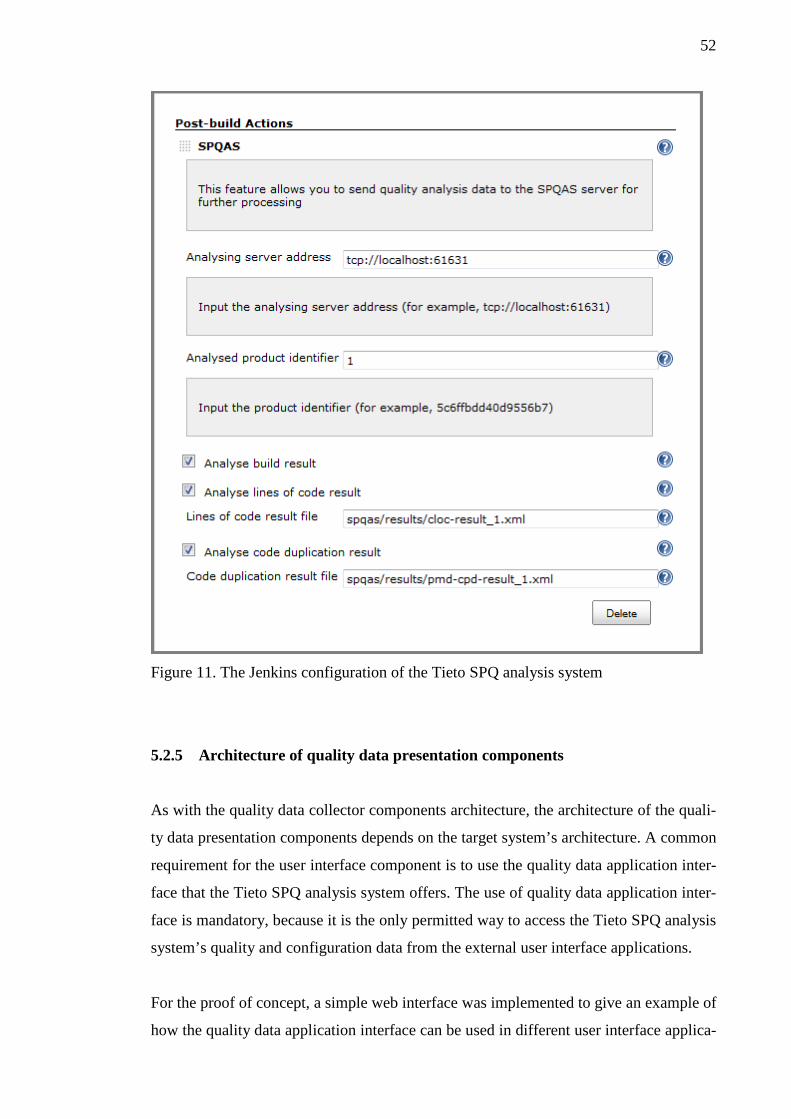
52
Figure 11. The Jenkins configuration of the Tieto SPQ analysis system
5.2.5 Architecture of quality data presentation components
As with the quality data collector components architecture, the architecture of the quali-
ty data presentation components depends on the target system’s architecture. A common
requirement for the user interface component is to use the quality data application inter-
face that the Tieto SPQ analysis system offers. The use of quality data application inter-
face is mandatory, because it is the only permitted way to access the Tieto SPQ analysis
system’s quality and configuration data from the external user interface applications.
For the proof of concept, a simple web interface was implemented to give an example of
how the quality data application interface can be used in different user interface applica-
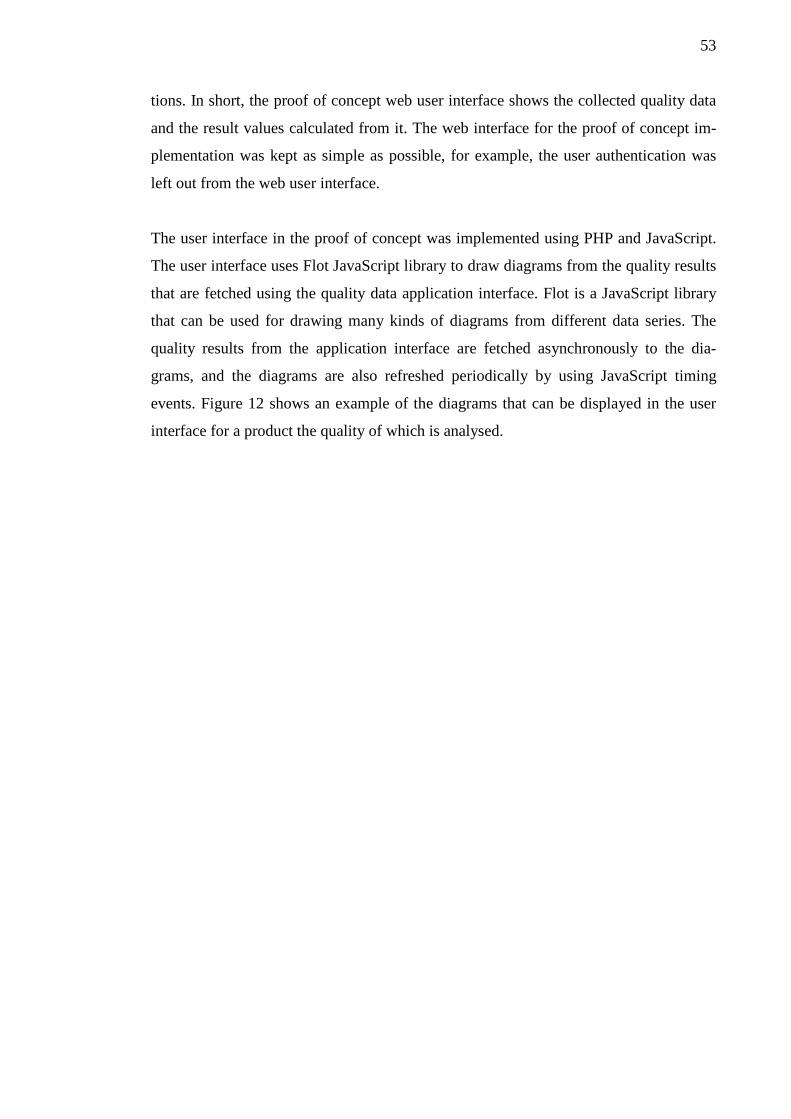
53
tions. In short, the proof of concept web user interface shows the collected quality data
and the result values calculated from it. The web interface for the proof of concept im-
plementation was kept as simple as possible, for example, the user authentication was
left out from the web user interface.
The user interface in the proof of concept was implemented using PHP and JavaScript.
The user interface uses Flot JavaScript library to draw diagrams from the quality results
that are fetched using the quality data application interface. Flot is a JavaScript library
that can be used for drawing many kinds of diagrams from different data series. The
quality results from the application interface are fetched asynchronously to the dia-
grams, and the diagrams are also refreshed periodically by using JavaScript timing
events. Figure 12 shows an example of the diagrams that can be displayed in the user
interface for a product the quality of which is analysed.

54
Figure 12. User interface diagrams of the Tieto SPQ analysis system
5.3 Quality data collected by using the proof of concept implementation
The Tieto SPQ analysis system proof of concept implementation collects build result,
code volume and code duplication quality data. The collection of quality data is activat-
ed whenever a software product build is triggered in the Jenkins continuous integration
server, as was explained in the chapter 5.2.2 that specified the architecture of the quality
data handler components.
The proof of concept implementation of the Tieto SPQ analysis system was configured
to collect data from one software product. The quality data collection period took one
week. During this period, the software product was developed quite rapidly by few de-
velopers to get the next software release ready. After every round of quality analysis
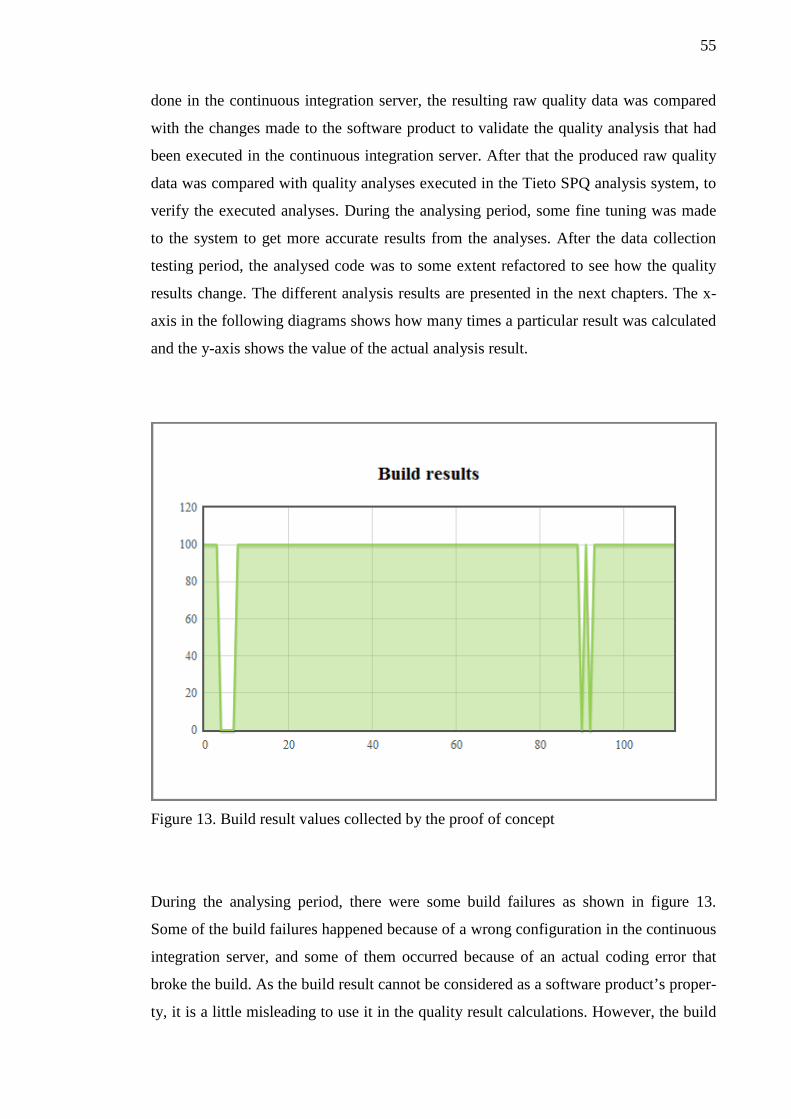
55
done in the continuous integration server, the resulting raw quality data was compared
with the changes made to the software product to validate the quality analysis that had
been executed in the continuous integration server. After that the produced raw quality
data was compared with quality analyses executed in the Tieto SPQ analysis system, to
verify the executed analyses. During the analysing period, some fine tuning was made
to the system to get more accurate results from the analyses. After the data collection
testing period, the analysed code was to some extent refactored to see how the quality
results change. The different analysis results are presented in the next chapters. The x-
axis in the following diagrams shows how many times a particular result was calculated
and the y-axis shows the value of the actual analysis result.
Figure 13. Build result values collected by the proof of concept
During the analysing period, there were some build failures as shown in figure 13.
Some of the build failures happened because of a wrong configuration in the continuous
integration server, and some of them occurred because of an actual coding error that
broke the build. As the build result cannot be considered as a software product’s proper-
ty, it is a little misleading to use it in the quality result calculations. However, the build
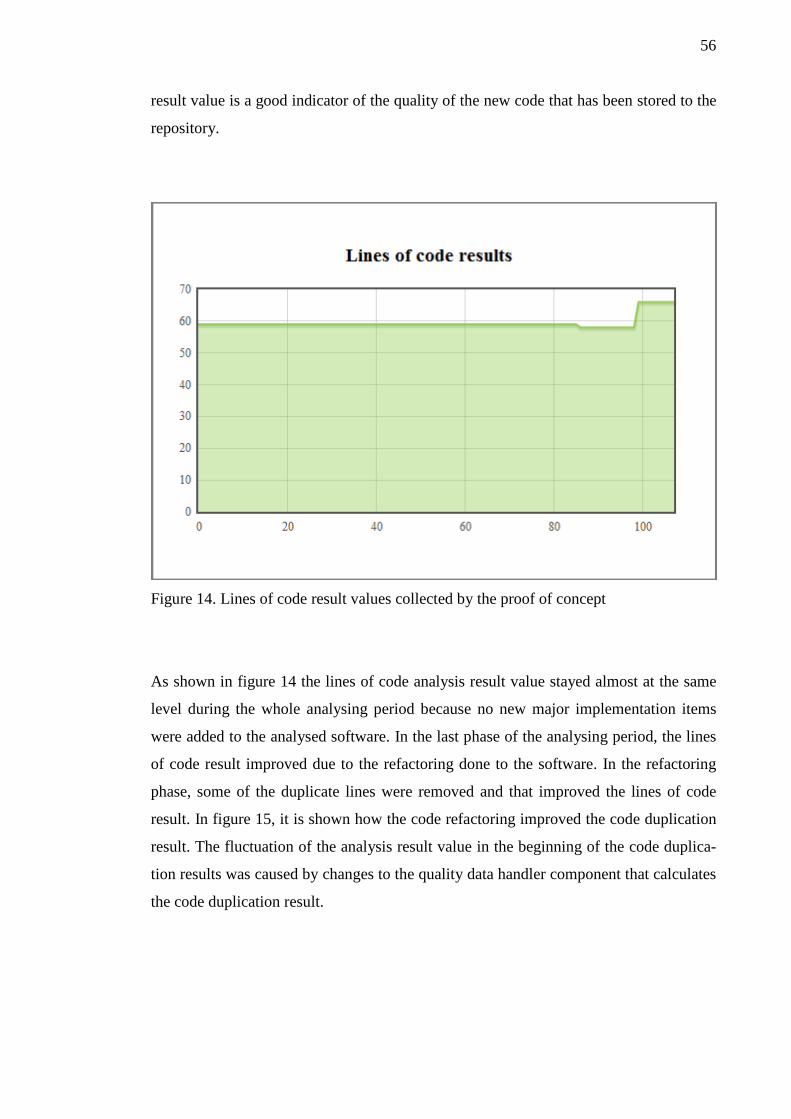
56
result value is a good indicator of the quality of the new code that has been stored to the
repository.
Figure 14. Lines of code result values collected by the proof of concept
As shown in figure 14 the lines of code analysis result value stayed almost at the same
level during the whole analysing period because no new major implementation items
were added to the analysed software. In the last phase of the analysing period, the lines
of code result improved due to the refactoring done to the software. In the refactoring
phase, some of the duplicate lines were removed and that improved the lines of code
result. In figure 15, it is shown how the code refactoring improved the code duplication
result. The fluctuation of the analysis result value in the beginning of the code duplica-
tion results was caused by changes to the quality data handler component that calculates
the code duplication result.
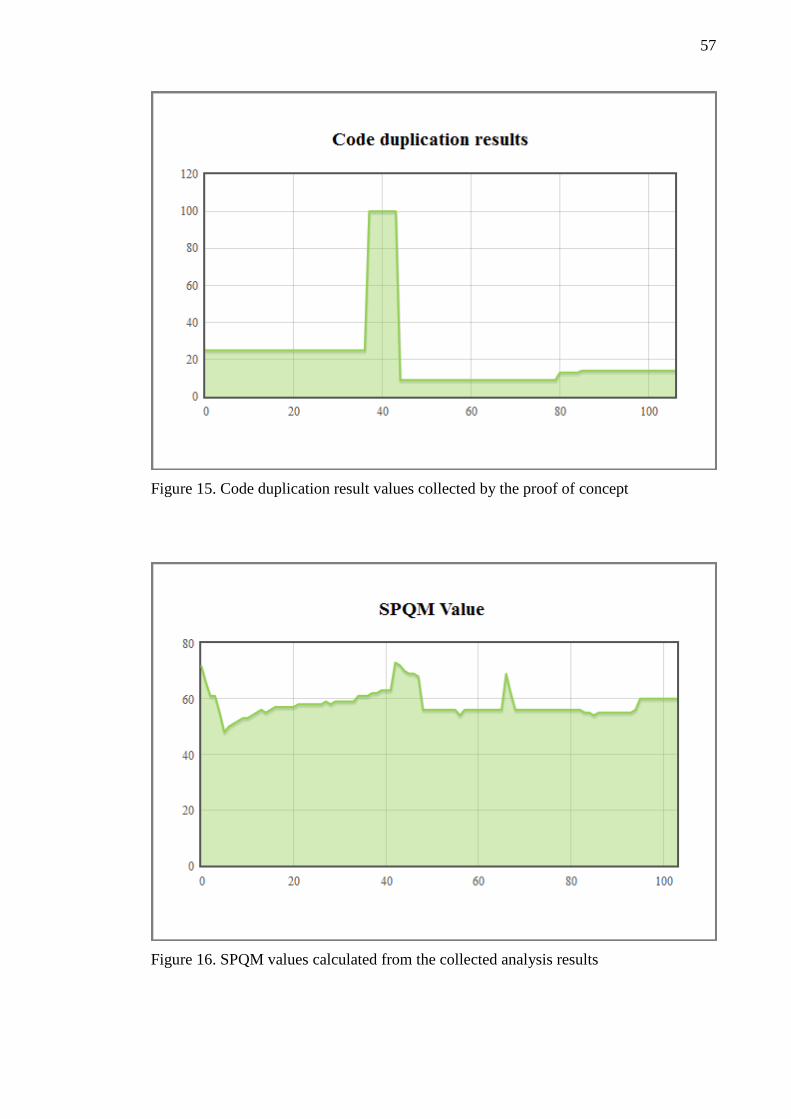
57
Figure 15. Code duplication result values collected by the proof of concept
Figure 16. SPQM values calculated from the collected analysis results
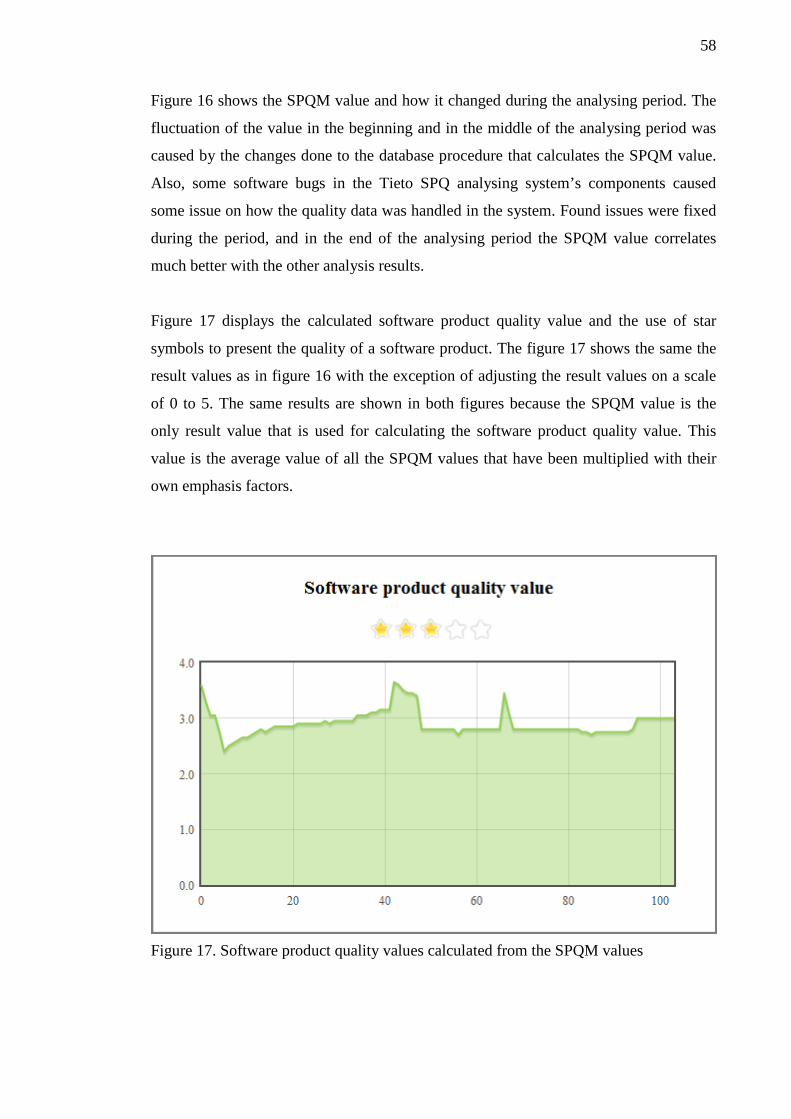
58
Figure 16 shows the SPQM value and how it changed during the analysing period. The
fluctuation of the value in the beginning and in the middle of the analysing period was
caused by the changes done to the database procedure that calculates the SPQM value.
Also, some software bugs in the Tieto SPQ analysing system’s components caused
some issue on how the quality data was handled in the system. Found issues were fixed
during the period, and in the end of the analysing period the SPQM value correlates
much better with the other analysis results.
Figure 17 displays the calculated software product quality value and the use of star
symbols to present the quality of a software product. The figure 17 shows the same the
result values as in figure 16 with the exception of adjusting the result values on a scale
of 0 to 5. The same results are shown in both figures because the SPQM value is the
only result value that is used for calculating the software product quality value. This
value is the average value of all the SPQM values that have been multiplied with their
own emphasis factors.
Figure 17. Software product quality values calculated from the SPQM values
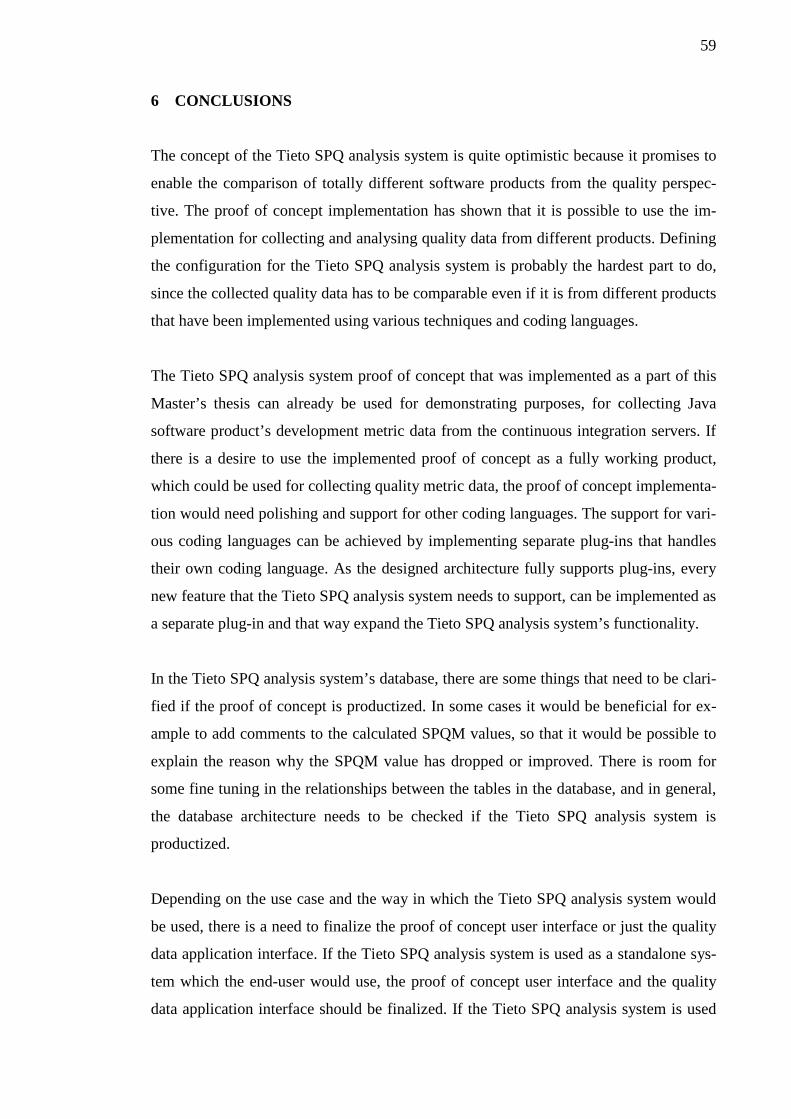
59
6 CONCLUSIONS
The concept of the Tieto SPQ analysis system is quite optimistic because it promises to
enable the comparison of totally different software products from the quality perspec-
tive. The proof of concept implementation has shown that it is possible to use the im-
plementation for collecting and analysing quality data from different products. Defining
the configuration for the Tieto SPQ analysis system is probably the hardest part to do,
since the collected quality data has to be comparable even if it is from different products
that have been implemented using various techniques and coding languages.
The Tieto SPQ analysis system proof of concept that was implemented as a part of this
Master’s thesis can already be used for demonstrating purposes, for collecting Java
software product’s development metric data from the continuous integration servers. If
there is a desire to use the implemented proof of concept as a fully working product,
which could be used for collecting quality metric data, the proof of concept implementa-
tion would need polishing and support for other coding languages. The support for vari-
ous coding languages can be achieved by implementing separate plug-ins that handles
their own coding language. As the designed architecture fully supports plug-ins, every
new feature that the Tieto SPQ analysis system needs to support, can be implemented as
a separate plug-in and that way expand the Tieto SPQ analysis system’s functionality.
In the Tieto SPQ analysis system’s database, there are some things that need to be clari-
fied if the proof of concept is productized. In some cases it would be beneficial for ex-
ample to add comments to the calculated SPQM values, so that it would be possible to
explain the reason why the SPQM value has dropped or improved. There is room for
some fine tuning in the relationships between the tables in the database, and in general,
the database architecture needs to be checked if the Tieto SPQ analysis system is
productized.
Depending on the use case and the way in which the Tieto SPQ analysis system would
be used, there is a need to finalize the proof of concept user interface or just the quality
data application interface. If the Tieto SPQ analysis system is used as a standalone sys-
tem which the end-user would use, the proof of concept user interface and the quality
data application interface should be finalized. If the Tieto SPQ analysis system is used
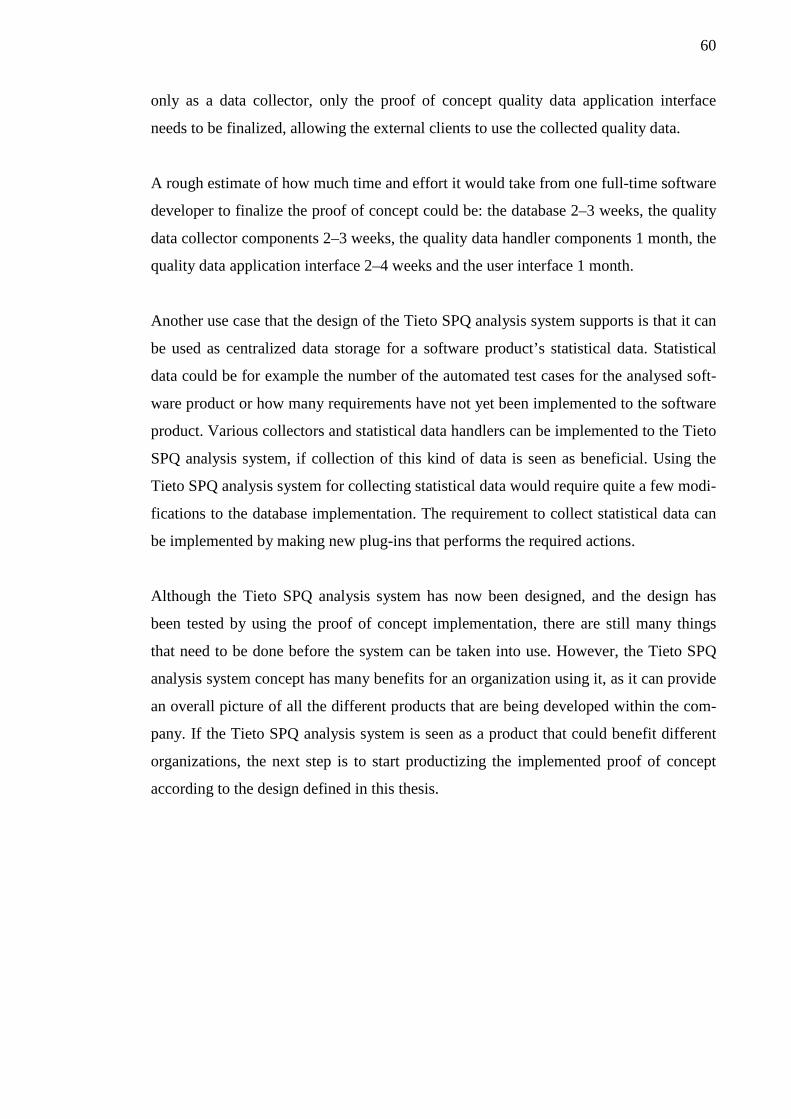
60
only as a data collector, only the proof of concept quality data application interface
needs to be finalized, allowing the external clients to use the collected quality data.
A rough estimate of how much time and effort it would take from one full-time software
developer to finalize the proof of concept could be: the database 2–3 weeks, the quality
data collector components 2–3 weeks, the quality data handler components 1 month, the
quality data application interface 2–4 weeks and the user interface 1 month.
Another use case that the design of the Tieto SPQ analysis system supports is that it can
be used as centralized data storage for a software product’s statistical data. Statistical
data could be for example the number of the automated test cases for the analysed soft-
ware product or how many requirements have not yet been implemented to the software
product. Various collectors and statistical data handlers can be implemented to the Tieto
SPQ analysis system, if collection of this kind of data is seen as beneficial. Using the
Tieto SPQ analysis system for collecting statistical data would require quite a few modi-
fications to the database implementation. The requirement to collect statistical data can
be implemented by making new plug-ins that performs the required actions.
Although the Tieto SPQ analysis system has now been designed, and the design has
been tested by using the proof of concept implementation, there are still many things
that need to be done before the system can be taken into use. However, the Tieto SPQ
analysis system concept has many benefits for an organization using it, as it can provide
an overall picture of all the different products that are being developed within the com-
pany. If the Tieto SPQ analysis system is seen as a product that could benefit different
organizations, the next step is to start productizing the implemented proof of concept
according to the design defined in this thesis.
61
REFERENCES
Apache Ant. 2012. Welcome web page. Printed on 7.10.2012. http://ant.apache.org/ Apache Subversion. 2012. Welcome web page. Printed on 7.10.2012. http://subversion.apache.org/ Apache Maven. 2012. Welcome web page. Printed on 7.10.2012. http://maven.apache.org/ Fowler, M. 2006. Continuous integration. Printed on 22.8.2012. http://martinfowler.com/articles/continuousIntegration.html Fowler, M. 2012. Xunit. Printed on 7.10.2012. http://www.martinfowler.com/bliki/Xunit.html Heitlager, I. Kuipers, T. & Visser J. 2007. A practical model for measuring maintaina-bility. In Proceedings of the 6th International Conference on Quality of Information and Communications Technology. Pages 30–39. IEEE Computer Society Press. Printed on 7.10.2012. http://www.sig.eu/blobs/Research/Scientific%20publication/HeitlagerKuipersVisser-Quatic2007_08.pdf Immonen, M. 2009. Tieto Software Product Quality Analysis System. Degree Programme in Information Technology. Tampere University of Applied Scienc-es. Master’s thesis. Printed on 13.3.2011. http://urn.fi/URN:NBN:fi:amk-201003042737 ISO/IEC FDIS 25000:2005 International standard - Software engineering - Software product Quality Requirements and Evaluation (SQuaRE) - Guide to SQuaRE ISO/IEC FDIS 25010:2010 International standard - Software engineering - Software product Quality Requirements and Evaluation (SQuaRE) – System and Software Quali-ty Models ISO/IEC FDIS 25020:2007 International standard - Software Engineering - Software quality requirements and evaluation (SQuaRE) - Quality measurement - Measurement reference model and guide Jenkins. 2012. Architecture page. Printed on 7.10.2012. https://wiki.jenkins-ci.org Jenkins. 2012. Meet Jenkins page. Printed on 13.10.2012. https://wiki.jenkins-ci.org/display/JENKINS/Meet+Jenkins Jenkins. 2012. Plug-in tutorial wiki page. Printed on 7.10.2012. https://wiki.jenkins-ci.org/display/JENKINS/Plugin+tutorial Smart, J. 2011. Jenkins The Definitive Guide. Printed on 13.10.2012. http://www.wakaleo.com/books/jenkins-the-definitive-guide
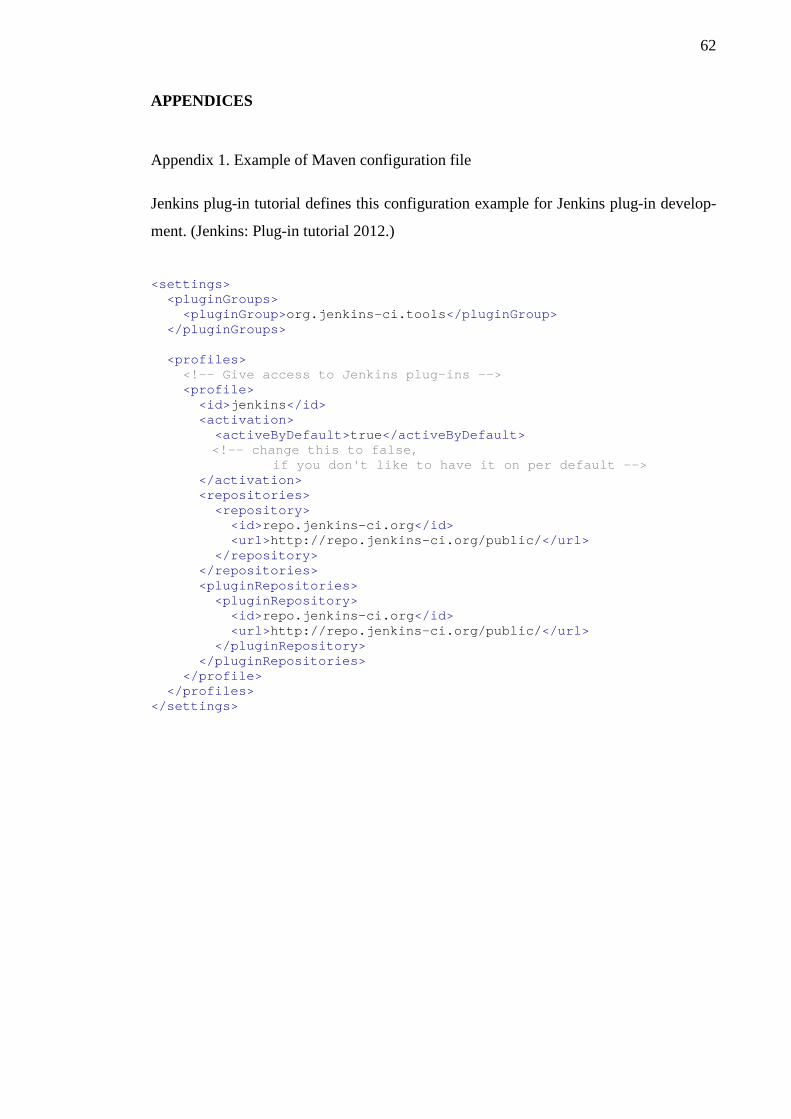
62
APPENDICES
Appendix 1. Example of Maven configuration file
Jenkins plug-in tutorial defines this configuration example for Jenkins plug-in develop-
ment. (Jenkins: Plug-in tutorial 2012.)
<settings> <pluginGroups> <pluginGroup>org.jenkins-ci.tools</pluginGroup> </pluginGroups> <profiles> <!-- Give access to Jenkins plug-ins --> <profile> <id>jenkins</id> <activation> <activeByDefault>true</activeByDefault> <!-- change this to false, if you don't like to have it on per default --> </activation> <repositories> <repository> <id>repo.jenkins-ci.org</id> <url>http://repo.jenkins-ci.org/public/</url> </repository> </repositories> <pluginRepositories> <pluginRepository> <id>repo.jenkins-ci.org</id> <url>http://repo.jenkins-ci.org/public/</url> </pluginRepository> </pluginRepositories> </profile> </profiles> </settings>
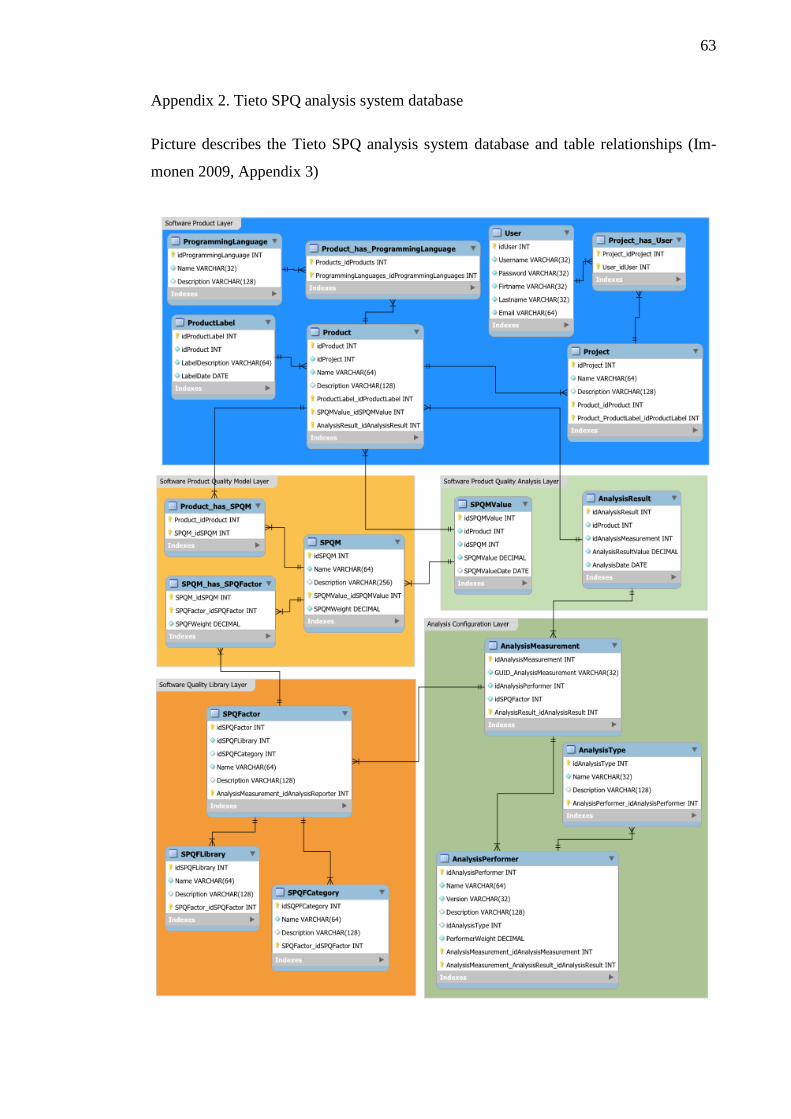
63
Appendix 2. Tieto SPQ analysis system database
Picture describes the Tieto SPQ analysis system database and table relationships (Im-
monen 2009, Appendix 3)