Embed Size (px)
Citation preview
1
Human Impact ToleranceAnd the STAR Helmet Rating
Stefan M. Duma and Steven RowsonSchool of Biomedical Engineering and Sciences
Virginia Tech – Wake Forest University
January 17, 2012
Presentation Outline• Part 1: Injury Biomechanics Background
– Reducing injuries in auto-safety, sports, military
• Part 2: STAR Helmet Rating Details– Review of exposure and risk analysis
• Part 3: Youth Football Data
2
• No financial interest in SIMBEX, HITS, or any other helmet related sensor or product
• No financial interest in Riddell, or any helmet manufacturer
• No helmet expert witness consulting
• Speaking fees donated to buy new helmets for youth teams in south-west Virginia.
Financial Disclaimer
Funding Sources
National Institutes of HealthNational Inst. Of Child Health & Human Development, R01HD048638
Department of TransportationNational Highway Traffic Safety Administration
Department of DefenseUS Medical Research and Material Command
Toyota Motor CorporationToyota Central Research and Development Labs
3
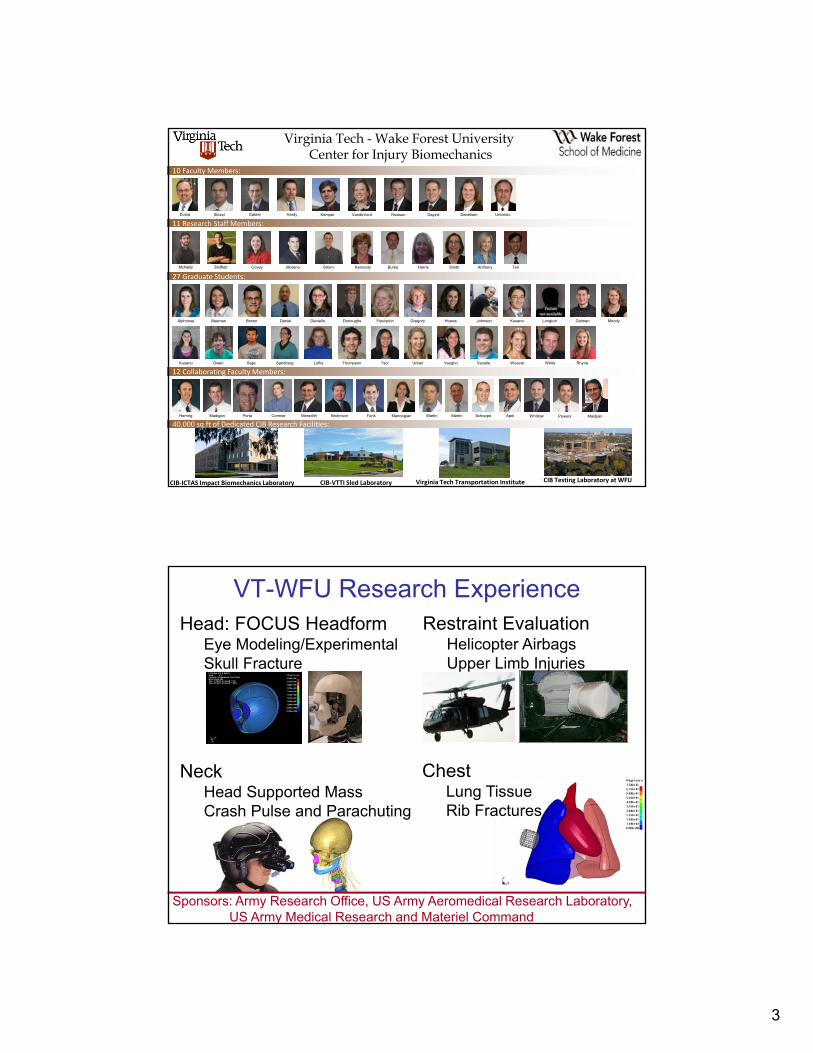
Virginia Tech - Wake Forest UniversityCenter for Injury Biomechanics
10 Faculty Members:
11 Research Staff Members:
27 Graduate Students:
12 Collaborating Faculty Members:
CIB‐ICTAS Impact Biomechanics Laboratory CIB‐VTTI Sled Laboratory CIB Testing Laboratory at WFU
Duma Gabler GayzikHardyStitzel VandeVordKemper Rowson Danelson
McNally Shifflett Covey Moreno Strom Kennedy Burke Harris Smith Anthony Tan
Alphonse Beeman Brown Daniel Daniello Donoughe Fievisohn Gregory Howes Johnson Kusano
Kusano Owen Sajja Sandberg Loftis Thompson Tsoi Urban Vaughn Vavalle Weaver
Herring Madigan Porta Cormier Meredith Brolinson Funk Manoogian Martin Martin Schoppe Apel
White
Longton
Virginia Tech Transportation Institute
Golman
Rhyne
Moody
40,000 sq ft of Dedicated CIB Research Facilities:
Untaroiu
Whitlow Powers Maldjian
VT-WFU Research ExperienceHead: FOCUS Headform−Eye Modeling/Experimental−Skull Fracture
Neck−Head Supported Mass−Crash Pulse and Parachuting
Restraint Evaluation−Helicopter Airbags−Upper Limb Injuries
Sponsors: Army Research Office, US Army Aeromedical Research Laboratory, US Army Medical Research and Materiel Command
Chest− Lung Tissue−Rib Fractures
4
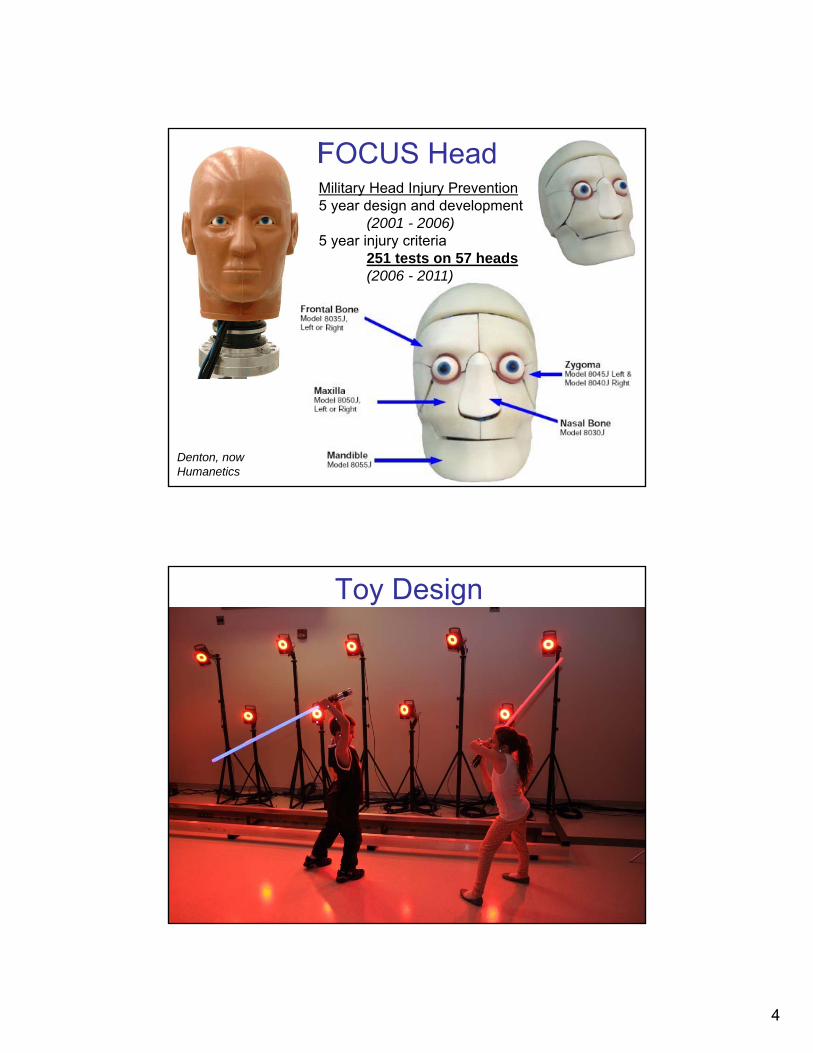
FOCUS Head
Denton, nowHumanetics
Military Head Injury Prevention5 year design and development
(2001 - 2006)5 year injury criteria
251 tests on 57 heads(2006 - 2011)
Toy Design
5
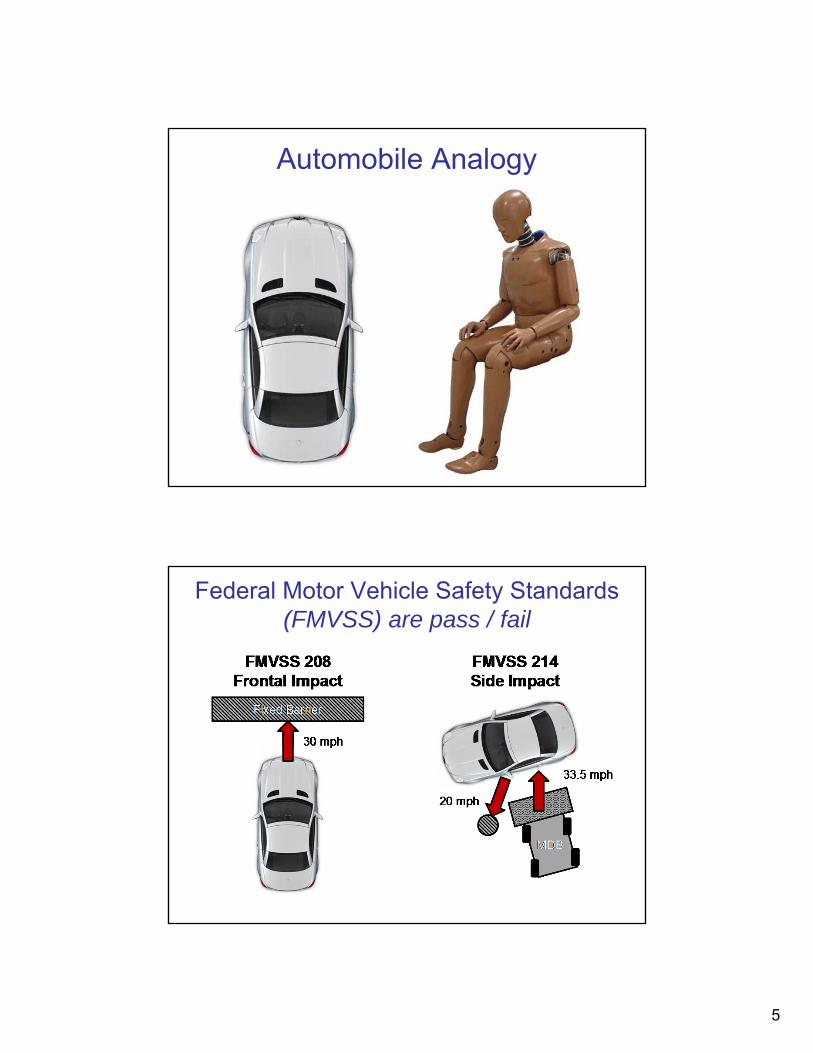
Automobile Analogy
Federal Motor Vehicle Safety Standards(FMVSS) are pass / fail
6
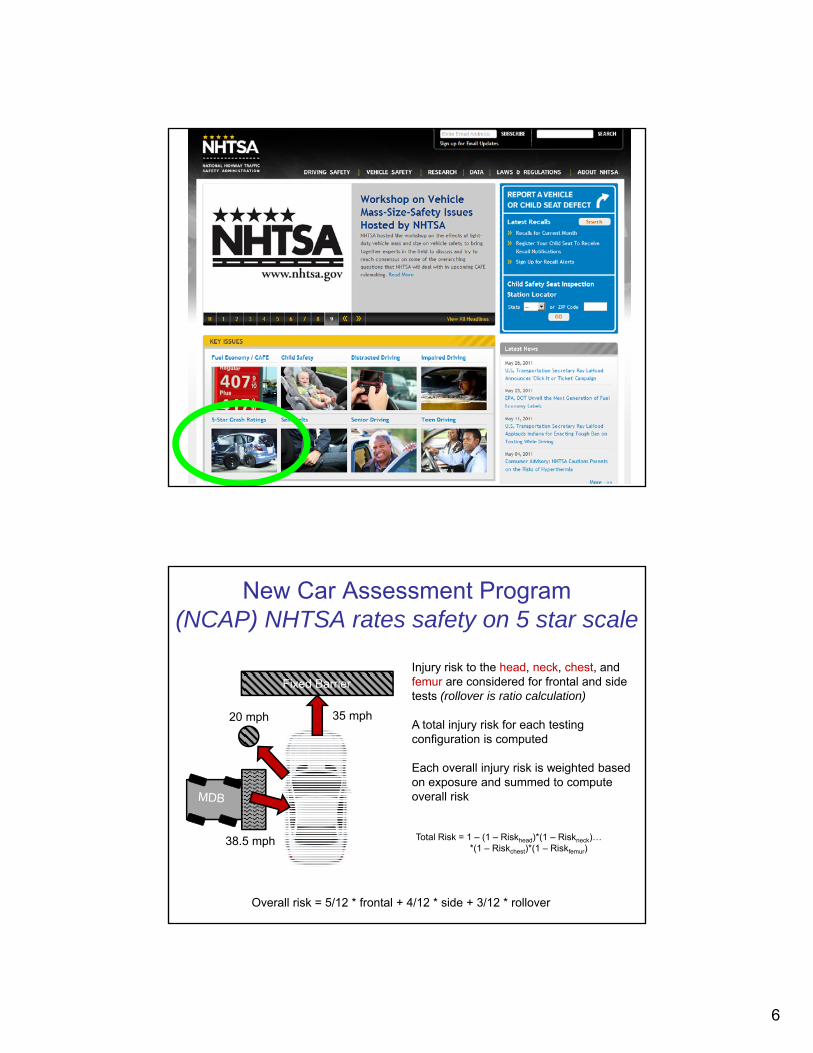
New Car Assessment Program(NCAP) NHTSA rates safety on 5 star scale
35 mph
Fixed Barrier
38.5 mph
20 mph
Injury risk to the head, neck, chest, and femur are considered for frontal and side tests (rollover is ratio calculation)
A total injury risk for each testing configuration is computed
Each overall injury risk is weighted based on exposure and summed to compute overall risk
Overall risk = 5/12 * frontal + 4/12 * side + 3/12 * rollover
Total Risk = 1 – (1 – Riskhead)*(1 – Riskneck)…*(1 – Riskchest)*(1 – Riskfemur)
7
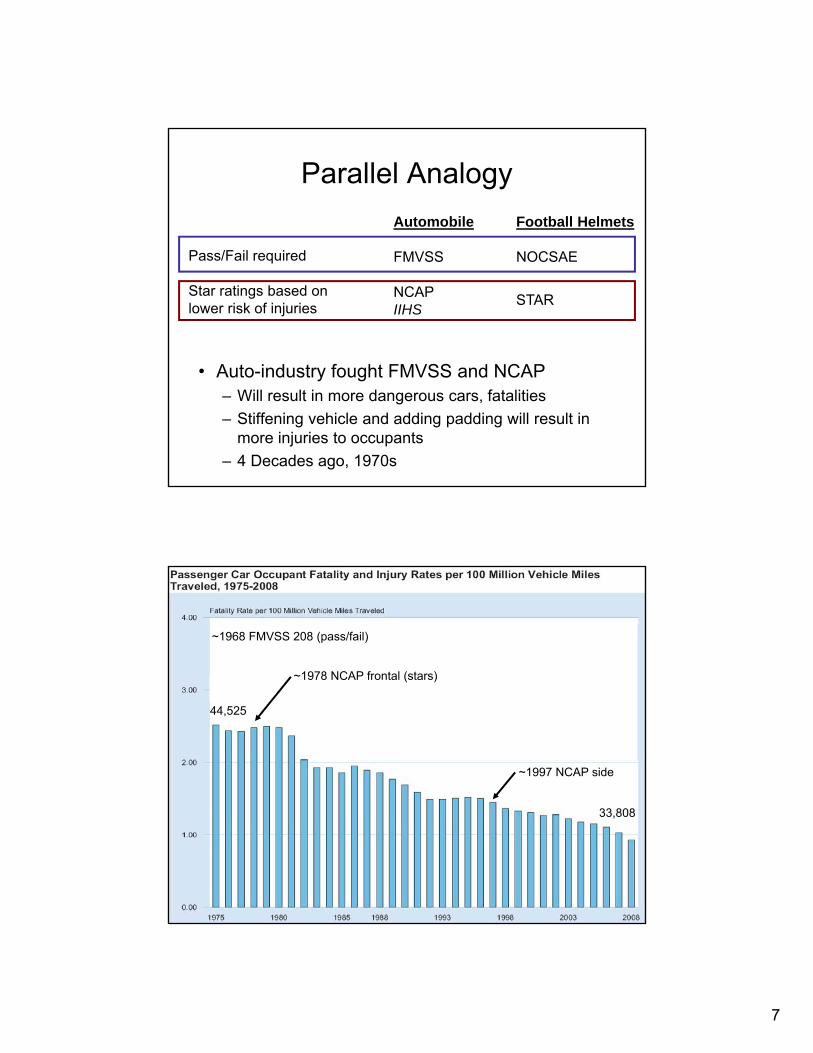
Parallel Analogy
• Auto-industry fought FMVSS and NCAP– Will result in more dangerous cars, fatalities
– Stiffening vehicle and adding padding will result in more injuries to occupants
– 4 Decades ago, 1970s
Automobile
FMVSS
NCAPIIHS
Football Helmets
NOCSAE
STAR
Pass/Fail required
Star ratings based on lower risk of injuries
44,525
33,808
~1968 FMVSS 208 (pass/fail)
~1978 NCAP frontal (stars)
~1997 NCAP side
8
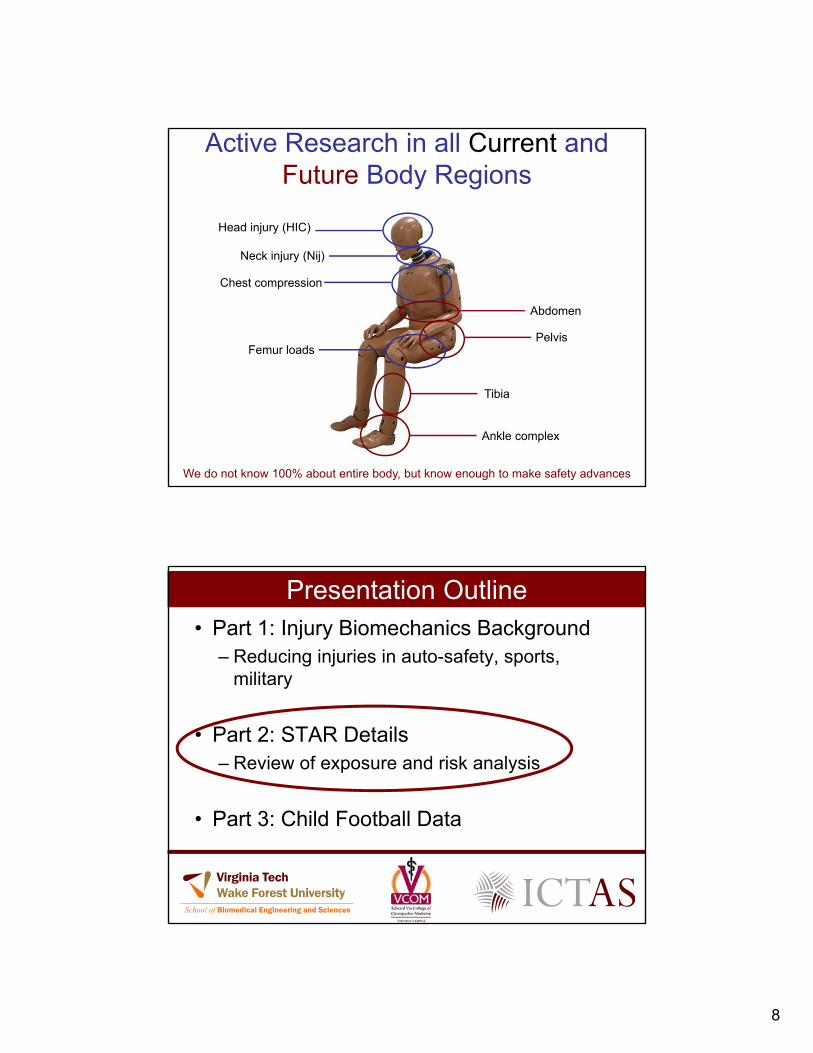
Active Research in all Current and Future Body Regions
We do not know 100% about entire body, but know enough to make safety advances
Head injury (HIC)
Neck injury (Nij)
Chest compression
Abdomen
Pelvis
Tibia
Ankle complex
Femur loads
Presentation Outline• Part 1: Injury Biomechanics Background
– Reducing injuries in auto-safety, sports, military
• Part 2: STAR Details– Review of exposure and risk analysis
• Part 3: Child Football Data
9
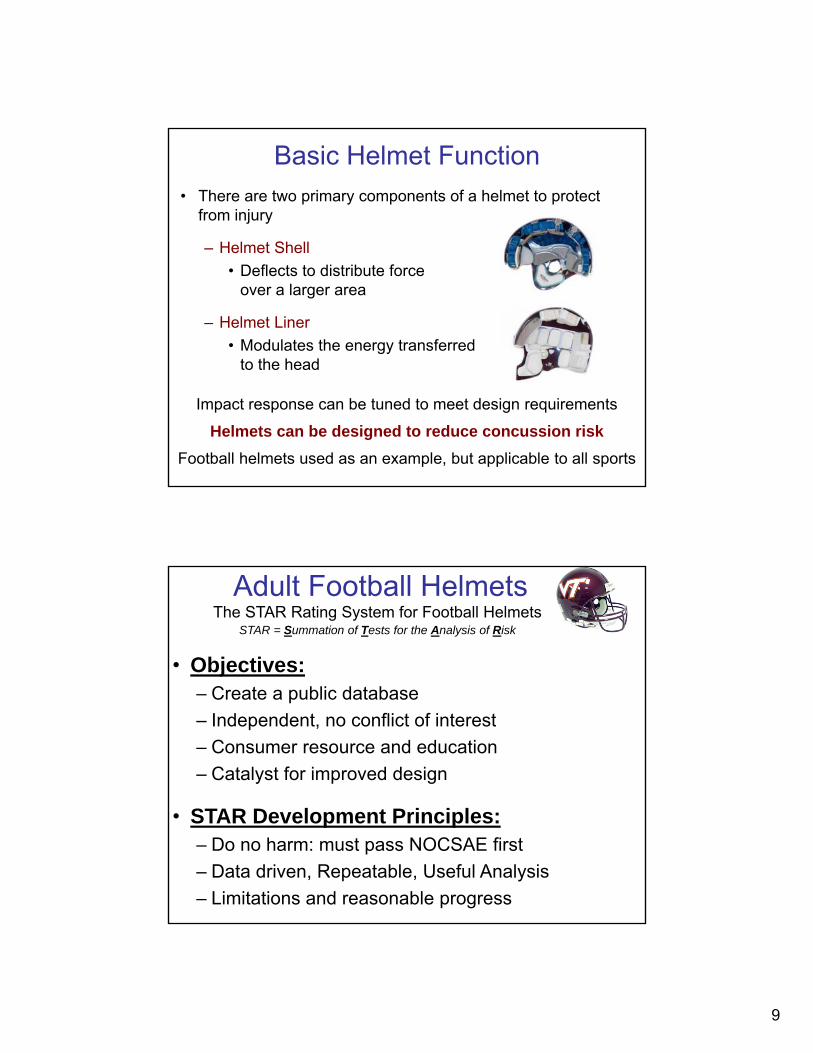
Basic Helmet Function• There are two primary components of a helmet to protect
from injury
– Helmet Shell
• Deflects to distribute forceover a larger area
– Helmet Liner
• Modulates the energy transferredto the head
Impact response can be tuned to meet design requirements
Helmets can be designed to reduce concussion risk
Football helmets used as an example, but applicable to all sports
• Objectives:– Create a public database
– Independent, no conflict of interest
– Consumer resource and education
– Catalyst for improved design
Adult Football HelmetsThe STAR Rating System for Football Helmets
STAR = Summation of Tests for the Analysis of Risk
• STAR Development Principles:– Do no harm: must pass NOCSAE first
– Data driven, Repeatable, Useful Analysis
– Limitations and reasonable progress
10
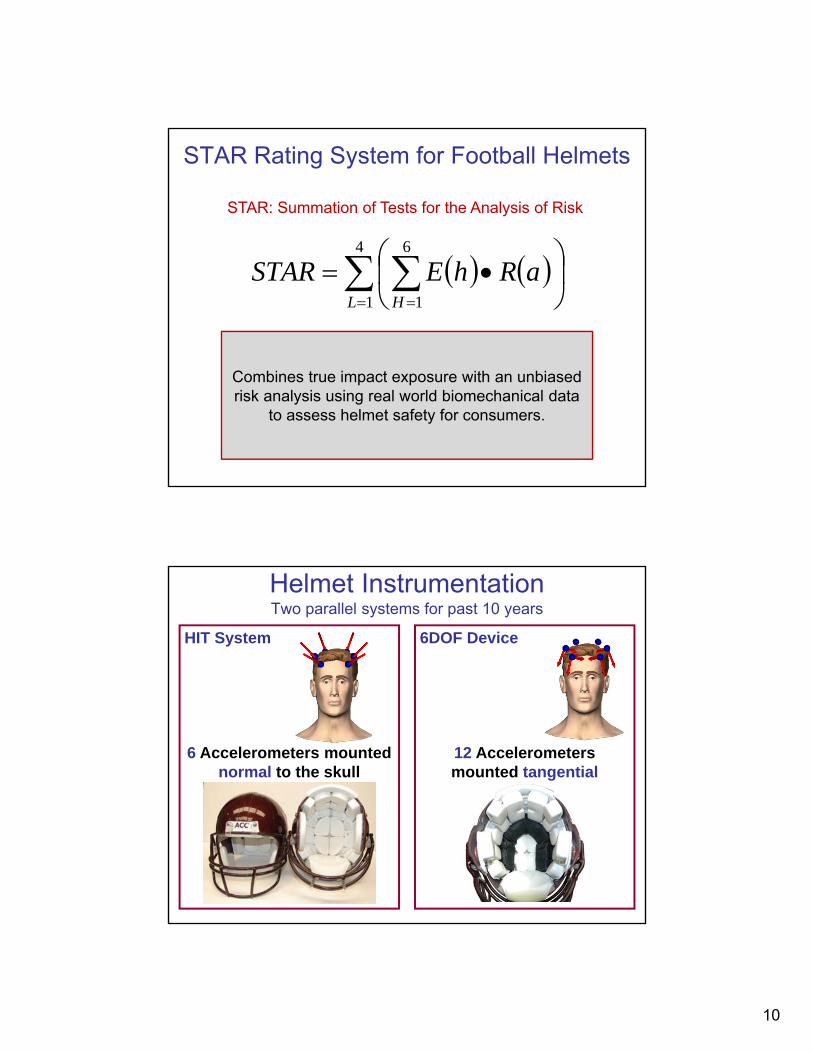
STAR Rating System for Football Helmets
STAR: Summation of Tests for the Analysis of Risk
4
1
6
1L H
aRhESTAR
Combines true impact exposure with an unbiased risk analysis using real world biomechanical data
to assess helmet safety for consumers.
HIT System
6 Accelerometers mounted normal to the skull
6DOF Device
12 Accelerometers mounted tangential
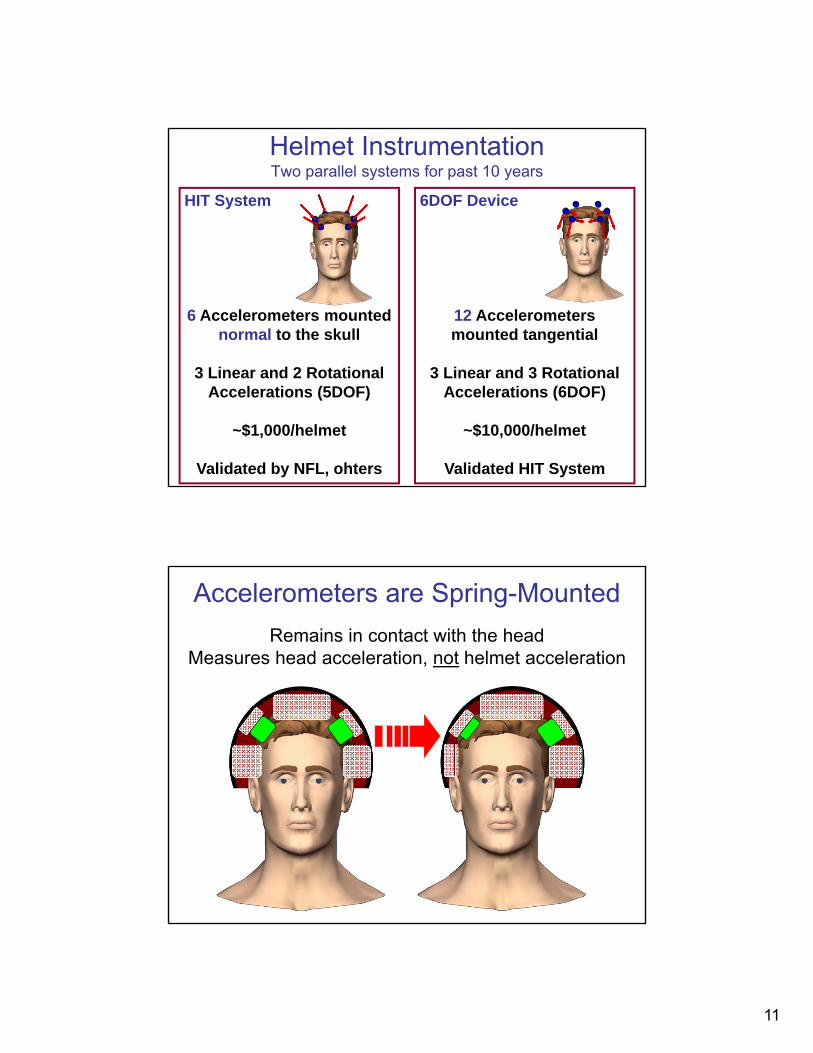
Helmet InstrumentationTwo parallel systems for past 10 years
11
HIT System
6 Accelerometers mounted normal to the skull
3 Linear and 2 Rotational Accelerations (5DOF)
~$1,000/helmet
Validated by NFL, ohters
6DOF Device
12 Accelerometers mounted tangential
3 Linear and 3 Rotational Accelerations (6DOF)
~$10,000/helmet
Validated HIT System
Helmet InstrumentationTwo parallel systems for past 10 years
Accelerometers are Spring-Mounted
Remains in contact with the headMeasures head acceleration, not helmet acceleration
12
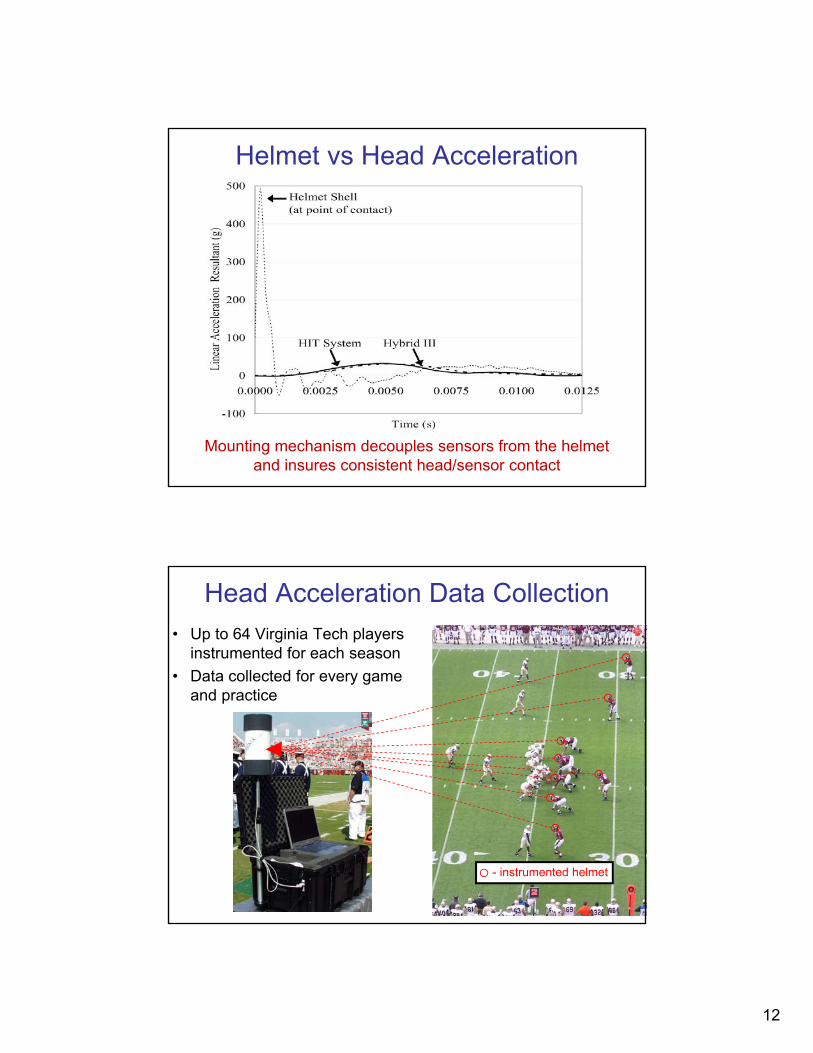
Helmet vs Head Acceleration
Mounting mechanism decouples sensors from the helmet and insures consistent head/sensor contact
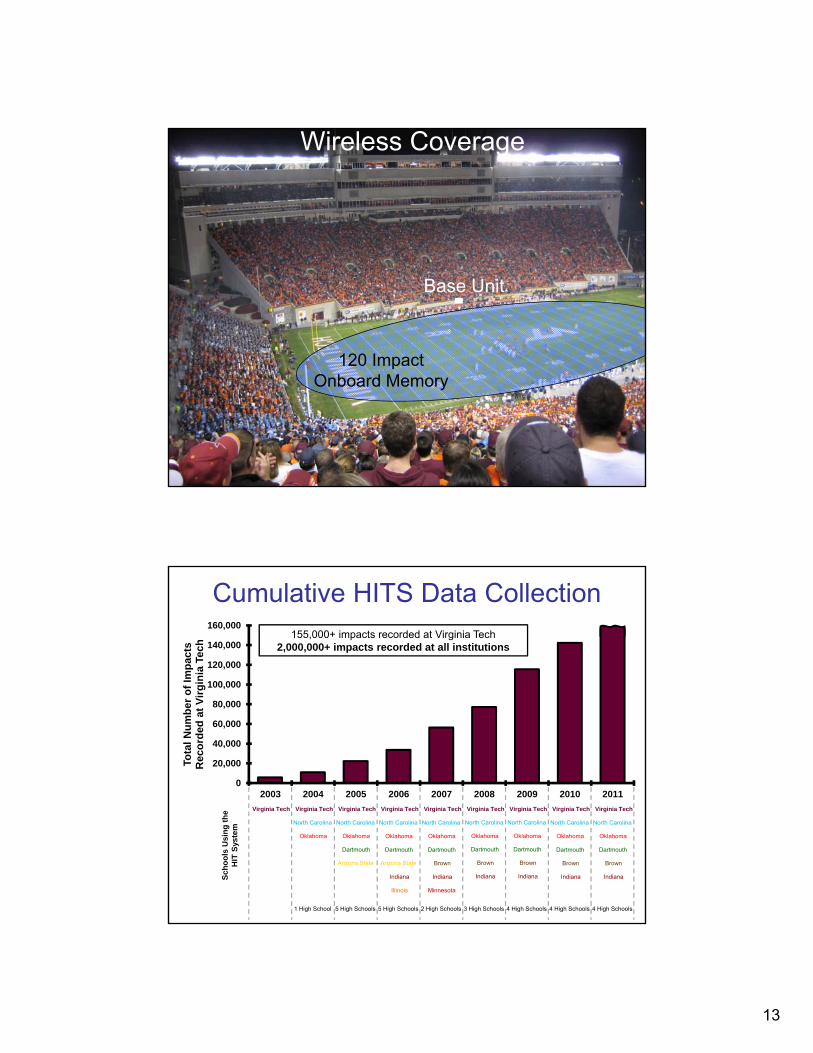
Head Acceleration Data Collection
• Up to 64 Virginia Tech players instrumented for each season
• Data collected for every game and practice
- instrumented helmet
13
Wireless Coverage
Base Unit
120 Impact Onboard Memory
Cumulative HITS Data Collection
0
20,000
40,000
60,000
80,000
100,000
120,000
140,000
160,000
2003 2004 2005 2006 2007 2008 2009 2010 2011
Tota
l N
um
ber
of
Imp
acts
Rec
ord
ed a
t V
irg
inia
Tec
h
Sch
oo
ls U
sin
g t
he
HIT
Sys
tem
Virginia Tech Virginia Tech
North Carolina
Oklahoma
1 High School
Virginia Tech
North Carolina
Oklahoma
Dartmouth
Arizona State
5 High Schools
Virginia Tech
North Carolina
Oklahoma
Dartmouth
Brown
2 High Schools
Minnesota
Indiana
Virginia Tech
North Carolina
Oklahoma
Dartmouth
Arizona State
5 High Schools
Indiana
Illinois
Virginia Tech
North Carolina
Oklahoma
Dartmouth
Brown
3 High Schools
Indiana
Virginia Tech
North Carolina
Oklahoma
Dartmouth
Brown
4 High Schools
Indiana
Virginia Tech
North Carolina
Oklahoma
Dartmouth
Brown
4 High Schools
Indiana
Virginia Tech
North Carolina
Oklahoma
Dartmouth
Brown
4 High Schools
Indiana
155,000+ impacts recorded at Virginia Tech2,000,000+ impacts recorded at all institutions
14
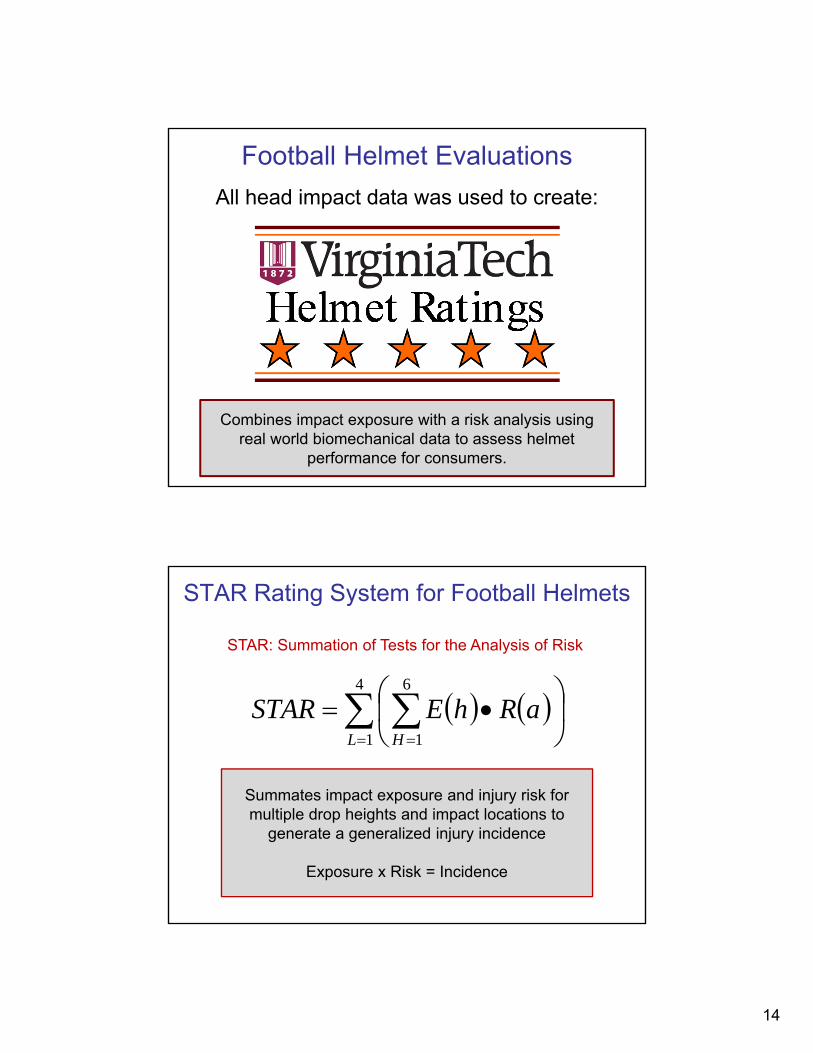
All head impact data was used to create:
Football Helmet Evaluations
Combines impact exposure with a risk analysis using real world biomechanical data to assess helmet
performance for consumers.
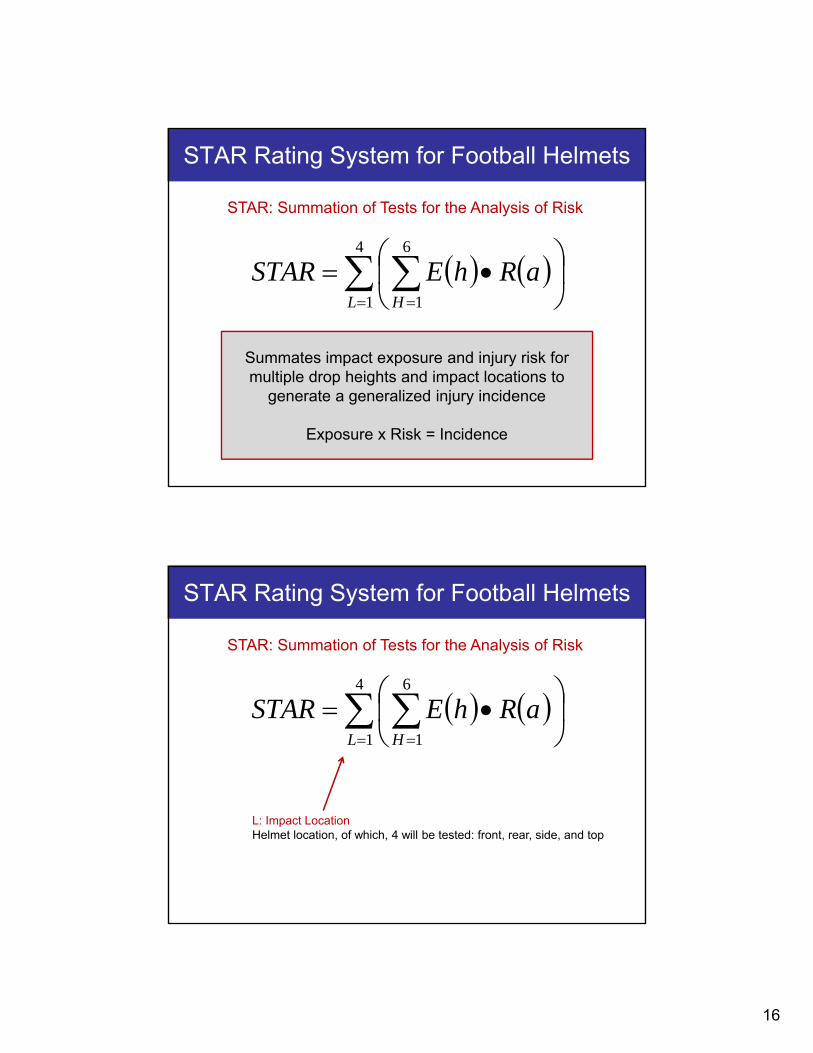
STAR Rating System for Football Helmets
STAR: Summation of Tests for the Analysis of Risk
4
1
6
1L H
aRhESTAR
Summates impact exposure and injury risk for multiple drop heights and impact locations to
generate a generalized injury incidence
Exposure x Risk = Incidence
15
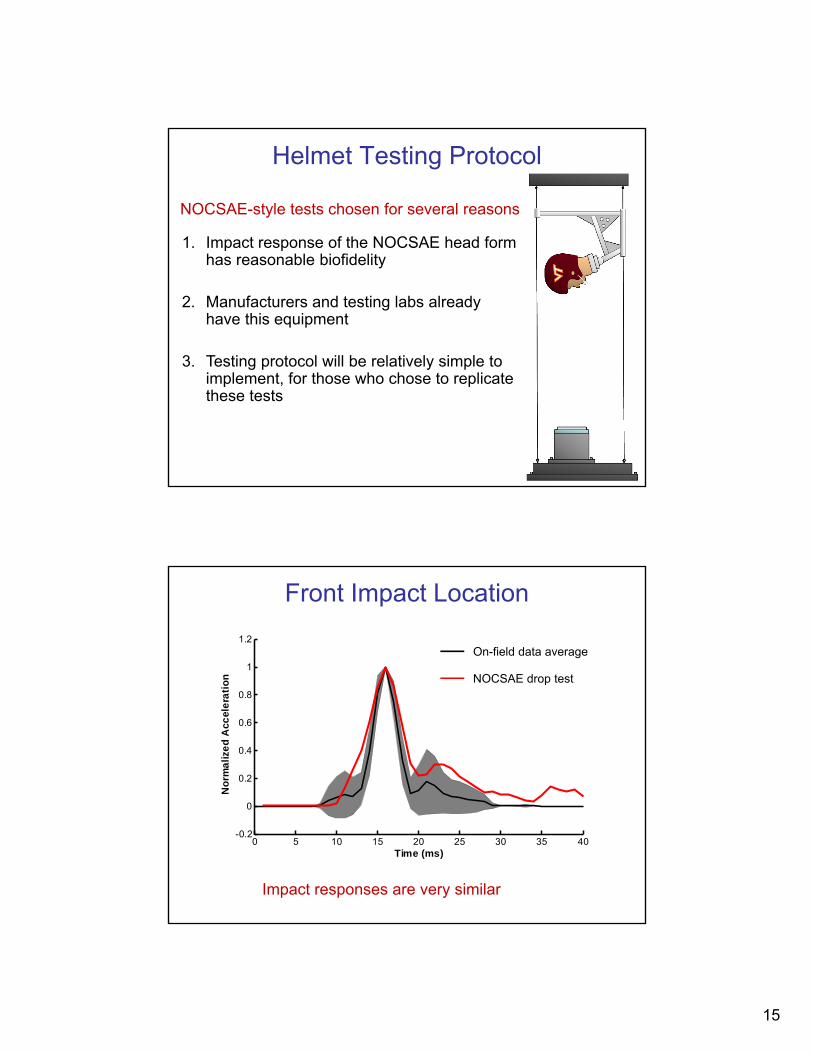
Helmet Testing Protocol
1. Impact response of the NOCSAE head form has reasonable biofidelity
2. Manufacturers and testing labs already have this equipment
3. Testing protocol will be relatively simple to implement, for those who chose to replicate these tests
NOCSAE-style tests chosen for several reasons
Front Impact Location
0 5 10 15 20 25 30 35 40-0.2
0
0.2
0.4
0.6
0.8
1
1.2
Time (ms)
No
rma
lize
d A
ccel
era
tio
n
On-field data average
NOCSAE drop test
Impact responses are very similar
16
STAR Rating System for Football Helmets
STAR: Summation of Tests for the Analysis of Risk
4
1
6
1L H
aRhESTAR
Summates impact exposure and injury risk for multiple drop heights and impact locations to
generate a generalized injury incidence
Exposure x Risk = Incidence
STAR Rating System for Football Helmets
STAR: Summation of Tests for the Analysis of Risk
4
1
6
1L H
aRhESTAR
L: Impact LocationHelmet location, of which, 4 will be tested: front, rear, side, and top
17
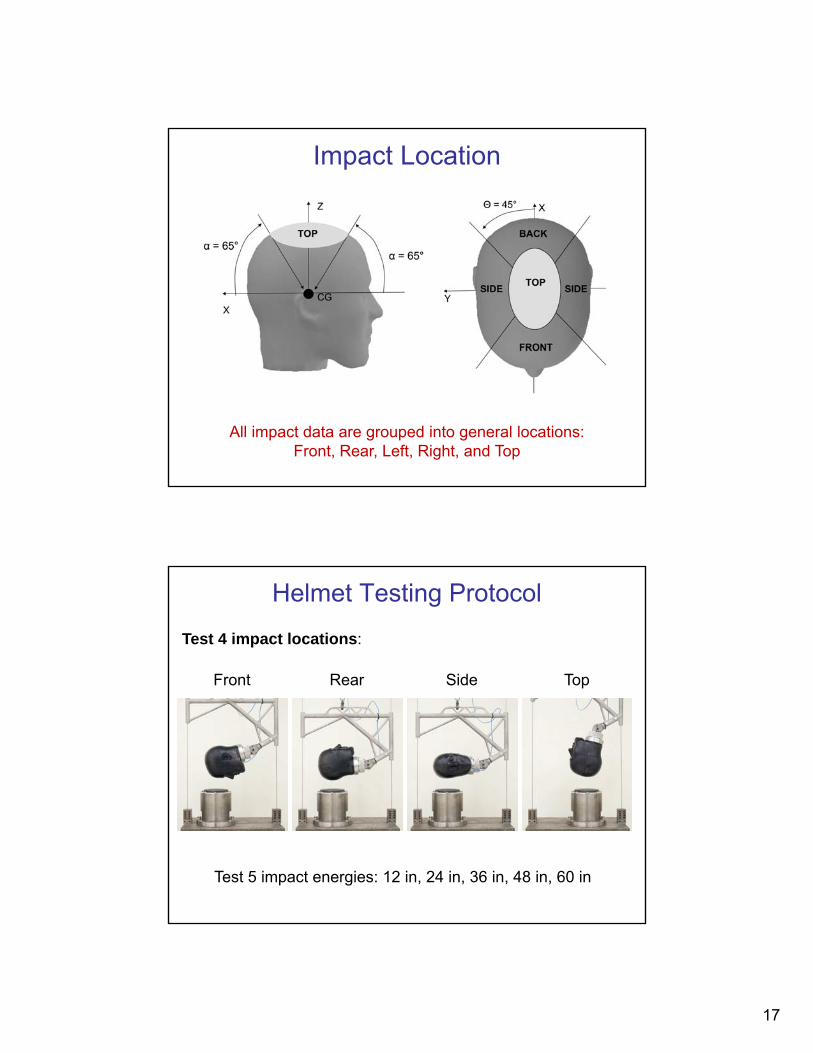
Impact Location
All impact data are grouped into general locations:Front, Rear, Left, Right, and Top
Helmet Testing Protocol
Test 4 impact locations:
Front Rear Side Top
Test 5 impact energies: 12 in, 24 in, 36 in, 48 in, 60 in
18
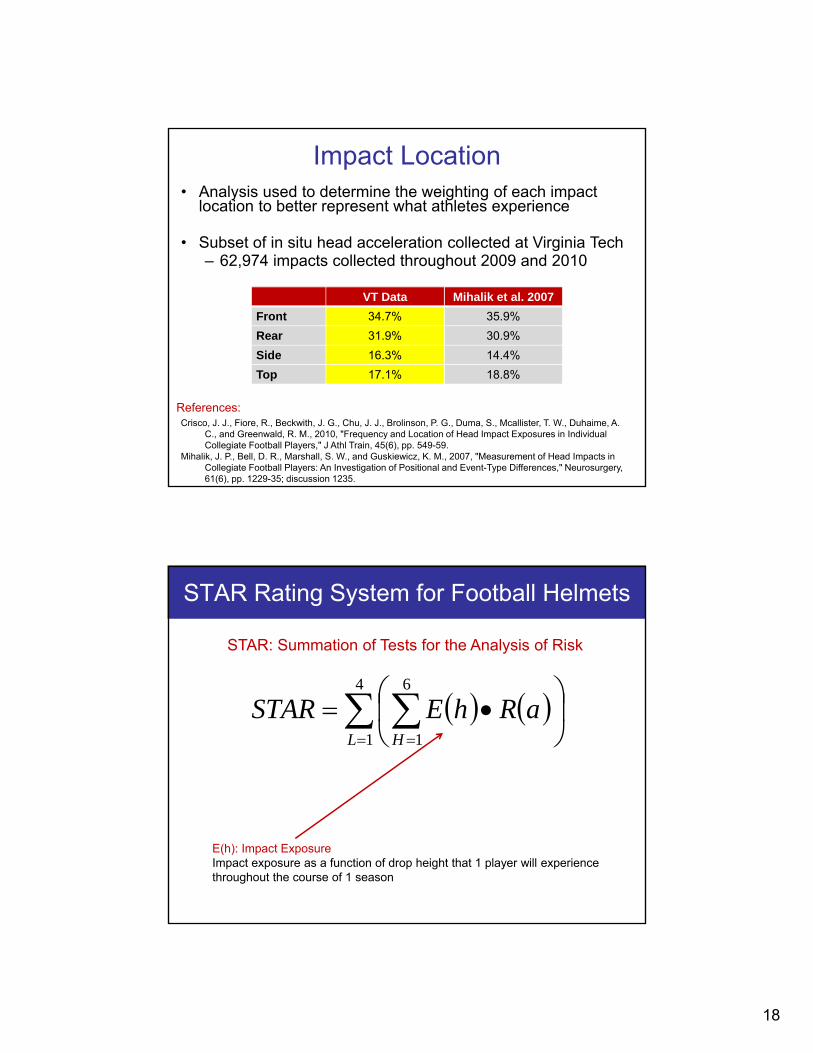
Impact Location• Analysis used to determine the weighting of each impact
location to better represent what athletes experience
• Subset of in situ head acceleration collected at Virginia Tech– 62,974 impacts collected throughout 2009 and 2010
VT Data Mihalik et al. 2007
Front 34.7% 35.9%
Rear 31.9% 30.9%
Side 16.3% 14.4%
Top 17.1% 18.8%
VT Data
Front 34.7%
Rear 31.9%
Side 16.3%
Top 17.1%
References:Crisco, J. J., Fiore, R., Beckwith, J. G., Chu, J. J., Brolinson, P. G., Duma, S., Mcallister, T. W., Duhaime, A.
C., and Greenwald, R. M., 2010, "Frequency and Location of Head Impact Exposures in Individual Collegiate Football Players," J Athl Train, 45(6), pp. 549-59.
Mihalik, J. P., Bell, D. R., Marshall, S. W., and Guskiewicz, K. M., 2007, "Measurement of Head Impacts in Collegiate Football Players: An Investigation of Positional and Event-Type Differences," Neurosurgery, 61(6), pp. 1229-35; discussion 1235.
VT Data
Front 34.7%
Rear 31.9%
Side 16.3%
Top 17.1%
STAR Rating System for Football Helmets
STAR: Summation of Tests for the Analysis of Risk
4
1
6
1L H
aRhESTAR
E(h): Impact ExposureImpact exposure as a function of drop height that 1 player will experience throughout the course of 1 season
19
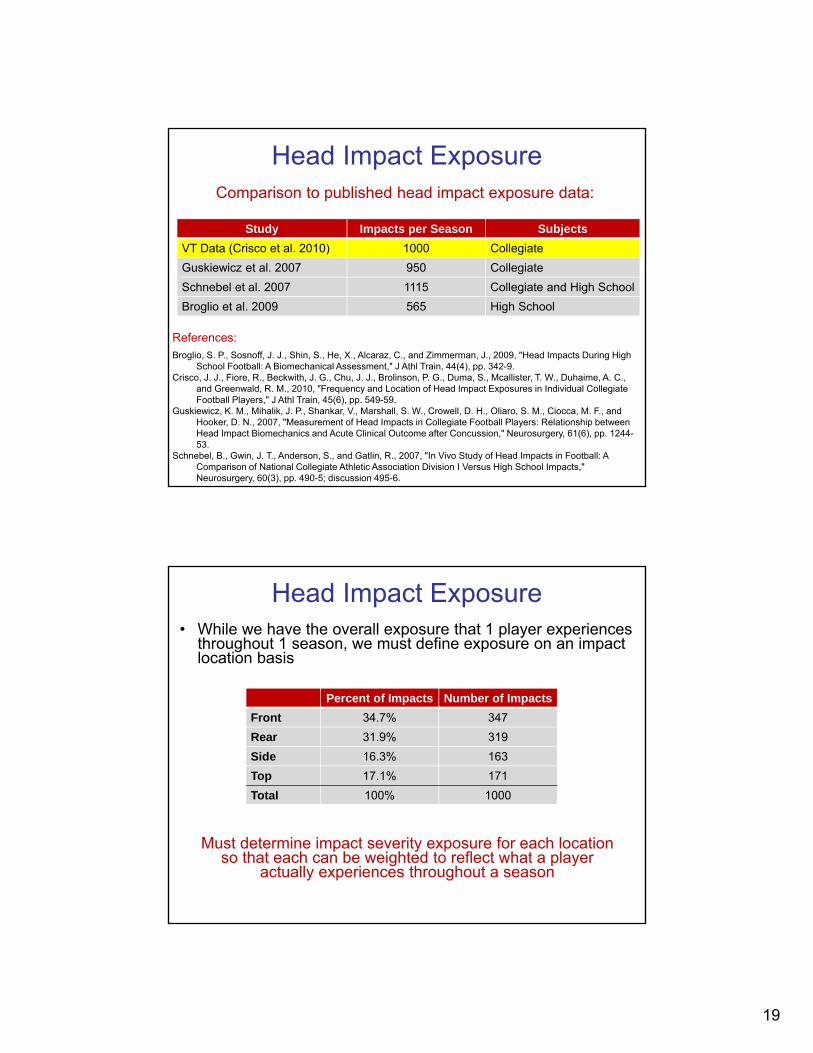
Head Impact Exposure
References:
Comparison to published head impact exposure data:
Study Impacts per Season Subjects
VT Data (Crisco et al. 2010) 1000 Collegiate
Guskiewicz et al. 2007 950 Collegiate
Schnebel et al. 2007 1115 Collegiate and High School
Broglio et al. 2009 565 High School
Study Impacts per Season Subjects
VT Data (Crisco et al. 2010) 1000 Collegiate
Guskiewicz et al. 2007 950 Collegiate
Schnebel et al. 2007 1115 Collegiate and High School
Broglio et al. 2009 565 High School
Broglio, S. P., Sosnoff, J. J., Shin, S., He, X., Alcaraz, C., and Zimmerman, J., 2009, "Head Impacts During High School Football: A Biomechanical Assessment," J Athl Train, 44(4), pp. 342-9.
Crisco, J. J., Fiore, R., Beckwith, J. G., Chu, J. J., Brolinson, P. G., Duma, S., Mcallister, T. W., Duhaime, A. C., and Greenwald, R. M., 2010, "Frequency and Location of Head Impact Exposures in Individual Collegiate Football Players," J Athl Train, 45(6), pp. 549-59.
Guskiewicz, K. M., Mihalik, J. P., Shankar, V., Marshall, S. W., Crowell, D. H., Oliaro, S. M., Ciocca, M. F., and Hooker, D. N., 2007, "Measurement of Head Impacts in Collegiate Football Players: Relationship between Head Impact Biomechanics and Acute Clinical Outcome after Concussion," Neurosurgery, 61(6), pp. 1244-53.
Schnebel, B., Gwin, J. T., Anderson, S., and Gatlin, R., 2007, "In Vivo Study of Head Impacts in Football: A Comparison of National Collegiate Athletic Association Division I Versus High School Impacts," Neurosurgery, 60(3), pp. 490-5; discussion 495-6.
Head Impact Exposure• While we have the overall exposure that 1 player experiences
throughout 1 season, we must define exposure on an impact location basis
Percent of Impacts
Front 34.7%
Rear 31.9%
Side 16.3%
Top 17.1%
Total 100%
Percent of Impacts Number of Impacts
Front 34.7% 347
Rear 31.9% 319
Side 16.3% 163
Top 17.1% 171
Total 100% 1000
Must determine impact severity exposure for each location so that each can be weighted to reflect what a player
actually experiences throughout a season
20
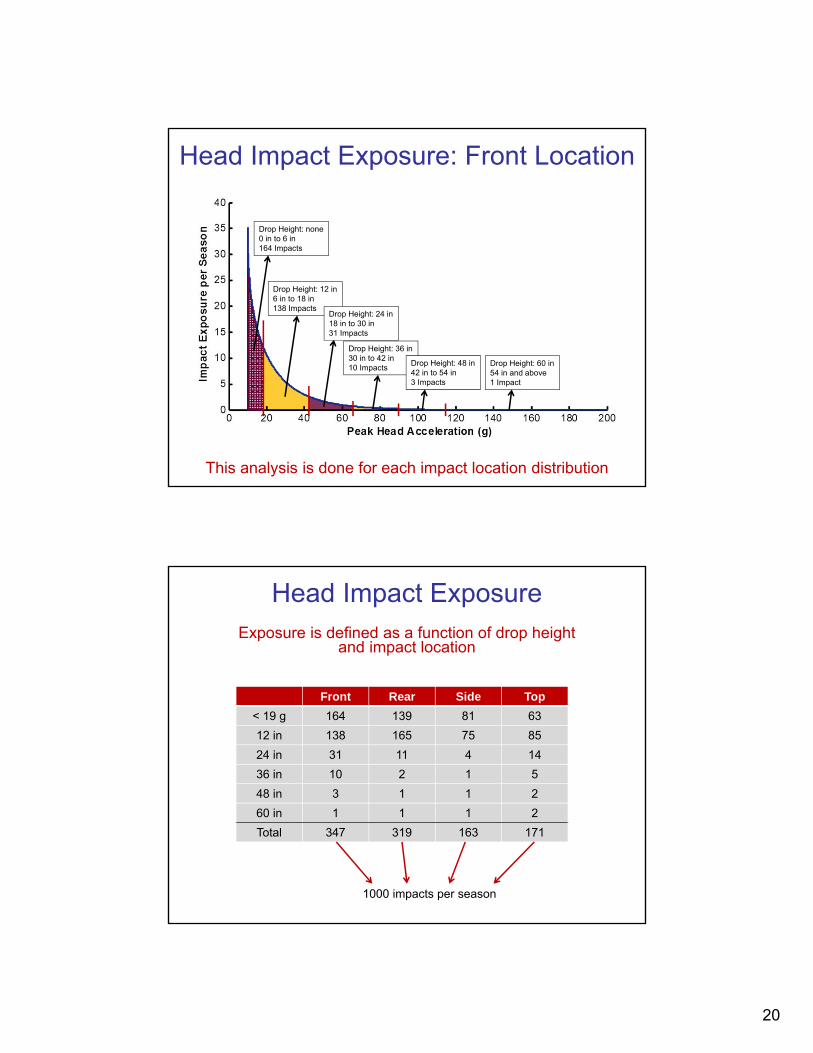
Head Impact Exposure: Front Location
Drop Height: none0 in to 6 in 164 Impacts
Drop Height: 12 in6 in to 18 in 138 Impacts
Drop Height: 24 in18 in to 30 in 31 Impacts
Drop Height: 36 in30 in to 42 in 10 Impacts
Drop Height: 48 in42 in to 54 in 3 Impacts
Drop Height: 60 in54 in and above1 Impact
This analysis is done for each impact location distribution
Front Rear Side Top
< 19 g 164 139 81 63
12 in 138 165 75 85
24 in 31 11 4 14
36 in 10 2 1 5
48 in 3 1 1 2
60 in 1 1 1 2
Front Rear Side Top
< 19 g 164 139 81 63
12 in 138 165 75 85
24 in 31 11 4 14
36 in 10 2 1 5
48 in 3 1 1 2
60 in 1 1 1 2
Total 347 319 163 171
Head Impact ExposureExposure is defined as a function of drop height
and impact location
1000 impacts per season
21
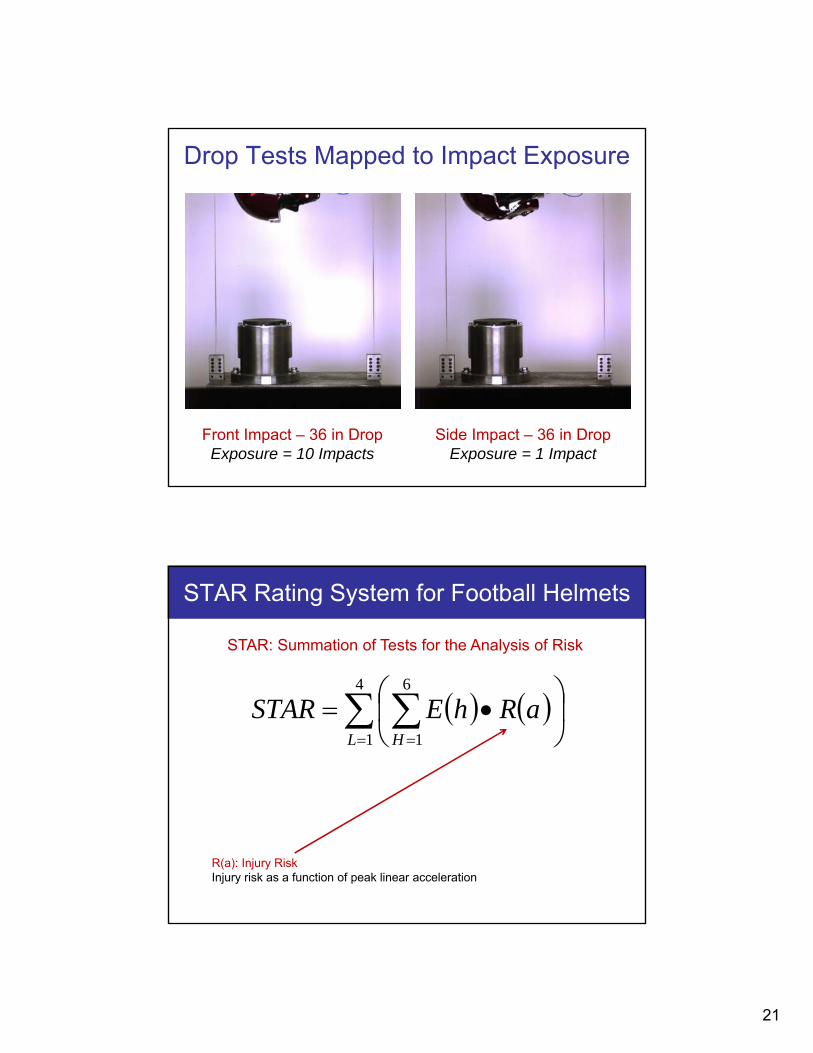
Drop Tests Mapped to Impact Exposure
Front Impact – 36 in DropExposure = 10 Impacts
Side Impact – 36 in DropExposure = 1 Impact
STAR Rating System for Football Helmets
STAR: Summation of Tests for the Analysis of Risk
4
1
6
1L H
aRhESTAR
R(a): Injury RiskInjury risk as a function of peak linear acceleration
22
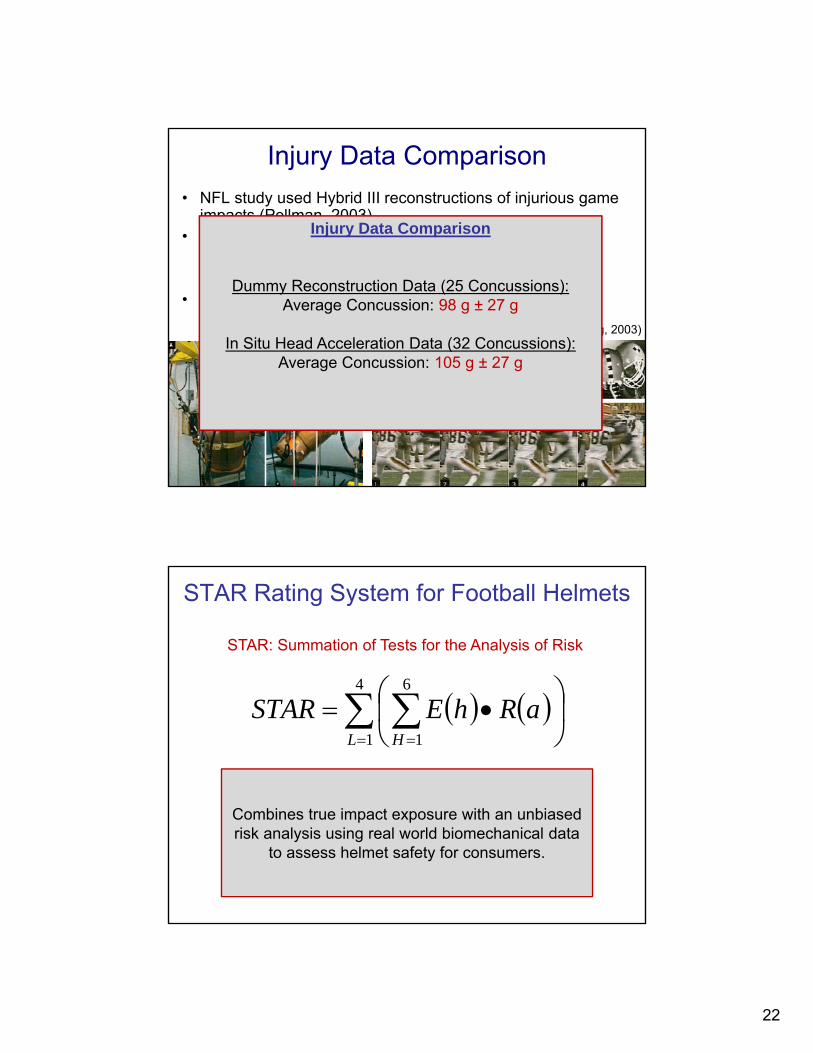
Injury Data Comparison
• NFL study used Hybrid III reconstructions of injurious game impacts (Pellman, 2003)
• 31 impacts, 25 concussions– Striking player (non-injury)– Struck Player (injury)
• Injury risk curves based on logistic regression
(King, 2003)
Injury Data Comparison
Dummy Reconstruction Data (25 Concussions):Average Concussion: 98 g ± 27 g
In Situ Head Acceleration Data (32 Concussions):Average Concussion: 105 g ± 27 g
STAR Rating System for Football Helmets
STAR: Summation of Tests for the Analysis of Risk
4
1
6
1L H
aRhESTAR
Combines true impact exposure with an unbiased risk analysis using real world biomechanical data
to assess helmet safety for consumers.
23
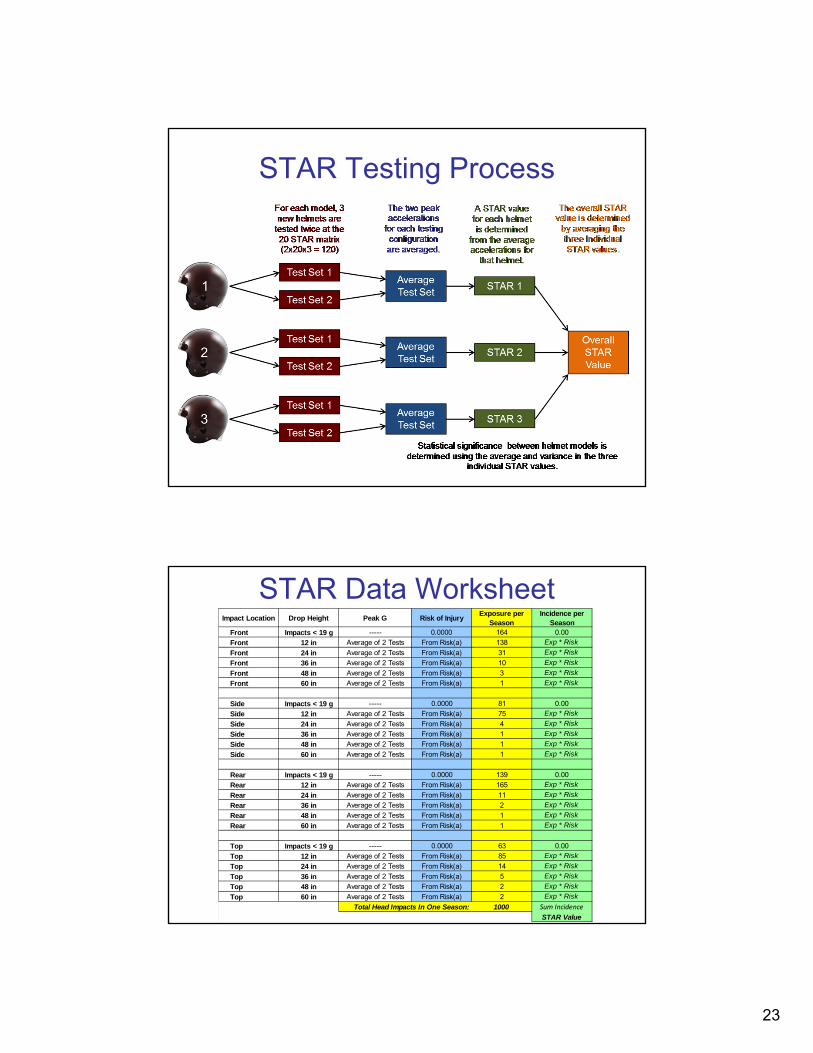
STAR Testing Process
Impact Location Drop Height Peak G Risk of InjuryExposure per
SeasonIncidence per
SeasonFront Impacts < 19 g ----- 0.0000 164 0.00
Front 12 in Average of 2 Tests From Risk(a) 138 Exp * Risk
Front 24 in Average of 2 Tests From Risk(a) 31 Exp * Risk
Front 36 in Average of 2 Tests From Risk(a) 10 Exp * Risk
Front 48 in Average of 2 Tests From Risk(a) 3 Exp * Risk
Front 60 in Average of 2 Tests From Risk(a) 1 Exp * Risk
Side Impacts < 19 g ----- 0.0000 81 0.00
Side 12 in Average of 2 Tests From Risk(a) 75 Exp * Risk
Side 24 in Average of 2 Tests From Risk(a) 4 Exp * Risk
Side 36 in Average of 2 Tests From Risk(a) 1 Exp * Risk
Side 48 in Average of 2 Tests From Risk(a) 1 Exp * Risk
Side 60 in Average of 2 Tests From Risk(a) 1 Exp * Risk
Rear Impacts < 19 g ----- 0.0000 139 0.00
Rear 12 in Average of 2 Tests From Risk(a) 165 Exp * Risk
Rear 24 in Average of 2 Tests From Risk(a) 11 Exp * Risk
Rear 36 in Average of 2 Tests From Risk(a) 2 Exp * Risk
Rear 48 in Average of 2 Tests From Risk(a) 1 Exp * Risk
Rear 60 in Average of 2 Tests From Risk(a) 1 Exp * Risk
Top Impacts < 19 g ----- 0.0000 63 0.00
Top 12 in Average of 2 Tests From Risk(a) 85 Exp * Risk
Top 24 in Average of 2 Tests From Risk(a) 14 Exp * Risk
Top 36 in Average of 2 Tests From Risk(a) 5 Exp * Risk
Top 48 in Average of 2 Tests From Risk(a) 2 Exp * Risk
Top 60 in Average of 2 Tests From Risk(a) 2 Exp * Risk
1000 Sum Incidence
STAR Value
Total Head Impacts In One Season:
STAR Data Worksheet

24
1. Rowson S, Brolinson PG, Goforth M, Dietter D, and Duma SM, “Linear and angular head accelerations measurements in collegiate football,” Journal of Biomechanical Engineering, vol. 131(6) pp. 061016, 2009.
2. Takhounts EG, Ridella SA, Hasija V, Tannous RE, Campbell JQ, Malone D, Danelson K, Stitzel J, Rowson S, and Duma S, "Investigation of traumatic brain injuries using the next generation of simulated injury monitor (SIMon) finite element head model," Stapp Car Crash Journal, vol. 52, pp. 1-31, 2008.
3. Crisco, J.J., Fiore, R., Beckwith, J.G., Chu, J.J., Brolinson, P.G., Duma, S., McAllister, T.W., Duhaime, A.C., Greenwald, R.M., Head Impact Exposures in Individual Collegiate Football Players. Journal of Athletic Training. 45(6):549-559, 2010.
4. Crisco JJ, Therrien B, Machan JT, McAllister TW, Duhaime AC, Duma S, Rowson S, Beckwith JG, Chu JJ, Greenwald RM, “Head Impact Severity Measures in Collegiate Football Players,” Journal of Applied Biomechanics, 2011.
5. Duma, S.M., Rowson, S., Past, present, and future of head injury research. Exercise and Sport Sciences Reviews. 39(1):2-3, 2011.
6. Rowson S, Goforth MW, Dietter D, Brolinson PG, and Duma SM, “Correlating cumulative sub-concussive impacts in football with player performance,” Biomedical Sciences Instrumentation, Vol. 45, pp. 113-118, 2009.
7. Duma S and Rowson S, “Every Newton hertz: a micro to macro approach investigating brain injury,” Conf Proc IEEE Eng Med Biol Soc, 2009, pp. 1123-6, 2009.
8. Rowson S, McNeely DE, and Duma SM, "Force transmission to the mandible by chin straps during head impacts in football," Biomedical Sciences Instrumentation, Vol. 44, pp. 195-200, 2008.
9. Rowson S, McNeely DE, Brolinson PG, and Duma SM, "Biomechanical analysis of football neck collars," Clinical Journal of Sports Medicine, vol. 18, pp. 316-21, 2008.
10. Shain KS, Madigan ML, Rowson S, and Duma SM, “Analysis of the ability of catcher’s masks to attenuate head accelerations upon impact with a baseball,” Clinical Journal of Sports Medicine, 2010. (Accepted)
11. Rowson S, McNeely DE, and Duma SM, "Lateral bending biomechanical analysis of neck protection devices used in football," Biomedical Sciences Instrumentation, Vol. 43, pp. 200-205, 2007.
12. Funk JR, Duma SM, Manoogian SJ, and Rowson S, "Biomechanical risk estimates for mild traumatic brain injury," Association for the Advancement of Automotive Medicine, vol. 51, pp. 343-61, 2007.
Peer Reviewed Publications: Head and Neck Data in Football
All Data and Reports Online
www.SBES.vt.edu
25
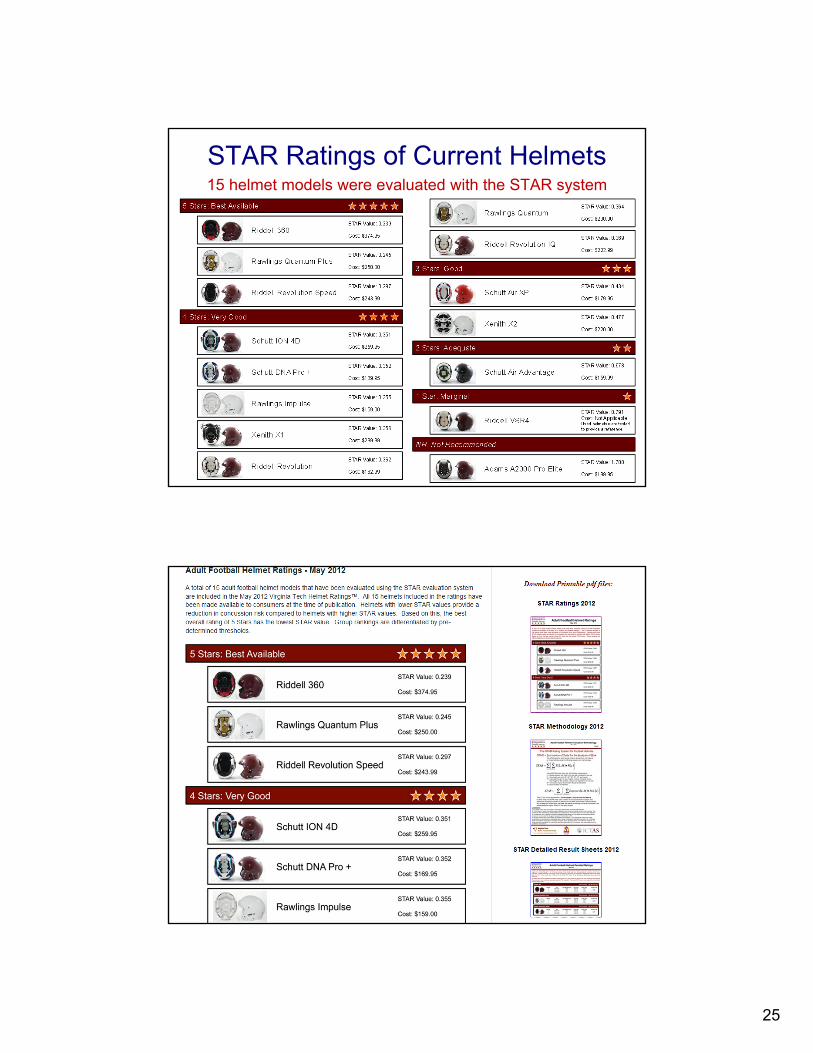
STAR Ratings of Current Helmets15 helmet models were evaluated with the STAR system
26
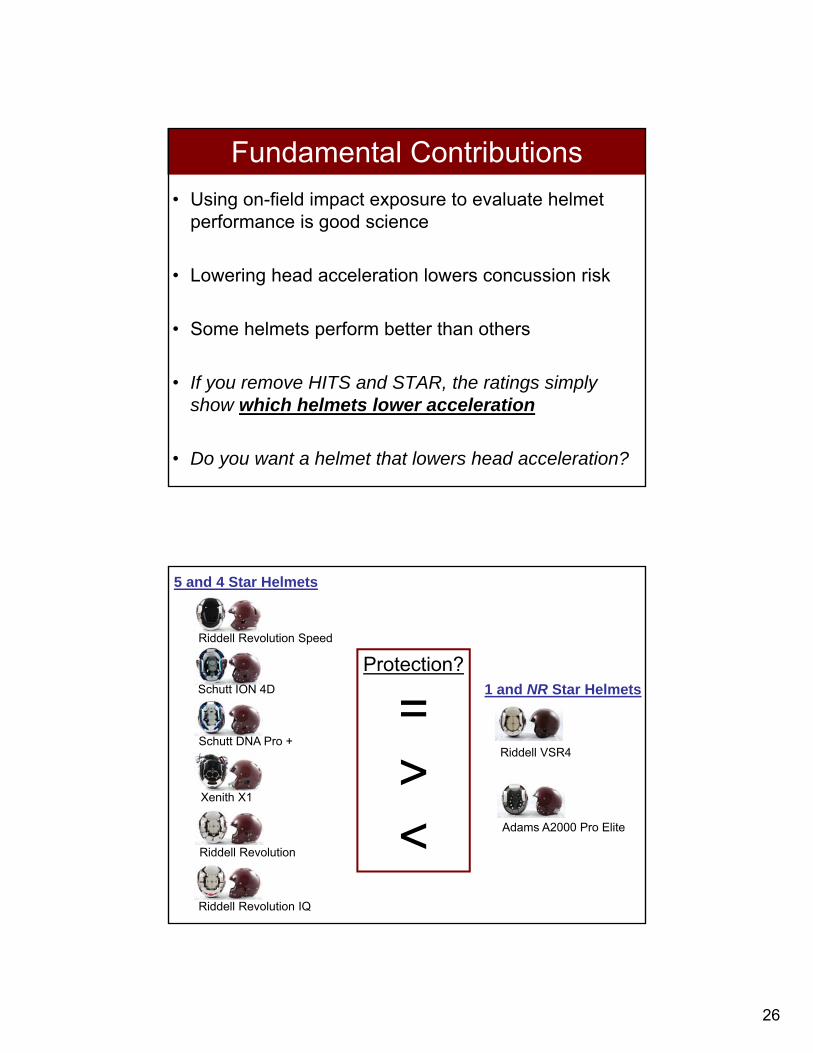
Fundamental Contributions
• Using on-field impact exposure to evaluate helmet performance is good science
• Lowering head acceleration lowers concussion risk
• Some helmets perform better than others
• If you remove HITS and STAR, the ratings simply show which helmets lower acceleration
• Do you want a helmet that lowers head acceleration?
Riddell Revolution Speed
Schutt ION 4D
Xenith X1
Riddell Revolution
Riddell Revolution IQ
Schutt DNA Pro +
5 and 4 Star Helmets
1 and NR Star Helmets
Adams A2000 Pro Elite
Riddell VSR4
Protection?
=><

27
• Collins et al. (2006)• Studied over 2000 high school players• Riddell Revolution reduced risk of concussion by 31%
• Virginia Tech Clinical Data (2005 - 2010)• Studied over 250 college football players• Riddell Revolution reduced risk of concussion by 85%
compared to Riddell VSR4
• STAR Evaluation System– Developed from data on over 100,000 head impacts– Predicts Riddell Revolution reduces risk of concussion
by 54% compared to Riddell VSR4
Clinical Validation of STAR
Clinical Validation of STAR
Riddell Revolution
STAR Value0.362
Riddell VSR4
STAR Value0.791
3 different studies show differences between helmets in ability to reduce concussion risk with Revolution
Collins31%
STAR54%
VT85%
>
28
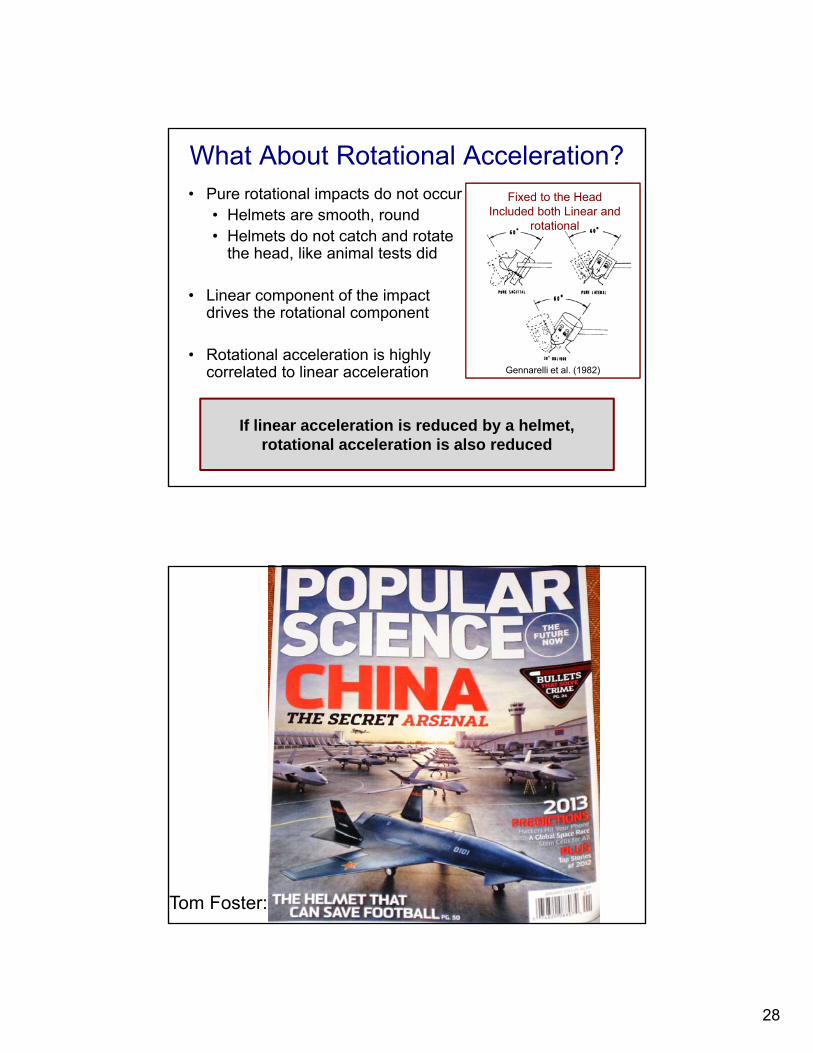
What About Rotational Acceleration?• Pure rotational impacts do not occur
• Helmets are smooth, round• Helmets do not catch and rotate
the head, like animal tests did
• Linear component of the impact drives the rotational component
• Rotational acceleration is highly correlated to linear acceleration Gennarelli et al. (1982)
Fixed to the HeadIncluded both Linear and
rotational
If linear acceleration is reduced by a helmet,rotational acceleration is also reduced
Tom Foster:
29
0 20 40 60 80 100 120 140 160 180 2000
2000
4000
6000
8000
10000
12000
Linear Acceleration (g)
Ro
tati
on
al A
cce
lera
tio
n (
rad
/s2)
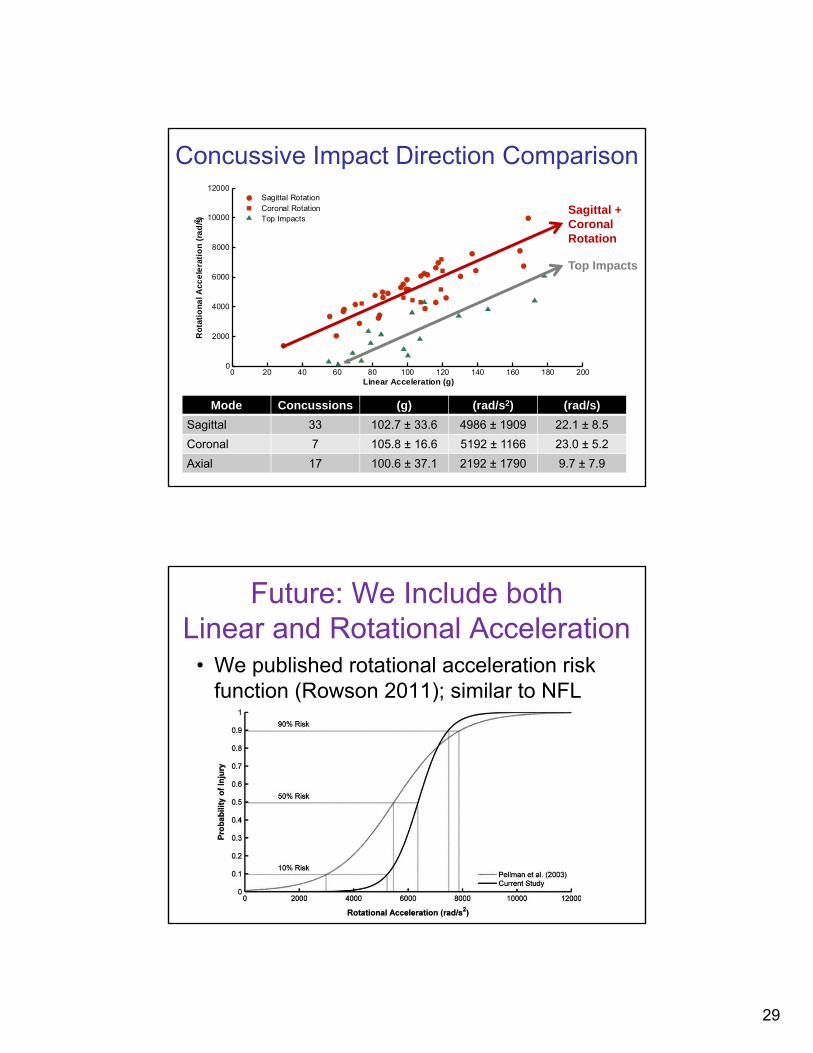
Sagittal RotationCoronal RotationTop Impacts
Concussive Impact Direction Comparison
Mode Concussions (g) (rad/s2) (rad/s)
Sagittal 33 102.7 ± 33.6 4986 ± 1909 22.1 ± 8.5
Coronal 7 105.8 ± 16.6 5192 ± 1166 23.0 ± 5.2
Axial 17 100.6 ± 37.1 2192 ± 1790 9.7 ± 7.9
Top Impacts
Sagittal + CoronalRotation
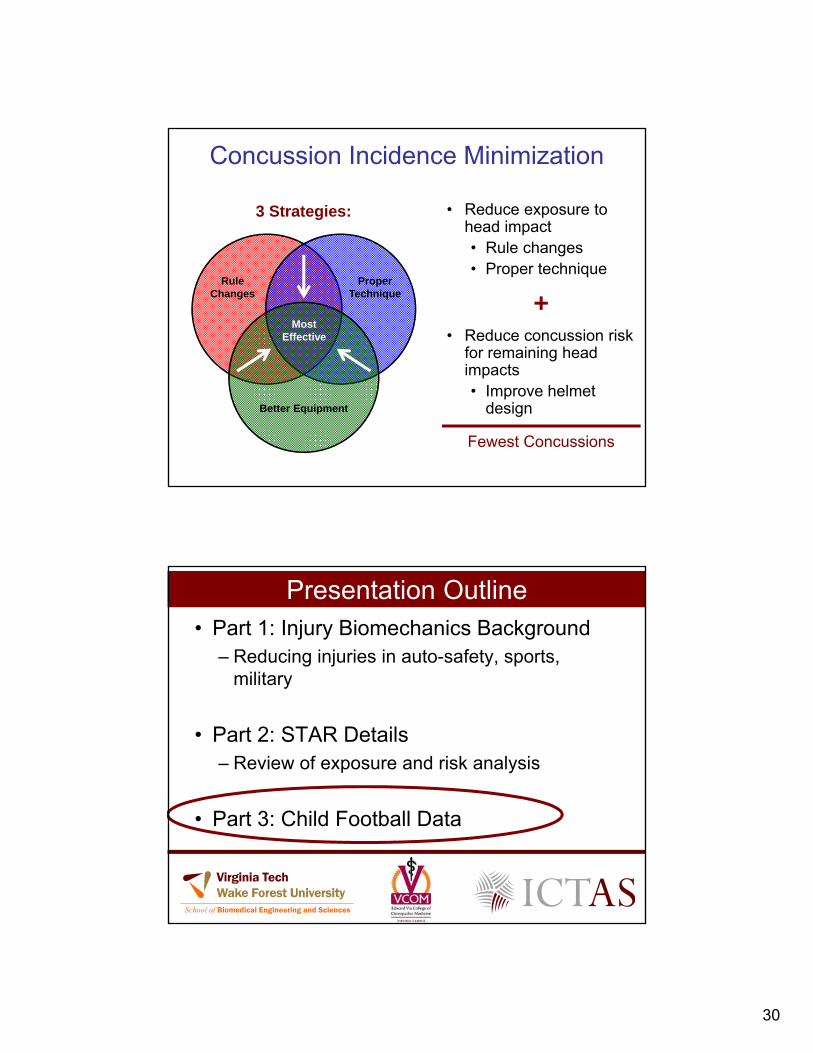
Future: We Include both Linear and Rotational Acceleration
• We published rotational acceleration risk function (Rowson 2011); similar to NFL
30
Concussion Incidence Minimization
RuleChanges
ProperTechnique
Better Equipment
MostEffective
3 Strategies: • Reduce exposure to head impact• Rule changes• Proper technique
+• Reduce concussion risk
for remaining head impacts• Improve helmet
design
Fewest Concussions
Presentation Outline• Part 1: Injury Biomechanics Background
– Reducing injuries in auto-safety, sports, military
• Part 2: STAR Details– Review of exposure and risk analysis
• Part 3: Child Football Data
31
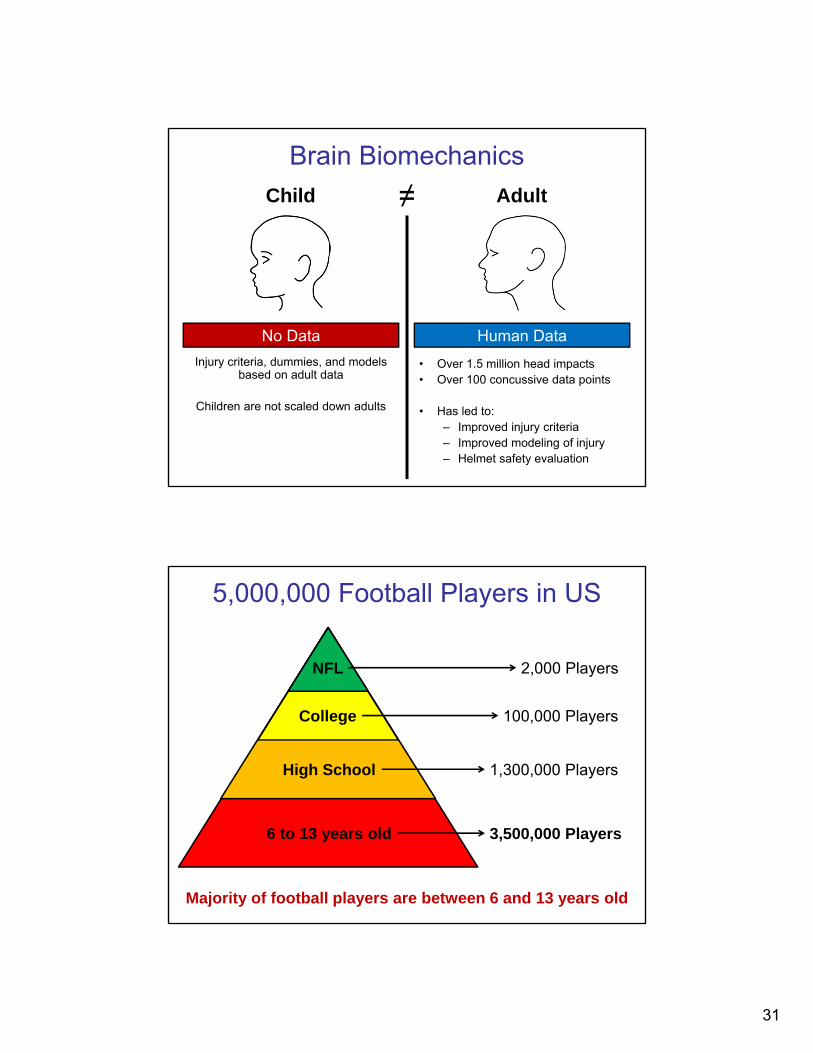
• Over 1.5 million head impacts• Over 100 concussive data points
• Has led to:– Improved injury criteria– Improved modeling of injury– Helmet safety evaluation
Adult
Human Data
Brain Biomechanics
≠
Injury criteria, dummies, and models based on adult data
Children are not scaled down adults
No Data
Child
3,500,000 Players6 to 13 years old
1,300,000 PlayersHigh School
College 100,000 Players
NFL 2,000 Players
5,000,000 Football Players in US
Majority of football players are between 6 and 13 years old
32
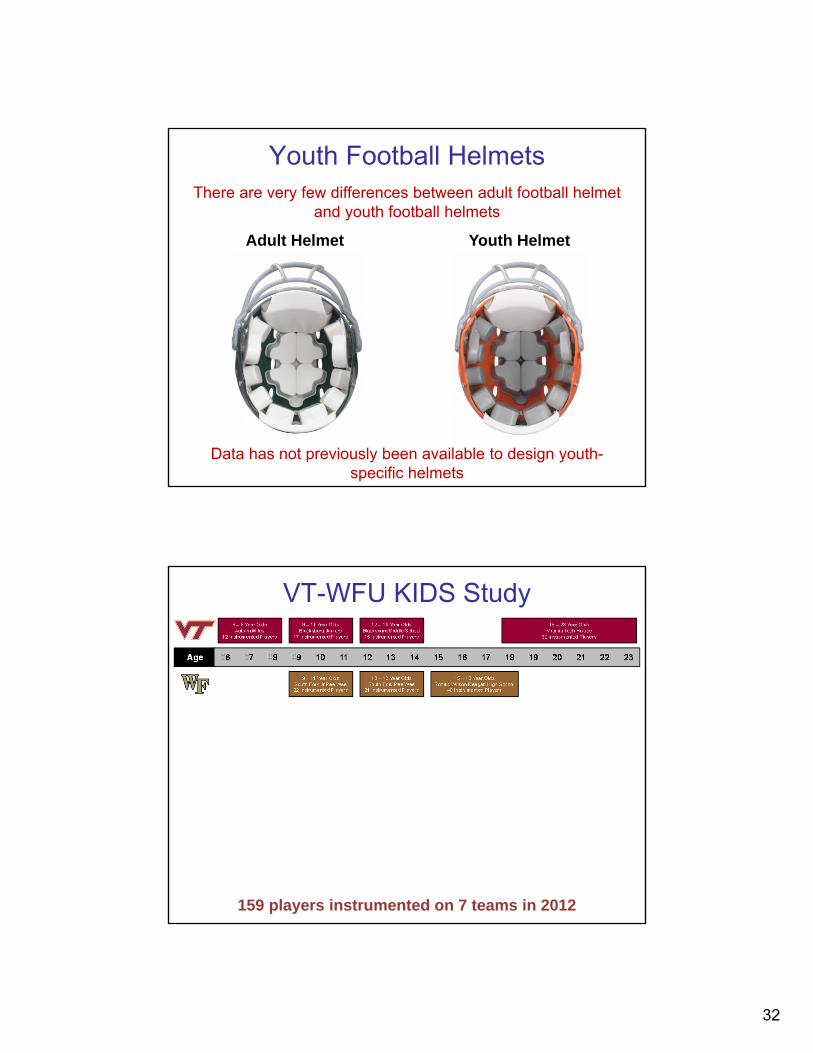
Youth Football Helmets
Adult Helmet Youth Helmet
There are very few differences between adult football helmet and youth football helmets
Data has not previously been available to design youth-specific helmets
VT-WFU KIDS Study
159 players instrumented on 7 teams in 2012

33
VT and WFU IRB Approved
Consent Obtained from Both Parents and Children
IRB ApprovalIRB Process
Youth Helmet Instrumentation• Youth helmets instrumented with:
– Standard HIT System
– 6DOF head acceleration measurement device
• Adult and youth helmets arevirtually identical
Instrumented VT Helmet Youth Helmet
34
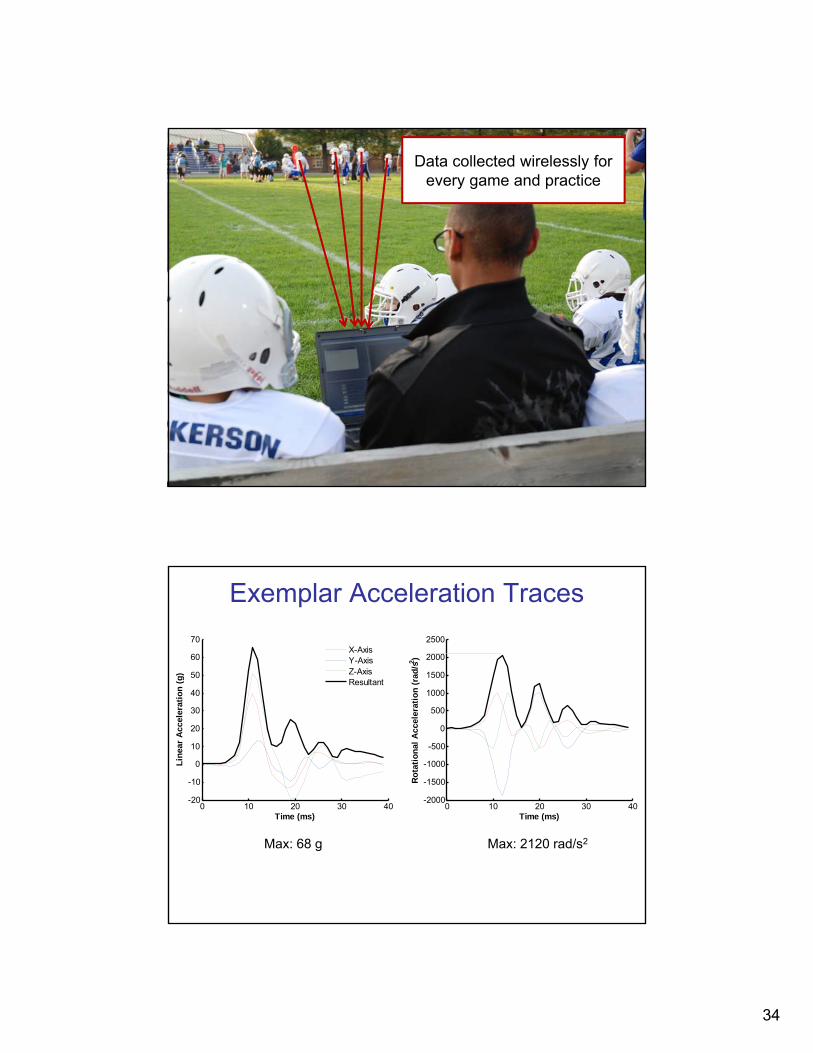
Child Head Acceleration MeasurementData collected wirelessly for every game and practice
Exemplar Acceleration Traces
0 10 20 30 40-20
-10
0
10
20
30
40
50
60
70
Time (ms)
Lin
ear
Acc
eler
atio
n (
g)
X-AxisY-AxisZ-AxisResultant
0 10 20 30 40-2000
-1500
-1000
-500
0
500
1000
1500
2000
2500
Time (ms)
Ro
tati
on
al A
ccel
erat
ion
(ra
d/s
2 )
Max: 68 g Max: 2120 rad/s2
35
0 20 40 60 80 1000
50
100
150
200
250
300
350
400
Peak Resultant Linear Acceleration (g)
Num
ber
of Im
pact
s
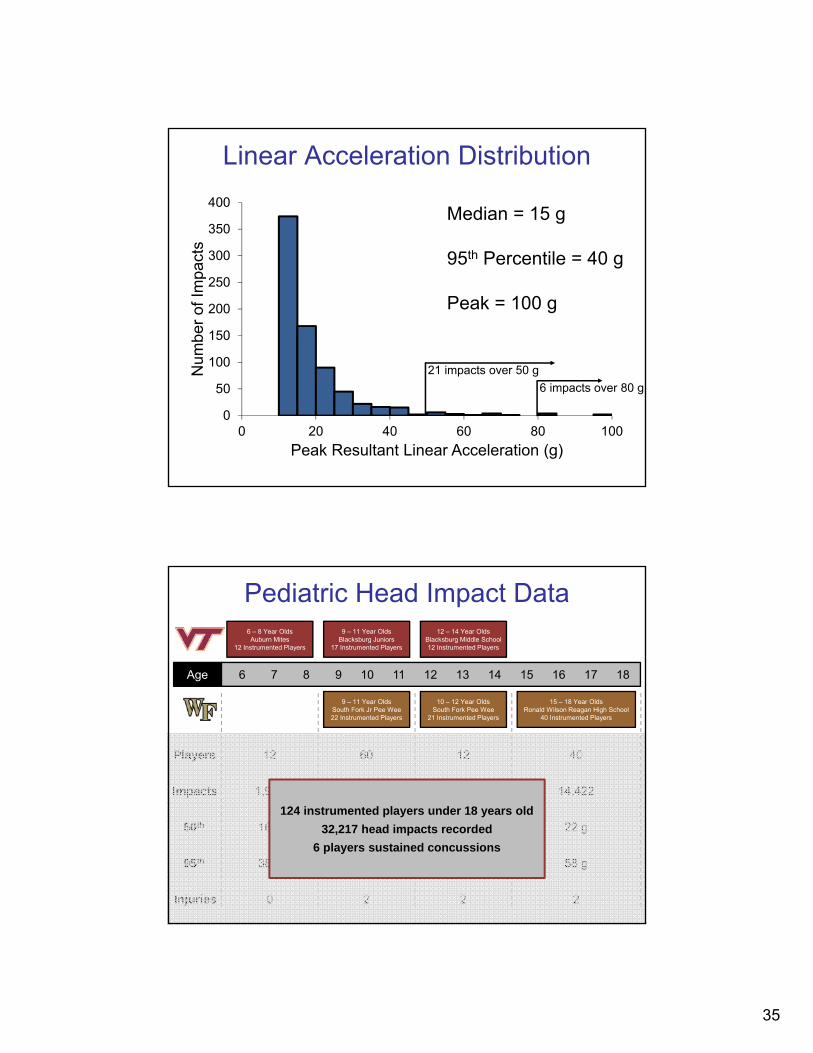
Linear Acceleration Distribution
Median = 15 g
95th Percentile = 40 g
Peak = 100 g
21 impacts over 50 g
6 impacts over 80 g
Pediatric Head Impact Data
Age 06 07 08 09 10 11 12 13 14 15 16 17 18
6 – 8 Year OldsAuburn Mites
12 Instrumented Players
9 – 11 Year OldsBlacksburg Juniors
17 Instrumented Players
12 – 14 Year OldsBlacksburg Middle School12 Instrumented Players
9 – 11 Year OldsSouth Fork Jr Pee Wee22 Instrumented Players
10 – 12 Year OldsSouth Fork Pee Wee
21 Instrumented Players
15 – 18 Year OldsRonald Wilson Reagan High School
40 Instrumented Players
Injuries
95th
50th
Players
Impacts
0
38 g
16 g
12
1,959
2
50 g
19 g
60
13,110
2
58 g
22 g
40
14,422
2
55 g
20 g
12
2,726
124 instrumented players under 18 years old
32,217 head impacts recorded
6 players sustained concussions
36
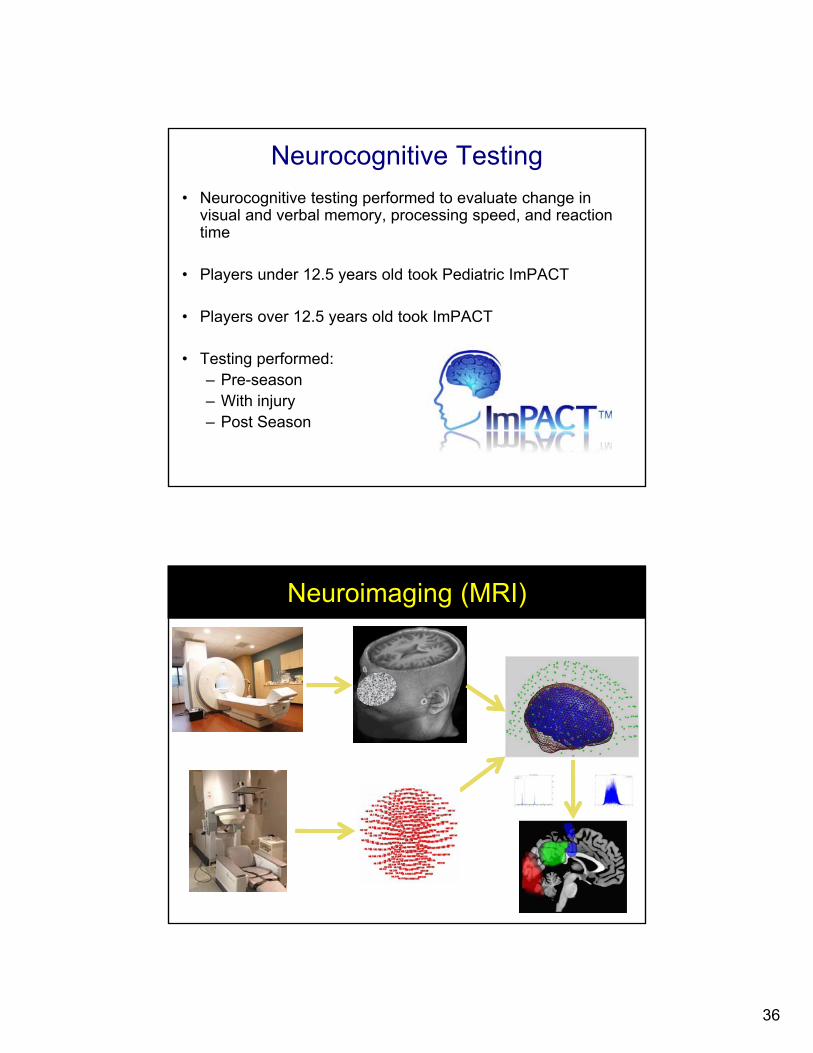
Neurocognitive Testing
• Neurocognitive testing performed to evaluate change in visual and verbal memory, processing speed, and reaction time
• Players under 12.5 years old took Pediatric ImPACT
• Players over 12.5 years old took ImPACT
• Testing performed:– Pre-season– With injury– Post Season
MRI
MEG
Neuroimaging (MRI)
37
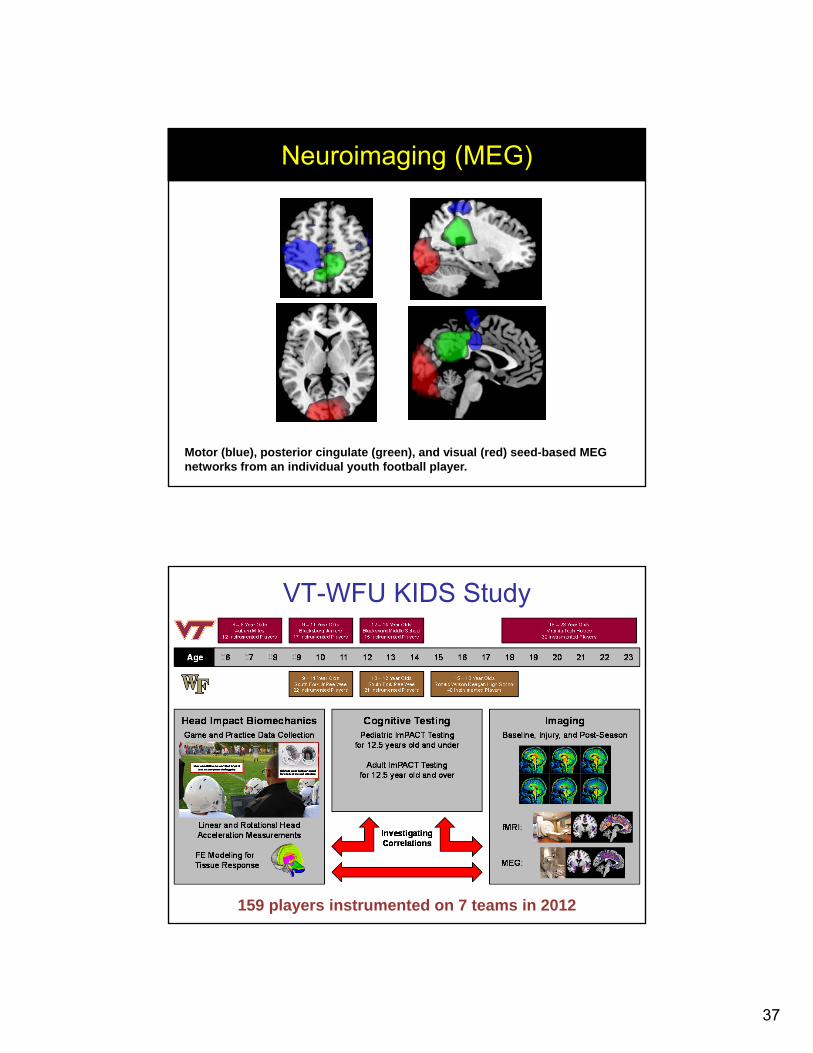
Motor (blue), posterior cingulate (green), and visual (red) seed-based MEG networks from an individual youth football player.
Neuroimaging (MEG)
VT-WFU KIDS Study
159 players instrumented on 7 teams in 2012
38
Acknowledgements
Center for Injury Biomechanics
COLLEGE of ENGINEERING
National Highway Safety Traffic Administration
Virginia Tech
Wake Forest University
Human Impact ToleranceAnd the STAR Helmet Rating
Stefan M. Duma and Steven RowsonSchool of Biomedical Engineering and Sciences
Virginia Tech – Wake Forest University
January 17, 2012