Embed Size (px)
Citation preview
1
Implementation of technology & production strategy practices:
relationship levels in different industries
Pedro Garrido-Vegab, Cesar H. Ortega Jimeneza,n, José Luis Díez Pérez de los Ríosc, Michiya
Moritad
a Instituto de Investigaciones Económicas y Sociales (IIES), Universidad Nacional Autónoma de Honduras
(UNAH), Ciudad Universitaria, Boulevard Suyapa, Tegucigalpa, Honduras
b Universidad de Sevilla, Facultad de Ciencias Económicas y Empresariales, Departamento de Economía
Financiera y Direccion de Operaciones, Grupo de Investigacion en Direccion de Operaciones en la
Industria y los Servicios (GIDEAO), Avenida Ramón y Cajal, 1,41018 Sevilla, Spain
c Universidad de Sevilla, Departamento de Economía Aplicada I, Facultad de Ciencias Económicas y
Empresariales, Avda. Ramón y Cajal , 1, 41018 Sevilla, Spain
d Faculty of Economics, Gakushuin University, Tokyo, Japan
Abstract
Many industries face open, global markets with requirements for rapid response and low costs. Given the
major role that technology plays in business competitiveness, proper technology management (T) in
combination with a good production strategy (S), is important to address current challenges. This paper
analyzes the nature of T & S implementation in different industrial contexts to examine whether there are
differences in how T & S are implemented in different sectors, whether implementation is linked to
performance, and whether contextual factors explain the differences. A database from the High
Performance Manufacturing Project is used to test the research questions based on a survey of 267 plants
across nine countries in three different industrial contexts (machinery, electronics and auto suppliers). The
findings show some differences between the T and S practice modes in the three industries. T and S
implementation is observed to be related to performance, but not in the same way. Three of the eight
contextual factors are found to differ in the three sectors, which may explain the differences found in T and
S implementation. The results imply that plants should consider the joint implementation of T and S as
their interdependencies may affect performance, outweighing the possible differences between industries in
which plants operate. However, when implementing a specific technology practice, not all plants
necessarily consider the same production strategy practices across industries. Likewise, when adopting a
certain production strategy, it is not necessarily influenced by the same technology practices across
industries.
Keywords: Production strategy, Technology, Strategic focus, Strategic planning, Fit, Interdependence
1. Introduction
2
Most of literature on the common implementation of production practices in both production strategy (S)
and technology (T) programs is largely prescriptive, with little systematic empirical research (e.g.,
Banerjee, 2000; Mohanty & Deshmukh, 1998). On the one hand, it is theoretically clear that when
implementing strategy, production achieves the long-term goal of effectiveness. In any event, any
production practice employed in a manufacturing plant should be consistent with its production strategy.
One example of this is that production strategy allocates pertinent technological resources, such as
technology practices, and aligns these resources with its strategy, so that technology practices can be
efficiently used to meet the objectives set out in the plant’s strategies. Hence, technology practices are
expected to be more effective in a plant that has a well-defined production strategy than in one that does not
(Dekkers et al., 2013)
On the other hand, implementing technologies embodied in production is an important issue that influences
long-term strategy at any manufacturing plant. From a perspective of production strategy, technology is
often seen as a source of core strategic competence for improving the reliability and attractiveness of
products and/or reducing manufacturing costs. One way to obtain an advantage from production strategy in
technology-intensive manufacturing industries is to exploit emergent product and process technologies to
develop and introduce attractive new products (Singh & Khanduja, 2010).
While implementations of many S and T practices in plants have been successful, many others have failed.
Previous research still does not provide enough insight into why some practices are a success in one plant
and the very same practices are a failure in its competitor. Although most empirical studies on S and T
investigate these programs separately (e.g., Thun, 2008; Manthou & Vlachopoulou, 2001; Rho et al., 2001),
successful manufacturing plants are likely to combine the implementation of production strategy and
technology practices, considering both.
Furthermore, special importance is placed on the relationship between the organizational system and its
environment in the contingency theory conceptual framework. Plants also vary internally depending on
whether they are located in stable or changing environments and they must be capable of not only
implementing manufacturing programs within certain contextual aspects, but also of interconnecting these
programs, in order to move plants forward into a better competitive position (Singh et al., 2008).
In volatile markets, such as the case of electronics companies, for example (Mallick & Schroeder, 2005;
Fine, 2000), a primary factor for being competitive could be high levels of technology practices
implemented in product and processes. Conversely, in other types of industries, where markets are more
stable and product cycles longer, such as auto suppliers and machinery, technology practices alone will not
create competitive advantages unless they are related to other production practices (Schroeder & Flynn,
2001).
However, while only a few studies have tried to explore the relationship between S and T practices
empirically (e.g., Matsui, 2002), even fewer, if any, have tested the two together, considering different
industries worldwide. Therefore, the purpose of this paper is to compare whether there are differences when
3
implementing practices from both programs in different contexts. This is the basis used to formulate the
next three research questions: 1) do plants need to implement the same production practices from S and T
regardless of their industry?, 2) are high performers in all industries implementing the production practices
from S and T in the same way?; and 3) are contextual factors the key to industry differences in the
implementation of T and S practices? These issues will be addressed empirically using a unique and
valuable database of technology and production strategy practices adopted by production plants around the
world, the associated competitive performance and plants’ contexts. To be specific, the research focuses on
the dependence relationships between implementations of production strategy and technology practices in
three industrial sectors: machinery, electronics, and auto suppliers, from nine countries around the world.
This is one of few studies testing for multidimensional performance differences in multi-practice T-S
linkages within multi-industrial environments.
The research mainly builds on earlier studies carried out internationally on the relationship between
production practices in these two manufacturing programs and takes the interdependence focus as its
reference. For data analysis the fit model will be used (Meilich, 2006; Drazin & Van de Ven, 1985). This is
suitable for the objective of this study as it is based on the assumption that for a production practice to be
controlled or improved, its levels of implementation have to be regulated or adapted, taking into
consideration the level of some other production practice, and/or vice-versa, as well as the common
implementation of all practices together. A comparison is made of the three industrial sectors under study
using the results to ascertain whether there are similarities or differences in the interrelationships between
the practices in the two programs due to differences in the sectors.
The remainder of this paper is divided into four sections. The following section sets out the theoretical
framework that establishes and defines both programs’ production practices and their proposed
relationships as the basis for the hypotheses. Subsequently, the methodology used to evaluate the
hypotheses is described. Next, the analysis of results and their discussion are presented. Finally, the main
conclusions and some lines of future research are presented.
2. Theoretical background and hypotheses
This paper considers the previous literature on S practices and T practices, but, to avoid an extensive
discussion, empirical work is mostly presented in this section.
2.1. Production strategy (S)
There is still insufficient broad empirical research in the documented production literature that clearly
addresses a well-implemented production strategy based on its practices (Hill & Hill, 2009; Hill, 2000).
Consequently, this sub-section focuses on the fact that for a properly implemented and well-aligned
production strategy, plants should consider four of its practices: anticipation of new technology;
manufacturing-business strategy linkage; formal strategic planning involving plant management; and
communication of manufacturing strategy (Schroeder and Flynn, 2001). Logically, these four aspects
4
(practices) do not represent the whole content of S, but they are sufficiently significant to have been studied
in previous papers.
On the one hand, there are clear signs that production strategies play a fundamental role in the assessment
of new technologies, since an analysis of appropriate technologies can eliminate many risks. Hence,
strategy practices such as anticipation of new technology are key factors in global competitiveness
(Machuca et al 2011).
In other regards, according to the classic conception defined in the strategy literature, which distinguishes
between processes and content (e.g., Kandemir et al. 2012; Swamidass and Newell 1987), it can be said
that the strategy practice of formal strategic planning process, which is successfully aligned with the
business strategy, is key to the formulation of production strategy. The formal planning perspective is
clearly distinguished from the concept of strategy solely as a model (guideline) for decision-making based
on past actions. The alignment of the external coupling (market) and the internal coupling (technology and
organization) through a strategy is so important that the literature suggests that a company can only survive
if the correct production and business advantages are interconnected in the strategy practice of
manufacturing-business strategy linkage (Yarbrough et al. 2011; Bates et al. 1995).
Finally, production strategy must be communicated and permeated to the plant personnel for it to be used
as a guide in decision-making, as this is crucial to it being successfully implemented (Ortega et al. 2011;
Bates et al. 1995). Through communication of manufacturing strategy, the production function is capable of
providing appropriate support to business strategy.
2.2. Technology Management (T)
The general trend towards an increase in the use of technology in manufacturing plants exists on the
premise that it will impact on effectiveness and efficiency (Torkkeli & Tuominen, 2002). However, these
investments are often criticized for not providing the desired results, i.e., technology initiatives often lead to
neither effective deployment of new practices nor the desired competitiveness being reached as quickly as
desired. For this to be understood, it is necessary to take into account that the performance effects of
technology are influenced by a number of factors, some of which can be controlled, and others which
cannot, but nonetheless they are all important for the final result.
Hence, plants need to have an even more progressive and dynamic vision of the management of
technologies in production by going beyond merely following the universal recommendation of simply
increasing technology use, by also considering in the “equation”, so to speak, the different aspects of its
production practices. Thus, when practices from technology aspects -product and process- are widely
applied in a factory, plants are more likely to steer towards a path to competitiveness, through this more
complete view of technology. Hence, an open definition of technology comprises not only of hardware
systems, but also human and organizational aspects of the way that the plant operates (Heim and Peng,
2010). Consequently, this study focuses on the following four production practices considering the two
main aspects of technology mentioned above (Fang et al., 2013).
5
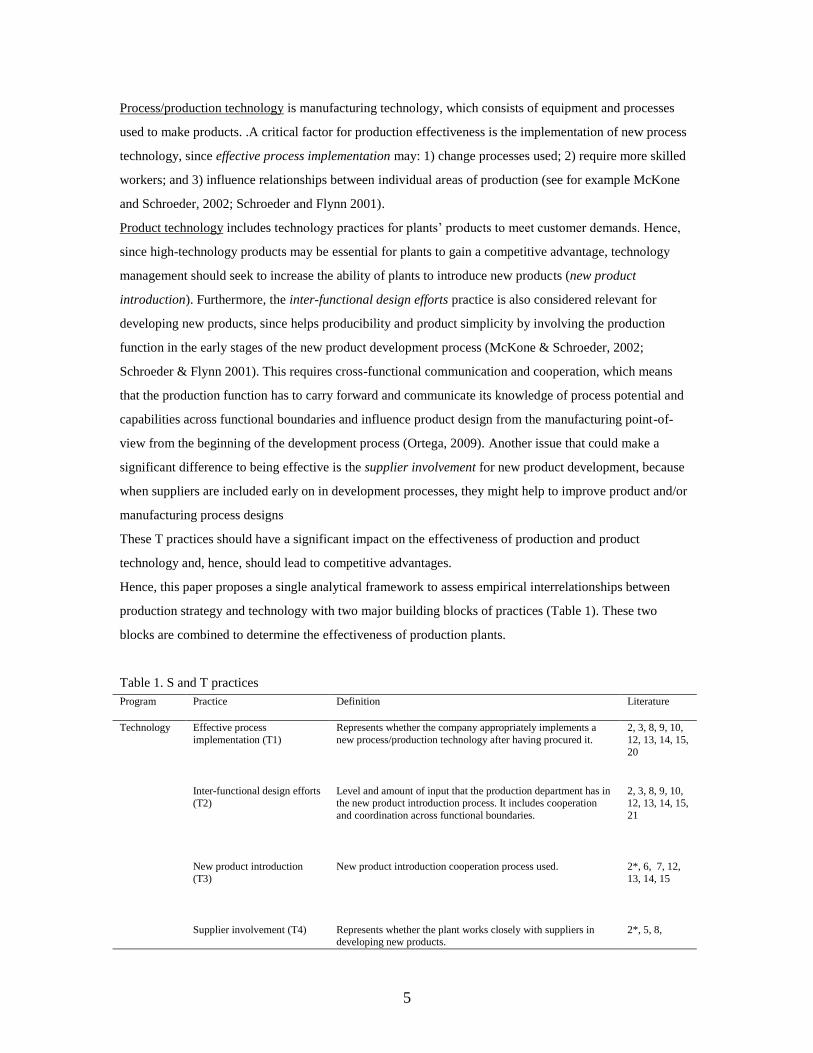
Process/production technology is manufacturing technology, which consists of equipment and processes
used to make products. .A critical factor for production effectiveness is the implementation of new process
technology, since effective process implementation may: 1) change processes used; 2) require more skilled
workers; and 3) influence relationships between individual areas of production (see for example McKone
and Schroeder, 2002; Schroeder and Flynn 2001).
Product technology includes technology practices for plants’ products to meet customer demands. Hence,
since high-technology products may be essential for plants to gain a competitive advantage, technology
management should seek to increase the ability of plants to introduce new products (new product
introduction). Furthermore, the inter-functional design efforts practice is also considered relevant for
developing new products, since helps producibility and product simplicity by involving the production
function in the early stages of the new product development process (McKone & Schroeder, 2002;
Schroeder & Flynn 2001). This requires cross-functional communication and cooperation, which means
that the production function has to carry forward and communicate its knowledge of process potential and
capabilities across functional boundaries and influence product design from the manufacturing point-of-
view from the beginning of the development process (Ortega, 2009). Another issue that could make a
significant difference to being effective is the supplier involvement for new product development, because
when suppliers are included early on in development processes, they might help to improve product and/or
manufacturing process designs
These T practices should have a significant impact on the effectiveness of production and product
technology and, hence, should lead to competitive advantages.
Hence, this paper proposes a single analytical framework to assess empirical interrelationships between
production strategy and technology with two major building blocks of practices (Table 1). These two
blocks are combined to determine the effectiveness of production plants.
Table 1. S and T practices
Program Practice Definition Literature
Technology Effective process
implementation (T1)
Represents whether the company appropriately implements a
new process/production technology after having procured it.
2, 3, 8, 9, 10,
12, 13, 14, 15,
20
Inter-functional design efforts
(T2)
Level and amount of input that the production department has in
the new product introduction process. It includes cooperation
and coordination across functional boundaries.
2, 3, 8, 9, 10,
12, 13, 14, 15,
21
New product introduction
(T3)
New product introduction cooperation process used. 2*, 6, 7, 12,
13, 14, 15
Supplier involvement (T4) Represents whether the plant works closely with suppliers in developing new products.
2*, 5, 8,
6
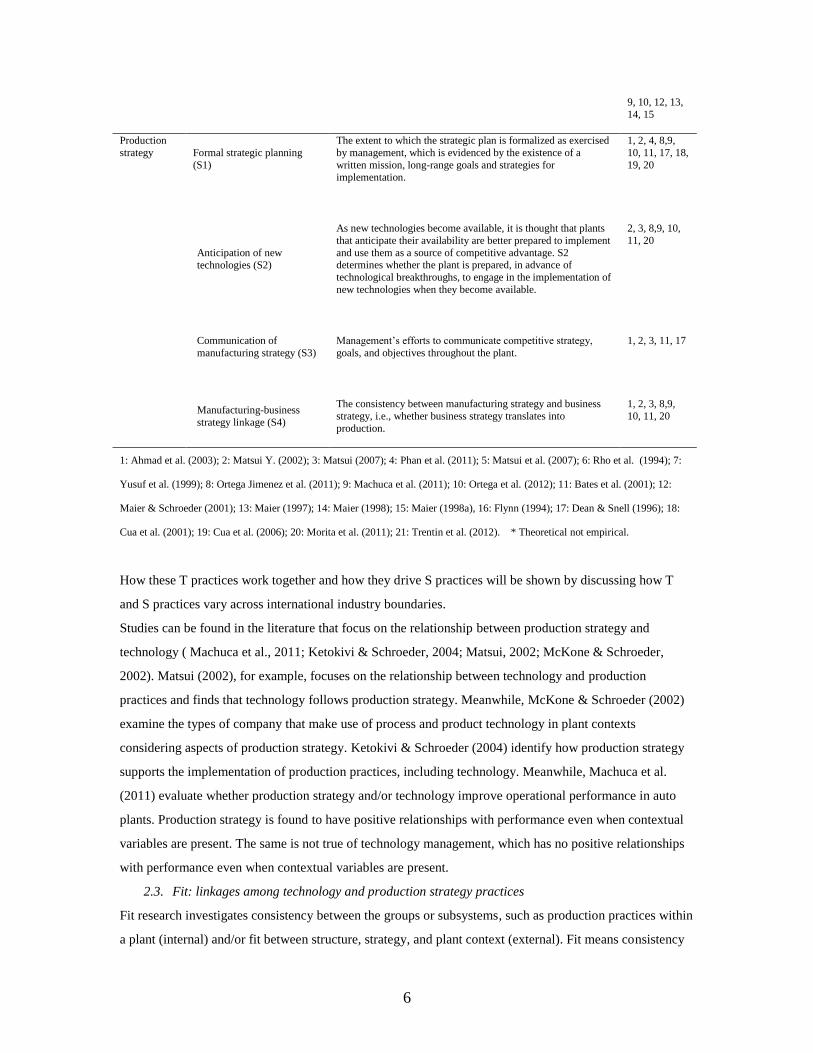
9, 10, 12, 13,
14, 15
Production
strategy Formal strategic planning
(S1)
The extent to which the strategic plan is formalized as exercised
by management, which is evidenced by the existence of a
written mission, long-range goals and strategies for
implementation.
1, 2, 4, 8,9,
10, 11, 17, 18,
19, 20
Anticipation of new
technologies (S2)
As new technologies become available, it is thought that plants
that anticipate their availability are better prepared to implement
and use them as a source of competitive advantage. S2 determines whether the plant is prepared, in advance of
technological breakthroughs, to engage in the implementation of
new technologies when they become available.
2, 3, 8,9, 10,
11, 20
Communication of
manufacturing strategy (S3)
Management’s efforts to communicate competitive strategy,
goals, and objectives throughout the plant.
1, 2, 3, 11, 17
Manufacturing-business
strategy linkage (S4)
The consistency between manufacturing strategy and business
strategy, i.e., whether business strategy translates into
production.
1, 2, 3, 8,9,
10, 11, 20
1: Ahmad et al. (2003); 2: Matsui Y. (2002); 3: Matsui (2007); 4: Phan et al. (2011); 5: Matsui et al. (2007); 6: Rho et al. (1994); 7:
Yusuf et al. (1999); 8: Ortega Jimenez et al. (2011); 9: Machuca et al. (2011); 10: Ortega et al. (2012); 11: Bates et al. (2001); 12:
Maier & Schroeder (2001); 13: Maier (1997); 14: Maier (1998); 15: Maier (1998a), 16: Flynn (1994); 17: Dean & Snell (1996); 18:
Cua et al. (2001); 19: Cua et al. (2006); 20: Morita et al. (2011); 21: Trentin et al. (2012). * Theoretical not empirical.
How these T practices work together and how they drive S practices will be shown by discussing how T
and S practices vary across international industry boundaries.
Studies can be found in the literature that focus on the relationship between production strategy and
technology ( Machuca et al., 2011; Ketokivi & Schroeder, 2004; Matsui, 2002; McKone & Schroeder,
2002). Matsui (2002), for example, focuses on the relationship between technology and production
practices and finds that technology follows production strategy. Meanwhile, McKone & Schroeder (2002)
examine the types of company that make use of process and product technology in plant contexts
considering aspects of production strategy. Ketokivi & Schroeder (2004) identify how production strategy
supports the implementation of production practices, including technology. Meanwhile, Machuca et al.
(2011) evaluate whether production strategy and/or technology improve operational performance in auto
plants. Production strategy is found to have positive relationships with performance even when contextual
variables are present. The same is not true of technology management, which has no positive relationships
with performance even when contextual variables are present.
2.3. Fit: linkages among technology and production strategy practices
Fit research investigates consistency between the groups or subsystems, such as production practices within
a plant (internal) and/or fit between structure, strategy, and plant context (external). Fit means consistency
7
of two or more factors and a good fit between relevant factors should improve effectiveness (Venkatraman,
1989). Since fit may explain why different practices may affect each other, its conceptualization in this
paper is according to the multiple interdependence research model in Figure 1, which is extended to include
the combined effects of S and T practices (Abdel-Maksoud et al., 2010; Gerdin, 2005, 2005a).
Some empirical questions concerning interdependences arise on the back of the above proposed model,
such as whether production strategy practices have a greater bearing on technology practices or whether the
opposite is true in different industrial contexts, and whether S practices and T practices have an equal effect,
or, even, no relationship at all. Hence, drawing on contingencies and interdependences in production
practices (e.g., Aoki et al., 2013; Jayaram & Xu, 2013; Rauniar & Rawski, 2012; Hallikas et al., 2012;
Boyle et al., 2008; de Vries, 2005; Fynes et al., 2005), this paper proposes to test for fit among practices,
following a similar typology to Thompson (1967) to analyze interdependence between work units within
organizations (pooled, sequential and reciprocal). According to this scheme, there will be three types of
interdependences: 1) pooled fit, where one practice proceeds in accordance with the action of another
practice with a common output, such as performance (i.e., co-ordination by standardization is suitable); 2)
sequential fit (one practice is dependent on another), where there is always an element of potential
contingency since a practice must be readjusted if another practice level changes (i.e., co-ordination by plan
may be used); and 3) interdependency as a high reciprocal fit, where contingency is permanent, for the
implementation in one practice must be adjusted to the actions of another practice and vice versa (i.e., co-
ordination by mutual adjustment is necessary).
What is sought with the analysis of the fit model is an understanding of the differentiation and integration
process in the relationship between plants and their environment. For example, the electronics sector
market is extremely dynamic with very short product lifecycles, and constant, rapid technological changes
in products and processes, and is a market where a great variety of products are handled. These features
position the electronics sector in an environment where plants must have responsiveness, and thus
technology could be a differentiating factor for generating competitive advantages. An environment with a
need for plant responsiveness requires the plant to be sensitive to customer requirements, and so strategy
must be capable of detecting new technologies early and communicating them to the plant efficiently.
However, in the machinery sector, with its complex products that require high levels of investment and
which are sensitive to changes in technology, but which have a longer lifecycles and more stable product
designs, cost reductions could be a competitive element, and so this sector could be situated in an
environment that focuses on efficiency.
Conversely, the auto supplier sector depends greatly on the dynamics of the automobile industry, which is
characterized by being highly competitive with efficient production processes, and with markets that are a
little more stable. Given that the auto industry has long-term contracts with its customers (automobile
industry) and has relationship processes with its customers, its market is a little more stable with a high
level of service. This positions the sector to focus on the intermediate threshold between rapid response and

8
efficiency. As its market is stable, strategy must be strengthened through coordination with customers,
through strategic planning and the link with supply chain strategy in order to achieve process efficiency.
For this very reason, involvement in new product development is vital for reducing launch lead times. This
strongly suggests that there must be some kind of relationship between S practices and T practices given
the intermediate environment between rapid response and efficiency, but that this could be governed by S
practices.
On the basis of the foregoing it can be anticipated that S and T have different types of fit in the 3 sectors
under consideration: sequential fit in electronics (from T to S) and in machinery (from S to T) and
reciprocal fit in auto suppliers. Therefore, in keeping with the concept of fit (Drazin & Van de Ven, 1985;
Venkatraman, 1989), S and T practices should be examined within a single theoretical framework so that
the effects of their joint implementation can be investigated. This is reflected in the following hypothesis
designed to answer some of the above questions.
H1: There are different types of dependence relationships/fits between T and S practices in the three
industries considered.
2.4. S and T practice effects on performance
Besides the proposed linkages between practices, it is important to also include an analysis of “strategic
focus” factors in the relationships studied here, that is, the strengths or values that plants wish to enhance to
have competitive outcomes (Yarbrough et al., 2011. Ortega & Eguia, 2010; Hallgren & Olhager, 2006;
Zahra & Covin, 1993; Itami & Numagami, 1992.). A mainly descriptive analysis based on a congruence fit
model has been done thus far to learn more about what the above relationships suggest, i.e., of the
relationships between T and S practices that govern plants’ behavior. However, going beyond this model,
this paper also tests to see whether descriptive merit holds true, even when cross-referred with normative
merit, i.e., rules plants should strengthen, where relationships between extracted relational rules of T and S
and plant performance/competitiveness are meaningful. This will be examined through the following
hypothesis:
H2: There is a positive relationship between the implementation levels of T and S practices, and
plant performance in all three sectors
2.5. Contextual effects on S and T practices
Lack of fit problems in plant contexts, such as strategy and technology incompatibilities, may affect a plant
outcome (Hayes & Wheelwright, 1984; Lawrence & Lorsch, 1967). Also, some practitioners suggest that,
in the context of their plant, some T and/or S practices are very hard to implement and that sometimes, even
when implemented successfully, they do not give the expected results. So it is important to explore whether
contextual factors help differentiate between the three industries in the common implementation of both S
9
and T practices. Therefore, apart from the production practices being implemented, the research also
considers contextual variables.
Drawing partially on Kotha & Orne (1989), this paper initially takes in three dimensions of organizational
scope environment (geographic market focus, degree of vertical integration, and size and scale of
operations), and two dimensions of complexity environment (process structure, product line). There is a
great deal of recent literature giving evidence that this typology has provided a useful approximation to the
manufacturing structure framework for the past three decades (Helkiö & Tenhiälä, 2013; Ha et al., 2012;
Ringen et al., 2012; Goodale et al., 2011; Jacobs et al., 2011; Bozarth et al., 2009; Kemppainen et al., 2008;
Thun, 2008; van Veen-Dorks, 2005). These factors from the industrial environment are expected to affect
the proposed production structure framework. For example, geographic market focus influences availability
of resources, such as supplier, sales force or channels, transportation and “competitive requirements”, such
as order-winning and order-qualifying criteria.
However, while the complexity of the environment may be adequately represented by this
operationalization that classifies process & product technology, three more measures of complexity are also
included in order to have a much broader conceptualization of the complexity of the manufacturing
structure framework. They are parts per product line, workplace design, and equipment and processes
(Matsui, 2007).
To summarize, using these contextual variables, it is proposed that common implementations of S and T
practices can be expected from production plants depending on the organizational scope, and complexity of
their respective industrial environments. Therefore contextual variables are included in this study and their
influence will be examined with the following hypothesis.
H3: Contextual factors (organizational scope and complexity) contribute to the explanation of
some industry differences
However, it is expected that a plant’s S and T practices provide a better explanation for the industrial
environment of the plant, since it is believed that practices adopted by a plant may reduce the negative
effects of industry factors.
10
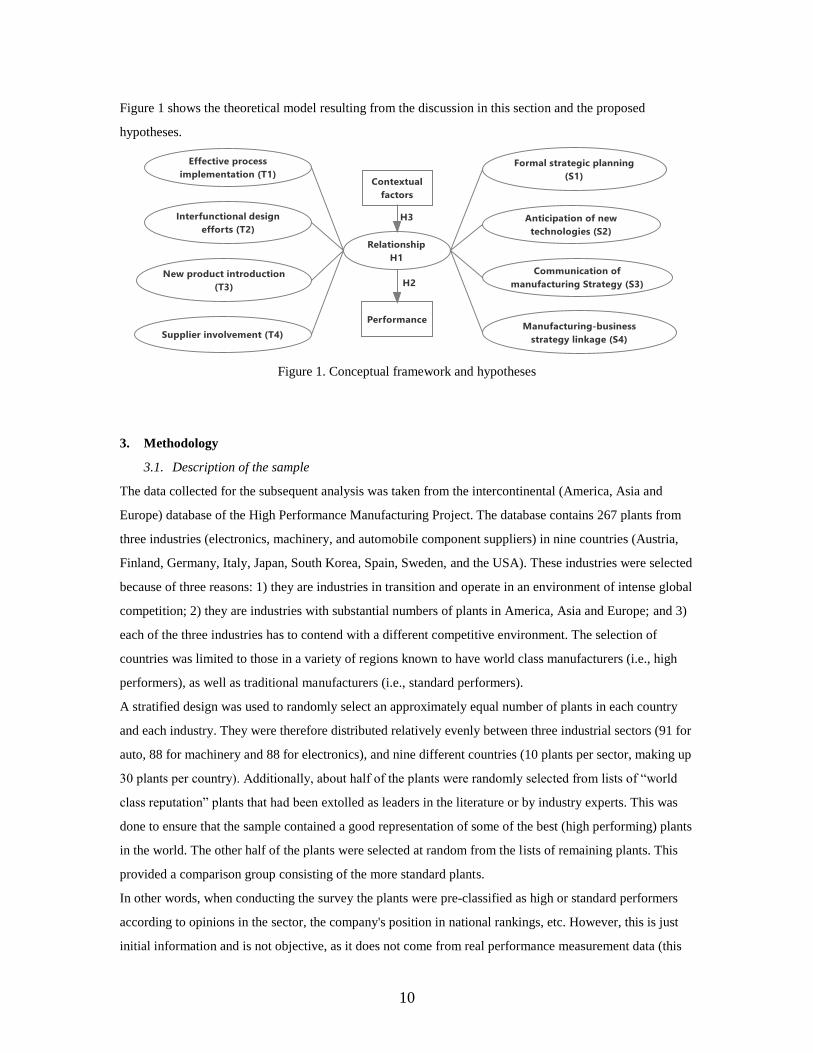
Figure 1 shows the theoretical model resulting from the discussion in this section and the proposed
hypotheses.
Figure 1. Conceptual framework and hypotheses
3. Methodology
3.1. Description of the sample
The data collected for the subsequent analysis was taken from the intercontinental (America, Asia and
Europe) database of the High Performance Manufacturing Project. The database contains 267 plants from
three industries (electronics, machinery, and automobile component suppliers) in nine countries (Austria,
Finland, Germany, Italy, Japan, South Korea, Spain, Sweden, and the USA). These industries were selected
because of three reasons: 1) they are industries in transition and operate in an environment of intense global
competition; 2) they are industries with substantial numbers of plants in America, Asia and Europe; and 3)
each of the three industries has to contend with a different competitive environment. The selection of
countries was limited to those in a variety of regions known to have world class manufacturers (i.e., high
performers), as well as traditional manufacturers (i.e., standard performers).
A stratified design was used to randomly select an approximately equal number of plants in each country
and each industry. They were therefore distributed relatively evenly between three industrial sectors (91 for
auto, 88 for machinery and 88 for electronics), and nine different countries (10 plants per sector, making up
30 plants per country). Additionally, about half of the plants were randomly selected from lists of “world
class reputation” plants that had been extolled as leaders in the literature or by industry experts. This was
done to ensure that the sample contained a good representation of some of the best (high performing) plants
in the world. The other half of the plants were selected at random from the lists of remaining plants. This
provided a comparison group consisting of the more standard plants.
In other words, when conducting the survey the plants were pre-classified as high or standard performers
according to opinions in the sector, the company's position in national rankings, etc. However, this is just
initial information and is not objective, as it does not come from real performance measurement data (this
11
would be the initially declared status). This aim of this information is, therefore, to act as an initial guide to
obtain a certain number of the two types of plant. Subsequently, and precisely to meet the various research
objectives, papers that use the database should provide objective confirmation as to which plants are really
high performers with regard to the performance measures considered in the research (Section 3.3). This can
only be done using the real performance measures obtained in the survey and this is what any article does
in this respect (work with the real empirical data and not with information taken from lists and external
opinions). Despite the stratification of the sample, it is not the aim of this research to make cross-
comparisons between countries and/or industries.
3.2. Measurements
The questionnaires used as data collection instruments were developed from a comprehensive literature
review. Their content validity was then strengthened by panels of experts, instrument pretesting at plants,
translation verification (i.e., native language-English back-translation). Twelve questionnaires were used,
aimed at different positions in the plant, from plant manager to shop floor worker. Only information about
practices for production strategy, and technology, and contextual variables for the three industrial sectors
under study was mined for the study.
• S and T practices
The questionnaires envisaged scales and measures for the various advanced production practices through
two to six question items measured using a seven-point Likert scale on which one represented: “totally
disagree” and the maximum, seven, “totally agree”. They were then used to construct the measurement
scales. Individual question items are shown in Appendixes A & B.
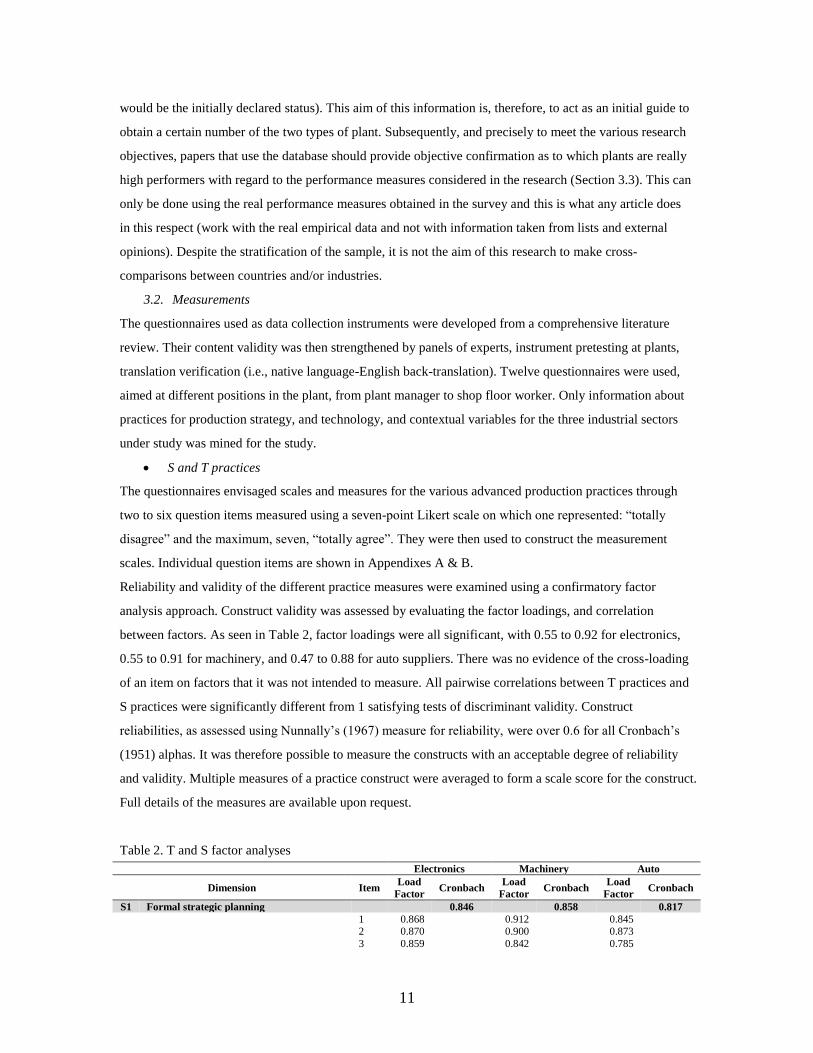
Reliability and validity of the different practice measures were examined using a confirmatory factor
analysis approach. Construct validity was assessed by evaluating the factor loadings, and correlation
between factors. As seen in Table 2, factor loadings were all significant, with 0.55 to 0.92 for electronics,
0.55 to 0.91 for machinery, and 0.47 to 0.88 for auto suppliers. There was no evidence of the cross-loading
of an item on factors that it was not intended to measure. All pairwise correlations between T practices and
S practices were significantly different from 1 satisfying tests of discriminant validity. Construct
reliabilities, as assessed using Nunnally’s (1967) measure for reliability, were over 0.6 for all Cronbach’s
(1951) alphas. It was therefore possible to measure the constructs with an acceptable degree of reliability
and validity. Multiple measures of a practice construct were averaged to form a scale score for the construct.
Full details of the measures are available upon request.
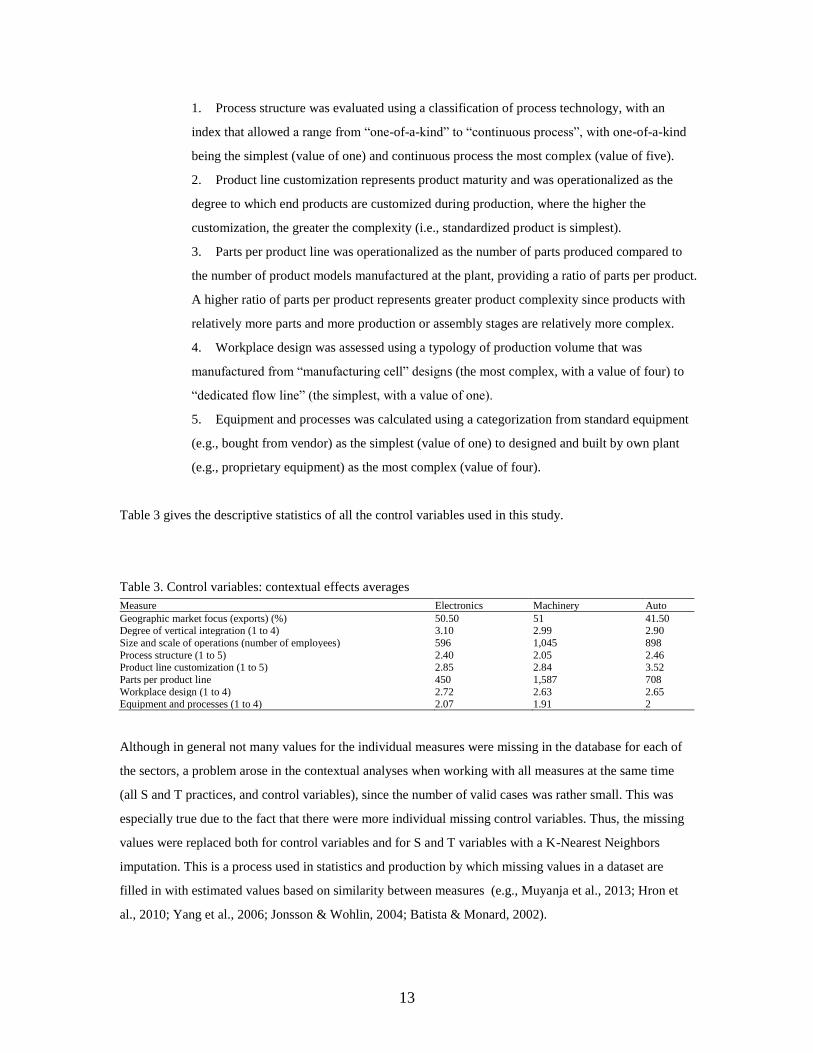
Table 2. T and S factor analyses
Electronics Machinery Auto
Dimension Item Load
Factor Cronbach
Load
Factor Cronbach
Load
Factor Cronbach
S1 Formal strategic planning 0.846 0.858 0.817
1 0.868
0.912
0.845
2 0.870 0.900 0.873
3 0.859 0.842 0.785
12
4 0.733 0.703 0.717
S2 Anticipation of new technologies 0.857 0.775 0.787
1 0.795
0.653
0.766
2 0.869 0.844 0.848 3 0.819 0.749 0.706
4 0.878 0.884 0.850
S3 Communication of manufacturing strategy 0.831 0.723 0.718
1 0.926
0.885
0.883
2 0.926 0.885 0.883
S4 Manufacturing-business strategy linkage 0.775 0.826 0.825
1 0.813
0.752
0.768
2 0.696 0.786 0.670
3 0.773 0.865 0.810 4 0.832 0.726 0.858
5 0.569 0.643 0.643
6 0.562 0.689 0.695 T1 Effective process implementation 0.690 0.779 0.774
1 0.590
0.547
0.476
2 0.559 0.726 0.708 3 0.728 0.728 0.788
4 0.698 0.853 0.848
5 0.813 0.852 0.836 T2 Inter-functional design effort 0.835 0.838 0.753
1 0.811
0.820
0.729
2 0.854 0.839 0.743 3 0.798 0.804 0.735
4 0.827 0.830 0.842 T3 New product introduction 0.636 0.610 0.639
1 0.856
0.849
0.858
2 0.856 0.849 0.858
T4 Supplier involvement 0.804 0.874 0.811
1 0.860
0.895
0.874
2 0.812 0.853 0.785 3 0.848 0.837 0.724
4 0.655 0.825 0.816
• Control variables: context effect
Plant effectiveness is affected by many factors other than S practices and T practices. However, due to data
limitations it is not possible to identify and eliminate these factors completely. As stated in section 2.5, this
paper identifies some factors in the industrial environment from the literature which are expected to affect
the proposed production structure framework, but a full study of these is outside the scope of this paper.
Thus, the eight final dimensions were operationalized as follow.
A. Organizational scope
1. Geographic market focus was estimated as the proportion of the plant’s production that
was exported.
2. Degree of vertical integration was assessed by directly asking an appropriate key
informant, the plant manager, the degree to which his firm was vertically integrated (i.e.,
owns elements of the total chain from transforming a raw material to putting it in the hands of
the consumers). It was measured from no integration (1) to maximum integration (4).
2. Size and scale of operations were measured by the number of personnel employed during
the current year.
B. Complexity of the environment.
13
1. Process structure was evaluated using a classification of process technology, with an
index that allowed a range from “one-of-a-kind” to “continuous process”, with one-of-a-kind
being the simplest (value of one) and continuous process the most complex (value of five).
2. Product line customization represents product maturity and was operationalized as the
degree to which end products are customized during production, where the higher the
customization, the greater the complexity (i.e., standardized product is simplest).
3. Parts per product line was operationalized as the number of parts produced compared to
the number of product models manufactured at the plant, providing a ratio of parts per product.
A higher ratio of parts per product represents greater product complexity since products with
relatively more parts and more production or assembly stages are relatively more complex.
4. Workplace design was assessed using a typology of production volume that was
manufactured from “manufacturing cell” designs (the most complex, with a value of four) to
“dedicated flow line” (the simplest, with a value of one).
5. Equipment and processes was calculated using a categorization from standard equipment
(e.g., bought from vendor) as the simplest (value of one) to designed and built by own plant
(e.g., proprietary equipment) as the most complex (value of four).
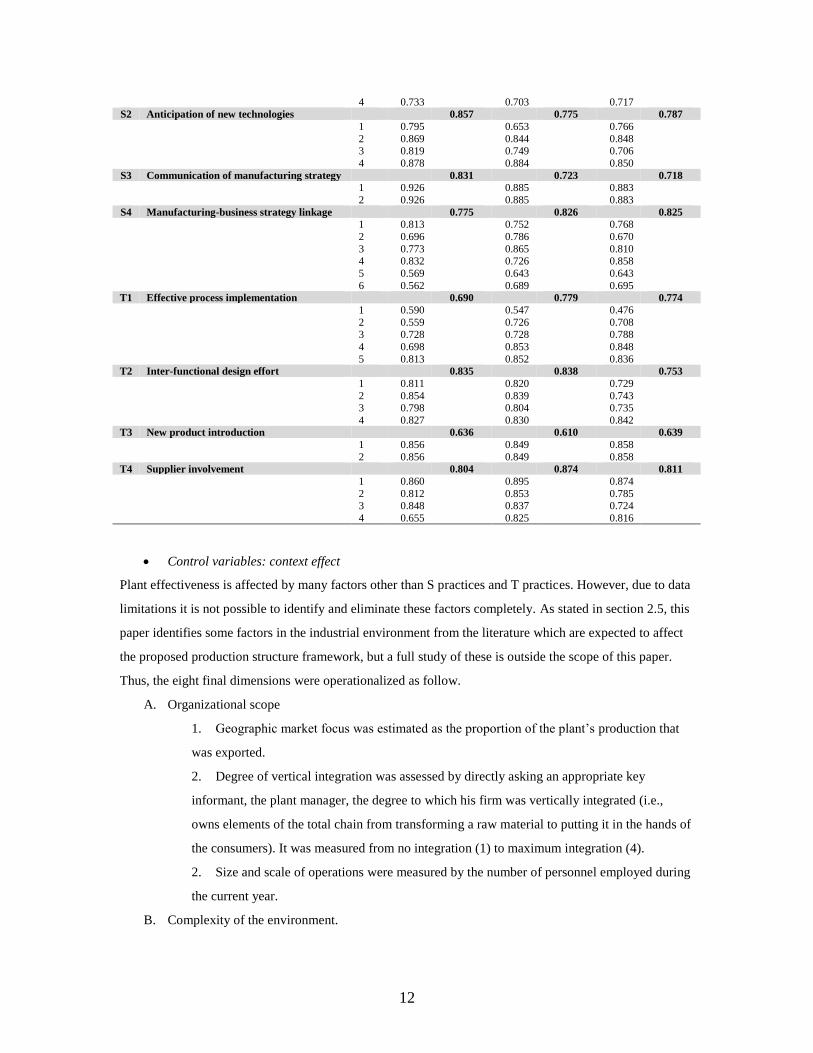
Table 3 gives the descriptive statistics of all the control variables used in this study.
Table 3. Control variables: contextual effects averages
Measure Electronics Machinery Auto
Geographic market focus (exports) (%) 50.50 51 41.50 Degree of vertical integration (1 to 4) 3.10 2.99 2.90
Size and scale of operations (number of employees) 596 1,045 898
Process structure (1 to 5) 2.40 2.05 2.46 Product line customization (1 to 5) 2.85 2.84 3.52
Parts per product line 450 1,587 708
Workplace design (1 to 4) 2.72 2.63 2.65 Equipment and processes (1 to 4) 2.07 1.91 2
Although in general not many values for the individual measures were missing in the database for each of
the sectors, a problem arose in the contextual analyses when working with all measures at the same time
(all S and T practices, and control variables), since the number of valid cases was rather small. This was
especially true due to the fact that there were more individual missing control variables. Thus, the missing
values were replaced both for control variables and for S and T variables with a K-Nearest Neighbors
imputation. This is a process used in statistics and production by which missing values in a dataset are
filled in with estimated values based on similarity between measures (e.g., Muyanja et al., 2013; Hron et
al., 2010; Yang et al., 2006; Jonsson & Wohlin, 2004; Batista & Monard, 2002).
14
• Performance
Eight different indicators frequently used in the literature have been used to measure performance: cost,
quality, cycle time, development lead time, on-time delivery performance, on-time new product launch,
flexibility to change product mix, flexibility to change volume. Questions relating to performance were
answered using Likert 1-to-5 rating scales. An ANOVA was used to confirm that all performance variables
did not present significant differences by industry, with the aim of discovering whether the variables
needed to be treated for each of the industries separately, or for all the industries jointly. From the results of
the ANOVA it was deduced that they could be created for all the industries as a whole (the p-values of F
statistics ranged from 0.386 for lead time to 0.939 for product mix flexibility). Hence, cost was measured
by unit cost of manufacturing. Secondly, quality was assessed with conformance to product specifications.
Thirdly, a factor analysis was carried out with the remaining six performance variables to see whether they
defined a single factor (responsiveness). The answer was ‘yes’ (factor loadings ranging from 0.607 to
0.741). Cronbach’s alpha was calculated for the performance dimensions for responsiveness and the result
was high, 0.775. On this basis, a responsiveness variable was created as the mean of the cycle time,
development lead time, on-time delivery performance, on-time new product launch, flexibility to change
product mix and flexibility to change volume variables. Finally, cost, quality and responsiveness were then
used in order to observe overall multidimensional competitiveness.
3.3. Methods of analysis
As previously stated, this research tries to determine whether or not the implementation of some production
practices associated with T and others associated with S explain different T-S interdependences in
industries (H1). The relationship between the implementation of the practices and performance is also
analyzed (H2). Contextual control variables are also considered, since they may affect interdependences
(H3). A multivariate focus congruence model will be used to test H1 hypothesis, with multivariate multiple
regression analysis (MMR). Multiple correspondence analysis (MCA) will be used to test H2 for the
performance impact of both sets of practices. Finally, the contextual proposition H3 will be tested by one-
way ANOVA (Table 4).
Fit has been widely measured through regression coefficients in the congruence/selection perspective (e.g.,
Umanath & Kim, 1992). Regression analysis not only shows the general direction of the association, but
also provides the degree to which the independent variables affect the dependent variable. The multivariate
part of the regression is due to the four outcome variables from each of the production programs (S and T).
The multiple part of the regression is due to the fact that there are four predictor variables for the other
corresponding program. It is important to note that this method is not being suggested for simultaneous
15
equations, since it may cause the regression coefficients to be biased. Therefore each of the two tests (i.e., S
practices to T practices and T practices to S practices) tests industry differences.
To test H2, plants were classified by their competitive position as high and standard performers. Although
the sample was designed to include both high and standard performing plants (see Section 3.1), this paper
decided not to rely on their initially declared status, as it was sometimes based on subjective information.
Instead, an analysis was performed to distinguish between two plant types based on performance
classification in all three performance measures considered here (cost, quality, and responsiveness): high
performer (HP) for higher-than-average in all measures, and standard performer (SP) for lower-than-
average. To confirm the importance of linkages between practices in both groups, multiple correspondence
analysis (MCA) was proposed. MCA is a technique for nominal categorical data used to detect and
represent underlying structures of practice linkage in the resulting groups. Depending on their scores plants
were classified as high implementation and low implementation for each of the S and T practices.
A one-way ANOVA was used to compare the means of the contextual variables in order to confirm the
results of the contextual variables as differentiators of industry differences. For this, a test for the
homogeneity of variance (Levene's statistic) was performed previously. Next, if there were significant F-
values in the ANOVA, multiple comparisons were used to confirm that all the means were not equal, with
pairwise comparisons by Tukey's HSD. Finally, confirmation was achieved by testing for homogeneous
subsets, which essentially reflected the previous information. This was done by means of grouping together
industry results; both those that did not differ from each other in a common group, as well as others that did
not differ from each other, but were different from other groups.
Table 4. Hypotheses testing and methods of analysis
Step Hypotheses Method Variables
1 H1: interdependence of S to T practices across industries MMR Independent: 4 Si; dependent: 4 Ti MMR Independent: 4 Ti; dependent: 4 Si
2 H2: examination of industry performance from the common implementation of T and S practices
MCA 4 Si, 4 Ti, & Performance
3 H3: examination of industrial context impacts on the common implementation of T and S practices
ANOVA 8 control variables
4. Results and discussion
In this section, the findings are analyzed in the three industrial sectors according to the hypotheses, the data
of the international survey described above, and prior studies on the interrelationships (linkages) between S
and T. Reviews of analyses and discussions of results are in the same order that the hypotheses were
developed in Table 4.
4.1. S to T linkages across industries
Firstly, in Table 5 simple correlation coefficients are reviewed between the production practices for T and S.
Most (38 out 48) of these are significantly greater than zero (at 0.01, 0.05, and 0.1). The ten exceptions are:
two in auto suppliers for T3 (S1 and S3), three in electronics for T4 (S1, S2 and S3), all four for T4 in
16
machinery, and one for auto supplier for T4 (S3). Hence, it is clear that T4 is not as closely related to S
practices as the other T practices.
Table 5. Correlations between practices
Practice T1 T2 T3 T4
E M A E M A E M A E M A
S1 0.557 0.454 0.614 0.403 0.378 0.295 0.332 0.343 - - - 0.293
S2 0.658 0.575 0.607 0.357 0.457 0.422 0.483 0.421 0.375 - - 0.254
S3 0.404 0.379 0.441 0.402 0.439 0.389 0.156 0.302 - - - - S4 0.609 0.686 0.631 0.249 0.410 0.391 0.325 0.390 0.186 0.180 - 0.282
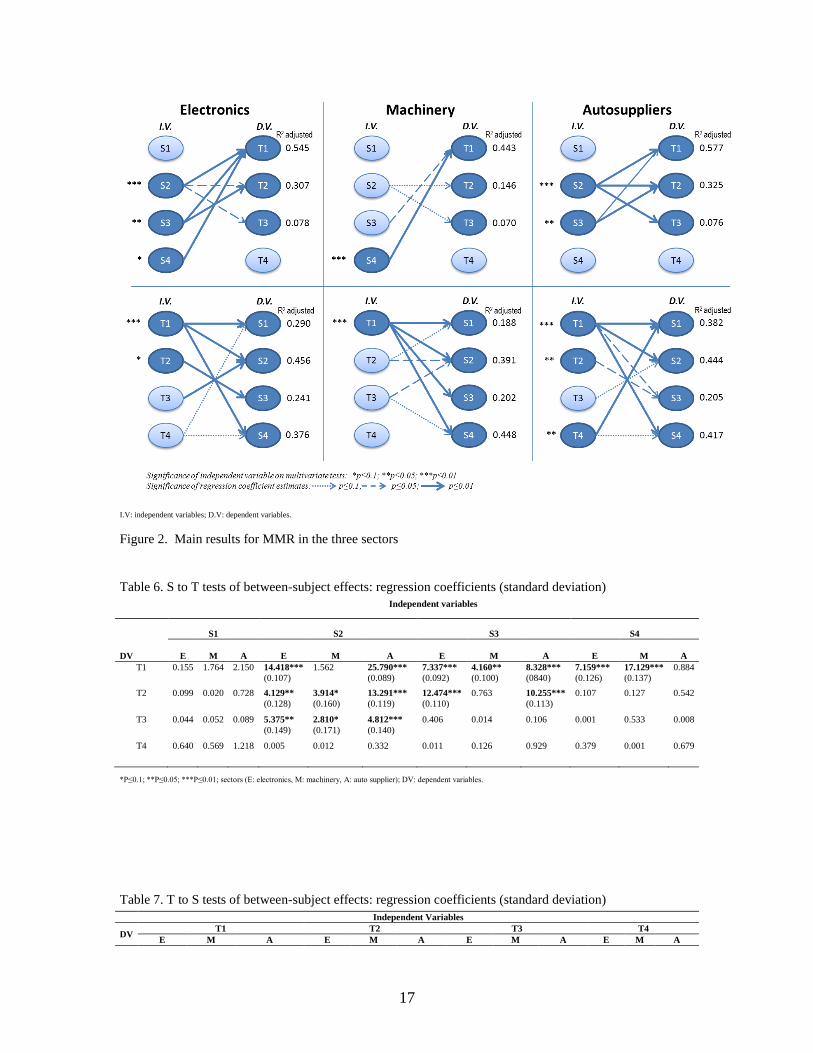
Next, a model that simultaneously analyses two or more dependent variables that are to be predicted from
two or more predictor variables is used. For the analysis the scales for each practice are considered as
dependent or independent variables depending on the hypothesis test that is being performed. In the first
MMR analysis for hypothesis H1 the technology scales depend on production strategy scales. In the second
MMR analysis, the strategy scales act as, dependent variables and the technology scales as independent
variables. Figure 2 gives the results of both MMR analyses in each of the 3 sectors. The independent
variables that were significant in the multivariate tests (Pillai’s Trace, Wilks’ Lambda, Hotelling’s Trace
and Roy’s largest root) are shown in bold on the left-hand side of each Figure with the level of significance
indicated. The dependent variables that were significant are shown in bold on the right with the coefficient
of determination (adjusted R2). The type of arrow that goes from the independent variables to the dependent
variables indicates the corresponding regression coefficient’s significance level. Non-significant regression
coefficients are indicated by no arrow. Tables 6 and 7 show the values of all the regression coefficients,
together with their standard errors in both MMR models.
17
I.V: independent variables; D.V: dependent variables.
Figure 2. Main results for MMR in the three sectors
Table 6. S to T tests of between-subject effects: regression coefficients (standard deviation)
Independent variables
DV
S1 S2 S3 S4
E M A E M A E M A E M A
T1 0.155 1.764 2.150 14.418***
(0.107)
1.562 25.790***
(0.089)
7.337***
(0.092)
4.160**
(0.100)
8.328***
(0840)
7.159***
(0.126)
17.129***
(0.137)
0.884
T2 0.099 0.020 0.728 4.129**
(0.128)
3.914*
(0.160)
13.291***
(0.119)
12.474***
(0.110)
0.763 10.255***
(0.113)
0.107 0.127 0.542
T3 0.044 0.052 0.089 5.375**
(0.149)
2.810*
(0.171)
4.812***
(0.140)
0.406 0.014 0.106 0.001 0.533 0.008
T4 0.640 0.569 1.218 0.005 0.012 0.332 0.011 0.126 0.929 0.379 0.001 0.679
*P≤0.1; **P≤0.05; ***P≤0.01; sectors (E: electronics, M: machinery, A: auto supplier); DV: dependent variables.
Table 7. T to S tests of between-subject effects: regression coefficients (standard deviation)
Independent Variables
DV T1 T2 T3 T4
E M A E M A E M A E M A
18
S1 10.106***
(0.127)
9.906***
(0.106)
32.828***
(0.117)
1.259 3.133*
(0.113)
1.840 1.186 0.770 1.840 3.104*
(0.102)
1.123 7.166***
(0.099)
S2 27.306***
(0.111)
24.621***
(0.092)
24.646***
(0.112)
0.063 6.037**
(0.092)
1.109 6.940***
(0.088)
4.111**
(0.091)
1.109*
(0.091)
1.445 0.323 1.447
S3 1.908 14.145***
(0.108)
5.453**
(0.134)
8.381***
(0.130)
2.574 4.749**
(0.133)
0.431 0.195 4.749 0.289 0.016 1.341
S4 26.519***
(0.114)
43.984***
(0.086)
30.155***
(0.116)
0.215 2.188 0.022 1.373 3.391*
(0.086)
0.022 2.879*
(0.091)
0.255 3.877*
(0.097)
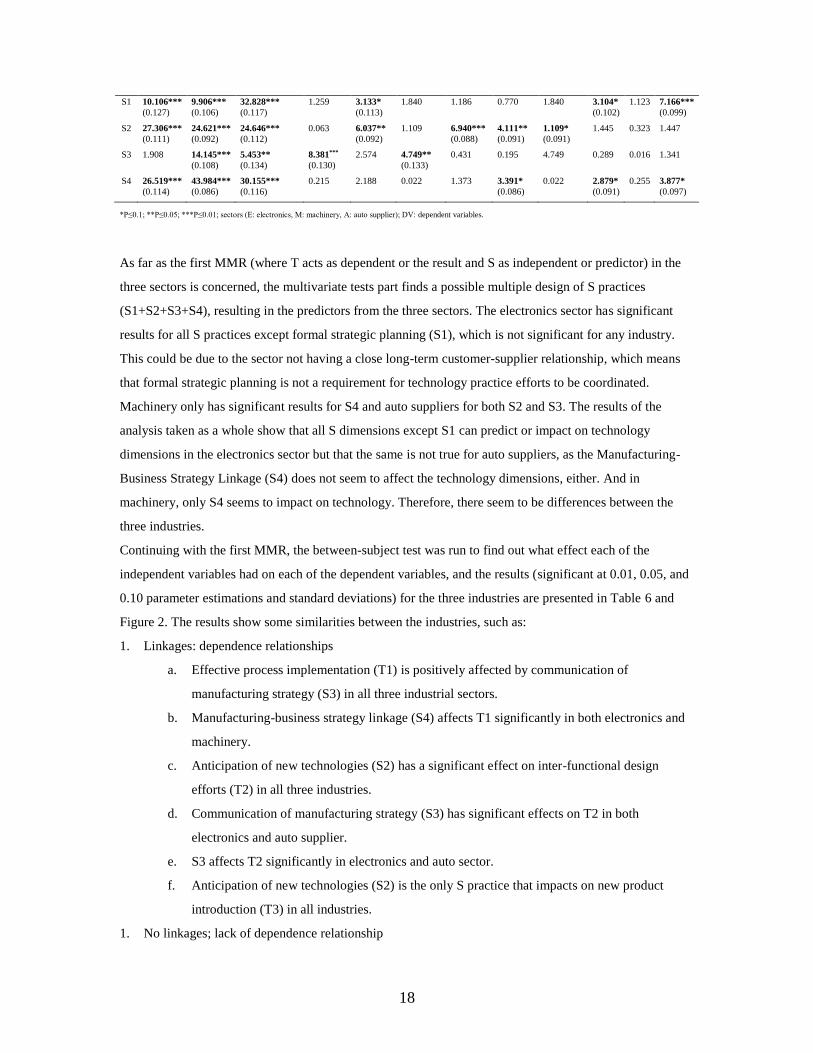
*P≤0.1; **P≤0.05; ***P≤0.01; sectors (E: electronics, M: machinery, A: auto supplier); DV: dependent variables.
As far as the first MMR (where T acts as dependent or the result and S as independent or predictor) in the
three sectors is concerned, the multivariate tests part finds a possible multiple design of S practices
(S1+S2+S3+S4), resulting in the predictors from the three sectors. The electronics sector has significant
results for all S practices except formal strategic planning (S1), which is not significant for any industry.
This could be due to the sector not having a close long-term customer-supplier relationship, which means
that formal strategic planning is not a requirement for technology practice efforts to be coordinated.
Machinery only has significant results for S4 and auto suppliers for both S2 and S3. The results of the
analysis taken as a whole show that all S dimensions except S1 can predict or impact on technology
dimensions in the electronics sector but that the same is not true for auto suppliers, as the Manufacturing-
Business Strategy Linkage (S4) does not seem to affect the technology dimensions, either. And in
machinery, only S4 seems to impact on technology. Therefore, there seem to be differences between the
three industries.
Continuing with the first MMR, the between-subject test was run to find out what effect each of the
independent variables had on each of the dependent variables, and the results (significant at 0.01, 0.05, and
0.10 parameter estimations and standard deviations) for the three industries are presented in Table 6 and
Figure 2. The results show some similarities between the industries, such as:
1. Linkages: dependence relationships
a. Effective process implementation (T1) is positively affected by communication of
manufacturing strategy (S3) in all three industrial sectors.
b. Manufacturing-business strategy linkage (S4) affects T1 significantly in both electronics and
machinery.
c. Anticipation of new technologies (S2) has a significant effect on inter-functional design
efforts (T2) in all three industries.
d. Communication of manufacturing strategy (S3) has significant effects on T2 in both
electronics and auto supplier.
e. S3 affects T2 significantly in electronics and auto sector.
f. Anticipation of new technologies (S2) is the only S practice that impacts on new product
introduction (T3) in all industries.
1. No linkages; lack of dependence relationship
19
a. Formal strategic planning (S1) has no significant impact on any of the T practices in all three
industries. This is somewhat surprising, since it shows that T practices do not consider
strategic formalization for their implementation to any great extent. This is probably caused
by ever-changing global markets, making T practices more responsive and less rigid to long-
term planning.
b. Supplier involvement (T4) is not affected by any S practices in any industry. This is probably
due to the fact that suppliers are external and not under plant control.
It can therefore be concluded that overall there are some relationships between three of the S practices (all
but S1) and three of the T practices (all but T4) showing dependence from S to T in the related-practices,
with some industry differences, where electronics has one more practice dependence combination (six) than
auto (five), and two more than machinery (four). Some S practices therefore have a slight impact on some
technology practices that is relatively similar in all three industries. It is important to note that even in cases,
where there is no dependence, they are across industries.
Moving on to the second MMR, the lower part of Figure 2 presents the results of the MMR analysis with T
scales as predictors for each of the three industries. The multivariate tests on T practices (T1+T2+T3+T4)
show that effective process implementation (T1) is the only T practice with a significant impact on S in all
the industries tested. New product introduction (T3) seems to have no significant effect on S in any of the
industries, possibly because the market needs of responsiveness make it less rigid to long-term planning.
On the other hand, inter-functional design effort (T2) only impacts significantly on S in electronics,
marking a small difference from the other two sectors. Auto supplier is the only sector where supplier
involvement (T4) impacts on S.
Table 7 shows the between-subject effects tests (significant at 0.01, 0.05, and 0.10 parameter estimations
and standard deviations) with the results depicted in Figure 2 (arrows). The results show the following
similarities in dependence relationships:
1. Effective process implementation (T1) impacts on all S production practices significantly in all
industries except S3 in electronics.
2. T4 impacts S1significantly both in electronics and in auto supplier.
3. S2 is affected significantly by T3 in all three industries.
4. S3 has the same T practices impacting it significantly in the following industries:
a. T2 in electronics and auto supplier
b. T1 in machinery and auto supplier
5. T4 affects S4significantly in both electronics and auto supplier
There are some differences in some dependence relationship linkages. For instance, T2 affects S1 and S2,
and also T3 impacts S4 only in machinery.
20
Regarding a lack of linkages, that is, where a dependence relationship is not found:
1. Similarities in all three industries: T3 does not affect S1; T4 did not affect S2 or S3; T2 did not affect
S4.
2. The only difference between industries was that T4 does not impact any of the S practices in
machinery significantly. This shows that the S practices under consideration are implemented in this
industry without considering technology supplier involvement. This may be due to industry plants
either buying standardized technology or making their own technology, which makes them
independent from technology suppliers.
As such, some technology practices are affecting some S practices, but there are some differences between
the sectors on the dimensions level tilting toward machinery (i.e. S a little less influenced by T. Again, it is
noted that all cases but one (T4 on machinery) where there are no dependences are the same for all sectors.
To summarize all the above, in general terms it can be said that links are observed between S and T in all 3
sectors, although there are differences regarding the connection patterns between the various practices
under consideration. By sector, machinery is observed to have the smallest predictive capacity, for S on T
especially (sequential), but also in the reverse direction, i.e., T on S (sequential), thus also giving some
support for reciprocal interdependence. Electronics and auto suppliers provide more similar relationship
profiles between T and S, with higher predictive capacity levels of T on S than the reverse. Hypothesis H1
is therefore accepted with slight reservations.
4.2. Relationship between T and S practice implementation and performance
Measurement of the plant’s operating performance level is next included to gain further insight into T and S
practice implementation in the 3 sectors under analysis. With the performance measures included, the
plants are classified as per section 3.3., HP: if cost, quality and responsiveness are greater than their
respective means, and SP: otherwise. This classification is carried out considering the joint mean for the
industries and also considering the mean of each of the industries for each industry. The results are the
same in both cases, as was to be expected since the ANOVA mentioned in section 3.2 indicates that there
are no differences in these variables by industry. Table 8 shows similar HP percentage results in all three
industries: electronics 22.2 %; machinery: 25%, and auto supplier 26.5%.
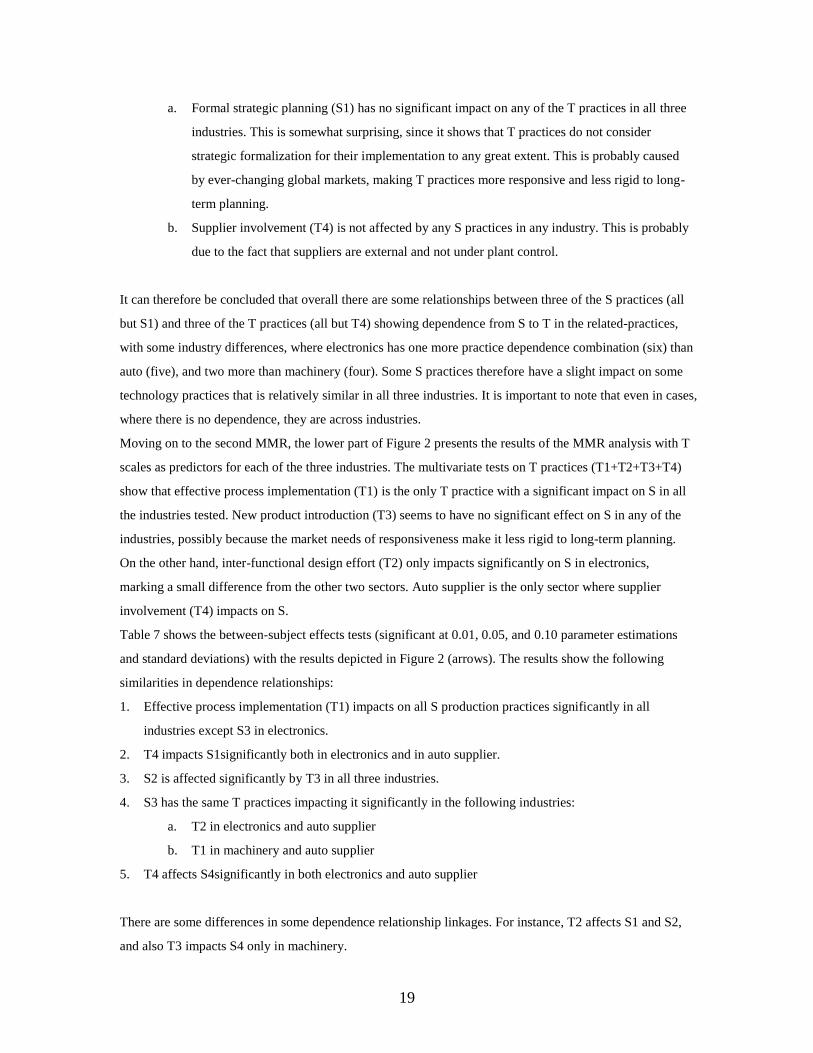
Table 8. HP vs. SP classification
Classification Total
21
SP HP
Industry
Electronics 63 18 81
Machinery 60 20 80
Auto Supplier 61 22 83
Total 184 60 244
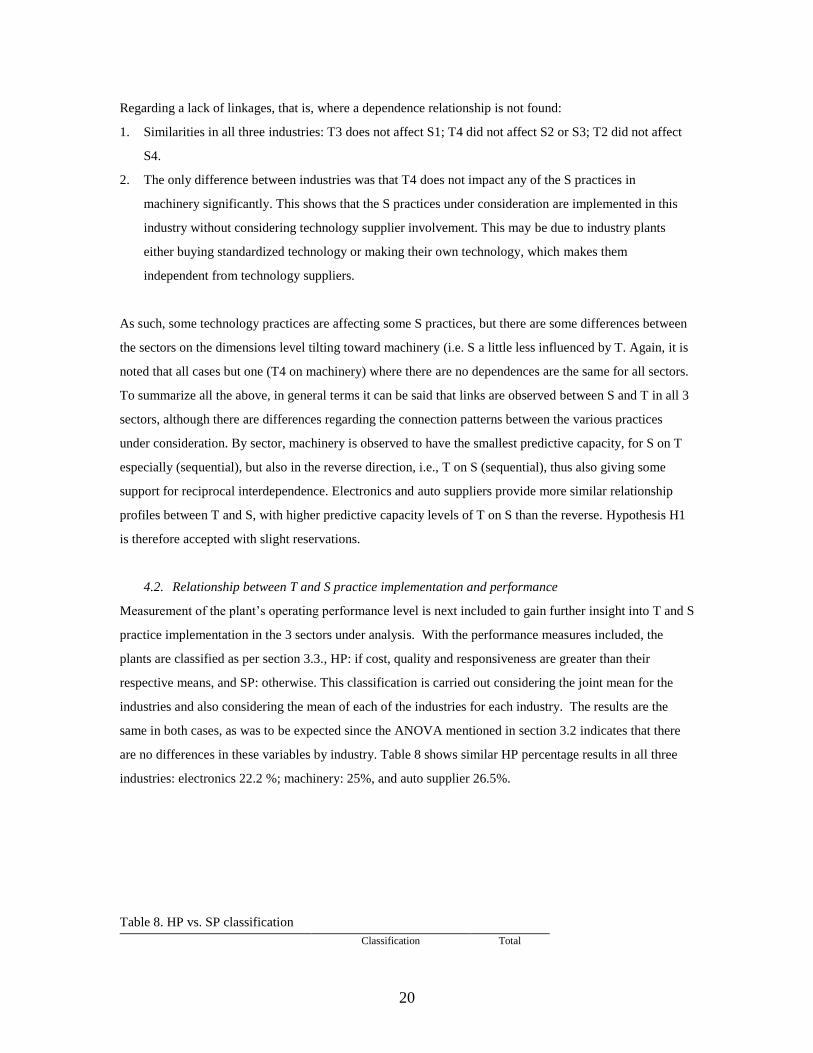
T and S practices are also classified into two levels of implementation. A practice is considered either
“above average” or “below average, depending on whether its value is higher or lower than the mean for
each industry individually. An MCA is then performed to see whether the implementation of T and S
practices is linked to the HP/SP classification considered. The correspondence analysis graphs for each of
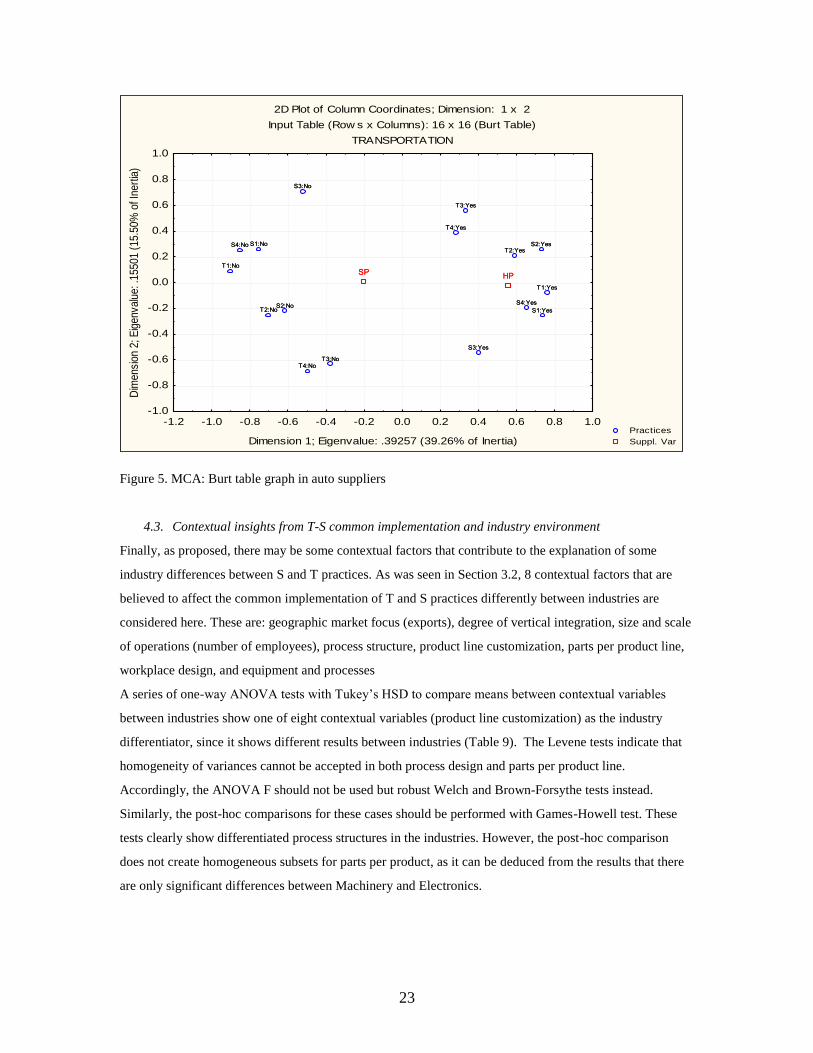
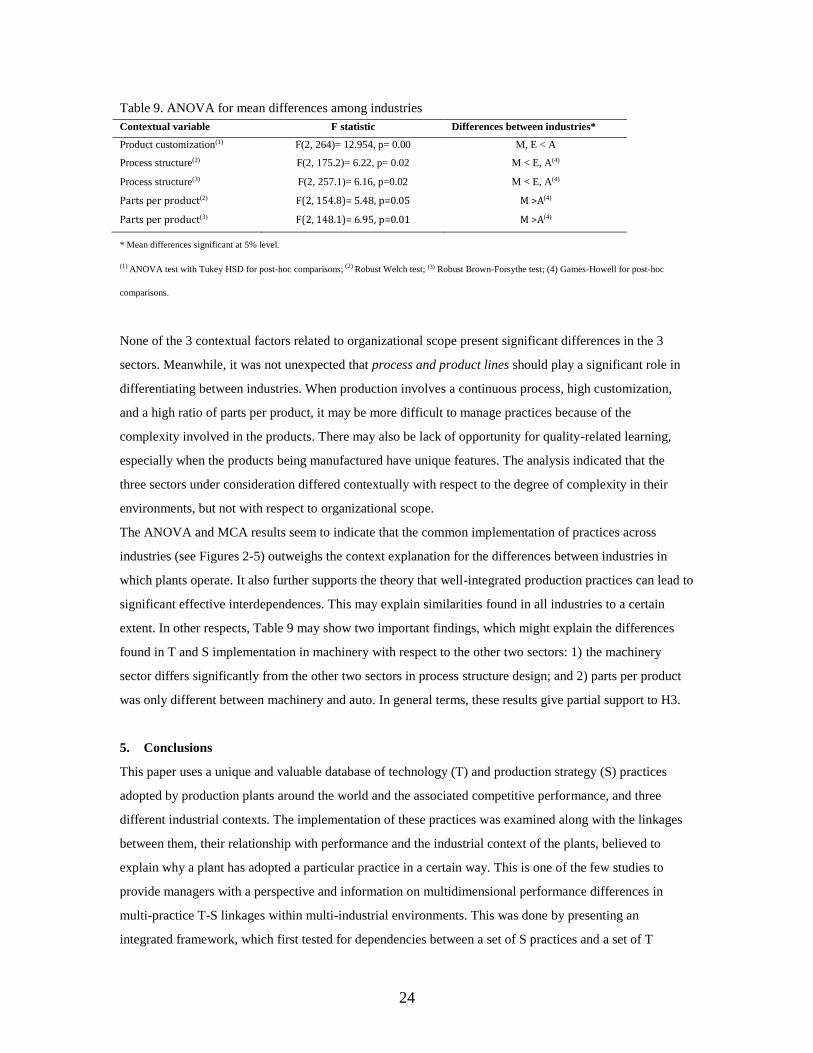
the industries are shown in Figures 3 (electronics with 80 plants), 4 (machinery with 80 plants), and 5 (auto
with 81 plants). The resulting Burt table has a clearly defined structure. Overall, the data matrix is
symmetrical, with nine categorical variables (four S practices, four T practices and performance). Hence,
the data matrix consists of 9 x 9 = 81 partitions, created by each variable being tabulated against itself and
against the categories of all the other variables. It is important to note that the sum of the diagonal elements
in each diagonal partition (i.e., where the respective variables are tabulated against themselves) is constant
(equal to 80 for both electronics and machinery, and to 81 for auto). Except for performance (represented
by HP and SP from Table 8), each of the remaining cases (practices) in the Figures is represented by one
case in this data. For each case a “Yes” is entered into the category where the respective case belongs
(“above average”) and a “No”, otherwise.
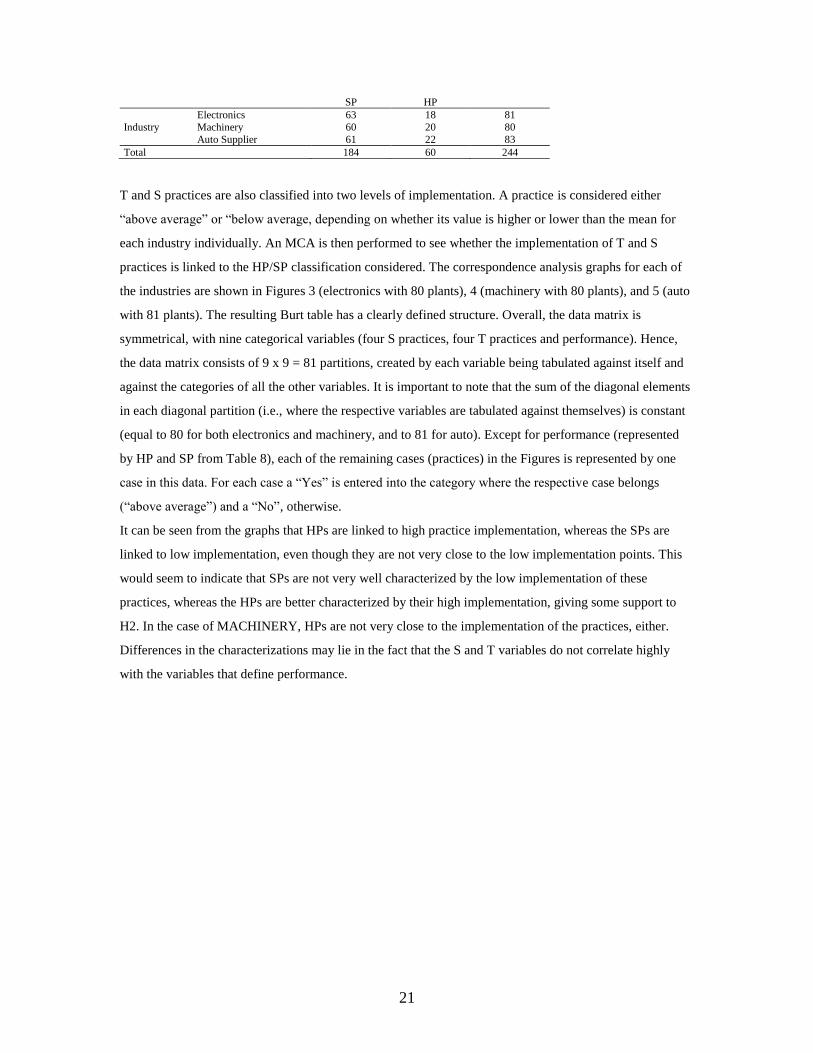
It can be seen from the graphs that HPs are linked to high practice implementation, whereas the SPs are
linked to low implementation, even though they are not very close to the low implementation points. This
would seem to indicate that SPs are not very well characterized by the low implementation of these
practices, whereas the HPs are better characterized by their high implementation, giving some support to
H2. In the case of MACHINERY, HPs are not very close to the implementation of the practices, either.
Differences in the characterizations may lie in the fact that the S and T variables do not correlate highly
with the variables that define performance.
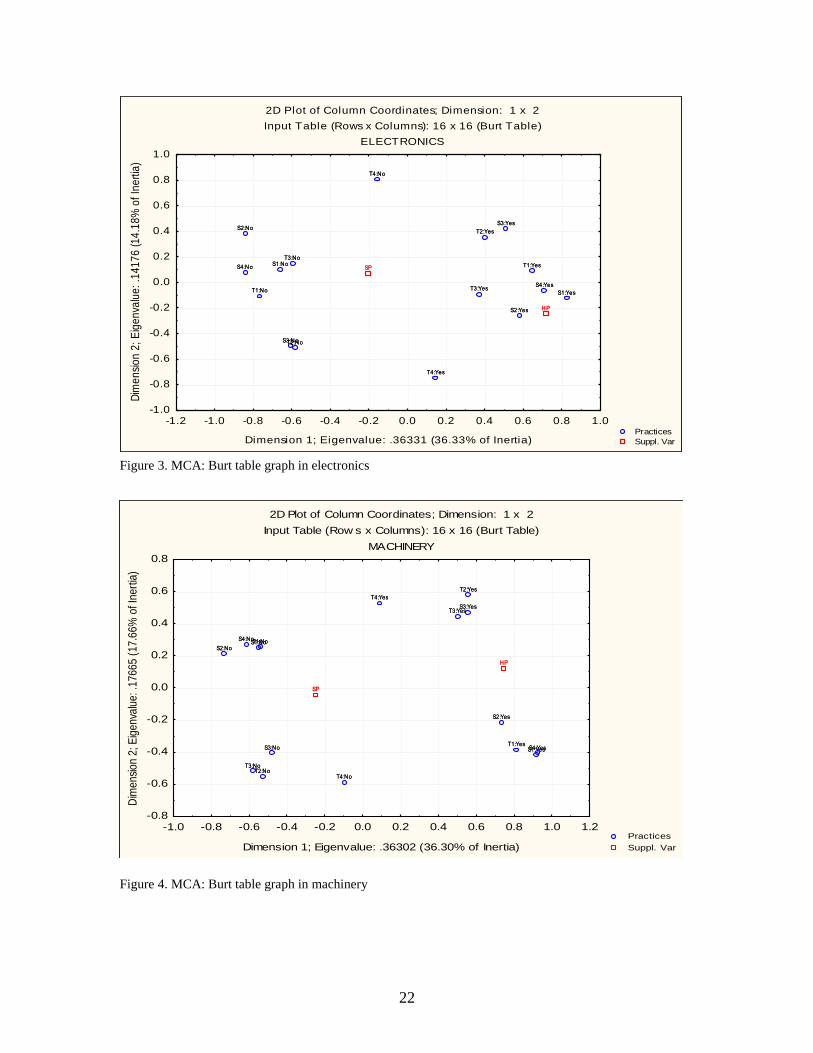
22
Figure 3. MCA: Burt table graph in electronics
Figure 4. MCA: Burt table graph in machinery
2D Plot of Column Coordinates; Dimension: 1 x 2
Input Table (Rows x Columns): 16 x 16 (Burt Table)
ELECTRONICS
Practices
Suppl. Var
S1:No
S1:Yes
S2:No
S2:Yes
S3:No
S3:Yes
S4:No
S4:YesT1:No
T1:Yes
T2:No
T2:Yes
T3:No
T3:Yes
T4:No
T4:Yes
SP
HP
-1.2 -1.0 -0.8 -0.6 -0.4 -0.2 0.0 0.2 0.4 0.6 0.8 1.0
Dimension 1; Eigenvalue: .36331 (36.33% of Inertia)
-1.0
-0.8
-0.6
-0.4
-0.2
0.0
0.2
0.4
0.6
0.8
1.0
Dim
en
sio
n 2
; E
ige
nva
lue
: .1
41
76
(1
4.1
8%
of
Ine
rtia
)
S1:No
S1:Yes
S2:No
S2:Yes
S3:No
S3:Yes
S4:No
S4:YesT1:No
T1:Yes
T2:No
T2:Yes
T3:No
T3:Yes
T4:No
T4:Yes
SP
HP
2D Plot of Column Coordinates; Dimension: 1 x 2
Input Table (Row s x Columns): 16 x 16 (Burt Table)
MACHINERY
Practices
Suppl. Var
S1:No
S1:Yes
S2:No
S2:Yes
S3:No
S3:Yes
S4:No
S4:Yes
T1:No
T1:Yes
T2:No
T2:Yes
T3:No
T3:Yes
T4:No
T4:Yes
SP
HP
-1.0 -0.8 -0.6 -0.4 -0.2 0.0 0.2 0.4 0.6 0.8 1.0 1.2
Dimension 1; Eigenvalue: .36302 (36.30% of Inertia)
-0.8
-0.6
-0.4
-0.2
0.0
0.2
0.4
0.6
0.8
Dim
en
sio
n 2
; E
ige
nva
lue
: .1
76
65
(1
7.6
6%
of
Ine
rtia
)
S1:No
S1:Yes
S2:No
S2:Yes
S3:No
S3:Yes
S4:No
S4:Yes
T1:No
T1:Yes
T2:No
T2:Yes
T3:No
T3:Yes
T4:No
T4:Yes
SP
HP
23
Figure 5. MCA: Burt table graph in auto suppliers
4.3. Contextual insights from T-S common implementation and industry environment
Finally, as proposed, there may be some contextual factors that contribute to the explanation of some
industry differences between S and T practices. As was seen in Section 3.2, 8 contextual factors that are
believed to affect the common implementation of T and S practices differently between industries are
considered here. These are: geographic market focus (exports), degree of vertical integration, size and scale
of operations (number of employees), process structure, product line customization, parts per product line,
workplace design, and equipment and processes
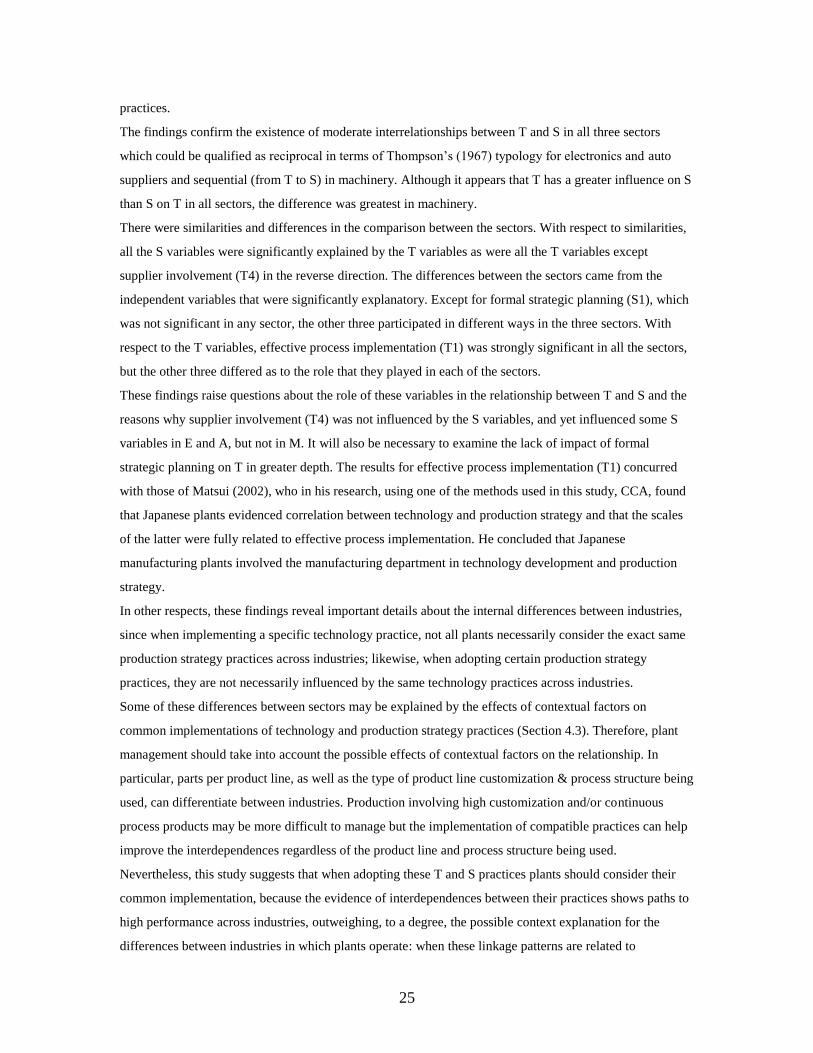
A series of one-way ANOVA tests with Tukey’s HSD to compare means between contextual variables
between industries show one of eight contextual variables (product line customization) as the industry
differentiator, since it shows different results between industries (Table 9). The Levene tests indicate that
homogeneity of variances cannot be accepted in both process design and parts per product line.
Accordingly, the ANOVA F should not be used but robust Welch and Brown-Forsythe tests instead.
Similarly, the post-hoc comparisons for these cases should be performed with Games-Howell test. These
tests clearly show differentiated process structures in the industries. However, the post-hoc comparison
does not create homogeneous subsets for parts per product, as it can be deduced from the results that there
are only significant differences between Machinery and Electronics.
2D Plot of Column Coordinates; Dimension: 1 x 2
Input Table (Row s x Columns): 16 x 16 (Burt Table)
TRANSPORTATION
Practices
Suppl. Var
S1:No
S1:YesS2:No
S2:Yes
S3:No
S3:Yes
S4:No
S4:Yes
T1:No
T1:Yes
T2:No
T2:Yes
T3:No
T3:Yes
T4:No
T4:Yes
SPHP
-1.2 -1.0 -0.8 -0.6 -0.4 -0.2 0.0 0.2 0.4 0.6 0.8 1.0
Dimension 1; Eigenvalue: .39257 (39.26% of Inertia)
-1.0
-0.8
-0.6
-0.4
-0.2
0.0
0.2
0.4
0.6
0.8
1.0
Dim
ensi
on 2
; Eig
enva
lue:
.155
01 (
15.5
0% o
f Ine
rtia
)
S1:No
S1:YesS2:No
S2:Yes
S3:No
S3:Yes
S4:No
S4:Yes
T1:No
T1:Yes
T2:No
T2:Yes
T3:No
T3:Yes
T4:No
T4:Yes
SPHP
24
Table 9. ANOVA for mean differences among industries
Contextual variable F statistic Differences between industries*
Product customization(1) F(2, 264)= 12.954, p= 0.00 M, E < A
Process structure(2) F(2, 175.2)= 6.22, p= 0.02 M < E, A(4)
Process structure(3) F(2, 257.1)= 6.16, p=0.02 M < E, A(4)
Parts per product(2) F(2, 154.8)= 5.48, p=0.05 M >A(4) Parts per product(3) F(2, 148.1)= 6.95, p=0.01 M >A(4)
* Mean differences significant at 5% level.
(1) ANOVA test with Tukey HSD for post-hoc comparisons; (2) Robust Welch test; (3) Robust Brown-Forsythe test; (4) Games-Howell for post-hoc
comparisons.
None of the 3 contextual factors related to organizational scope present significant differences in the 3
sectors. Meanwhile, it was not unexpected that process and product lines should play a significant role in
differentiating between industries. When production involves a continuous process, high customization,
and a high ratio of parts per product, it may be more difficult to manage practices because of the
complexity involved in the products. There may also be lack of opportunity for quality-related learning,
especially when the products being manufactured have unique features. The analysis indicated that the
three sectors under consideration differed contextually with respect to the degree of complexity in their
environments, but not with respect to organizational scope.
The ANOVA and MCA results seem to indicate that the common implementation of practices across
industries (see Figures 2-5) outweighs the context explanation for the differences between industries in
which plants operate. It also further supports the theory that well-integrated production practices can lead to
significant effective interdependences. This may explain similarities found in all industries to a certain
extent. In other respects, Table 9 may show two important findings, which might explain the differences
found in T and S implementation in machinery with respect to the other two sectors: 1) the machinery
sector differs significantly from the other two sectors in process structure design; and 2) parts per product
was only different between machinery and auto. In general terms, these results give partial support to H3.
5. Conclusions
This paper uses a unique and valuable database of technology (T) and production strategy (S) practices
adopted by production plants around the world and the associated competitive performance, and three
different industrial contexts. The implementation of these practices was examined along with the linkages
between them, their relationship with performance and the industrial context of the plants, believed to
explain why a plant has adopted a particular practice in a certain way. This is one of the few studies to
provide managers with a perspective and information on multidimensional performance differences in
multi-practice T-S linkages within multi-industrial environments. This was done by presenting an
integrated framework, which first tested for dependencies between a set of S practices and a set of T
25
practices.
The findings confirm the existence of moderate interrelationships between T and S in all three sectors
which could be qualified as reciprocal in terms of Thompson’s (1967) typology for electronics and auto
suppliers and sequential (from T to S) in machinery. Although it appears that T has a greater influence on S
than S on T in all sectors, the difference was greatest in machinery.
There were similarities and differences in the comparison between the sectors. With respect to similarities,
all the S variables were significantly explained by the T variables as were all the T variables except
supplier involvement (T4) in the reverse direction. The differences between the sectors came from the
independent variables that were significantly explanatory. Except for formal strategic planning (S1), which
was not significant in any sector, the other three participated in different ways in the three sectors. With
respect to the T variables, effective process implementation (T1) was strongly significant in all the sectors,
but the other three differed as to the role that they played in each of the sectors.
These findings raise questions about the role of these variables in the relationship between T and S and the
reasons why supplier involvement (T4) was not influenced by the S variables, and yet influenced some S
variables in E and A, but not in M. It will also be necessary to examine the lack of impact of formal
strategic planning on T in greater depth. The results for effective process implementation (T1) concurred
with those of Matsui (2002), who in his research, using one of the methods used in this study, CCA, found
that Japanese plants evidenced correlation between technology and production strategy and that the scales
of the latter were fully related to effective process implementation. He concluded that Japanese
manufacturing plants involved the manufacturing department in technology development and production
strategy.
In other respects, these findings reveal important details about the internal differences between industries,
since when implementing a specific technology practice, not all plants necessarily consider the exact same
production strategy practices across industries; likewise, when adopting certain production strategy
practices, they are not necessarily influenced by the same technology practices across industries.
Some of these differences between sectors may be explained by the effects of contextual factors on
common implementations of technology and production strategy practices (Section 4.3). Therefore, plant
management should take into account the possible effects of contextual factors on the relationship. In
particular, parts per product line, as well as the type of product line customization & process structure being
used, can differentiate between industries. Production involving high customization and/or continuous
process products may be more difficult to manage but the implementation of compatible practices can help
improve the interdependences regardless of the product line and process structure being used.
Nevertheless, this study suggests that when adopting these T and S practices plants should consider their
common implementation, because the evidence of interdependences between their practices shows paths to
high performance across industries, outweighing, to a degree, the possible context explanation for the
differences between industries in which plants operate: when these linkage patterns are related to
26
performance these mutual reciprocal relationships are seen in high performers, i.e., world class
manufacturers, and plants that do not take this into account are left at a competitive disadvantage
internationally and relegated to the position of standard performers, i.e., lagging world class manufacturers.
Therefore, despite the differences noted, the interrelationship between Technology Management and
Manufacturing Strategy practices is somewhat similar in the three sectors on a multidimensional level. This
confirms what was stated by Schroeder & Flynn (2001), that for companies to be competitive and to
generate competitive advantages they must relate production practices to each other. Hence, S and T
practices must be related to one another to withstand the challenges of a changing and intensely
competitive global business environment. Thus, powerful relationships between S and T may be influenced
by plants’ ways of thinking. For example, specific data shows that Honda emphasizes speed (lead-time) and
then puts a priority on developing robotic process technologies. Meanwhile, Toyota emphasizes “avoidance
of waste” or “lean” and then develops a JIT system and relevant technologies, such as set-up time reduction
technologies and quality-related technologies. In any case, any firm that has a clear competitive focus
establishes its production strategy (representing the emphasis on competitive focuses) and tries to develop
or install technologies that contribute to the focuses. These firms also accept under their clear competitive
focuses new technologies that have been researched and developed and implement them. Sometimes this
strengthens, or makes it possible to feature, new competitive focuses that had been considered difficult.
These technologies may then add a new competitive aspect to the original strategic paradigm. Interactions
of this type develop reciprocal relationships.
In short, one point this paper tries to make is that there are clear competitive focuses guided by the
production strategy and then technologies are considered as an additional ingredient to better accomplish
the strategic focuses. There will also be an opposite effect, that is, from technologies to strategy, which
works over time and further strengthens the strategic focuses. This mutual, reciprocal relationship holds in
high performance plants.
While results suggest that implementing production practices can mask contextual effects on industries, as
seen in high performers (Figures 5-7), future studies should investigate the possible holistic effects of
industrial contexts and production practices in technology, production strategy and other production
programs on performance.
This research chose to focus on three industries in order to obtain more generalizable and readily
interpretable results. This means that the conclusions are limited to these three industries only and should
not be generalized beyond them. On the other hand, the sample contains ample cultural variability, since it
includes data from nine diverse countries around the world. However, this research does not try to analyze
cultural questions, but focuses more on industrial differences worldwide. Both own business reality and
research have indicated that production practices are universally applicable, regardless of cultural
differences. Nevertheless, cultural issues may affect the implementation of Production practices in certain
ways, and this represents a line for future research.
27
Furthermore, although it is difficult to extract interactive processes like those proposed and tested here
from any database, by doing chronological analyses it is possible to develop a few interactive patterns.
Relating these patterns more deeply to performance is also anticipated for the near future.
The limitations of this research present great opportunities for a variety of other future research studies that
may be possible, including studies to verify whether contextual variables can have a mediating and/or
moderation effect on the relationship between production strategy and technology management. The
combined effects of the S-T linkages and the industry context on operational performance could also be
compared for the electronics, machinery and auto supplier sectors. Naturally, it is also important to focus
on the variables that had no dependence relationship and on the differences between the industries. For
instance, supplier involvement being significant only in the auto sector deserves further research to test for
current technology procurement differences between industries, starting from regular vendors, following
with custom development by proprietary vendors, and all the way to own plant development.
In other respects, this study could also be replicated in other countries and sectors for inter-sector and inter-
country comparisons to be made. Longitudinal studies should also be conducted, including a more detailed
examination of the relationships between the two programs and industrial contexts. Longitudinal studies
could help inspect causal linkages among practices. More detailed studies could pinpoint the exact nature
of the interaction between practices. While this study provides a foundation for examining T, S, and
multiple industrial contexts within a single framework, it is only through further research that a full
understanding of their relationship will be obtained.
Acknowledgments
This research has been partly funded by the Spanish Ministry of Science and Innovation, project DPI-2009-
11148, and by the Junta de Andalucía project P08-SEJ-03841. The authors wish to acknowledge both
Governments’ support.
Appendix A. Question items of production strategy-related measurement practices
A1. Formal strategic planning (S1)
1. Our plant has a formal strategic planning process, which results in a written mission, long-range goals
and strategies for implementation.
2. This plant has a strategic plan, which is put in writing.
3. Plant management routinely reviews and updates a long-range strategic plan.
4. The plant has an informal strategy, which is not very well defined.
A2. Anticipation of new technologies (S2)
1. We pursue long-range programs in order to acquire manufacturing capabilities in advance of our needs.

28
2. We make an effort to anticipate the potential of new manufacturing practices and technologies.
3. Our plant stays on the leading edge of new technology in our industry.
4. We are constantly thinking of the next generation of manufacturing technology.
A3. Communication of manufacturing strategy (S3)
1. In our plant, goals, objectives and strategies are communicated to me.
2. I understand the long-term competitive strategy of this plant.
A4. Manufacturing-business strategy linkage (S4)
1. We have a manufacturing strategy that is actively pursued.
2. Our business strategy is translated into manufacturing terms.
3. Potential manufacturing investments are screened for consistency with our business strategy.
4. At our plant, manufacturing is kept in step with our business strategy.
5. Manufacturing management is not aware of our business strategy.
6. Corporate decisions are often made without consideration of the manufacturing strategy.
Appendix B. Question items of technology-related measurement practices
B1. Effective process implementation (T1)
1. We often fail to achieve the potential of new process technology.
2. Once a new process is working, we leave it alone.
3. We pay close attention to the organizational and skill changes needed for new processes.
4. We search for continued learning and improvement after the installation of new equipment.
5. Our processes are effectively developed and implemented.
B2. Inter-functional design effort (T2)
1. Direct labor employees are involved to a great extent before introducing new products or making
product changes.
2. Manufacturing engineers are involved to a great extent before the introduction of new products.
3. There is little involvement of manufacturing and quality people in the early design of products, before
they reach the plant.
4. We work in teams, with members from a variety of areas (marketing, manufacturing, etc.) to introduce
new products.
B3. New product introduction (T3)
1. Compared to our industry, we introduce new products more slowly.
29
2. We are never the first in our industry to introduce a new product.
B4. Supplier involvement in new product development (T4)
1. Suppliers were involved early in the design efforts in this project.
2. We partnered with suppliers for the design of this product.
3. Suppliers were frequently consulted about the design of this product.
4. Suppliers were an integral part of the design effort.
References
Abdel-Maksoud, A., Cerbioni, F., Ricceri, F., Velayutham, S., 2010. Employee morale, non-financial performance
measures, deployment of innovative managerial practices and shop-floor involvement in Italian manufacturing
firms. The British Accounting Review, 42(1), 36-55.
Adamides, E.D., & Pomonis, N., 2009. The co-evolution of product, production and supply chain decisions, and the
emergence of manufacturing strategy. International Journal of Production Economics, 121(2), 301-312.
Ahmad, S., Schroeder, R.G., Sinha, K.K., 2003. The role of infrastructure practices in the effectiveness of JIT
practices: implications for plant competitiveness. Journal of Engineering and Technology management, 20(3),
161-191.
Amoako-Gyampah, K., Acquaah, M., 2008. Manufacturing strategy, competitive strategy and firm performance: An
empirical study in a developing economy environment. International Journal of Production Economics, 111(2),
575-592.
Aoki, K., Staeblein, T., Tomino, T., 2013. Monozukuri capability to address product variety: A comparison between
Japanese and German automotive makers. International Journal of Production Economics. Available online 13
March 2013, ISSN 0925-5273, 10.1016/j.ijpe.2013.02.026.
Banerjee, S.K. 2000. Developing manufacturing management strategies: Influence of technology and other issues.
International journal of production economics, 64(1), 79-90.
Bates, K, Blackmon, K., Flynn, E., Voss, C., 2001. Manufacturing strategy: Building Capability for Dynamic Markets.
In: Schroeder, R., Flynn, B., (Eds.). High Performance Manufacturing-Global Perspectives. New York: John
Wiley & Sons, Inc., 42-72.
Bates, K. A., Amundson, S.D., Schroeder, R.G., Morris, W.T., 1995. The crucial interrelationship between
manufacturing strategy and organizational culture. Management Science 41(10): 1565-1580.
Batista, G.E.A.P.A., Monard, M.C., 2002. A study of k-nearest neighbour as an imputation method. Soft Computing
Systems: Design, Management and Applications, Santiago, Chile, 251-260.
Boyle, E., Humphreys, P., & McIvor, R., 2008. Reducing supply chain environmental uncertainty through e-
intermediation: An organisation theory perspective. International Journal of Production Economics, 114(1),
347-362
30
Bozarth, C.C., Warsing, D.P., Flynn, B.B., Flynn, E.J., 2009. The impact of supply chain complexity on manufacturing
plant performance. Journal of Operations Management, 27(1), 78-93.
Cronbach, L.J., 1951. Coefficient alpha and the internal structure of tests. Psychometrika, 16, 297-334.
Cua, K., McKone, K.E., Schroeder, R.G., 2001. Relationships between implementation of TQM, JIT, and TPM and
manufacturing performance. Journal of Operations Management, 19(6), 675–694.
Cua, K., McKone-Sweet, K., Schroeder, R., 2006. Improving Performance through an Integrated Manufacturing
Program. The Quality Management Journal, 13(3), 45-60.
de Vries, J., 2005. The complex relationship between inventory control and organisational setting: theory and
practice. International Journal of Production Economics, 93, 273-284.
Dean, J. W., and Snell S. A., 1996. The strategic use of integrated manufacturing: An empirical examination. Strategic
Management Journal, 17, 459-480.
Dekkers, R., Chang, C. M., Kreutzfeldt, J., 2013. The interface between “product design and engineering” and
manufacturing: A review of the literature and empirical evidence. International Journal of Production
Economics, 144(1), 316-333;
Drazin, R., Van de Ven, A.H., 1985. Alternative forms of fit in contingency theory. Administrative science quarterly,
514-539.
Fine, C.H., 2000. Clockspeed-based strategies for supply chain design. Production and Operations Management, 9(3),
213-221.
Flynn, B.B., Schroeder, R.G., Sakakibara, S., 1994. A framework for quality management research and an associated
measurement instrument. Journal of Operations Management 11 (4), 339–366.
Fynes, B., Voss, C., De Burca, S., 2005. The impact of supply chain relationship quality on quality performance.
International Journal of Production Economics, 96(3), 339-354.
Gerdin, J., 2005. Management accounting system design in manufacturing departments: an empirical investigation
using a multiple contingencies approach. Accounting, Organizations and Society, 30(2), 99-126.
Gerdin, J., 2005a. The impact of departmental interdependences and management accounting system use on subunit
performance. European accounting review, 14(2), 297-327.
Gonçalves Zangiski, M. A. D. S., de Lima, E. P., da Costa, S.E.G., 2013. Organizational competence building and
development: contributions to operations management. International Journal of Production Economics.
Goodale, J.C., Kuratko, D.F., Hornsby, J.S., Covin, J.G., 2011. Operations management and corporate
entrepreneurship: The moderating effect of operations control on the antecedents of corporate entrepreneurial
activity in relation to innovation performance. Journal of Operations Management, 29(1), 116-127.
Graybill, F.A., 1961. An Introduction to Linear Statistical Models, New York: McGraw Hill.
Hallgren, M., Olhager, J., 2006. Quantification in manufacturing strategy: A methodology and illustration. International
journal of production economics, 104(1), 113-124.
Hallikas, J., Immonen, M., Pynnönen, M., Mikkonen, K., 2012. Service purchasing and value creation: towards
systemic purchases. International Journal of Production Economics. Available online 22 October 2012, ISSN
31
0925-5273, 10.1016/j.ijpe.2012.10.005.
Han, C., Porterfield, T. E., & Li, X., 2012. Impact of industry competition on contract manufacturing: An empirical
study of US manufacturers. International Journal of Production Economics.
Hayes, R.H., Wheelwright, S.C., 1984. Restoring Our Competitive Edge: Competing Through Manufacturing. Wiley,
New York.
Heim, G.R., Peng, D.X., 2010. The impact of information technology use on plant structure, practices, and
performance: an exploratory study. Journal of Operations Management 28(2): 144-162.
Helkiö, P., & Tenhiälä, A., 2013. A contingency theoretical perspective to the product-process matrix. International
Journal of Operations & Production Management, 33(2), 216-244.
Hill, T., 2000. Manufacturing Strategy: Text and Cases, 3rd ed. (Burr Ridge, IL: Irwin/McGraw-Hill).
Hill, T., Hill, A., 2009. Manufacturing strategy: text and cases. Palgrave Macmillan.
Hron, K., Templ, M., Filzmoser, P., 2010. Imputation of missing values for compositional data using classical and
robust methods. Computational Statistics & Data Analysis, 54(12), 3095-3107.
Itami, H., and Numagami, T., 1992. Dynamic Interaction between Strategy and Technology. Strategic Management
Journal, 13 (S2), 119–136.
Jacobs, M., Droge, C., Vickery, S. K., Calantone, R., 2011. Product and process modularity's effects on manufacturing
agility and firm growth performance. Journal of Product Innovation Management, 28(1), 123-137.
Jayaram, J., Xu, K., 2013. The Relative Influence of External versus Internal Integration on Plant Performance in
China. International Journal of Production Economics. Available online 18 April 2013, ISSN 0925-5273,
10.1016/j.ijpe.2013.03.024.
Jonsson, P., Wohlin, C., 2004. An evaluation of k-nearest neighbour imputation using likert data. In Proceedings of
10th International Symposium on Software Metrics. IEEE, 108-118.
Kandemir, D., Acur, N., 2012. Examining Proactive Strategic Decision‐Making Flexibility in New Product
Development. Journal of Product Innovation Management 29 (4), 608–622.
Kemppainen, K., Vepsäläinen, A.P., Tinnilä, M., 2008. Mapping the structural properties of production process and
product mix. International Journal of Production Economics, 111(2), 713-728.
Ketokivi, M., Schroeder, R.G., 2004. Production practices, strategic fit and performance: A routine-based view.
International Journal of Operations & Production Management, 24(2), 171-191.
Kotha, S., Orne, D., 1989. Generic manufacturing strategies: a conceptual synthesis. Strategic Management Journal,
10(3), 211-231.
Lawrence, P.R., Lorsch, P.R., 1967. Organization and Environment. Harvard University Press, Boston, MA.
Machuca, José AD, Cesar H. Ortega-Jiménez, Pedro Garrido-Vega, and José Luis Pérez Diez de los Ríos, 2011. Do
technology and manufacturing strategy links enhance operational performance? Empirical research in the auto
supplier sector, International Journal of Production Economics, 133(2), 541-550.
Maier, F. H., 1997. Competitiveness in Manufacturing as Influenced by Technology-Some Insights from the Research
Project: World Class Manufacturing. In: Barlas Y., Diker, V. G., Polat, S. (Eds.). Systems Approach to
32
Learning and Education into the 21st Century, 2, 667-670
Maier, F., Schroeder, R., 2001. Competitive Product and Process Technology. In: Schroeder, R.G., Flynn, B. (Eds.).
High Performance Manufacturing, Global Perspectives. New York: John Wiley & Sons, Inc., 93–114.
Maier, F.H., 1998. Technology: A Crucial Success Factor in Manufacturing?-Some Insights from the Research Project:
World Class Manufacturing. Proceedings of the International System Dynamics Conference. Quebec City,
Canada.
Maier, F.H., 1998a. Consequences of Technological Strategies for Competitiveness: Lessons from Statistical Analysis
and Dynamic Modeling. Publications of the System Dynamics Group: D-4784. WP 4033-98. Working papers
from Massachusetts Institute of Technology (MIT), Sloan School of Management.
Mallick, D.N., Schroeder, R.G., 2005. An Integrated Framework for Measuring Product Development Performance in
High Technology Industries. Production and Operations Management, 14(2), 142-158.
Manthou, V., Vlachopoulou, M., 2001. Bar-code technology for inventory and marketing management systems: A
model for its development and implementation. International Journal of Production Economics, 71(1), 157-164
Matsui, Y., 2002. Contribution of manufacturing departments to technology development: An empirical analysis for
machinery, electrical and electronics, and automobile plants in Japan. International Journal of Production
Economics, 80, 185–197.
Matsui, Y., 2007. An empirical analysis of just-in-time production in Japanese manufacturing companies. International
Journal of Production Economics, 108(1), 153-164.
Matsui, Y., Filippini, R., Kitanaka, H., Sato, O., 2007. A comparative analysis of new product development by Italian
and Japanese manufacturing companies: a case study. International journal of production economics, 110(1),
16-24.
McKone, K. E., and Schroeder, R.G., 2002. A plant’s technology emphasis and approach: A contextual view.
International Journal of Operations & Production Management, 22(7), 772-792.
Meilich, O., 2006. Bivariate Models of Fit in Contingency Theory. Critique and a Polynomial Regression Alternative.
Organisational Research Methods, 9(2), 161-193.
Merschmann, U., Thonemann, U.W., 2011. Supply chain flexibility, uncertainty and firm performance: An empirical
analysis of German manufacturing firms. International Journal of Production Economics, 130(1), 43-53.
Miltenburg, J., 2008. Setting manufacturing strategy for a factory-within-a-factory. International Journal of Production
Economics, 113(1), 307-323.
Mohanty, R.P., Deshmukh, S.G., 1998. Advanced manufacturing technology selection: a strategic model for learning
and evaluation. International Journal of Production Economics, 55(3), 295-307.
Morita, M., James Flynn, E., Ochiai, S. 2011. Strategic management cycle: The underlying process building aligned
linkage among operations practices. International Journal of Production Economics, 133(2), 530-540.
Muyanja, A.W., Atichat, T., Porter, J. D. 2013. An Experimental Study on the Effect of Pattern Recognition Parameters
on the Accuracy of Wireless-Based Task Time Estimation. International Journal of Production Economics.
Available online 16 April 2013, ISSN 0925-5273, 10.1016/j.ijpe.2013.04.006.
33
Nunnally, J.C., 1967. Psychometric Theory. McGraw-Hill, New York.
Ortega Jimenez, C.H., Garrido Vega, P., Pérez Díez de los Rios, J.L. García González, S., 2011. Manufacturing
strategy–technology relationship among auto suppliers. International Journal of Production Economics, 133(2),
508-517.
Ortega, C. H., Garrido-Vega, P., Machuca, J.A.D., 2012. Analysis of interaction fit between manufacturing strategy and
technology management and its impact on performance. International Journal of Operations & Production
Management, 32(8), 958-981.
Ortega, C.H., (2009). Manufacturing Strategy-Technology Link in the Honduran Industry: Selection Fit (In Spanish).
Economía Política (Now Economia y Administracion), 47(2), 133-148.
Ortega, C.H., Eguia, I., 2010. Reconfigurable manufacturing system and industrial competitiveness (In Spanish).
Economia y Administracion (Before Economia Politica), 48(2), 97-114.
Parthasarthy, R., Sethi, S.P., 1992. The impact of flexible automation on business strategy and organizational structure.
Academy of Management Review, 17(1), 86-111.
Phan, A.C., Abdallah, A.B., Matsui, Y., 2011. Quality management practices and competitive performance: Empirical
evidence from Japanese manufacturing companies. International Journal of Production Economics, 133(2),
518-529.
Rauniar, R., Rawski, G., 2012. Organizational structuring and project team structuring in integrated product
development project. International Journal of Production Economics, 135(2), 939-952.
Rho, B. H., Hahm, Y. S., Yu, Y. M., 1994. Improving interface congruence between manufacturing and marketing in
industrial-product manufacturers. International Journal of Production Economics, 37(1), 27-40.
Rho, B.H., Park, K., Yu, Y.M., 2001. An international comparison of the effect of manufacturing strategy-
implementation gap on business performance. International Journal of Production Economics, 70(1), 89-97.
Ringen, G., Holtskog, H., Martinsen, K., 2012. User Friendly Framework for Measuring Product and Process Novelty
in the Early Stages of Product Development. Procedia CIRP, 3, 513-518.
Schroeder, R. G., Flynn, B.B., 2001. High Performance Manufacturing-Global Perspectives, New York: John Wiley &
Sons, Inc.
Singh, B. J., Khanduja, D., 2010. DMAICT: a road map to quick changeovers. International Journal of Six Sigma and
Competitive Advantage, 6(1), 31-52.
Singh, R. K., Garg, S. K., Deshmukh, S. G., 2008. Strategy development by SMEs for competitiveness: a review.
Benchmarking: An International Journal, 15(5), 525-547.
Skinner, W., 1969. Manufacturing - Missing link in corporate strategy. Harvard Business Review, 136-145.
Swamidass, P.M., Newell W.T., 1987. Manufacturing strategy, environmental uncertainty and performance: a path
analytic model. Management Science 33(4): 509-524.
Thompson, J. D., 1967. Organizations in action: Social science bases of administrative theory. New York: McGraw-
Hill.
Thun, J.H., 2008. Empirical analysis of manufacturing strategy implementation. International Journal of Production
34
Economics, 113(1), 370-382.
Torkkeli, M., Tuominen, M., 2002. The contribution of technology selection to core competencies. International journal
of production economics, 77(3), 271-284.
Trentin, A., Perin, E., Forza, C., 2012. Product configurator impact on product quality. International Journal of
Production Economics, 135(2), 850-859.
Umanath, N.S., Kim, K.K., 1992. Task‐Structure Relationship of Information Systems Development Subunit: A
Congruence Perspective. Decision Sciences, 23(4), 819-838.
van Veen-Dirks, P., 2005. Management control and the production environment: A review. International Journal of
Production Economics, 93, 263-272.
Venkatraman, N., 1989. The concept of fit in strategy research: toward verbal and statistical correspondence. Academy
of Management Review, 14(3), 423-444.
Yang, M. S., Hung, W. L., Cheng, F. C., 2006. Mixed-variable fuzzy clustering approach to part family and machine
cell formation for GT applications. International Journal of Production Economics, 103(1), 185-198.
Yarbrough, L., Morgan, N.A., Vorhies, D.W., 2011. The impact of product market strategy-organizational culture fit on
business performance. Journal of the Academy of Marketing Science 39(4): 555-573.
Yusuf, Y. Y., Sahardi, M., Gunasekaran, A., 1999. Agile manufacturing: The drivers, concepts and attributes,
International Journal of Production Economics, 62 (1/2), 33-43.
Zahra, S., Covin, J., 1993. Business Strategy, Technology Policy, and Firm Performance. Strategic Management
Journal, 14(6), 451–478.