Embed Size (px)
Citation preview
Implementing the NGA/SGA DIMP Template
A Case Study
Robert McElroy, PE.VP Sales & Marketing
August 25, 2010
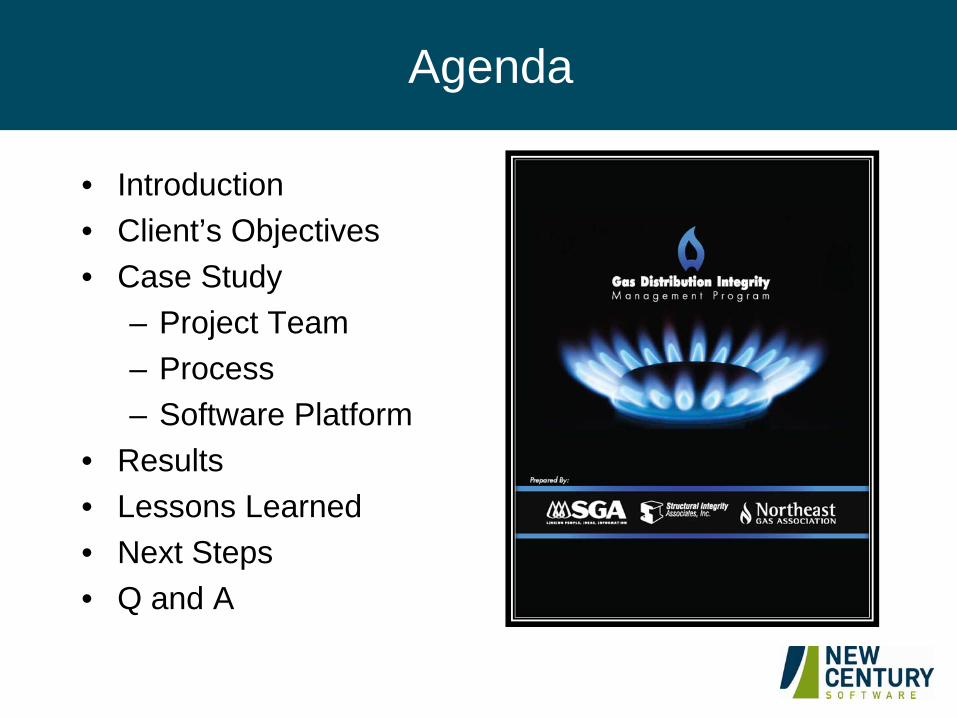
Agenda
• Introduction• Client’s Objectives• Case Study
– Project Team– Process – Software Platform
• Results• Lessons Learned• Next Steps• Q and A
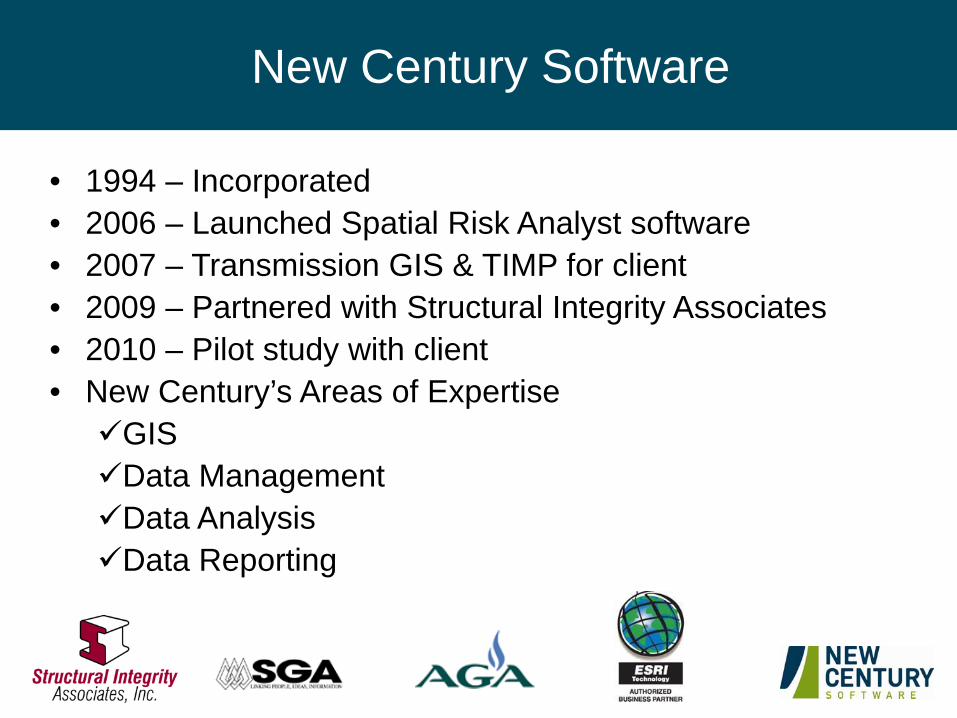
New Century Software
• 1994 – Incorporated • 2006 – Launched Spatial Risk Analyst software• 2007 – Transmission GIS & TIMP for client• 2009 – Partnered with Structural Integrity Associates• 2010 – Pilot study with client• New Century’s Areas of Expertise
GISData ManagementData AnalysisData Reporting
Client’s Objectives
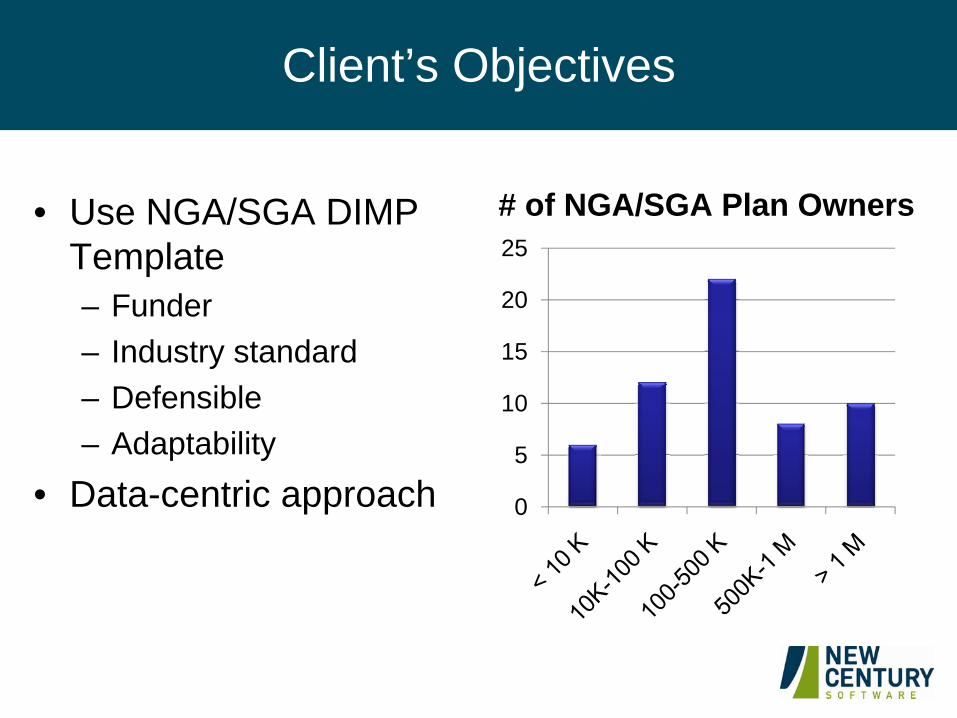
• Use NGA/SGA DIMP Template– Funder– Industry standard– Defensible– Adaptability
• Data-centric approach
# of NGA/SGA Plan Owners
0
5
10
15
20
25
Client’s Objective
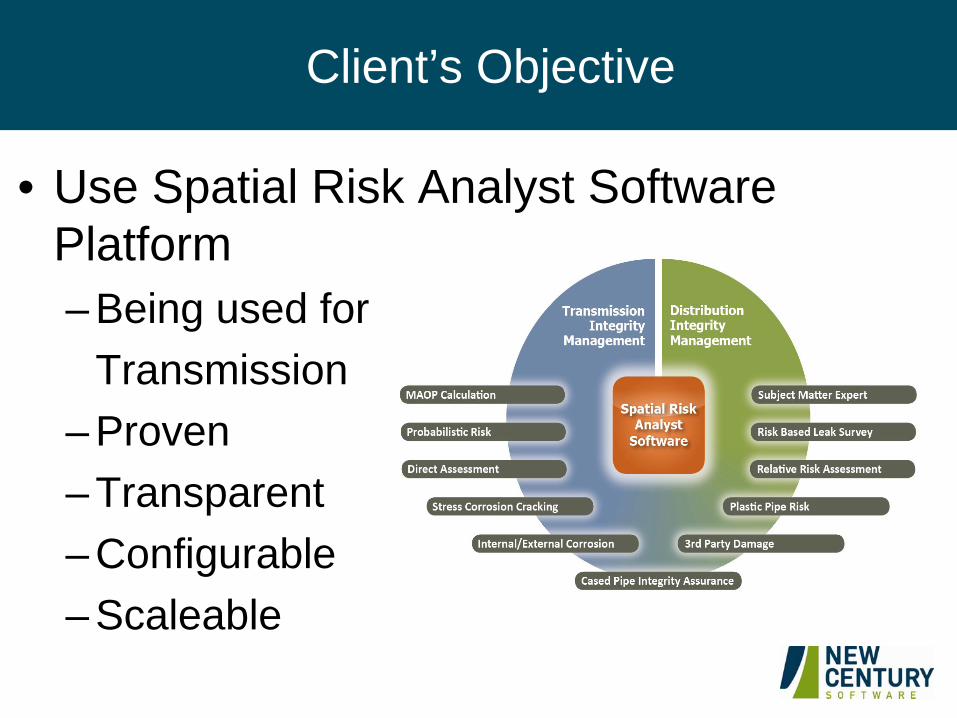
• Use Spatial Risk Analyst Software Platform– Being used for
Transmission– Proven– Transparent– Configurable– Scaleable
Client’s Objectives
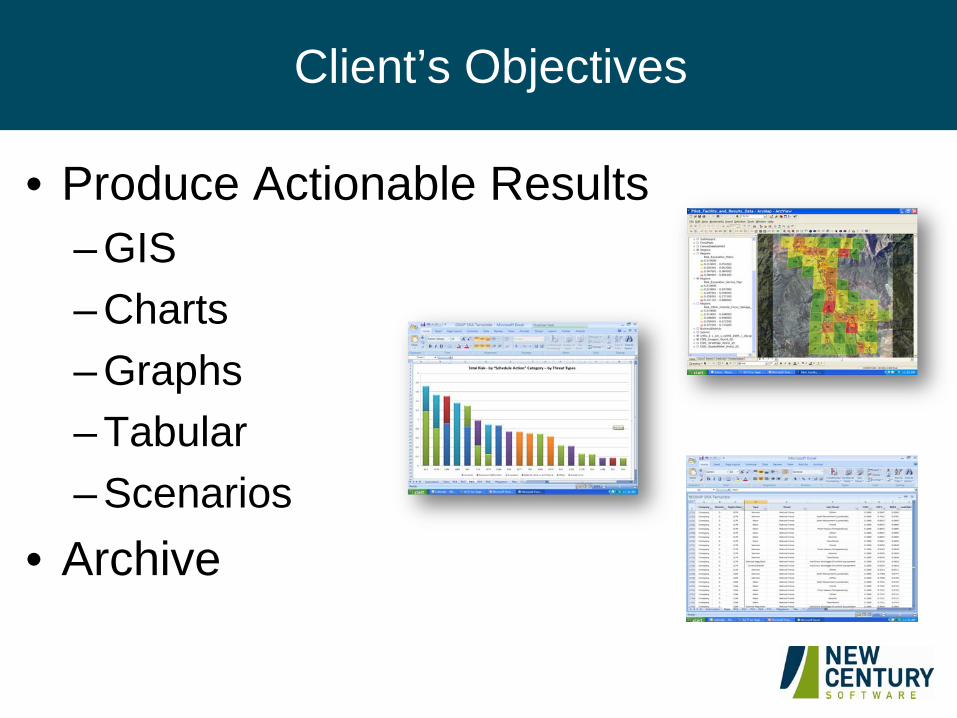
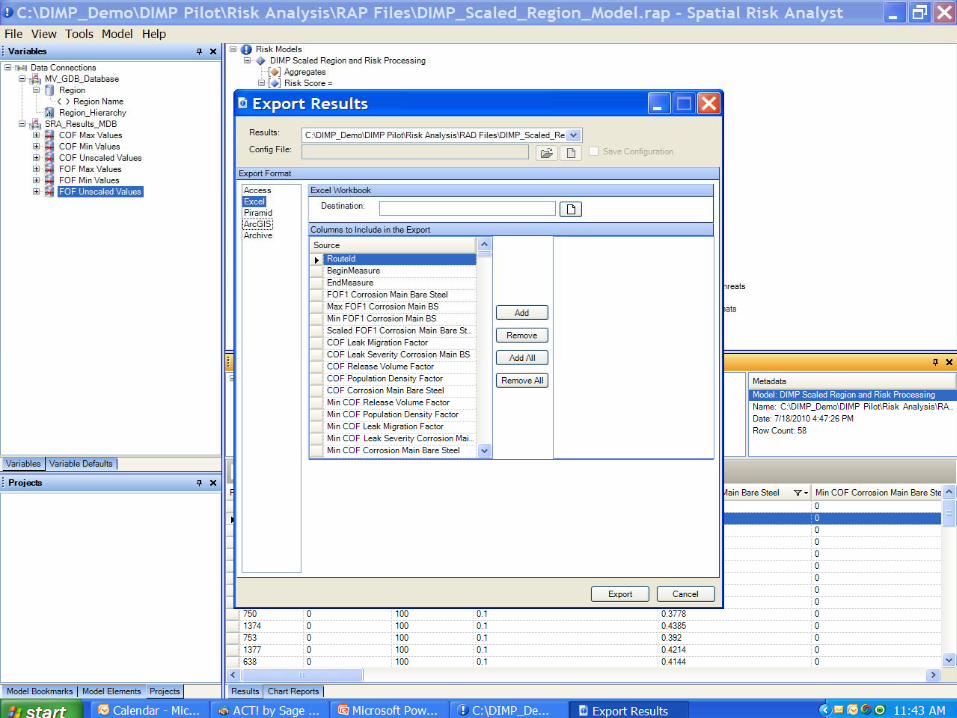
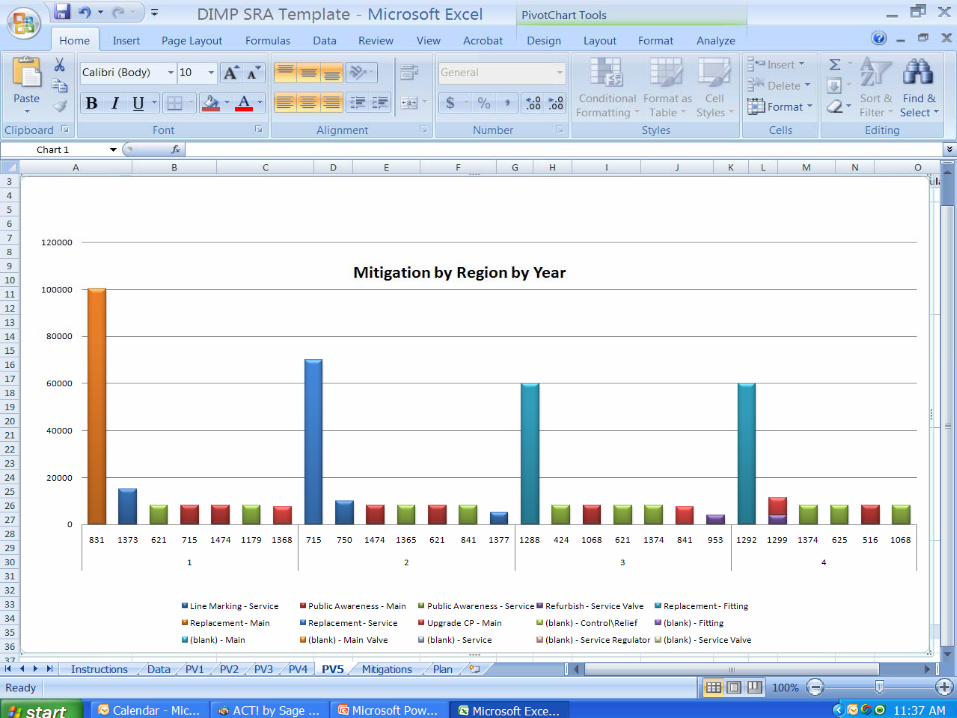
• Produce Actionable Results– GIS– Charts– Graphs– Tabular– Scenarios
• Archive

Client’s Objectives
• Assess data readiness– Enterprise data sources– GIS– Access and Excel– SME
• Develop implementation schedule
• Develop project roadmap
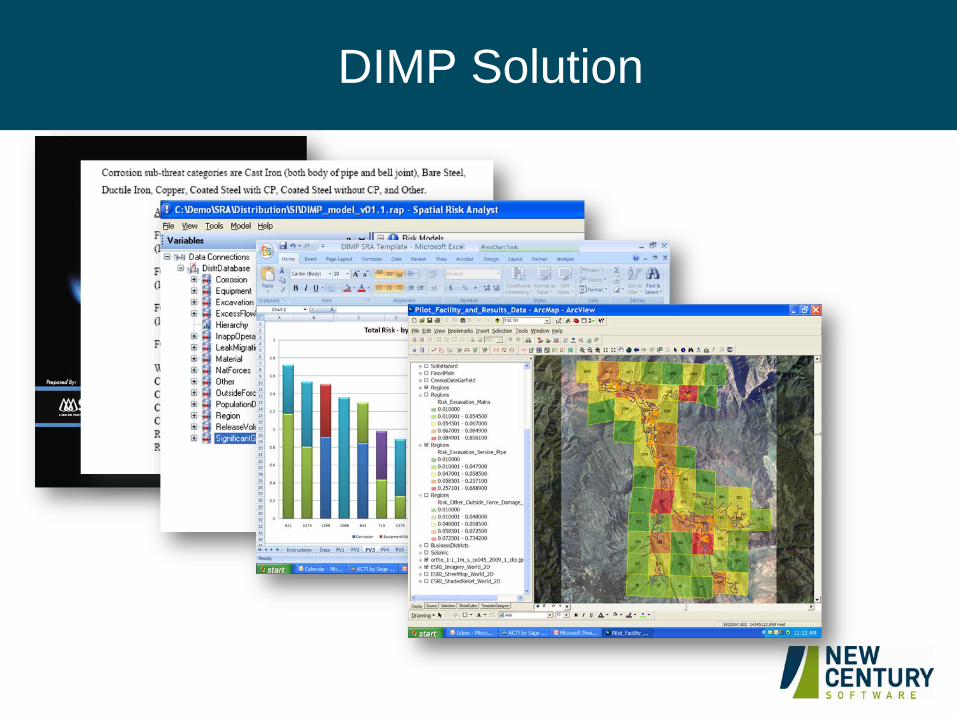
DIMP Solution
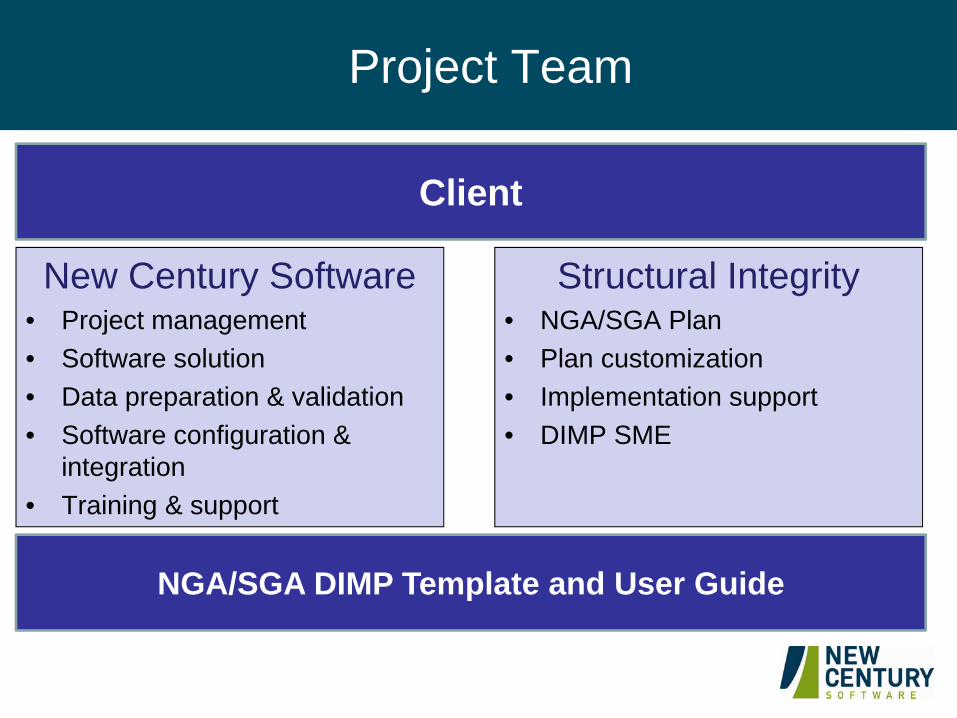
Project Team
Structural Integrity• NGA/SGA Plan• Plan customization• Implementation support• DIMP SME
New Century Software• Project management• Software solution• Data preparation & validation • Software configuration &
integration • Training & support
NGA/SGA DIMP Template and User Guide
Client
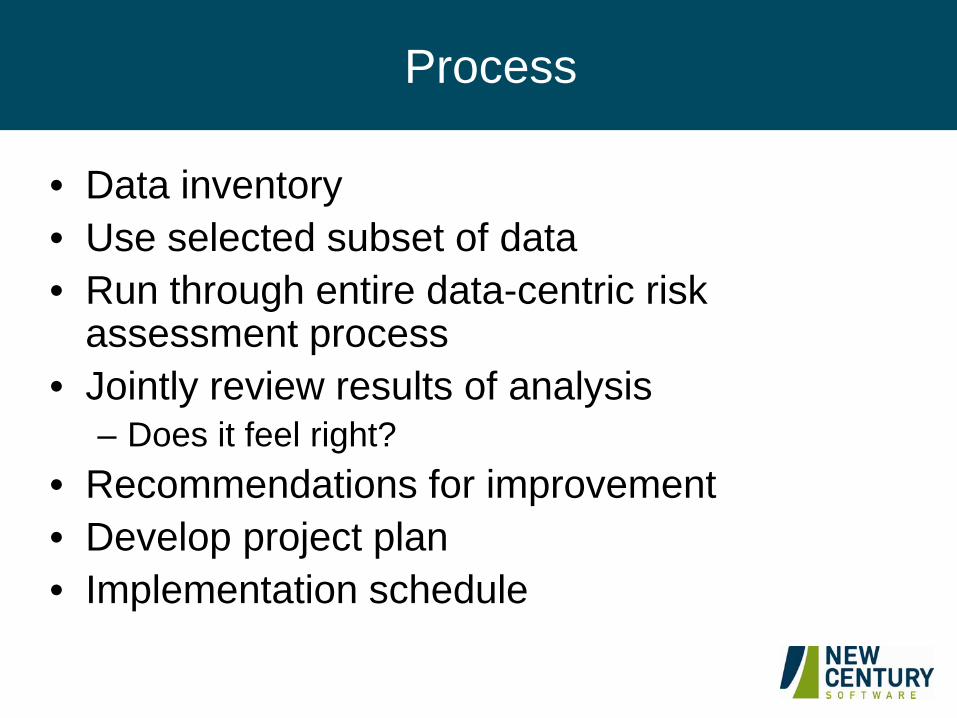
Process
• Data inventory• Use selected subset of data• Run through entire data-centric risk
assessment process• Jointly review results of analysis
– Does it feel right?• Recommendations for improvement• Develop project plan • Implementation schedule

Data Inventory
Copyright 2010 New Century Software, Inc. All rights reserved
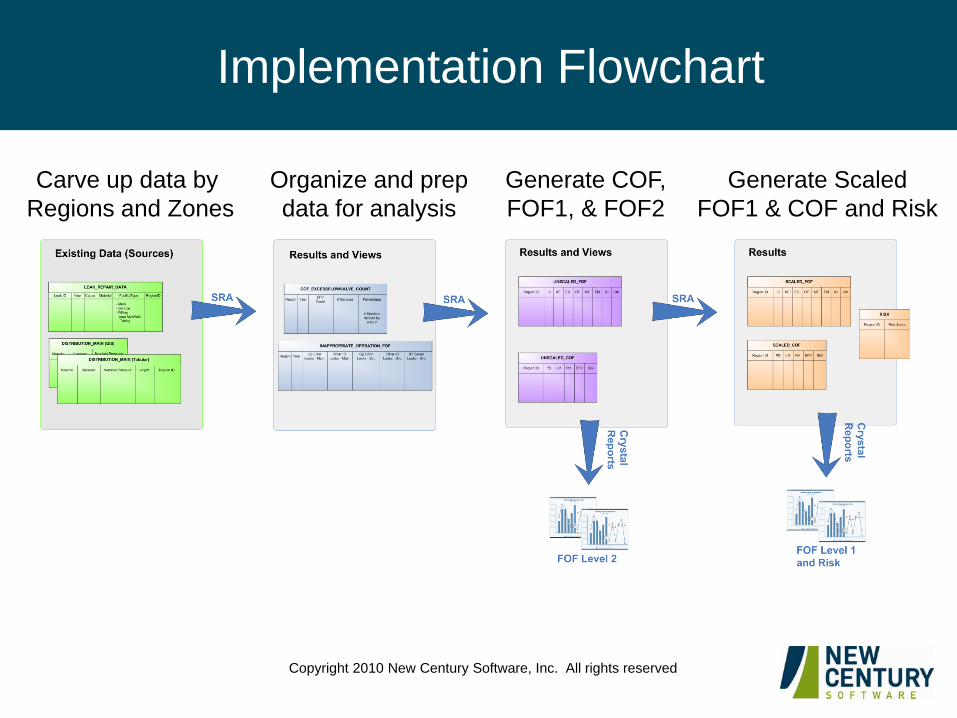
Implementation Flowchart
Carve up data by Regions and Zones
Organize and prepdata for analysis
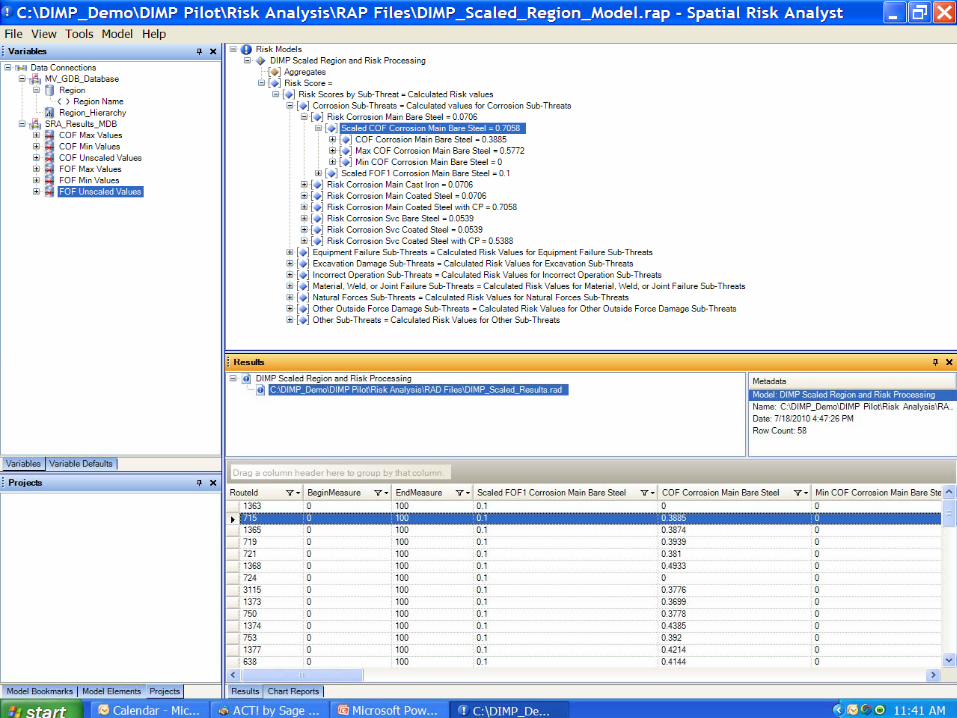
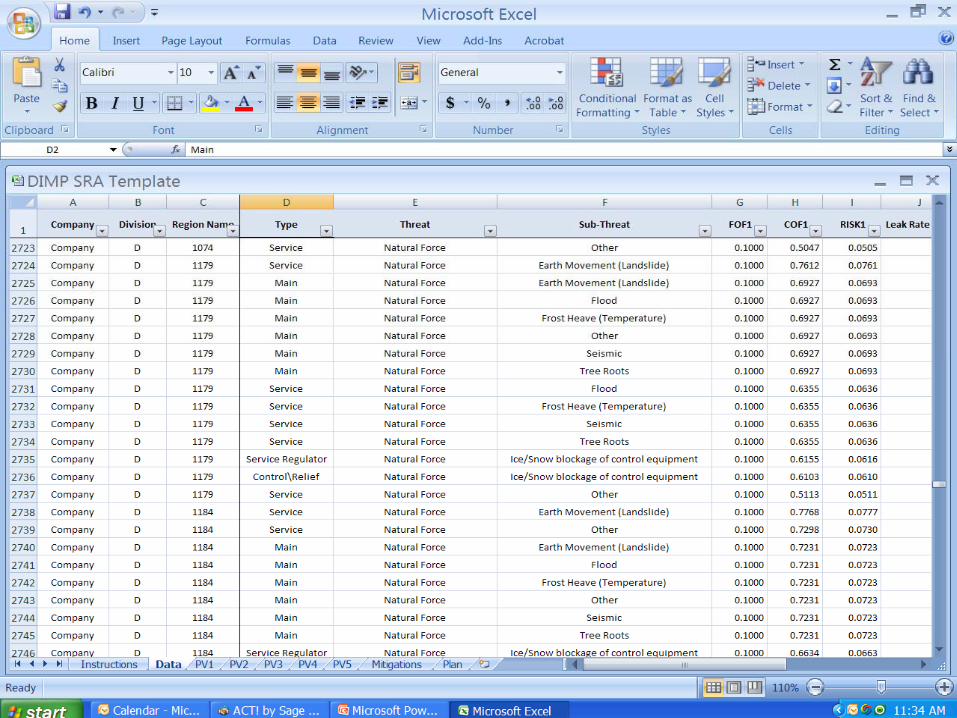
Generate COF,FOF1, & FOF2
Generate ScaledFOF1 & COF and Risk
Copyright 2010 New Century Software, Inc. All rights reserved
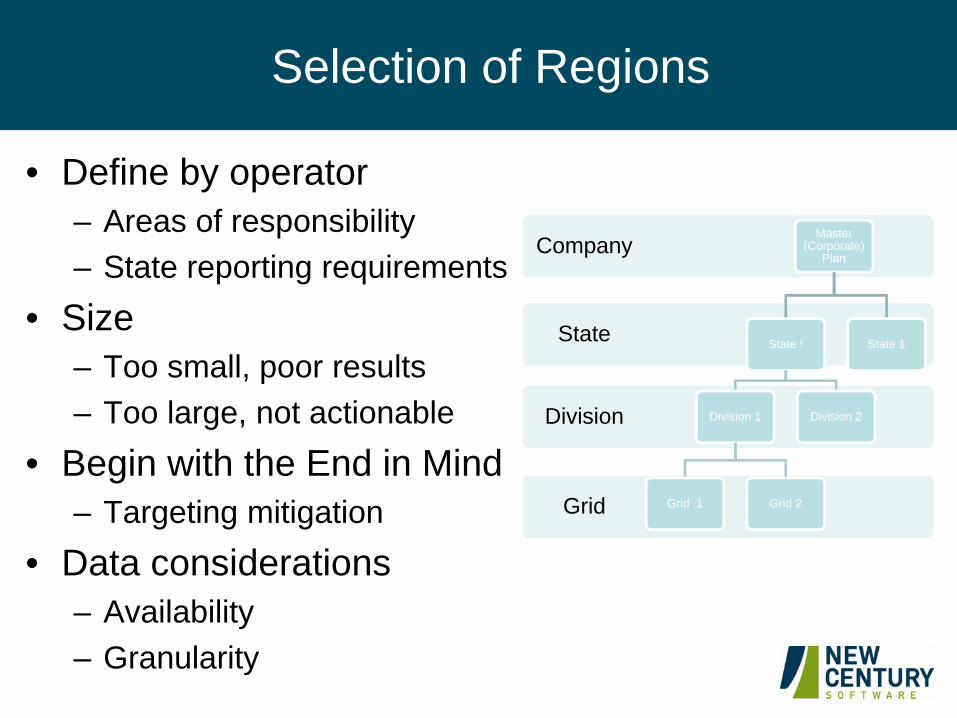
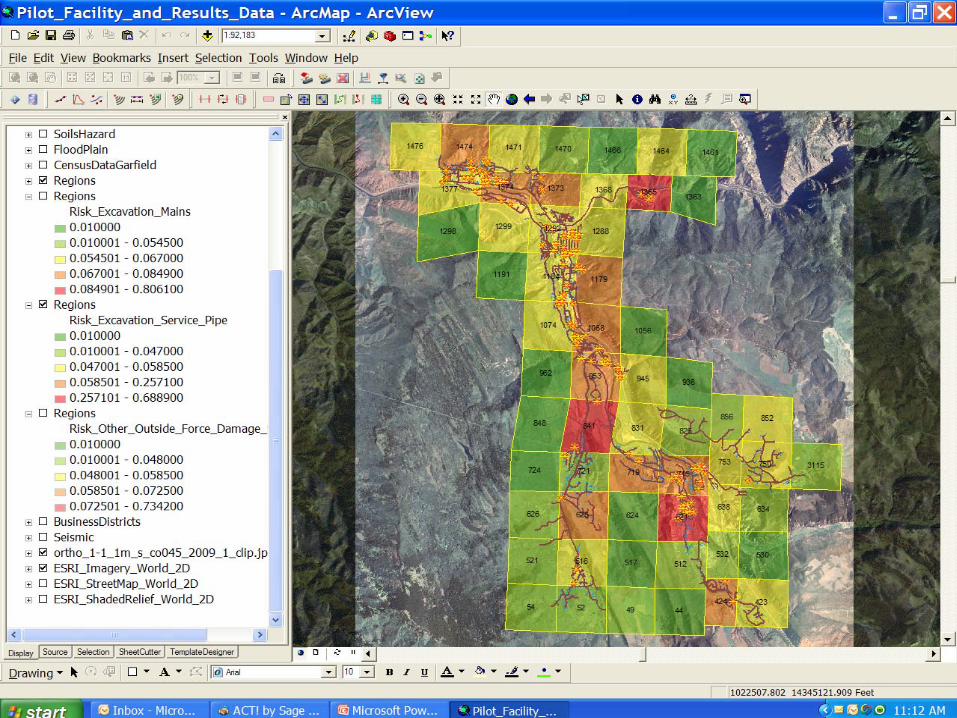
Selection of Regions
• Define by operator– Areas of responsibility– State reporting requirements
• Size– Too small, poor results– Too large, not actionable
• Begin with the End in Mind– Targeting mitigation
• Data considerations – Availability – Granularity
Grid
Division
State
CompanyMaster
(Corporate) Plan
State !
Division 1
Grid 1 Grid 2
Division 2
State 1
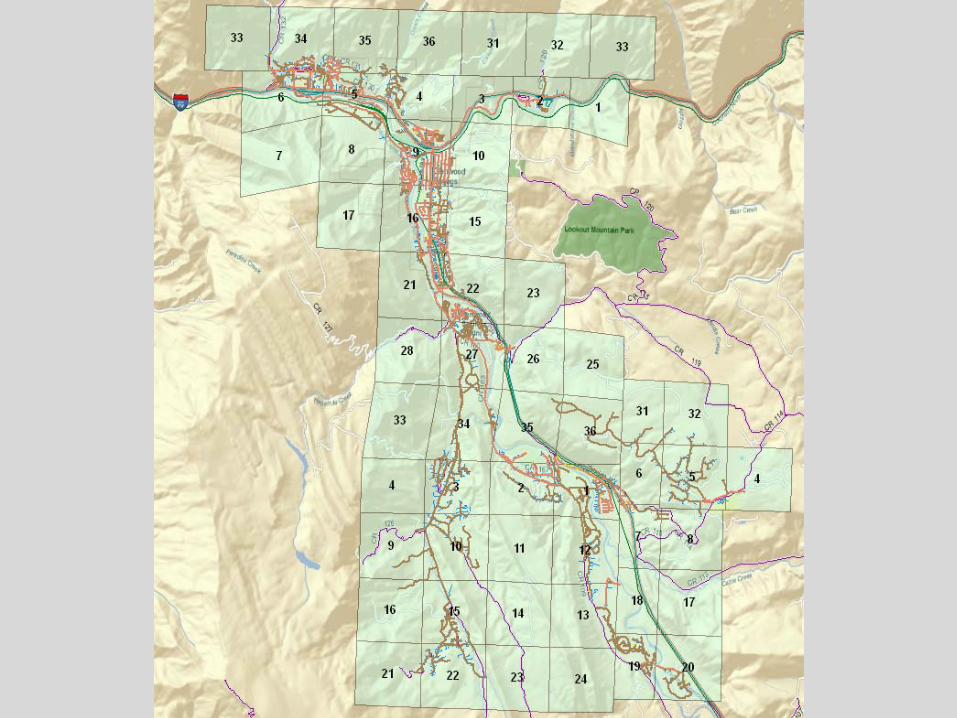
Regions
Data
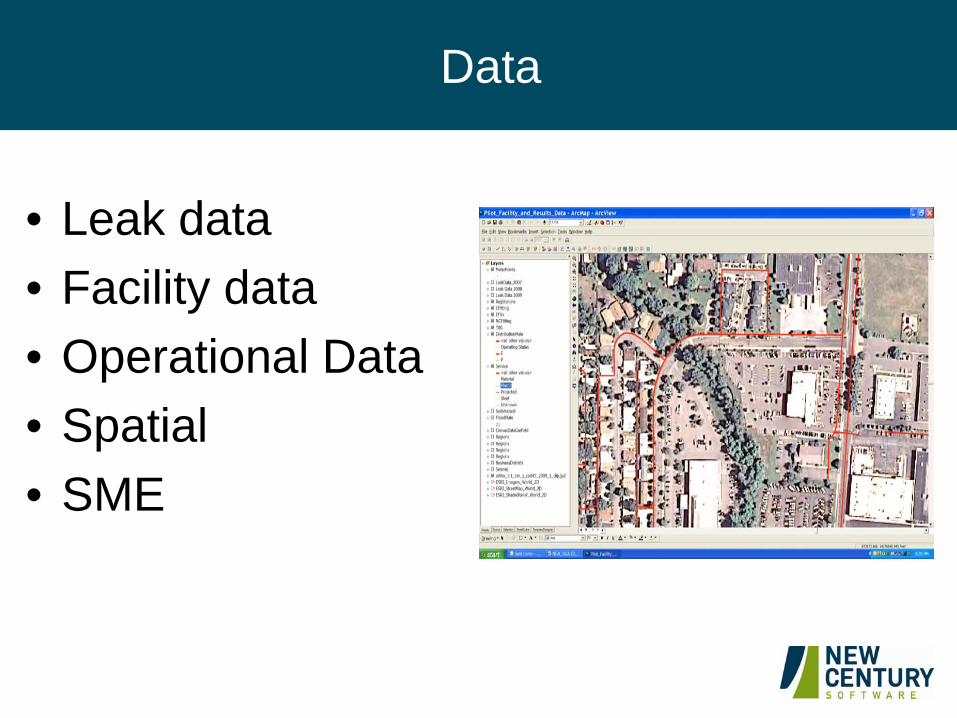
• Leak data• Facility data• Operational Data• Spatial• SME
Leak Data
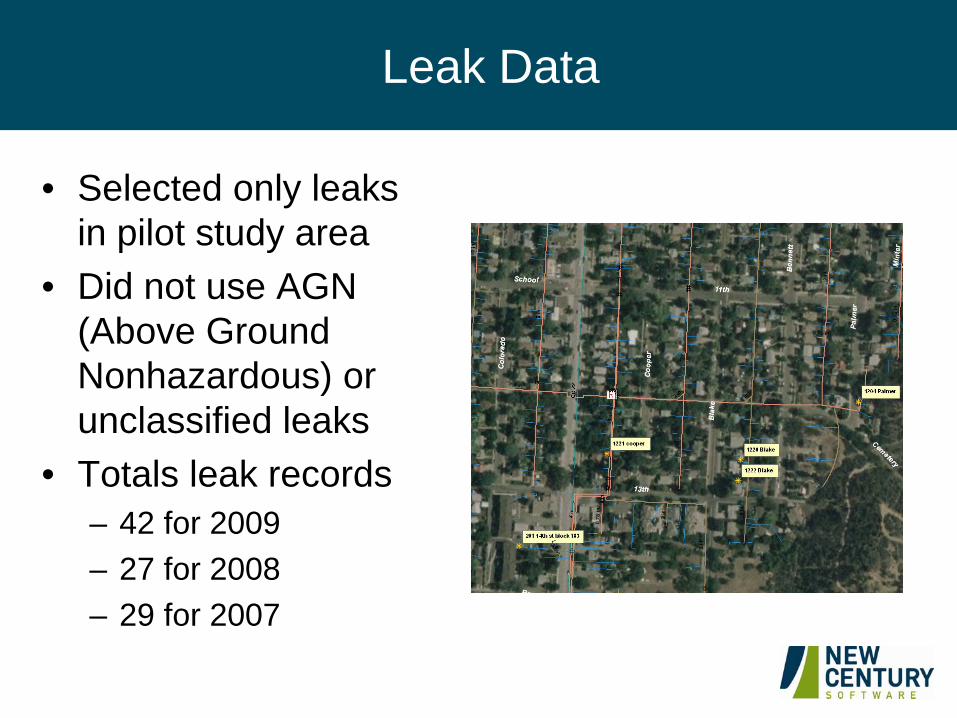
• Selected only leaks in pilot study area
• Did not use AGN (Above Ground Nonhazardous) or unclassified leaks
• Totals leak records– 42 for 2009– 27 for 2008– 29 for 2007
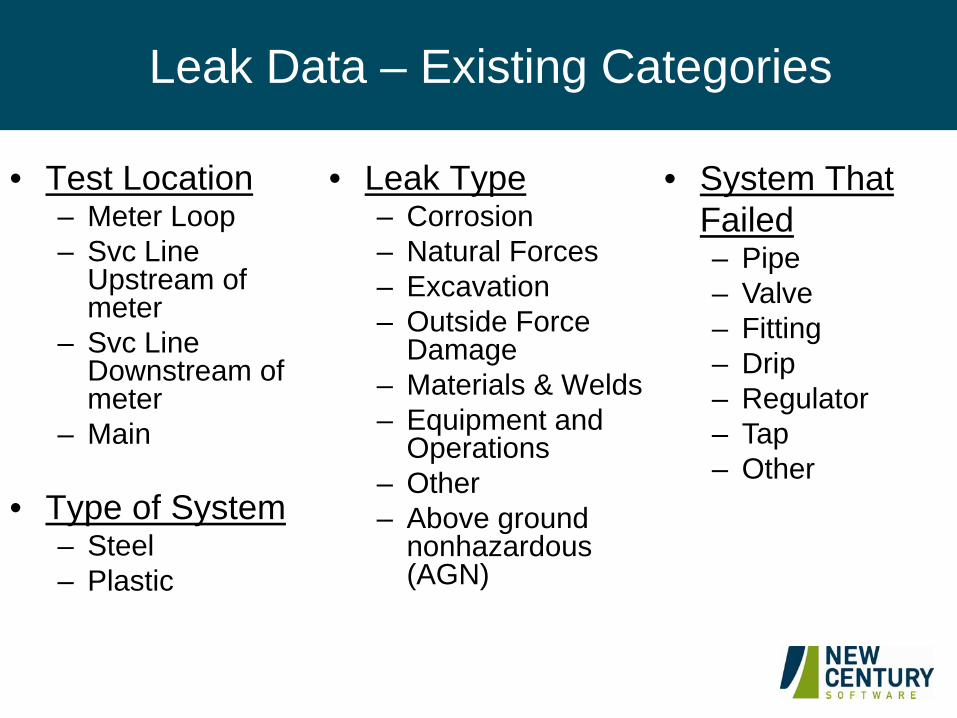
Leak Data – Existing Categories
• Test Location – Meter Loop– Svc Line
Upstream of meter
– Svc Line Downstream of meter
– Main
• Type of System– Steel– Plastic
• Leak Type– Corrosion– Natural Forces– Excavation– Outside Force
Damage– Materials & Welds– Equipment and
Operations– Other– Above ground
nonhazardous (AGN)
• System That Failed– Pipe– Valve– Fitting– Drip– Regulator– Tap– Other
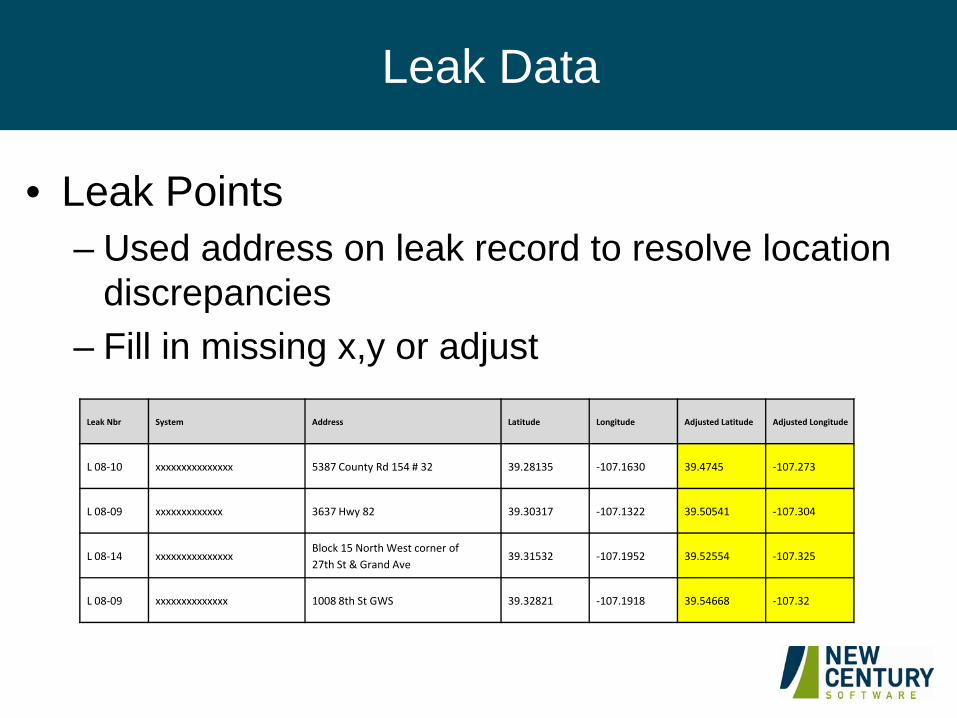
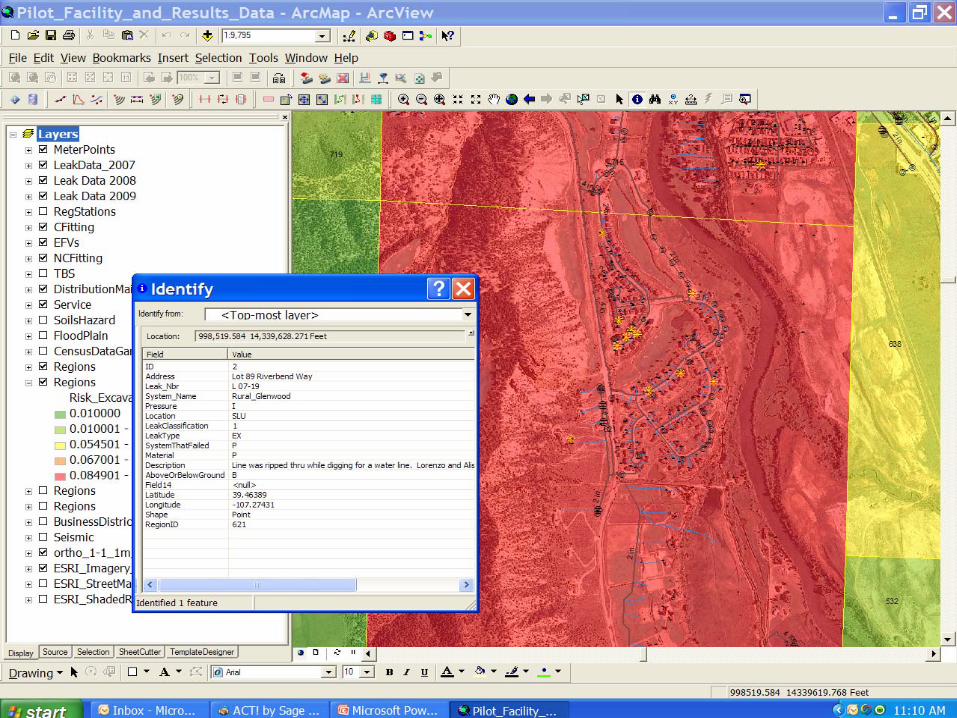
Leak Data
• Leak Points– Used address on leak record to resolve location
discrepancies– Fill in missing x,y or adjust
Leak Nbr System Address Latitude Longitude Adjusted Latitude Adjusted Longitude
L 08‐10 xxxxxxxxxxxxxxx 5387 County Rd 154 # 32 39.28135 ‐107.1630 39.4745 ‐107.273
L 08‐09 xxxxxxxxxxxxx 3637 Hwy 82 39.30317 ‐107.1322 39.50541 ‐107.304
L 08‐14 xxxxxxxxxxxxxxxBlock 15 North West corner of 27th St & Grand Ave
39.31532 ‐107.1952 39.52554 ‐107.325
L 08‐09 xxxxxxxxxxxxxx 1008 8th St GWS 39.32821 ‐107.1918 39.54668 ‐107.32
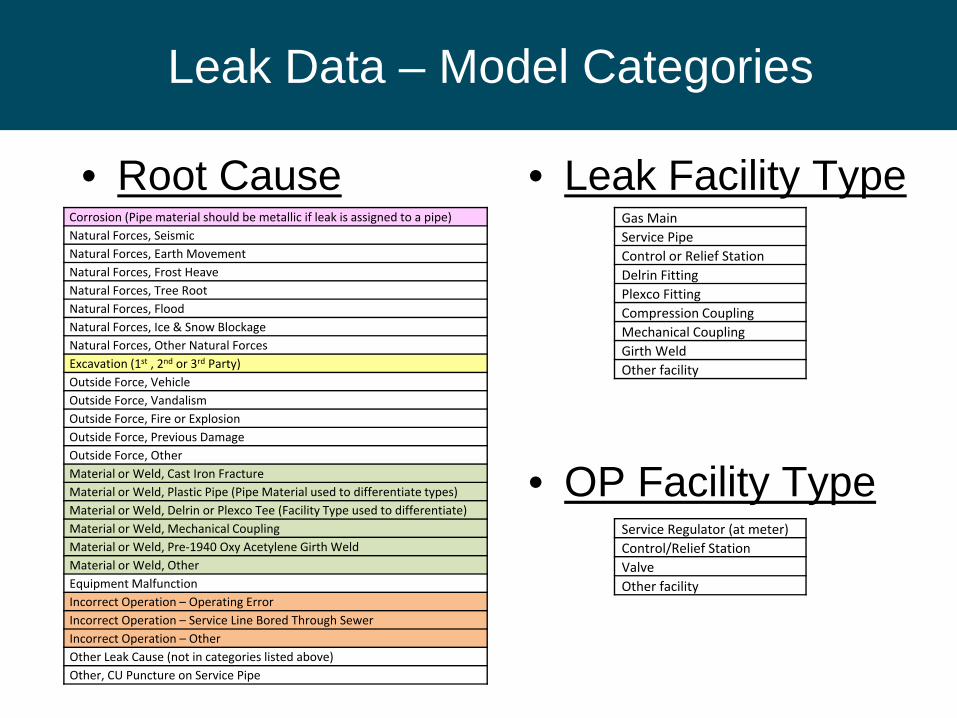
Leak Data – Model Categories
• Root CauseCorrosion (Pipe material should be metallic if leak is assigned to a pipe)Natural Forces, SeismicNatural Forces, Earth MovementNatural Forces, Frost HeaveNatural Forces, Tree RootNatural Forces, FloodNatural Forces, Ice & Snow BlockageNatural Forces, Other Natural ForcesExcavation (1st , 2nd or 3rd Party)Outside Force, VehicleOutside Force, VandalismOutside Force, Fire or ExplosionOutside Force, Previous DamageOutside Force, Other Material or Weld, Cast Iron FractureMaterial or Weld, Plastic Pipe (Pipe Material used to differentiate types)Material or Weld, Delrin or Plexco Tee (Facility Type used to differentiate)Material or Weld, Mechanical Coupling Material or Weld, Pre‐1940 Oxy Acetylene Girth Weld Material or Weld, OtherEquipment MalfunctionIncorrect Operation – Operating ErrorIncorrect Operation – Service Line Bored Through SewerIncorrect Operation – OtherOther Leak Cause (not in categories listed above)Other, CU Puncture on Service Pipe
• Leak Facility Type
• OP Facility Type
Gas MainService PipeControl or Relief StationDelrin FittingPlexco FittingCompression CouplingMechanical CouplingGirth WeldOther facility
Service Regulator (at meter)Control/Relief StationValveOther facility
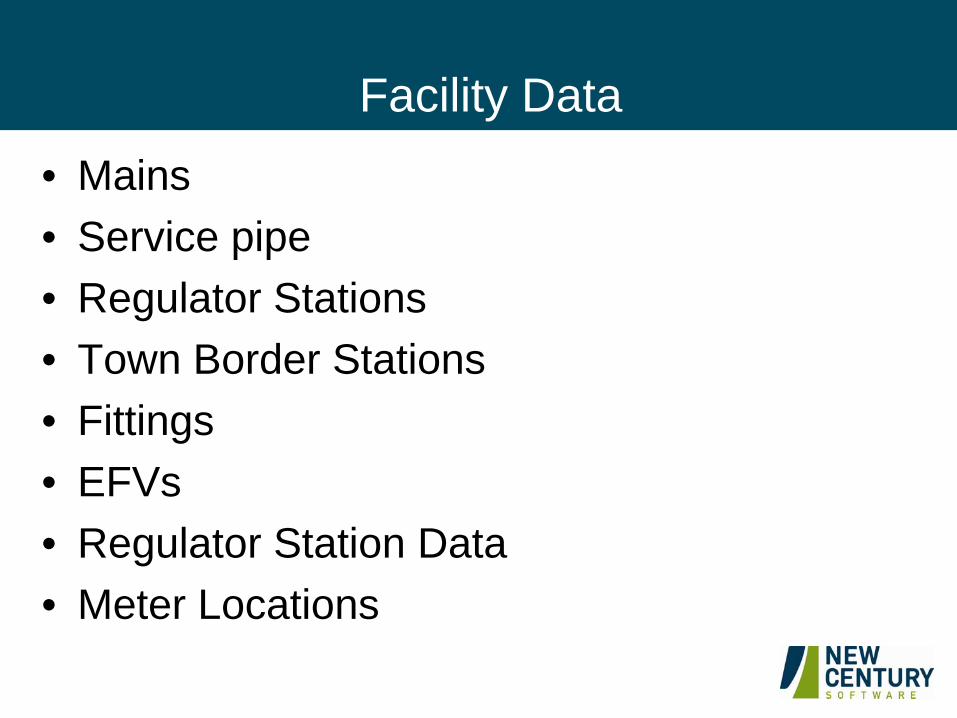
Facility Data• Mains• Service pipe• Regulator Stations• Town Border Stations• Fittings• EFVs• Regulator Station Data• Meter Locations
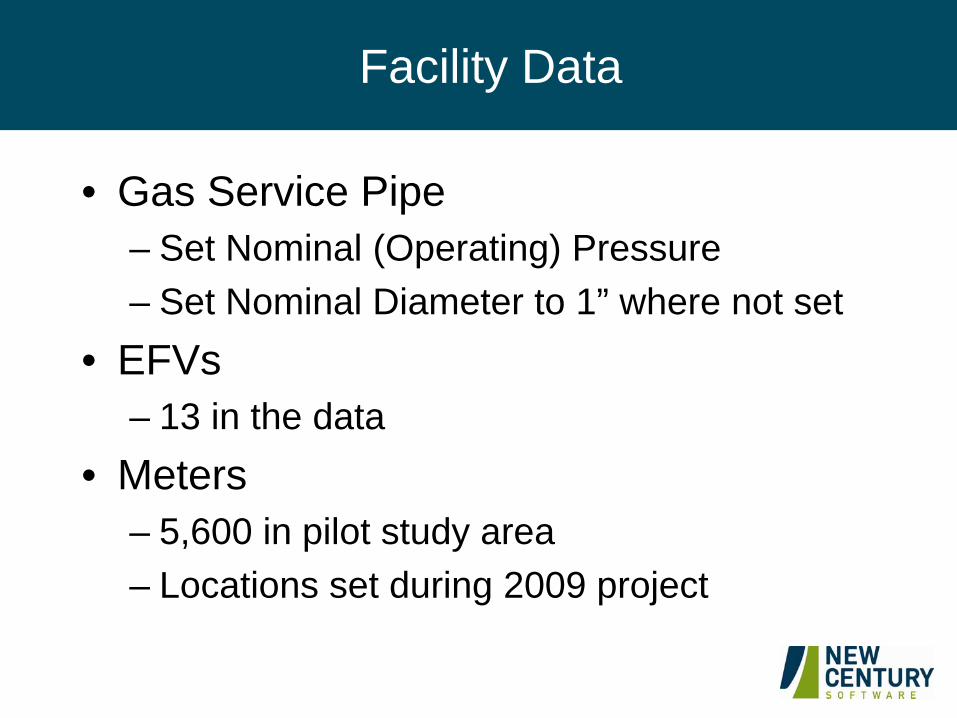
Facility Data
• Gas Service Pipe– Set Nominal (Operating) Pressure– Set Nominal Diameter to 1” where not set
• EFVs– 13 in the data
• Meters– 5,600 in pilot study area– Locations set during 2009 project
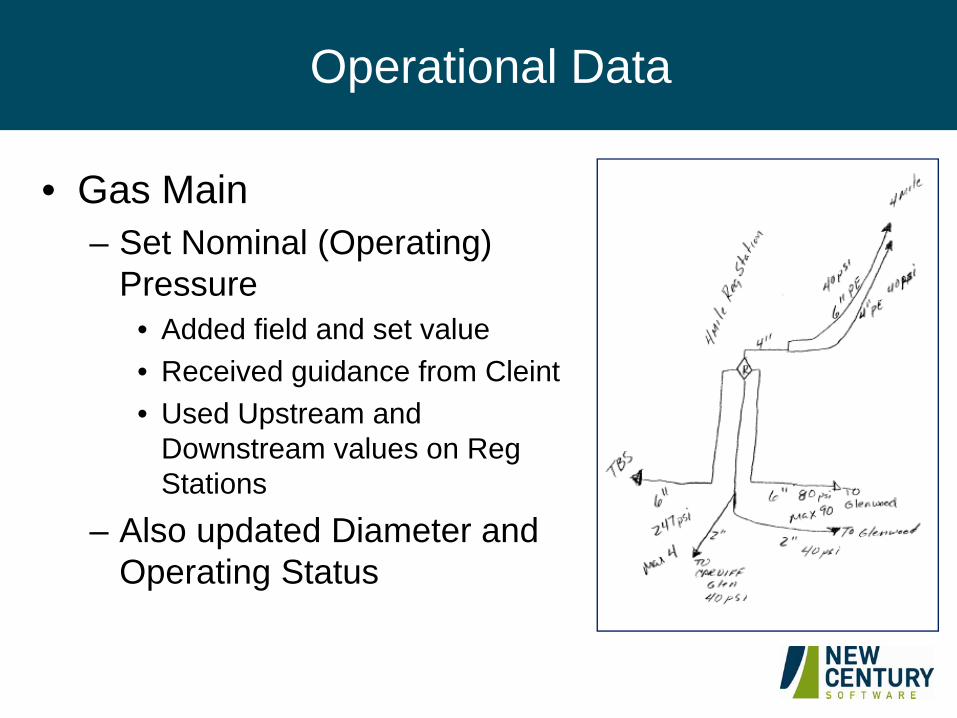
Operational Data
• Gas Main– Set Nominal (Operating)
Pressure • Added field and set value• Received guidance from Cleint• Used Upstream and
Downstream values on RegStations
– Also updated Diameter and Operating Status
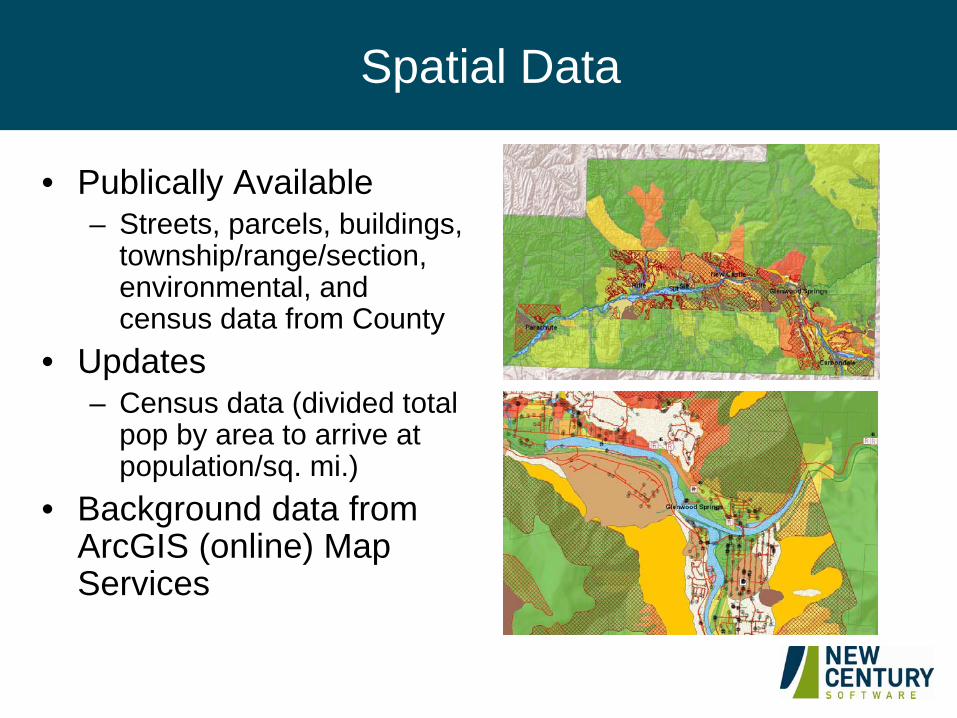
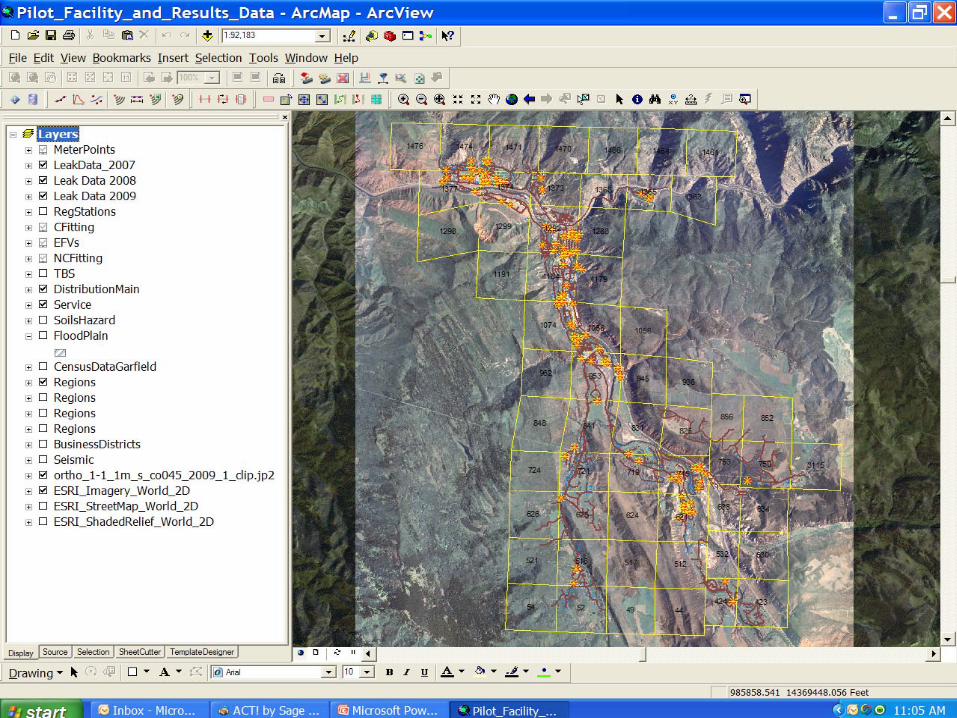
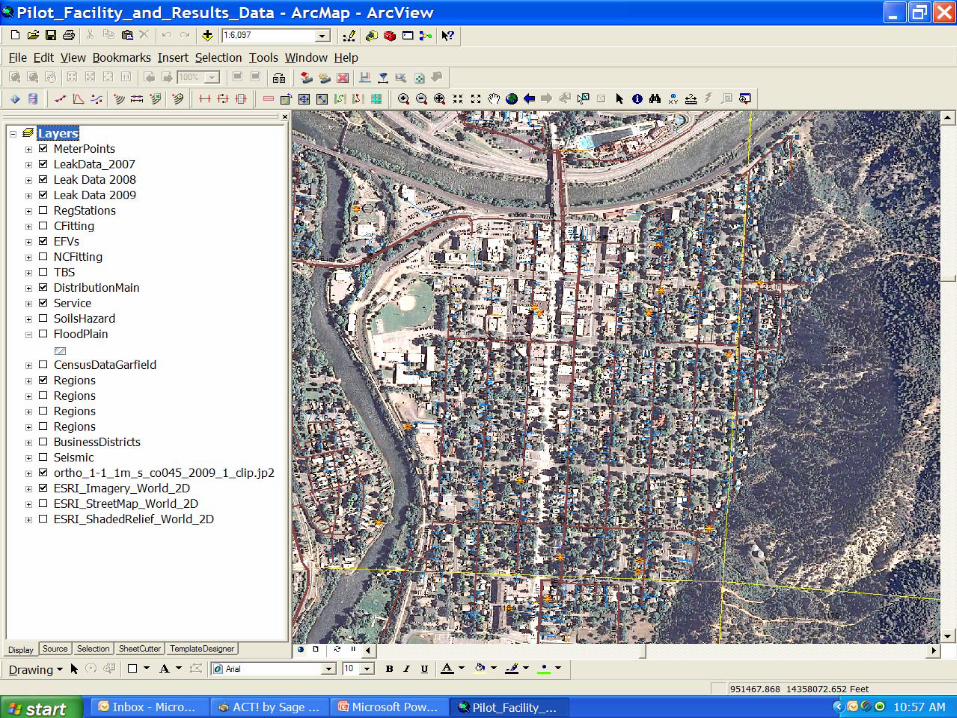
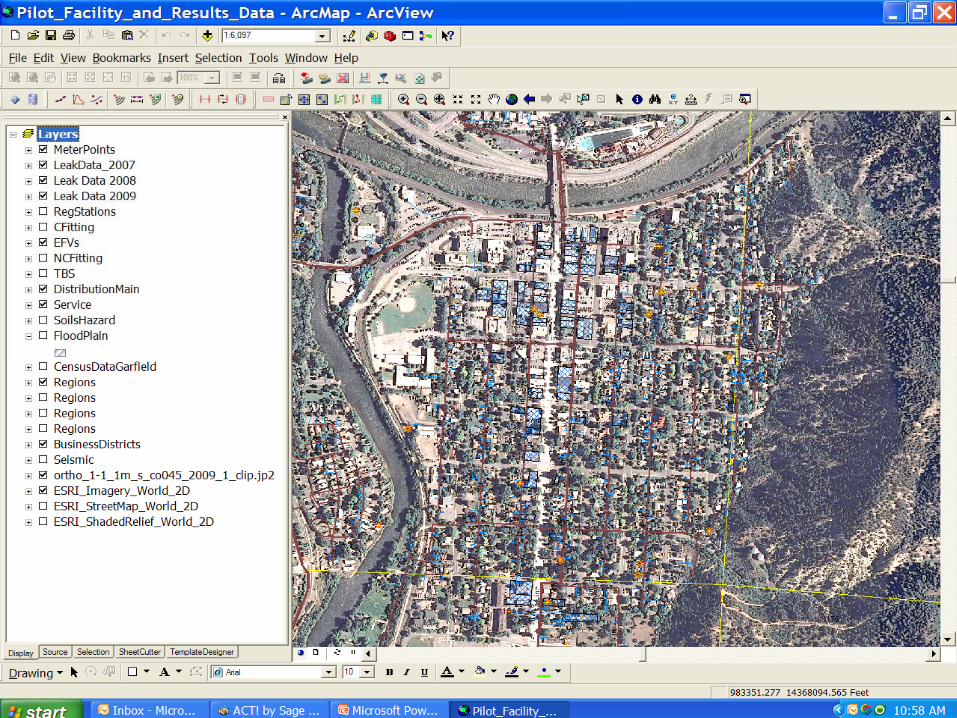
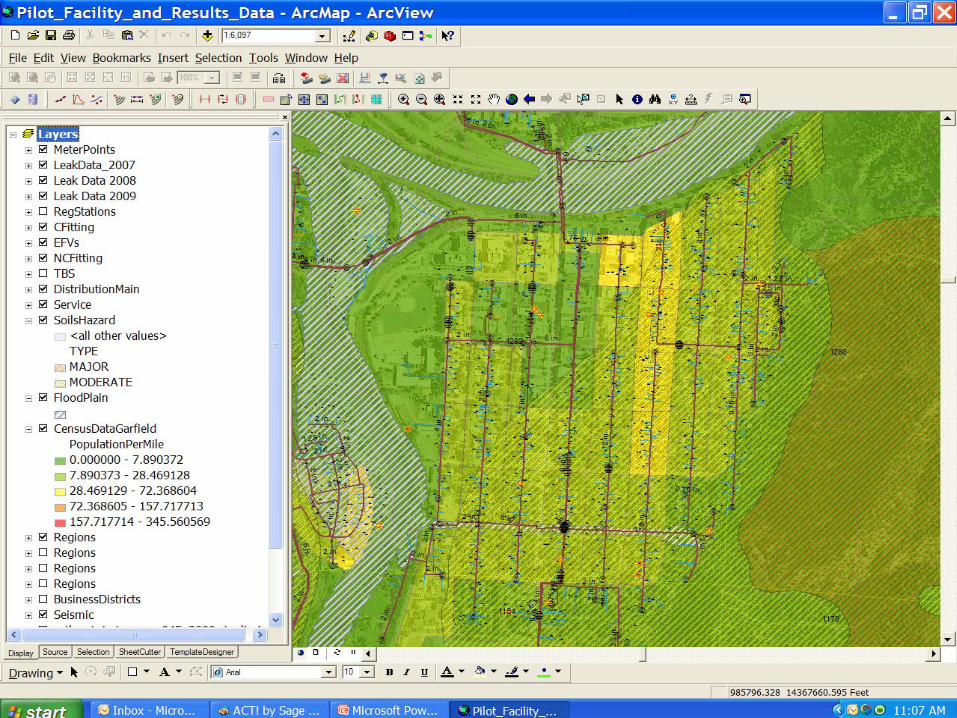
Spatial Data
• Publically Available– Streets, parcels, buildings,
township/range/section, environmental, and census data from County
• Updates– Census data (divided total
pop by area to arrive at population/sq. mi.)
• Background data from ArcGIS (online) Map Services

SME Data
• Wall-to-wall paving• Business districts• Seasonal frost cap
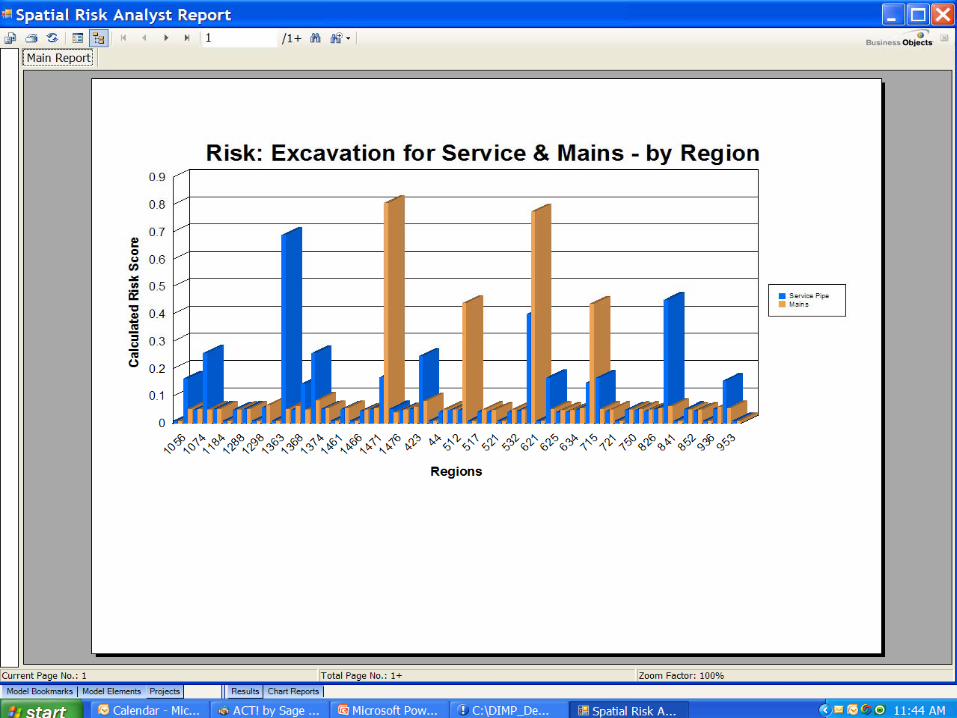
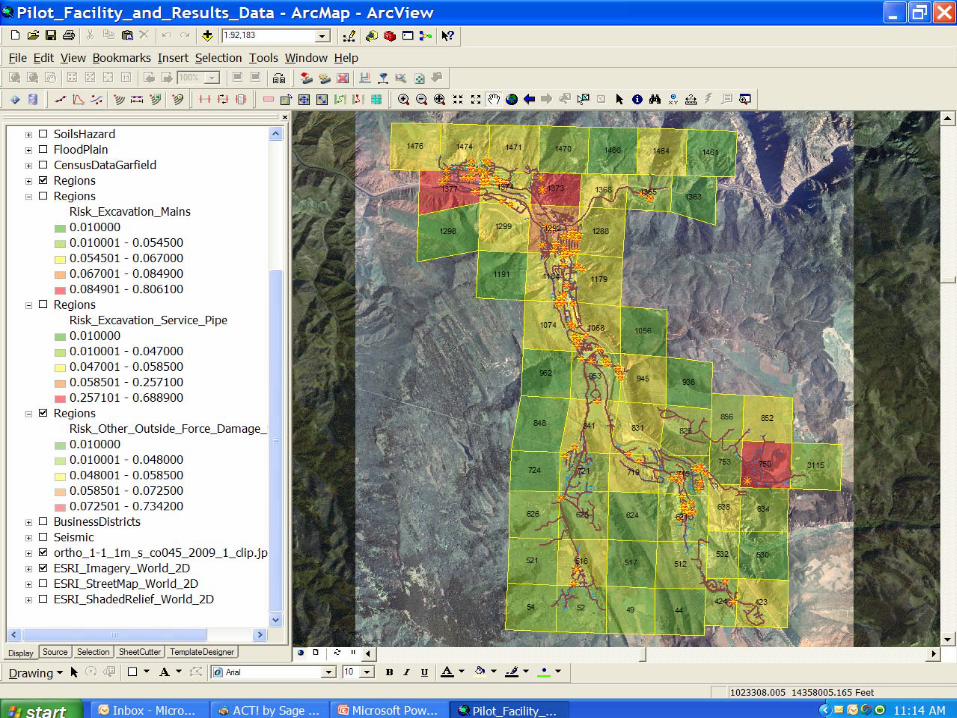
Results
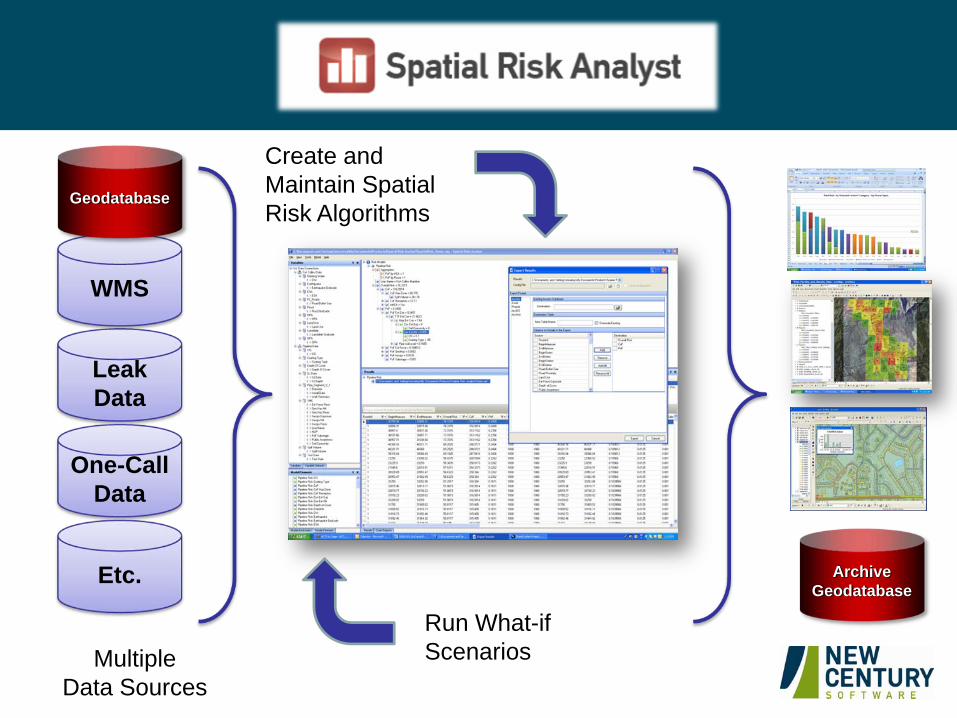
Etc.
Leak Data
One-CallData
Create and Maintain Spatial Risk Algorithms
Run What-ifScenariosMultiple
Data Sources
WMS
Geodatabase
ArchiveGeodatabase

Results


Lessons Learned
• Assess data readiness early• Make it a project/manage the process
– Begin with the end in mind– Leverage existing processes and procedures
• Use an industry standard approach• Implement a flexible solution
– Open architecture - No “black box”• “Show your work”• Provide tools to help entire DIM program• Leverage critical GIS Analyst expertise• Drive specific mitigation options
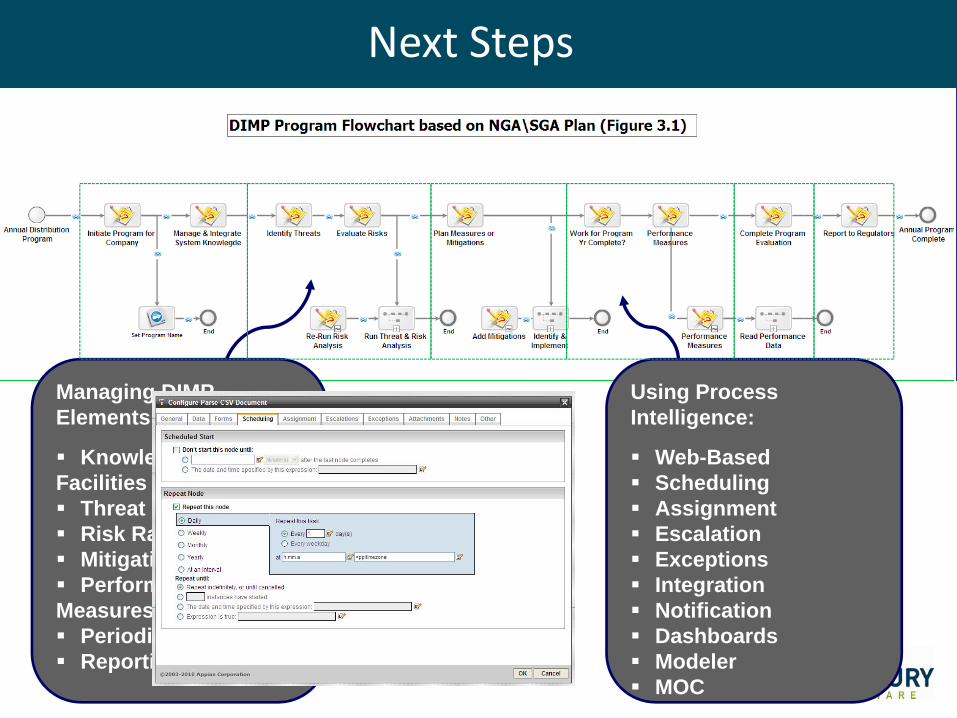
Next Steps
Managing DIMP Elements:
Knowledge of Facilities
Threat IdentificationRisk RankingMitigation MeasuresPerformance
MeasuresPeriodic EvaluationReporting
Using Process Intelligence:
Web-BasedSchedulingAssignmentEscalationExceptionsIntegrationNotificationDashboardsModelerMOCDocumentation

Questions
Thank You
Web sitewww.newcenturysoftware.com
Phone(970) 267-2016