Embed Size (px)
Citation preview
1
Individual variation of the SARS-CoV2 receptor ACE2 gene expression and regulation
Jiawei Chen1*, Quanlong Jiang2*, Xian Xia2*, Kangping Liu1*, Zhengqing Yu1, Wanyu
Tao1, Wenxuan Gong2 and Jing-Dong J. Han1,2#
1 Peking-Tsinghua Center for Life Sciences, Academy for Advanced Interdisciplinary Studies, Center for
Quantitative Biology (CQB), Peking University, Beijing 100871, China
2 CAS Key Laboratory of Computational Biology, CAS-MPG Partner Institute for Computational Biology,
Shanghai Institute of Nutrition and Health, Chinese Academy of Sciences Center for Excellence in
Molecular Cell Science, Collaborative Innovation Center for Genetics and Developmental Biology,
Shanghai Institutes for Biological Sciences, Chinese Academy of Sciences, 320 Yue Yang Road,
Shanghai, 200031, China
*These authors contributed equally to this work
#Correspondence and requests for materials should be addressed to J.-D.J.H. (Email:
ABSTRACT
The CovID19 coronavirus SARS-CoV2 spreading in Wuhan and now worldwide has been shown to use angiotensin-converting enzyme 2 ACE2 as its host cell receptor, like the severe acute respiratory syndrome coronavirus (SARS-CoV). Epidemiology studies found different sex and age groups have different susceptibility to infection, and very skewed severity and mortality of the virus infection, with male, old age, and comorbidity being the most inflicted. Here by analyzing GTEx and other public data in 30 tissues across thousands of individuals, we found significantly higher expression in Asian females compared to males and other ethnic groups, an age dependent ACE2 expression decrease and a highly significant decrease in type II diabetic patients. Consistently, the most significant expression quantitative loci (eQTLs) contributing to high ACE2 expression are close to 100% in East Asians, >30% higher than other ethnic groups. Together with the shockingly common enrichment of viral infection pathways among ACE2 anti-expressed genes, binding of virus infection-related transcription factors at ACE2 regulatory regions, the repression of ACE2 expression by inflammatory cytokines and by type 2 diabetes, and the induction by estrogen and androgen (both decrease with age) established a negative correlation between ACE2 expression and CovID19 fatality at both population and molecular levels. Our results will be instrumental when designing potential prevention and treatment strategies for ACE2 binding coronaviruses in general.
Introduction
Preprints (www.preprints.org) | NOT PEER-REVIEWED | Posted: 12 March 2020
© 2020 by the author(s). Distributed under a Creative Commons CC BY license.
2
Since December 2019, a novel CovID-19 coronavirus, formally named Severe Acute Respiratory Syndrome Coronavirus-2 (SARS-CoV2) 1, exploded in Wuhan, Hubei Province, China, and spread rapidly in China and worldwide. As of March, 5, 2020, 80, 552 cases were confirmed in China, 482 were suspected, with an alarming number of severe cases 2. Currently no effective drugs are clinically approved. It is therefore pivotal to find strategies to prevent the virus infection, in particular the severity and fatality associated with it. SARS-CoV-2 belongs to the same as the Severe Acute Respiratory Syndrome coronavirus (SARS-CoV), and was shown to use the same receptor, angiotensin converting enzyme 2 (ACE2) for entry into the cells through its surface spike (S) protein 3. ACE2 plays an important role in regulating the renin-angiotensin system (RAS). Acting as a protease to cleave angiotensin II, ACE2 counteracts the effect of angiotensin II and maintains blood pressure, heart rate, and osmotic pressure 4,5. Despite of not serving as a receptor for other viruses, such as influenza virus H5N1, it also protects mice against both SARS, H5N1 6, H7N9 7 and acid aspiration induced lung injury 8.
Epidemiology studies found among the virus positive cases, males are slightly more than female cases, but are highly skewed for the majority of the severely ill and fatality, in particular those older than 60 years or have chronic diseases such as type II diabetes (T2D) and hypertension 9-12, and are frequently associated with systemic inflammation or cytokine storm 10,13-15. For example, in the analysis of 44,672 confirmed patients in China by Feb 11, males account for 51.4% of the total patients but 63.8% of the deaths, and the fatalities of males and females are 2.8% compared to 1.7%, respectively 16. Patients older than 50 years account for nearly half of total confirmed cases, and the majority of fatality is attributed to old males. Globally, World Health Organization has reported 14,768 laboratory-confirmed cases outside China by March, 5, 2020, mainly distributed in Western Pacific Region, South-East Asia, Europe and North America, and very few cases in Africa 17, similar with the distribution pattern of previous SARS-CoV 18. These suggest that the differences in immunity, gene expression or even genetic background may contribute to the different susceptibility to and severity of SARS-CoV2 infection. Strangely, in the severe cases, many vital tissues including those with little ACE2 expressed are severely damaged SARS-CoV2 infection 19. Since ACE2 as a confirmed host cell receptor for SARS-CoV2 also plays an important role in regulating the renin-angiotensin system (RAS), we examined whether ACE2 expression may contribute to susceptibility and severity of the disease. Here, we found by using the large GTEx data, the association is opposite to that expected from a sole receptive/inductive role of ACE2, with higher ACE2 expression in Asian females, and significantly or insignificantly decreased during aging in many tissues, consistent with the strong ACE2 expression positive eQTLs highly prevalent in East Asians. In addition, using publicly available gene expression datasets, we found ACE2 expression upregulated by estrogen and androgen, repressed by inflammatory cytokines and type II diabetes (T2D) in various mouse and human tissues, and a strong negative correlation of ACE2 expression with viral infection, in particular herpes simplex virus 1 infection response genes in many tissues across different individuals.
Results
ACE2 expression in different tissues across human individuals
Preprints (www.preprints.org) | NOT PEER-REVIEWED | Posted: 12 March 2020
3
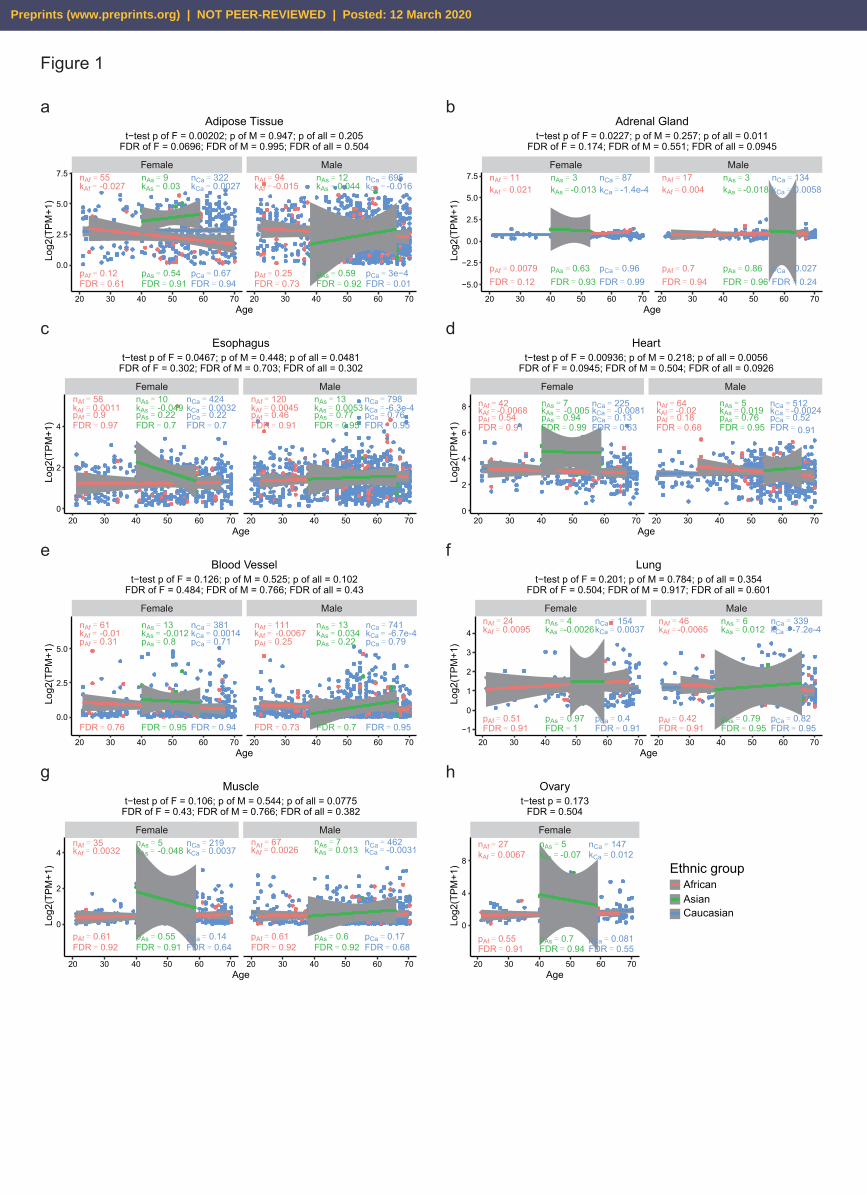
Because both SARS and CovID19 preferentially inflict old males 10,16,20 and most widely spread in East Asia, we examined whether ACE2 expression levels are different between male and female, and among the three major ethnic groups. If its sole function is the virus receptor, we would expect old Asian males have the highest level of ACE2, on the contrary, we found among the tissues with large sample sizes and high ACE2 expression, Asian females have significantly higher ACE2 expression in adipose tissue, adrenal gland, heart and esophagus than males, and compared to other ethnic groups (Fig. 1a-d), and moderately higher ACE2 expression in blood vessels, lung, muscle and ovary (Fig. 1e-h) (Methods). Although the trend is obvious, after multiple test correction, only adipose tissue reaches an FDR<0.1. In all ethnic groups, and for both sexes, ACE2 expression generally decreases with age significantly or insignificantly (Fig. 1 and Supplementary Fig. 1, Methods). Although only Caucasian samples are large enough to detect significance, it is obvious that the age dependent decrease is more significant in males than females. For examples, ACE2 expression significantly decrease with age in colon, blood and adrenal gland, brain, nerve, adipose and salivary gland in Caucasian males, but only does so in the first three tissues in female (Fig. 1 and Supplementary Fig. 1). For colon, nerve, salivary gland, adipose, blood and brain, even after multiple test correction, the age dependent decrease in Caucasian males is significant, but only remains significant for colon in females (FDRs in Fig. 1 and Supplementary Fig. 1). These patterns are opposite to an inductive effect of high ACE2 expression to virus infection susceptibility and severity. Complex gene regulatory elements of human ACE2 Then the next question is that what keeps Asian females have higher ACE2 expression than males, and what makes the ACE2 level decrease with age. The human ACE2 gene is mainly composed of two isoforms of 18 or 19 exons, with the longer isoform containing an extra exon at the 5’ end. The coronavirus S protein is known to bind to ACE2 at regions encoded in exons 1, 2 and 8 of the most studied 18-exon isoform. Here we refer all annotations according to this 18-exon isoform. We first analyzed chromatin modification and transcription factor (TF) binding ChIP-seq profiles to identify key regulatory regions in the -10kb of transcription start site (TSS) to +10kb of transcription termination site (TTS) of the ACE2 gene. In addition to the promoter region marked by H3K4me3 and DNAse I hypersensitivity (regulatory region R2), we also identified four enhancer-like sites marked by H3K4me1, H3K27ac, DNAse I hypersensitivity or TF binding clusters upstream of TSS (R1), downstream of TTS (R5), between exons 8 and 9 (R3) (which is the strongest and most ubiquitous among different cell types), and between 16 and 17 (R4), respectively (Fig. 2a) (Methods).
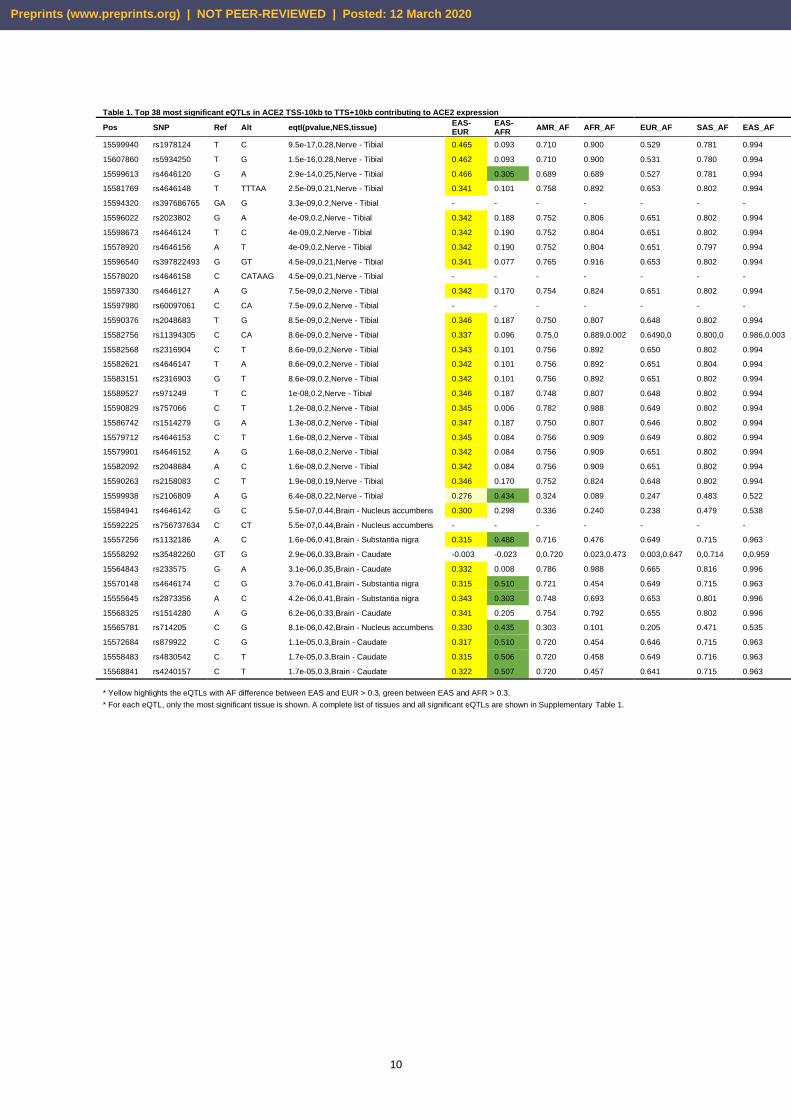
We then calculated ACE2 eQTLs from the GTEx data for each tissue in the TSS-10kb to TTS+10kb region of the ACE2 gene (Methods). Although eQTLs are calculated independently, they form 5 clusters, remarkably corresponding to the 5 regulatory regions. In particular, two previously reported SNPs (rs2074192 and rs2106809) that are associated with left ventricle hypertension (LVH) 21 fall into R1 at the promoter and the R4, respectively, suggesting that the hypertension association of the SNPs are mediated by their effects on ACE2 gene expression, and further confirming the regulatory role of these regions. All the most significant eQTLs in many tissues, including brain, nerve, artery, ovary, adipose and liver, have specifically high (close to 100%) allele frequency in East Asians, and are all positively correlated with higher ACE2 expression, indicative
Preprints (www.preprints.org) | NOT PEER-REVIEWED | Posted: 12 March 2020
4
of their contributions to higher ACE2 expression in East Asians (Table 1). These are apparently consistent with the significantly higher ACE2 expression of East Asian females compared to other ethnic groups independent of age (Fig. 1).
It was previously reported that estrogen is protective against SARS infection in mice 22. We asked whether ACE2 expression is regulated by estrogen or androgen (testosterone). Interestingly, among these regulatory regions there are many estrogen receptor binding motifs and a few androgen receptor binding motifs. In particular, R1 and R4 contain clusters of multiple ESR binding motifs and more tissue specific enhancer marks than the more ubiquitous R3 (Fig. 2a). These implicates that higher ACE2 expression might have been selected in Asians females pervasively in many tissues but in a tissue or cell type specific manner, potentially through estrogen regulation. Regulation of ACE2 expression by estrogen and androgen To test whether the sex hormones, which decrease with age, can regulate ACE2 expression, we searched the GEO database for RNA-seq/microarray datasets upon estrogen or androgen treatment. Among these data, we found estrogen treatment significantly increases ACE2 expression by an average of 1.274 log2 fold in mouse thymus (GSE2889, p=0.005, FDR=0.028, Fig. 2b), whereas androgen (testosterone) increases Ace2 expression in mouse kidney by an average of 0.533 log2 fold (GSE47181, p=0.017, FDR=0.137, Fig. 2c). Interestingly, transgender males who underwent estrogen therapy (estradiol) and androgen deprivation therapy (spirolactone) for 1 year show significantly higher ACE2 expression level and more ACE2 expressing cells among testis Sertoli cells (Supplementary Fig. 2). As both estrogen and androgen are well known to decrease with age 23, thus these declines might contribute to ACE2 expression decrease over age, which could be particularly the case for estrogen.
Potential function of ACE2 in antiviral response In the majority of human tissues across different individuals, the top most enriched pathway transcriptionally anti-correlated with ACE2 is Herpes simplex virus 1 (HSV1) infection, in lung, is human papilloma virus (HPV) infection (Fig. 3a, Supplementary Fig. 3). The virus infection related genes negatively correlated with ACE2 expression in intestine, breast and ovary include the APOBEC RNA (often viral RNA) editing enzymes, and most prominently many ZNF (shockingly all are KRAB-ZNF containing the transcriptionally repressive KRAB domain) transcription factors, which often directly binds to endogenous retrovirus sequences (Supplementary Table 2). At least 3 KARB-ZNFs directly bind to the ACE2 R3 region (Supplementary Fig. 4). Intriguingly, these genes are strongly positively correlated ACE2 expression in testis and pancreas (Supplementary Table 2), but not in pancreas ductal cells, where the most significant KEGG negatively associated with ACE2 expression is again herpes virus infection (Supplementary Fig. 5d-e).
Although by directly binding and consuming ACE2, the ACE2 protein expression is expected to decrease by SARS-CoV infection as reported 24, it is puzzling why virus infection by those that do not use ACE2 as receptor, such HSV1, HIV or HPV show any positive or negative correlation with ACE2 expression. ACE2 protein expression is repressed by lung injury caused by acid inhalation 8, H5N1 6 and H7N9 25, and ACE2 KO mice have been shown to be more susceptible to lung injury caused by acid inhalation 8, H5N1 6, H7N9 7 and and SARS-CoV 24. Consistently, we
Preprints (www.preprints.org) | NOT PEER-REVIEWED | Posted: 12 March 2020
5
found using a previously published microarray dataset on mice lung upon SARS-CoV infection, ACE2 mRNA is transiently upregulated at low SARS-CoV titer but repressed at higher dosage or with time after infection, by day 4 even the lowest dosage tested suppressed ACE2 expression (Fig. 3b).
Since cytokine storm was shown to underline the severity of the infection 10,13, we whether some of the differentially expressed cytokines between mild and severe symptom patients can suppress ACE2 expression. These include the significant
increase of IL-2, IL-7, IL-10, G-CSF, IP-10, MCP-1, MIP-1a, and TNF- in severe
symptom patients 10. We found using public gene expression data, IL-7 significantly decreased Ace2 expression in mouse CD4 T cells (GSE86542, logFC=-1.386, p=0.038, FDR=0.282) and IL-2 decreased Ace2 expression in induced Treg cells from Foxp3/EGFP bicistronic mice (GSE14415, logFC=-0.962, p=0.0003, FDR=0.023) (Fig. 3c and d). As T2D is highly associated with CoVID-19 fatality 26, we compared ACE2 expression in T2D versus control human subjects. Interestingly, ACE2 expression are significantly decreased in at least in female adipose tissue and male muscle in T2D patients (Supplementary Fig. 5a and b). A single cell RNA-seq data showed ACE2 are expressed in ductal cells of pancreas (Fig. 3e-g and Supplementary Fig. 5), and both ACE2 expression and the fraction of ACE2+ cells among all ductal cells and significantly decrease in T2D patients (GSE83139, p=0.00047 and 0.0032, respectively). The fraction of ACE2+ cells also slightly decreases with age, while the average ACE2 expression per ACE2+ ductal cell is largely unchanged with age, but decreases in T2D (p=0.00901, Fig. 3f). These suggest that T2D or its associated inflammation also results in low basal level of ACE2 expression. Taken together, our results implicate that low ACE2 expression or reserve in an individual may contribute to the progression of the CoVID-19 to a severe or fatal stage, consistent with the previous reports that ACE2 knock out precipitates H5N1, H7N9 and acid induced lung injury 6-8,24. Discussion In summary, through integrating public genomics, epigenomics and transcriptomics data, we examined whether variation of the SARS-CoV2 receptor ACE2 gene expression in different tissues across individuals can explain the differences in infection susceptibility and outcome. Our findings are contrary to the expectation from ACE2 being only a receptor for the virus, instead, its expression level is high in Asian females and young people (Fig. 1 and Table 1), those who are known to be less susceptible, and even less inflicted by severe or fatal outcome, while it is low in males, further decrease with age and T2D, those who are most susceptible to bad outcome (Fig. 1 and 3), suggesting at a population level a negative correlation between ACE2 expression and CovID19 severity and fatality.
At the molecular level, we found ACE2 anti-expressed genes in most tissues and cells are highly enriched for virus infection pathways (Fig. 3a), estrogen strongly and androgen moderately increase ACE2 expression in mouse and human tissues (Fig. 2), whereas severe CoVID-19 induced IL-2 and IL7 repress ACE2 expression in mouse T cells, and T2D reduced ACE2 expression and ACE2 expressing cells in human tissues (Fig. 3). The effect of estrogen, androgen and cytokines are reflected on clusters of estrogen and androgen receptors, STAT5, JUN, MYC and other TFs binding at ACE2 regulatory regions, where hypertension QTLs and the great majority of ACE2 eQTLs are also mapped to. Finally, as the eQTLs that show largest allele frequency differences between ethnic groups are also the ones having close to full
Preprints (www.preprints.org) | NOT PEER-REVIEWED | Posted: 12 March 2020
6
penetrance in East Asians and also the strongest positive eQTLs on ACE2 expression (Table 1), ACE2 expression differences among ethnic groups are indeed genetically coded, which may also contribute to the differences in SARS-CoV2 infection outcome.
Our results established a counter argument against the speculation that high ACE2 is a culprit in CoVID-19 outcome, and on the contrary supports a protective role of high ACE2 expression against SARS-CoV2 fatality (Fig. 3h). The exceptionally elevated basal level of ACE2 in Asian females (Fig. 1) and the strong positive ACE2 eQTLs in East Asians (Table 1) suggest that it could be the Asian females are more protected against SARS-CoV and SARS-CoV2 severe symptoms rather than males being more susceptible. Although we have analyzed thousands of samples, the sizes of Asian samples and samples for some tissues are still small compared to others, it remains to be seen whether larger samples will reveal similar patterns in the future when more data become available.
The repression of ACE2 might be counteracted by higher basal ACE2 level, which is inducible by higher sex hormone levels (that decrease with age) and repressed by systemic inflammation (that increase with age and chronic diseases) (Fig. 2 and 3). For SARS-CoV2, the decrease of ACE2 might be further exacerbated by the direct binding and consumption of ACE2 protein by the virus. Before the availability of an effective vaccine to prevent SARS-CoV2 infection, a major task is to understand the variations in severity and fatality of the infection in human populations, to which ACE2 might be one of the contributors. Fortunately, the low ACE2 activity can be rescued by dampening its negatively regulated downstream targets such as angiotensin II or its receptors, such as by angiotensin II antagonist losartan 27. Methods GTEx gene expression data and analysis The gene TPM data were obtained from the GTEx Portal and dbGaP accession number phs000424.v8.p2. Meta data (ethnic and sex information) were obtained from phs000424.v8.pht002742.v8.p2.c1.GTEx_Subject_Phenotypes.GRU.txt. For each tissue with more than 20 samples (27 tissues altogether), linear regression analyses and significance tests of ACE2 expression to age in males and females of the three ethnic groups were obtained by lm(Expression~Age) and t.test(Asian, others) in R. Multiple testing BH corrected FDR of the t-test p values and linear regression p values were obtained by p.adjust(pvalues, method = "fdr") in R based on all 27 tested tissues. The scatter plots were plotted by R package “ggplot2”. 19 tissues with more than 10 ACE2 positive (log2(TPM+1) ≥ 2) samples were used to calculate expression PCC between each gene and ACE2. In each tissue, the genes ranked by PCC were used to test KEGG pathway enrichment by GSEA.
Calculation of eQTLs of ACE2 SNPs of +/-10kb of ACE2 were selected from dbSNP build 150. These SNPs were used to calculate eQTLs for all tissues of GTEx by the ‘eQTL Calculator’ from GTEx. eQTLs with p value < 0.01 were retained. Population allele frequencies were obtained from 1000 Genomes Phase 3. UCSC genome browser track view of ACE2 gene regulatory regions The ENCODE track of transcription, histone modification (H3K4me1, H2K4me3 and H3K27ac) and transcription factor ChIP-seq clusters are selected to show around
Preprints (www.preprints.org) | NOT PEER-REVIEWED | Posted: 12 March 2020
7
ACE2 gene (including +/-10kb of the whole gene). In parallel, we added thes track of eQTLs that has large difference between populations, all eQTLs on ACE2, and functional annotation of ACE2 gene (including inferred motif binding region of ESR1, ESR2 and AR, calculated by FIMO from MEME suite with default settings, and inferred interaction sites with SARS-Cov spike glycoprotein from the UniProt database).
Public data for perturbation effect on Ace2 expression The GEO database was searched for perturbations, including estrogen, androgen,
testosterone, IL-2, IL-7, IL-10, G-CSF, IP-10, MCP-1, MIP-1a, and TNF-α according
to the significantly differentially expression between mild and severe symptom patients 10, on both human and mouse normal tissue or cell lines. Log2 fold change (logFC) relative to controls, p and FDR (adjusted p value by BH correction) were calculated by using the GEO2R R script and visualized. For platform have several probes or several experimental setups for Ace2, the one with smallest p is shown. Mouse lung SARS-CoV infection microarray was downloaded from the GEO database (GSE33266), and log2 expression levels were visualized. Analysis of ACE2 expression in ductal cells GEO dataset (GSE83139) was used for analysis. The Seurat program (https://satijalab.org/seurat/, v.3.1.4) was used to read a combined gene-barcode matrix of all samples. Each sample was filtered and normalized with default settings. Specifically, cells were retained only if they contained > 200 expressed genes and had < 25% reads mapped to mitochondrial genome. t-SNE and clustering analyses were performed on the combined data using the top 2,500 highly variable genes and 1-15 PCs, which showed the most significant p values. The expression level of highly variable genes in the cells was scaled and centered for each gene, then used for t-SNE plot. Analysis of ACE2 expression in human testis GEO datasets (GSE134144, GSE112013) were used for bioinformatics analysis. We used Sctransform (https://satijalab.org/seurat/v3.0/sctransform_vignette.html,v0.2.1) to merge, normalizes and stabilizes the technical noise variance of UMI counts prior of adult, adolescent and transgender samples data. Each experiment was filtered and normalized with default settings. Specifically, cells were retained only if they contained >500 expressed genes and had < 25% reads mapped to mitochondrial genome. 19,240 testis cells were retained in for downstream analysis. Dimensionality reduction by Seurat and Monocle (https://cole-trapnell-lab.github.io/monocle3/,v2.14.0) were used for visualization and further exploration of results.
Acknowledgements
This work was supported by grants from National Natural Science Foundation of China
(91749205) and China Ministry of Science and Technology (2016YFE0108700) to J.D.J.H. We thank Fan Lan and Minghong Zhu for suggestions.
Author contributions
J.D.J.H. conceived the project, instructed the analyses and wrote the paper with help from others. All others implemented the analyses.
Preprints (www.preprints.org) | NOT PEER-REVIEWED | Posted: 12 March 2020
8
References 1 Gorbalenya, A. E. et al. The species Severe acute respiratory syndrome-related
coronavirus: classifying 2019-nCoV and naming it SARS-CoV-2. Nature Microbiology, doi:10.1038/s41564-020-0695-z (2020).
2 National Health Commission of the People’s Republic of ChinaThe latest situation of novel coronavirus pneumonia as of 24:00 on 5, March, 2020, <http://www.nhc.gov.cn/xcs/yqtb/202003/b59dbcc84ed1498292714975039dcdc9.shtml> (2020).
3 Zhou, P. et al. A pneumonia outbreak associated with a new coronavirus of probable bat origin. Nature, doi:10.1038/s41586-020-2012-7 (2020).
4 Crackower, M. A. et al. Angiotensin-converting enzyme 2 is an essential regulator of heart function. Nature 417, 822-828, doi:10.1038/nature00786 (2002).
5 Boehm, M. & Nabel, E. G. Angiotensin-Converting Enzyme 2 — A New Cardiac
Regulator. New England Journal of Medicine 347, 1795-1797, doi:10.1056/NEJMcibr022472 (2002).
6 Zou, Z. et al. Angiotensin-converting enzyme 2 protects from lethal avian influenza A H5N1 infections. Nature Communications 5, 3594, doi:10.1038/ncomms4594 (2014).
7 Yang, P. et al. Angiotensin-converting enzyme 2 (ACE2) mediates influenza H7N9 virus-induced acute lung injury. Scientific Reports 4, 7027, doi:10.1038/srep07027 (2014).
8 Imai, Y. et al. Angiotensin-converting enzyme 2 protects from severe acute lung failure. Nature 436, 112-116, doi:10.1038/nature03712 (2005).
9 Wang, D. et al. Clinical Characteristics of 138 Hospitalized Patients With 2019 Novel Coronavirus-Infected Pneumonia in Wuhan, China. Jama, doi:10.1001/jama.2020.1585 (2020).
10 Huang, C. et al. Clinical features of patients infected with 2019 novel coronavirus in Wuhan, China. Lancet (London, England), doi:10.1016/s0140-6736(20)30183-5 (2020).
11 Chen, N. et al. Epidemiological and clinical characteristics of 99 cases of 2019 novel coronavirus pneumonia in Wuhan, China: a descriptive study. Lancet (London, England), doi:10.1016/s0140-6736(20)30211-7 (2020).
12 Guan, W. J. et al. Clinical Characteristics of Coronavirus Disease 2019 in China. N Engl J Med, doi:10.1056/NEJMoa2002032 (2020).
13 Wan, S. et al. (medRxiv, 2020). 14 Diao, B. et al. Reduction and Functional Exhaustion of T Cells in Patients with
Coronavirus Disease 2019 (COVID-19). medRxiv, 2020.2002.2018.20024364, doi:10.1101/2020.02.18.20024364 (2020).
15 Liu, Y. et al. 2019-novel coronavirus (2019-nCoV) infections trigger an exaggerated cytokine response aggravating lung injury. ChinaXiv (2020).
16 The Novel Coronavirus Pneumonia Emergency Response Epidemiology Team. The epidemiological characteristics of an outbreak of 2019 novel coronavirus diseases (COVID-19) in China. Chinese Journal of Epidemiology 41, 145-151 (2020).
Preprints (www.preprints.org) | NOT PEER-REVIEWED | Posted: 12 March 2020
9
17 WHO. Coronavirus disease (COVID-2019) situation reports, <https://www.who.int/docs/default-source/coronaviruse/situation-reports/20200305-sitrep-45-covid-19.pdf?sfvrsn=ed2ba78b_2> (2020).
18 WHO. SARS: Cumulative number of reported probable cases, <https://www.who.int/csr/sars/map-2003_04_29.gif> (2003).
19 Chai, X. et al. Specific ACE2 Expression in Cholangiocytes May Cause Liver Damage After 2019-nCoV Infection. bioRxiv, 2020.2002.2003.931766, doi:10.1101/2020.02.03.931766 (2020).
20 Karlberg, J., Chong, D. S. Y. & Lai, W. Y. Y. Do Men Have a Higher Case Fatality Rate of Severe Acute Respiratory Syndrome than Women Do? American Journal of Epidemiology 159, 229-231, doi:10.1093/aje/kwh056 (2004).
21 Fan, Z. et al. Hypertension and hypertensive left ventricular hypertrophy are associated with ACE2 genetic polymorphism. Life sciences 225, 39-45, doi:10.1016/j.lfs.2019.03.059 (2019).
22 Channappanavar, R. et al. Sex-Based Differences in Susceptibility to Severe Acute Respiratory Syndrome Coronavirus Infection. J Immunol 198, 4046-4053, doi:10.4049/jimmunol.1601896 (2017).
23 Horstman, A. M., Dillon, E. L., Urban, R. J. & Sheffield-Moore, M. The role of androgens and estrogens on healthy aging and longevity. J Gerontol A Biol Sci Med Sci 67, 1140-1152, doi:10.1093/gerona/gls068 (2012).
24 Kuba, K. et al. A crucial role of angiotensin converting enzyme 2 (ACE2) in SARS coronavirus-induced lung injury. Nature medicine 11, 875-879, doi:10.1038/nm1267 (2005).
25 Huang, F. et al. Angiotensin II plasma levels are linked to disease severity and predict fatal outcomes in H7N9-infected patients. Nat Commun 5, 3595, doi:10.1038/ncomms4595 (2014).
26 Yang, X. et al. Clinical course and outcomes of critically ill patients with SARS-CoV-2 pneumonia in Wuhan, China: a single-centered, retrospective, observational study. The Lancet Respiratory Medicine, doi:10.1016/S2213-2600(20)30079-5 (2020).
27 Yan, Y. et al. Angiotensin II receptor blocker as a novel therapy in acute lung injury induced by avian influenza A H5N1 virus infection in mouse. Science China Life Sciences 58, 208-211, doi:10.1007/s11427-015-4814-7 (2015).
Preprints (www.preprints.org) | NOT PEER-REVIEWED | Posted: 12 March 2020
10
Table 1. Top 38 most significant eQTLs in ACE2 TSS-10kb to TTS+10kb contributing to ACE2 expression
Pos SNP Ref Alt eqtl(pvalue,NES,tissue) EAS-EUR
EAS-AFR
AMR_AF AFR_AF EUR_AF SAS_AF EAS_AF
15599940 rs1978124 T C 9.5e-17,0.28,Nerve - Tibial 0.465 0.093 0.710 0.900 0.529 0.781 0.994
15607860 rs5934250 T G 1.5e-16,0.28,Nerve - Tibial 0.462 0.093 0.710 0.900 0.531 0.780 0.994
15599613 rs4646120 G A 2.9e-14,0.25,Nerve - Tibial 0.466 0.305 0.689 0.689 0.527 0.781 0.994
15581769 rs4646148 T TTTAA 2.5e-09,0.21,Nerve - Tibial 0.341 0.101 0.758 0.892 0.653 0.802 0.994
15594320 rs397686765 GA G 3.3e-09,0.2,Nerve - Tibial - - - - - - -
15596022 rs2023802 G A 4e-09,0.2,Nerve - Tibial 0.342 0.188 0.752 0.806 0.651 0.802 0.994
15598673 rs4646124 T C 4e-09,0.2,Nerve - Tibial 0.342 0.190 0.752 0.804 0.651 0.802 0.994
15578920 rs4646156 A T 4e-09,0.2,Nerve - Tibial 0.342 0.190 0.752 0.804 0.651 0.797 0.994
15596540 rs397822493 G GT 4.5e-09,0.21,Nerve - Tibial 0.341 0.077 0.765 0.916 0.653 0.802 0.994
15578020 rs4646158 C CATAAG 4.5e-09,0.21,Nerve - Tibial - - - - - - -
15597330 rs4646127 A G 7.5e-09,0.2,Nerve - Tibial 0.342 0.170 0.754 0.824 0.651 0.802 0.994
15597980 rs60097061 C CA 7.5e-09,0.2,Nerve - Tibial - - - - - - -
15590376 rs2048683 T G 8.5e-09,0.2,Nerve - Tibial 0.346 0.187 0.750 0.807 0.648 0.802 0.994
15582756 rs11394305 C CA 8.6e-09,0.2,Nerve - Tibial 0.337 0.096 0.75,0 0.889,0.002 0.6490,0 0.800,0 0.986,0.003
15582568 rs2316904 C T 8.6e-09,0.2,Nerve - Tibial 0.343 0.101 0.756 0.892 0.650 0.802 0.994
15582621 rs4646147 T A 8.6e-09,0.2,Nerve - Tibial 0.342 0.101 0.756 0.892 0.651 0.804 0.994
15583151 rs2316903 G T 8.6e-09,0.2,Nerve - Tibial 0.342 0.101 0.756 0.892 0.651 0.802 0.994
15589527 rs971249 T C 1e-08,0.2,Nerve - Tibial 0.346 0.187 0.748 0.807 0.648 0.802 0.994
15590829 rs757066 C T 1.2e-08,0.2,Nerve - Tibial 0.345 0.006 0.782 0.988 0.649 0.802 0.994
15586742 rs1514279 G A 1.3e-08,0.2,Nerve - Tibial 0.347 0.187 0.750 0.807 0.646 0.802 0.994
15579712 rs4646153 C T 1.6e-08,0.2,Nerve - Tibial 0.345 0.084 0.756 0.909 0.649 0.802 0.994
15579901 rs4646152 A G 1.6e-08,0.2,Nerve - Tibial 0.342 0.084 0.756 0.909 0.651 0.802 0.994
15582092 rs2048684 A C 1.6e-08,0.2,Nerve - Tibial 0.342 0.084 0.756 0.909 0.651 0.802 0.994
15590263 rs2158083 C T 1.9e-08,0.19,Nerve - Tibial 0.346 0.170 0.752 0.824 0.648 0.802 0.994
15599938 rs2106809 A G 6.4e-08,0.22,Nerve - Tibial 0.276 0.434 0.324 0.089 0.247 0.483 0.522
15584941 rs4646142 G C 5.5e-07,0.44,Brain - Nucleus accumbens 0.300 0.298 0.336 0.240 0.238 0.479 0.538
15592225 rs756737634 C CT 5.5e-07,0.44,Brain - Nucleus accumbens - - - - - - -
15557256 rs1132186 A C 1.6e-06,0.41,Brain - Substantia nigra 0.315 0.488 0.716 0.476 0.649 0.715 0.963
15558292 rs35482260 GT G 2.9e-06,0.33,Brain - Caudate -0.003 -0.023 0,0.720 0.023,0.473 0.003,0.647 0,0.714 0,0.959
15564843 rs233575 G A 3.1e-06,0.35,Brain - Caudate 0.332 0.008 0.786 0.988 0.665 0.816 0.996
15570148 rs4646174 C G 3.7e-06,0.41,Brain - Substantia nigra 0.315 0.510 0.721 0.454 0.649 0.715 0.963
15555645 rs2873356 A C 4.2e-06,0.41,Brain - Substantia nigra 0.343 0.303 0.748 0.693 0.653 0.801 0.996
15568325 rs1514280 A G 6.2e-06,0.33,Brain - Caudate 0.341 0.205 0.754 0.792 0.655 0.802 0.996
15565781 rs714205 C G 8.1e-06,0.42,Brain - Nucleus accumbens 0.330 0.435 0.303 0.101 0.205 0.471 0.535
15572684 rs879922 C G 1.1e-05,0.3,Brain - Caudate 0.317 0.510 0.720 0.454 0.646 0.715 0.963
15558483 rs4830542 C T 1.7e-05,0.3,Brain - Caudate 0.315 0.506 0.720 0.458 0.649 0.716 0.963
15568841 rs4240157 C T 1.7e-05,0.3,Brain - Caudate 0.322 0.507 0.720 0.457 0.641 0.715 0.963
* Yellow highlights the eQTLs with AF difference between EAS and EUR > 0.3, green between EAS and AFR > 0.3. * For each eQTL, only the most significant tissue is shown. A complete list of tissues and all significant eQTLs are shown in Supplementary Table 1.
Preprints (www.preprints.org) | NOT PEER-REVIEWED | Posted: 12 March 2020
11
Figure Legends Figure 1. ACE2 expression in different tissues in males, females of Asians, Africans and Caucasians with age. Panels a-d and e-h are tissues where Asian females show significantly and moderately (marginally significant) higher expression than other groups, respectively. n, sample numbers in each group; k, p and FDR are slope, p value and multiple testing corrected FDR of linear regression, respectively. The significance p values and FDR of the difference between Asians versus other ethnic groups are shown on top of the graphs. Figure 2. Transcription regulation of human ACE2 gene. a, Cis regulatory elements. eQTL to ACE2 gene expression in the ACE2 TSS-10kb to TTS+10kb region are visualized together with chromatin modification ChIP-seq signals, DNAse I sensitivity sites and TF and chromatin state regulators ChIP-seq targets from ENCODE and ESR1, ESR2 and AR motifs identified by the FIMO function from MEME package. b-c, The effect of estrogen (b), testosterone (c) on ACE2 expression in mouse thymus and kidney, respectively. Figure 3. ACE2 expression is negatively with virus infection pathways and suppressed by inflammation and T2D. a, KEGG pathway enrichment of ACE2 correlated and anti-correlated genes in each tissue were determined by GSEA (Methods). b, Dosage and time dependent SARS-CoV infection on ACE2 mRNA level. c-d, Suppression of ACE2 expression by IL2 and IL-7 treatment in mouse T cells. e, Reduction of ACE2 expression in T2D human pancreas ductal cells compared to age-matched controls as shown by scRNA-seq data. f, Fraction of ACE2+ cells among ductal cells and the average ACE2 expression per ACE2+ ductal cell in healthy and T2D individuals. ACE2+ cells are defined by normalized expression level >0.01. k and p, slope and p value of linear regression to age, respectively. The significance p values of the difference between healthy and T2D groups are shown on top of the graphs. g, ACE2 expression patterns projected on the t-SNE (t-distributed stochastic neighbor embedding) plot from type 2 diabetes and healthy pancreas single cell RNAseq data. h, Schematic illustrations of the negative correlation of high basal ACE2 level with CoVID-19 severity/fatality at the population level (top, solid lines indicate our findings, dotted lines are knowledge derived from literature), and its anti-correlation with virus infection pathway expression levels, upregulation by sex hormones and suppression by inflammatory cytokine at the molecular level (bottom). Supplementary Figure and Table Legends Supplementary Figure 1. ACE2 expression in different tissues in males, females of Asians, Africans and Caucasians with age. Shown here are the rest of the 27 samples excluding the ones in Fig. 1 that contain more than 20 samples. Supplementary Figure 2. ACE2 expression in human testis by scRNA-seq. a, t-SNE and clustering analysis of single-cell RNA-seq data from juvenile to adult human testis (n = 19,240). Each dot represents a single cell and is colored according to its cell type. b, Expression patterns of ACE2 projected onto the t-SNE plot from adolescent, adult and transgender males. Sertoli cells in adolescent males and transgender males, those who are in sexual hormone excitation, show both more
Preprints (www.preprints.org) | NOT PEER-REVIEWED | Posted: 12 March 2020
12
ACE2+ cells and higher ACE2 expression level in testis Sertoli cells compared to adults with similar age (age 24 and 25). Supplementary Figure 3. KEGG pathway enrichment of genes ranked by PCC in each tissue were determined by GSEA. Shown here are the rest of the 19 samples excluding the ones in Fig. 3a that contain more than 10 ACE2 positive (log2(TPM+1) ≥ 2) samples. Supplementary Figure 4. ENCODE ChIP-seq binding peaks of KARB-ZNFs at the ACE2 R3 region. Supplementary Figure 5. ACE2 expression in healthy and T2D individuals. a-b, Reduction of ACE2 expression in middle aged (45-65 years old) female adipose (a) and male muscle (b) tissues in T2D patients versus middle aged controls. c, t-SNE representation of 322 pancreas cells. Clusters are colored, distinctively labeled by cell type. d-e, KEGG term enrichment by the ACE2 positively (d) and negatively (e)
correlated genes (|PCC value| ≥0.01 and p<0.01), respectively, in ductal cells. The
most significant KEGG negatively associated with ACE2 expression is herpes virus infection. Supplementary Table 1. All eQTLs in ACE2 TSS-10kb to TTS+10kb associated with ACE2 expression (p<0.01). Supplementary Table 2. Genes that significant negatively co-express with ACE2 (PCC<-0.3) in at least 5 tissues. Supplementary Table 3. The expression correlations to ACE2 of KRAB-ZNFs that bind ACE2.
Preprints (www.preprints.org) | NOT PEER-REVIEWED | Posted: 12 March 2020
●
●
●
●
●
●
●
●
●●
●
●
●
●
●●
●
●●
●
●
●
●
●●
●
●
●
●
●
●
●
●
●
●●●●●
● ●
●●
●
●
●
●
●●
●
●
●
●
●
●●
●
●
●
●
●
●
●
●
●
●
●
●●
●
●
●
●
●●
●
●
●●
●
●
●
●
●
●
●
●
●
●
●●
●
●●
●
●
●
●
●
●
●
●●
●
●
●
●
●
●● ●
●
●
●
●
●
●
●
●
●
●
●
●
●
●
●
●
●
●
●
●
●
●
●
●
●●
●
●
●
●●
●
●● ●
●
●
●
●
●
●
●
●
●
●●
●
●
●
●
●
●
●
●
●
●
●
●
●
●
●
●
●
●
●●●
●
●
●
●
●
●
●●●
●●
●●
●
●●
●
●
●
●
●
●
●
●
●
●
●
●
●
●
●
●
●
●
●
●
●●●
●●
●
●●
●
●
●
●
●
●
●
●●
●
●
●
●
●
●
●
●
●
●
●●
●
●
●
● ●
●
●
●
●●
●
●●
●●
●●●
●
●●
●
●
●
●
●
●
●
●
●
●
●
●
●●
●
●
●
●
●
●
●
●
●
●
●
●●
●
●
●
●
●●
●
●
●
●
●
●●
●
●
●
●●
●
●
●
●
●
●●
●
●
●
●
●
●
●
●
●
●
●
●
●
●
●
●
●
●
●●●
●
●
●
●
●
●
●●
●●
●
●
●●●
●
●
●
●
●
●
●
●●
●●
●
●
●
●
●
●
●●
●
●
●
●
●
●
●
●●
●
●
●
●
●
●
nAf = 55 nAs = 9 nCa = 322kAf = -0.027 kAs = 0.03 kCa = 0.0027
pAf = 0.12 pAs = 0.54 pCa = 0.67FDR = 0.61 FDR = 0.91 FDR = 0.94
●
●
●●
●●
●
●
●
●●
●
●● ●
●
●
●
●
●
●
●
●
●
●
●
●●
●
●●
●
●
●
●
●
●
●
●
●●
●
●●
●
●
●
●
●
●
●●●
●
●
●
●●
●
●
●
●
●
●
●
●
●
●
●
●
●
●
●●
●
●●
●
●
●
●
●
●
●
●
●●
● ●
●
●●
●● ●
●
●
●
●
●
●
●
●
●
●
●
●
●
●●
●
●
●
●
●
●
●
●●
●
●
●
●
●
●
●
●
●
●
●
●
●
●
●
●
●
●
●●
●●
●
●
●
●
●
●
●
●
●●
●
●
●
●
● ●
●
●
●
●
●
●
●
●
●
● ● ●
●
●
●●
●
●
●
●
● ●
●
●
●●
●
●
●
●
●
●
●
●
●
●
●●
●
●
●●
●
●
●
●
●
●
●●
●
●
●
●
●
●●
●
●
●
●●
●
●
●
●
●●
●
●
●
●●●
●●
●
●
●
●
●
●
●●
●
●
●
●●
●
●
●
●
●●
●
●●
● ●
●
●
●
●
●●
●
●
●
●
●
●
●●
●
●
●
●
●●
●●
●
●
●●
●
●
●●
●
●
●
●
●
●
●
●
●●
●
●
●
●
●
●
●●
●
●
●●
●●
●●
●
●
●
●●
●
●
●
●
●
●
●
●●
●
● ●
●
●
●
●
●
●
●
●
●●
●
●●
●
●
●
●●
●
●
●
●
●
●
●
●
●
●
●
●
●
●
●
●
●
●
●
●
●
●
●
●●●
●
●
●
●●
●
● ●●
●
●●
●
●
●
●
●
●
●●
●
●
●
●
●
●
●
●●
●
●
●
●
● ●
●
●
●
●
●
●
●
●
●
●
●
●
●
●
●
●
●
●
●
●
●
●
●
●●
●
●
●
●
● ●●
●
●●
●●
●
●●
●
●
●
●
●
●
●
●
●
●
●
●
●
●
●●
●
●●
●
●
●
●
●
●
●
● ●
●
●
●
●●
●
●
●
●
●
● ●
●●
●
●
●
●
●
●
●●
●
●
●
●
●
●●
●
●
●
●
●
●
●
●
●
●
●●
●
●
●
●
●
●
●
●
●
●
●
●●
●●
●
●
●●
●
●●
●
●
●●
●●●
●
●
●
●●
●
●
●●
●
●
●
●
●
●
●
●
●
●
●
●
●
●
●
●
●
●
●
●
●
●
●
●●
●
●
●
●
●
●
●
●
●
●
●
●
●
●
●
●
●
●
●
●
●●
●
●
●
●●
●
●
●
●
●
● ●
●
●
●
●
●●
●
●
●●
●●
●
●
●
●
●
●
●
●
●
●
●
●
●
● ●
●
● ●
●
●
●
●
●
●
●●
●
●
●
●
●●
● ●
●
●
●
●
●
●
●
●
●
●
●
●
●
●
●
●
●
●
●
●
●
●●
●
●●
●
●
●
●●
●
●
●
●
●
●
●
●
●
●
●
●
● ●
●
●
●●
●
● ●●
●
● ●
●
●
●
●●
●
●
●
●●
●
●
●
●●
●
●
●●
●
●
●
●
●
●
●●
●
●
●●
●
●
●
●
●
●
●
●
●
●
●
●
●●
●
●
●
●
●
●
●●
●
●
●
●
●
●
●●
●
●
●
●
●
●●
●
●
●
●●
●
●
●
●
●●
●
●
●
●
●
nAf = 94 nAs = 12 nCa = 695kAf = -0.015 kAs = 0.044 kCa = -0.016
pAf = 0.25 pAs = 0.59 pCa = 3e−4FDR = 0.73 FDR = 0.92 FDR = 0.01
Female Male
20 30 40 50 60 70 20 30 40 50 60 70
0.0
2.5
5.0
7.5
Age
Log2
(TP
M+1
)
t−test p of F = 0.00202; p of M = 0.947; p of all = 0.205FDR of F = 0.0696; FDR of M = 0.995; FDR of all = 0.504
Adipose Tissue
●●
● ●●●● ●
●●
●
●
●●
●● ● ●●●●●
●
●●● ●●
●
●●
●● ●
● ●● ● ●●
●
● ●● ●● ●●
●
●●
●
●● ●
●●●
●
●
●
●
●● ● ●● ●
●●●
●●
●●● ● ●●● ●●●● ●●
●●● ●●
●●●●● ●
● ●●●
nAf = 11 nAs = 3 nCa = 87kAf = 0.021 kAs = -0.013 kCa = -1.4e-4
pAf = 0.0079 pAs = 0.63 pCa = 0.96FDR = 0.12 FDR = 0.93 FDR = 0.99
●●● ●
●●
● ●● ●
●●
●
●●
●●●● ●
●
●●●
● ●●●●● ●
●
●●● ●
●●
●
●●●●
●
●● ●
●
●
●
●● ●
●
● ●●
●
●
●● ●●
●
● ●●● ●
●● ●● ●●
●●
●●● ●●
●
●
● ●●● ●
●
● ●●●
●
●●●●
●●●
●● ●
●● ●● ●● ●
●●●
●
● ●●●
●●
● ●●●
●
●
●● ●●
● ● ●●●
●● ●● ●●
●●
●●
●
●● ●● ●●
nAf = 17 nAs = 3 nCa = 134kAf = 0.004 kAs = -0.018 kCa = 0.0058
pAf = 0.7 pAs = 0.86 pCa = 0.027FDR = 0.94 FDR = 0.96 FDR = 0.24
Female Male
20 30 40 50 60 70 20 30 40 50 60 70
−5.0
−2.5
0.0
2.5
5.0
7.5
Age
Log2
(TP
M+1
)
t−test p of F = 0.0227; p of M = 0.257; p of all = 0.011FDR of F = 0.174; FDR of M = 0.551; FDR of all = 0.0945
Adrenal Gland
●
●
●
●●
●
●
●
●
●
●
●
●
●
●
●●
●
●
●
●
●●
●
●
●
●
●
●●●
●
●
●
●●
●
●
●
●
●
●
●●
●
●
●
●
●
●
●
●
●
●
●●●●
●
●
●
●
●
●
●
●
●
●
●
●
●●●
●
●
●
●
●
●
●
●
●
●
●
●
●●
●●
●
●
●
●●
●
●●
●
●● ●
●
●
●
●
●
●
●●
●
●●
●
●
●
●
●
●
●
●
●●
●
●
●
●●
●
●
●
● ●
●
●
●●
●●
●
●●
●
●●●
●●
●
●
●●
●
●
●
●
●
●●
●
●
●
●
●●
●●●
●
●
●●
●
●●
●
●
●
●
●
●
●
●
●
●
●
●
●
●●
●
●
●
●
●
●
●
●
●●
●
●
●●
●
●●
●●●
●
●
●●
●
●
●
●
● ●●
●
●
●●
●
●
●●
●
●●
●● ●
●●
●
●●
●
●
●●
●
●●
●
●
●
●
●●●
●
●
●
●●
●
●●
●●
●
●
●●
●●
●
●
●
●
●
●●
●
●●
●
●
●
●
●●
●
●
●
●
●
●
●
●
●
●
●
●
●●●
●
●
●
●
●
●
●
●
●●
●●
●
●
●
●
●
●
●
●
●
●
●
●
●
●
●
●
●
●
●
●
●
●
●
●
●
●
●
●
●
●
●
●
●
●●
●●
●
●
●
●
●
●
●
●
●
●
●
●
●
●
●
●
●
●
●
●
●
●●●
●
●●
●
●
●
●
●●
●
●
●
●
● ●
●●
●
●
●
●
●
●
●
●
●
●
●
●
●
●
●
●
●
●
●
●●
●
●●
●●
●●
●
●●
●
●
●
●
●
● ●●
●●
●
●
●●
●
●●
●
●
●
●●
●
●
●
●
●
●●
●●
●
●
●
●●
●
●
●
●●
●
●
●●
●●
●
●●
●●
●
●
●
●
●
●
●●●
●●●●
●
●●
●
●
●
nAf = 58 nAs = 10 nCa = 424kAf = 0.0011 kAs = -0.049 kCa = 0.0032pAf = 0.9 pAs = 0.22 pCa = 0.22FDR = 0.97 FDR = 0.7 FDR = 0.7
●
●
●
●
●
●
●
●
●
●
●
●
●
●
●
●
●
●● ●
●
●
●
●
●●
●
●
●
●
●●
●●
●
●
●
●
●
●
●
●
●
●
●
●
●
●
●
●
●
●
●
●
●●
● ●
●
●
●
●
●
●●
●●
●●
●
●
●
●
●
●
●
●
●
●
●
●
●
●
●
●●
●
●
●
●
●
●
●
●●
●●
●
●
●●
●
●
●●●
●●●●●
●
●
●
●
●●
●
●
●
●
●
●●
●●●
●
●
●
●
●●
●
●
●
●
●
●●
●
●
●
●
●
●
●
●●●●
●
●
● ●
●
●
●
●
●●
●
●
●
●
●
●
●
●●
●
●
●
●
●●
●
●
●
●●
●
●
●
●●
●
●
●
●
●
●
●
●● ●
●●
●
●●
●
●
●
●●●
●
●
●
●
●
●
●
●●
●
●●
●●
●
●
●
●●●
●● ●
●
●
●
●
●
●
●
●
●●
●
●
●
●●
●
●
●
●
●
●
●
●
●
●
●●
●
●
●●
●
●
●
●●
●
●
●
●
●
●
●●
●●
●
●
●●
●
●
●
●●
●●
●
●
●
●
●
●●●●
●
●
●
●
●
●
●
●
●
●
●
●
●
●
●
●
●
●
●
●
●●
●
●
●●●
●
●●
●
●
●
●
●
●
●●
●●
●●
●
●
●
●●
●
●
●
●
●
●
●●
●
●
●
●●
●
●●
●
●
●
●
●
●●
●
●●
●●
●
●
●
●
●
●●
●
●
●
●
●
●
●
●●●●
●
●
●
● ●
●
●
●
●
●
●●
●
●
●
●
●●
●
●
●●●
●
●
●●
●
●●
●●
●●
●●
●●●
●
●
●
●
●
●
●
●
●
●
●
●
●
●●
●
●
●
●
●
●
●
●●●
●
●●
●
●
●
●
●
●● ●●●
●
●
●
●
●
●
●●
●●
●
●●
●
●
●
●●
●
●
●
●●
●
●
●
●
●●●●
●●
●●
●
●
●
●
●
●
●
●
●●
●
●
●
●
●
●
●
●
●
●
●
●
●
●
●●●
●
●
●
●
●
●
●
●●
●●
●
●
●
●●
●
●●
●
●
●
●
●
●●
●
●●
●●
●
●●
●
●
●
●
●
●
● ●
●●
●
● ●
●
●●
●
●
●
●
●●
● ●
●
●
●
●
●
●
●
●
●
●●
●
●
●
●
●
●●
●
●
●
●●
●●
●
●
●
●
●
●
●●●●
●
●
●
●
●●●
●
●
●
●●
●●
●
●
●
●
●
●
●
●●
● ●●
●
●
●●
●
●
●
●
●
●
●
●
●
●
●
●
●
●
●●
●
●
●
●●
●●
●●
●
●●
●●
●
●
●
●
●●
●●
●
●
●
●
●●
●
●●
●
●
●
●●
●
●● ●●
●
●
●●
●
●●
●
●
●
●
●
●
●
●●●
●
●
●
●
●●
●
●
●
●
●
●
●
●
●
●
●
●
●
●
●
●
●
●
●
●●
●
●
●●
●
●●
●
●
●●
●
●
●
●
●
●
●
●
●
● ●
●
●
●●●
●
●
●
●
●
●
●
●
●
●●
●
●●
●
●
●
●
●
●
●
●
●
●
●
●
●
●
●●
●
●
●●
●
●
●
●
●
●
●
●
●
●●
●
●
●
●
●
●
●
●
●●
●
●●
●
●● ●
●
●
●
●
●
●●●●
●
●
●
●
● ●
●
●
●
●
●
●
●
●
●
●
●
●
●
●●
●●
●●
●
●
●
●
●
●
●
●
●
●
●
●
●
●
●
●
●●●
●
●
●●
●
●
●
●
●
●●
●●
●
●
●
●
●
●
●●
●
●
●●
●●●●
●
●
●
●
●
●
●
●
nAf = 120 nAs = 13 nCa = 798kAf = 0.0045 kAs = 0.0053 kCa = -6.3e-4pAf = 0.46 pAs = 0.77 pCa = 0.76FDR = 0.91 FDR = 0.95 FDR = 0.95
Female Male
20 30 40 50 60 70 20 30 40 50 60 700
2
4
Age
Log2
(TP
M+1
)
t−test p of F = 0.0467; p of M = 0.448; p of all = 0.0481FDR of F = 0.302; FDR of M = 0.703; FDR of all = 0.302
Esophagus
●
●● ●
●●
●
●●
●
●
●
●
●
●●
●
●
●
●●
●
●●
●
●
●
●
●
●
●●
●
●
●●
●
●
●
●
●
●
●
●
●●
●
●
●●
●
●●
●
●
●
●
●
●
●
●
●●
●
●●
●●
●
●
●
●
●
●
●
●
●
●
●●
●
●
●
●
●
●
●●
●
●
●●
●
●
●
●
●
●
●●
●
●
●
●
●
●●●
●●
●
●
●
●
●
●
●
●
●●
●
●
●
●
●
●
●●●
●
●
●●
●●
●
●●
●
●
●
●
●
●
●●
●
●
●●
●●●
●
●
●
●●
●
●
●
●
●
●
●
●
●
●
●
●
●
●
●●●
●
●●
●
●
●
●●
●●●
●
●
●
●
●
●
●
●
●
●
●●
●
●
●
●
●
●
●●
●
●●
●
●
●
●
●
●
●
●
●
●
●●
●
●
●
●
●
●
●
●
●●
●
●
●
●
●
●
● ●●
●
●●
●●
●
●
●●●
●
●
●
●
●
●
●
●
●
●
●
●●●
●
●
●
●●
●
●●
●
●
nAf = 42 nAs = 7 nCa = 225kAf = -0.0068 kAs = -0.005 kCa = -0.0081pAf = 0.54 pAs = 0.94 pCa = 0.13FDR = 0.91 FDR = 0.99 FDR = 0.63
●
● ●
●
●
●●
●
●
●
●●
●
●●
●
●
●●●
●
●
●
●●
●
●
●
●
● ●
●
●
●
●●
●●●●
●
●
●
●
●
●●
●
●
●
●
●
●
●
●
●●
●
●●●
●
●
●●
●
●
●
●●
●
●●●
●
●
●
●●
●
●●
●
●●●
●●●
●
●
●
●
●●
●● ●●●
●●
●
●
●
●
●
●
●●
●
● ●
●
●
●●
●
●●
●●
●
●●
●
●
●
●
●
●
●
●
●
●
●
●
●
●
●
●
●
●
●
●●
●●
●
● ●●
●
●●
●
●
●
●
●●
●
●●
●
●
●
●●
●
●●
●
●
●
●
●
●
●
●
●
●●
●
●
●
● ●●
●
●
●●
●●
●
●
●
●●●
●
●
●
●●
● ●
●
●
●
●
●
●
●
●
●●
● ●●
●
●●
●
●
●
●
●
●
●
●●
●
●
●
●
●●
●
●
●
●●
●
●●
●
●
●● ●
●●
●
●●
●● ●
●
●●
●●
●
●
●
●
●
●
●●
●
●
●
●
●
●
●
●
●●
●
●
●●
●●
●●
●
●
●●
●●
●
●
●
● ●●
●
●
●
●●
●
●
●
●●
●
●
●●
●●
●●
●
●
●
●
●
●
●
●
●
●
●
●
●
●
●
●●
●
●●●
●
●
●
●●
●
●● ●
●
●●
●
●
●
●
●
●
●
●●
●
●
●
●●
● ●●
●
●
●
●
●
●●
●
●
●●
●
●
●
●
●
●
●●
●
●
●
● ●
●
●
●
●
●●
●●
●
●
●●
●
●●● ●
●
●
● ●
●
●
●
●●
●
●
●
●
●●
●
●
●
●●
● ●●
●
●
●●
●●
●
●
●
●●
●
●
●
● ●
●
●
●
●
●
●
●
●
●
●
●
●
●
●●
●
●
●●
●●
●
●
●
●
●
●●
●
●
●
●●●
●●
● ●
●
●
●
●●●
●
●
●
●●
●
●●
●
●
●
●
●●
●
●
●
●
●●
●●
●
●
●
●
●
●
●
●
●●
●
●
●
●
●
●
●
●
●● ●
●
●
●
●
●
●
●
●●
●
●
●●
●
●
●●
●
●●
●●●
●
●●●
●
●
●
●
●
●
●
●
●
●●●
●
●
●●
nAf = 64 nAs = 5 nCa = 512kAf = -0.02 kAs = 0.019 kCa = -0.0024pAf = 0.18 pAs = 0.76 pCa = 0.52FDR = 0.68 FDR = 0.95 FDR = 0.91
Female Male
20 30 40 50 60 70 20 30 40 50 60 700
2
4
6
8
Age
Log2
(TP
M+1
)
t−test p of F = 0.00936; p of M = 0.218; p of all = 0.0056FDR of F = 0.0945; FDR of M = 0.504; FDR of all = 0.0926
Heart
●●
●
●
●
●
●
●
●
●
●
● ●●
●
●
●
●
●
●
●
●
●
●
●
●
●
●● ●
●●
●
●
●
●●●
●
●
●
●
●
●
●
●
●
●
●
●
●●
●
●
●
●
●
●
●●
●
●●
●
●
●
●
●●●
● ●●
●
●●
●●
●
●
●
●
●
●●
●
●●●
●
●
●
●
●
●
●● ●
●
●●
●
●
●
●
●
●
● ●●
●●
●
●●
●
●●
●
●
●
●● ●
●
●
●
●
●
●
●
●
●
●
●
●
●● ●
●
● ●●
●
●
●
●
●●
●
●
●
●
●
●
●
●
●
●
●
●
●●
●●
● ●
●
●●
●
●
●●
●●
●
●
●
●
●
●
nAf = 24 nAs = 4 nCa = 154kAf = 0.0095 kAs =-0.0026kCa = 0.0037
pAf = 0.51 pAs = 0.97 pCa = 0.4FDR = 0.91 FDR = 1 FDR = 0.91
● ●
●
●
●
●
●●
●●
●
●●
●
● ●
●
●
●
●
●
●●
●
●
●
●
●
●
●●
●
●
●●
●
●●
●
●
●
●
●
●●
●
●
●
●●
●
●
●
●●
●
●
●●
●
●
●
●
●
●●
●●
●
●●●●
●●
●
●
●
●
●
●●
●●
●
●●●
●
●
●
●
●●
●
●● ●
●
●
●●
●
●●
●
●
●●
●
●
●
●
●
●
●
●
●
●●
●
●
●
●
●
●
●
●●
●
●
●
● ●●
● ● ●●
●
●●
●
●
●
●
●
●
●
●
●
●
●●
● ●
●●
●
●
●
●
●
●
●
●●●
●
●● ●
●
●
●
●
●
●
●
●
●
● ●
●
●●
●
●
●
●
●
●
●
●
● ●
●
●●
●
●●
●
●
●
●● ● ●
●●
●
●
●
●
●
●
●
●●
●●
●
●
●
●
●
●
●●
●
●
●●
●
●
●
●
●
●
●
●
●
●
●
●
●
●
●
●●
●
●
●●
●●
●
●
●
●●
●
●
●●
●
● ●
●●●
●
●
●
●
●
●●
●
●
●
●●
●●
●●
●
●●●
●● ●
●
●
●●
●
●●
●
●●
●
●
●
● ●
●
●
●
●●
●
● ●
●●
●
●
●
●
●●
●
●●
● ●
●●
●
●●
●●
●
●
●
●
●
●
●
●●
●
●●
●
●
●
●
●●
●
●
●
●
●
●
●
●
●
●
●
● ●
●
●
●● ●
●
●
●
●●
●●●
●
●
●●
●
●
● ●●
nAf = 46 nAs = 6 nCa = 339kAf = -0.0065 kAs = 0.012 kCa = -7.2e-4
pAf = 0.42 pAs = 0.79 pCa = 0.82FDR = 0.91 FDR = 0.95 FDR = 0.95
Female Male
20 30 40 50 60 70 20 30 40 50 60 70−1
0
1
2
3
4
Age
Log2
(TP
M+1
)
t−test p of F = 0.201; p of M = 0.784; p of all = 0.354FDR of F = 0.504; FDR of M = 0.917; FDR of all = 0.601
Lung
●
●
●
●● ●●
●
●
●●
●
●●●●●
●
●
●●● ●●
●●
●
●
●●
●
●●
●●●
●
●●
●
● ●●●
●
●●● ●●●●
●
●●●
●
●
●
●
●●●
●
●●●●
●
●●● ●●
●●
●●●
●
●
●
●
●●
●
●
●
●●
●
●
●
●
●
●
●●
●
●
●
●
●
●
● ●●
●
● ●
●
●
●●
●
●●●●●
●
●●●
●
● ●●●●●●● ●
●●
●
●
●
●
●
●
● ●
●
●●
●
●
●●
● ●●
● ●
●
●●●
●
●●
●
●●●● ●●
●●
●
●
●● ●●
●
●
●●
●●
●
●
●●●
●●●●● ●●
●● ●
●
●
●●●
●
●●● ●
●
●●●●
●
●
●●●●
●
●
●●
●
●●
●
●
●●●
●
●
●
●
●
●
●
●●
●●
●
●●●
●●
●
●
●
●●
●● ●
●
●●●
●
●
●
●
●
●●●
●●
●
●
● ●● ●
●
●●●●
●
●
●
●●
●
●●●
●●
● ●
●
●
●
●●
●
●●●
●●●
●● ●
●
●
●
●
●●●●●
●
●
● ●●●
●
●● ●
●●●● ●
●●
●●
●
●●● ●
●
● ●● ●●●●
●
●
●●●
● ●
●
●
● ●●
●
●●●
●
●
●●
●
●
●
●●●
●
●
●●● ●●●
●●● ●●
●
●
● ●●
●
●●
●●●●●
●
● ●●●
●
●
●●
●
●●
●● ●●●●●
●
●●
●●●
●
●
●
●
●
●●
●
●
●
●●
●
●
●
●
●
●●
●
●
●
● ●
●●
●
nAf = 61 nAs = 13 nCa = 381kAf = -0.01 kAs = -0.012 kCa = 0.0014pAf = 0.31 pAs = 0.8 pCa = 0.71
FDR = 0.76 FDR = 0.95 FDR = 0.94●
●● ●
●●●
●
●●●
●●●
●
●● ●● ●●●
●
● ●●●● ● ●
●
●●
●
●●● ●●●●
●
●●
●
●● ●●●
●
●●●●
●
●●
●
●●
●
● ●●●
●
●●
●●
● ●
●
●●
●●
●
●●●
●
● ●●
●
●●● ●●●●
●
● ●●
●
●●
●
● ●●
●
●●
●●●
●
●
●● ●● ●
●●
●
●●●
●
●●
●● ● ●●●●
●
●
●
●●●
●
●
●
●●●
● ●●
●● ●
● ●
●
●●
●
●●●●
● ●
●
●●●
●●
●
●●
●
●● ●●● ●
●
●
●
●●
●
●
●● ●
●
●●●
●
●
●
●●
● ●● ●●
●
●
● ●●●
●
●
● ●
●
●
●●
●
●
●●
●
●● ●
●
●
●●
●
●
●
●●●● ●● ●
●●
●
●
●
●
●● ●●
●
●●●
●●●● ●
●●●
●●●
●
●●
●
●●
●
●●●
● ●●●●
●
●
●●
●
●●
●
●
●
●
●
●
●●●●
●
●●
● ●●●●●●
●
●●●
●
●
●●● ● ●
●●
●
●●●●
●
●● ●
●
● ●●●
●
●
●●
●●
● ●
●●
●
●●
●
●●●●
●●
●
●
●
●
●●
●●
●●
●
●
●●●●●
●
●
●
●
●●●● ●●●●●
●●● ●●●
●
●
●●
●
●
●●
●
●
●
●●
●
● ●●●●●
●●
●
●
●●
●
●
●
●●
●●
●●●
● ●
●
●●●
●●●●
●●●●
●●● ●
●
●●●
●
●●● ●
●●
●●●
●●● ●
●
●
●●● ●●●● ●●
●
●
●
●
●
●●
●●
● ●●
●
●●●
●
●
●●
●
●●
●
●● ●●●●
●
●
●●
●●●
●
● ●●●
●
●●
●
●●
●
●● ●
●
●●
●
●
●●
●
●
●●
●●
●
●
●
●
●●●●
●
●
●
●
●
●●
●
●●●●
● ●
●
●
●●●●
●
● ● ●●
●
●●
●
●
●
●
●
●
●●●
●●
●
●
●
●
●
●
●●
●
●
●●
●●●
●
●●
●
●
●●
●
●●
●● ●
●●●
●
●
●●
●
●
●●●●
●
●
●
●
●●
●
●●●●
●
●
● ●
●
●
●●
●
●
●
●
●
●
●
●
●
●
●●●●
●
●
●● ●
●●
●●●
●
●
● ●●●
●●
●
●●●
●
●●●● ●
●● ●● ●
●
●●
●●
●
●●
●●●
●
●
●
●
●●
●●●
●
●
●●●
●
●●● ●
● ●●
●●
●● ●
●
●
●
●
●
●
●
●
●
●
●
●
●●●●
●● ●
●●
●●
●●
●●
●
●●●
●●
●● ●
●●●
●
●
●
●
●
●
●
●
●
●
●
●●
●
●
●
●
●●●
●
●
●●●
●●
●
●●
●
●
●
●
●●
●●
●
● ●●
●
●
●
● ●
●
● ●
●
●
●●
●
●●
●
●●
●●
●
●
●
●
●●●
●
●
●
●●
● ●●
●
●
●●
●
●
●●●
●
●
●●
●
●●●●
●
nAf = 111 nAs = 13 nCa = 741kAf = -0.0067 kAs = 0.034 kCa = -6.7e-4pAf = 0.25 pAs = 0.22 pCa = 0.79
FDR = 0.73 FDR = 0.7 FDR = 0.95
Female Male
20 30 40 50 60 70 20 30 40 50 60 70
0.0
2.5
5.0
Age
Log2
(TP
M+1
)
t−test p of F = 0.126; p of M = 0.525; p of all = 0.102FDR of F = 0.484; FDR of M = 0.766; FDR of all = 0.43
Blood Vessel
●
●
●
●
●
●●
●
●
●
●●
●
● ●
●
●
●
● ●●
●
●
●
●●
● ●
●
●
●
●● ●
●●
●●
●●
●
●
●
●●
●●
●
●
●●●●
●
●●
●●●●●
●
●●
● ●
●
●●
●
●
●
●
●● ●●
●●
●●
●
●
●
● ●●
●
●
●●
●
●
● ●
●
●
●
●
●
●
●
●
● ●●
●
●
●
●
●●
●
●●
●
●●
●
●
●
●● ●
●
●
●
●
●
●●
●●●
●
● ●●●
●
●●
●
●●● ●
●
●
●
●
●
●
●
● ●
●
●● ●●
●
●●
●
● ●
●●
● ●● ●
●●
● ●
●●
●
●
●●●● ● ● ●
●●
●● ●
●
●
●
● ●
●●
●
●
●●
●●
●
●
●
●●
●●
●●
●
●● ●
● ●
●●●
●
●
● ●
●
●●●●
●●
●●● ●
●
●●●
●●
●
●●●
●
●
●
●●
●●
●
●
●
nAf = 35 nAs = 5 nCa = 219kAf = 0.0032 kAs = -0.048 kCa = 0.0037
pAf = 0.61 pAs = 0.55 pCa = 0.14FDR = 0.92 FDR = 0.91 FDR = 0.64
●
● ●
●
●●
●
●● ●●
●
● ●
●
●●
●
●
●● ●
● ●● ●
●
● ●●
●● ●●●
●● ●●●
●
●●
●
● ●●●
●● ●●
●
●●
●
●
● ●
●
●
●
● ●
●●
●●●●
● ●●
●
●
●●
●
●
●
●
●
● ●
●
● ●●
●
●
●●
●
●
● ● ●●● ●
●
●●●
● ●● ●●
● ●
●
●
●●
●●
●●
●
●
●
●●
●
●
●
●
●
● ● ●●
●
●●● ●
●●
●●●
●
●
●
●
●●
● ●
●
●
●
●
●
● ●●● ●
●
●
●
●
●
●
●
●
● ●●
●
●
●
●●
● ●
●
● ●
●
●
●●
●
●
●● ●●
●●
●●
●
●
●
●
●
●
●●
●
●● ●
●
●●
●
●
●
● ●●●
●
●●
●●
●
●
●
●
●
●
●
●
●
●●
●
●
●●
●
●● ●●
●
●●●
●●
●
●
●
●
●
● ●●
●●●
●
●● ●●
●
●
●
●
●
●●
●
●●
●
●
●
●●
●
● ●
●
●●
●
●
●
●
●●
●
●● ●●●●
● ●
●
●
●
●● ●●
●●●
● ●● ●
●
●
●
●
●
●
●●●●
● ●●
●
●
●
●
●
●
●●●●
●●●●
●
●
●●
●
●
●
●●
●●
●
●
●●
●
●
●
●
●●
●
● ●
●
●
●
●
●
●
●
●●
●
●
●
●
●●●●
●● ●● ●
●
●●●
●
●●●
●●
●
●● ●
●●
●
●
●
●
●●
●
●●
●
●
●
●●
●
●
●
●
●
●●
●
●
● ●
●
●●
●●
●
●●
●●
●
●
● ●
●
●
● ●●
●
●
●
●
●
●
●
● ●● ●
●●
●
●
●●●●
●●
●
●
●
●
●
●
●
●
●●●
● ●
●
●
●
●
●
●
●●●
●
●
●
●●
●●
● ●
●●
●●
●
●●
● ● ●●●
●
●●
●
●●
●
●
●
●
●
●
● ●
●
●●
●
●●●
●●
●
nAf = 67 nAs = 7 nCa = 462kAf = 0.0026 kAs = 0.013 kCa = -0.0031
pAf = 0.61 pAs = 0.6 pCa = 0.17FDR = 0.92 FDR = 0.92 FDR = 0.68
Female Male
20 30 40 50 60 70 20 30 40 50 60 70
0
2
4
Age
Log2
(TP
M+1
)
t−test p of F = 0.106; p of M = 0.544; p of all = 0.0775FDR of F = 0.43; FDR of M = 0.766; FDR of all = 0.382
Muscle
●● ●●
●● ●
●
●●● ● ●●●
●
●
●
●
●●
●
●
●
●
●
● ●
●
●
● ●
●●
●●
●
●
●
● ●
●
●●●
●
●
●
●●
●
●
●●●
●
●●
●
●
●
●●
●
●●● ●
●●
●
●
●
●● ●
●
● ●
●
●
●
●
●●
● ●● ●
●
●
●
●
● ●
●
●●
●●
●
●
●●
●
●●
●●● ●
●
●
●●
●●
●
●●
●●
●
●● ●●
●
●
●●
●
●●●
●
●
● ●●
●
●●
● ●
●●
● ●
●
●
● ●● ●
●●
●
●
●
●
●●
●●
●●●
●●
●
●●
●
●●●
●●
nAf = 27 nAs = 5 nCa = 147kAf = 0.0067 kAs = -0.07 kCa = 0.012
pAf = 0.55 pAs = 0.7 pCa = 0.081FDR = 0.91 FDR = 0.94 FDR = 0.55
Female
20 30 40 50 60 70
0
4
8
Age
Log2
(TP
M+1
)
t−test p = 0.173FDR = 0.504
Ovary
a b
c d
e f
g h
Figure 1
Ethnic group●
●
●
AfricanAsianCaucasian
Preprints (www.preprints.org) | NOT PEER-REVIEWED | Posted: 12 March 2020
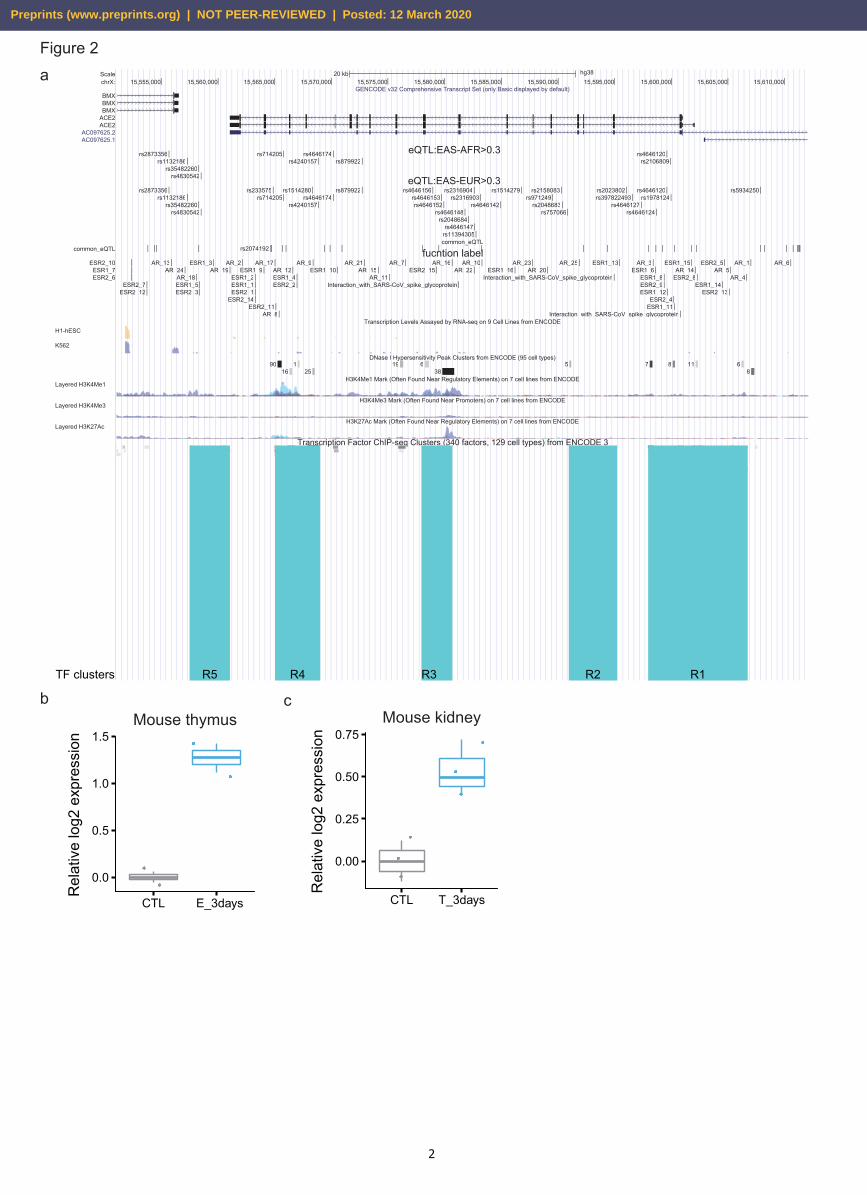
Mouse kidney
●
●
●
●
●
●
0.00
0.25
0.50
0.75
CTL T_3days
Rel
ativ
e lo
g2 e
xpre
ssio
n
ScalechrX:
common_eQTL
20 kb hg3815,555,000 15,560,000 15,565,000 15,570,000 15,575,000 15,580,000 15,585,000 15,590,000 15,595,000 15,600,000 15,605,000 15,610,000
GENCODE v32 Comprehensive Transcript Set (only Basic displayed by default)
eQTL:EAS-AFR>0.3
eQTL:EAS-EUR>0.3
common_eQTL
fucntion label
Transcription Levels Assayed by RNA-seq on 9 Cell Lines from ENCODE
DNase I Hypersensitivity Peak Clusters from ENCODE (95 cell types)
H3K4Me1 Mark (Often Found Near Regulatory Elements) on 7 cell lines from ENCODE
H3K4Me3 Mark (Often Found Near Promoters) on 7 cell lines from ENCODE
H3K27Ac Mark (Often Found Near Regulatory Elements) on 7 cell lines from ENCODE
Transcription Factor ChIP-seq Clusters (340 factors, 129 cell types) from ENCODE 3
BMXBMXBMX
ACE2ACE2
AC097625.2AC097625.1
rs2873356rs1132186
rs35482260rs4830542
rs714205rs4240157
rs4646174rs879922
rs4646120rs2106809
rs2873356rs1132186
rs35482260rs4830542
rs233575rs714205
rs1514280
rs4240157rs4646174
rs879922 rs4646156rs4646153rs4646152
rs4646148rs2048684
rs2316904
rs4646147rs11394305
rs2316903rs4646142
rs1514279rs971249
rs2158083
rs2048683rs757066
rs2023802rs397822493
rs4646127rs4646124
rs4646120rs1978124
rs5934250
ESR2_10ESR1_7ESR2_6
ESR2_7ESR2_12
AR_13AR_24
AR_18ESR1_5ESR2_3
ESR1_3AR_19
AR_2
ESR1_2ESR1_1ESR2_1
ESR2_14
ESR1_9AR_17
ESR2_11AR_8
AR_12ESR1_4ESR2_2
AR_9ESR1_10
AR_21AR_15
AR_11
AR_7ESR2_15
AR_16
Interaction_with_SARS-CoV_spike_glycoprotein
AR_22AR_10
ESR1_16AR_23
AR_20AR_25
Interaction_with_SARS-CoV_spike_glycoprotein
ESR1_13 AR_3ESR1_6
ESR1_8ESR2_9ESR1_12
ESR2_4ESR1_11
Interaction_with_SARS-CoV_spike_glycoprotein
ESR1_15AR_14
ESR2_8ESR1_14
ESR2_5
ESR2_13
AR_5AR_4
AR_1 AR_6
9016
125
19 638
5 7 8 11 68
H1-hESC
K562
Layered H3K4Me1
Layered H3K4Me3
Layered H3K27Ac
aFigure 2
TF clusters R5 R4 R3 R2 R1
b c
rs2074192
2
Mouse thymus
●
●
●
●
0.0
0.5
1.0
1.5
CTL E_3days
Rel
ativ
e lo
g2 e
xpre
ssio
n
Preprints (www.preprints.org) | NOT PEER-REVIEWED | Posted: 12 March 2020
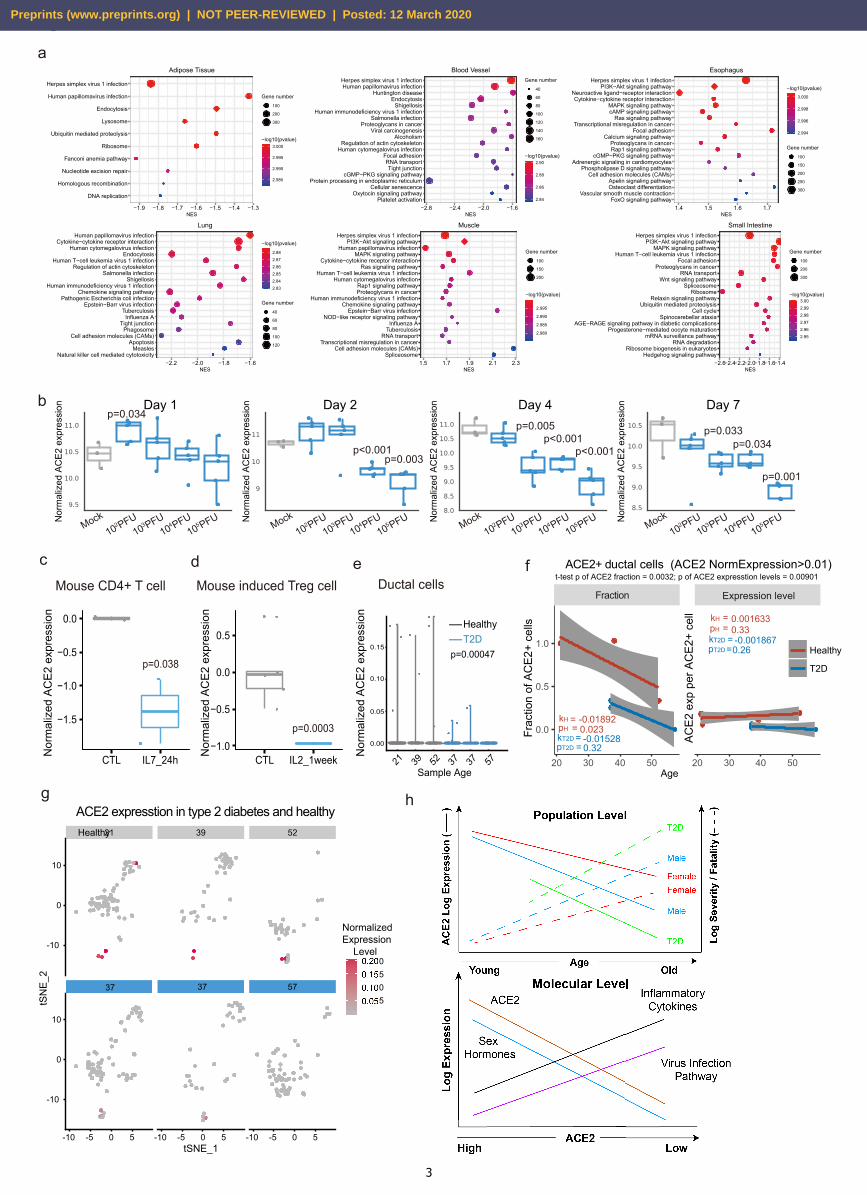
Figure 3
●
●
●
●
●
●
●
●
●
●
DNA replication
Homologous recombination
Nucleotide excision repair
Fanconi anemia pathway
Ribosome
Ubiquitin mediated proteolysis
Lysosome
Endocytosis
Human papillomavirus infection
Herpes simplex virus 1 infection
−1.9 −1.8 −1.7 −1.6 −1.5 −1.4 −1.3NES
Gene number
●
●●
100
200
300
2.985
2.990
2.995
3.000−log10(pvalue)
Adipose Tissue
●
●
●●
●
●●
●
●
●●
●●
●●
●●
●●
●
Platelet activationOxytocin signaling pathway
Cellular senescenceProtein processing in endoplasmic reticulum
cGMP−PKG signaling pathwayTight junction
RNA transportFocal adhesion
Human cytomegalovirus infectionRegulation of actin cytoskeleton
AlcoholismViral carcinogenesis
Proteoglycans in cancerSalmonella infection
Human immunodeficiency virus 1 infectionShigellosis
EndocytosisHuntington disease
Human papillomavirus infectionHerpes simplex virus 1 infection
−2.8 −2.4 −2.0 −1.6NES
Gene number●
●
●
●●●●
40
60
80
100
120
140
160
2.84
2.86
2.88
2.90−log10(pvalue)
Blood Vessel
●
●
●
●
●
●
●
●
●
●
●
●
●
●●
●●
●●
●
FoxO signaling pathwayVascular smooth muscle contraction
Osteoclast differentiationApelin signaling pathway
Cell adhesion molecules (CAMs)Phospholipase D signaling pathway
Adrenergic signaling in cardiomyocytescGMP−PKG signaling pathway
Rap1 signaling pathwayProteoglycans in cancer
Calcium signaling pathwayFocal adhesion
Transcriptional misregulation in cancerRas signaling pathway
cAMP signaling pathwayMAPK signaling pathway
Cytokine−cytokine receptor interactionNeuroactive ligand−receptor interaction
PI3K−Akt signaling pathwayHerpes simplex virus 1 infection
1.4 1.5 1.6 1.7NES
2.994
2.996
2.998
3.000
−log10(pvalue)
Gene number●
●
●●●
100
150
200
250
300
Esophagus
●
●
●●
●●
●●●
●●
●●
●●
●●
●●
●
Natural killer cell mediated cytotoxicityMeasles
ApoptosisCell adhesion molecules (CAMs)
PhagosomeTight junction
Influenza ATuberculosis
Epstein−Barr virus infectionPathogenic Escherichia coli infection
Chemokine signaling pathwayHuman immunodeficiency virus 1 infection
ShigellosisSalmonella infection
Regulation of actin cytoskeletonHuman T−cell leukemia virus 1 infection
EndocytosisHuman cytomegalovirus infection
Cytokine−cytokine receptor interactionHuman papillomavirus infection
−2.2 −2.0 −1.8 −1.6NES
2.832.842.852.862.872.88
−log10(pvalue)
Gene number●
●
●●●
40
60
80
100
120
Lung
●
●
●
●
●
●
●
●
●
●
●●
●
●●
●●
●●
●
SpliceosomeCell adhesion molecules (CAMs)
Transcriptional misregulation in cancerRNA transport
TuberculosisInfluenza A
NOD−like receptor signaling pathwayEpstein−Barr virus infection
Chemokine signaling pathwayHuman immunodeficiency virus 1 infection
Proteoglycans in cancerRap1 signaling pathway
Human cytomegalovirus infectionHuman T−cell leukemia virus 1 infection
Ras signaling pathwayCytokine−cytokine receptor interaction
MAPK signaling pathwayHuman papillomavirus infection
PI3K−Akt signaling pathwayHerpes simplex virus 1 infection
1.5 1.7 1.9 2.1 2.3NES
Gene number
●
●●
100
150
200
2.980
2.985
2.990
2.995
−log10(pvalue)
Muscle
●
●
●
●
●
●
●
●
●
●
●●
●●
●●●●●
●
Hedgehog signaling pathwayRibosome biogenesis in eukaryotes
RNA degradationmRNA surveillance pathway
Progesterone−mediated oocyte maturationAGE−RAGE signaling pathway in diabetic complications
Spinocerebellar ataxiaCell cycle
Ubiquitin mediated proteolysisRelaxin signaling pathway
RibosomeSpliceosome
Wnt signaling pathwayRNA transport
Proteoglycans in cancerFocal adhesion
Human T−cell leukemia virus 1 infectionMAPK signaling pathway
PI3K−Akt signaling pathwayHerpes simplex virus 1 infection
−2.6−2.4−2.2−2.0−1.8−1.6−1.4NES
Gene number
●
●●
100
200
300
2.952.962.972.982.993.00
−log10(pvalue)
Small Intestine
a
b
c d e
g
Mouse CD4+ T cell
●
●
●
●
−1.5
−1.0
−0.5
0.0
CTL IL7_24h
p=0.038
Mouse induced Treg cell
●
●
●
●
●
●
●●−1.0
−0.5
0.0
0.5
CTL IL2_1week
p=0.0003
___
●● ●●● ●● ●● ●●● ●● ●●●● ●●● ●● ●●● ●●●●● ●● ●●● ●● ●● ● ●● ●● ●●●● ●● ●● ●● ●● ●● ● ●● ●●●● ●●●● ●● ●● ●● ●● ●●●● ●●● ●● ●● ●●● ●●● ● ●●● ●● ● ●●●●● ●●● ●● ●●●● ●●●●●● ●●● ●●●●● ●● ●●● ●● ● ● ●● ● ●●● ●● ●●● ●● ●● ●● ● ●● ● ●● ●● ● ●●●●● ● ● ●●● ●●● ●● ●● ●● ●● ●●● ●●● ●● ●●● ●● ●●●● ●●● ●● ●●●● ●●●● ●●●●● ●●● ●● ● ●● ●● ● ●●●● ● ●●●●● ●● ●● ●●●●● ●● ● ●● ● ●●● ●● ● ●● ●●● ●●● ●●● ●●● ●● ●●●●● ●● ●● ●●● ●● ●●● ●● ●● ● ●●● ●●● ●● ●● ● ● ●● ●●● ●●● ● ●● ●● ●●●●● ●● ● ●● ● ●●●●● ●●● ●● ●●● ●●● ●● ●● ●●● ●● ●●●● ●●● ●● ●●● ●●●●● ●● ●●● ●● ●● ● ●● ●● ●●●● ●● ●● ●● ●● ●● ● ●● ●●●● ●●●
___
0.00
0.05
0.10
21 39 52 37 37 57
0.15
Sample Age
HealthyT2D
Ductal cells
Day 1 Day 2 Day 4 Day 7p=0.034
p<0.001p=0.003
p=0.005p<0.001
p<0.001
p=0.033p=0.034
p=0.001
Nor
mal
ized
AC
E2 e
xpre
ssio
n
Mock102 PFU
105 PFU104 PFU
103 PFU Mock102 PFU
105 PFU104 PFU
103 PFU Mock102 PFU
105 PFU104 PFU
103 PFU Mock102 PFU
105 PFU104 PFU
103 PFU
p=0.00047
●
●
●
●
●●●
●
●
●
●
●
●
●
●
●
●
●
●
●
●
●
●●
●
●
●
●
●
●
●
●●
●
●
●
●●●
●●
●
●
●●
●
●
●
●
●
●
●●●
●●
●
●
●
●
● ●
●
●
●●
●
●
●
●
●
●
●
●
●
●
●
●
●●
●
●
●
●
●
●
●
●●
●
● ●
●
●
●
●●
●
●
●
●
●
●●
●
●
●
●
●
●
●
●
●
●
●
●●
●
●
● ●
●
●
●
●
●
●
●
●
●
●
●
● ●
●
●
●
●
●
●
●●
●
●
●
●
●
●
●●
●
●
●
●
●
●
●
●
●●
●
●
●
●
●
●●
●
●
●
●
●
● ●
●
●
●
●
●
●●
●●
●● ●
●
●●●●
●●
●
●●
●
●
●
●
●
●●
●
●
●●
●
●
●
●
●
●
●
●
●
●●
●
●
●
●
●
●
●
●
●
●
●
●
●
●●
●
●
●
●●
●
●
●
●
●●
●
●
●
●
●
●
●
●●
●
●●
●
●
●
●
●
●●
●
●●
●●
●
●●
●
●● ●
●
●
●
●
●
●
●
●
●
●●
●
●●● ●
●
●
●●
●
●
●
● ●
●
●●
●● ●
● ●●
●● ●
● ●●
●
●
●
●
●
●
37 37 57
21 39 52
-10 -5 0 5 -10 -5 0 5 -10 -5 0 5
-10
0
10
-10
0
10
tSNE_1
tSN
E_2
ACE2 expresstion in type 2 diabetes and healthy
0.050.100.150.20
Normalized Expression Level
T2D
Healthy
h
kH
=
-0.01892
pH = 0.023kT2D
== -0.01528
pT2D 0.32
●● ●●
●●●●
●
●
Fraction
20 30 40 50
0.0
0.5
1.0
t-test p of ACE2 fraction = 0.0032; p of ACE2 expresstion levels = 0.00901
kH
=
0.001633
pH = 0.33kT2D
==
-0.001867pT2D 0.26
●
●● ●●
●●
●●●
●
Expression level
20 30 40 50
●
●
Healthy
T2D
ACE2+ ductal cells (ACE2 NormExpression>0.01) f
Nor
mal
ized
AC
E2 e
xpre
ssio
n
Nor
mal
ized
AC
E2 e
xpre
ssio
n
Nor
mal
ized
AC
E2 e
xpre
ssio
n
Nor
mal
ized
AC
E2 e
xpre
ssio
n
Nor
mal
ized
AC
E2 e
xpre
ssio
n
Nor
mal
ized
AC
E2 e
xpre
ssio
n
Frac
tion
of A
CE2
+ ce
lls
Age
ACE2
exp
per
AC
E2+
cell
3
Preprints (www.preprints.org) | NOT PEER-REVIEWED | Posted: 12 March 2020