Embed Size (px)
Citation preview
DRA2 Technical Manual 1
K–8 Technical Manual Developmental Reading Assessment®
SECOND EDITION Copyright 2011 Pearson Education, Inc. or its affiliate(s). All rights reserved.
DRA2 T e ch n ic a l Man u a l 2
Table of Contents Introduction to the Developmental Reading Assessment
– 2nd Edition ………………………………………………………………….. 6 What is the history of the DRA? ……………………………………….. 6
What are the limitations of DRA2? ……………………………………. 12
Theoretical Framework and Research ……………………………………. 13 Description of the DRA2 ……………………………………………………... 23
What comprises the DRA2 test materials? ………………………….. 23
How is the DRA2 administered ……………………………………….. 27
How is the DRA2 scored? ……………………………………………… 29
How should DRA2 scores be interpreted and shared? ……………... 36
What types of training are available ………………………………….. 38
Reliability of the DRA2 ……………………………………………………….. 39 Internal Consistency Reliability ………………………………………… 39
Passage Equivalency …………………………………………………… 41
Test – Retest Reliability ………………………………………………… 42
Inter-Rater and Rater-Expert Reliabilities …………………………….. 44
Summary …………………………………………………………………. 46
Validity of the DRA2 …………………………………………………………… 47
Content-Related Validity………………………………………………… 47
Benchmark Validation …………………………………………………... 49
Results ……………………………………………………...................... 52
Criterion-Related Validity ………………………………………………. 56
Construct Validity ……………………………………………………...... 61
Summary ……………………………………………………................... 69
Word Analysis Technical Information ……………………………………... 71 References……………………………………………………..........................102
DRA2 T e ch n ic a l Man u a l 3
APPENDIX A: DRA2 Reliability and Validity Samples …………………... 104 APPENDIX B: Additional Teacher Ratings on the DRA2 ……………….. 105 APPENDIX C: DRA Word Analysis Study Samples ………………………106
APPENDIX D: Additional Teacher Ratings on the DRA Word Analysis. 107
DRA2 Technical Manual 4
Tables and Figures
Table 1. DRA2 K–8 Oral Reading Rates (words per minute) by
Fiction/Nonfiction and Level………………………………………… 30
Table 2. DRA2 K–8 Accuracy Rates for Levels 14–80…………………… 32
Table 3. DRA2: Cronbach’s Alpha…………………………………………… 40
Table 4. Oral Fluency and Reading Comprehension Within-level
Equivalency: MANOVA……………………………………………… 42
Table 5. Test – Retest Reliability for the DRA2……………………………. 43
Table 6. DRA2 Inter-Rater Reliability Estimates…………………………… 45
Table 7. DRA2 Rater-Expert Reliability Estimates………………………… 45
Table 8. Ratings of the DRA2: Measurement of Reading and
Usefulness…………………………………………………………… 48
Table 9. Participant Information……………………………………………… 50
Table 10. DRA2 Book Level Cutpoints: Independent and Instructional….. 53
Table 11. DRA2 Book Level Cutpoints: Intervention……………………….. 55
Table 12. Correlations between DRA2 and Other Reading Tests……… 58
Table 13. DRA2 Predictive Validity Results with GRADE and DIBELS….. 59
Table 14. Correlations between DRA2 and Teacher Ratings …………… 60
Table 15. Intercorrelations between DRA2 Subtests and Total Score…… 62
Table 16. DRA2 Inter-Item Correlations……………………………………… 64
Table 17. Eigenvalues, % Variance, and Communalities: Factor Analysis. 66
Table 18. Factor Loadings …………………………………………………… 67
Table 19. DRA2 Subtest Scores by Age …………………………………… 68
Table 20. DRA Word Analysis Tasks by Strand…………………………… 77
Table 21. Word Analysis: Cronbach’s Alpha…………………………………. 84
Table 22. Test – Retest Reliability for the DRA2…………………………….. 87
Table 23. Ratings of the DRA Word Analysis: Measurement of Word
Analysis and Usefulness……………………………………………. 90
DRA2 T e ch n ic a l Man u a l 5
Table 24. Correlations between DRA2 Printed Language Concepts and
DRA Word Analysis Metalanguage Tasks………………………… 91
Table 25. Correlations between DRA Word Analysis: Phonological
Awareness Tasks and DIBELS Phoneme Segmentation
Fluency and GRADE: Phonological Awareness Subtests………. 93
Table 26. Correlations between DRA Word Analysis: Letter Naming
Tasks and DIBELS Letter Naming Fluency and GRADE:
Letter Naming Subtest……………………………………………..... 93
Table 27. Correlations between DRA Word Analysis: Phonics Tasks and
GRADE: Word Reading Subtest……………………………………. 93
Table 28. Point Biserial Correlations of DRA Word Analysis & Gender /
Minority Status…………………………………………………………95
Table 29. Changes in DRA Word Analysis Scores…………………………...98
Table 30. DRA Word Analysis Task Performance by ELL Status………….100
Table A1. Characteristics of DRA2 Samples in Reliability and Validity
Analyses………………………………………………………………104
Table B1. Ratings of the DRA2: Usability and Quality of Reading
Materials……………………………………………………………….105
Table C1. Characteristics of DRA Word Analysis Samples in Reliability
and Validity Analyses………………………………………………...106
Table D1. Ratings of the DRA Word Analysis: Usability……………………...107
DRA2 T e ch n ic a l Man u a l 6
Introduction to the Developmental Reading Assessment – 2nd Edition
The primary goal of reading programs and classroom educators is to help students become proficient, enthusiastic readers. The Developmental Reading Assessment® K-8 (K–3 and 4-8), Second Edition, or DRA2, helps teachers and students achieve this critical goal. Authored originally in 1988 by Joetta M. Beaver and the Upper Arlington City School District, the Developmental Reading Assessment (DRA) K–3 was updated and expanded starting in 1998, and then completely revised in 2004–2005 to become DRA2 K–3. Joetta Beaver and Mark A. Carter, Ph.D., coauthors of the original DRA 4–8 and DRA Bridge Pack revised and merged the two programs to create DRA2 4–8(year). The DRA2 family of assessments gives teachers of students in grades K–3 and 4–8 the necessary tools to accurately assess their students’ reading skills and inform future instruction. DRA2 K–3 and 4-8 are designed to be administered by classroom teachers. The DRA2 helps teachers: 1) assess a student’s independent reading level; and 2) diagnose a student’s strengths and weaknesses in relation to reading engagement, oral reading fluency, and comprehension skills and strategies. All DRA2 assessments involve one-on-one student teacher conferences and facilitate a unique opportunity for personalized student assessment so that instruction can be directly tailored to the needs of individual students. This technical manual provides teachers, administrators and other school staff, with information about the broad research foundation of the Developmental Reading Assessment® K–8, Second Edition. Detailed information on the technical characteristics of the DRA2, in terms of validity and reliability, is provided. Such knowledge is essential when deciding if and how DRA2 should be used and what kinds of inferences about readers are permissible. Unless otherwise noted, all information in this technical manual applies to DRA2 K–3 and 4–8.
What is the history of the DRA? In 1983, the U.S. Department of Education published A Nation at Risk, a report that described the reading ability of students (National Commission of Excellence in Education). Upon learning the results of this report, the public became concerned about
DRA2 T e ch n ic a l Man u a l 7
the “rising tide of mediocrity” in the public educational system. In response to A Nation at Risk, the State of Ohio undertook a competency-based educational reform initiative in 1986 that required districts to identify students who were at risk of failure in reading. At that time, Joetta Beaver was an early education lead teacher for the Upper Arlington City School District, a suburb of Columbus, Ohio. She was also a member of the state-level K–12 Language Arts Committee, a group charged with revising the language arts curriculum and integrating the English, writing, spelling, and handwriting competencies into one curricular framework. To identify at-risk students, most Ohio school districts chose to use a standardized, norm-referenced test. Beaver, in collaboration with the teachers and educators in Upper Arlington, wanted to identify an assessment that would match the curricular framework for reading and also drive instruction. Since the committee could not identify such an assessment, they decided to create their own performance-based reading assessment. The Ohio Department of Education gave the Upper Arlington City School District permission to develop this assessment during the next two years. In 1986, Upper Arlington schools were using structured settings and Reading Recovery-trained individuals to identify students at risk of failure. Upper Arlington’s reading assessment development committee chose to model its assessment on that of Reading Recovery, but with several key differences: (1) instead of using specially trained individuals to administer the test, the assessment would be implemented by classroom teachers so as to provide critical information directly to teachers on what their students needed to learn; (2) while Reading Recovery assessed and monitored oral reading only, the new assessment would include comprehension and fluency because both are key components of reading; and (3) the assessment could be used with all primary-grade students, not just at-risk students in first grade. In 1988, the Ohio Department of Education approved the original pilot version of the Developmental Reading Assessment (or DRA, as it became known in the district) for use in other districts. As Joetta Beaver trained teachers on how to use the DRA K–3, she was often asked when the assessment would be expanded to include grades 4 and 5. In 2000, work on DRA 4–8 began. Originally, it was planned to assess reading in grades 4–6, but this was changed to grades 4–8 with the passage of the No Child Left Behind (NCLB) Act of 20011. Joetta Beaver partnered with Mark Carter, a middle school English teacher to develop DRA 4–8. Key goals included helping intermediate teachers understand what is important in reading and to provide them with a tool to analyze what their students are doing when they read so that they could tailor instruction accordingly and provide cogent
1 As part of the No Child Left Behind Act of 2001, President Bush put forward Reading First, a new comprehensive program. Its aim is to provide assistance to state and local education agencies in applying science-based reading research--and the proven instructional and assessment tools consistent with this research--to improve reading instruction for kindergarten through grade 3 students so that students will read on grade level by the end of third grade (U.S. Department of Education, 2002). How is this citation related to the expansion of DRA to 8th grade?)
DRA2 T e ch n ic a l Man u a l 8
interventions. It was designed to assess important areas not typically assessed by schools, including: (1) students’ strengths and weaknesses; (2) fluency, and its impact on reading; and (3) not only literal comprehension but also the ability to make inferences and generalizations. DRA K–3 was modified and additional assessment texts added during 1998–2003 in response to multiple field-tests and feedback from teachers within the United States and parts of Canada. In 1999–2000, a Spanish-language version of the original DRA K–3, Evaluación del desarrollo de la lectura, or EDL K–3, was created, field tested, and published. In 2001, the DRA Online Management System was created to allow teachers, schools, and districts to archive DRA assessment results online, review the calculated data, retrieve the data to create instructional groups, report on individual student progress, and depict classroom, school, and district results. DRA Word Analysis, an individual diagnostic assessment that provides more detailed analysis of students’ reading skills, joined the DRA family of assessments in 2004. How was the DRA2 developed? In 2004–2005, the DRA K–8 was revised, expanded, field-tested, and published as the Developmental Reading Assessment, Second Edition, K-3 and 4-8, or DRA2 K–3 and DRA2 4-8. EDL was also revised and expanded to assess Spanish-speaking students in kindergarten through sixth grade. (Was this when it was published in EDL2?) The overarching goals of the DRA2 remain the same, that is: 1) determine a student’s independent reading level; and 2) diagnose a student’s strengths and weaknesses in relation to reading engagement, oral reading fluency, and comprehension skills and strategies so as to inform future instruction. As part of the revision process, a field study was conducted in the Spring of 2005 to compare revised DRA2 Benchmark Assessment Books across levels. The average scores on comprehension, words per minute, and accuracy rate were compared for students who were administered adjacent text levels. A paired-samples t-test which compared the average scores of a student assessed with 2 different books one level apart showed appropriate differences in values for comprehension, words per minute, and accuracy rate across levels. At the same time, a field study was conducted to compare benchmark assessment books within the same level. Results indicated there were no significant differences between books administered at the same level, as predicted. This information was critical in ensuring that the benchmark assessment books were suitable within levels and could appropriately show growth across levels. Note that, while these initial analyses were conducted during the development phase of the DRA2, additional in-depth analyses on the validity and reliability of the DRA2, as well as on passage equivalency, have since been conducted and are reported in subsequent sections of this technical manual.
DRA2 T e ch n ic a l Man u a l 9
How does the 2nd edition of the DRA differ from the 1st edition? Important differences between the first and second editions include the following:
The Benchmark Assessment Books now comprise Levels A–40, with four Level 40 texts from DRA2 4–8 and no fifth-grade-level texts. This change was made for multiple reasons. First, the DRA2 recognizes that students who are reading above grade level should read or be tested no more than one grade level above their present grade. Second, for proficient readers, text level is less significant than their ability to understand text. Third, proficient students still need to develop comprehension skills and should be encouraged to read for a variety of purposes and across genres and content areas.
Students’ oral reading is timed to determine their oral reading rate beginning with Level 14. The timing element is deemed important and relevant because a slow reading rate not only hinders the reader’s comprehension, it also limits the amount read. The assessment is stopped if students’ accuracy rate and/or oral reading rate fall below the Developing/Independent performance range on the DRA2 Continuum. Research and DRA2 field-test data indicate that appropriate oral reading rates and accuracy have an impact on students’ ability to construct meaning.
Students reading DRA2 texts Level 28 and above write a one-page summary of what they’ve read, as well as responses to Literal Comprehension, Interpretation, and Reflection questions or prompts within a Student Booklet. In the oral retelling and summary sections, vocabulary concepts are now part of the DRA2 K–3 assessment, raising the top Comprehension score to 28. Most state assessments require students to respond to different types of questions and prompts in writing. DRA2 provides insight into how well students respond in writing. The composing process gives students time to think about what is important to include and how to organize their thoughts. Knowledge of a student’s control or understanding of words and concepts is important to the assessment of comprehension.
The Continuum is now included as part of the Teacher Observation Guide for each level text. The reason for this change is that placing the Continuum within the Teacher Observation Guide allows for immediate marking of descriptors to determine students’ strengths and needs.
While the DRA2 finds students’ independent reading levels, clear guidelines are now provided in each Teacher Guide for teachers who need to find students’ instructional reading levels. This information is provided because some teachers/schools/districts/states must identify students’ instructional text levels in order to meet state or district objectives.
DRA2 T e ch n ic a l Man u a l 10
DRA 4–8 and the DRA Bridge Pack have been combined. This change creates one cohesive set of assessments that enable teachers to readily assess all intermediate and middle-school students reading at Levels 20 (second grade) through Level 80 (eighth grade).
Six of the Bridge Pack Benchmark Assessment Books have been replaced with more age-appropriate material. One fourth-grade text has also been replaced. These changes were made to ensure reader engagement with the texts.
All of the nonfiction Benchmark Assessment Books now have a contents page and Levels 28–80 now have a glossary. Questions utilizing text features and graphic organizers have been added to the Student Booklets. These changes reflect students’ need to access and use key nonfiction text features.
In Levels 60–80, a graphic organizer has been added to the Student Booklets to help students organize their ideas for their summary. This change enables students to demonstrate their ability to access and think about important ideas.
A Handbook section has been added to the DRA2 K–3 Teacher Guide to provide scored Independent and Advanced student examples. Similarly, the Handbook section in the DRA2 4–8 Teacher Guide has been extended to provide scored examples that demonstrate one Independent response for each text. For Bridge Pack books, an Advanced response is also provided. These changes help provide reference points for teachers so as to help ensure accurate scoring.
Instructional ideas have been added to help teachers better address student needs. These ideas will help teachers apply the information gained from the assessment in meaningful ways to address instructional needs.
The overall scoring has been simplified in that the students total scores in Oral Reading Fluency and Comprehension determine if a student is reading independently at the level assessed. This change makes finding a student’s Independent reading level quicker and easier, as well as providing continuity between the K–3 and 4–8 assessments.
Each Teacher Observation Guide now has its own Focus for Instruction tailored to fiction or nonfiction and specific DRA2 level. This makes the process of planning future instructional steps more precise.
What are the purposes and features of the DRA2? The current era of student and teacher-level accountability and high-stakes assessment requires differentiated instruction as a means for educators to help all students succeed. In a differentiated classroom, a teacher must design a learning experience based on his or
DRA2 T e ch n ic a l Man u a l 11
her best understanding of the student’s current ability, needs, readiness and interests. The DRA2 was designed so that educators could obtain the information they need to make sound decisions about their students’ reading levels and development, and inform their subsequent instruction. More specifically, according to Beaver and Carter (2003), the DRA2 is designed to:
measure how well students read fiction and nonfiction; monitor student growth and development on a variety of crucial skills and
strategies that successful readers utilize; help teachers diagnose student needs and plan for timely instruction; prepare students to be successful at meeting today’s classroom and testing
expectations; and support teachers and school districts in keeping parents and other stakeholders
informed about their students’ level of reading achievement. The DRA2 measures or describes three critical components of reading: reading engagement, oral reading fluency, and comprehension. The authentic texts used to assess these components are typical of the materials students read both in and out of school, including content drawn from different academic areas such as humanities, social studies, and science literature. The authors of DRA2 have provided multiple texts for each level tested starting at grade one, with non-fiction texts included at levels 16, 28, 38, and 40 through 80. Several specific features of the DRA2 are noteworthy, including :
The DRA2 can be used in classrooms from kindergarten through eighth-grade. The DRA2 may be administered and interpreted by classroom teachers. Assessments are conducted during one-on.-one reading conferences during
which students read specially selected assessment texts and respond to questions/prompts verbally or in written format.
Individual conferences with students provide time for the teacher to develop a rapport with the student and for the student to feel comfortable and relaxed during the assessment. They also allow the teacher to obtain specific information about each student’s reading rate and accuracy.
Results inform instructional interventions and strategies which allow a teacher to plan for future learning.
The DRA2 may be used on an annual basis or multiple times throughout the school year to document changes in each student’s reading development.
Two decades of research and development have gone into DRA2. In direct response to teacher feedback, the procedures, forms and Benchmark Assessment Books have changed over the years to ensure that the assessment is high-quality and provides valuable information to teachers.
DRA2 T e ch n ic a l Man u a l 12
How does the DRA2 differ from other reading assessments? The DRA2 differs from other reading assessments in the following ways:
It is a unified K–8 assessment that provides all the information required to individually pinpoint the reading level of a student and subsequently link assessment information with appropriate and individualized instructional steps.
It is correlated to Celebration Press Reading: Good Habits, Great Readers, so that teachers can easily move from the assessment to the appropriate instructional steps.
Because of its built-in comprehensive teaching support and training options, it is easy to use and administer on a district wide level.
Changes made to the Continuum and Focus for Instruction make scoring easier and more objective.
Simplified Teacher Observation Guides allows for seamless, easy collection of student assessment data.
New and revised Benchmark Assessment Books provide fiction and nonfiction alternatives throughout the levels. The informational text topics are familiar to most students and do not require special background knowledge to comprehend.
Guidance on how to determine the correct level at which students should first be assessed is included.
DRA2 K–3 and DRA2 4–8 each come in their own classroom organizers that provide everything teachers need to conduct assessments in an efficient manner, including a clipboard with a calculator and timer,
What are the limitations of DRA2? Instructional decisions are best made when using multiple sources of evidence about a reader. DRA2 is a single source of evidence about a student’s reading development. Other sources may include standardized reading test data, reading group placement, lists of books read, and most importantly, teacher judgment. A single measure of reader performance, taken on one day, is never sufficient to make high-stakes decisions for students, such as summer school placement or retention.
DRA2 T e ch n ic a l Man u a l 13
Theoretical Framework and Research
Development of the DRA2 K–3 and DRA2 4–8 was based on what educators and the extant research literature identified as being key characteristics and behaviors of good readers. The DRA2 is based upon a number of premises which were drawn from: 1) developers’ observations and experiences as they worked with students in the classroom; 2) feedback from teachers and practitioners; and 3) the research literature concerning reading development and instruction. Each premise is listed below, followed by a summary of some of the relevant research backing that premise, and a description of how the premise is incorporated into the DRA2.
Premise 1. Good readers choose reading materials to fulfill different purposes and to reflect their interests. Good readers read well-targeted text (text that is accessible at their level) with a high level of success and accuracy.
Learning how to select reading materials at appropriate levels to fulfill multiple purposes enables students to become more independent in the classroom and have greater control over their choice of reading materials. Supporting Research: Baker, 2002; Baker and Brown, 1984; Bamford and Kristo, 2000; Calfee and Hiebert, 1996; Clay, 1991, 1993, 1997; Holdaway, 1979; and Nagy and Scott, 2002. DRA2 K–3. Good readers select appropriately leveled reading materials and continue to improve as readers each time they read. DRA2 4–8. Good readers successfully select texts that match their reading level, interests, and purposes. Good readers read appropriately leveled texts with a high level of accuracy, monitor meaning, and use strategies to quickly self-correct miscues that interfere with meaning. With DRA2 K–3, students reading above Level 3 choose a text that seems right for them from those selected by the teacher. This book should be used during the assessment. With DRA2 4–8, students record the titles of books and other reading materials that they
DRA2 T e ch n ic a l Man u a l 14
have read at school and at home during the last two months. The record reveals students’ levels of reading engagement.
Premise 2. Good readers read for extended periods of time that are consistent with the purpose for reading.
It is extremely important that young readers have extended practice in reading. They need interesting and well-written books to read, time in which to read, and reasons for wanting to read (North Carolina Department of Public Instruction, 1999). While the small amount of research concerning the impact of sustained silent reading is not conclusive, the National Reading Panel (2000) indicated that encouraging students to read might be beneficial. Additional Research: Snow, Burns, and Griffin, 1998. DRA2 K–3. Good readers read and sustain their reading for longer periods of time. DRA2 4–8. Good readers enjoy reading, read often, and read a wide variety of genres to meet multiple purposes. With DRA2 K–3 at Levels up to 24, teachers are instructed to monitor their students’ reading in terms of the amount of support they need when reading familiar and unfamiliar texts and when reading new genres, . At Levels 28–40 and with DRA2 4–8, students identify their own reading strengths and goals, as well as develop a plan to achieve their goals and/or improve their reading. This strategy helps students become more self-regulated.
Premise 3. Good readers preview a book before reading in order to predict events, identify topics or themes, or make real-world connections by relating the content to their own experiences.
Good readers are adept at drawing upon their prior knowledge as they read to: a) make predictions about what might happen next; and b) to understand ideas as they encounter them (Paris, Wasik, and Turner, 1991; Pressley, 2002c). Furthermore, research shows that encouraging and teaching prediction as a strategy (e.g., via reciprocal teaching and transactional strategies) can have a positive impact on comprehension (Palincsar & Brown, 1984; Pressley et al., 1992). Additional Research: Baker, 2002; Baker and Brown, 1984; Clay, 1991, 1993; National Reading Panel, 2000; and Snow, Bums, and Griffin, 1998. DRA2 K–3. Good readers preview a book before reading it, predict what might happen, or, for non-fiction texts, identify the topics that may be addressed.
DRA2 T e ch n ic a l Man u a l 15
DRA2 4–8. Good readers preview texts, make predictions about what is likely to happen and/or identify topics and information that may be included. DRA2 K–3 evaluates the student’s ability to preview text and anticipate what might happen at Levels A–24. By flipping through the book and periodically reading short sections, the student is able to predict what might happen in the book or what he or she will be reading about in a nonfiction text. The assessment also asks the student to identify topics and information presented in graphic formats. With DRA2 K–3, Levels 28–40 and DRA2 4–8, students dictate or record their predictions about what might happen in a narrative text or what information might be included in a biography or informational text before reading the complete text. This record identifies which students have begun to engage with the text by assessing background knowledge and initial information from the text. For both assessments, students’ reports are validated by the observations they make while reading.
Premise 4. Good readers read aloud with fluency (e.g., quickly and accurately with expression) for longer periods of time.
Research has shown that good readers read words accurately, rapidly, and efficiently. Research conducted by LaBerge and Samuels (1974), Gough and Tunmer (1986), and Tan and Nicholson (1997) has shown that fluent readers devote less attention to word recognition and more attention to comprehension. Good readers appear to recognize words as a whole because they have developed a thorough and interconnected knowledge of the spellings, sounds, and meanings of words (Pressley, 2002c). In addition, good readers recognize when they have misread a word because the word does not make sense to them in the context of what they are reading; that is, good readers monitor their comprehension as they read (Gough, 1983, 1984; Isakson and Miller, 1976). Other studies have confirmed that more rapid decoding improves comprehension, probably by freeing up more memory for comprehension. For a student, the amount of cognitive resources available for decoding (recognizing printed words) and comprehension (constructing meaning from recognized words) is restricted by the limits of memory. If a student struggles with the task of word recognition, then all of his or her available memory may be consumed with decoding and, as a result, he or she would have little memory left for the task of comprehension. Problems with word recognition slow the process down and use the resources that are necessary for comprehension (Breznitz, 1997a and 1997b; National Reading Panel, 2000). If readers have to struggle with words, they can easily lose track of meaning and, as a result, comprehension suffers (Adams, 1990; Snow, Bums, and Griffin, 1998). Indeed, the National Reading Panel (2001) concluded that children who do not develop reading fluency, no matter how bright they are, continue to read slowly and with great effort.
DRA2 T e ch n ic a l Man u a l 16
Additional Research. Hall and Moats, 1999; Hiebert and Taylor, 2002; Moats, 2000; Pressley, Allington, Wharton-McDonald, Block, and Morrow, 2001; and Samuels, Shanahan, and Shaywitz, 2000. DRA2 K–3. Good readers read aloud quickly and smoothly. DRA2 4–8. Good readers read quickly in longer, meaningful phrases. As part of DRA2 K–3, teachers note and monitor changes over time in students’ rate, accuracy, phrasing and expression as the students read orally. Starting at Level 14, students’ oral reading of the story or designated passage is timed. With DRA2 4–8, students are also timed as they read aloud a designated passage to determine their oral-reading rates and accuracy as well as phrasing and expression. This information reflects the students’ abilities to read aloud quickly and smoothly with expression that indicates a deeper understanding of the text. With both levels of DRA2, teachers observe and make note of how well the student makes appropriate pauses at punctuation marks, uses appropriate intonation, and exhibits fluent reading, or reading with little hesitation or labor.
Premise 5. Good readers are aware of and use a variety of strategies to decode words and comprehend reading materials, including previewing text, self-questioning, paraphrasing, and note-taking.
Proficient readers understand the characteristics of different modes of text, such as the expressive, narrative, poetic, dramatic, and informational. Furthermore, proficient readers adapt the strategies they use in preparing to read, engaging in reading, and responding to what they have read according to their purpose for reading and according to the mode of text that they are reading. Proficient readers also use contextual clues, including text features, to comprehend what they read (e.g., Snow, 2002). They use text structure, including the organization of the text and their knowledge of the characteristics of the genre they are reading, to aid comprehension. Proficient readers also use multiple cueing systems--graphophonic, semantic, and syntactic--in different degrees during the preparation, engagement, and response stages of reading (North Carolina Department of Public Instruction, 1999; Weaver, 1994). The National Reading Panel (2000) examined 203 studies that dealt with the instruction of text comprehension. This meta-analysis led to the identification of eight different kinds of effective procedures that had strong scientific bases for improving comprehension. One procedure is comprehension monitoring, where the student learns how to be aware or conscious of his or her understanding during reading and learns procedures to deal with problems in understanding as they arise. Another procedure is the use of graphic and semantic organizers that allow the student to represent graphically the meanings and relationships of the ideas that underlie the words in the text. The Panel concluded that “the teaching of a variety of reading comprehension strategies leads to
DRA2 T e ch n ic a l Man u a l 17
increased learning of the strategies, to the specific transfer of learning, to increased retention and understanding of new passages, and in some cases, to general improvements in comprehension” (p. 4–6). Additional Research: Armbruster, Lehr, and Osborn, 2001; Baker, 2002; Baker and Brown, 1984; Calfee and Hiebert, 1996; Fisher, Schumaker, and Deschler, 2002; Hoyt, 1998; Ivey, 2002; Kamil, Ferguson, Garza, Trabasso, and Williams, 2000; Paris, Wasik, and Turner, 1996; Pearson and Duke, 2002; Pearson and Fielding, 1996; Pressley, 2002a, 2002b; Snow, Burns, and Griffin, 1998; Tierny and Cunningham, 1996; and Tracey and Morrow, 2002. DRA2 K–3. Good readers use a variety of strategies. DRA2 4–8. Good readers ask themselves questions prior to and during the reading of a text. Good readers are aware of the strategies they use to construct and monitor meaning while reading. As part of DRA2, teachers note observable reading behaviors such as pausing, rereading, using the pictures, making use of context clues, asking for assistance, sounding out clusters of letters, answering questions while reading, and self-correcting as evidence of students’ use of various strategies. Teachers are instructed to make note of miscues on the record of oral reading. With DRA2 K–3, Levels 28–40 and DRA2 4–8, students generate questions they think might be answered as they read. Student-generated questions often pique interest and provide a purpose for reading. In addition, students check the comprehension strategies they use to help them understand the text and give examples from the text showing where or how they used the reading strategies. At Levels 40–80, students’ levels of metacognitive awareness are revealed.
Premise 6. Good readers read for meaning and understanding and are able to summarize text in their own words. Older readers should also be able to summarize what they read in writing.
Cognitive research describes the reading process as “purposeful and active” (National Reading Panel, 2000). Students read texts to understand what is read and to put this understanding to use. A student can read a text for a variety of purposes: for entertainment (literary experience), to gain information, or to perform a task. These various purposes of understanding require the student to use his or her prior knowledge and experiences, including those related to language and print. This knowledge and these skills enable the student to “make meanings of the text, to form memory representations of these meanings, and to use them to communicate information with others about what was read” (p. 4–5). Because students can be more or less proficient in reading different types of text and in adopting different purposes for reading, the National Assessment of Educational Progress (NAEP) assesses various types
DRA2 T e ch n ic a l Man u a l 18
of text and asks questions related to the purpose for reading the text (National Assessment Governing Board, 2000). Additional Research: Baker, 2002; Baker and Brown, 1984; Brown, 2002; Fisher, Schumaker, and Deschler, 2002; Hoyt, 1998; Pearson and Duke, 2002; Pressley, 2002a; and Snow, Bums, and Griffin, 1998. DRA2 K–3. Good readers read for meaning. DRA2 4–8. Good readers comprehend what they read (silently or orally) and are able to use their own language and key vocabulary from the text to identify and organize important information into an adept written summary. As part of DRA2 K–3, Levels 4–24, students are asked to retell the story they have just read and respond to prompts and questions during the conference with the teacher. With Levels 28–40 and DRA2 4–8, students compose a one-page summary of the text. Students demonstrate overall understanding when they determine importance, prioritize and synthesize ideas, and organize their own thoughts into an effective summary.
Premise 7. Good readers read and communicate with others using both oral and written discourse.
Good readers want to know a great deal about the world and what happens in it. Their prior knowledge affects their understanding of text (Pressley, 2002c). The more varied and extensive a child’s world experiences and vicarious experiences are (such as hearing stories read, interacting with adults and older children, playing word games, and watching quality children’s shows on television), the richer the child’s schematic knowledge base will be (Hudson, 1990; McCartney and Nelson, 1981; and Nelson, 1978). Some children have experienced as many as a thousand hours of informal reading and writing encounters before they enter school (Adams, 1990). These students have become engaged and motivated by literacy activities such as being read aloud to, watching adults write letters and lists, trying to write themselves (drawing or “scribble” writing), manipulating magnetic letters or blocks, and talking about environmental print such as labels and signs. Many children enter school without these experiences; these students need to see literacy (reading and writing) as important to adults, as a useful and meaningful endeavor, and as an exciting and enjoyable activity (North Carolina Department of Public Instruction, 1999). Additional Research: Brown and Camboume, 1990; Freppon, 1991; Heath, 1996; Juel and Cupp-Minden, 2000; Ogle and Blachowicz, 2002; and Wilkinson and Silliman, 2002. DRA2 K–8. Good readers read and function within a literacy community.
DRA2 T e ch n ic a l Man u a l 19
During the DRA2 conference at Levels A–24, teachers ask students about their reading preferences, both to become aware of students’ penchants and to identify students who are somewhat passive about reading. At Levels 28–80, prior to the one-on-one conference, students complete a reading survey that asks about students’ reading history and preferences. For all of these students, the goal is to help them to become engaged during reading activities (e.g., reading circles or other group sharing times).
Premise 8. Good readers can monitor and develop their reading skills.
Students should be encouraged to become aware of their reading strengths and enhance their ability to set and achieve reading goals. Students who are good at monitoring their own comprehension know when they understand what they read and when they do not. These students have strategies to “fix up” problems in their understanding as the problems arise (Center for the Improvement of Early Reading Achievement, 2001). For good readers, it is the perception of their capability as readers that makes a difference in how competent they feel (Pajares, 1996). By providing readers with clearer goals and providing them with feedback on their progress, students can exhibit increased self-efficacy and a greater use of comprehension strategies (Dillon, 1989; Schunk and Rice, 1993). Additional Research. Bandura, 1993; Pintrich and Schunk, 1995; Schunk, 1991; Shell, Colvine and Bruning, 1995. DRA2 K–8, Levels 28–80. Good readers are confident about their ability to read, are aware of their strengths as readers, and are goal-directed. With DRA2 K–8, Levels 28–80, students identify their own reading strengths and goals, as well as develop a plan to achieve their goals and/or improve their reading. This helps students become more self-regulated.
Premise 9. Good readers can read, comprehend and interpret text on a literal level.
Students read on a literal level when they read the specific words and lines of the text. They are searching for answers to basic questions: who, what, when, and where. Rapheal (NCREL, 2004) has described this lowest level of comprehension (text-explicit) as “right on the page,” when the reader is able to find the answers to questions directly in the text. Vaca and Vaca (1999) state, “. . . a literal recognition of the message determines what the author says” (p. 437). Teachers should promote strategies that help students to effectively locate information in text that answers literal questions.
DRA2 T e ch n ic a l Man u a l 20
Additional Research: Baker, 2002; Baker and Brown, 1984; Brown, 2001; Fisher Schumaker, and Deschler, 2002; Hoyt 1998; National Reading Panel, 2000; National Research Council, 1998; Pearson and Duke, 2001; and Pressley, 2002b. DRA2 K–8, Levels 28–80. Good readers understand what is explicitly stated in the text. With DRA2 K–8, Levels 28–80, students locate and restate information within the texts to effectively respond to literal questions. This process demonstrates an ability to locate and/or recall literal information.
Premise 10. Good readers can read, interpret text by making use of inferences, and make connections to personal experiences and existing knowledge.
Inferential comprehension requires that the student go beyond the printed words on the page to understand how the pieces of information fit together--the student must read between the lines. Herber (1978) describes the difference between literal comprehension and inferential comprehension in this way: “At the literal level readers identify the important information. At the interpretative level readers perceive the relationships that exist in the information, conceptualizing the ideas formulated by those relationships” (p. 45). Vaca and Vaca (1999) state that the interpretative level “delves into the author’s intended meaning” (p. 433). The interpretative process integrates the material with the reader’s prior knowledge. Teachers should help students to record information that they think is implied, but not explicitly stated, in the text. Raphael (NCREL, 2004) describes this level of comprehension as “think and search” or text-implicit comprehension. At this level the reader must infer the answer to questions based on information in the material read; readers search for answers to why, what, if, and how questions. Additional Research. Baker, 2002- Baker and Brown, 1984; Brown, 2002; Cuesta College, 2004; Fisher, Schumaker, and Deschler, 2002; Hoyt, 1998; National Reading Panel, 2000; Pearson and Duke, 2002; Pressley, 2002b; and Snow, Bums, and Griffin, 1998. DRA2 K–8. Good readers interpret what they read by making inferences and making connections. With DRA2 K–3, in Levels 4–16 students make personal connections with the text. With DRA2 K–3, Levels 18–40 and DRA2 4–8, students record what they think is implied or suggested in the text. With this constructive process, students’ abilities to go beyond the literal level are demonstrated.
DRA2 T e ch n ic a l Man u a l 21
Premise 11. Good readers validate their inferences, generalizations, connections, and judgments with information from the text, information from other sources, or personal experiences.
Good readers attempt to validate the information that they read based on external information and their prior knowledge and experiences. Teachers should help students to cite examples, phrases, and/or actions or events from the text that support inferences. Raphael (NCREL, 2004) describes the highest level of comprehension as “on your own,” or experienced-based comprehension. At this level, readers respond to questions that have no right or wrong answers or no specific solution. Readers must use their experiences and prior knowledge to answer such questions inferring what may happen or what might be the motivation for doing something. Additional Research. Anderson and Pearson, 1984; Cuesta College, 2004; Fisher, Schumaker, and Deschler, 2002; Palincsar and Brown, 1984; and Pressley, 2002b. DRA2 K–8, Levels 28–80. Good readers support their responses (inferences and connections) with information from the text. Good readers support their judgments with reasons and/or personal or text examples. With DRA2 K–8, Levels 28–80, students cite examples, phrases, and/or actions from the text to show why or how the inference or connection was made. This illustrates how students use portions of the text to support their thinking. In addition, students tell why they think an event or message is significant. This demonstrates students’ adeptness at explaining or justifying their reading responses.
Premise 12. Good readers reflect on what they read to determine its significance, to validate its authenticity, and to understand the author’s intent.
Good readers constantly search to understand information and determine its authenticity and relevance. Vaca and Vaca (1999) describe this level of reading as reading beyond the lines. When readers read at this level, they know how to synthesize the information with what they already know and draw conclusions and form opinions. Teachers should promote students’ critical thinking skills by facilitating their recognition of messages or themes developed by an author. Often the author does not state things directly and it is up to the reader to figure out why the author is presenting the materials and to determine whether the author is presenting his or her opinions or presenting facts. Additional Research. Cuesta College, 2004; Fisher, Schumaker, and Deschler, 2002; Ivey, 2002; Pearson and Duke, 2002; Pressley, 2002b; Tierney and Cunningham, 1984; and Tracey and Morrow, 2002.

DRA2 T e ch n ic a l Man u a l 22
DRA2 K–8, Levels 28–80. Good readers reflect on what they read and determine it’s significance, and/or evaluate what they read. With DRA2 K–8, Levels 28–80, students identify the information learned, the message in the text, or what they think is the most significant event in the text. Establishing and/or using criteria when making judgments are important skills in critical reading.
DRA2 T e ch n ic a l Man u a l 23
Description of the DRA2
What comprises the DRA2 test materials? Teacher Guides – The Teacher Guides (DRA2 K-3 and 4-8) provide an overview of the development of DRA2, explain the various components, administration guidelines, and reporting procedures, and include helpful descriptions and examples of how to effectively score DRA2 assessments. They also contain “Moving Into Instruction” and “Frequently Asked Questions” sections, which are helpful resources for using the assessments and applying the resulting data. DRA2 K-3 and 4-8 Teacher Guides contain a list of common children’s literature titles that are comparable in reading level to the Benchmark Assessment Books used for the assessment. The lists provide an additional reference to help teachers determine which DRA2 level to begin testing students based on what the student may currently be reading. The Teacher Guides offer additional support on ways to select appropriate levels of text for beginning-level and new students. Benchmark Assessment Books - The Benchmark Assessment Books are comprised of both fiction and nonfiction texts ranging from beginning to upper reading levels. Each Benchmark Assessment Book is identified on a scale from A through 80, with A be the easiest and 80 being the hardest. The fiction selections feature engaging, age appropriate stories and the Nonfiction selections feature informational text, narrative (biographies) and expository text. Teacher Observation Guides – A Teacher Observation Guide has been developed for each Benchmark Assessment Book and were designed to direct the teacher through each assessment. Copies of each Teacher Observation Guide can easily be photocopied from the Blackline Master book or printed directly from the Blackline Masters CD. Each Guide includes detailed teacher directions, questions, and prompts for use during the student-teacher conferences. Student Reading Survey (DRA2 K–3, Levels 28–40 and DRA2 4–8) – There are three versions of the Student Reading Survey with each one addressing either grades 2-3, 4-5 or 6-8. Each consists of two sections: Wide Reading and Self- Assessment/Goal Setting.
DRA2 T e ch n ic a l Man u a l 24
Wide Reading – The Wide Reading section is used to document the student’s
reading habits within a specified period of time in order to determine the student’s level of engagement.
Self-Assessment/Goal Setting – This section gives the student an opportunity to express his or her perceived strengths, needs and plans to stay engaged as a reader.
Student Booklets (DRA2 K–3, Levels 28-–40 and DRA2 4–8 only) - Student Booklets correspond with the Benchmark texts for Levels 28-80 and provide a place for students to record their answers to the Comprehension Skills/Strategies prompts and questions.
DRA2 Continuum - The DRA2 Continuum is now part of each Teacher Observation Guide and has been customized to correspond with each of the Benchmark Assessment Books. The Continuum scaffolds the analysis of student performance levels in Reading Engagement, Oral Reading/Oral Reading Fluency, and Printed Language Concepts/Comprehension.
Focus for Instruction – This form comprises a checklist of possible instructional paths, based on the categories found on the specific Continuum for each Benchmark Assessment Book. It is located on the last page of the Teacher Observation Guide.
Other DRA2 Materials Focus for Instruction Class Profile – Easy to use forms that assist teachers with grouping students based on specific needs and abilities. They are a great tool for providing a classroom overview of targeted growth and differentiated instruction. Student Book Graph – Provide a way to monitor independent reading of increasingly difficult texts across a student’s school years. These are included in the Blackline Master books as well as printed on the back of Student Assessment Folders. Class Reporting Form – Provides school- or district-wide accountability and tracking of student scores. This is an optimal way to identify and track the development of at risk reading students across the years. Each of the K–3 and 4–8 Student Assessment Forms provide a way to track the following data: Assessment date, grade, DRA2 text level, fiction or nonfiction text, and grade-level performance. As well, the Fiction and Nonfiction Text Forms provide a summary for each student regarding their progress in reading both types of text; the following data is tracked: assessment date, Benchmark Assessment Book title, DRA2 text level, accuracy rate, reading engagement score, oral reading fluency score, printed language concepts score (Levels A–3 only) and comprehension score (Levels 4 and up).
DRA2 T e ch n ic a l Man u a l 25
Student Assessment Folder - Provides storage and longitudinal monitoring of individual student progress. This is a good place to store yearly Student Reading Surveys, Teacher Observation Guides and the Student Booklets. Assessment Procedures Overview Card - This laminated card provides a summary of the sequence of steps in the different DRA2-level assessments. The opposite side of the card displays the Record of Oral Reading Guidelines. Training DVD – A professional training video for use in learning how to administer the assessment. It is a great resource for administrators and teacher trainers during group training sessions and for yearly assessment procedure review. Organizer and Hanging File Folders - A built in feature of the DRA2 kit, each box comes with an updated version of the individual hanging files and file folders for storing the Benchmark Assessment Books and associated forms. Clipboard – New to the DRA2, the Clipboard comes with many built in features (an unobtrusive clock, timer, calculator and handy writing surface) making it ideal for use during individual assessments. Students may experience less assessment anxiety without the distraction of an obvious and distinct timer visible during the assessment. Word Analysis (Included with K-3; also available separately) - This diagnostic tool provides a systematic means to observe how struggling and emerging readers attend to and work with the various components of spoken and written words. The information gathered about students’ knowledge and skills in working with letters and sounds, words in context and in isolation is helpful to teachers planning instruction for at-risk, struggling and emerging readers. Technical information is in Chapter 6. Bridge Pack (now included in the DRA2 4-8) - Consists of eight Benchmark Assessment Books, corresponding Teacher Observation Guides and other assessment forms for DRA Levels 20–38. These materials allow teachers to accurately assess students who are reading below grade level and subsequently plan an appropriate reading program. Additional Blackline Masters - These are provided in the back of the Blackline Masters books, as well as a printable format on the Blackline Masters CD. EDL2 K-6 (Evaluación del desarollo de la lectura K-6) - The Spanish edition of DRA2 allows educators working with Spanish-speaking students to assess reading achievement for elementary grades. Field-tested in Spanish by bilingual educators across the United States, EDL2’s proven validity and reliability allows educators to determine independent reading level, group students for reading experiences and instruction in a productive manner, document changes in students’ reading performance

DRA2 T e ch n ic a l Man u a l 26
over time and identify students who may be working below proficiency and require additional intervention. EDL2 K–6 is available as a separate purchase. .
DRA2 T e ch n ic a l Man u a l 27
How is the DRA2 administered?
Format of the Test The DRA2 K–3 and DRA2 4–8 are administered in a four-step process:
Step One consists of student reading engagement. Step Two consists of student oral reading. Step Three evaluates student comprehension/printed language concepts. Step Four is the teacher’s analysis of the student’s performance.
Administration Time The DRA2 can be administered to students annually or semiannually in the Fall and Spring. It can also be administered more frequently to identify students needing intervention and monitor their progress. Many districts use a pre- and post-test procedure for administering and reporting DRA2 results, with a post-test occurring in late April as a way to monitor progress over time. By administering the assessment late in the school year, results can be used to inform instruction or to show students’ progress over the course of the year. This type of assessment administration timeline can also validate instructional decisions a teacher may have made during the course of the year. Since all DRA2 assessments require a one-on-one conference, it may benefit a new teacher or student to engage in the assessment process more than twice a year. Additional testing (beyond twice yearly) may help develop a stronger rapport between students and their teachers. As well, a teacher may have better success in gaining insight into problem areas if they administer DRA2 more often to students who are not making progress. DRA2 K–3 The total student time to complete the assessment is 60 minutes or less. It takes approximately 10 to 20 minutes per student to administer the test, depending on the level of the text and how well the level of the text matches the student’s Independent reading level. For emergent readers, the administration time is 5–10 minutes; for early readers the administration time is about 10 minutes; for transitional readers the administration time is 15–20 minutes; for extending readers (Levels 28–38) the administration time is approximately 45–60 minutes. Much of this time is independent work by the student, during which the teacher may be otherwise engaged.
DRA2 T e ch n ic a l Man u a l 28
DRA2 4–8 The total student time to complete the assessment takes about 55–70 minutes. The Student Reading Survey takes 10–15 minutes, the oral reading takes 5-7 minutes, the student independent work takes 35–40 minutes, and teacher analysis takes about 10–12 minutes to complete. Much of this time is independent work by the student, during which the teacher may be otherwise engaged
Administration Procedures DRA2 K–8 has been developed for use in self-contained classrooms, elementary classrooms that are structured according to curricular areas, intermediate and middle school environments, and reading intervention programs. Ideally, classroom teachers should assess their own students. This allows teachers to get direct and immediate information that can be used to shape both their individual and classroom instruction in a way that benefits student growth. Reading specialists can also benefit by using DRA2 to assess and monitor at-risk and struggling students. Note that it is important to consider all of the information provided by the DRA2 to: (1) determine a student’s Independent reading level; and (2) identify areas that the student needs to focus on next as well as possible interventions. Use of only select components of the DRA2 will not allow one to determine the student’s overall reading ability and may not lead to comprehensive understanding of his or her reading skills and abilities. The following presents an overview of how DRA2 is administered. The reader is referred to the DRA2 Teacher Guide for more detailed information on its administration. Step 1: Reading Engagement DRA2 begins with recording information about students’ past and present reading in order to determine their current reading engagement. The questions asked differ based on each student’s unique developmental levels. For example, at Levels A–3, the reading preference questions ask for information about who reads with or to them and what stories they like most. In DRA2 4–8, the reading preference and self-assessment/goal setting questions ask about what books students have finished reading over the last couple of months; what types of reading material they like, and why; what criteria is used to select reading materials for independent reading; what are three strengths they have as a reader; what are their current goals as a reader; and to explain how they plan to do achieve their goals. Step 2: Oral Reading In the second step of the assessment, teachers gather information about students’ oral reading skills. Typically the teacher offers a pre-selected group of three or four books at
DRA2 T e ch n ic a l Man u a l 29
or near the student’s reading level and then asks the student to select the book that seems right for them and is not too easy or too hard. However, for a student reading at Levels A–3, the teacher selects the book for them and reads one or two pages to introduce the text pattern. For students reading at Levels 4–16, the teacher introduces the text they have selected and then asks the student to predict outcomes based on an examination of the illustrations or photos. For Levels 18–80, the teacher introduces the text they have selected and then asks the student to read aloud a specific portion of the text. While the student reads aloud, the teacher uses the Teacher Observation Guide to record notes about the student’s oral reading behaviors. In this way the teacher is able to determine whether the student’s oral reading ability is at a high-enough level to merit continuing the assessment. If it is, the teacher continues to the next step. Step 3: Comprehension/Printed Language Concepts At levels A-3, the DRA2 addresses printed language concepts, such as students’ ability to point to words with a consistent one-to-one match. At levels 4-80, comprehension is evaluated. To assess comprehension, students reading at Levels 4–24 orally retell the story or important ideas. At Levels 18–24, students read the entire story silently and then retell what they’ve read about. If the teacher feels the student knows more than their retelling has indicated, he or she may prompt the student to tell more by asking additional, scripted questions. Students reading at Levels 28-38 read the entire story silently and then respond orally or in writing to specific comprehension questions and prompts in the Student Booklet. They are also required to provide a summary of the story or book. Students reading at Levels 40–80 silently read the entire story and then independently write a summary and responses to comprehension questions in the Student Booklet. Note that for struggling students or those who have an IEP, teachers may choose to record students’ responses in the Student Booklet rather than having students write the information themselves. Step 4: Teacher Analysis/Scoring The fourth step of the assessment is teacher analysis and scoring. Note that certain portions of the scoring process occur during the one-on-one DRA2 conference (see next section on scoring). The teacher analyzes the information gathered during the student’s oral reading and evaluates the student’s retelling/summary and comprehension responses in order to complete the Continuum and Focus for Instruction. In Levels 28–80, the teacher incorporates information in the Student Reading Survey and Student Booklet in their analysis.
How is the DRA2 scored?
Teachers use the Teacher Observation Guide to record observations during the conference; to describe fluency; to calculate accuracy and oral reading rate; to determine
DRA2 T e ch n ic a l Man u a l 30
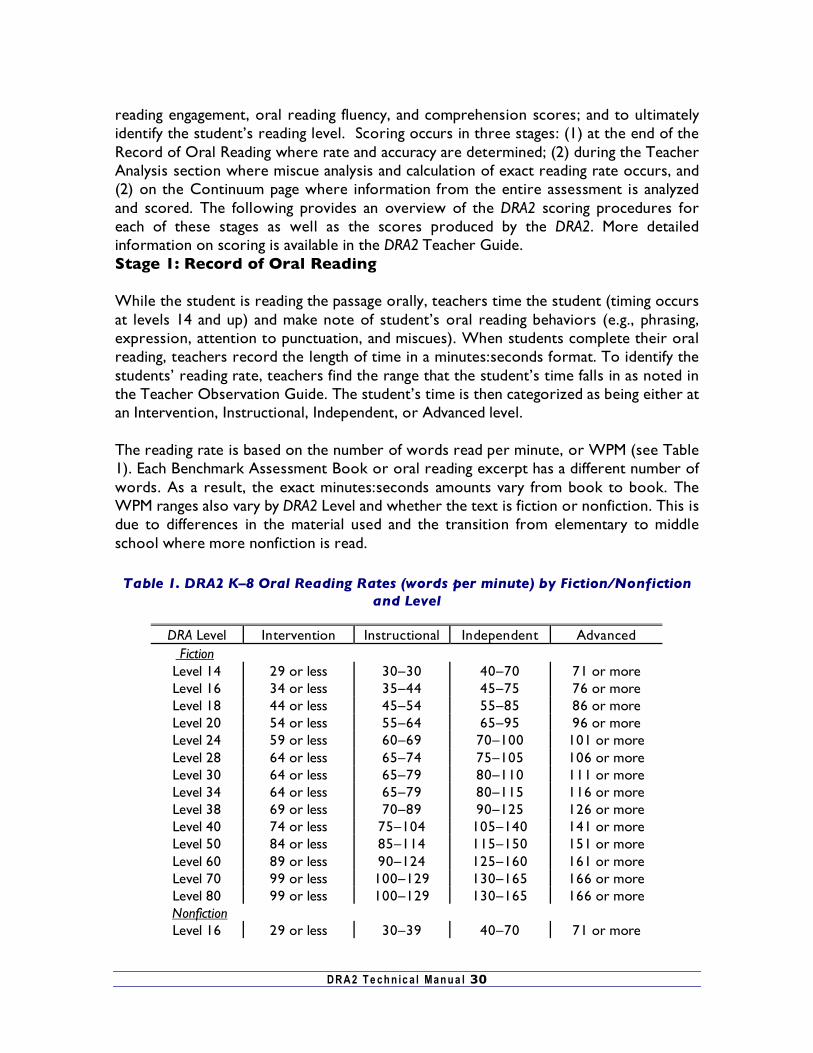
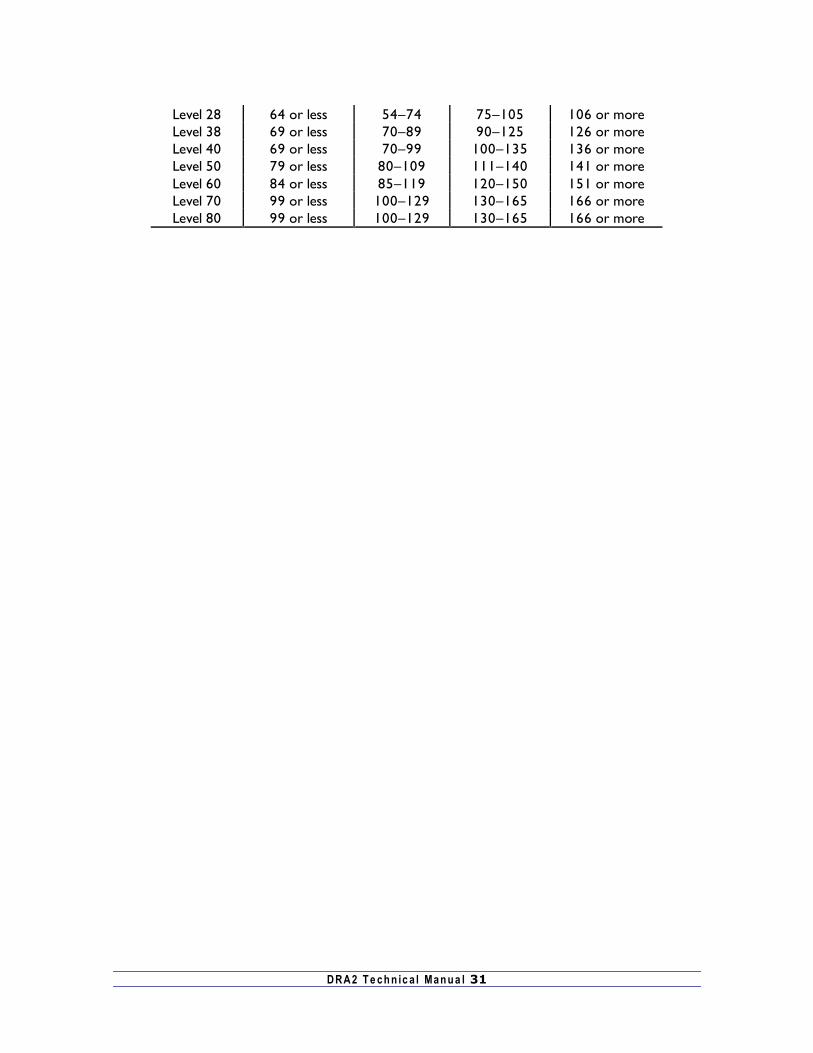
reading engagement, oral reading fluency, and comprehension scores; and to ultimately identify the student’s reading level. Scoring occurs in three stages: (1) at the end of the Record of Oral Reading where rate and accuracy are determined; (2) during the Teacher Analysis section where miscue analysis and calculation of exact reading rate occurs, and (2) on the Continuum page where information from the entire assessment is analyzed and scored. The following provides an overview of the DRA2 scoring procedures for each of these stages as well as the scores produced by the DRA2. More detailed information on scoring is available in the DRA2 Teacher Guide. Stage 1: Record of Oral Reading While the student is reading the passage orally, teachers time the student (timing occurs at levels 14 and up) and make note of student’s oral reading behaviors (e.g., phrasing, expression, attention to punctuation, and miscues). When students complete their oral reading, teachers record the length of time in a minutes:seconds format. To identify the students’ reading rate, teachers find the range that the student’s time falls in as noted in the Teacher Observation Guide. The student’s time is then categorized as being either at an Intervention, Instructional, Independent, or Advanced level. The reading rate is based on the number of words read per minute, or WPM (see Table 1). Each Benchmark Assessment Book or oral reading excerpt has a different number of words. As a result, the exact minutes:seconds amounts vary from book to book. The WPM ranges also vary by DRA2 Level and whether the text is fiction or nonfiction. This is due to differences in the material used and the transition from elementary to middle school where more nonfiction is read. Table 1. DRA2 K–8 Oral Reading Rates (words per minute) by Fiction/Nonfiction
and Level
DRA Level Intervention Instructional Independent Advanced Fiction
Level 14 29 or less 30–30 40–70 71 or more Level 16 34 or less 35–44 45–75 76 or more Level 18 44 or less 45–54 55–85 86 or more Level 20 54 or less 55–64 65–95 96 or more Level 24 59 or less 60–69 70–100 101 or more Level 28 64 or less 65–74 75–105 106 or more Level 30 64 or less 65–79 80–110 111 or more Level 34 64 or less 65–79 80–115 116 or more Level 38 69 or less 70–89 90–125 126 or more Level 40 74 or less 75–104 105–140 141 or more Level 50 84 or less 85–114 115–150 151 or more Level 60 89 or less 90–124 125–160 161 or more Level 70 99 or less 100–129 130–165 166 or more Level 80 99 or less 100–129 130–165 166 or more
Nonfiction Level 16 29 or less 30–39 40–70 71 or more
DRA2 T e ch n ic a l Man u a l 31
Level 28 64 or less 54–74 75–105 106 or more Level 38 69 or less 70–89 90–125 126 or more Level 40 69 or less 70–99 100–135 136 or more Level 50 79 or less 80–109 111–140 141 or more Level 60 84 or less 85–119 120–150 151 or more Level 70 99 or less 100–129 130–165 166 or more Level 80 99 or less 100–129 130–165 166 or more
DRA2 Technical Manual 32
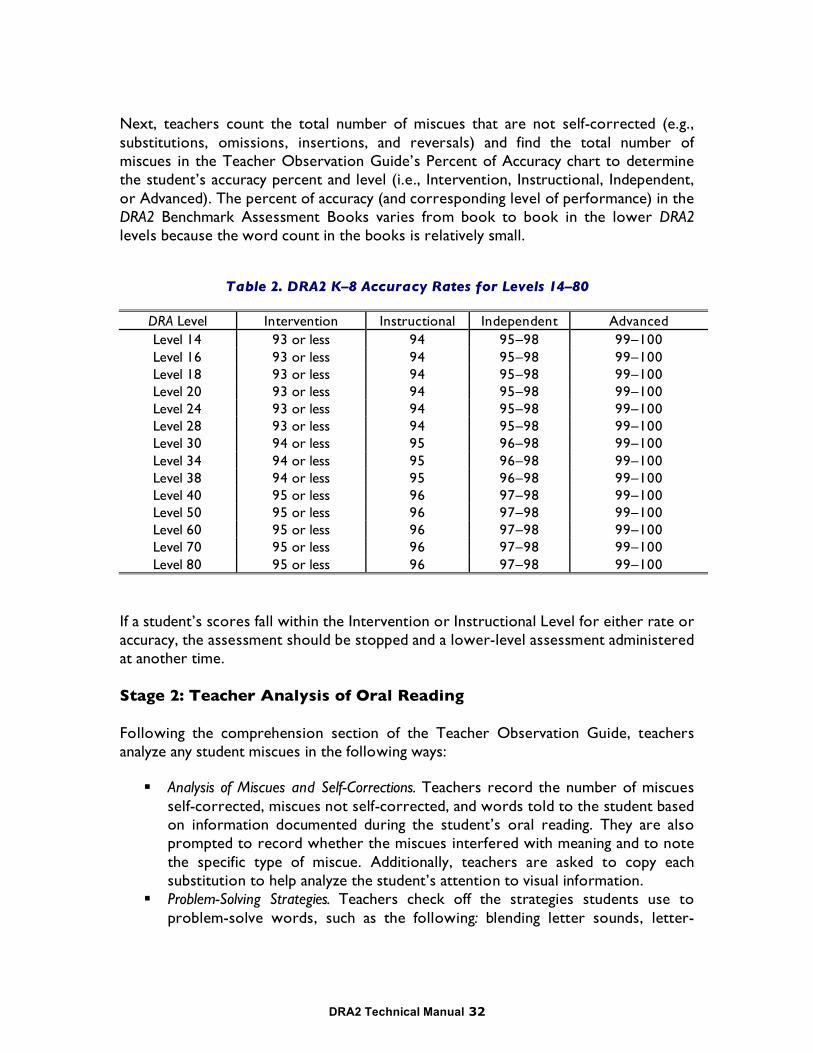
Next, teachers count the total number of miscues that are not self-corrected (e.g., substitutions, omissions, insertions, and reversals) and find the total number of miscues in the Teacher Observation Guide’s Percent of Accuracy chart to determine the student’s accuracy percent and level (i.e., Intervention, Instructional, Independent, or Advanced). The percent of accuracy (and corresponding level of performance) in the DRA2 Benchmark Assessment Books varies from book to book in the lower DRA2 levels because the word count in the books is relatively small.
Table 2. DRA2 K–8 Accuracy Rates for Levels 14–80
DRA Level Intervention Instructional Independent Advanced Level 14 93 or less 94 95–98 99–100 Level 16 93 or less 94 95–98 99–100 Level 18 93 or less 94 95–98 99–100 Level 20 93 or less 94 95–98 99–100 Level 24 93 or less 94 95–98 99–100 Level 28 93 or less 94 95–98 99–100 Level 30 94 or less 95 96–98 99–100 Level 34 94 or less 95 96–98 99–100 Level 38 94 or less 95 96–98 99–100 Level 40 95 or less 96 97–98 99–100 Level 50 95 or less 96 97–98 99–100 Level 60 95 or less 96 97–98 99–100 Level 70 95 or less 96 97–98 99–100 Level 80 95 or less 96 97–98 99–100
If a student’s scores fall within the Intervention or Instructional Level for either rate or accuracy, the assessment should be stopped and a lower-level assessment administered at another time. Stage 2: Teacher Analysis of Oral Reading Following the comprehension section of the Teacher Observation Guide, teachers analyze any student miscues in the following ways:
Analysis of Miscues and Self-Corrections. Teachers record the number of miscues self-corrected, miscues not self-corrected, and words told to the student based on information documented during the student’s oral reading. They are also prompted to record whether the miscues interfered with meaning and to note the specific type of miscue. Additionally, teachers are asked to copy each substitution to help analyze the student’s attention to visual information.
Problem-Solving Strategies. Teachers check off the strategies students use to problem-solve words, such as the following: blending letter sounds, letter-
DRA2 T e ch n ic a l Man u a l 33
sound clusters, onset and rime, knowledge of spelling patterns, syllables, rereading, or no observable behaviors.
Teachers also have the opportunity at this point to calculate the student’s exact oral reading rate. To perform the calculation, teachers must first convert the student’s reading time from minutes:seconds to seconds only. Then the number of words in the passage is divided by the student’s time (in seconds); the result is multiplied by 60 to arrive at the student’s exact words-per-minute reading rate. Stage 3: Continuum The final analysis and scoring section is the DRA2 Continuum in the Teacher Observation Guide. There are three main sections within the Continuum: Reading Engagement, Oral Reading Fluency, and Comprehension. Each item within these three sections is analyzed and scored separately using a 4-point scale where 1=Intervention level of performance; 2=Instructional level of performance; 3=Independent level of performance; and 4=Advanced level of performance. The individual scores within each section are added together to generate a Reading Engagement score, an Oral Reading Fluency Score, and a Comprehension score. These scores are then recorded at the top of the first page of the Teacher Observation Guide. Note that in Levels 28–80, students’ Comprehension score is also recorded at the top of the Continuum. This is done to help determine whether students reading at Levels 28–80 are comprehending at a grade-appropriate level. If students are reading with grade-appropriate accuracy and reading rate but with an Intervention level of performance in comprehension, students should be reassessed at another time with a lower-level Benchmark Assessment Book. The following section describes the major scores provided by the DRA2 in more detail. Reading Engagement Reading Engagement describes the student’s level of engagement with reading. Engaged readers read often, know books and authors, and have goals for themselves as readers. Teachers rate students’ responses in the Student Reading Survey. Each item--Wide Reading and Self-Assessment/Goal Setting--is rated on the 4-point scale. The Reading Engagement score is the sum of the ratings for Wide Reading and Self-Assessment/Goal Setting. Scores range from 2 to 8, where scores of 2 to 3 indicate an Intervention level of performance, scores of 4 to 5 indicate an Instructional level of performance, scores of 6 to 7 indicate an Independent level of performance, and a score of 8 indicates an Advanced level of performance. Oral Reading Fluency At levels 14-80, Oral Reading Fluency describes the student’s oral reading behaviors in terms of expression, phrasing, rate, and accuracy. At levels 4-12, Oral Reading Fluency
DRA2 T e ch n ic a l Man u a l 34
is comprised of phrasing, monitoring/self-corrections, problem-solving unknown words, and accuracy.
Expression describes how the student sounds when he or she reads the text. Different scoring criteria are used for fiction and nonfiction texts for Expression. Expression in nonfiction texts reflects a deeper understanding of the text through the emphasis of key words and phrases. With fiction texts, the student’s understanding of the text is demonstrated with expression. In a Level 40 fiction text, for example, the descriptor “Monotone; very little expression” scores 1 point; the descriptor “Expression reflects mood, pace, and tension most of the time” scores 4 points.
Phrasing describes the length of the phrases the student uses during oral reading (e.g., how often the student pauses while reading a sentence).
Rate describes the number of words read per minute and is scored on a four-point scale.
Accuracy describes the percentage of words read correctly during the oral reading.
Monitoring/Self-Corrections reflects the extent to which the student self-corrects miscues while reading.
Problem-Solving Unknown Words describes the extent to which the student attempts to problem-solve unknown words through cues or relies on teacher assistance.
The Oral Reading Fluency score is the sum of the four indicators (e.g., for levels 14-80, Expression, Phrasing, Rate, and Accuracy). Scores range from 4 to 16, where scores of 4 to 6 indicate an Intervention level of performance, scores of 7 to 10 indicate an Instructional level of performance, scores of 11 to 14 indicate an Independent level of performance, and scores of 15 to 16 indicate an Advanced level of performance. Comprehension/Printed Language Concepts Comprehension describes the student’s ability to retell and understand the text including the main ideas, key facts, and characters, events, or topics. At lower levels (A-3), printed language concepts are evaluated. The teacher uses the items within the Comprehension/ Printed Language Concepts section of the Continuum in the Teacher Observation Guide to score the student’s level of understanding. The scoring criteria for Intervention, Instructional, Independent, and Advanced levels of performance increase in expectation as the DRA2 Level goes up to reflect students’ growing comprehension and language skills. At Levels A–1, the student’s use of printed language concepts is evaluated, specifically directionality and one-to-one correspondence. At Levels 2–3, evaluation of students’ use of words/letters is added. At Levels 4–24, in addition to evaluating the student’s retelling of the story (including the sequence of events, characters and details, and key vocabulary), the teacher evaluates the student’s preview or predictions about the story, the level of interpretation of the story, the level of reflection on the story, and how
DRA2 T e ch n ic a l Man u a l 35
much teacher support the student required to retell the story. At Levels 4–16 only, a student’s performance is evaluated for making connections with the text. At Levels 28–80, teachers rate the student’s responses to the questions and prompts in the Student Booklet. At Levels 28–38, teachers also evaluate the use of key vocabulary in the summary. At Levels 40–80, teachers additionally evaluate the skill of Metacognitive Awareness. Each task is rated on a four-point scale. Different descriptions are used for fiction and nonfiction texts for Summary and Reflection and also for texts at Levels 28–38 versus Levels 40–80. For a more thorough description of the various indicators used to measure Comprehension/Printed Language Concepts, the reader is referred to the DRA2 Teacher Guide.
The teacher selects the best description of the student’s performance on each indicator and sums the score to obtain the Comprehension score. Comprehension scores range in DRA2 K–3 from 7 to 28 (except Level 40, which ranges from 6–24); and in DRA2 4–8, scores range from 6 to 24. With DRA2 K–3 (except Level 40), scores of 7 to 13 reflect an Intervention level of performance; scores of 14 to 18 reflect an Instructional level of performance; scores of 19 to 25 reflect an Independent level of performance; and scores of 26 to 28 reflect an Advanced level of performance. With DRA2 4–8, and DRA2 K–3, Level 40, scores of 6 to 11 indicate an Intervention level of performance, scores of 12 to 16 indicate an Instructional level of performance, scores of 17 to 22 indicate an Independent Level of performance, and scores of 23 to 24 indicate an Advanced Level of performance.
Overall Performance Level In DRA2 K–3, students’ overall performance level can be determined to be either Emerging (Levels A–12), Developing (Levels A–12), Intervention (Levels 14–40), Instructional (Levels 14–40), Independent (Levels A-40), or Advanced (Levels 4–40). In DRA2 4–8, students’ performance on the assessment can be reflected in these four scoring categories: Intervention, Instructional, Independent, or Advanced. It is important to note that the student’s total score in Oral Reading/Oral Reading Fluency and the student’s total score in Comprehension/ Printed Language Concepts determines whether a text was read at an independent, instructional, or advanced level.
Independent: The total score for both Oral Reading/Oral Reading Fluency AND the total score for Comprehension/Printed Language Concepts must be at least within the Independent range on the Continuum.
Instructional: The total score for Oral Reading/Oral Reading Fluency OR the total score for Comprehension/Printed Language Concepts is within the Instructional range on the Continuum.
Advanced: The total score for both Oral Reading/Oral Reading Fluency AND the total score for Comprehension/Printed Language Concepts must be within the Advanced range on the Continuum.
DRA2 T e ch n ic a l Man u a l 36
Descriptors that fall within the Instructional or Intervention categories indicate a need for instruction or intervention. Descriptors that fall within the Independent and Advanced categories indicate strengths and areas to reinforce and extend.
Independent Reading Level Independent Reading Level is the reading level at which the student can engage with the text independently (e.g., the teacher does not provide any scaffolding). The Independent Reading Level is based on the following criteria:
Oral Reading Fluency: For oral reading fluency, students must score within the Independent level of performance for reading rate AND percent of accuracy as identified in the Teacher Observation Guide for each Benchmark Assessment Book. If a student scores below the Independent level of performance, then he or she is missing a significant number of words and will struggle with comprehension because the reading is being interrupted by unfamiliar words. Note that reading rate is not assessed until Level 14, or typically the end of first grade because at kindergarten and early first grade, students are just learning to access passages and a significant amount of text needs to be read to determine fluency.
Comprehension: For Independent level of performance, in DRA2 K–3, students must achieve a Comprehension score of at least 19. In DRA2 4–8, students need to score at least 17 in Comprehension. If a student scores between 12 and 16, AND scored within the Independent performance level in Oral Reading Fluency, then that student may stay at that reading level and does not need to be reassessed at a lower level. However, the assessed level is the student’s Instructional level of performance.
Stage of Reading Development
If a student’s performance is scored as Independent, teachers can identify the reading stage as emergent, early, transitional, or extending, depending on the level of the DRA2 assessment administered. If a student is assessed with DRA2 K–3, the student’s reading stage can be found at the top right of the completed Continuum page in the Teacher Observation Guide. The DRA2 K–3 Student Book Graph also identifies the reading stage on the left side of the graph. In DRA2 4–8, the reading stage is identified on the DRA2 4–8 Student Book Graph along the left side of the graph.
How should DRA2 scores be interpreted and shared?
Interpreting DRA2 Scores
DRA2 T e ch n ic a l Man u a l 37
The authors of DRA2 K–8 designed the assessment to inform and guide instruction by helping teachers: (1) assess a student’s Independent reading level; and (2) diagnose a student’s strengths and weaknesses in relation to Reading Engagement, Oral Reading Fluency, and Comprehension. DRA2 is developmentally appropriate for all students, not just those considered at risk for failure. The reason that some students do not perform well may be that they have not had adequate instruction and practice. A student’s Independent reading level does not reflect ability alone; it also reflects the student’s experiences and the opportunities for good instruction to which the student has been exposed. In order to determine a student’s Independent reading level, the teacher needs to guide the student through the complete assessment to determine Reading Engagement, Oral Reading Fluency, and Comprehension. Even if the student is reading accurately and effortlessly, it is not appropriate to skip some levels or portions of the test. If the student is able to read the text but does not have adequate comprehension or oral reading fluency, then the teacher should try a lower text level. This information will indicate instructional areas on which the teacher should focus. It may be that the student does not know how to do a retelling. If the student has adequate accuracy but is reading very slowly, further assessment at a lower level needs to be conducted to determine the student’s Independent reading level. If the goal for the student is to work on comprehension or fluency, the teacher should select text a level or two below the student’s Independent reading level. Teachers should conduct further diagnostic assessments for students who plateau on accuracy and subsequently do not progress. When the text becomes too difficult for a student to read, teachers should look further to determine what the problem is: comprehension or decoding. In first through third grade, students also should be assessed for proficiency with informational text. A student’s low performance with these passages can signal a lack of instruction or exposure to this genre.
Sharing DRA2 Scores The results of DRA2 can be shared with administrators, parents, and students. The Class Reporting Form is ideal for sharing assessment results with school and/or district administrators. The information on the Continuum and the Student Assessment Folder can be shared with parents to help them understand and appreciate their child’s reading progress and needs in Reading Engagement, Oral Reading Fluency, and Comprehension. After seeing this information, parents also have a better understanding of what teachers are trying to accomplish. Many of the statements on the Continuum may be used on students’ progress reports as well. Discussing the Student Book Graph on the back of the Student Assessment Folder helps parents see their child’s present reading level as well as their progress over the years.
DRA2 T e ch n ic a l Man u a l 38
It is important for this information to be shared with students, as well, particularly for those reading at Levels 28–80. It helps them know what is expected and provides them with the language to discuss and evaluate their own performance as readers. The Continuum also enables students to identify their strengths and areas for improvement. and helps them to select appropriate reading goals in Reading Engagement, Oral Reading Fluency, and/or Comprehension. When students reading at Levels 28–80 are given the opportunity to set personal reading goals, it gives them a sense of ownership, reinforces a purpose for their work, and fosters a more positive attitude toward learning and reading.
What types of training are available? Training is integral to administer the DRA2 with accuracy and reliability. There are many options for training teachers.
The first option is for the teacher to watch the appropriate DRA2 K–3 or DRA2 4–8 Training DVD with the assessment materials in hand. This can be done individually or in small groups. Each Training DVD is 90 minutes long, provides step-by-step implementation instructions, and includes conferences at each stage of reading development, as well as a discussion of a conference with Joetta Beaver.
The second option for training are recorded tutorials that can be located at http://www.mypearsontraining.com/products/dra2/tutorials.asp. These pre-recorded tutorials are available on-demand and cover a variety of topics ranging from basic product orientation to more in-depth sessions describing how to score the assessment. The final option for training is on-site professional development. In this approach, on-site professional development is delivered by highly-trained educational consultants. The consultants offer a flexible model for schools who want to address particular instructional needs. During the course of a school day, an experienced Pearson Consultant provides expertise and support to teachers, coaches, and/or leaders. Flexible services may include observation, coaching, data analysis, lesson planning, and problem-solving as needed.
DRA2 T e ch n ic a l Man u a l 39
Reliability of the DRA2
Reliability refers to the stability or consistency of assessment results. That is, it refers to the question: “Can I rely on assessment scores being consistent across time, people, or content?” Consider for example a test that lacks reliability. Examiner A tests a student and, based on the results of the test, identifies the student as needing extensive remediation. Examiner B tests the same student on the following day and determines, based on the results, that the student is gifted. Such a measure would lack evidence of reliability since the results are so obviously inconsistent – and such large differences could not be attributed to actual changes in the students’ ability level given the small amount of time that elapsed between assessments. Although an extreme example, it demonstrates the importance of using an assessment measure that yields consistent results across different raters, different periods of time, different samples of tasks (content), and so forth2. Given the characteristics of the DRA2, four methods were used to examine the reliability of this assessment: internal consistency, parallel equivalency reliability, test-retest reliability, and inter-rater reliability. Results from each of these methods are presented in the following sections. In addition, while overall results are presented for the DRA2, whenever possible and as applicable, findings are also disaggregated by grade level so as to determine whether results vary as a function of whether the student is early primary (grades 1-3 and assessed via DRA2 K-3 kit) or upper primary/middle school (grades 4-8 and assessed via DRA2 4-8 kit).
Internal Consistency Reliability Internal consistency reliability is a commonly used psychometric measure which tells us how well different items are measuring the same variable or behavioral trait. This is important because a group of items that are supposed to be measuring the same thing should be highly related to one another. With the DRA2, four indicators are used to
2 While a good assessment needs to be reliable in that it yields consistent results across different conditions, it is unrealistic to expect assessment results to be perfectly consistent. Elaborating on this, all assessments have a certain degree of measurement error; however, measures with less measurement error will have greater reliability. For example, even if tests are given in close succession, some variation can still be expected from test-retest reliability due to such extraneous factors as fatigue, attention, memory fluctuations, guessing, etc. However, good measures would yield fairly similar assessment results from Time 1 to Time 2 and high correlations.
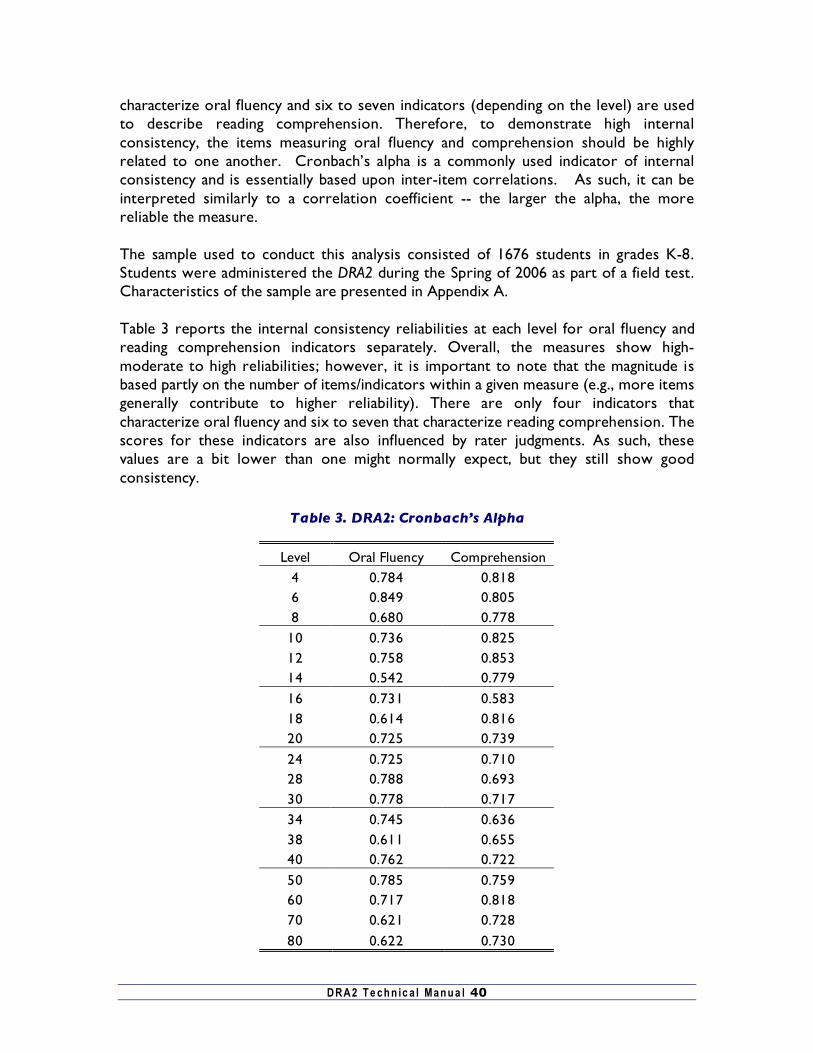
DRA2 T e ch n ic a l Man u a l 40
characterize oral fluency and six to seven indicators (depending on the level) are used to describe reading comprehension. Therefore, to demonstrate high internal consistency, the items measuring oral fluency and comprehension should be highly related to one another. Cronbach’s alpha is a commonly used indicator of internal consistency and is essentially based upon inter-item correlations. As such, it can be interpreted similarly to a correlation coefficient -- the larger the alpha, the more reliable the measure. The sample used to conduct this analysis consisted of 1676 students in grades K-8. Students were administered the DRA2 during the Spring of 2006 as part of a field test. Characteristics of the sample are presented in Appendix A. Table 3 reports the internal consistency reliabilities at each level for oral fluency and reading comprehension indicators separately. Overall, the measures show high-moderate to high reliabilities; however, it is important to note that the magnitude is based partly on the number of items/indicators within a given measure (e.g., more items generally contribute to higher reliability). There are only four indicators that characterize oral fluency and six to seven that characterize reading comprehension. The scores for these indicators are also influenced by rater judgments. As such, these values are a bit lower than one might normally expect, but they still show good consistency.
Table 3. DRA2: Cronbach’s Alpha
Level Oral Fluency Comprehension 4 0.784 0.818 6 0.849 0.805 8 0.680 0.778
10 0.736 0.825 12 0.758 0.853 14 0.542 0.779 16 0.731 0.583 18 0.614 0.816 20 0.725 0.739 24 0.725 0.710 28 0.788 0.693 30 0.778 0.717 34 0.745 0.636 38 0.611 0.655 40 0.762 0.722 50 0.785 0.759 60 0.717 0.818 70 0.621 0.728 80 0.622 0.730
DRA2 T e ch n ic a l Man u a l 41
Passage Equivalency There are two to four passages that are available at each level of the DRA2. These include a combination of fiction and non-fiction passages; however, when determining individuals’ fluency or comprehension scores, it should be a matter of indifference as to which passage (at a given level) the student receives. Stated differently, students should get similar scores, on average, irrespective of which passage they receive within a given level. Passage equivalency looks at the extent to which DRA2 results are consistent or reliable over different samples of tasks (e.g., reading passages) within a given level. While passage equivalency can be examined using a one-way ANOVA, because there is likely some interaction between fluency and comprehension, both of these scores were examined simultaneously using a MANOVA. The analysis was conducted at each level separately, with the confidence level set to 0.05 (see Table 4). The sample consisted of students who were administered the DRA2 in the Spring of 2006 and 2007. Characteristics of these samples are presented in the Appendix. Table 4 reports the complete results of the MANOVA, although the primary statistics of interest with regard to equivalency are the p-values for Passage. The Intercept results characterize the amount of variability within passages and the Passage results characterize the amount of variability between passages. By far, the largest portion of the total variability at each level is explained by within-passage differences. On the other hand, there is very little between-passage variation. This is what one should expect to see if all of the passages at a given level are equivalent. With the exception of oral fluency at level 4 and reading comprehension at level 34, there are no significant differences between the difficulties of passages at the various levels. This suggests that in most cases, the passages at each level are equivalent and can be used interchangeably. This also shows that the fiction and non-fiction passages at levels 16, 28, and 38-80 can be considered equivalent.
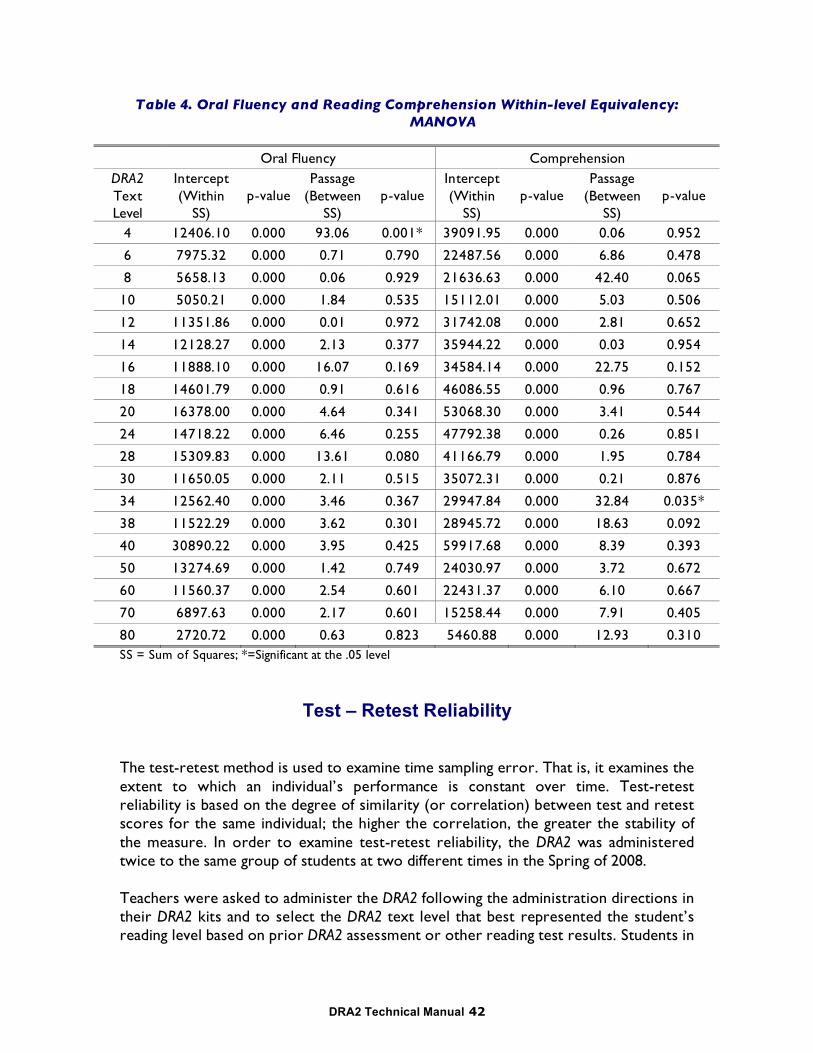
DRA2 Technical Manual 42
Table 4. Oral Fluency and Reading Comprehension Within-level Equivalency: MANOVA
Oral Fluency Comprehension DRA2 Text Level
Intercept (Within
SS) p-value
Passage (Between
SS) p-value
Intercept (Within
SS) p-value
Passage (Between
SS) p-value
4 12406.10 0.000 93.06 0.001* 39091.95 0.000 0.06 0.952
6 7975.32 0.000 0.71 0.790 22487.56 0.000 6.86 0.478
8 5658.13 0.000 0.06 0.929 21636.63 0.000 42.40 0.065
10 5050.21 0.000 1.84 0.535 15112.01 0.000 5.03 0.506
12 11351.86 0.000 0.01 0.972 31742.08 0.000 2.81 0.652
14 12128.27 0.000 2.13 0.377 35944.22 0.000 0.03 0.954
16 11888.10 0.000 16.07 0.169 34584.14 0.000 22.75 0.152
18 14601.79 0.000 0.91 0.616 46086.55 0.000 0.96 0.767
20 16378.00 0.000 4.64 0.341 53068.30 0.000 3.41 0.544
24 14718.22 0.000 6.46 0.255 47792.38 0.000 0.26 0.851
28 15309.83 0.000 13.61 0.080 41166.79 0.000 1.95 0.784
30 11650.05 0.000 2.11 0.515 35072.31 0.000 0.21 0.876
34 12562.40 0.000 3.46 0.367 29947.84 0.000 32.84 0.035*
38 11522.29 0.000 3.62 0.301 28945.72 0.000 18.63 0.092
40 30890.22 0.000 3.95 0.425 59917.68 0.000 8.39 0.393
50 13274.69 0.000 1.42 0.749 24030.97 0.000 3.72 0.672
60 11560.37 0.000 2.54 0.601 22431.37 0.000 6.10 0.667
70 6897.63 0.000 2.17 0.601 15258.44 0.000 7.91 0.405
80 2720.72 0.000 0.63 0.823 5460.88 0.000 12.93 0.310 SS = Sum of Squares; *=Significant at the .05 level
Test – Retest Reliability The test-retest method is used to examine time sampling error. That is, it examines the extent to which an individual’s performance is constant over time. Test-retest reliability is based on the degree of similarity (or correlation) between test and retest scores for the same individual; the higher the correlation, the greater the stability of the measure. In order to examine test-retest reliability, the DRA2 was administered twice to the same group of students at two different times in the Spring of 2008. Teachers were asked to administer the DRA2 following the administration directions in their DRA2 kits and to select the DRA2 text level that best represented the student’s reading level based on prior DRA2 assessment or other reading test results. Students in
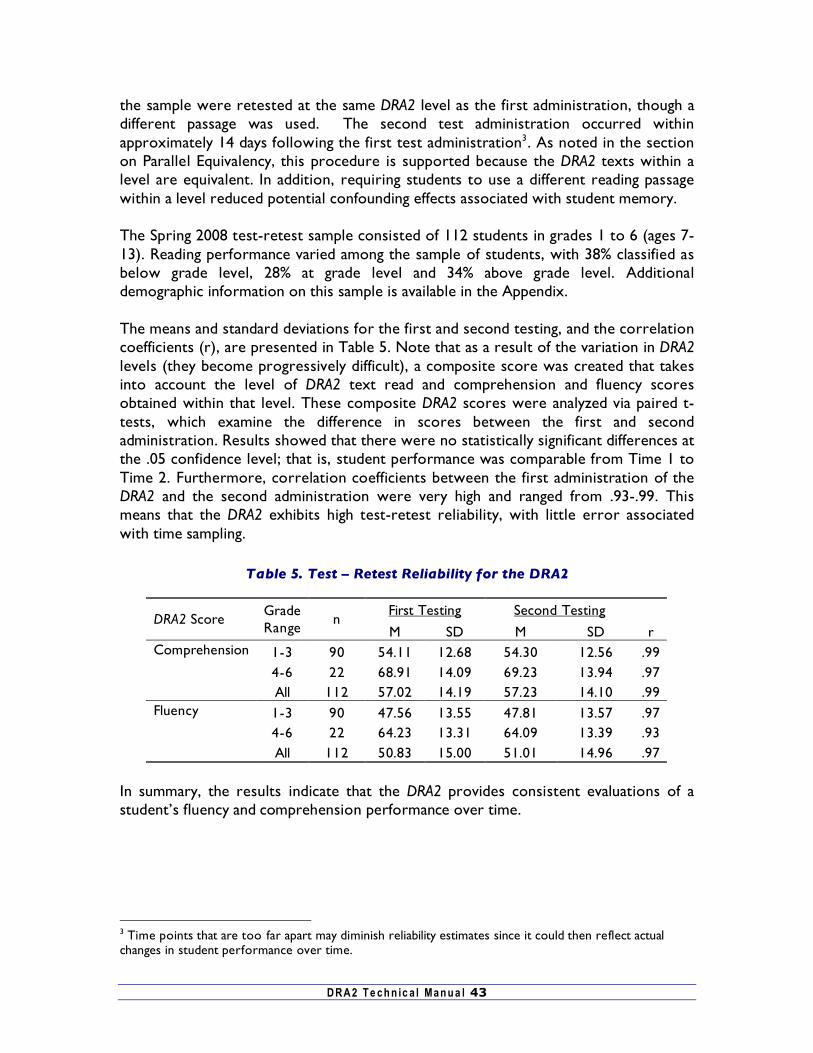
DRA2 T e ch n ic a l Man u a l 43
the sample were retested at the same DRA2 level as the first administration, though a different passage was used. The second test administration occurred within approximately 14 days following the first test administration3. As noted in the section on Parallel Equivalency, this procedure is supported because the DRA2 texts within a level are equivalent. In addition, requiring students to use a different reading passage within a level reduced potential confounding effects associated with student memory. The Spring 2008 test-retest sample consisted of 112 students in grades 1 to 6 (ages 7-13). Reading performance varied among the sample of students, with 38% classified as below grade level, 28% at grade level and 34% above grade level. Additional demographic information on this sample is available in the Appendix. The means and standard deviations for the first and second testing, and the correlation coefficients (r), are presented in Table 5. Note that as a result of the variation in DRA2 levels (they become progressively difficult), a composite score was created that takes into account the level of DRA2 text read and comprehension and fluency scores obtained within that level. These composite DRA2 scores were analyzed via paired t-tests, which examine the difference in scores between the first and second administration. Results showed that there were no statistically significant differences at the .05 confidence level; that is, student performance was comparable from Time 1 to Time 2. Furthermore, correlation coefficients between the first administration of the DRA2 and the second administration were very high and ranged from .93-.99. This means that the DRA2 exhibits high test-retest reliability, with little error associated with time sampling.
Table 5. Test – Retest Reliability for the DRA2
First Testing Second Testing DRA2 Score
Grade Range
n M SD M SD r
1-3 90 54.11 12.68 54.30 12.56 .99 4-6 22 68.91 14.09 69.23 13.94 .97
Comprehension
All 112 57.02 14.19 57.23 14.10 .99 1-3 90 47.56 13.55 47.81 13.57 .97 4-6 22 64.23 13.31 64.09 13.39 .93
Fluency
All 112 50.83 15.00 51.01 14.96 .97 In summary, the results indicate that the DRA2 provides consistent evaluations of a student’s fluency and comprehension performance over time.
3 Time points that are too far apart may diminish reliability estimates since it could then reflect actual changes in student performance over time.
DRA2 Technical Manual 44
Inter-Rater and Rater-Expert Reliabilities Many types of assessments, such as the DRA2, require judgment in scoring student responses. When raters are used to assign scores, it is reasonable to ask whether different raters would assign the same scores to a given student based upon the identical sample of student work. Inter-rater reliability addresses the question of “how well do two or more raters agree in their assessment of a given student’s work?” After all, if raters cannot agree on a particular score, subsequent analyses and use of the ratings will likely yield spurious results. Thus, in the case of the DRA2, it is important to examine the extent to which different raters assign the same level of performance to a given student. To examine inter-rater and rater-expert reliability, 30 students were tested by 26 independent raters. Raters consisted of existing users of the DRA2 that had substantial experience administering the DRA24. Raters were provided with audiotape recordings of DRA2 test administrations as well as copies of written student DRA2 work. Two groups of raters (n=13) provided independent ratings for 15 students each. Thus, multiple raters were used to assess inter-rater reliability in order to ensure that a robust estimate of reliability would be provided by examining the consistency of ratings among multiple individuals. Both groups of raters provided ratings for students at both the early primary and upper primary levels (grades 2-5) who read a range of DRA2 texts (levels 18-60) and who represented a wide range of ability levels (from intervention to advanced). Inter-rater reliability estimates are provided below and “are based on the assumption that reasonable observers should be able to come to exact agreement about how to apply the various levels of a scoring rubric to the observed behaviors. If two judges come to exact agreement on how to use the rating scale to score behaviors, then the two judges may be said to share a common interpretation of the construct” (Stemler, 2004, p. 2). Based upon this assumption, two types of reliability estimates are reported in Table 6. First, the degree of overall consensus among the raters in terms of their ratings for comprehension and fluency levels was computed. That is, when multiple scorers are rating the same student, what is the likelihood of those raters having exact agreement? The overall likelihood that two randomly selected raters were in exact agreement on the DRA2 score assigned to a given student was 66% for Fluency and 72% for Comprehension, respectively5 (see Table 6). First order agreement coefficients (Gwet’s Kappa) were also calculated. This kappa statistic was used because: (1) it adjusts for any chance-level agreement between raters that could coincidentally occur and thus, is a more accurate measure of agreement as compared to calculating simple percent agreement6, and (2) it can estimate agreement among multiple raters (Gwet, 2001). Note that unlike percent agreement, a kappa of zero does not mean that raters did not agree with one another. Rather, a value of zero means that raters did not agree with each other any 4 Raters had, on average, 2 years of experience using the DRA2 and had received 15 hours of training in the form of Pearson DRA2 webinar or video presentation(s), inservice by a DRA2 expert, and/or training from a Pearson DRA2 professional trainer. 5 100% of raters were within one level of each other for both fluency and comprehension. 6 Percent agreement may be artificially inflated when most observations fall into a single category (Stemler, 2004).
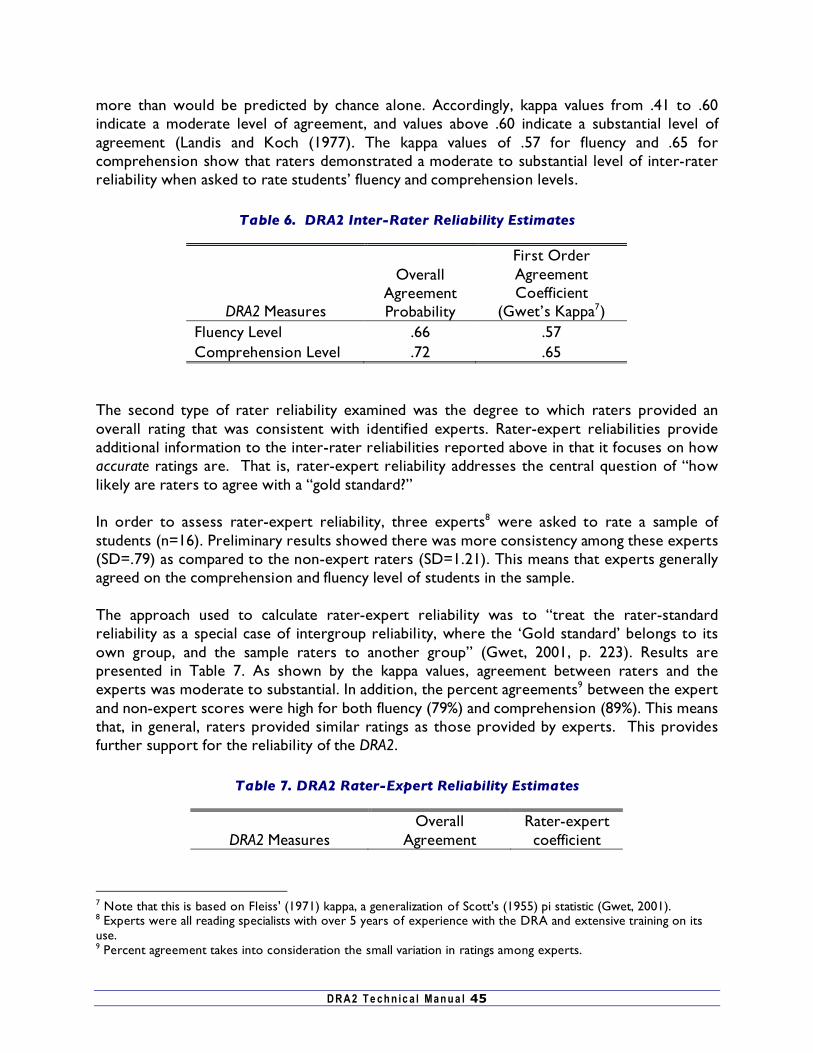
DRA2 T e ch n ic a l Man u a l 45
more than would be predicted by chance alone. Accordingly, kappa values from .41 to .60 indicate a moderate level of agreement, and values above .60 indicate a substantial level of agreement (Landis and Koch (1977). The kappa values of .57 for fluency and .65 for comprehension show that raters demonstrated a moderate to substantial level of inter-rater reliability when asked to rate students’ fluency and comprehension levels.
Table 6. DRA2 Inter-Rater Reliability Estimates
DRA2 Measures
Overall Agreement Probability
First Order Agreement Coefficient
(Gwet’s Kappa7) Fluency Level .66 .57 Comprehension Level .72 .65
The second type of rater reliability examined was the degree to which raters provided an overall rating that was consistent with identified experts. Rater-expert reliabilities provide additional information to the inter-rater reliabilities reported above in that it focuses on how accurate ratings are. That is, rater-expert reliability addresses the central question of “how likely are raters to agree with a “gold standard?” In order to assess rater-expert reliability, three experts8 were asked to rate a sample of students (n=16). Preliminary results showed there was more consistency among these experts (SD=.79) as compared to the non-expert raters (SD=1.21). This means that experts generally agreed on the comprehension and fluency level of students in the sample. The approach used to calculate rater-expert reliability was to “treat the rater-standard reliability as a special case of intergroup reliability, where the ‘Gold standard’ belongs to its own group, and the sample raters to another group” (Gwet, 2001, p. 223). Results are presented in Table 7. As shown by the kappa values, agreement between raters and the experts was moderate to substantial. In addition, the percent agreements9 between the expert and non-expert scores were high for both fluency (79%) and comprehension (89%). This means that, in general, raters provided similar ratings as those provided by experts. This provides further support for the reliability of the DRA2.
Table 7. DRA2 Rater-Expert Reliability Estimates
DRA2 Measures Overall
Agreement Rater-expert coefficient
7 Note that this is based on Fleiss' (1971) kappa, a generalization of Scott's (1955) pi statistic (Gwet, 2001). 8 Experts were all reading specialists with over 5 years of experience with the DRA and extensive training on its use. 9 Percent agreement takes into consideration the small variation in ratings among experts.
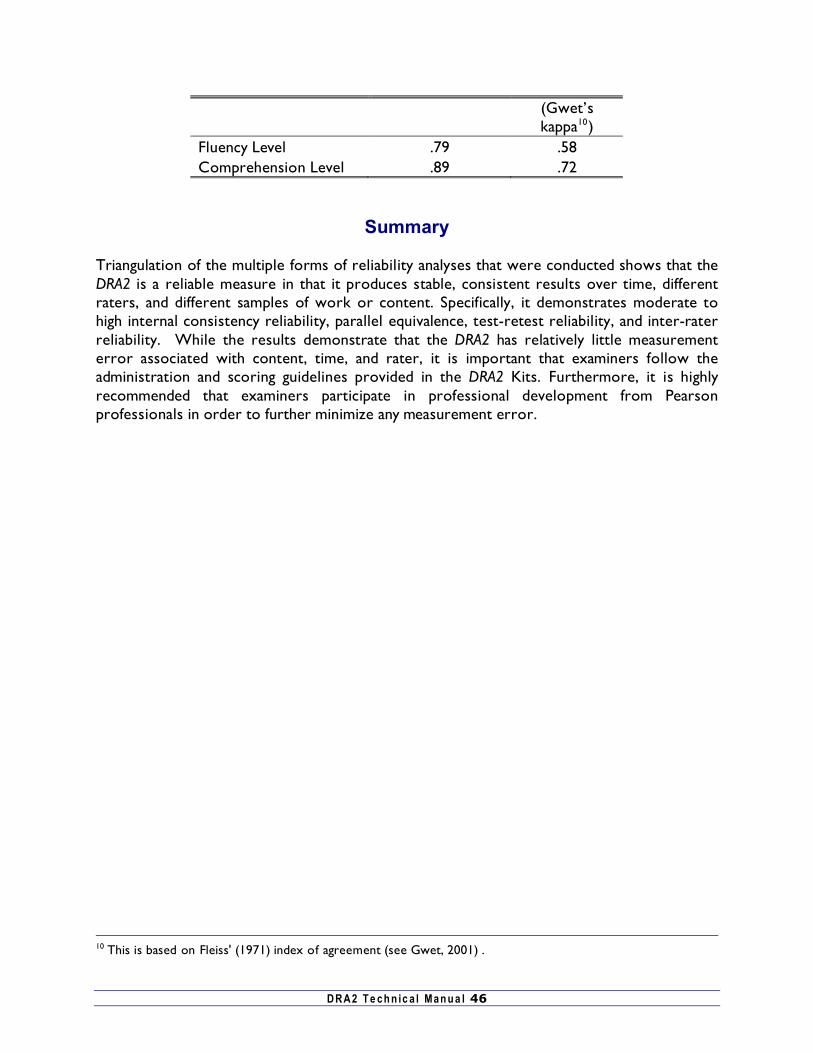
DRA2 T e ch n ic a l Man u a l 46
(Gwet’s kappa10)
Fluency Level .79 .58 Comprehension Level .89 .72
Summary Triangulation of the multiple forms of reliability analyses that were conducted shows that the DRA2 is a reliable measure in that it produces stable, consistent results over time, different raters, and different samples of work or content. Specifically, it demonstrates moderate to high internal consistency reliability, parallel equivalence, test-retest reliability, and inter-rater reliability. While the results demonstrate that the DRA2 has relatively little measurement error associated with content, time, and rater, it is important that examiners follow the administration and scoring guidelines provided in the DRA2 Kits. Furthermore, it is highly recommended that examiners participate in professional development from Pearson professionals in order to further minimize any measurement error.
10 This is based on Fleiss' (1971) index of agreement (see Gwet, 2001) .
DRA2 T e ch n ic a l Man u a l 47
Validity of the DRA2
When referring to the validity of an assessment, one looks at the extent to which the assessment actually measures what it is supposed to measure. For example, an assessment that is supposed to measure math ability should measure students’ capacity to do math and not related but different variables, such as reading comprehension11. In the context of the DRA2, when examining the validity of this measure, the overarching question becomes “does this assessment truly measure reading ability? Can teachers make accurate inferences about the true reading ability of a student based upon DRA2 assessment results?” It is important to note that validity is an abstract, multidimensional concept. Validity cannot be determined by a single statistic. Rather, there are different types of validity and multiple methods that must be used in order to compile a body of evidence that speaks towards the validity of an assessment or lack thereof (Standards for Educational and Psychological Testing, 1999). Accordingly, three types of validity evidence are presented in this technical manual: content-related validity, criterion-related validity and construct validity (Aiken, 2000; Anastasi & Urbina, 1997; Standards for Educational and Psychological Testing, 1999). For ease of interpretation, information and analyses related to these different types of validity are presented sequentially, however, it should be emphasized that all validity information should be reviewed as a whole in order to obtain a comprehensive picture of the validity of the DRA2.
Content-Related Validity The content validity of a test relates to the adequacy with which important content has been sampled and the adequacy with which the content is covered in the test. Content validity was built into the DRA and DRA2 assessments during the development process. Texts are authentic, and the student is asked to respond to the text in ways that are appropriate for the genre (for example, with nonfiction texts, the student is asked specific questions related to the content rather than asked to make inferences about what will happen in the text). As described in the section “Theoretical Framework and Research,” the DRA2 incorporates important reading domains and concepts based on consultation with experts and educators, and a review of the extant research literature on the characteristics and behaviors of “good readers.” This information was incorporated into the DRA during its initial development and
11 Elaborating on this example, if a math assessment is solely comprised of lengthy word problems, it could be measuring reading comprehension and not math. This would negatively influence the validity of the measure in that it may not be directly measuring what it is intended to measure but rather is measuring a related but different underlying trait.
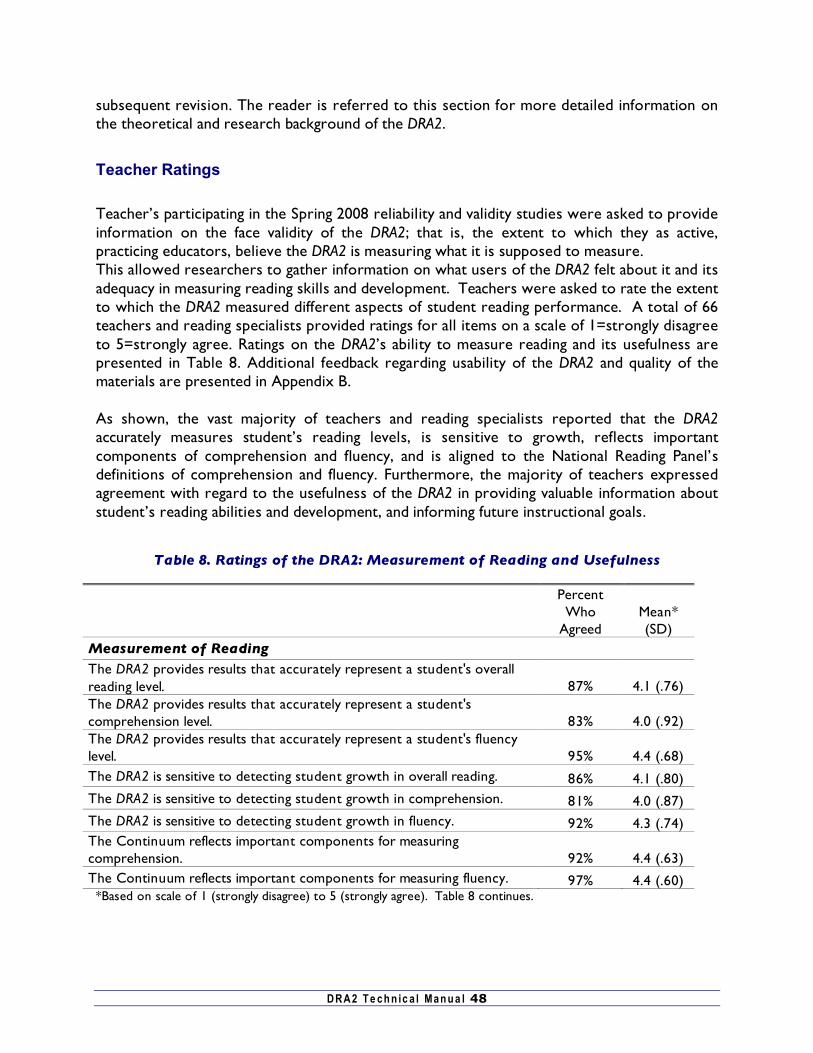
DRA2 T e ch n ic a l Man u a l 48
subsequent revision. The reader is referred to this section for more detailed information on the theoretical and research background of the DRA2.
Teacher Ratings Teacher’s participating in the Spring 2008 reliability and validity studies were asked to provide information on the face validity of the DRA2; that is, the extent to which they as active, practicing educators, believe the DRA2 is measuring what it is supposed to measure. This allowed researchers to gather information on what users of the DRA2 felt about it and its adequacy in measuring reading skills and development. Teachers were asked to rate the extent to which the DRA2 measured different aspects of student reading performance. A total of 66 teachers and reading specialists provided ratings for all items on a scale of 1=strongly disagree to 5=strongly agree. Ratings on the DRA2’s ability to measure reading and its usefulness are presented in Table 8. Additional feedback regarding usability of the DRA2 and quality of the materials are presented in Appendix B. As shown, the vast majority of teachers and reading specialists reported that the DRA2 accurately measures student’s reading levels, is sensitive to growth, reflects important components of comprehension and fluency, and is aligned to the National Reading Panel’s definitions of comprehension and fluency. Furthermore, the majority of teachers expressed agreement with regard to the usefulness of the DRA2 in providing valuable information about student’s reading abilities and development, and informing future instructional goals.
Table 8. Ratings of the DRA2: Measurement of Reading and Usefulness
Percent Who
Agreed Mean* (SD)
Measurement of Reading The DRA2 provides results that accurately represent a student's overall reading level. 87% 4.1 (.76) The DRA2 provides results that accurately represent a student's comprehension level. 83% 4.0 (.92) The DRA2 provides results that accurately represent a student's fluency level. 95% 4.4 (.68) The DRA2 is sensitive to detecting student growth in overall reading. 86% 4.1 (.80) The DRA2 is sensitive to detecting student growth in comprehension. 81% 4.0 (.87) The DRA2 is sensitive to detecting student growth in fluency. 92% 4.3 (.74) The Continuum reflects important components for measuring comprehension. 92% 4.4 (.63) The Continuum reflects important components for measuring fluency. 97% 4.4 (.60)
*Based on scale of 1 (strongly disagree) to 5 (strongly agree). Table 8 continues.
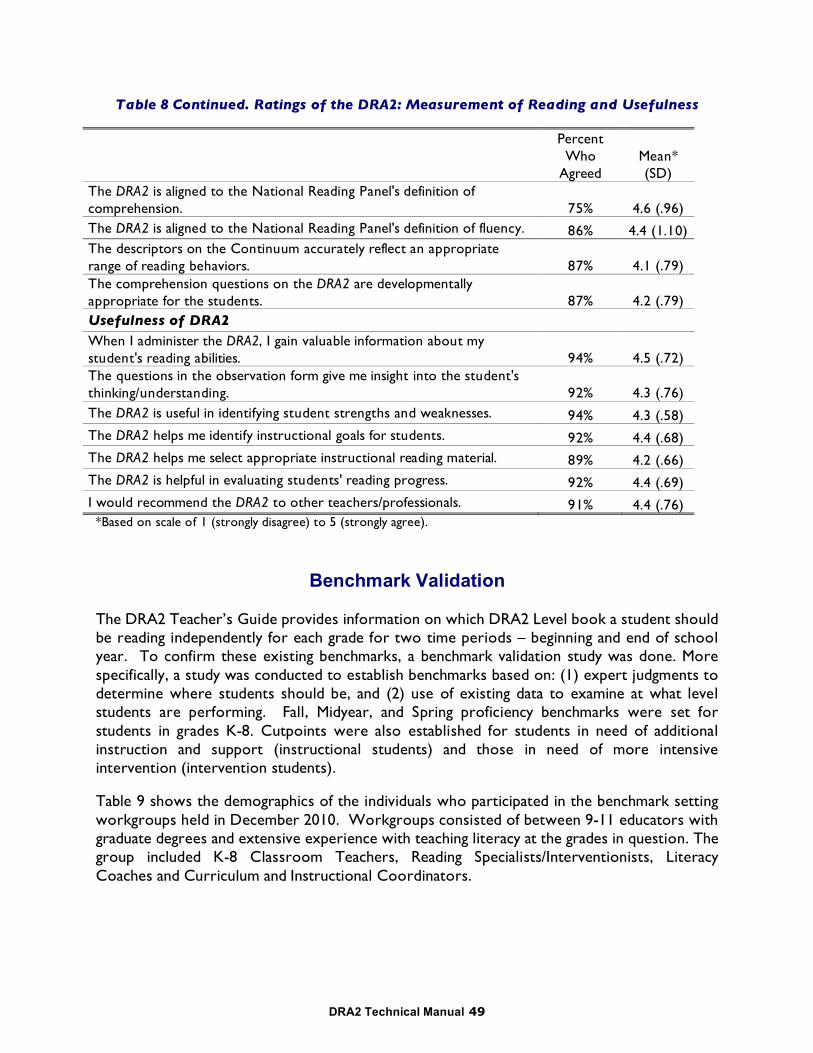
DRA2 Technical Manual 49
Table 8 Continued. Ratings of the DRA2: Measurement of Reading and Usefulness
Percent Who
Agreed Mean* (SD)
The DRA2 is aligned to the National Reading Panel's definition of comprehension. 75% 4.6 (.96) The DRA2 is aligned to the National Reading Panel's definition of fluency. 86% 4.4 (1.10) The descriptors on the Continuum accurately reflect an appropriate range of reading behaviors. 87% 4.1 (.79) The comprehension questions on the DRA2 are developmentally appropriate for the students. 87% 4.2 (.79) Usefulness of DRA2 When I administer the DRA2, I gain valuable information about my student's reading abilities. 94% 4.5 (.72) The questions in the observation form give me insight into the student's thinking/understanding. 92% 4.3 (.76) The DRA2 is useful in identifying student strengths and weaknesses. 94% 4.3 (.58) The DRA2 helps me identify instructional goals for students. 92% 4.4 (.68) The DRA2 helps me select appropriate instructional reading material. 89% 4.2 (.66) The DRA2 is helpful in evaluating students' reading progress. 92% 4.4 (.69) I would recommend the DRA2 to other teachers/professionals. 91% 4.4 (.76)
*Based on scale of 1 (strongly disagree) to 5 (strongly agree).
Benchmark Validation
The DRA2 Teacher’s Guide provides information on which DRA2 Level book a student should be reading independently for each grade for two time periods – beginning and end of school year. To confirm these existing benchmarks, a benchmark validation study was done. More specifically, a study was conducted to establish benchmarks based on: (1) expert judgments to determine where students should be, and (2) use of existing data to examine at what level students are performing. Fall, Midyear, and Spring proficiency benchmarks were set for students in grades K-8. Cutpoints were also established for students in need of additional instruction and support (instructional students) and those in need of more intensive intervention (intervention students).
Table 9 shows the demographics of the individuals who participated in the benchmark setting workgroups held in December 2010. Workgroups consisted of between 9-11 educators with graduate degrees and extensive experience with teaching literacy at the grades in question. The group included K-8 Classroom Teachers, Reading Specialists/Interventionists, Literacy Coaches and Curriculum and Instructional Coordinators.
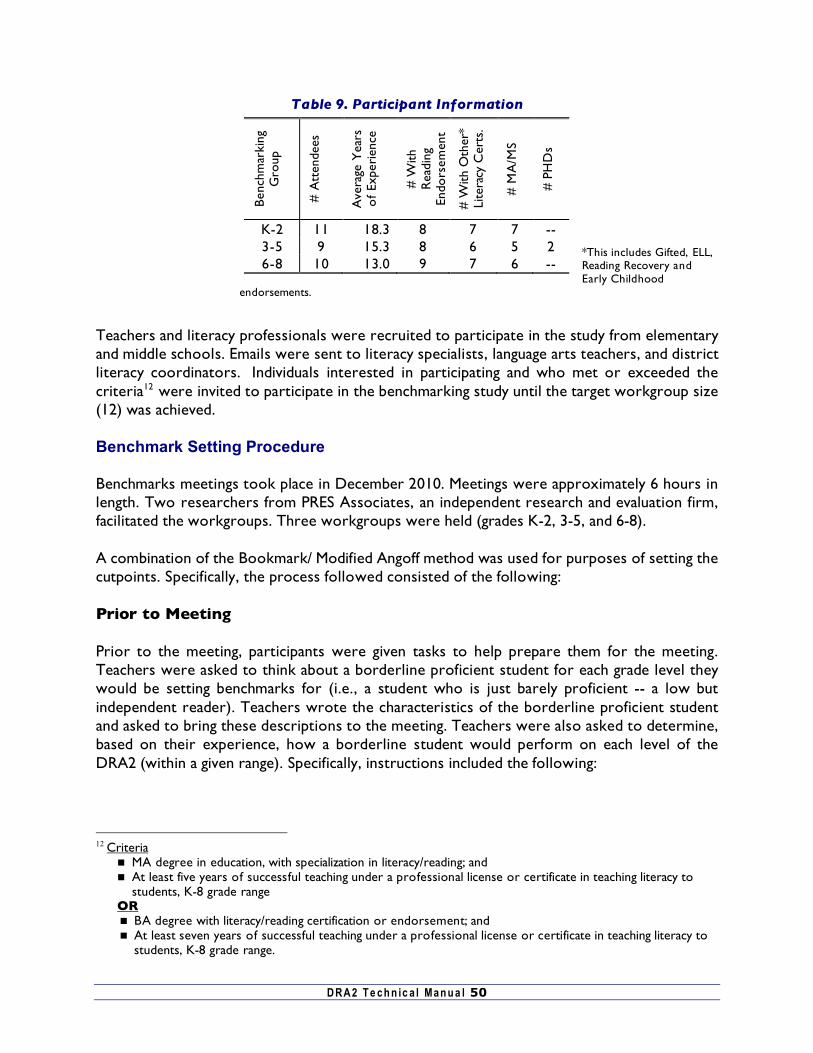
DRA2 T e ch n ic a l Man u a l 50
Table 9. Participant Information
*This includes Gifted, ELL, Reading Recovery and Early Childhood
endorsements.
Teachers and literacy professionals were recruited to participate in the study from elementary and middle schools. Emails were sent to literacy specialists, language arts teachers, and district literacy coordinators. Individuals interested in participating and who met or exceeded the criteria12 were invited to participate in the benchmarking study until the target workgroup size (12) was achieved. Benchmark Setting Procedure Benchmarks meetings took place in December 2010. Meetings were approximately 6 hours in length. Two researchers from PRES Associates, an independent research and evaluation firm, facilitated the workgroups. Three workgroups were held (grades K-2, 3-5, and 6-8). A combination of the Bookmark/ Modified Angoff method was used for purposes of setting the cutpoints. Specifically, the process followed consisted of the following:
Prior to Meeting Prior to the meeting, participants were given tasks to help prepare them for the meeting. Teachers were asked to think about a borderline proficient student for each grade level they would be setting benchmarks for (i.e., a student who is just barely proficient -- a low but independent reader). Teachers wrote the characteristics of the borderline proficient student and asked to bring these descriptions to the meeting. Teachers were also asked to determine, based on their experience, how a borderline student would perform on each level of the DRA2 (within a given range). Specifically, instructions included the following:
12 Criteria
MA degree in education, with specialization in literacy/reading; and At least five years of successful teaching under a professional license or certificate in teaching literacy to
students, K-8 grade range OR BA degree with literacy/reading certification or endorsement; and At least seven years of successful teaching under a professional license or certificate in teaching literacy to
students, K-8 grade range.
Ben
chm
arki
ng
Gro
up
# A
tten
dees
Ave
rage
Yea
rs
of
Expe
rien
ce
# W
ith
Rea
ding
En
dors
emen
t
# W
ith O
ther
* Li
tera
cy C
erts
.
# M
A/M
S
# P
HD
s
K-2 11 18.3 8 7 7 -- 3-5 9 15.3 8 6 5 2 6-8 10 13.0 9 7 6 --
DRA2 T e ch n ic a l Man u a l 51
Starting from the first level book, go through the books and corresponding Teacher Observation Guide (in the Blackline Masters) and indicate on the attached rating form whether: 1) The borderline proficient student would definitely pass the DRA2 level (i.e., obtain a score in
the Independent range of the Continuum for both fluency and comprehension), OR 2) The borderline proficient student would definitely not pass the DRA2 level (i.e., obtain a score
below the Independent range of the Continuum for both fluency and comprehension), OR 3) Either you are unsure of the performance of a borderline proficient student OR you would
predict some borderline students would pass and others would not. You will do this for Fall (i.e., how a borderline proficient student would perform during the first month of the school year) and Spring (i.e., how a borderline student would perform at the end of the school year) for each grade level.
Teachers entered data on an online form allowing researchers to analyze the initial cutpoint ratings prior to the meeting. Using this data, facilitators were able to obtain preliminary information on the DRA2 levels where the performance of a borderline student was unclear. During Benchmark Meeting Benchmarks were set sequentially, beginning with the lowest grade level being examined by the workgroup (K, 3rd, or 6th). The group first began with Fall benchmarks, followed by Spring, and then Midyear. In addition, proficiency benchmarks were set first for all grade levels and time periods. Following this task, cutpoints were identified for students who are at an intervention and instructional level13. For purposes of establishing cutpoints, teachers considered the following general descriptions. These general descriptions served as a grounding tool and were elaborated upon as noted in the next step.
Emerging / Intervention: These students do not understand what to do or lack the strategies and skills needed to adequately respond. Students falling in this category require highly effective instruction and more intensive support.
Developing / Instructional: These students have some control of the necessary strategies to decode, comprehend, and respond to prompts and questions for the text level, but they need models and demonstrations of what is expected. Students falling in this category are in need of additional support and instruction.
Proficient/Independent: These students have for the most part control of the necessary strategies to decode, comprehend, and respond to prompts and questions for the text level assessed.
The following steps describe the process undertaken for establishing proficiency benchmarks. These steps were repeated for each grade level and time period.
a) Teachers described what a borderline proficient student (for setting the first proficiency cutpoint) should demonstrate in terms of literacy-related behaviors. Discussion ensued among teachers as to what a borderline student should or should
13 Cutpoints for advanced level were not established given the variations in what is considered “advanced” (e.g., gifted, provision of enrichment, etc.).
DRA2 T e ch n ic a l Man u a l 52
not be able to do at a certain time period (Fall, Midyear, Spring) and grade level until consensus was achieved as to what a borderline student would look like. Teachers also referred to the Common Core Standards (for Spring benchmark setting) in identifying what students should be able to do or not do at a given grade level. Thus, traits characterizing a borderline student were aligned to Common Core Standards. For Common Core Standards, go to www.corestandards.org.
b) Following the grounding exercise to develop shared perceptions of a borderline student, teachers were asked to estimate the percentage of borderline proficient students at the grade level in question that would score at an independent level on the fluency and comprehension portion of the DRA2 assessment at a range of DRA2 levels14 determined by the preliminary data. For example, teachers were asked the percentage of 1st grade borderline proficient students who would be able to read independently at DRA2 Levels A-8 in the Fall. Teachers completed ratings independently and results were entered into a spreadsheet.
c) The workgroup was shown the independent rating results on the spreadsheet and, in most cases, there was substantial agreement among the individual ratings as to where the cutpoint should be (i.e., the point at which 50% or more of borderline students would read the DRA2 level independently). However, for a very few grade and time points, the cutpoint was ambiguous. In these cases, discussion ensued on why people rated it the way they did. After such discussion, teachers had the option to change their ratings. Discussion continued until consensus was achieved on where the cutpoint should be set.
d) As a final activity, results from national data available from the DRA2 Online Management System (OMS) were shared with teachers following their setting of benchmarks15. The sample size ranged from 29000 to 65000 (dependent on grade level). Specifically, at each grade level, the percent of students who scored at the independent level on each of the DRA2 book levels were shared with teachers so they could compare their benchmarks of where a proficient student should be performing to how a sample of students nationwide have performed. In all cases, teachers felt that the national data confirmed the cutpoints they had established.
e) Steps A-C were repeated to establish cutpoints for intervention and instructional students.
f) For grades 4-8, more detailed cutpoints were established. Since the range of DRA2 levels is more limited at these grade levels given that there is less of a rapid growth in reading skills as compared to the primary grade levels, teachers were asked what the minimum total score (i.e., comprehension and fluency) a borderline student would need to achieve on the DRA2 continuum to be identified as proficient.
Results
The following tables show the cutpoints set by the workgroups. As shown, while three different workgroups established cutpoints for different grade ranges (K-2, 3-5, 6-8), a clear 14 The student engagement measure was not used in setting the cutpoints. 15 This was only done for setting the proficient cutpoint as the DRA2 is designed to determine a student’s independent reading level. As such, there was fewer data available on students scoring at the advanced, intervention, and instructional level.
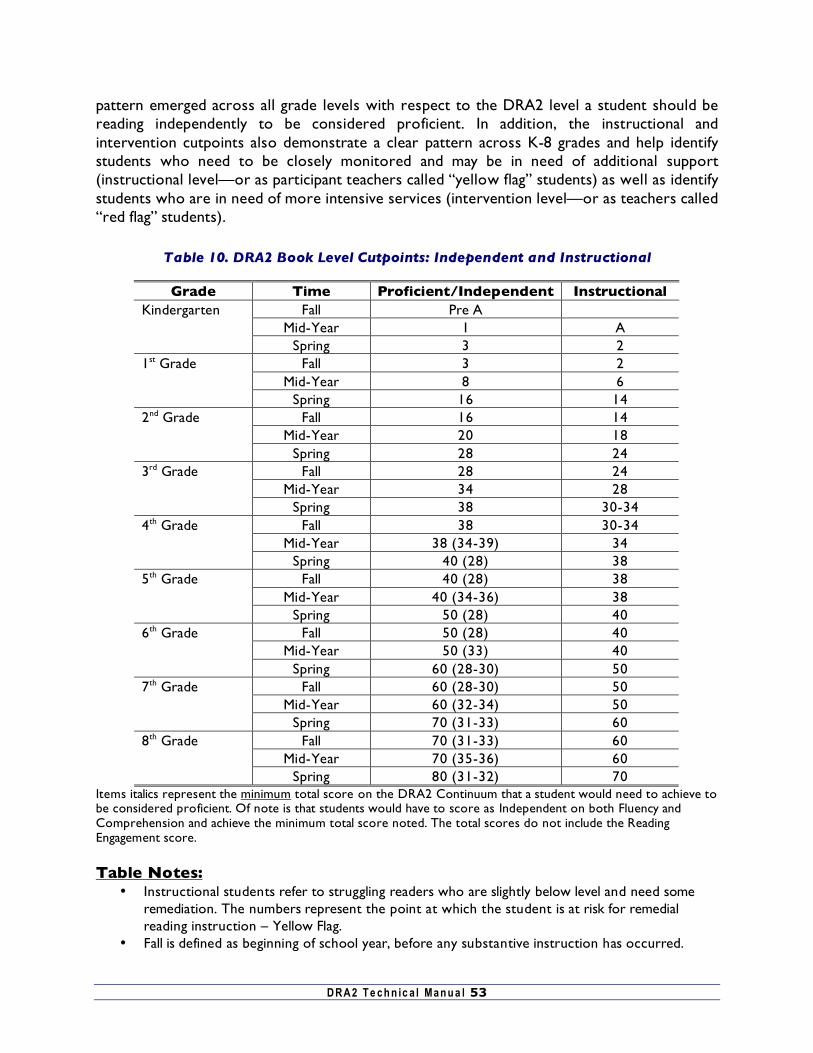
DRA2 T e ch n ic a l Man u a l 53
pattern emerged across all grade levels with respect to the DRA2 level a student should be reading independently to be considered proficient. In addition, the instructional and intervention cutpoints also demonstrate a clear pattern across K-8 grades and help identify students who need to be closely monitored and may be in need of additional support (instructional level—or as participant teachers called “yellow flag” students) as well as identify students who are in need of more intensive services (intervention level—or as teachers called “red flag” students).
Table 10. DRA2 Book Level Cutpoints: Independent and Instructional
Grade Time Proficient/Independent Instructional Fall Pre A
Mid-Year 1 A Kindergarten
Spring 3 2 Fall 3 2
Mid-Year 8 6 1st Grade
Spring 16 14 Fall 16 14
Mid-Year 20 18 2nd Grade
Spring 28 24 Fall 28 24
Mid-Year 34 28 3rd Grade
Spring 38 30-34 Fall 38 30-34
Mid-Year 38 (34-39) 34 4th Grade
Spring 40 (28) 38 Fall 40 (28) 38
Mid-Year 40 (34-36) 38 5th Grade
Spring 50 (28) 40 Fall 50 (28) 40
Mid-Year 50 (33) 40 6th Grade
Spring 60 (28-30) 50 Fall 60 (28-30) 50
Mid-Year 60 (32-34) 50 7th Grade
Spring 70 (31-33) 60 Fall 70 (31-33) 60
Mid-Year 70 (35-36) 60 8th Grade
Spring 80 (31-32) 70 Items italics represent the minimum total score on the DRA2 Continuum that a student would need to achieve to be considered proficient. Of note is that students would have to score as Independent on both Fluency and Comprehension and achieve the minimum total score noted. The total scores do not include the Reading Engagement score. Table Notes:
• Instructional students refer to struggling readers who are slightly below level and need some remediation. The numbers represent the point at which the student is at risk for remedial reading instruction – Yellow Flag.
• Fall is defined as beginning of school year, before any substantive instruction has occurred.
DRA2 T e ch n ic a l Man u a l 54
• Mid-Year is defined as the middle of the school year. NOTE: Mid-year benchmarks are not generally conducted, however this information is provided for those districts that do mid-year assessments.
• Spring is defined as the end of the school year, following substantive instruction for a specific grade level.
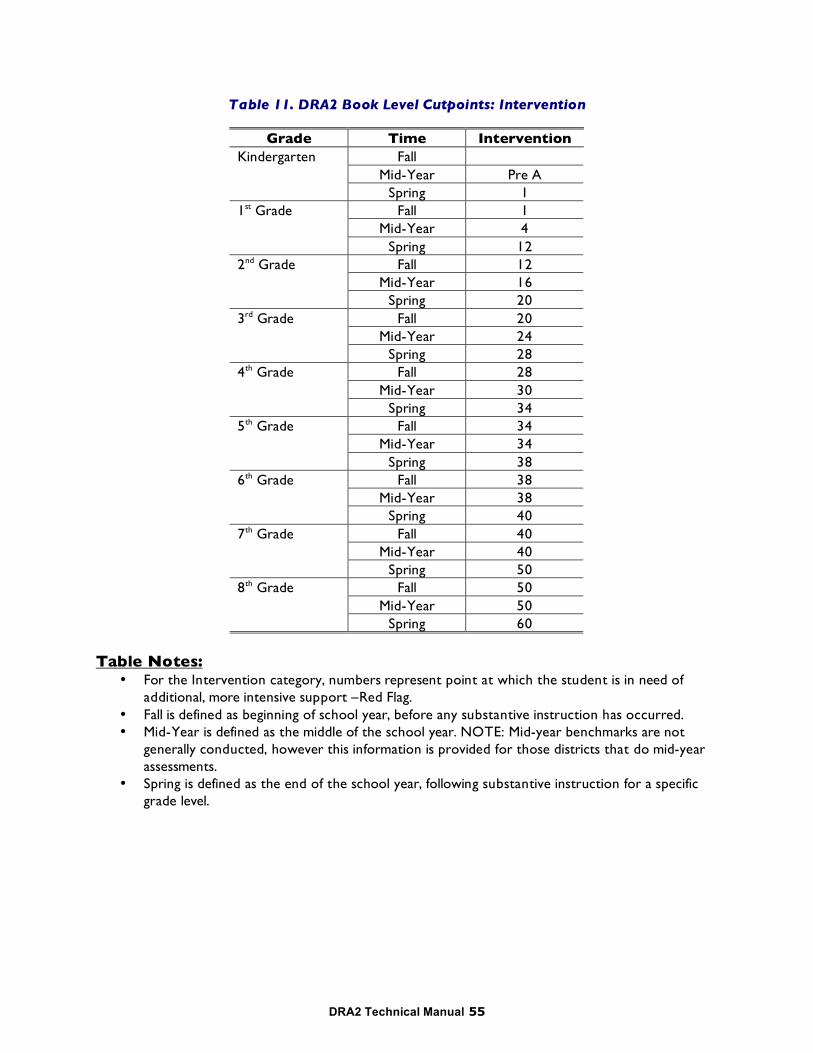
DRA2 Technical Manual 55
Table 11. DRA2 Book Level Cutpoints: Intervention
Grade Time Intervention Fall
Mid-Year Pre A Kindergarten
Spring 1 Fall 1
Mid-Year 4 1st Grade
Spring 12 Fall 12
Mid-Year 16 2nd Grade
Spring 20 Fall 20
Mid-Year 24 3rd Grade
Spring 28 Fall 28
Mid-Year 30 4th Grade
Spring 34 Fall 34
Mid-Year 34 5th Grade
Spring 38 Fall 38
Mid-Year 38 6th Grade
Spring 40 Fall 40
Mid-Year 40 7th Grade
Spring 50 Fall 50
Mid-Year 50 8th Grade
Spring 60 Table Notes:
• For the Intervention category, numbers represent point at which the student is in need of additional, more intensive support –Red Flag.
• Fall is defined as beginning of school year, before any substantive instruction has occurred. • Mid-Year is defined as the middle of the school year. NOTE: Mid-year benchmarks are not
generally conducted, however this information is provided for those districts that do mid-year assessments.
• Spring is defined as the end of the school year, following substantive instruction for a specific grade level.
DRA2 Technical Manual 56
Criterion-Related Validity Criterion-related validity refers to the extent to which a measure predicts performance on some other significant measures (called a criterion) other than the test itself. Criterion validity may be broken down into two components: concurrent and predictive. Concurrent validity involves comparing assessment results with other measures of performance obtained concurrently (to estimate present status) whereas predictive validity involves comparing assessment performance with another measure of performance obtained at a later point in time (for prediction).
Concurrent Validity With concurrent validity, scores between different assessments taken at the same time or at close points in time are correlated with one another in order to ascertain the degree to which they are measuring the same constructs of interest -- in this instance, reading comprehension and fluency. Thus, the focus of interest here is the relationship between assessment measures that are taken concurrently. To examine the DRA2’s concurrent validity, DRA2 scores were correlated with scores from other well-known, previously validated tests of reading comprehension and fluency. Specifically, the relationship between the DRA2 and Gray’s Oral Reading Test-4th Edition (GORT-4; Weiderholt & Bryant, 2001), the DIBELS Oral Reading Fluency Test-6th Edition (DORF; Good, Kaminski, & Dill, 2002), and Gates MacGinitie Reading Test-4th Edition (MacGinitie, MacGinitie, Maria, & Dreyer, 2002) was examined. The following are descriptions of these tests:
The GORT-4 is a validated, norm-referenced test designed to measure reading comprehension (i.e., correctness of students’ responses to items about the passage read) and fluency (i.e., the rate and accuracy during oral reading). Students read passages until a basal and ceiling has been achieved. Performance on each passage is summed to produce a total score for fluency (sum of rate and accuracy) and comprehension.
The DORF consists of oral reading fluency passages for 1st to 6th grades. Students read three passages aloud for one minute each. The number of correct words per minute from the passage is the oral reading fluency rate for that passage. The median score (across the three passages) is used as the overall oral fluency score. The DORF is used extensively nationwide.
The Gates MacGinitie Reading Test: Comprehension subtest consists of group-administered, multiple-choice test measuring students’ abilities to read and understand different types of prose. Some questions require students to construct an understanding based on a literal understanding of the passage; others require students to make inferences or draw conclusions.
DRA2 T e ch n ic a l Man u a l 57
As part of the concurrent validity study undertaken in Spring of 2008, students were administered the DRA2 16 followed by either the GORT-4 or DORF test. No more than a one week interval took place between administrations of the different assessments. Two schools who were already participating in the concurrent validity study also used the Gates MacGinitie Reading Test as part of their existing school testing program; these schools provided researchers with students’ test scores on this assessment as well. Demographic characteristics of the students who participated in the concurrent validity study are available in the Appendix. Notably, the student sample reflected a wide range of reading performance levels, with 37% classified as below grade level, 33% at grade level and 30% above grade level. The correlation coefficients (r) are presented in Table 9. Since the DRA2 levels are ordered but not on a true interval scale, Spearman’s Rho were computed. Furthermore, differences between standard scores17 were examined via t-tests. Results showed no significant differences, at the .05 level, between performance on the Gray’s Oral Reading Test: Comprehension and Fluency, DORF, and Gates MacGinitie: Comprehension Test. This means that students’ reading performance on the DRA2 is similar to their reading performance on the GORT-4, DORF, and Gates MacGinitie Reading tests. In addition, Table 12 shows that statistically significant correlations were obtained for all comparisons between the DRA2 and each of the three other assessments (GORT-4, DORF, Gates MacGinitie). Correlation coefficients ranged from .60 to .76. All of the obtained correlations can be classified as large to very large in magnitude (Hopkins, 2002). This means that the DRA2 comprehension and fluency measures have a large to very large relationship with other, well-known measures of reading comprehension and fluency. It should be noted that these correlations are especially impressive given the different tasks and scoring procedures involved among the various tests. Furthermore, the variation in the student sample means that this test demonstrates validity for a wide range of ages, ethnic backgrounds, and reading levels. In sum, the results from the concurrent validity study provide support for the validity of the DRA2 as a measure of reading comprehension and fluency.
16 Teachers were asked to administer the DRA2 following the administration directions in their DRA2 kits and to select the DRA2 text level that best represented the student’s reading ability based on prior DRA2 assessment or other reading test results. 17 In order to facilitate comparisons, raw scores were converted to a standard score based on a normal distribution with a mean of 100 and standard deviation of 15. In addition, DRA2 level and performance at that level (i.e., total fluency and comprehension score) were taken into account in the converted score.
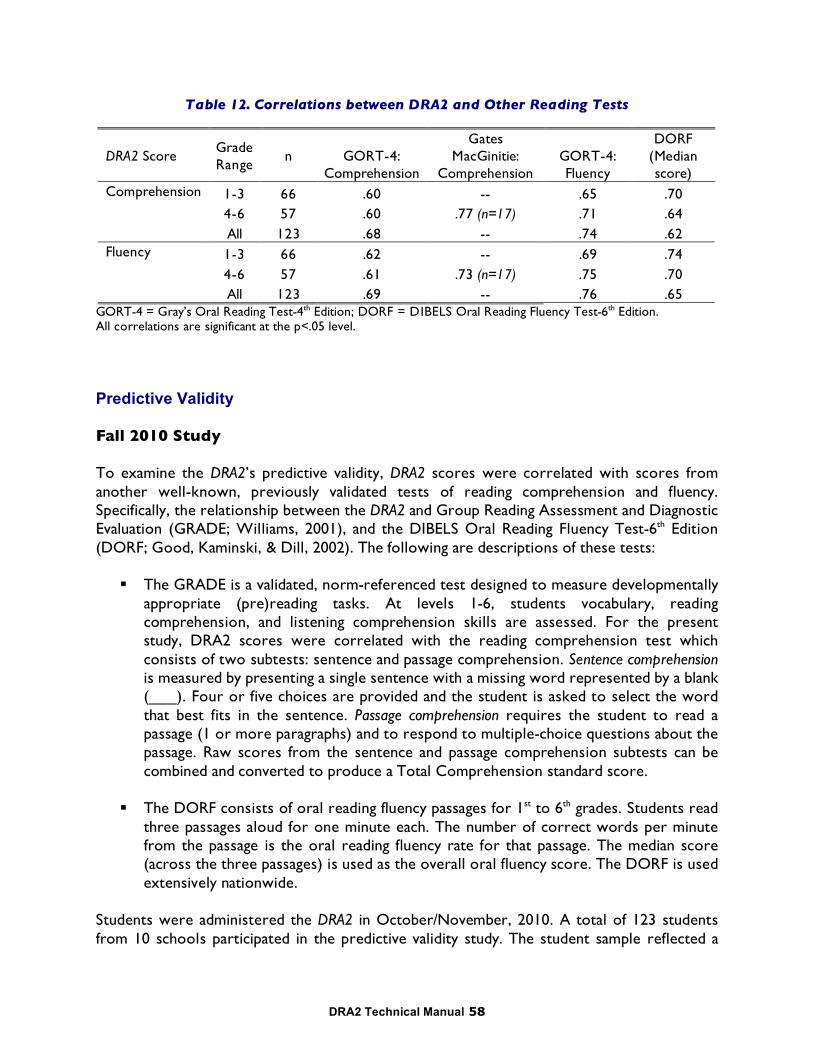
DRA2 Technical Manual 58
Table 12. Correlations between DRA2 and Other Reading Tests
DRA2 Score Grade Range
n GORT-4: Comprehension
Gates MacGinitie:
Comprehension GORT-4: Fluency
DORF (Median score)
1-3 66 .60 -- .65 .70 4-6 57 .60 .77 (n=17) .71 .64
Comprehension
All 123 .68 -- .74 .62 1-3 66 .62 -- .69 .74 4-6 57 .61 .73 (n=17) .75 .70
Fluency
All 123 .69 -- .76 .65 GORT-4 = Gray’s Oral Reading Test-4th Edition; DORF = DIBELS Oral Reading Fluency Test-6th Edition. All correlations are significant at the p<.05 level.
Predictive Validity Fall 2010 Study To examine the DRA2’s predictive validity, DRA2 scores were correlated with scores from another well-known, previously validated tests of reading comprehension and fluency. Specifically, the relationship between the DRA2 and Group Reading Assessment and Diagnostic Evaluation (GRADE; Williams, 2001), and the DIBELS Oral Reading Fluency Test-6th Edition (DORF; Good, Kaminski, & Dill, 2002). The following are descriptions of these tests:
The GRADE is a validated, norm-referenced test designed to measure developmentally
appropriate (pre)reading tasks. At levels 1-6, students vocabulary, reading comprehension, and listening comprehension skills are assessed. For the present study, DRA2 scores were correlated with the reading comprehension test which consists of two subtests: sentence and passage comprehension. Sentence comprehension is measured by presenting a single sentence with a missing word represented by a blank (___). Four or five choices are provided and the student is asked to select the word that best fits in the sentence. Passage comprehension requires the student to read a passage (1 or more paragraphs) and to respond to multiple-choice questions about the passage. Raw scores from the sentence and passage comprehension subtests can be combined and converted to produce a Total Comprehension standard score.
The DORF consists of oral reading fluency passages for 1st to 6th grades. Students read three passages aloud for one minute each. The number of correct words per minute from the passage is the oral reading fluency rate for that passage. The median score (across the three passages) is used as the overall oral fluency score. The DORF is used extensively nationwide.
Students were administered the DRA2 in October/November, 2010. A total of 123 students from 10 schools participated in the predictive validity study. The student sample reflected a
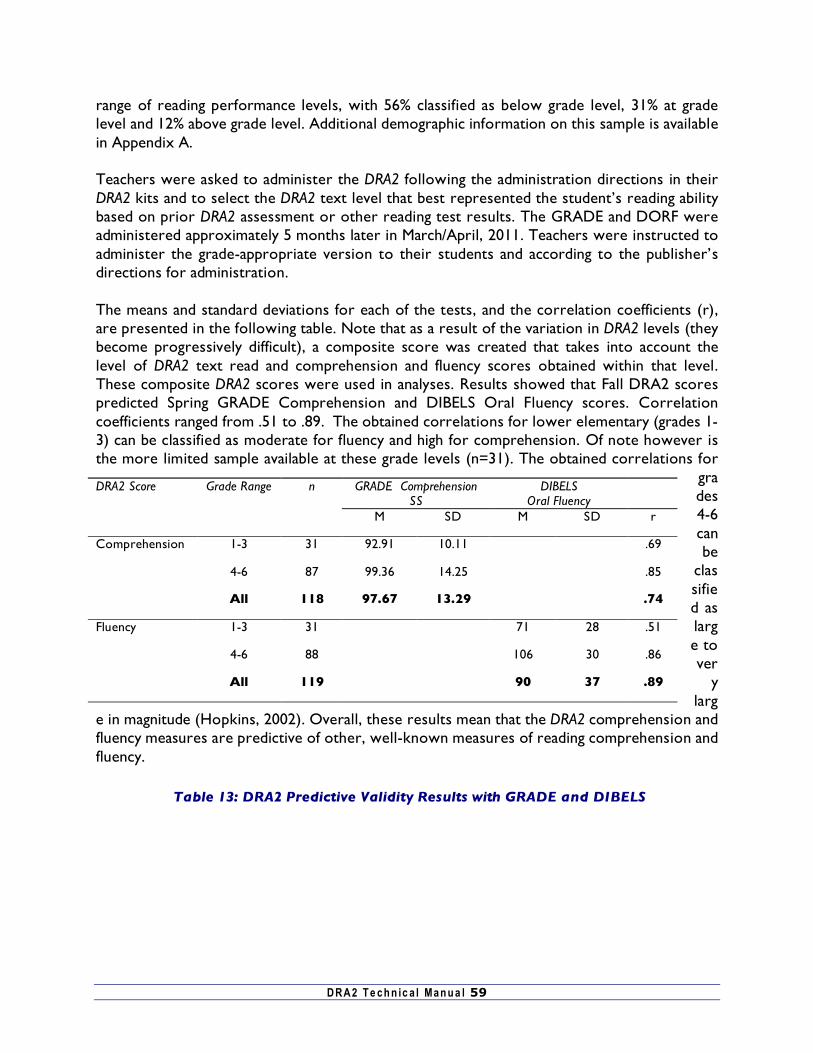
DRA2 T e ch n ic a l Man u a l 59
range of reading performance levels, with 56% classified as below grade level, 31% at grade level and 12% above grade level. Additional demographic information on this sample is available in Appendix A. Teachers were asked to administer the DRA2 following the administration directions in their DRA2 kits and to select the DRA2 text level that best represented the student’s reading ability based on prior DRA2 assessment or other reading test results. The GRADE and DORF were administered approximately 5 months later in March/April, 2011. Teachers were instructed to administer the grade-appropriate version to their students and according to the publisher’s directions for administration. The means and standard deviations for each of the tests, and the correlation coefficients (r), are presented in the following table. Note that as a result of the variation in DRA2 levels (they become progressively difficult), a composite score was created that takes into account the level of DRA2 text read and comprehension and fluency scores obtained within that level. These composite DRA2 scores were used in analyses. Results showed that Fall DRA2 scores predicted Spring GRADE Comprehension and DIBELS Oral Fluency scores. Correlation coefficients ranged from .51 to .89. The obtained correlations for lower elementary (grades 1-3) can be classified as moderate for fluency and high for comprehension. Of note however is the more limited sample available at these grade levels (n=31). The obtained correlations for
grades 4-6 can be
classified as large to ver
y larg
e in magnitude (Hopkins, 2002). Overall, these results mean that the DRA2 comprehension and fluency measures are predictive of other, well-known measures of reading comprehension and fluency.
Table 13: DRA2 Predictive Validity Results with GRADE and DIBELS
GRADE Comprehension SS
DIBELS Oral Fluency
DRA2 Score Grade Range n
M SD M SD r
1-3 31 92.91 10.11 .69
4-6 87 99.36 14.25 .85
Comprehension
All 118 97.67 13.29 .74
1-3 31 71 28 .51
4-6 88 106 30 .86
Fluency
All 119 90 37 .89
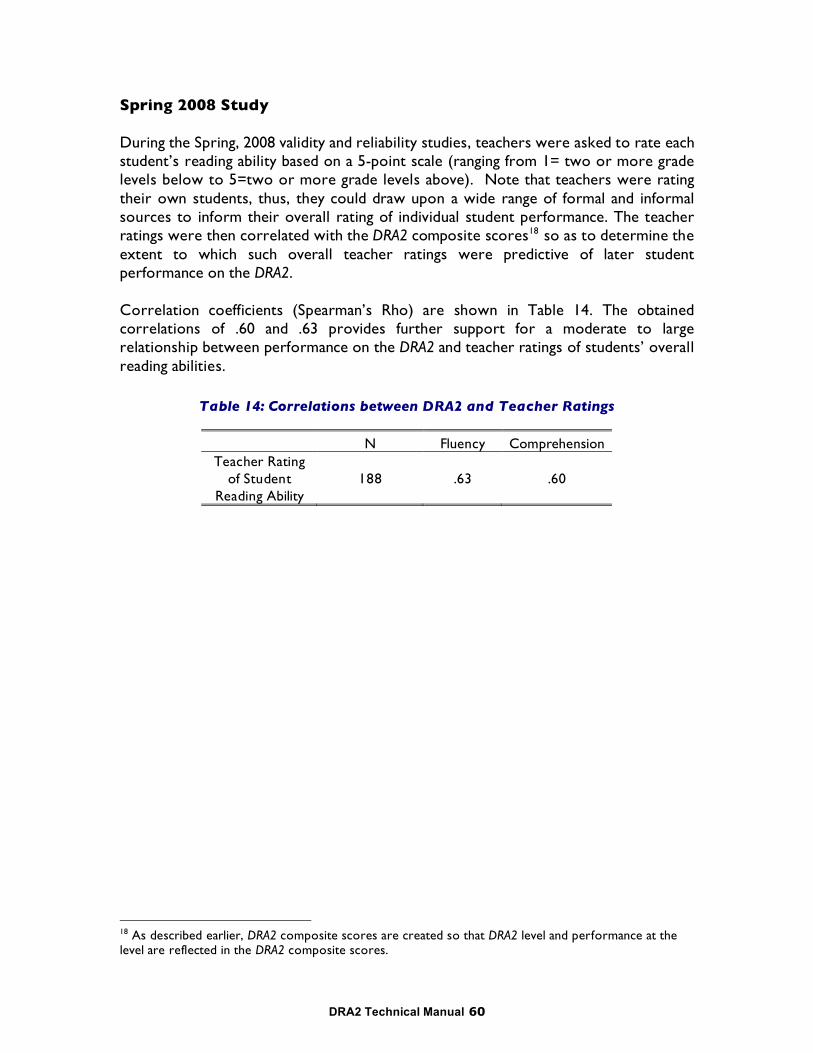
DRA2 Technical Manual 60
Spring 2008 Study During the Spring, 2008 validity and reliability studies, teachers were asked to rate each student’s reading ability based on a 5-point scale (ranging from 1= two or more grade levels below to 5=two or more grade levels above). Note that teachers were rating their own students, thus, they could draw upon a wide range of formal and informal sources to inform their overall rating of individual student performance. The teacher ratings were then correlated with the DRA2 composite scores18 so as to determine the extent to which such overall teacher ratings were predictive of later student performance on the DRA2. Correlation coefficients (Spearman’s Rho) are shown in Table 14. The obtained correlations of .60 and .63 provides further support for a moderate to large relationship between performance on the DRA2 and teacher ratings of students’ overall reading abilities.
Table 14: Correlations between DRA2 and Teacher Ratings
N Fluency Comprehension Teacher Rating
of Student Reading Ability
188 .63 .60
18 As described earlier, DRA2 composite scores are created so that DRA2 level and performance at the level are reflected in the DRA2 composite scores.
DRA2 Technical Manual 61
Construct Validity When examining the construct validity of an assessment, one is typically interested in determining the extent to which an assessment is a meaningful measure of some underlying characteristic, trait, or “construct.” For example, an instrument that is designed to measure the underlying construct of “work ethic” would not usually directly ask “what is your work ethic?” Rather, a variety of different items believed to be related to the underlying construct of work ethic may be used to get at this latent trait, for example, how often a person is late for work, the extent to which they complete tasks independently, in a timely manner, and so forth. Construct validity of an assessment refers to the extent to which the test is really measuring the underlying constructs or traits that it is designed to measure. The items within the DRA2 subtests are designed to measure the underlying constructs of oral fluency and reading comprehension. Thus, when looking at construct validity, an overarching question of interest is, “to what extent does the DRA2 provide high-quality information on students’ level of oral fluency and comprehension – the underlying constructs that it was originally designed to measure?” To this end, multiple methods were used to examine the construct validity of the DRA2, with an emphasis being placed on examining the relationship between the theoretical pattern expected and the observed pattern (Trochim, 2006). Specifically, three steps were undertaken (Carmines & Zeller, 1979): (1) the theoretical relationship between concepts were specified, (2) the empirical relationship between measures of the concepts were examined, and (3) the empirical evidence was interpreted to clarify the construct validity of the measure. The following section presents data on the construct validity of the DRA2. Analyses performed are based on three core premises or assumptions believed to underlie the use of the DRA2:
i. Since the two subtests of comprehension and fluency are related facets of reading, there should be a relationship between the subtests and the indicators used to measure these constructs.
ii. Furthermore, since the DRA2 was developed so that indicators would reflect the underlying constructs of oral fluency and reading comprehension, factor analysis should provide support for two factors. That is, oral fluency and reading comprehension, while certainly related, should still be distinctive in that they represent unique aspects of reading.
iii. Given that fluency and reading comprehension skills are developmental in nature, performance on the test should be strongly related to age.
iv. Since reading accuracy is affected by difficulty of the text being read, students reading texts above their independent reading level should display a decrease in their reading accuracy.
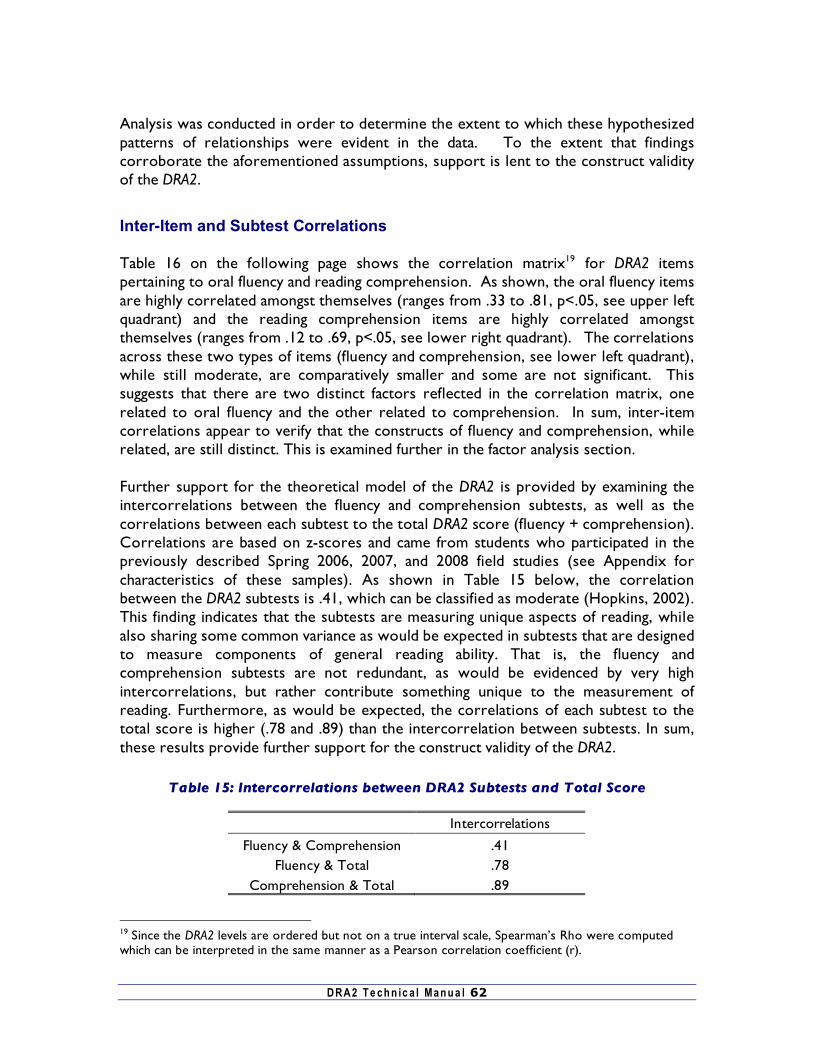
DRA2 T e ch n ic a l Man u a l 62
Analysis was conducted in order to determine the extent to which these hypothesized patterns of relationships were evident in the data. To the extent that findings corroborate the aforementioned assumptions, support is lent to the construct validity of the DRA2.
Inter-Item and Subtest Correlations Table 16 on the following page shows the correlation matrix19 for DRA2 items pertaining to oral fluency and reading comprehension. As shown, the oral fluency items are highly correlated amongst themselves (ranges from .33 to .81, p<.05, see upper left quadrant) and the reading comprehension items are highly correlated amongst themselves (ranges from .12 to .69, p<.05, see lower right quadrant). The correlations across these two types of items (fluency and comprehension, see lower left quadrant), while still moderate, are comparatively smaller and some are not significant. This suggests that there are two distinct factors reflected in the correlation matrix, one related to oral fluency and the other related to comprehension. In sum, inter-item correlations appear to verify that the constructs of fluency and comprehension, while related, are still distinct. This is examined further in the factor analysis section. Further support for the theoretical model of the DRA2 is provided by examining the intercorrelations between the fluency and comprehension subtests, as well as the correlations between each subtest to the total DRA2 score (fluency + comprehension). Correlations are based on z-scores and came from students who participated in the previously described Spring 2006, 2007, and 2008 field studies (see Appendix for characteristics of these samples). As shown in Table 15 below, the correlation between the DRA2 subtests is .41, which can be classified as moderate (Hopkins, 2002). This finding indicates that the subtests are measuring unique aspects of reading, while also sharing some common variance as would be expected in subtests that are designed to measure components of general reading ability. That is, the fluency and comprehension subtests are not redundant, as would be evidenced by very high intercorrelations, but rather contribute something unique to the measurement of reading. Furthermore, as would be expected, the correlations of each subtest to the total score is higher (.78 and .89) than the intercorrelation between subtests. In sum, these results provide further support for the construct validity of the DRA2.
Table 15: Intercorrelations between DRA2 Subtests and Total Score
Intercorrelations
Fluency & Comprehension .41 Fluency & Total .78
Comprehension & Total .89
19 Since the DRA2 levels are ordered but not on a true interval scale, Spearman’s Rho were computed which can be interpreted in the same manner as a Pearson correlation coefficient (r).

DRA2 T e ch n ic a l Man u a l 63
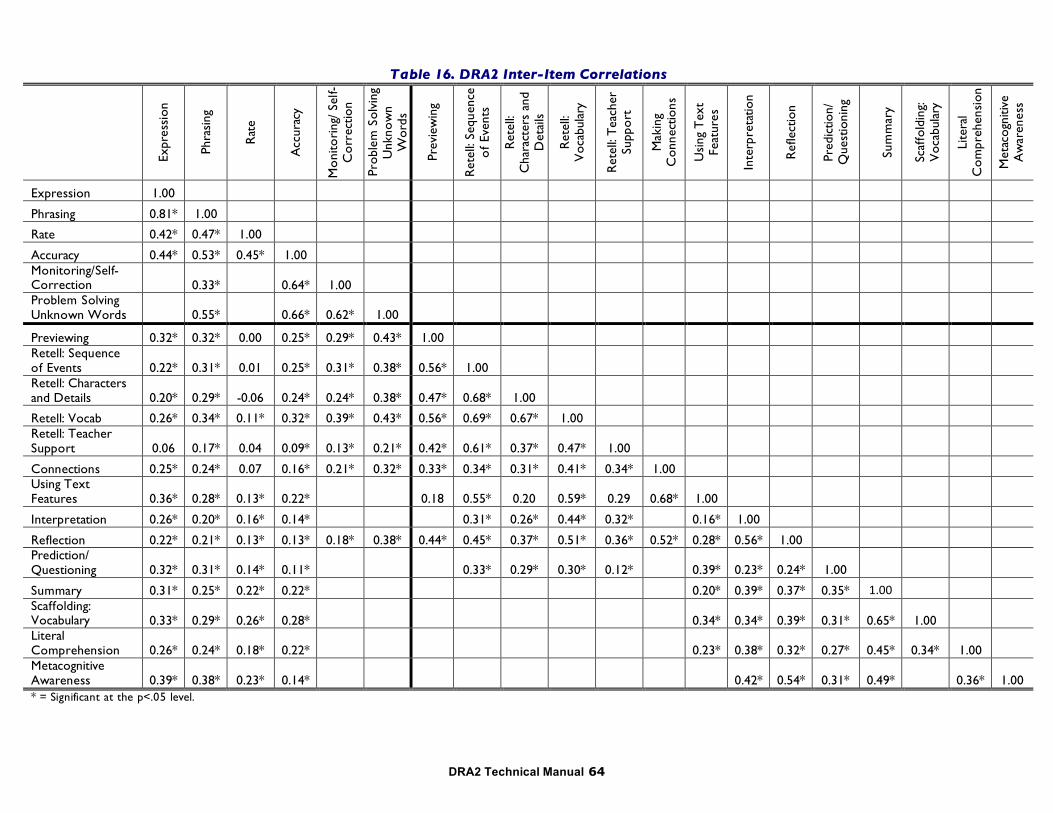
DRA2 Technical Manual 64
Table 16. DRA2 Inter-Item Correlations
Ex
pres
sion
Phra
sing
Rat
e
Acc
urac
y
Mo
nito
ring
/ Se
lf-C
orr
ectio
n
Prob
lem
Sol
ving
U
nkno
wn
Wor
ds
Prev
iew
ing
Ret
ell:
Sequ
ence
o
f Ev
ents
Ret
ell:
Cha
ract
ers
and
Det
ails
Ret
ell:
Voc
abul
ary
Ret
ell:
Tea
cher
Su
ppo
rt
Mak
ing
Con
nect
ions
Usi
ng T
ext
Feat
ures
Inte
rpre
tatio
n
Ref
lect
ion
Pred
ictio
n/
Que
stio
ning
Sum
mar
y
Scaf
fold
ing:
V
ocab
ular
y
Lite
ral
Co
mpr
ehen
sion
Met
acog
nitiv
e A
war
enes
s
Expression 1.00
Phrasing 0.81* 1.00
Rate 0.42* 0.47* 1.00
Accuracy 0.44* 0.53* 0.45* 1.00 Monitoring/Self-Correction 0.33* 0.64* 1.00 Problem Solving Unknown Words 0.55* 0.66* 0.62* 1.00
Previewing 0.32* 0.32* 0.00 0.25* 0.29* 0.43* 1.00 Retell: Sequence of Events 0.22* 0.31* 0.01 0.25* 0.31* 0.38* 0.56* 1.00 Retell: Characters and Details 0.20* 0.29* -0.06 0.24* 0.24* 0.38* 0.47* 0.68* 1.00
Retell: Vocab 0.26* 0.34* 0.11* 0.32* 0.39* 0.43* 0.56* 0.69* 0.67* 1.00 Retell: Teacher Support 0.06 0.17* 0.04 0.09* 0.13* 0.21* 0.42* 0.61* 0.37* 0.47* 1.00
Connections 0.25* 0.24* 0.07 0.16* 0.21* 0.32* 0.33* 0.34* 0.31* 0.41* 0.34* 1.00 Using Text Features 0.36* 0.28* 0.13* 0.22* 0.18 0.55* 0.20 0.59* 0.29 0.68* 1.00
Interpretation 0.26* 0.20* 0.16* 0.14* 0.31* 0.26* 0.44* 0.32* 0.16* 1.00
Reflection 0.22* 0.21* 0.13* 0.13* 0.18* 0.38* 0.44* 0.45* 0.37* 0.51* 0.36* 0.52* 0.28* 0.56* 1.00 Prediction/ Questioning 0.32* 0.31* 0.14* 0.11* 0.33* 0.29* 0.30* 0.12* 0.39* 0.23* 0.24* 1.00
Summary 0.31* 0.25* 0.22* 0.22* 0.20* 0.39* 0.37* 0.35* 1.00 Scaffolding: Vocabulary 0.33* 0.29* 0.26* 0.28* 0.34* 0.34* 0.39* 0.31* 0.65* 1.00 Literal Comprehension 0.26* 0.24* 0.18* 0.22* 0.23* 0.38* 0.32* 0.27* 0.45* 0.34* 1.00 Metacognitive Awareness 0.39* 0.38* 0.23* 0.14* 0.42* 0.54* 0.31* 0.49* 0.36* 1.00 * = Significant at the p<.05 level.
DRA2 Technical Manual 65
Factor Analysis In order to further examine the construct validity of the DRA2, factor analysis20 was conducted in order to determine: a) whether two distinct underlying dimensions emerged from the data (fluency and comprehension); and b) the extent to which fluency and comprehension indicators are measuring the theoretical trait(s) or attribute(s) they were designed to measure. The sample consisted of students assessed in the Spring of 2006 (see Appendix A). The DRA2 indicators for oral fluency and comprehension were first examined using a principal components analysis to determine the number of underlying dimensions reflected by the data. This was done separately for five levels of the DRA2 because the number of indicators for fluency and comprehension vary depending on the level. Table 17 shows the output that is used to determine the number of factors to extract. Specifically, the second column shows the eigenvalues (the variances extracted by the factors) and the third column expresses these values as the percent of total variance explained. Note that successive factors account for less and less variability as they are extracted – when there is little variability left there is no need to continue extracting factors. A common rule of thumb for extraction of factors is the “eigenvalue greater than 1” criteria. In addition, plotting the eigenvalues in a scree plot shows where the largest values are distinguishable from the other values and is an indication of the number of underlying dimensions. Based upon the eigenvalues21 and examination of the scree plot, two distinct factors emerged across all levels. The first factor accounted for 33% to 47% of the variance, the second factor explained 15% to 20%. Cumulatively, these two factors explained an ample amount of variability (ranging from 51% to 62% across the levels)22.
20 Factor analysis refers to a statistical approach that can be used to analyze interrelationships among variables and to explain these variables in terms of their common underlying dimensions (factors). There are different types of factor analysis that can be conducted, two main types of which are principal components analysis and common factor analysis. 21 Eigenvalues are computed from a correlation matrix. Because the indicators for the DRA2 are ordinal rather than interval, polychoric correlations were used instead of Pearson correlations. In addition, to facilitate presentation of results, components five and above (all of which had eigenvalues less than 1) are excluded from Table 13. 22 While there was possibly a third factor trying to emerge at some levels, the contribution of a third factor solution was negligible in terms of explaining additional variability.
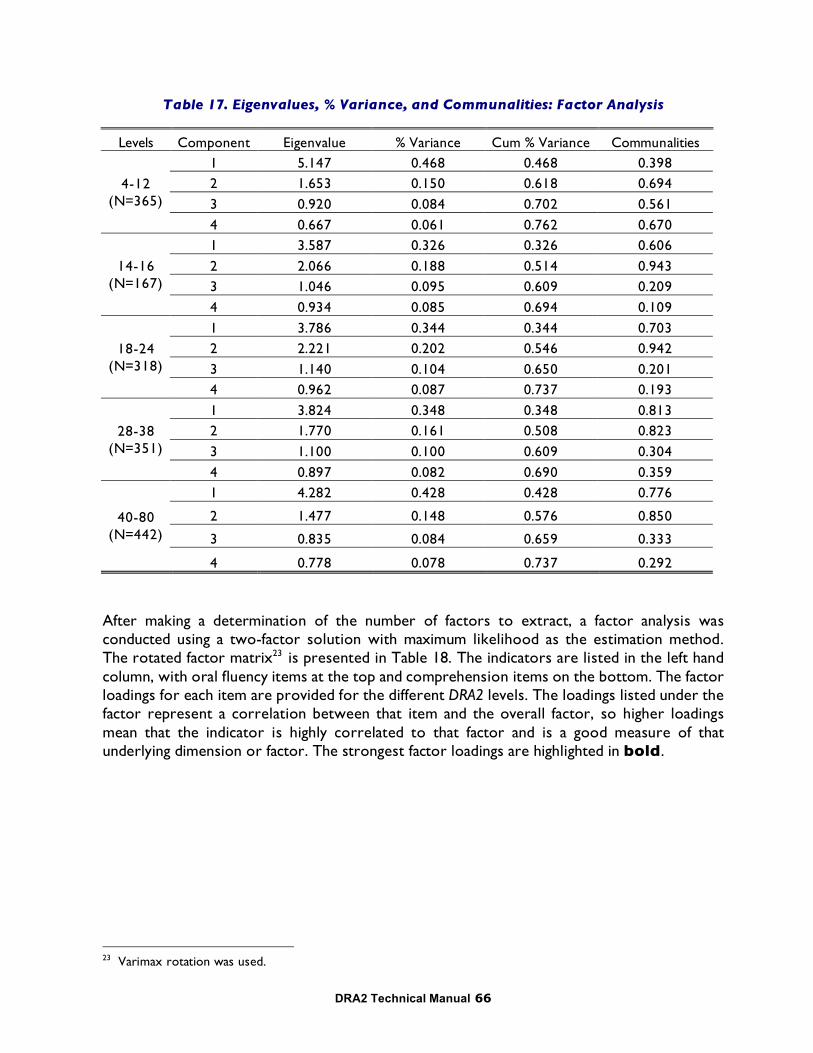
DRA2 Technical Manual 66
Table 17. Eigenvalues, % Variance, and Communalities: Factor Analysis
Levels Component Eigenvalue % Variance Cum % Variance Communalities 1 5.147 0.468 0.468 0.398 2 1.653 0.150 0.618 0.694 3 0.920 0.084 0.702 0.561
4-12 (N=365)
4 0.667 0.061 0.762 0.670 1 3.587 0.326 0.326 0.606 2 2.066 0.188 0.514 0.943 3 1.046 0.095 0.609 0.209
14-16 (N=167)
4 0.934 0.085 0.694 0.109 1 3.786 0.344 0.344 0.703 2 2.221 0.202 0.546 0.942 3 1.140 0.104 0.650 0.201
18-24 (N=318)
4 0.962 0.087 0.737 0.193 1 3.824 0.348 0.348 0.813 2 1.770 0.161 0.508 0.823 3 1.100 0.100 0.609 0.304
28-38 (N=351)
4 0.897 0.082 0.690 0.359 1 4.282 0.428 0.428 0.776
2 1.477 0.148 0.576 0.850
3 0.835 0.084 0.659 0.333
40-80 (N=442)
4 0.778 0.078 0.737 0.292
After making a determination of the number of factors to extract, a factor analysis was conducted using a two-factor solution with maximum likelihood as the estimation method. The rotated factor matrix23 is presented in Table 18. The indicators are listed in the left hand column, with oral fluency items at the top and comprehension items on the bottom. The factor loadings for each item are provided for the different DRA2 levels. The loadings listed under the factor represent a correlation between that item and the overall factor, so higher loadings mean that the indicator is highly correlated to that factor and is a good measure of that underlying dimension or factor. The strongest factor loadings are highlighted in bold.
23 Varimax rotation was used.
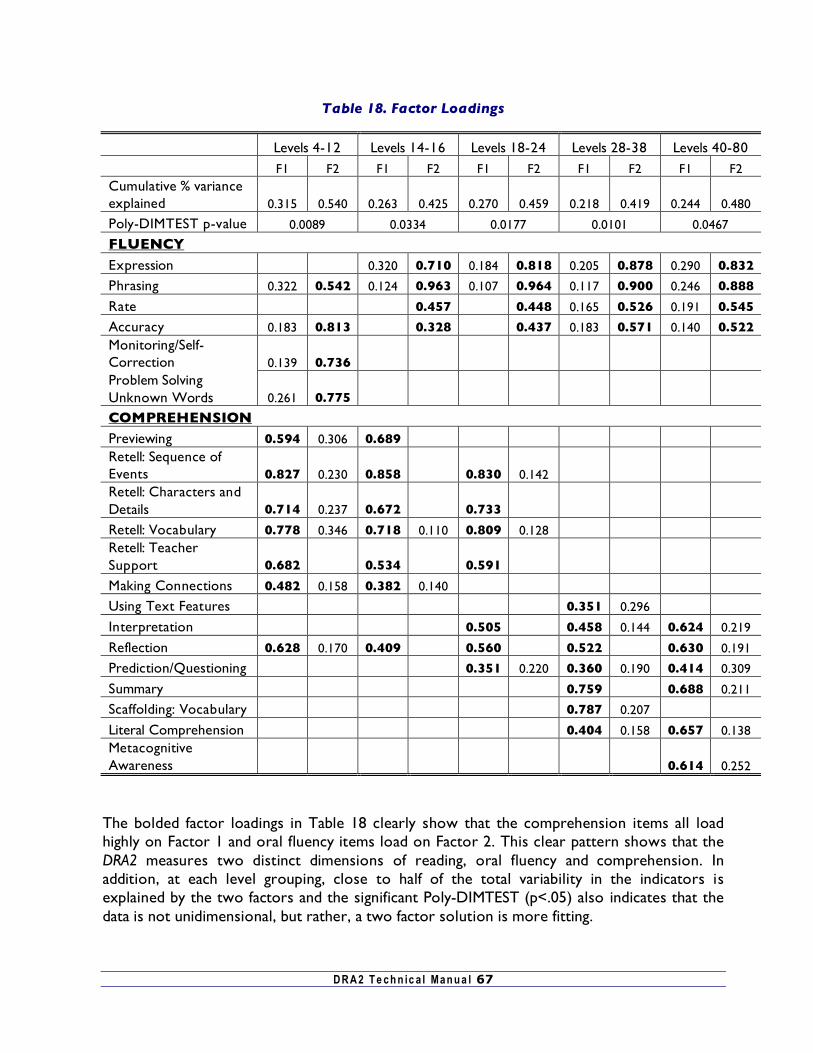
DRA2 T e ch n ic a l Man u a l 67
Table 18. Factor Loadings
Levels 4-12 Levels 14-16 Levels 18-24 Levels 28-38 Levels 40-80 F1 F2 F1 F2 F1 F2 F1 F2 F1 F2 Cumulative % variance explained 0.315 0.540 0.263 0.425 0.270 0.459 0.218 0.419 0.244 0.480
Poly-DIMTEST p-value 0.0089 0.0334 0.0177 0.0101 0.0467
FLUENCY
Expression 0.320 0.710 0.184 0.818 0.205 0.878 0.290 0.832
Phrasing 0.322 0.542 0.124 0.963 0.107 0.964 0.117 0.900 0.246 0.888
Rate 0.457 0.448 0.165 0.526 0.191 0.545
Accuracy 0.183 0.813 0.328 0.437 0.183 0.571 0.140 0.522 Monitoring/Self-Correction 0.139 0.736 Problem Solving Unknown Words 0.261 0.775
COMPREHENSION
Previewing 0.594 0.306 0.689 Retell: Sequence of Events 0.827 0.230 0.858 0.830 0.142 Retell: Characters and Details 0.714 0.237 0.672 0.733
Retell: Vocabulary 0.778 0.346 0.718 0.110 0.809 0.128 Retell: Teacher Support 0.682 0.534 0.591
Making Connections 0.482 0.158 0.382 0.140
Using Text Features 0.351 0.296
Interpretation 0.505 0.458 0.144 0.624 0.219
Reflection 0.628 0.170 0.409 0.560 0.522 0.630 0.191
Prediction/Questioning 0.351 0.220 0.360 0.190 0.414 0.309
Summary 0.759 0.688 0.211
Scaffolding: Vocabulary 0.787 0.207
Literal Comprehension 0.404 0.158 0.657 0.138 Metacognitive Awareness 0.614 0.252
The bolded factor loadings in Table 18 clearly show that the comprehension items all load highly on Factor 1 and oral fluency items load on Factor 2. This clear pattern shows that the DRA2 measures two distinct dimensions of reading, oral fluency and comprehension. In addition, at each level grouping, close to half of the total variability in the indicators is explained by the two factors and the significant Poly-DIMTEST (p<.05) also indicates that the data is not unidimensional, but rather, a two factor solution is more fitting.
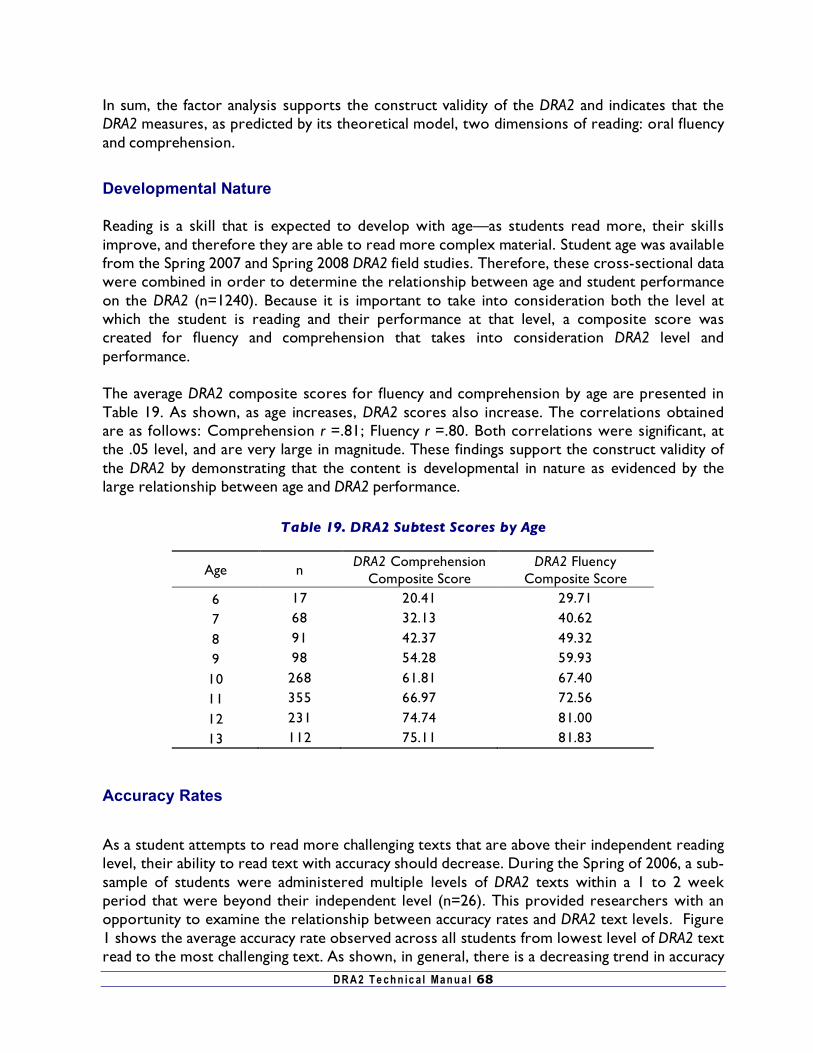
DRA2 T e ch n ic a l Man u a l 68
In sum, the factor analysis supports the construct validity of the DRA2 and indicates that the DRA2 measures, as predicted by its theoretical model, two dimensions of reading: oral fluency and comprehension.
Developmental Nature Reading is a skill that is expected to develop with age—as students read more, their skills improve, and therefore they are able to read more complex material. Student age was available from the Spring 2007 and Spring 2008 DRA2 field studies. Therefore, these cross-sectional data were combined in order to determine the relationship between age and student performance on the DRA2 (n=1240). Because it is important to take into consideration both the level at which the student is reading and their performance at that level, a composite score was created for fluency and comprehension that takes into consideration DRA2 level and performance. The average DRA2 composite scores for fluency and comprehension by age are presented in Table 19. As shown, as age increases, DRA2 scores also increase. The correlations obtained are as follows: Comprehension r =.81; Fluency r =.80. Both correlations were significant, at the .05 level, and are very large in magnitude. These findings support the construct validity of the DRA2 by demonstrating that the content is developmental in nature as evidenced by the large relationship between age and DRA2 performance.
Table 19. DRA2 Subtest Scores by Age
Age n DRA2 Comprehension
Composite Score DRA2 Fluency
Composite Score 6 17 20.41 29.71
7 68 32.13 40.62
8 91 42.37 49.32
9 98 54.28 59.93
10 268 61.81 67.40
11 355 66.97 72.56
12 231 74.74 81.00
13 112 75.11 81.83
Accuracy Rates As a student attempts to read more challenging texts that are above their independent reading level, their ability to read text with accuracy should decrease. During the Spring of 2006, a sub-sample of students were administered multiple levels of DRA2 texts within a 1 to 2 week period that were beyond their independent level (n=26). This provided researchers with an opportunity to examine the relationship between accuracy rates and DRA2 text levels. Figure 1 shows the average accuracy rate observed across all students from lowest level of DRA2 text read to the most challenging text. As shown, in general, there is a decreasing trend in accuracy
DRA2 T e ch n ic a l Man u a l 69
as text level increases. Analysis showed that decreases in accuracy rates were significant, F(2,
46)=14.54, p<.001. These results provide further support for the construct validity of the DRA2 by supporting the predicted relationship between accuracy and difficult of the text—as more challenging texts are read, accuracy is negatively affected.
Figure 1. DRA2 Accuracy Rates by Text Level
Summary
It is imperative that a test is valid in order for the results to be accurately applied and interpreted. The findings presented on content-related validity, criterion-related validity and construct validity provide support for the validity of the DRA2. Specifically, the data show that the DRA2 subtests measure those constructs it was designed to measure – oral fluency and reading comprehension. Elaborating on this, results show that oral fluency and reading comprehension, as measured by the DRA2, represent unique dimensions of reading. However, results also show that these two subtests are correlated with one another at a moderate level -- as would be expected since comprehension and fluency are both related facets of reading which are highly correlated to the total reading score. Additionally, results indicate that
DRA2 T e ch n ic a l Man u a l 70
fluency and reading comprehension measures are developmental in nature, as demonstrated by the strong correlations with age, and that accuracy is influenced, as predicted, by reading more challenging texts. In sum, the results presented indicate that the DRA2 is a valid measure that can accurately measure students’ oral reading fluency and comprehension level.
DRA2 T e ch n ic a l Man u a l 71
Word Analysis Technical Information
Overview of the DRA Word Analysis Each year as teachers administer the DRA2, they often encounter a number of students who make little or no progress in their ability to read more challenging texts due to inefficient word analysis skills and/ or strategies. Some of these students are “struggling” readers who do not know how to efficiently problem-solve unknown words they meet in text. Their oral reading is often slow, choppy, and repetitious as they work to figure out words. Others are at-risk emerging readers who do not understand how oral language relates to written language or how to attend to print. To help these at-risk struggling and emerging readers, teachers need further information about their knowledge and skills in working with words in context and in isolation. The DRA Word Analysis was created for this very purpose. The DRA Word Analysis is a diagnostic assessment that provides classroom and reading teachers with a systematic means to observe how struggling and emerging readers attend to and work with the various components of spoken and written words. It consists of forty word analysis tasks that assess a student’s level of control. The DRA Word Analysis is divided into five strands: (1) phonological awareness, (2) metalanguage (language used to talk about printed language concepts), (3) letter/high-frequency word recognition, (4) phonics, and (5) structural analysis and syllabication. The tasks, as much as possible, reflect what developing readers need to know and do in order to successfully problem-solve unknown or less familiar words as they read meaningful texts. They are sequenced in order of difficulty based upon the performance of students at the same DRA text levels as well as research-based expectations for phonological awareness. The information gained from DRA Word Analysis will enable teachers to 1. Determine students’ level of control of various word analysis tasks. 2. Document students’ progress over time. 3. Group students according to their instructional needs. 4. Plan more effectively for instruction.
Development of the DRA Word Analysis
The DRA Word Analysis was developed over a period of years. Beginning in the spring of 2000, an analysis of all words included within the DRA leveled texts, the types of miscues children made while reading DRA texts, and research-based information concerning developing readers’ ability to attend to and work with words was compiled. An initial draft of the DRA Word Analysis drew upon these three resources and was shared with a small group of highly effective classroom, reading, and speech teachers. The initial draft of the assessment was revised based on the feedback from this group.
DRA2 T e ch n ic a l Man u a l 72
Pilot Test Following these initial revisions, a pilot test was conducted in one urban, one rural, and two suburban schools in central Ohio in late spring and early fall of 2002. The pilot test included a small but representative sample across racial/ethnic, gender, and grade-level groups. The major purposes of the pilot test were to:
Observe how students responded to the tasks. Clarify the general directions as well as the directions for each task so that they were
clear and easy for teachers and students to follow. Clarify the assessment procedures and forms.
Discussions with teachers who administered the assessment as well as an analysis of students’ behaviors and responses resulted in major revisions. Tasks were revised; some tasks were deleted while other tasks were added; teacher directions were clarified; and the assessment materials were modified. Field Tests Subsequently, field tests were conducted in the winter and then again in the fall of 2003 by classroom and reading teachers across the United States. Urban, suburban, rural, and small town school settings were represented. The field tests included representative samples across racial/ethnic, gender, and grade-level groups. The purposes of the field tests included verifying that:
DRA Word Analysis is effective in assessing students’ abilities to attend to and work with components of spoken and written words.
Information gained from the assessment provided direction for future instruction. Assessment tasks were organized in a logical and developmentally appropriate order. Designated entry-level tasks were appropriate for students reading at specific DRA text
levels. Directions and forms were clear and manageable.
Teacher directions and student forms were further revised based upon teacher feedback as well as teacher and student performance. Tasks were revised and reordered based on student performance.
DRA2 T e ch n ic a l Man u a l 73
Theoretical Framework of the DRA Word Analysis: Developing Proficient Readers and the DRA Word Analysis
Proficient readers are able to read more complex texts due to effective word analysis skills and strategies. They skillfully attend to letter information, use spelling pattern/sound relationships, and recognize familiar spelling and syllable patterns as they identify words while constructing meaning. They continue to extend and deepen their vocabularies and concepts by reading many and diverse texts. They see themselves as readers, spend time reading, and become better readers each time they read. Struggling Readers
Most “struggling” readers, on the other hand, are unable to read more complex texts due to ineffective word analysis skills and strategies. They generally pay less attention to letter information and often neglect vowel patterns within words as well as middle and ending syllables of polysyllabic words when problem-solving unknown words. They have limited reading experiences and frequently are given texts that are too difficult for them to read and comprehend independently. As a result, they do not perceive themselves as readers; they often avoid reading and are reluctant to engage with longer and/or more challenging texts. Emerging Readers
Emerging readers are learning how speech and print are related, about letter/sound relationships, and how to attend to letters and words in text. Some emerging readers in kindergarten and beginning first grade, unlike their peers who have spent many hours listening to and “rereading” books as well as drawing and scribbling messages, come to school with very limited literacy experiences. These students, like many of the struggling readers, are at risk due to factors beyond their control. They need to be carefully monitored, immersed in oral and written language, introduced to rhyming and alliteration, and helped to develop basic concepts about print. To help these at-risk emerging and/or struggling readers obtain the necessary skills and strategies to become proficient readers is a big challenge. The more teachers know about the reading process, how proficient readers attend to and analyze words while constructing meaning, and what their students currently know and can do as readers, the more successful they will be in providing developmentally appropriate instruction and learning activities for all of their students. The DRA Word Analysis helps teachers determine emerging and struggling readers’ levels of control in attending to and working with spoken and written words. The information gained from this assessment will enable teachers to make more effective teaching decisions to help emerging and struggling readers gain the word analysis skills and strategies needed to read and comprehend more challenging texts. The chart on the following pages illustrates the alignment between the behavior of proficient readers and the DRA Word Analysis tasks within the five strands.
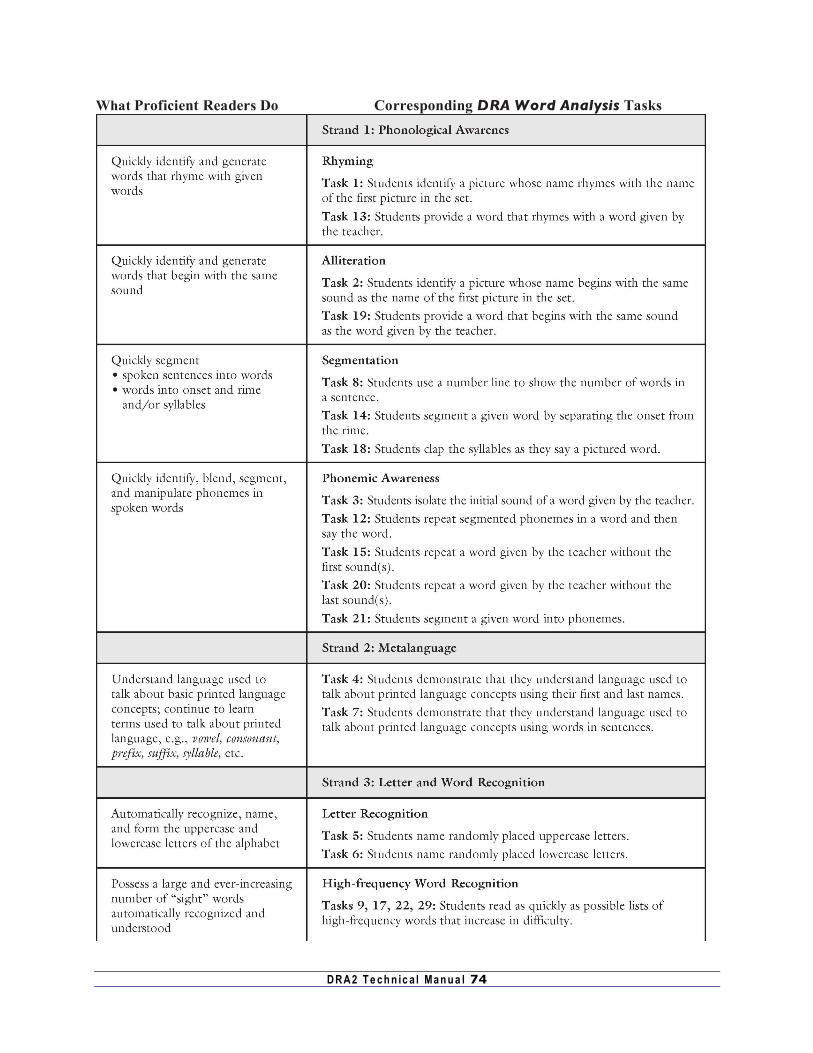
DRA2 T e ch n ic a l Man u a l 74
What Proficient Readers Do Corresponding DRA Word Analysis Tasks
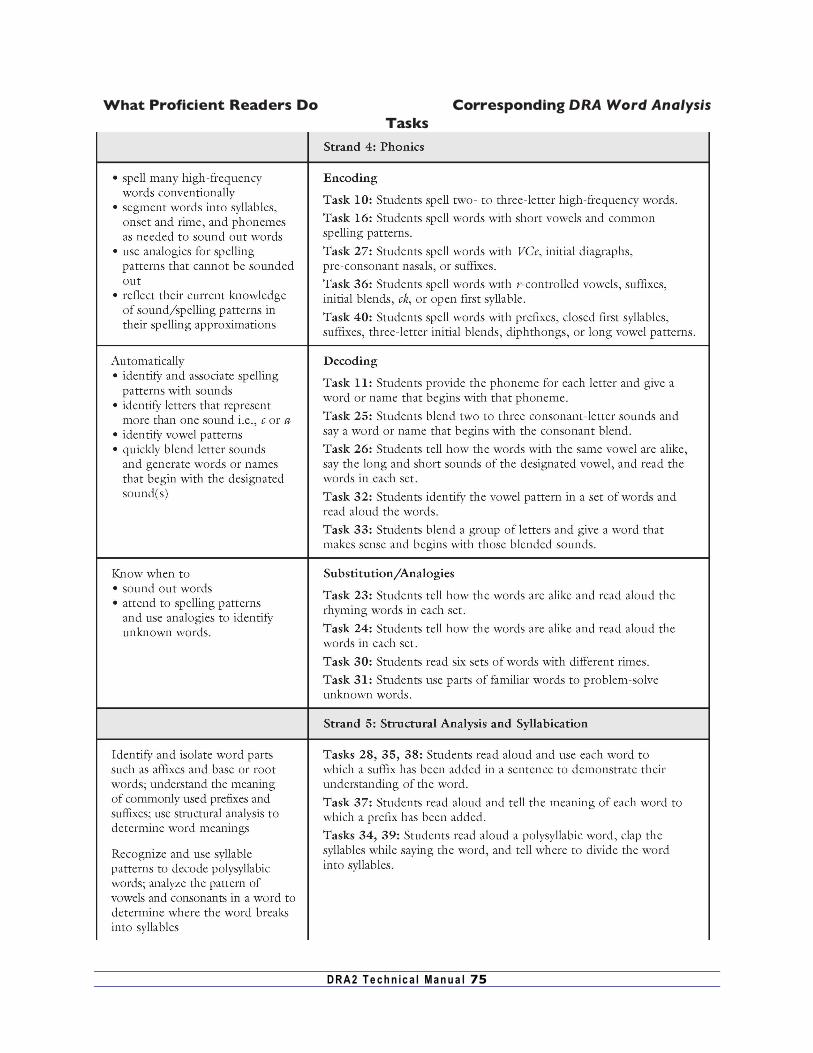
DRA2 T e ch n ic a l Man u a l 75
What Proficient Readers Do Corresponding DRA Word Analysis Tasks
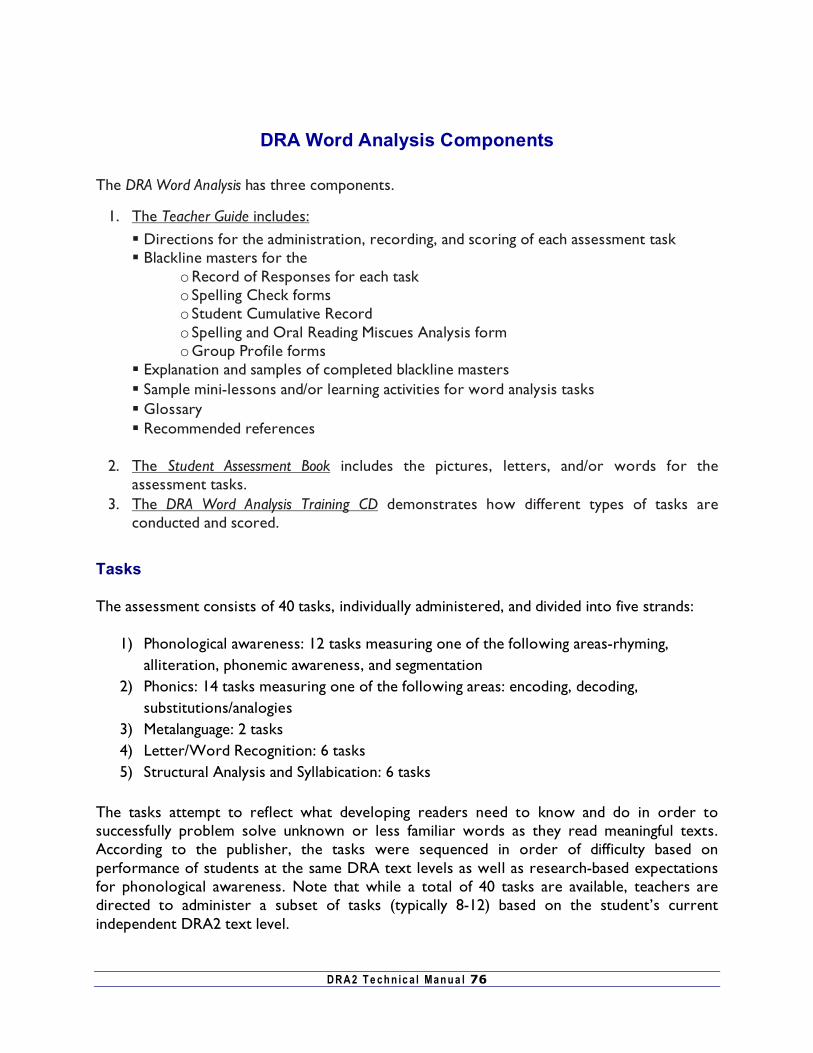
DRA2 T e ch n ic a l Man u a l 76
DRA Word Analysis Components
The DRA Word Analysis has three components.
1. The Teacher Guide includes: Directions for the administration, recording, and scoring of each assessment task Blackline masters for the
o Record of Responses for each task o Spelling Check forms o Student Cumulative Record o Spelling and Oral Reading Miscues Analysis form o Group Profile forms
Explanation and samples of completed blackline masters Sample mini-lessons and/or learning activities for word analysis tasks Glossary Recommended references
2. The Student Assessment Book includes the pictures, letters, and/or words for the
assessment tasks. 3. The DRA Word Analysis Training CD demonstrates how different types of tasks are
conducted and scored.
Tasks The assessment consists of 40 tasks, individually administered, and divided into five strands:
1) Phonological awareness: 12 tasks measuring one of the following areas-rhyming,
alliteration, phonemic awareness, and segmentation 2) Phonics: 14 tasks measuring one of the following areas: encoding, decoding,
substitutions/analogies 3) Metalanguage: 2 tasks 4) Letter/Word Recognition: 6 tasks 5) Structural Analysis and Syllabication: 6 tasks
The tasks attempt to reflect what developing readers need to know and do in order to successfully problem solve unknown or less familiar words as they read meaningful texts. According to the publisher, the tasks were sequenced in order of difficulty based on performance of students at the same DRA text levels as well as research-based expectations for phonological awareness. Note that while a total of 40 tasks are available, teachers are directed to administer a subset of tasks (typically 8-12) based on the student’s current independent DRA2 text level.
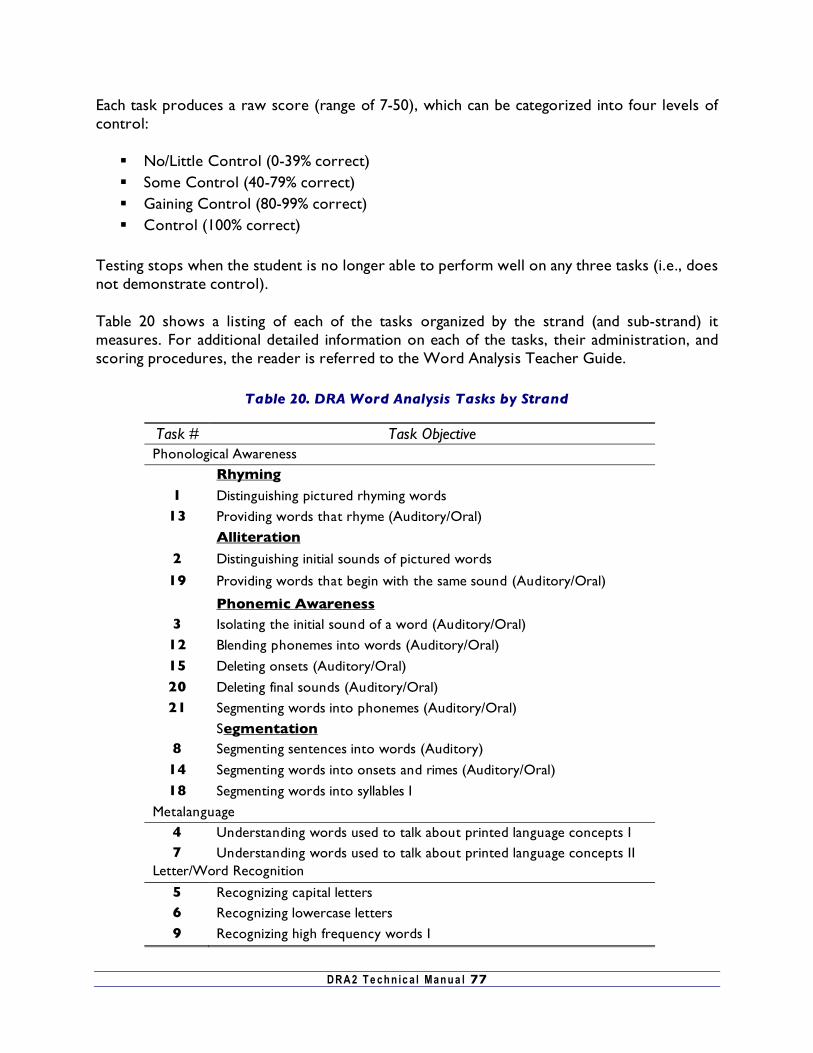
DRA2 T e ch n ic a l Man u a l 77
Each task produces a raw score (range of 7-50), which can be categorized into four levels of control:
No/Little Control (0-39% correct) Some Control (40-79% correct) Gaining Control (80-99% correct) Control (100% correct)
Testing stops when the student is no longer able to perform well on any three tasks (i.e., does not demonstrate control). Table 20 shows a listing of each of the tasks organized by the strand (and sub-strand) it measures. For additional detailed information on each of the tasks, their administration, and scoring procedures, the reader is referred to the Word Analysis Teacher Guide.
Table 20. DRA Word Analysis Tasks by Strand
Task # Task Objective Phonological Awareness
Rhyming
1 Distinguishing pictured rhyming words 13 Providing words that rhyme (Auditory/Oral)
Alliteration
2 Distinguishing initial sounds of pictured words
19 Providing words that begin with the same sound (Auditory/Oral)
Phonemic Awareness 3 Isolating the initial sound of a word (Auditory/Oral)
12 Blending phonemes into words (Auditory/Oral) 15 Deleting onsets (Auditory/Oral) 20 Deleting final sounds (Auditory/Oral) 21 Segmenting words into phonemes (Auditory/Oral)
Segmentation 8 Segmenting sentences into words (Auditory)
14 Segmenting words into onsets and rimes (Auditory/Oral) 18 Segmenting words into syllables I
Metalanguage 4 Understanding words used to talk about printed language concepts I 7 Understanding words used to talk about printed language concepts II
Letter/Word Recognition
5 Recognizing capital letters 6 Recognizing lowercase letters 9 Recognizing high frequency words I
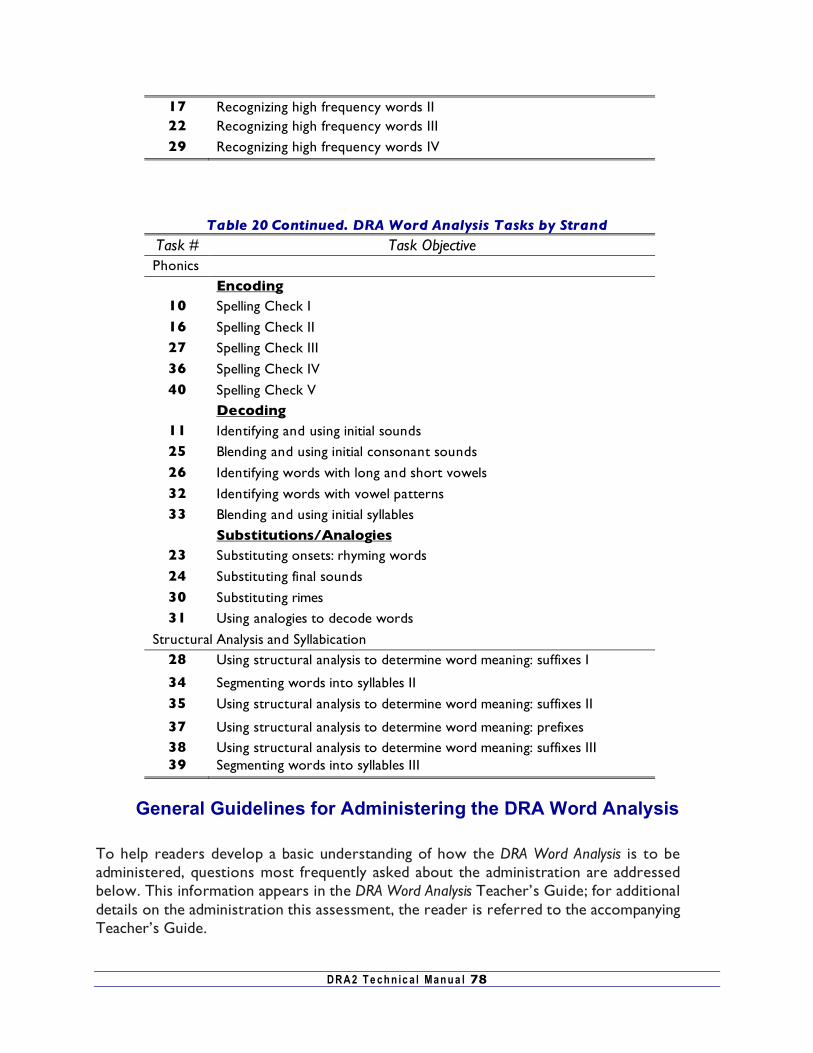
DRA2 T e ch n ic a l Man u a l 78
17 Recognizing high frequency words II 22 Recognizing high frequency words III 29 Recognizing high frequency words IV
Table 20 Continued. DRA Word Analysis Tasks by Strand Task # Task Objective Phonics Encoding
10 Spelling Check I 16 Spelling Check II 27 Spelling Check III 36 Spelling Check IV 40 Spelling Check V
Decoding 11 Identifying and using initial sounds 25 Blending and using initial consonant sounds 26 Identifying words with long and short vowels 32 Identifying words with vowel patterns 33 Blending and using initial syllables
Substitutions/Analogies 23 Substituting onsets: rhyming words 24 Substituting final sounds 30 Substituting rimes 31 Using analogies to decode words
Structural Analysis and Syllabication 28 Using structural analysis to determine word meaning: suffixes I
34 Segmenting words into syllables II 35 Using structural analysis to determine word meaning: suffixes II
37 Using structural analysis to determine word meaning: prefixes 38 Using structural analysis to determine word meaning: suffixes III 39 Segmenting words into syllables III
General Guidelines for Administering the DRA Word Analysis
To help readers develop a basic understanding of how the DRA Word Analysis is to be administered, questions most frequently asked about the administration are addressed below. This information appears in the DRA Word Analysis Teacher’s Guide; for additional details on the administration this assessment, the reader is referred to the accompanying Teacher’s Guide.
DRA2 T e ch n ic a l Man u a l 79
Who should administer the DRA Word Analysis? It is highly recommended that the teacher who is responsible for teaching the student to read should administer this assessment. Even though others could give it and share the results, much is gained by administering the assessment. The teacher who gives the assessment will:
Know what is expected. Have the opportunity to see how the student behaves and responds to the tasks. Know the student better. Be better prepared to make developmentally appropriate instructional decisions for
each student he/she assesses. To whom should teachers administer the DRA Word Analysis? The DRA Word Analysis is intended for:
Emerging readers in kindergarten and beginning first grade to identify their level of phonological awareness and basic knowledge of phoneme/grapheme relationships.
Struggling readers in the latter part of first grade through third grade who are reading below grade level or designated levels of proficiency due to ineffective word-solving skills and strategies.
Fourth- and fifth-grade students whose independent DRA text level is 38 or below. The DRA Word Analysis is not intended for:
Students who have demonstrated adequate progress on the DRA2 and are meeting established levels of proficiency.
Students who are able to decode a text but have difficulty demonstrating their comprehension of what they have read. These students need instruction on how to construct meaning using comprehension strategies and how to respond to and/or retell what they have read.
Students whose silent and oral reading rates are slow but who basically make only a few miscues. These students need instruction on how to read more fluently and should participate in repeated readings of familiar texts in order to become more fluent.
When should the DRA Word Analysis be administered? It is recommended that DRA Word Analysis be administered during the first part of the school year after the DRA2 has been administered to students in first through fifth grades. Teachers will use the information gained from the DRA2 to determine which emerging and/or struggling readers should be given this assessment. It is best to wait until midyear to give this assessment to emerging readers in kindergarten.
DRA2 T e ch n ic a l Man u a l 80
It is also recommended that teachers readminister the DRA Word Analysis midyear and at the end of the school year to:
Determine if students have gained control of those tasks that they initially demonstrated no, little, and/or some control.
Identify a new focus of instruction for students who are still reading below a designated level of proficiency on the DRA2 due to ineffective word-solving skills and strategies.
What materials are needed to administer the DRA Word Analysis? The materials needed to administer each task are listed in the beginning of the teacher directions for that task. In general, teachers will need:
A copy of the Record of Responses for each task to be administered A pen or pencil to record responses and observations A stopwatch for timed tasks The Student Cumulative Record for each student assessed A designated colored pen to record the student’s total scores on his/her Student
Cumulative Record How should teachers prepare to administer the DRA Word Analysis? It is important for teachers to become familiar with the directions and the guidelines for recording and scoring. In preparation, teachers should first watch the DRA Word Analysis Training DVD to learn how to administer the assessment, record student responses and behaviors, score the assessment, and use the information gained from this assessment. Next, they should read and/or reread the DRA Word Analysis general guidelines and administration procedures for each task they plan to administer. As with all assessments, this assessment will become easier to administer, record, and score with experience, but in order to ensure inter- and intra-rater reliability, it is critical that all teachers follow the directions each time a task is administered. Which DRA Word Analysis task should be administered first? The first time the DRA Word Analysis is administered, the initial task is determined by the student’s current independent DRA text level. All students will not begin with the same task. After identifying the student’s independent DRA text level, teachers will use the chart in the Teacher’s Guide to determine which DRA Word Analysis task to administer first. [Note: The designated entry tasks were based upon the performance of students who read the same DRA text levels in the 2003 field tests.] The second and/or subsequent times the DRA Word Analysis is administered, teachers will assess only those tasks on which the student did not previously demonstrate control. Once the student demonstrates control of a task, it does not need to be administered again. All the
DRA2 T e ch n ic a l Man u a l 81
other tasks previously administered will be reassessed as well as some new tasks each time the assessment is readministered. For example, if a student demonstrated control of Tasks 1 through 6 and 11 the first time the DRA Word Analysis was administered, the teacher would begin with Task 7 and assess 8, 9, 10, skip 11, and go on to 12, 13, etc. the second time the assessment is administered. When should teachers stop administering DRA Word Analysis tasks? Teachers are to begin with the recommended entry task and continue administering DRA Word Analysis tasks until the student performs any three tasks with no, little, and/or some control. Once the student has demonstrated no, little, and/or some control on any three tasks, teachers should stop assessing. The three tasks do not need to be in consecutive order. Student performance on the various DRA Word Analysis tasks frequently reflects previous literacy experiences and instruction, or the lack thereof. How long does it take to administer the DRA Word Analysis? Each assessment task takes, on average, two to three minutes to administer. Some of the higher-level spelling checks may take slightly longer, especially if the student is slow in responding. Generally, it is best to plan to administer as many tasks as possible within a fifteen-minute block of time. Even though the tasks vary in what students are to do, some students have a difficult time staying focused for a longer period of time. The vast majority of emerging readers in the 2003 field tests were finished in less than twelve minutes. The early (DRA text levels 4–12) through extending (DRA text levels 28–38) readers varied in the number of tasks they completed, and some students required several sittings.
How should the information from the DRA Word Analysis be used? The information gained from this assessment should be used to help make instructional decisions. Transferring the scores from the Record of Responses onto the Student Cumulative Record will enable teachers to quickly identify the strengths and instructional needs of each student assessed. Once teachers are aware of what students need to gain control over, they are able to plan more effectively for instruction and monitor progress over time. Suggested mini-lessons to support student learning are listed in the Teacher’s Guide for each strand and DRA Word Analysis task. How should teachers prepare students for this assessment? Preparation for this assessment begins with good classroom instruction. During interactive writing, shared and guided reading, mini-lessons, as well as word sorts and word wall activities, teachers should call students’ attention to and teach these activities as developmentally appropriate to:
DRA2 T e ch n ic a l Man u a l 82
Understand language used to talk about printed language concepts. Identify letters and words within texts and in isolation. Use knowledge of sounds and spelling patterns to read and spell words. Identify and segment various parts of words (e.g., onsets, rimes, syllables, affixes, base
words). Substitute onsets and rimes. Blend, segment, and manipulate phonemes in spoken words. Identify and understand common prefixes and suffixes. Use structural analysis to determine the meaning of words.
If teachers think their students will be unfamiliar with one or more of the DRA Word Analysis tasks, they may use the suggested learning activities for each task in the Teacher’s Guide to demonstrate or explain how to do a task before administering the assessment. What are the other students doing while the teacher administers the assessment? Students should be involved in meaningful literacy learning activities that for the most part they are able to sustain while the teacher administers the DRA Word Analysis to selected students. For example, students could reread familiar texts, read to a partner or volunteer, draw as a preliminary step to writing, sort words, practice forming letters, illustrate texts they have written, draw as a response to a text read, listen to stories on tape, and/or complete other assignments.
When possible, teachers could team up and work together to provide each other with time to assess the identified students. While one assesses, the other could work with the combined group of students for a period of time. What if teachers find the terms and/or language used in the DRA Word Analysis unfamiliar, confusing, and/or difficult to remember? Teachers, like the students they work with, are in the process of learning and extending their understanding of words, labels, and/or terms used to talk about language and word components. While students are learning to understand words like first, last, consonant, and vowel, teachers are learning to grasp and understand words like phonological awareness, phoneme, alliteration, onset, rime, etc. Several steps have been taken to help teachers develop a better understanding of the language included in the DRA Word Analysis.
A general definition, when appropriate, has been included with the text the first time the word appears.
The Student Cumulative Record is organized so teachers can see the relationship of the tasks within each strand and subset. At times, the title of the task helps to clarify the label for the strand and/or subset. For example, under “Alliteration” the titles for Tasks 2 and 19, “Distinguishes initial sounds of pictured words” and “Provides words
DRA2 T e ch n ic a l Man u a l 83
that begin with the same sound,” support the meaning of alliteration. A glossary including a basic definition and sometimes an example has been included in
the Teacher’s Guide as a reference. Should the DRA2 be given before the DRA Word Analysis is administered a second and/or third time? It is important that teachers administer the DRA2 first. The DRA2 will show if the students have learned how to efficiently use what they know to problem-solve unknown words while constructing meaning in a slightly more challenging DRA text level. That will be a true indication of progress. If students are able to read an on-grade-level DRA text, then it is not necessary to readminister the DRA Word Analysis. For all students reading below grade level due to inefficient word analysis skills, it is recommended that teachers readminister the DRA2 and the DRA Word Analysis periodically (beginning of the year, midyear, and end of the year) to monitor progress and determine current instructional needs.
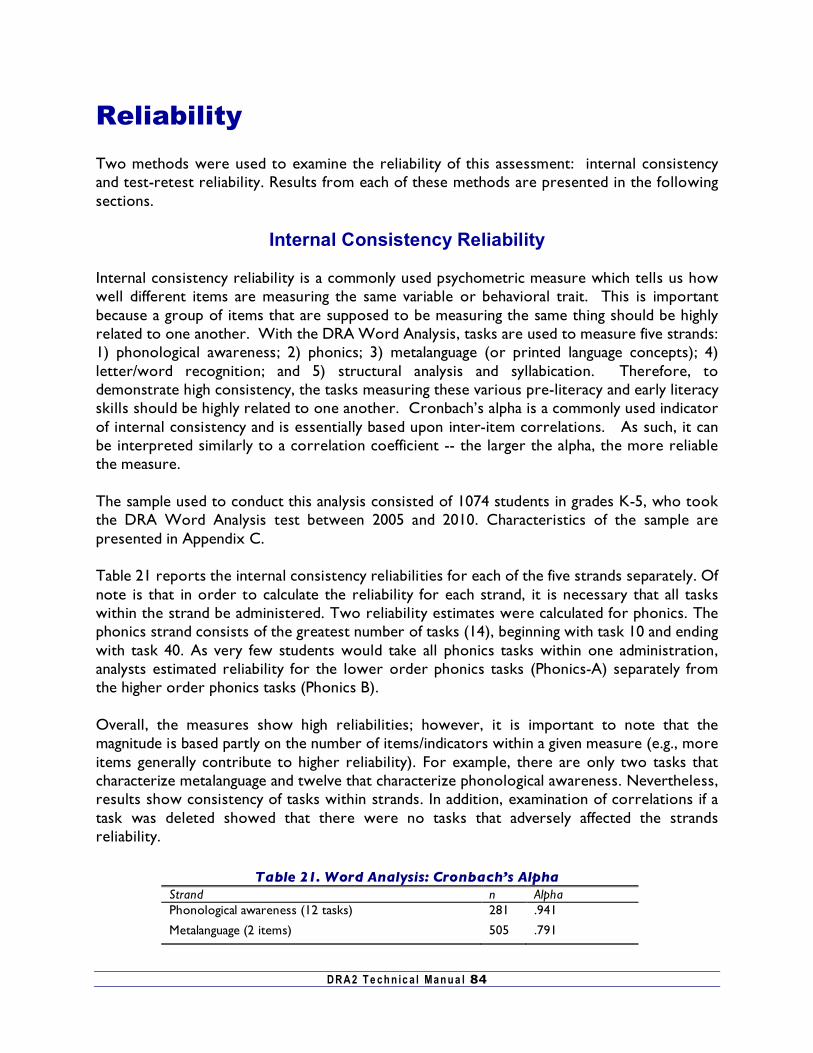
DRA2 T e ch n ic a l Man u a l 84
Reliability
Two methods were used to examine the reliability of this assessment: internal consistency and test-retest reliability. Results from each of these methods are presented in the following sections.
Internal Consistency Reliability Internal consistency reliability is a commonly used psychometric measure which tells us how well different items are measuring the same variable or behavioral trait. This is important because a group of items that are supposed to be measuring the same thing should be highly related to one another. With the DRA Word Analysis, tasks are used to measure five strands: 1) phonological awareness; 2) phonics; 3) metalanguage (or printed language concepts); 4) letter/word recognition; and 5) structural analysis and syllabication. Therefore, to demonstrate high consistency, the tasks measuring these various pre-literacy and early literacy skills should be highly related to one another. Cronbach’s alpha is a commonly used indicator of internal consistency and is essentially based upon inter-item correlations. As such, it can be interpreted similarly to a correlation coefficient -- the larger the alpha, the more reliable the measure. The sample used to conduct this analysis consisted of 1074 students in grades K-5, who took the DRA Word Analysis test between 2005 and 2010. Characteristics of the sample are presented in Appendix C.
Table 21 reports the internal consistency reliabilities for each of the five strands separately. Of note is that in order to calculate the reliability for each strand, it is necessary that all tasks within the strand be administered. Two reliability estimates were calculated for phonics. The phonics strand consists of the greatest number of tasks (14), beginning with task 10 and ending with task 40. As very few students would take all phonics tasks within one administration, analysts estimated reliability for the lower order phonics tasks (Phonics-A) separately from the higher order phonics tasks (Phonics B).
Overall, the measures show high reliabilities; however, it is important to note that the magnitude is based partly on the number of items/indicators within a given measure (e.g., more items generally contribute to higher reliability). For example, there are only two tasks that characterize metalanguage and twelve that characterize phonological awareness. Nevertheless, results show consistency of tasks within strands. In addition, examination of correlations if a task was deleted showed that there were no tasks that adversely affected the strands reliability.
Table 21. Word Analysis: Cronbach’s Alpha Strand n Alpha Phonological awareness (12 tasks) 281 .941
Metalanguage (2 items) 505 .791
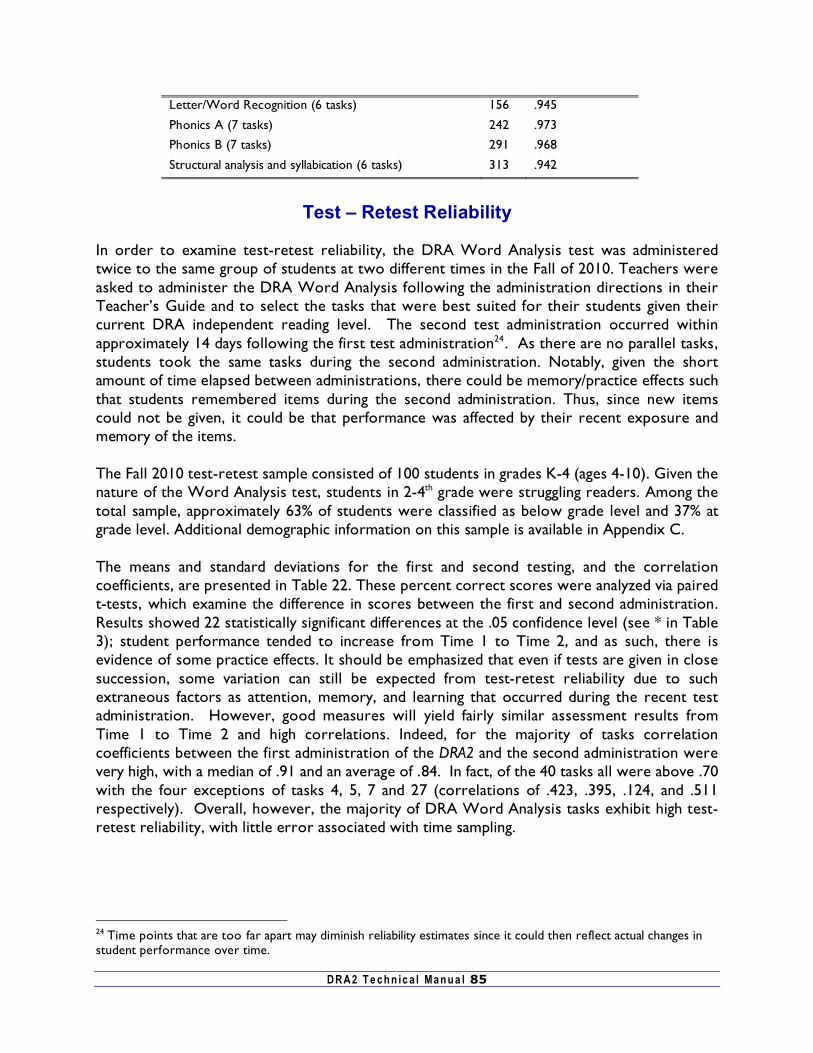
DRA2 T e ch n ic a l Man u a l 85
Letter/Word Recognition (6 tasks) 156 .945
Phonics A (7 tasks) 242 .973
Phonics B (7 tasks) 291 .968
Structural analysis and syllabication (6 tasks) 313 .942
Test – Retest Reliability
In order to examine test-retest reliability, the DRA Word Analysis test was administered twice to the same group of students at two different times in the Fall of 2010. Teachers were asked to administer the DRA Word Analysis following the administration directions in their Teacher’s Guide and to select the tasks that were best suited for their students given their current DRA independent reading level. The second test administration occurred within approximately 14 days following the first test administration24. As there are no parallel tasks, students took the same tasks during the second administration. Notably, given the short amount of time elapsed between administrations, there could be memory/practice effects such that students remembered items during the second administration. Thus, since new items could not be given, it could be that performance was affected by their recent exposure and memory of the items.
The Fall 2010 test-retest sample consisted of 100 students in grades K-4 (ages 4-10). Given the nature of the Word Analysis test, students in 2-4th grade were struggling readers. Among the total sample, approximately 63% of students were classified as below grade level and 37% at grade level. Additional demographic information on this sample is available in Appendix C.
The means and standard deviations for the first and second testing, and the correlation coefficients, are presented in Table 22. These percent correct scores were analyzed via paired t-tests, which examine the difference in scores between the first and second administration. Results showed 22 statistically significant differences at the .05 confidence level (see * in Table 3); student performance tended to increase from Time 1 to Time 2, and as such, there is evidence of some practice effects. It should be emphasized that even if tests are given in close succession, some variation can still be expected from test-retest reliability due to such extraneous factors as attention, memory, and learning that occurred during the recent test administration. However, good measures will yield fairly similar assessment results from Time 1 to Time 2 and high correlations. Indeed, for the majority of tasks correlation coefficients between the first administration of the DRA2 and the second administration were very high, with a median of .91 and an average of .84. In fact, of the 40 tasks all were above .70 with the four exceptions of tasks 4, 5, 7 and 27 (correlations of .423, .395, .124, and .511 respectively). Overall, however, the majority of DRA Word Analysis tasks exhibit high test-retest reliability, with little error associated with time sampling.
24 Time points that are too far apart may diminish reliability estimates since it could then reflect actual changes in student performance over time.

DRA2 T e ch n ic a l Man u a l 86
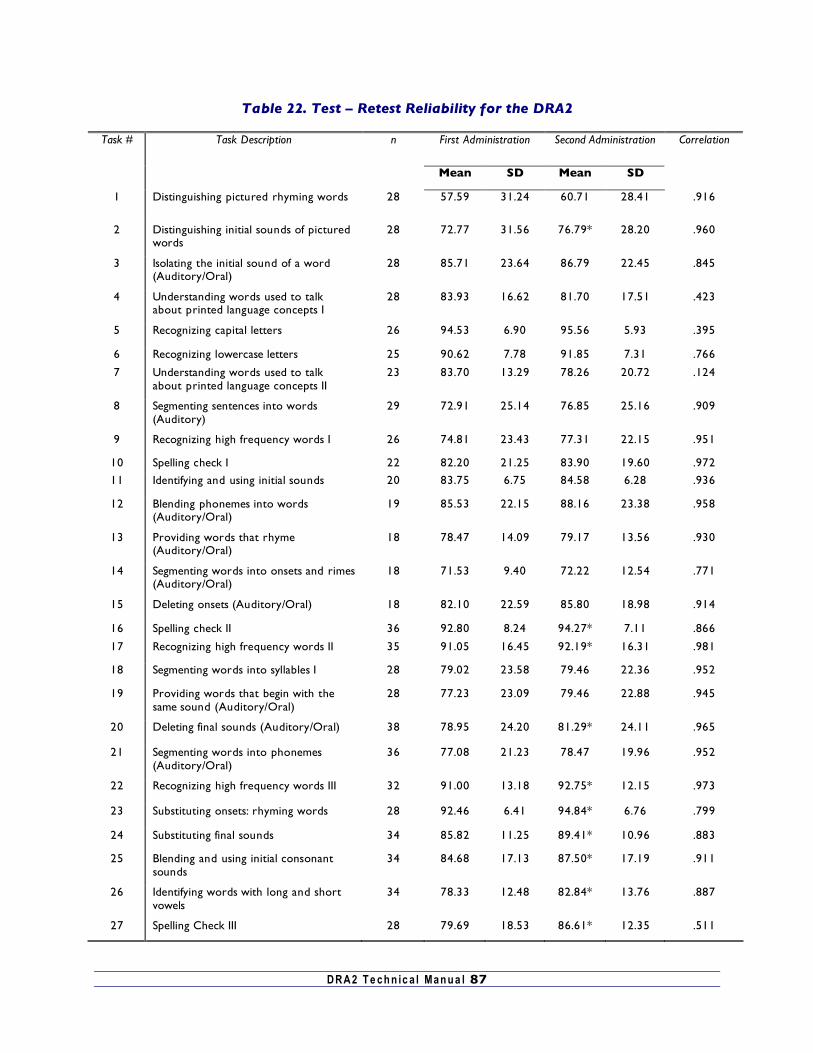
DRA2 T e ch n ic a l Man u a l 87
Table 22. Test – Retest Reliability for the DRA2
First Administration Second Administration Task # Task Description n
Mean SD Mean SD
Correlation
1 Distinguishing pictured rhyming words 28 57.59 31.24 60.71 28.41 .916
2 Distinguishing initial sounds of pictured words
28 72.77 31.56 76.79* 28.20 .960
3 Isolating the initial sound of a word (Auditory/Oral)
28 85.71 23.64 86.79 22.45 .845
4 Understanding words used to talk about printed language concepts I
28 83.93 16.62 81.70 17.51 .423
5 Recognizing capital letters 26 94.53 6.90 95.56 5.93 .395
6 Recognizing lowercase letters 25 90.62 7.78 91.85 7.31 .766
7 Understanding words used to talk about printed language concepts II
23 83.70 13.29 78.26 20.72 .124
8 Segmenting sentences into words (Auditory)
29 72.91 25.14 76.85 25.16 .909
9 Recognizing high frequency words I 26 74.81 23.43 77.31 22.15 .951
10 Spelling check I 22 82.20 21.25 83.90 19.60 .972
11 Identifying and using initial sounds 20 83.75 6.75 84.58 6.28 .936
12 Blending phonemes into words (Auditory/Oral)
19 85.53 22.15 88.16 23.38 .958
13 Providing words that rhyme (Auditory/Oral)
18 78.47 14.09 79.17 13.56 .930
14 Segmenting words into onsets and rimes (Auditory/Oral)
18 71.53 9.40 72.22 12.54 .771
15 Deleting onsets (Auditory/Oral) 18 82.10 22.59 85.80 18.98 .914
16 Spelling check II 36 92.80 8.24 94.27* 7.11 .866
17 Recognizing high frequency words II 35 91.05 16.45 92.19* 16.31 .981
18 Segmenting words into syllables I 28 79.02 23.58 79.46 22.36 .952
19 Providing words that begin with the same sound (Auditory/Oral)
28 77.23 23.09 79.46 22.88 .945
20 Deleting final sounds (Auditory/Oral) 38 78.95 24.20 81.29* 24.11 .965
21 Segmenting words into phonemes (Auditory/Oral)
36 77.08 21.23 78.47 19.96 .952
22 Recognizing high frequency words III 32 91.00 13.18 92.75* 12.15 .973
23 Substituting onsets: rhyming words 28 92.46 6.41 94.84* 6.76 .799
24 Substituting final sounds 34 85.82 11.25 89.41* 10.96 .883
25 Blending and using initial consonant sounds
34 84.68 17.13 87.50* 17.19 .911
26 Identifying words with long and short vowels
34 78.33 12.48 82.84* 13.76 .887
27 Spelling Check III 28 79.69 18.53 86.61* 12.35 .511
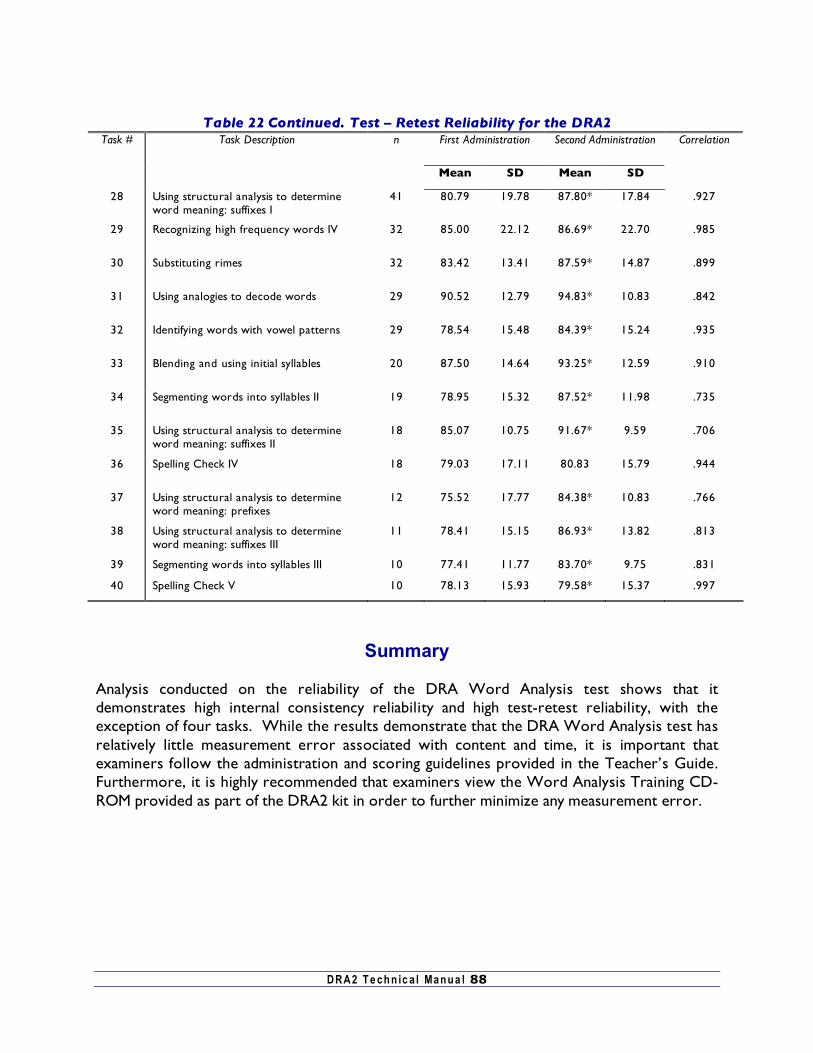
DRA2 T e ch n ic a l Man u a l 88
Table 22 Continued. Test – Retest Reliability for the DRA2
First Administration Second Administration Task # Task Description n
Mean SD Mean SD
Correlation
28 Using structural analysis to determine word meaning: suffixes I
41 80.79 19.78 87.80* 17.84 .927
29 Recognizing high frequency words IV 32 85.00 22.12 86.69* 22.70 .985
30 Substituting rimes 32 83.42 13.41 87.59* 14.87 .899
31 Using analogies to decode words 29 90.52 12.79 94.83* 10.83 .842
32 Identifying words with vowel patterns 29 78.54 15.48 84.39* 15.24 .935
33 Blending and using initial syllables 20 87.50 14.64 93.25* 12.59 .910
34 Segmenting words into syllables II 19 78.95 15.32 87.52* 11.98 .735
35 Using structural analysis to determine word meaning: suffixes II
18 85.07 10.75 91.67* 9.59 .706
36 Spelling Check IV 18 79.03 17.11 80.83 15.79 .944
37 Using structural analysis to determine word meaning: prefixes
12 75.52 17.77 84.38* 10.83 .766
38 Using structural analysis to determine word meaning: suffixes III
11 78.41 15.15 86.93* 13.82 .813
39 Segmenting words into syllables III 10 77.41 11.77 83.70* 9.75 .831
40 Spelling Check V 10 78.13 15.93 79.58* 15.37 .997
Summary
Analysis conducted on the reliability of the DRA Word Analysis test shows that it demonstrates high internal consistency reliability and high test-retest reliability, with the exception of four tasks. While the results demonstrate that the DRA Word Analysis test has relatively little measurement error associated with content and time, it is important that examiners follow the administration and scoring guidelines provided in the Teacher’s Guide. Furthermore, it is highly recommended that examiners view the Word Analysis Training CD-ROM provided as part of the DRA2 kit in order to further minimize any measurement error.
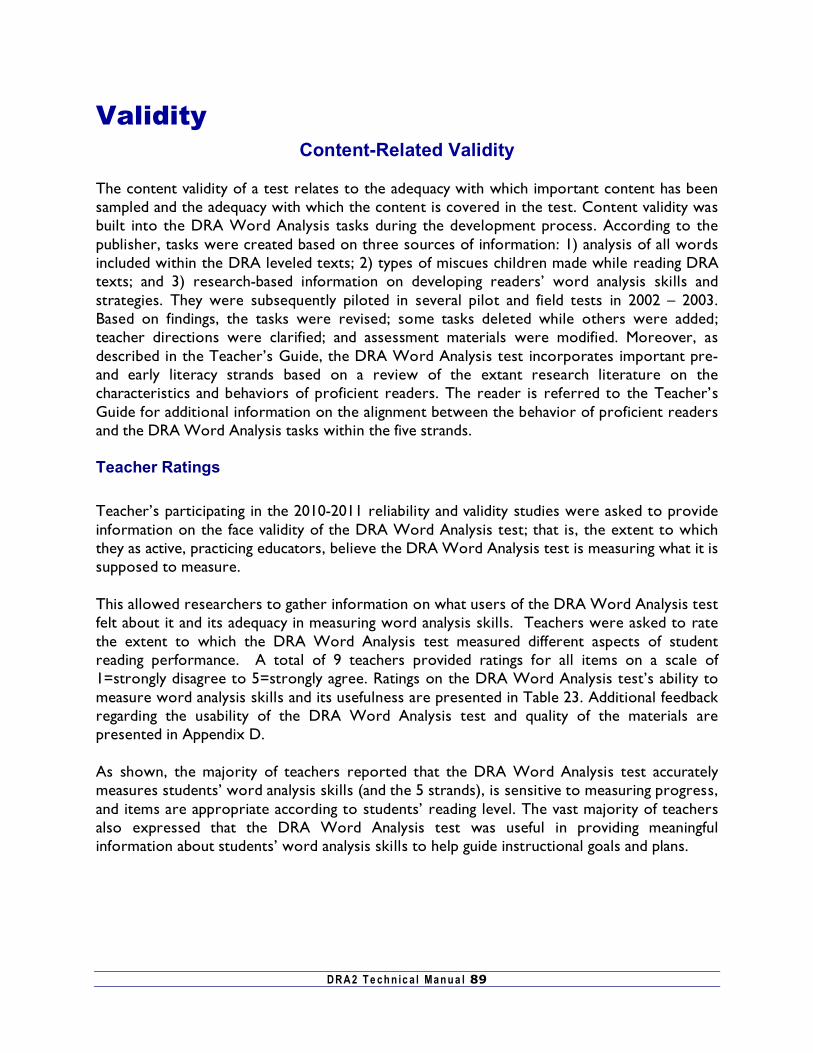
DRA2 T e ch n ic a l Man u a l 89
Validity Content-Related Validity
The content validity of a test relates to the adequacy with which important content has been sampled and the adequacy with which the content is covered in the test. Content validity was built into the DRA Word Analysis tasks during the development process. According to the publisher, tasks were created based on three sources of information: 1) analysis of all words included within the DRA leveled texts; 2) types of miscues children made while reading DRA texts; and 3) research-based information on developing readers’ word analysis skills and strategies. They were subsequently piloted in several pilot and field tests in 2002 – 2003. Based on findings, the tasks were revised; some tasks deleted while others were added; teacher directions were clarified; and assessment materials were modified. Moreover, as described in the Teacher’s Guide, the DRA Word Analysis test incorporates important pre- and early literacy strands based on a review of the extant research literature on the characteristics and behaviors of proficient readers. The reader is referred to the Teacher’s Guide for additional information on the alignment between the behavior of proficient readers and the DRA Word Analysis tasks within the five strands.
Teacher Ratings
Teacher’s participating in the 2010-2011 reliability and validity studies were asked to provide information on the face validity of the DRA Word Analysis test; that is, the extent to which they as active, practicing educators, believe the DRA Word Analysis test is measuring what it is supposed to measure.
This allowed researchers to gather information on what users of the DRA Word Analysis test felt about it and its adequacy in measuring word analysis skills. Teachers were asked to rate the extent to which the DRA Word Analysis test measured different aspects of student reading performance. A total of 9 teachers provided ratings for all items on a scale of 1=strongly disagree to 5=strongly agree. Ratings on the DRA Word Analysis test’s ability to measure word analysis skills and its usefulness are presented in Table 23. Additional feedback regarding the usability of the DRA Word Analysis test and quality of the materials are presented in Appendix D.
As shown, the majority of teachers reported that the DRA Word Analysis test accurately measures students’ word analysis skills (and the 5 strands), is sensitive to measuring progress, and items are appropriate according to students’ reading level. The vast majority of teachers also expressed that the DRA Word Analysis test was useful in providing meaningful information about students’ word analysis skills to help guide instructional goals and plans.
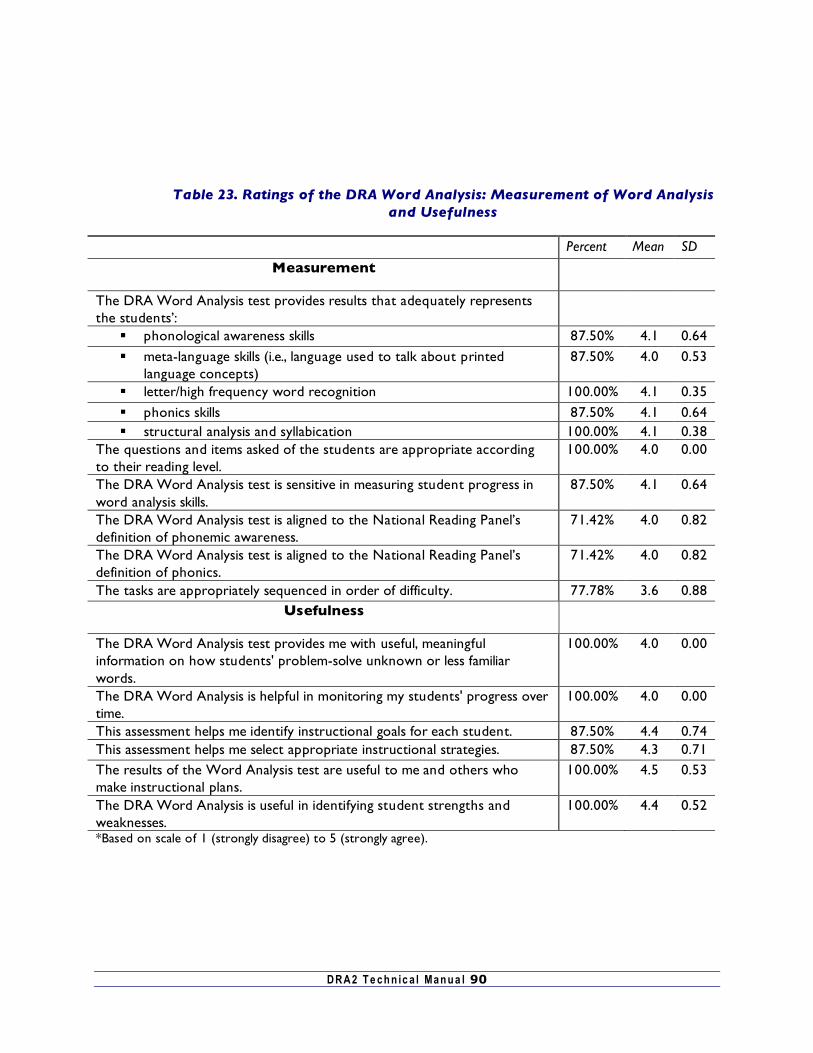
DRA2 T e ch n ic a l Man u a l 90
Table 23. Ratings of the DRA Word Analysis: Measurement of Word Analysis and Usefulness
Percent Mean SD
Measurement
The DRA Word Analysis test provides results that adequately represents the students’:
phonological awareness skills 87.50% 4.1 0.64 meta-language skills (i.e., language used to talk about printed
language concepts) 87.50% 4.0 0.53
letter/high frequency word recognition 100.00% 4.1 0.35 phonics skills 87.50% 4.1 0.64 structural analysis and syllabication 100.00% 4.1 0.38
The questions and items asked of the students are appropriate according to their reading level.
100.00% 4.0 0.00
The DRA Word Analysis test is sensitive in measuring student progress in word analysis skills.
87.50% 4.1 0.64
The DRA Word Analysis test is aligned to the National Reading Panel’s definition of phonemic awareness.
71.42% 4.0 0.82
The DRA Word Analysis test is aligned to the National Reading Panel’s definition of phonics.
71.42% 4.0 0.82
The tasks are appropriately sequenced in order of difficulty. 77.78% 3.6 0.88 Usefulness
The DRA Word Analysis test provides me with useful, meaningful information on how students' problem-solve unknown or less familiar words.
100.00% 4.0 0.00
The DRA Word Analysis is helpful in monitoring my students' progress over time.
100.00% 4.0 0.00
This assessment helps me identify instructional goals for each student. 87.50% 4.4 0.74 This assessment helps me select appropriate instructional strategies. 87.50% 4.3 0.71 The results of the Word Analysis test are useful to me and others who make instructional plans.
100.00% 4.5 0.53
The DRA Word Analysis is useful in identifying student strengths and weaknesses.
100.00% 4.4 0.52
*Based on scale of 1 (strongly disagree) to 5 (strongly agree).
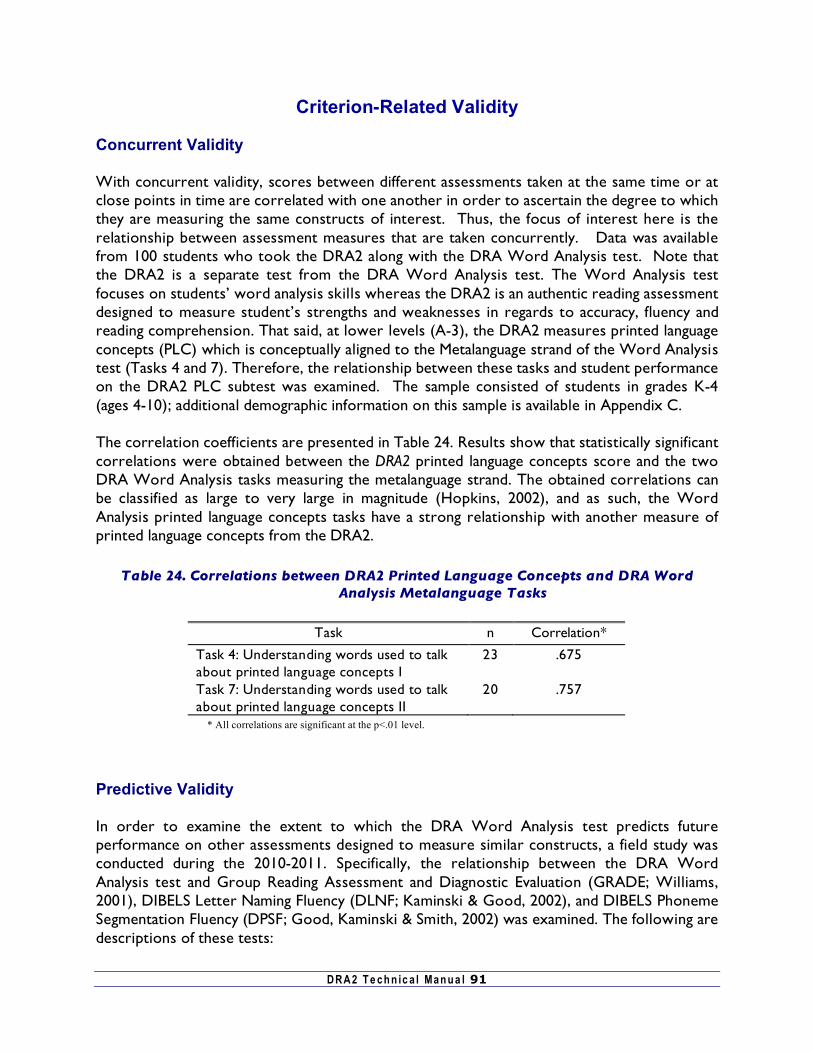
DRA2 T e ch n ic a l Man u a l 91
Criterion-Related Validity Concurrent Validity With concurrent validity, scores between different assessments taken at the same time or at close points in time are correlated with one another in order to ascertain the degree to which they are measuring the same constructs of interest. Thus, the focus of interest here is the relationship between assessment measures that are taken concurrently. Data was available from 100 students who took the DRA2 along with the DRA Word Analysis test. Note that the DRA2 is a separate test from the DRA Word Analysis test. The Word Analysis test focuses on students’ word analysis skills whereas the DRA2 is an authentic reading assessment designed to measure student’s strengths and weaknesses in regards to accuracy, fluency and reading comprehension. That said, at lower levels (A-3), the DRA2 measures printed language concepts (PLC) which is conceptually aligned to the Metalanguage strand of the Word Analysis test (Tasks 4 and 7). Therefore, the relationship between these tasks and student performance on the DRA2 PLC subtest was examined. The sample consisted of students in grades K-4 (ages 4-10); additional demographic information on this sample is available in Appendix C.
The correlation coefficients are presented in Table 24. Results show that statistically significant correlations were obtained between the DRA2 printed language concepts score and the two DRA Word Analysis tasks measuring the metalanguage strand. The obtained correlations can be classified as large to very large in magnitude (Hopkins, 2002), and as such, the Word Analysis printed language concepts tasks have a strong relationship with another measure of printed language concepts from the DRA2.
Table 24. Correlations between DRA2 Printed Language Concepts and DRA Word Analysis Metalanguage Tasks
* All correlations are significant at the p<.01 level.
Predictive Validity In order to examine the extent to which the DRA Word Analysis test predicts future performance on other assessments designed to measure similar constructs, a field study was conducted during the 2010-2011. Specifically, the relationship between the DRA Word Analysis test and Group Reading Assessment and Diagnostic Evaluation (GRADE; Williams, 2001), DIBELS Letter Naming Fluency (DLNF; Kaminski & Good, 2002), and DIBELS Phoneme Segmentation Fluency (DPSF; Good, Kaminski & Smith, 2002) was examined. The following are descriptions of these tests:
Task n Correlation*
Task 4: Understanding words used to talk about printed language concepts I
23 .675
Task 7: Understanding words used to talk about printed language concepts II
20 .757
DRA2 T e ch n ic a l Man u a l 92
The GRADE is a validated, norm-referenced test designed to measure developmentally
appropriate pre-reading and reading tasks. At levels P-K, students’ are assessed in the areas of phonological awareness, early literacy skills, and word reading. For the present study, students took the phonological awareness subtests (sound matching and rhyming), letter recognition, and word reading subtests, as these are more closely aligned to the DRA Word Analysis phonological awareness, letter/word recognition, and phonics strands respectively. Sound matching consists of two parts, “Begins with” and “Ends with”. Students are asked to mark the picture that begins or ends with the same sound as the stimulus word spoken by the teacher. There are 12 items and a point is awarded for each correct response. Rhyming requires the student to mark the picture that rhymes with the stimulus word spoken by the teacher. There are 14 items and a point is awarded for each correct response. Raw scores from the sound matching and rhyming subtests can be combined and converted to produce a phonological awareness score. Letter recognition consists of the teacher saying a letter name and asking the students to mark the correct letter out of 5 choices. There are 11 items and a point is awarded for each correct response. Word reading, which measures a student’s ability to decode phonetically regular words, consists of the teacher reading a word and asking the students to mark the word from a list of 4-5 choices. There are 20-30 items, depending on the level, and a point is awarded for each correct response.
The DLNF is a standardized, individually administered test. Students are presented with a page of uppercase and lowercase letters arranged in random order and are asked to name as many letters as they can. The student is given one minute and the number of correct letters named is the letter naming fluency score. This test is closely aligned to the letter/word recognition strand of the DRA Word Analysis (particularly tasks 5 and 6).
The DPSF is a standardized, individually administered test of phonological awareness.
The teacher orally presents a word of 3 to 4 phonemes. The student is required to verbally produce the individual phonemes for each word, and is awarded one point for each phoneme correctly produced within one minute. This test was correlated with the segmentation tasks (8, 14, 18, 21) within the phonological awareness strand of the DRA Word Analysis test.
The sample consisted of the same group of students (n=100) who participated in the test-retest reliability study. Students were administered the DRA Word Analysis test in October/November, 2010. Teachers were asked to administer the DRA Word Analysis following the Teacher’s Guide and to select the tasks that were best suited for their students given their current DRA independent reading level and/or prior performance on Word Analysis tasks. A strand score was produced by taking the mean of percent correct scores for tasks within the strand25. The GRADE and DIBELS subtests were administered approximately 25 Note that teachers in general administered 10 tasks, which rarely included all tasks within a single strand. For example, a participant may have administered 3 items from the phonological awareness strand, 3 from the phonics strand, and 4 from the letter/word recognition strand. Therefore, to minimize missing data, the average performance among tasks taken was used. Note that given internal consistency findings provided earlier, the tasks
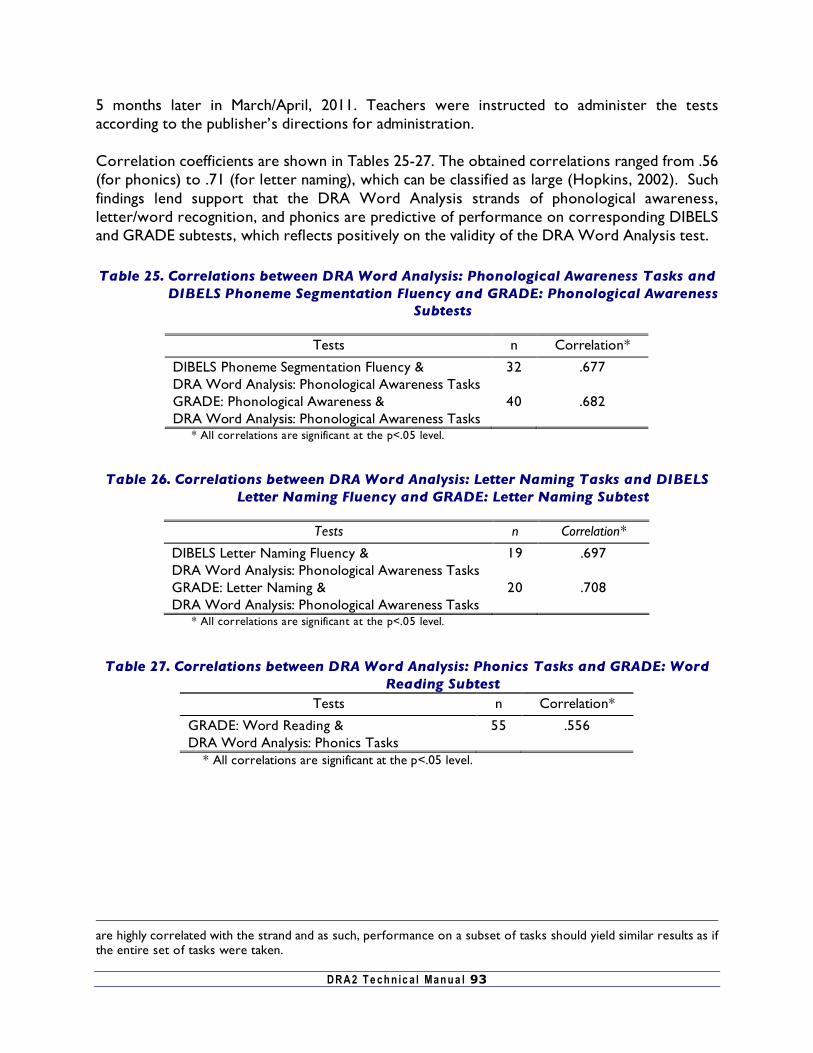
DRA2 T e ch n ic a l Man u a l 93
5 months later in March/April, 2011. Teachers were instructed to administer the tests according to the publisher’s directions for administration. Correlation coefficients are shown in Tables 25-27. The obtained correlations ranged from .56 (for phonics) to .71 (for letter naming), which can be classified as large (Hopkins, 2002). Such findings lend support that the DRA Word Analysis strands of phonological awareness, letter/word recognition, and phonics are predictive of performance on corresponding DIBELS and GRADE subtests, which reflects positively on the validity of the DRA Word Analysis test. Table 25. Correlations between DRA Word Analysis: Phonological Awareness Tasks and
DIBELS Phoneme Segmentation Fluency and GRADE: Phonological Awareness Subtests
Tests n Correlation*
DIBELS Phoneme Segmentation Fluency & DRA Word Analysis: Phonological Awareness Tasks
32 .677
GRADE: Phonological Awareness & DRA Word Analysis: Phonological Awareness Tasks
40 .682
* All correlations are significant at the p<.05 level.
Table 26. Correlations between DRA Word Analysis: Letter Naming Tasks and DIBELS Letter Naming Fluency and GRADE: Letter Naming Subtest
Tests n Correlation*
DIBELS Letter Naming Fluency & DRA Word Analysis: Phonological Awareness Tasks
19 .697
GRADE: Letter Naming & DRA Word Analysis: Phonological Awareness Tasks
20 .708
* All correlations are significant at the p<.05 level.
Table 27. Correlations between DRA Word Analysis: Phonics Tasks and GRADE: Word Reading Subtest
Tests n Correlation*
GRADE: Word Reading & DRA Word Analysis: Phonics Tasks
55 .556
* All correlations are significant at the p<.05 level.
are highly correlated with the strand and as such, performance on a subset of tasks should yield similar results as if the entire set of tasks were taken.
DRA2 Technical Manual 94
Construct Validity As previously noted, the DRA Word Analysis tasks are designed to measure the underlying construct of word analysis, defined by the following strands: 1) phonological awareness; 2) phonics; 3) metalanguage (or printed language concepts); 4) letter/word recognition; and 4) structural analysis and syllabication. Thus, when looking at construct validity, an overarching question of interest is, “to what extent does the DRA Word Analysis test provide high-quality information on students’ level of word analysis skills that it was originally designed to measure?” To this end, multiple methods were used to examine the construct validity of the DRA Word Analysis, with an emphasis being placed on examining the relationship between the theoretical pattern expected and the observed pattern (Trochim, 2006). The following section presents data on the construct validity of the DRA Word Analysis test. Methods for determining how the test relates to the theoretical construct that the test claims to measure include:
1. Distinguishing the construct from other constructs by convergent and divergent validity.
2. Showing that there are positive changes in performance over time, given that word analysis skills are developmental in nature.
3. Showing how test scores relate to special populations (English Language Learners) that should be linked to the construct.
Convergent and Divergent Validity
Convergent validity refers to the extent to which the measure is similar to (or converges on) other measures that it should be theoretically be related to. This was demonstrated via the high correlations presented between the DRA Word Analysis strands and the corresponding DIBELS, GRADE, and DRA2 subtests. Divergent (or discriminant) validity refers to the extent to which the measure is not associated with distinct constructs -- the more distinct, the smaller the correlation should be. For example, performance on a math test should show very little, if any, relationship with shoe size. Discriminant validity was explored by examining the correlations between the performance on the DRA Word Analysis test and gender, and minority status26. Theoretically, there should be no relationship between student performance on the tasks and their gender and ethnic background.
The sample used to conduct this analysis consisted of students in grades K-5, who took the DRA Word Analysis test between 2005 and 2010. Characteristics of the sample are presented in Appendix C.
26 Note that these results also speak towards the extent to which there is test bias.
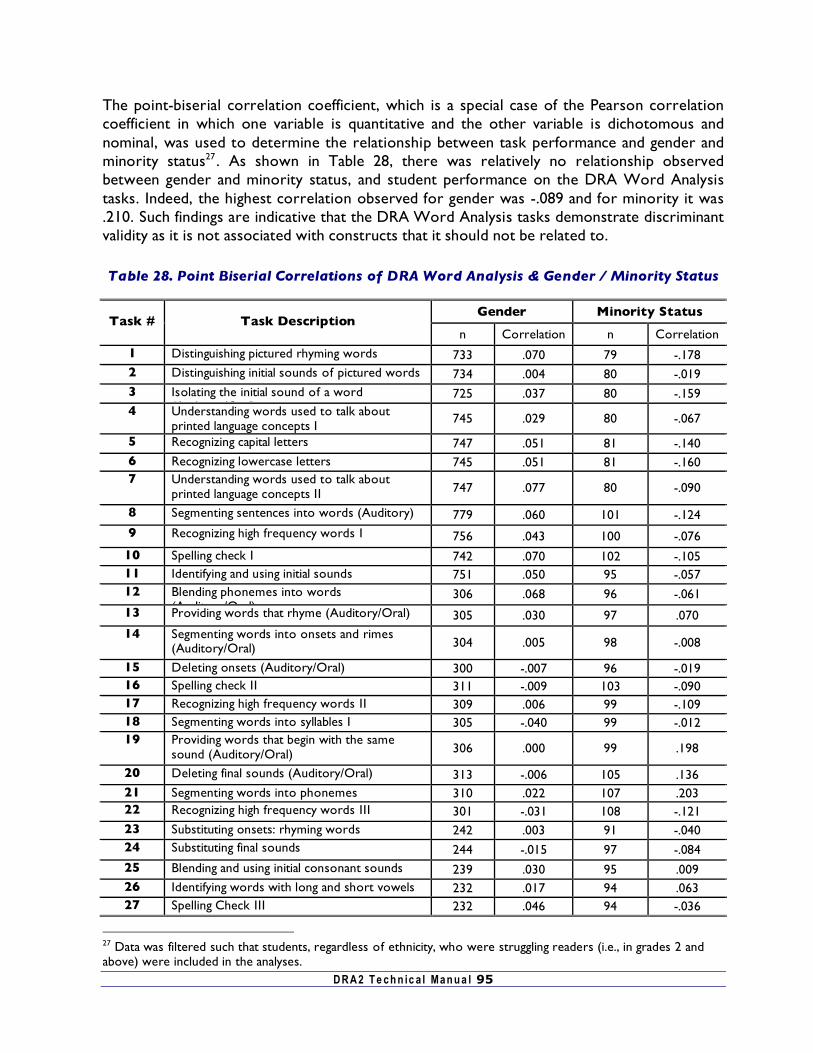
DRA2 T e ch n ic a l Man u a l 95
The point-biserial correlation coefficient, which is a special case of the Pearson correlation coefficient in which one variable is quantitative and the other variable is dichotomous and nominal, was used to determine the relationship between task performance and gender and minority status27. As shown in Table 28, there was relatively no relationship observed between gender and minority status, and student performance on the DRA Word Analysis tasks. Indeed, the highest correlation observed for gender was -.089 and for minority it was .210. Such findings are indicative that the DRA Word Analysis tasks demonstrate discriminant validity as it is not associated with constructs that it should not be related to.
Table 28. Point Biserial Correlations of DRA Word Analysis & Gender / Minority Status
Gender Minority Status Task # Task Description
n Correlation n Correlation 1 Distinguishing pictured rhyming words 733 .070 79 -.178 2 Distinguishing initial sounds of pictured words 734 .004 80 -.019 3 Isolating the initial sound of a word
(Auditory/Oral) 725 .037 80 -.159
4 Understanding words used to talk about printed language concepts I 745 .029 80 -.067
5 Recognizing capital letters 747 .051 81 -.140 6 Recognizing lowercase letters 745 .051 81 -.160 7 Understanding words used to talk about
printed language concepts II 747 .077 80 -.090
8 Segmenting sentences into words (Auditory) 779 .060 101 -.124 9 Recognizing high frequency words I 756 .043 100 -.076
10 Spelling check I 742 .070 102 -.105 11 Identifying and using initial sounds 751 .050 95 -.057 12 Blending phonemes into words
(Auditory/Oral) 306 .068 96 -.061
13 Providing words that rhyme (Auditory/Oral) 305 .030 97 .070 14 Segmenting words into onsets and rimes
(Auditory/Oral) 304 .005 98 -.008
15 Deleting onsets (Auditory/Oral) 300 -.007 96 -.019 16 Spelling check II 311 -.009 103 -.090 17 Recognizing high frequency words II 309 .006 99 -.109 18 Segmenting words into syllables I 305 -.040 99 -.012 19 Providing words that begin with the same
sound (Auditory/Oral) 306 .000 99 .198
20 Deleting final sounds (Auditory/Oral) 313 -.006 105 .136 21 Segmenting words into phonemes
(Auditory/Oral) 310 .022 107 .203
22 Recognizing high frequency words III 301 -.031 108 -.121 23 Substituting onsets: rhyming words 242 .003 91 -.040 24 Substituting final sounds 244 -.015 97 -.084 25 Blending and using initial consonant sounds 239 .030 95 .009 26 Identifying words with long and short vowels 232 .017 94 .063 27 Spelling Check III 232 .046 94 -.036
27 Data was filtered such that students, regardless of ethnicity, who were struggling readers (i.e., in grades 2 and above) were included in the analyses.

DRA2 T e ch n ic a l Man u a l 96
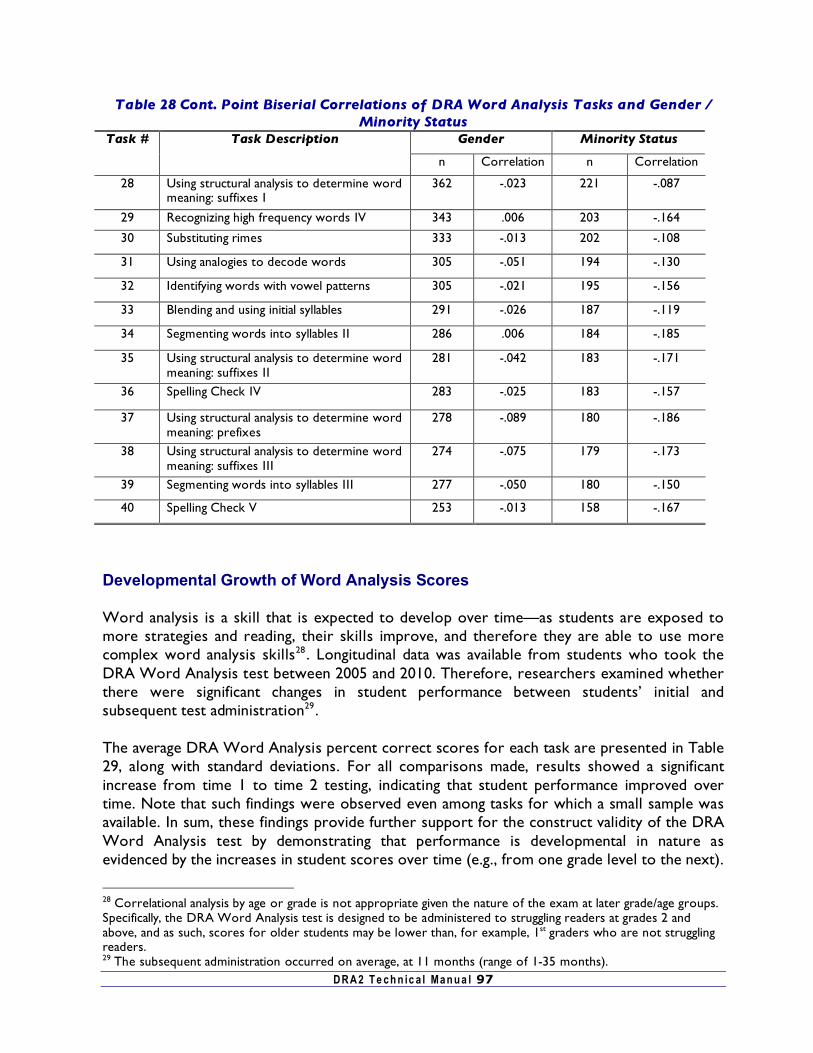
DRA2 T e ch n ic a l Man u a l 97
Table 28 Cont. Point Biserial Correlations of DRA Word Analysis Tasks and Gender / Minority Status
Gender Minority Status Task # Task Description
n Correlation n Correlation
28 Using structural analysis to determine word meaning: suffixes I
362 -.023 221 -.087
29 Recognizing high frequency words IV 343 .006 203 -.164
30 Substituting rimes 333 -.013 202 -.108
31 Using analogies to decode words 305 -.051 194 -.130
32 Identifying words with vowel patterns 305 -.021 195 -.156
33 Blending and using initial syllables 291 -.026 187 -.119
34 Segmenting words into syllables II 286 .006 184 -.185
35 Using structural analysis to determine word meaning: suffixes II
281 -.042 183 -.171
36 Spelling Check IV 283 -.025 183 -.157
37 Using structural analysis to determine word meaning: prefixes
278 -.089 180 -.186
38 Using structural analysis to determine word meaning: suffixes III
274 -.075 179 -.173
39 Segmenting words into syllables III 277 -.050 180 -.150
40 Spelling Check V 253 -.013 158 -.167
Developmental Growth of Word Analysis Scores Word analysis is a skill that is expected to develop over time—as students are exposed to more strategies and reading, their skills improve, and therefore they are able to use more complex word analysis skills28. Longitudinal data was available from students who took the DRA Word Analysis test between 2005 and 2010. Therefore, researchers examined whether there were significant changes in student performance between students’ initial and subsequent test administration29. The average DRA Word Analysis percent correct scores for each task are presented in Table 29, along with standard deviations. For all comparisons made, results showed a significant increase from time 1 to time 2 testing, indicating that student performance improved over time. Note that such findings were observed even among tasks for which a small sample was available. In sum, these findings provide further support for the construct validity of the DRA Word Analysis test by demonstrating that performance is developmental in nature as evidenced by the increases in student scores over time (e.g., from one grade level to the next).
28 Correlational analysis by age or grade is not appropriate given the nature of the exam at later grade/age groups. Specifically, the DRA Word Analysis test is designed to be administered to struggling readers at grades 2 and above, and as such, scores for older students may be lower than, for example, 1st graders who are not struggling readers. 29 The subsequent administration occurred on average, at 11 months (range of 1-35 months).
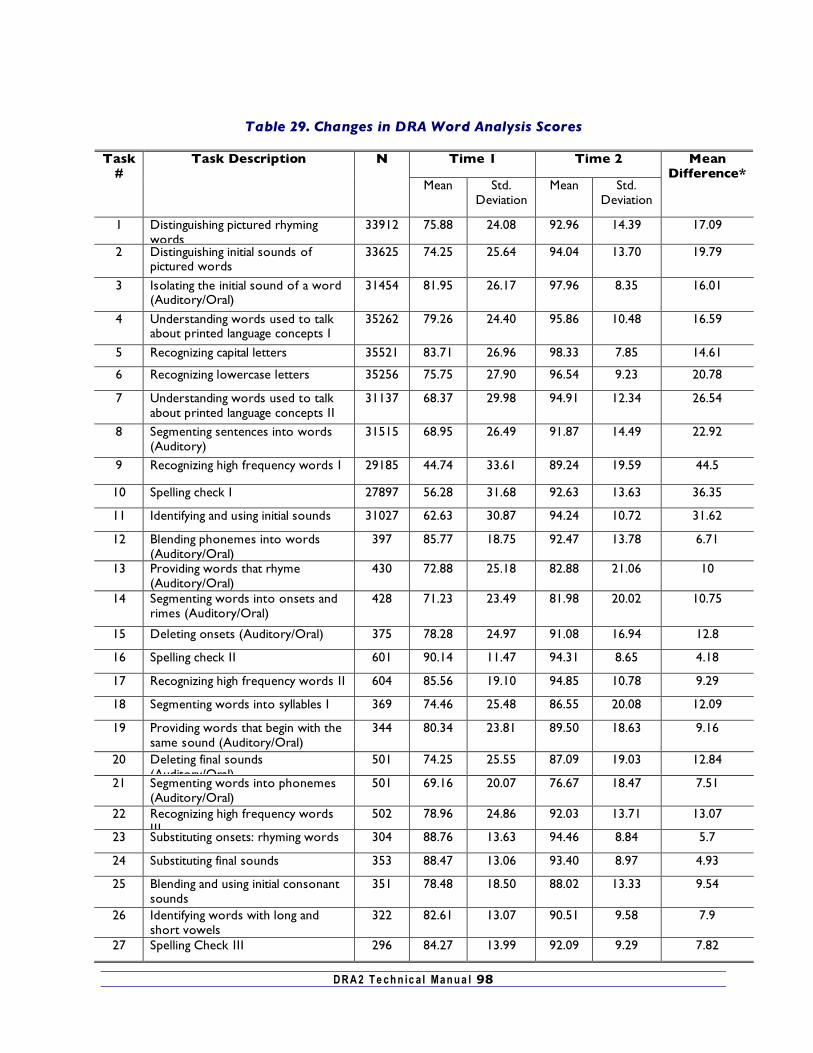
DRA2 T e ch n ic a l Man u a l 98
Table 29. Changes in DRA Word Analysis Scores
Time 1 Time 2 Task #
Task Description N
Mean Std. Deviation
Mean Std. Deviation
Mean Difference*
1 Distinguishing pictured rhyming words
33912 75.88 24.08 92.96 14.39 17.09
2 Distinguishing initial sounds of pictured words
33625 74.25 25.64 94.04 13.70 19.79
3 Isolating the initial sound of a word (Auditory/Oral)
31454 81.95 26.17 97.96 8.35 16.01
4 Understanding words used to talk about printed language concepts I
35262 79.26 24.40 95.86 10.48 16.59
5 Recognizing capital letters 35521 83.71 26.96 98.33 7.85 14.61
6 Recognizing lowercase letters 35256 75.75 27.90 96.54 9.23 20.78
7 Understanding words used to talk about printed language concepts II
31137 68.37 29.98 94.91 12.34 26.54
8 Segmenting sentences into words (Auditory)
31515 68.95 26.49 91.87 14.49 22.92
9 Recognizing high frequency words I 29185 44.74 33.61 89.24 19.59 44.5
10 Spelling check I 27897 56.28 31.68 92.63 13.63 36.35
11 Identifying and using initial sounds 31027 62.63 30.87 94.24 10.72 31.62
12 Blending phonemes into words (Auditory/Oral)
397 85.77 18.75 92.47 13.78 6.71
13 Providing words that rhyme (Auditory/Oral)
430 72.88 25.18 82.88 21.06 10
14 Segmenting words into onsets and rimes (Auditory/Oral)
428 71.23 23.49 81.98 20.02 10.75
15 Deleting onsets (Auditory/Oral) 375 78.28 24.97 91.08 16.94 12.8
16 Spelling check II 601 90.14 11.47 94.31 8.65 4.18
17 Recognizing high frequency words II 604 85.56 19.10 94.85 10.78 9.29
18 Segmenting words into syllables I 369 74.46 25.48 86.55 20.08 12.09
19 Providing words that begin with the same sound (Auditory/Oral)
344 80.34 23.81 89.50 18.63 9.16
20 Deleting final sounds (Auditory/Oral)
501 74.25 25.55 87.09 19.03 12.84
21 Segmenting words into phonemes (Auditory/Oral)
501 69.16 20.07 76.67 18.47 7.51
22 Recognizing high frequency words III
502 78.96 24.86 92.03 13.71 13.07
23 Substituting onsets: rhyming words 304 88.76 13.63 94.46 8.84 5.7
24 Substituting final sounds 353 88.47 13.06 93.40 8.97 4.93
25 Blending and using initial consonant sounds
351 78.48 18.50 88.02 13.33 9.54
26 Identifying words with long and short vowels
322 82.61 13.07 90.51 9.58 7.9
27 Spelling Check III 296 84.27 13.99 92.09 9.29 7.82
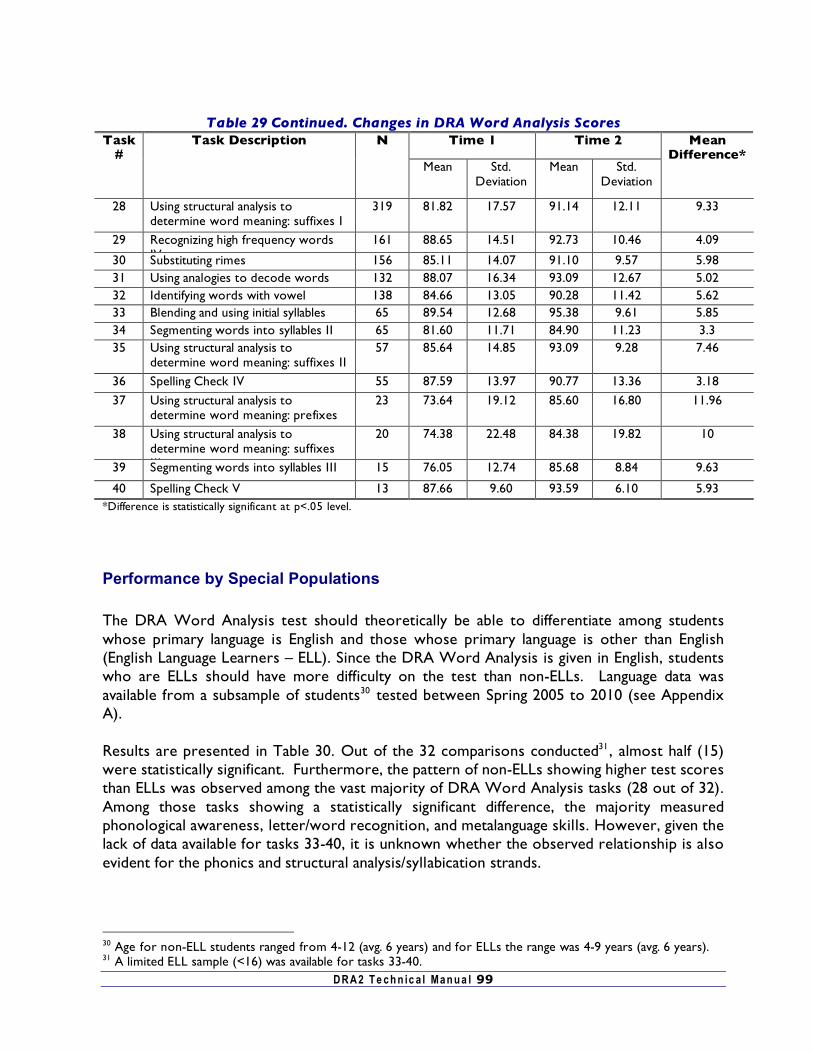
DRA2 T e ch n ic a l Man u a l 99
Table 29 Continued. Changes in DRA Word Analysis Scores
Time 1 Time 2 Task #
Task Description N
Mean Std. Deviation
Mean Std. Deviation
Mean Difference*
28 Using structural analysis to determine word meaning: suffixes I
319 81.82 17.57 91.14 12.11 9.33
29 Recognizing high frequency words IV
161 88.65 14.51 92.73 10.46 4.09
30 Substituting rimes 156 85.11 14.07 91.10 9.57 5.98 31 Using analogies to decode words 132 88.07 16.34 93.09 12.67 5.02 32 Identifying words with vowel
patterns 138 84.66 13.05 90.28 11.42 5.62
33 Blending and using initial syllables 65 89.54 12.68 95.38 9.61 5.85 34 Segmenting words into syllables II 65 81.60 11.71 84.90 11.23 3.3 35 Using structural analysis to
determine word meaning: suffixes II 57 85.64 14.85 93.09 9.28 7.46
36 Spelling Check IV 55 87.59 13.97 90.77 13.36 3.18
37 Using structural analysis to determine word meaning: prefixes
23 73.64 19.12 85.60 16.80 11.96
38 Using structural analysis to determine word meaning: suffixes III
20 74.38 22.48 84.38 19.82 10
39 Segmenting words into syllables III 15 76.05 12.74 85.68 8.84 9.63
40 Spelling Check V 13 87.66 9.60 93.59 6.10 5.93 *Difference is statistically significant at p<.05 level.
Performance by Special Populations
The DRA Word Analysis test should theoretically be able to differentiate among students whose primary language is English and those whose primary language is other than English (English Language Learners – ELL). Since the DRA Word Analysis is given in English, students who are ELLs should have more difficulty on the test than non-ELLs. Language data was available from a subsample of students30 tested between Spring 2005 to 2010 (see Appendix A). Results are presented in Table 30. Out of the 32 comparisons conducted31, almost half (15) were statistically significant. Furthermore, the pattern of non-ELLs showing higher test scores than ELLs was observed among the vast majority of DRA Word Analysis tasks (28 out of 32). Among those tasks showing a statistically significant difference, the majority measured phonological awareness, letter/word recognition, and metalanguage skills. However, given the lack of data available for tasks 33-40, it is unknown whether the observed relationship is also evident for the phonics and structural analysis/syllabication strands.
30 Age for non-ELL students ranged from 4-12 (avg. 6 years) and for ELLs the range was 4-9 years (avg. 6 years). 31 A limited ELL sample (<16) was available for tasks 33-40.
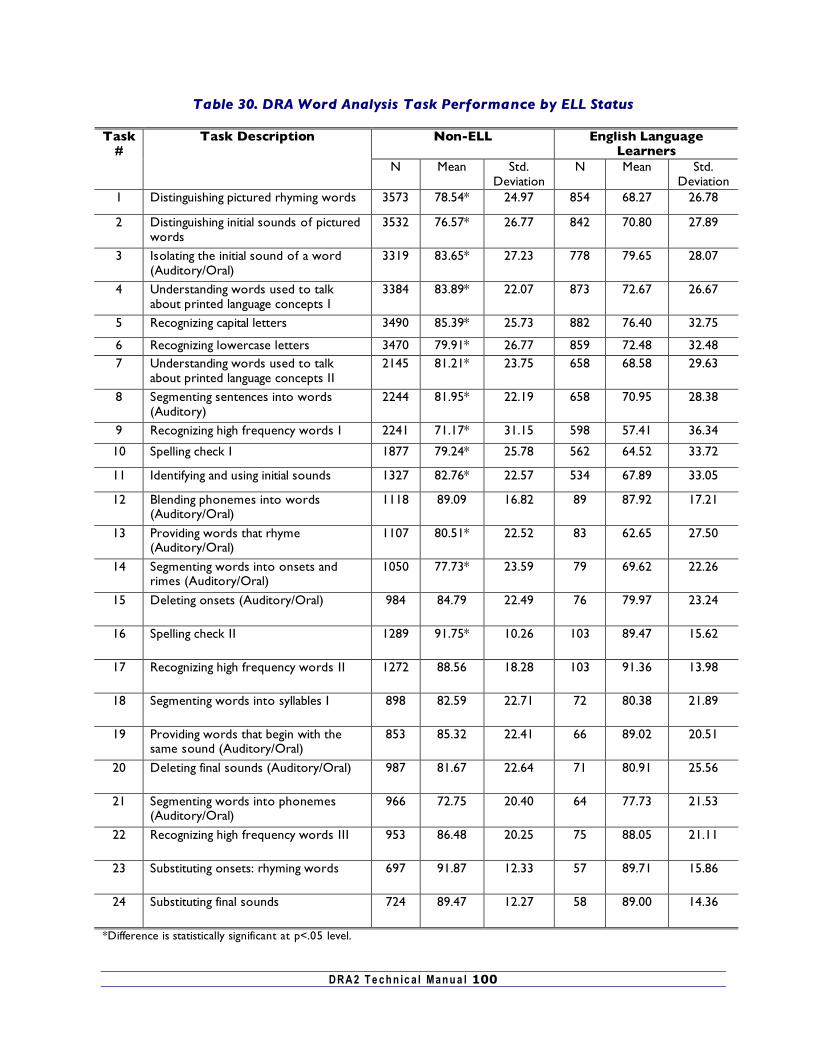
DRA2 T e ch n ic a l Man u a l 100
Table 30. DRA Word Analysis Task Performance by ELL Status
Non-ELL English Language Learners
Task #
Task Description
N Mean Std. Deviation
N Mean Std. Deviation
1 Distinguishing pictured rhyming words 3573 78.54* 24.97 854 68.27 26.78
2 Distinguishing initial sounds of pictured words
3532 76.57* 26.77 842 70.80 27.89
3 Isolating the initial sound of a word (Auditory/Oral)
3319 83.65* 27.23 778 79.65 28.07
4 Understanding words used to talk about printed language concepts I
3384 83.89* 22.07 873 72.67 26.67
5 Recognizing capital letters 3490 85.39* 25.73 882 76.40 32.75
6 Recognizing lowercase letters 3470 79.91* 26.77 859 72.48 32.48 7 Understanding words used to talk
about printed language concepts II 2145 81.21* 23.75 658 68.58 29.63
8 Segmenting sentences into words (Auditory)
2244 81.95* 22.19 658 70.95 28.38
9 Recognizing high frequency words I 2241 71.17* 31.15 598 57.41 36.34
10 Spelling check I 1877 79.24* 25.78 562 64.52 33.72
11 Identifying and using initial sounds 1327 82.76* 22.57 534 67.89 33.05
12 Blending phonemes into words (Auditory/Oral)
1118 89.09 16.82 89 87.92 17.21
13 Providing words that rhyme (Auditory/Oral)
1107 80.51* 22.52 83 62.65 27.50
14 Segmenting words into onsets and rimes (Auditory/Oral)
1050 77.73* 23.59 79 69.62 22.26
15 Deleting onsets (Auditory/Oral) 984 84.79 22.49 76 79.97 23.24
16 Spelling check II 1289 91.75* 10.26 103 89.47 15.62
17 Recognizing high frequency words II 1272 88.56 18.28 103 91.36 13.98
18 Segmenting words into syllables I 898 82.59 22.71 72 80.38 21.89
19 Providing words that begin with the same sound (Auditory/Oral)
853 85.32 22.41 66 89.02 20.51
20 Deleting final sounds (Auditory/Oral) 987 81.67 22.64 71 80.91 25.56
21 Segmenting words into phonemes (Auditory/Oral)
966 72.75 20.40 64 77.73 21.53
22 Recognizing high frequency words III 953 86.48 20.25 75 88.05 21.11
23 Substituting onsets: rhyming words 697 91.87 12.33 57 89.71 15.86
24 Substituting final sounds 724 89.47 12.27 58 89.00 14.36
*Difference is statistically significant at p<.05 level.
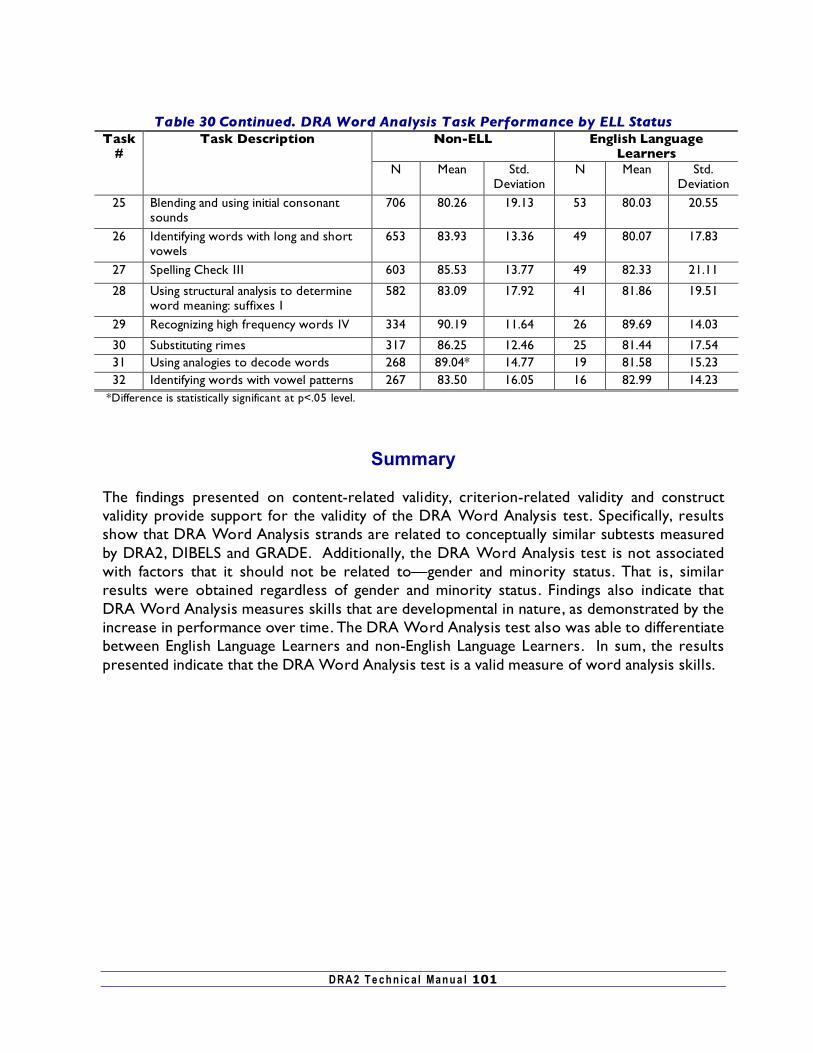
DRA2 T e ch n ic a l Man u a l 101
Table 30 Continued. DRA Word Analysis Task Performance by ELL Status
Non-ELL English Language Learners
Task #
Task Description
N Mean Std. Deviation
N Mean Std. Deviation
25 Blending and using initial consonant sounds
706 80.26 19.13 53 80.03 20.55
26 Identifying words with long and short vowels
653 83.93 13.36 49 80.07 17.83
27 Spelling Check III 603 85.53 13.77 49 82.33 21.11
28 Using structural analysis to determine word meaning: suffixes I
582 83.09 17.92 41 81.86 19.51
29 Recognizing high frequency words IV 334 90.19 11.64 26 89.69 14.03
30 Substituting rimes 317 86.25 12.46 25 81.44 17.54 31 Using analogies to decode words 268 89.04* 14.77 19 81.58 15.23 32 Identifying words with vowel patterns 267 83.50 16.05 16 82.99 14.23
*Difference is statistically significant at p<.05 level.
Summary The findings presented on content-related validity, criterion-related validity and construct validity provide support for the validity of the DRA Word Analysis test. Specifically, results show that DRA Word Analysis strands are related to conceptually similar subtests measured by DRA2, DIBELS and GRADE. Additionally, the DRA Word Analysis test is not associated with factors that it should not be related to—gender and minority status. That is, similar results were obtained regardless of gender and minority status. Findings also indicate that DRA Word Analysis measures skills that are developmental in nature, as demonstrated by the increase in performance over time. The DRA Word Analysis test also was able to differentiate between English Language Learners and non-English Language Learners. In sum, the results presented indicate that the DRA Word Analysis test is a valid measure of word analysis skills.
DRA2 Technical Manual 102
References
Aiken, L. R. (2000). Psychological testing and assessment (10th Ed.). Needham Heights, MA: Allyn & Bacon.
American Educational Research Association, American Psychological Association, National
Council of Measurement in Education. (1999). Standards for educational and psychological testing. Washington DC: Authors.
Anastasi, A. (1958). Differential psychology (3rd Ed.). New York: Macmillan. Anastasi, A., & Urbina, S. (1997). Psychological testing (7th Ed.). Upple Saddle River, NJ: Prentice
Hall. Carmines, E. G., & Zeller, R. A. (1979). Reliability and validity assessment. Beverly Hills, CA:
Sage. Feingold, A. (1993). Cognitive gender differences: a developmental perspective. Sex Roles: A
Journal of Research. July 1993. Retrieved May 26, 2008 from http://findarticles.com/p/articles/mi_m2294/is_n1-2_v29/ai_14526339.
Gwet, K. (2001). Handbook of inter-rater reliability. Gaithersburg, MD. STATAXIS Publishing. Good, R. H., Kaminski, R. A., & Dill, S. (2002). DIBELS Oral Reading Fluency. In R. H. Good &
R. A. Kaminski (Eds.), Dynamic Indicators of Basic Early Literacy Skills (6th Ed.). Eugene, OR: Institute for the Development of Educational Achievement.
Hopkins, W. G. (2002). A scale of magnitudes for the effect statistics. In A new view of statistics.
Retrieved March 1, 2008 from http://www.sportsci.org/resource/stats/effectmag.html. Fleiss, J. L. (1971). Measuring nominal scale agreement among many raters. Psychological Bulletin,
76 (5), 378—382. Landis, J. R., & Koch, G. G. (1977). The measurement of observer agreement for categorical
data. Biometrics, 33, 159-174. Maccoby, E. E., (1966). Sex differences in intellectual functioning. In E. E. Maccoby (Ed.), The
development of sex differences. Stanford, CA: Stanford University Press. MacGinitie, W. H., MacGinitie, R. K., Maria, K., & Dreyer, L. G. (2002). Gates-MacGinitie
Reading Tests: Technical report (4th Ed.). Itasca, IL: Riverside. Nandakumar, R., Yu, F., Li, H.-H., & Stout, W. (1998). Assessing unidimensionality of
polytomous data. Applied Psychological Measurement, 22(2), 99-115.
DRA2 T e ch n ic a l Man u a l 103
Nunnally, J. C., & Bernstein, I. H. (1994). Psychometric theory (3rd Ed.). New York: McGraw Hill. Scott, W. (1955). Reliability of content analysis: The case of nominal scale coding. Public Opinion
Quarterly, 19(3), 321--325. Somes, G. W. (1986). The generalized mantel-haenszel statistic. The American Statistician, 40(2),
106-108. Stemler, S. E. (2004). A comparison of consensus, consistency, and measurement approaches
to estimating interrater reliability. Practical Assessment, Research & Evaluation, 9(4). Retrieved February 25, 2008 from http://PAREonline.net/getvn.asp?v=9&n=4.
Tabachnick, B., & Fidel, L. S. (2007). Using multivariate statistics (5th ed.). Boston: Allyn and
Bacon. Trochim, W. M. (2008). The Research Methods Knowledge Base (2nd Ed.). Retrieved February 26,
2008 from http://www.socialresearchmethods.net/kb. Wiederholt, J. L., & Bryant, B. R. (2001). Gray Oral Reading Tests: Examiner's Manual (4th Ed.).
Austin, TX: PRO-ED. Wilson, M. (2005). Constructing measures: An item response modeling approach. Mahwah, NJ:
Lawrence Erlbaum Associates.
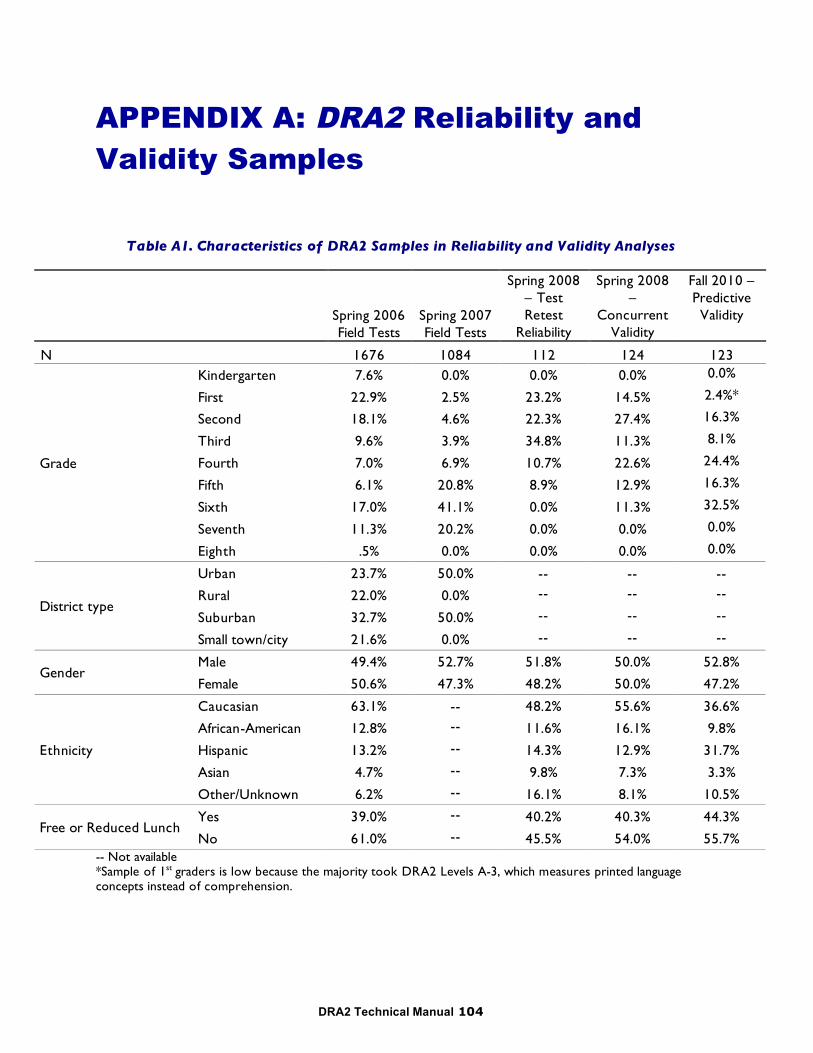
DRA2 Technical Manual 104
APPENDIX A: DRA2 Reliability and Validity Samples
Table A1. Characteristics of DRA2 Samples in Reliability and Validity Analyses
Spring 2006 Field Tests
Spring 2007 Field Tests
Spring 2008 – Test Retest
Reliability
Spring 2008 –
Concurrent Validity
Fall 2010 – Predictive Validity
N 1676 1084 112 124 123 Kindergarten 7.6% 0.0% 0.0% 0.0% 0.0%
First 22.9% 2.5% 23.2% 14.5% 2.4%*
Second 18.1% 4.6% 22.3% 27.4% 16.3%
Third 9.6% 3.9% 34.8% 11.3% 8.1%
Fourth 7.0% 6.9% 10.7% 22.6% 24.4%
Fifth 6.1% 20.8% 8.9% 12.9% 16.3%
Sixth 17.0% 41.1% 0.0% 11.3% 32.5%
Seventh 11.3% 20.2% 0.0% 0.0% 0.0%
Grade
Eighth .5% 0.0% 0.0% 0.0% 0.0%
Urban 23.7% 50.0% -- -- --
Rural 22.0% 0.0% -- -- --
Suburban 32.7% 50.0% -- -- -- District type
Small town/city 21.6% 0.0% -- -- --
Male 49.4% 52.7% 51.8% 50.0% 52.8% Gender
Female 50.6% 47.3% 48.2% 50.0% 47.2%
Caucasian 63.1% -- 48.2% 55.6% 36.6%
African-American 12.8% -- 11.6% 16.1% 9.8%
Hispanic 13.2% -- 14.3% 12.9% 31.7%
Asian 4.7% -- 9.8% 7.3% 3.3%
Ethnicity
Other/Unknown 6.2% -- 16.1% 8.1% 10.5%
Yes 39.0% -- 40.2% 40.3% 44.3% Free or Reduced Lunch
No 61.0% -- 45.5% 54.0% 55.7% -- Not available *Sample of 1st graders is low because the majority took DRA2 Levels A-3, which measures printed language concepts instead of comprehension.
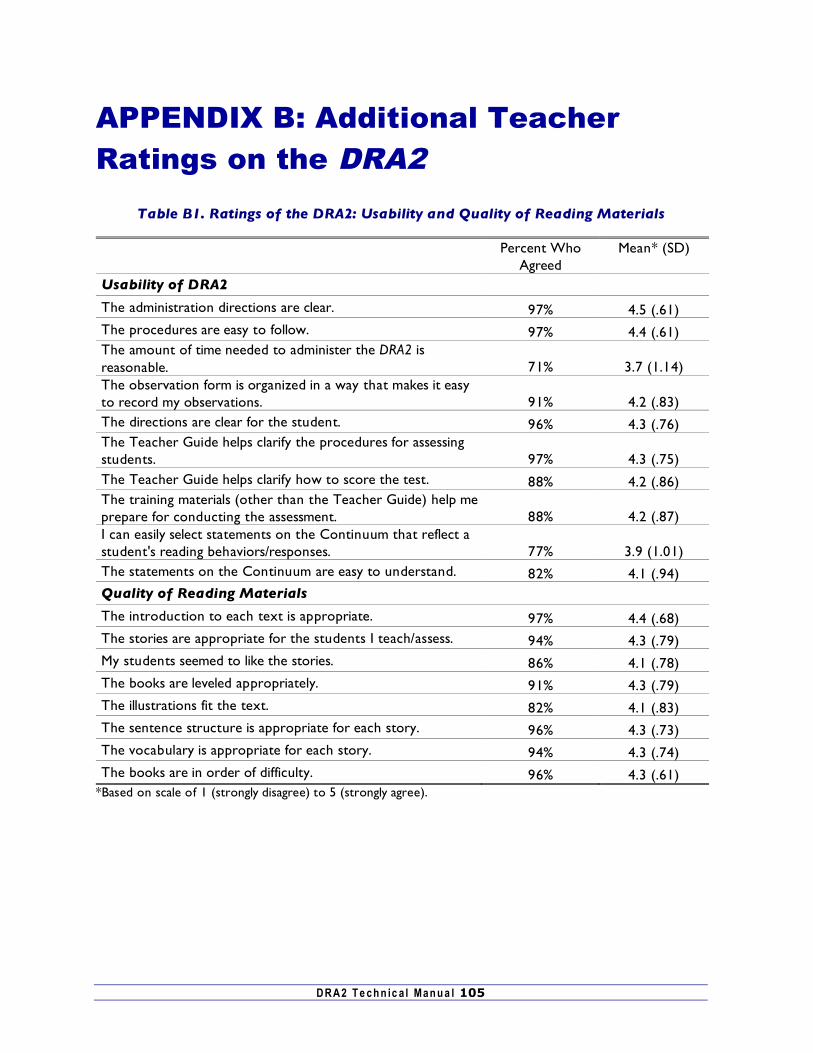
DRA2 T e ch n ic a l Man u a l 105
APPENDIX B: Additional Teacher Ratings on the DRA2
Table B1. Ratings of the DRA2: Usability and Quality of Reading Materials
Percent Who Agreed
Mean* (SD)
Usability of DRA2 The administration directions are clear. 97% 4.5 (.61) The procedures are easy to follow. 97% 4.4 (.61) The amount of time needed to administer the DRA2 is reasonable. 71% 3.7 (1.14) The observation form is organized in a way that makes it easy to record my observations. 91% 4.2 (.83) The directions are clear for the student. 96% 4.3 (.76) The Teacher Guide helps clarify the procedures for assessing students. 97% 4.3 (.75) The Teacher Guide helps clarify how to score the test. 88% 4.2 (.86) The training materials (other than the Teacher Guide) help me prepare for conducting the assessment. 88% 4.2 (.87) I can easily select statements on the Continuum that reflect a student's reading behaviors/responses. 77% 3.9 (1.01) The statements on the Continuum are easy to understand. 82% 4.1 (.94) Quality of Reading Materials The introduction to each text is appropriate. 97% 4.4 (.68) The stories are appropriate for the students I teach/assess. 94% 4.3 (.79) My students seemed to like the stories. 86% 4.1 (.78) The books are leveled appropriately. 91% 4.3 (.79) The illustrations fit the text. 82% 4.1 (.83) The sentence structure is appropriate for each story. 96% 4.3 (.73) The vocabulary is appropriate for each story. 94% 4.3 (.74) The books are in order of difficulty. 96% 4.3 (.61)
*Based on scale of 1 (strongly disagree) to 5 (strongly agree).
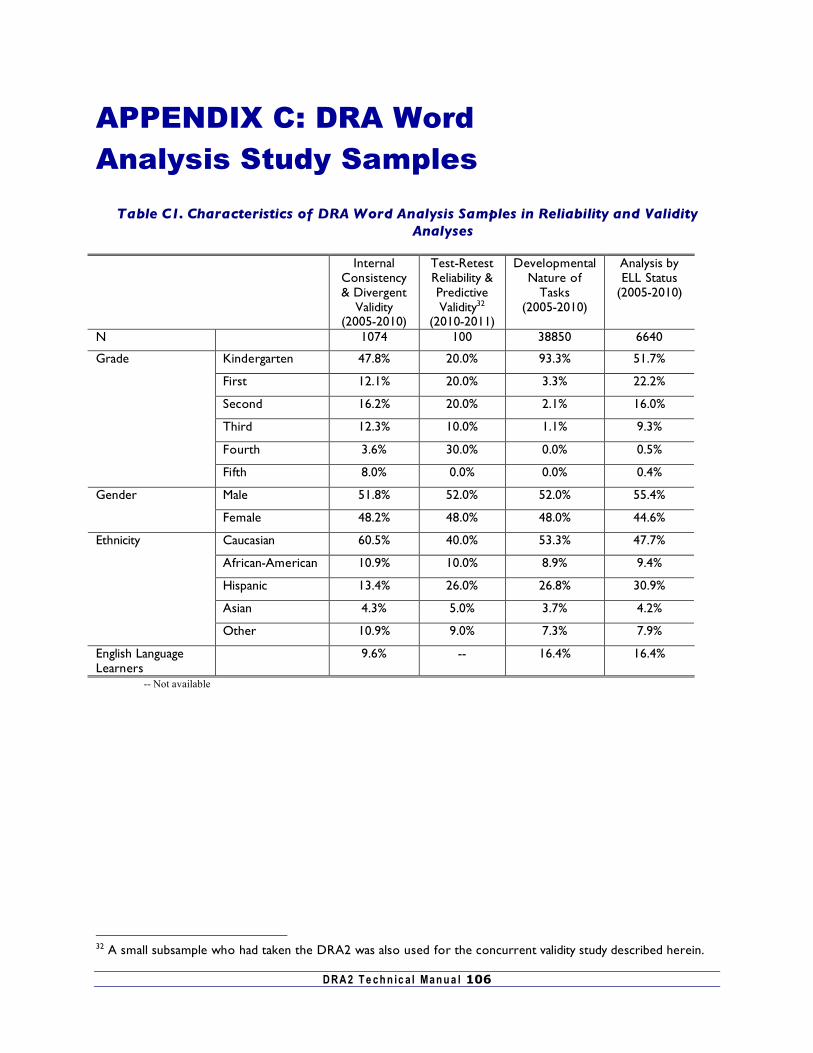
DRA2 T e ch n ic a l Man u a l 106
APPENDIX C: DRA Word Analysis Study Samples
Table C1. Characteristics of DRA Word Analysis Samples in Reliability and Validity Analyses
Internal Consistency & Divergent
Validity (2005-2010)
Test-Retest Reliability & Predictive Validity32
(2010-2011)
Developmental Nature of
Tasks (2005-2010)
Analysis by ELL Status
(2005-2010)
N 1074 100 38850 6640
Kindergarten 47.8% 20.0% 93.3% 51.7%
First 12.1% 20.0% 3.3% 22.2%
Second 16.2% 20.0% 2.1% 16.0%
Third 12.3% 10.0% 1.1% 9.3%
Fourth 3.6% 30.0% 0.0% 0.5%
Grade
Fifth 8.0% 0.0% 0.0% 0.4%
Male 51.8% 52.0% 52.0% 55.4% Gender
Female 48.2% 48.0% 48.0% 44.6%
Caucasian 60.5% 40.0% 53.3% 47.7%
African-American 10.9% 10.0% 8.9% 9.4%
Hispanic 13.4% 26.0% 26.8% 30.9%
Asian 4.3% 5.0% 3.7% 4.2%
Ethnicity
Other 10.9% 9.0% 7.3% 7.9%
English Language Learners
9.6% -- 16.4% 16.4%
-- Not available
32 A small subsample who had taken the DRA2 was also used for the concurrent validity study described herein.
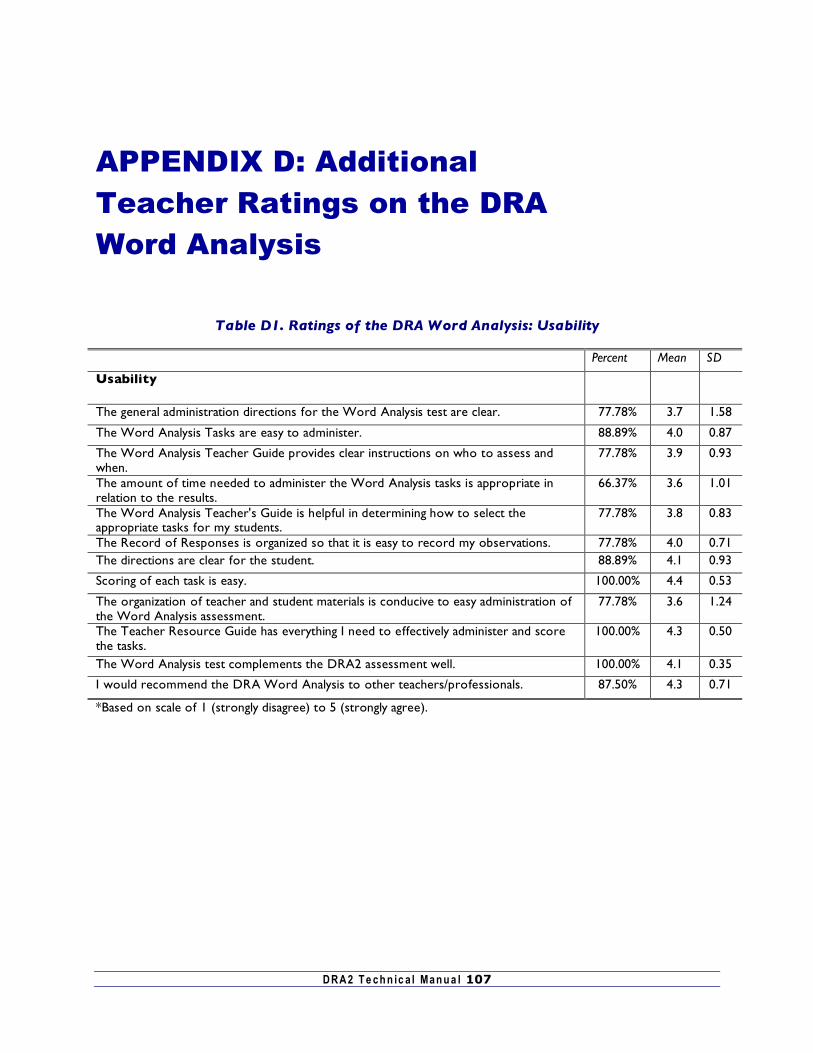
DRA2 T e ch n ic a l Man u a l 107
APPENDIX D: Additional Teacher Ratings on the DRA Word Analysis
Table D1. Ratings of the DRA Word Analysis: Usability
Percent Mean SD
Usability
The general administration directions for the Word Analysis test are clear. 77.78% 3.7 1.58
The Word Analysis Tasks are easy to administer. 88.89% 4.0 0.87
The Word Analysis Teacher Guide provides clear instructions on who to assess and when.
77.78% 3.9 0.93
The amount of time needed to administer the Word Analysis tasks is appropriate in relation to the results.
66.37% 3.6 1.01
The Word Analysis Teacher's Guide is helpful in determining how to select the appropriate tasks for my students.
77.78% 3.8 0.83
The Record of Responses is organized so that it is easy to record my observations. 77.78% 4.0 0.71 The directions are clear for the student. 88.89% 4.1 0.93
Scoring of each task is easy. 100.00% 4.4 0.53
The organization of teacher and student materials is conducive to easy administration of the Word Analysis assessment.
77.78% 3.6 1.24
The Teacher Resource Guide has everything I need to effectively administer and score the tasks.
100.00% 4.3 0.50
The Word Analysis test complements the DRA2 assessment well. 100.00% 4.1 0.35
I would recommend the DRA Word Analysis to other teachers/professionals. 87.50% 4.3 0.71
*Based on scale of 1 (strongly disagree) to 5 (strongly agree).

DRA2 T e ch n ic a l Man u a l 108