Embed Size (px)
Citation preview

Kobe University Repository : Thesis
学位論文題目Tit le
Geochemical and environmental studies on chlorinated organiccompounds based on chlorine stable isotope analysis(塩素安定同位体分析による有機塩素化合物の地球化学的動態の解明)
氏名Author 沼田, 雅彦
専攻分野Degree 博士(理学)
学位授与の日付Date of Degree 2001-03-31
資源タイプResource Type Thesis or Dissertat ion / 学位論文
報告番号Report Number 甲2261
権利Rights
JaLCDOI
URL http://www.lib.kobe-u.ac.jp/handle_kernel/D1002261※当コンテンツは神戸大学の学術成果です。無断複製・不正使用等を禁じます。著作権法で認められている範囲内で、適切にご利用ください。
PDF issue: 2020-10-10
博士論文
GEOCHEMICAL AND ENVIRONMENTAL STUDIES ON CHLORINATED ORGANIC COMPOUNDS BASED ON
CHLORINE STABLE ISOTOPE ANALYSIS
(塩素安定同位体分析による有機塩素化合物の地球化学的動態の解明)
平成 13 年 1 月
神戸大学大学院自然科学研究科 沼田 雅彦 (Masahiko Numata)

Acknowledgements
I would like to thank my advisor Prof. Noboru Nakamura for his
supervision and support. I also thank my colleagues in the cosmo-geochemistry
laboratory for their help and encouragement. In particular, I acknowledge Dr.
Katsuyuki Yamashita and Mr. Gabor Kondorosi for their helpful comments on the
manuscript. Mr. Yusuke Hirota, Mr. Tadatsugu Murata, Ms. Miwa Yoshitake, Mr.
Masanori Kawashima and Mr. Ken-ichiro Takahashi are thanked for their
support to development of the chlorine isotopic analysis.
I thank late Dr. Mitsunobu Tatsumoto (U.S. Geological Survey) for kindly
providing us the high purity graphite and also Prof. Toshitaka Gamo (Faculty of
Science, Hokkaido University) for kindly providing us the Pacific Ocean seawater
samples. Mr. Nobuyuki Kanazawa (ThermoQuest Co. Ltd.) is thanked for his
advice on measurements using MAT262 mass spectrometers. Dr. Ying-Kai Xiao
(Qinghai Institute of Salt Lakes, China) is appreciated for his advise on thermal
ionization mass spectrometry of Cs2Cl+.
Support to treatments of chlorinated organic compounds and bacteria by
Prof. Yutaka Terashima, Dr. Hiromoto Koshikawa and Dr. Masaharu Nagao
(Graduate School of Engineering, Kyoto University) is highly acknowledged.
I thank Ms. Kumiko Yaguchi (Tama blanch Laboratory, The Tokyo
Metropolitane Research Laboratory of Public Health), Prof. Masanori Fujita, Dr.
Tae Ho Lee (Graduate School of Engineering, Osaka University) and Kennichi
Matsuura (Dowa Mining Co., Ltd.) for kindly supply of tetrachloroethene
degrading bacteria.
This research was partially supported by Grant-in-Aid (No. 11640489)
from the Ministry of Education, Science and Culture of Japan.

Abstract
Determination of chlorine isotope ratios is a new tool for geochemical and
environmental studies. An improved method for chlorine isotopic analysis using
thermal ionization mass spectrometry (TIMS) of CS2CI+ has been investigated for
precise measurement of 37C1I35CI isotopic ratios for small amount of samples.
Chlorine in inorganic samples was recovered as AgCI and converted to
CsCI with metallic Mg and CS+'form ion exchange resin. The CsCI (containing 2
/Jog of cn was loaded onto a Ta filament together with graphite powder. The
37C1I35CI ratio was measured as CS2CI+ using Faraday cups in a static mode.
Measurement for each sample took approximately 80 - 100 minutes, and the
replicate analysis of sea water and laboratory standard (CsCI reagent) gave
internal and external precision of 0.1-0.2 %'0 (2crm) and 0.1-0.2 ~ (1crSD),
respectively. This method has been tested on a variety of chemical reagents
including metal chlorides and hydrochloric acid. It was found that the artificial
chlorine compound show large variations of 37C1I35CI ratio (total ranges from -2.5
to +1.2 ~ relative to standard mean ocean chloride). We suggest that the high
sensitivity and precision technique established in this work would allow us to
detect small isotopic variations of chlorine in small amounts of natural samples
such as terrestrial materials G.e. minerals, rocks, sediments, groundwater and
various environmental materials), meteorites and other planetary materials.
Chlorinated aliphatic hydrocarbons (CARs) are known as ubiquitous
contaminants in aquifers and soil, but it is difficult to trace the source of
pollution and identify their subsurface processes. The 837CI values for 10
commercial CARs provided by 6 suppliers are presented. The CARs were treated
with a sodium-biphenyl reagent. The liberated chloride ions were converted to
CsCI and then their isotopic compositions were determined by TIMS. Replicate
I

analysis of the CAHs gave an internal precision of 0.1-0.4 ~ (2crm) and external
precision of 0.1-0.4 ~ (lcrsD). The CAHs showed larger variations in 837CI values
(-5.0 to +2.9 ~ relative to standard mean ocean chloride) than inorganic
compounds. As each compounds and each supplier (i.e. manufacturer) may have
distinctive 837CI value, CI isotope data can be used to trace a specific source of
pollutants in subsurface environment.
Trichloroethene (TCE) and tetrachloroethene (PCE) were extracted from
aqueous solutions with toluene and their chlorine isotope compositions were
analyzed. Because the differences in 837CI values between the pure-phase and the
extracted chloroethens were insignificant, the solvent extraction method may be
applicable to analysis of actual contaminated water samples. Organic chlorine
was recovered as inorganic chloride from unsaturated chlorinated aliphatic
compounds (TCE and PCE) by KMn04 oxidation, but saturated compounds were
resistant to KMn04 oxidation. Chlorine atom binding to an intramolecular site in
an asymmetric molecule TCE was eliminated by anaerobic dechlorination, and
recovered as chloride ion. The isotopic compositions of the recovered chlorine
were then determined by TIMS. Such compound-specific and intramolecular
site-specific isotopic analyses may give much information of past record of each
contaminant compared with bulk isotope compositions.
Chlorine isotope fractionation during reductive dechlorination of TCE and
PCE to cis-l,2-dichloroethene (cDCE) by anaerobic bacteria was investigated.
Mathematical models for one'step reaction (TCE to cDCE) and two-step reaction
(PCE to cDCE) were developed. The change of 837CI values of organic-chlorine
during TCE dechlorination to cDCE can be explained by regioselective
elimination of chlorine accompanied with the Rayleigh fractionation. The
fractionation factors (a.) of the TCE dechlorination by 3 kinds of anaerobic
cultures were approximately 0.994 to 0.995 at 30 °C. The enrichment of 37CI in
11

organic chlorine during PCE dechlorination to cDCE can be explained by random
elimination of one chlorine atom in PCE molecule and followed regioselective
elimination of one chlorine atom in TCE molecule. The fractionation factors for
the first step of PCE dechlorination with 3 kinds of anaerobic cultures were
estimated to be 0.987 to 0.991 at 30°C using the model. Isotope fractionation
during the first step would be the primary factor of the chlorine isotope
fractionation during the PCE dechorination to cDCE. More precise analytical
technique is necessary to estimate the fractionation factor of the second step of
the reaction (TCE to cDCE). These models can be utilized to evaluate the
fractionation factors of regioselective and multi-step reactions for which the
simple Rayleigh model is not applied. Chlorine isotope fractionation factors
during biotic or abiotic degradation of CARs can be applied to investigate the
subsurface reaction mechanisms and to assess the clean-up efficiency of the
contaminated sites.
Finally, the application of TIMS for isotopic dilution mass spectrometry
(IDMS) of chlorine and isotopic analysis of bromine was investigated. The CsBr
and 37Cl spiked CsCl gave intense and stable signals (CS2X+, X: Cl or Br). The
preliminary results suggest that the TIMS of cesium halide molecular ion may be
applicable to determination of halogen abundance and bromine isotope ratio in
geochemical and cosmochemical samples.
HI

Table of Contents
1. General introduction・・・・・・・・・・・・・・・・・・・・・・・・・・・・・・・・・・・・・・・・・・・・・・・・・・・・・・・1
2. Measurements of chlorine isotopic ratio in inorganic compounds
Introduction・・・・・・・・・・・・・・・・・・・・・・・・・・・・・・・・・・・・・・・・・・・・・・・・・・・・・・・・・・8
Experimental procedures・・・・・・・・・・・・・・・・・・・・・・・・・・・・・・・・・・・・・・・・・・・・・・9
Results and Discussion・・・・・・・・・・・・・・・・・・・・・・・・・・・・・・・・・・・・・・・・・・・・・・・・14
Conclusions・・・・・・・・・・・・・・・・・・・・・・・・・・・・・・・・・・・・・・・・・・・・・・・・・・・・・・・・・・27
Tables・・・・・・・・・・・・・・・・・・・・・・・・・・・・・・・・・・・・・・・・・・・・・・・・・・・・・・・・・・・・・・・29
Figures・・・・・・・・・・・・・・・・・・・・・・・・・・・・・・・・・・・・・・・・・・・・・・・・・・・・・・・・・・・・・36
3. Measurements of chlorine isotopic ratio in chlorinated organic compounds
Introduction・・・・・・・・・・・・・・・・・・・・・・・・・・・・・・・・・・・・・・・・・・・・・・・・・・・・・・47
Experimental procedures・・・・・・・・・・・・・・・・・・・・・・・・・・・・・・・・・・・・・・・・・・・・・48
Results and Discussion・・・・・・・・・・・・・・・・・・・・・・・・・・・・・・・・・・・・・・・・・・・・・・・54
Conclusions・・・・・・・・・・・・・・・・・・・・・・・・・・・・・・・・・・・・・・・・・・・・・・・・・・・・・・・・・・61
Tables・・・・・・・・・・・・・・・・・・・・・・・・・・・・・・・・・・・・・・・・・・・・・・・・・・・・・・・・・・・・・・・63
Figures・・・・・・・・・・・・・・・・・・・・・・・・・・・・・・・・・・・・・・・・・・・・・・・・・・・・・・・・・・・・・70
4. Isotope fractionation during reductive dechlorination of chlorinated ethenes
Introduction・・・・・・・・・・・・・・・・・・・・・・・・・・・・・・・・・・・・・・・・・・・・・・・・・・・・・・・・・78
Experimental procedures・・・・・・・・・・・・・・・・・・・・・・・・・・・・・・・・・・・・・・・・・・・・・81
Results・・・・・・・・・・・・・・・・・・・・・・・・・・・・・・・・・・・・・・・・・・・・・・・・・・・・・・・・・・・・・・90
Discussion・・・・・・・・・・・・・・・・・・・・・・・・・・・・・・・・・・・・・・・・・・・・・・・・・・・・・・・・・・93
Conclusions・・・・・・・・・・・・・・・・・・・・・・・・・・・・・・・・・・・・・・・・・・・・・・・・・・・・・・・・・98
Table・・・・・・・・・・・・・・・・・・・・・・・・・・・・・・・・・・・・・・・・・・・・・・・・・・・・・・・・・・・・・・・・100
Figures・・・・・・・・・・・・・・・・・・・・・・・・・・・・・・・・・・・・・・・・・・・・・・・・・・・・・・・・・・・101

5. Application of halogen isotopic analysis for cosmo-geochemistry
Introduction・・・・・・・・・・・・・・・・・・・・・・・・・・・・・・・・・・・・・・・・・・・・・・・・・・・・・・113
Experimental procedures・・・・・・・・・・・・・・・・・・・・・・・・・・・・・・・・・・・・・・・・・・117
Results and Discussion・・・・・・・・・・・・・・・・・・・・・・・・・・・・・・・・・・・・・・・・・・・・119
Conclusions・・・・・・・・・・・・・・・・・・・・・・・・・・・・・・・・・・・・・・・・・・・・・・・・・・・・・・122
Figure・・・・・・・・・・・・・・・・・・・・・・・・・・・・・・・・・・・・・・・・・・・・・・・・・・・・・・・・・・・123
6. References・・・・・・・・・・・・・・・・・・・・・・・・・・・・・・・・・・・・・・・・・・・・・・・・・・・・・・・・・124
1
1. General introduction
As one of the representative volatile elements, chlorine participates in
many geochemical processes (e.g. degassing process of juvenile planet,
hydrothermal activity, chemical evolution of ocean). Chlorine is ubiquitous in the
atmosphere, hydrosphere and lithosphere as major anion (Cl-) and minor gaseous
components (HCl, CH3Cl) (Table 1-1, Fig.1-1). Cl is not only essential for life on
the Earth, but also important for industrial and household use in the form of
inorganic and organic compounds. As a consequence, many artificial Cl
compounds are released to air, water and soil and cause serious environmental
problems. Therefore, understanding the behavior of Cl is important in solving
problems in the field of geochemistry and environmental chemistry.
Isotopes are ideal tracer of chemical species. On the other hand, isotope
fractionation is identical for physical, chemical or biological reactions. For these
reasons, isotopic analysis has been applied to investigate geochemical and
biochemical cycle of many elements. After the discovery of two stable Cl isotopes
(35Cl and 37Cl), several techniques for the determination of Cl isotope composition
have been developed and applied for geochemical investigations. Variations in the
isotopic compositions of chlorine are regarded as useful diagnostic tool for
processes associated with important geochemical reactions in the atmosphere,
surface fluids and the lithosphere (Hoefs, 1997).
The chlorine isotopes are fractionated mainly by phase change of
Cl-bearing materials, (e. g. evaporites crystallized from brine: Vengosh et al.,
1989; Eggenkamp et al., 1995; Liu et al., 1997; Lyons et al., 1999; Eastoe et al.,
1999, reaction between hydrous silicate minerals and aqueous phase: Eastoe and
Guilbert, 1992; Magenheim et al., 1995; Ransom et al., 1995, volatilization of HCl

2
from acidic aerosols: Volpe and Spivack, 1994; Volpe et al., 1998; Lyons et al.,
1999). Although the isotopic abundances are generally utilized as conservative
tracers in hydrology (Phillips, 1995), not only mixing of waters from different
sources (Kaufmann et al., 1993) but also difference of diffusion rate between 35Cl-
and 37Cl- (Desaulniers et al., 1986; Eggenkamp et al., 1994), and ion filtration
effect in clay layers (Phillips and Bentley, 1987) can cause variation in Cl isotopic
ratio of groundwater. The studies of nonconservative behavior of Cl have
potential for constraining the distribution and chemical evolution of volatile
elements on the Earth (Magenheim et al., 1995; Eggenkamp and Koster von
Groos, 1997; Markl et al., 1997; Pillippot et al., 1998).
Many organic Cl compounds (freon, trihalomethane, chlorinated solvents,
chlorinated pesticides, PCBs, dioxins and so on) have polluted the atmosphere,
surface water, aquifers, soils and ecosystems for many years. Isotope ratios in
organic Cl compounds have been investigated to trace the chemicals produced by
different production procedures in different manufacturers and/or different
period and the sources of pollutants (Tanaka and Rye, 1991; Jarman et al., 1998;
Beneteau et al., 1999; Reddy et al., 2000). Also the reaction pathways and
mechanisms of organic Cl compounds in environment can be constrained by
magnitude of isotopic fractionation (e.g. biodegradation: Bloom et al., 2000;
Hunkeler et al., 1999; Sturchio et al., 1998; Sherwood Lollar et al., 1999; Heraty
et al., 1999; evaporation: Slater et al., 1999; Huang et al., 1999; abiotic
degradation: Dayan et al., 1999).
However, the studies of Cl isotopes were limited compared to other light
elements by small range of Cl isotopic variations in natural materials and lack of
analytical precision and sensitivity. Because there are no redox reactions of Cl in
natural system, the variation of Cl isotopic ratios is less significant than other

3
light elements. Several techniques, including electron impact ionization mass
spectrometry (EIMS: Boyd et al., 1955; Hoering and Parker, 1961; Taylor and
Grimsrud, 1969), negative thermal ionization mass spectrometry (N-TIMS:
Shields et al., 1962; Vengosh et al., 1989) have been developed to determine the
isotopic composition of Cl. However, memory effect and mass discrimination
during the ionization process limits the analytical precision of the EIMS and the
N-TIMS respectively.
Recently more sensitive and precise techniques of isotopic analysis has
been developed, and research of Cl isotopes has been accelerated. The electron
impact ionization mass spectrometry of CH3Cl (Long et al., 1993; Musashi et al.,
1998), known as the most precise method for Cl isotopic analysis were applied to
many fields. On the other hand, the thermal ionization mass spectrometry
(TIMS) of Cs2Cl+ (Xiao, 1992; Magenheim et al., 1994) is less precise to some
extent but requires relatively small quantities of Cl compared to the mass
spectrometry of CH3Cl. Sensitivity of isotopic analysis is important for the
studies of materials such as meteorites and environmental pollutants because
their size and concentration of Cl are sometimes limited.
In the chapter 2, conditions of Cl isotopic analysis such as sample
preparation, sample loading and mass spectrometric condition are described. Also,
the results for the measurements of seawater and inorganic reagents are
described. Isotopic composition of chloride in seawater is the standard of Cl
isotopes. And a CsCl reagent was established as a laboratory reference standard.
In the chapter 3, a method of Cl isotopic analysis in organic compound
were established and analytical results of several chlorinated aliphatic
hydrocarbons were described.
The chlorinated aliphatic hydrocarbons (CAHs: e.g. trichloroethene,

4
tetrachloroethene and 1,1,1-trichloroethane) are utilized to degrease
semiconductors, machinery parts and clothes. They are released into
groundwater systems and soils, and cause serious pollution in many countries
(Kawasaki, 1985; Fisher et al., 1987). Although, some CAHs are suspected as
mutagen or carcinogen, much cost and long operation period are necessary to
identify the pollution source and to cleanup contaminated sites.
As Cl isotopes in the CAHs would be discriminated in the production
processes, different materials and the manufacturing processes will be reflected
to isotopic compositions. Conventional chemical analysis such as gas
chromatography can give only information about the chemical species and their
concentration. On the other hand, it will be possible to trace pollution sources by
using isotope ratio in CAHs as fingerprints. In this study, highly sensitive
technique of Cs2Cl+ thermal ionization mass spectrometry was applied for the
purpose.
In the chapter 4, isotope fractionation effects by dechlorination of
chlorinated ethenes were described.
In subsurface environments, phases of CAHs change by evaporation,
absorption, solubilization and so on. Also, they are degraded by biotic or abiotic
processes. As each process causes identical change of isotopic compositions in
CAHs, it is possible to identify reaction pathways and mechanisms of subsurface
processes by isotopic analysis. In this study, isotope fractionation of chlorinated
ethenes during reductive dechlorination was examined, because the reaction
plays important rolls in remediation or natural attenuation of contaminated soil
and aquifers.
Finally, preliminary results of halogen analysis technique derived from
Cs2Cl+ thermal ionization mass spectrometry are presented in the chapter 5.

5
Isotope dilution mass spectrometry for determination of Cl abundance and Br
isotopic analysis by mass spectrometry of Cs2Br+ were investigated for possible
use for research in the field of cosmochemistry.

6
Abundance (mg/kg) δ37Cl (‰)Seawater 18000~20000 0.0Crust 130(average) -7.7~+7.5 Ignous Rocks 40~900 ?
Sediments - -7.7~ Evaporites ~600000 -1.1~+1.2Mantle 25?(average) +4.7?(average) (MORB Glass) 40~1000 +0.2~+7.5
Chondrites Carbonaceious 180~850 (CM:+3.4,CV:+4.0) (C1) 580~850 +2.7 Ordinary 70~560 ?
Achondrites 5~26 ?
Moon (Basalt) 4~19 ?
Martian Meteorites 14~1100 ?
Martian 'Soil' 4000~8000 ?
Table 1-1. Concentrations and isotopic compositions of Chlorine
in terrestrial and extraterrestrial systems
Data from Dreibus et al., 1977; Garrison et al., 2000; Magenheim
et al., 1994; Ransom et al., 1995; Liu et al., 1997; etc.

Fig.
1-1
. Dis
trib
utio
n of
Cl o
n th
e E
arth
A
bund
ance
: g, F
lux:
g/y
r, δ3
7 Cl:
‰
Dat
a fr
om S
chill
ing
et a
l.(19
78),
Cic
eron
e (1
981)
, Hoe
f (19
97),
Vol
pe e
t al.(
1998
), Ta
naka
& R
ye (1
991)
etc
.

8
2. Measurements of chlorine isotopic ratios in inorganic compounds
Introduction
Variations in the isotopic compositions of chlorine (37Cl/35Cl) are useful
diagnostic tool for processes associated with important geochemical reactions in
the atmosphere, surface fluids and the lithosphere (Hoefs, 1997).
Several techniques, including electron impact ionization mass
spectrometry (Boyd et al., 1955; Hoering and Parker, 1961; Taylor and Grimsrud,
1969; Kaufmann et al., 1984; Long et al., 1993; Musashi et al., 1998), negative
thermal ionization mass spectrometry (Shields et al., 1962; Vengosh et al., 1989)
and fast atom bombardment-mass spectrometry (Wastaway et al., 1998) have
been developed to determine the isotopic composition of Cl. However, the study of
Cl isotopes was limited by lack of precision and sensitivity. High sensitivity of
isotopic analysis is important for samples like meteorites and environmental
pollutants because their size and concentration of Cl are sometimes limited.
Thermal ionization mass spectroscopy (TIMS) of Cs2Cl+ has small mass
dependent fractionation (Xiao and Zhang, 1992; Xiao et al., 1995), high
sensitivity and low filament blank (Magenheim et al., 1994). Also, the analytical
results of Cs2Cl+ mass spectrometry correlates closely with the results of electron
impact mass spectrometry of CH3Cl (Rosenbaum et al., 2000). It has been used
successfully in the investigation of brines (Liu et al., 1997), aerosols (Magenheim
et al., 1994; Volpe and Spivack, 1994; Volpe et al., 1998), rocks (Magenheim et al.,
1994; Magenheim et al., 1995; Boudreau et al., 1997), fluid inclusion (Banks et al.,
2000) and subduction-zone pore waters (Ransom et al., 1995) in magnetic
scanning (peak jumping) mode.
In this work, a repeated analysis of ocean water and reagent standard
have been carried out in different conditions in order to develop an improved

9
method of the Cl isotopic analysis using TIMS. We have established a high
sensitivity, precision method which enable us to analyze Cl isotopes with
precision of ~ 0.1 ‰ for 2 μg-size Cl, demonstrated detailed methods and
presented analytical results for ocean water and Cl-bearing commercial inorganic
reagents.
Experimental Procedures
Presentation of isotopic data.
In this chapter, isotopic compositions are represented as isotopic ratios of
37Cl to 35Cl or in per mil (‰) deviation from those of the standard mean ocean
chloride (SMOC: Long et al., 1993).
1000137 ×⎥⎥⎦
⎤
⎢⎢⎣
⎡−⎟⎟
⎠
⎞⎜⎜⎝
⎛=
SMOC
sample
RR
Clδ ClCl
35
37
=R (2-1)
where RSMOC is the average of 25 ratios of the seawater chloride (Table 2-3).
Seawater Samples and Reagents
Seawater samples from the Pacific Ocean were taken during the KH-98-1
expedition (Fig. 2-1) by research vessel Hakuho-maru of the Ocean Research
Institute (University of Tokyo). In addition, a coast water from Setouchi area of
Japan (Setonaikai) was analyzed to find possible variation of Cl isotopic
composition caused by human activities. The seawater samples were stored at
-20 ℃ until use, and were filtered with a cellulose acetate membrane filter (pore
size: 0.45 μm) before pretreatment for isotopic measurement.
Two high purity CsCl (99.999 %; Aldrich and 99.9 % Wako Chemical
industries) and three commercial grade CsCl reagents (minimum assay 99 %;

10
Nacalai tesque, minimum assay 99 %; Wako Pure Chemical Industries: 1 g and
500 g bottles) were stored as 56.4 mM (2 g-Cl/L) solution. Water was purified
using a Milli-RX12Plus and a Milli-Q SP systems (Millipore).
NaCl (99.99 %; Matsunaga Chemical), HCl (reagent grade hydrochloric
acid, Wako Pure Chemical Industries; High-purity HCl gas, Sumitomo Seika
Chemicals), KCl (minimum assay 99.5 %; Wako Pure Chemical Industries) were
used for Cl isotopic measurements. Other chemicals were analytical or reagent
grades.
Cs-form cation exchange resin was prepared from DOWEX 50Wx8
(200-400 mesh, Nakarai Chemicals). The resin in a polyethylene column was
washed with 1.5 times resin volume of 3 M H2SO4 in order to remove possible
contamination, and then washed with more than 10 times volume of water.
Obtained H-form resin was mixed ca 0.5 M Cs2CO3 solution and converted into
Cs-form resin. A quantity of the Cs2CO3 solution was used which supplied 1.2
times of ion exchange capacity of the resin. By this procedure, the amount of
Cs-salt consumption was almost stoichiometric and much less than amount of
neutral salt (e.g. CsNO3) consumption for the in-column procedure (Xiao and
Zhang, 1992), because counter anion of Cs+ escaped as CO2. Ba-form resin was
prepared by washing the H-form resin with 10 times volume of 0.25 M Ba(NO3)2
solution in a polyethylene column. The Cs-form and Ba-form resins were washed
in columns with at least 10 times volume of water before use.
H-form chelate resin was prepared from Diaion CR-11 (Na-form, 16-50
mesh; Supelco). The resin in a polyethylene column was washed with 1.5 times
volume of 3 M H2SO4 in order to remove Na+ and possible contamination, and
then washed with more 10 times volume of water. Na-form chelate resin was used
without any pretreatment.
Metal ribbons were obtained from Nilaco (Ta: 99.99 %, thickness: 0.025

11
mm, width: 0.75 or 1.5 mm) and Finnigan MAT (Ta, width: 0.75 mm or 1 mm; W,
width: 0.75 mm; Re, width: 0.75 mm). The ribbons were washed with water in an
ultrasonic oscillation bath (10 min) before use.
A graphite powder was supplied from late Professor Mitsunobu Tatsumoto
(United States Geological Survey: USGS). Another high purity graphite powder
(99.999 %) was obtained from Nilaco Co. Ltd.
Ion Chromatography
Analysis of chloride ion and other anions was performed using Hitachi ion
chromatograph L-7000 (non-suppressor type). A 20 μl volume of the sample was
injected into the mobile phase. Separations were performed with a Hitachi 2740
guard column and a Hitachi 2740 analytical column with a mixed eluent of 2.3
mM phthalic acid, and 2.5 mM 2-amino-2-hydroxymethyl-1,3-propanediol. A
Shodex IC YK-421 guard column and a Shodex IC YK-421 analytical column with
a mixed eluent of 1.0 mM 2,6-pyridinedicarboxylic acid, 5.0 mM L-tartaric acid,
and 24 mM boric acid were used for analysis of alkali metal, alkali earth and
ammonium ions.
Preparation of CsCl
Chloride ion in aqueous solution (seawater and dissolved inorganic
reagents) was isolated as AgCl and converted into CsCl by the method of Hoering
and Parker (1961) and Magenheim et al. (1994) with some modifications (Fig.
2-2).
Sample solutions containing 50 μg of Cl- were placed into polypropylene
centrifuge tubes. Fifty microliters of 1 M HNO3 and 100 μL of 30 mM AgNO3
solution were added to each tube, and then kept for 2 hours at room temperature
in the dark. The solution was centrifuged at 12,000 g for 5 min, and the

12
supernatant was discarded. Precipitation of AgCl was washed twice with 500 μL
of 0.01 M HNO3 and once with 50 μL of water by centrifugation, and then 50 μL
of 1 M NH3 was added to dissolve the AgCl. In order to remove Ag ion, ca. 1 mg of
Mg powder was added to the solution. After one-hour reaction, the solution was
centrifuged and the supernatant was recovered. The precipitate was washed
twice with 50 μL of water. All supernatant fractions were combined and
evaporated to dryness on a hot plate (120 ℃). The residue (NH4Cl + MgCl2) was
dissolved in 50 μL of water and loaded onto a column (borosilicate glass, inner
diameter: 2 mm) containing 0.1 mL of Cs-form cation exchange resin. The column
was washed with 170 μL of water. The concentration of Cl- in the eluent was
measured by ion chromatography, and the eluent was evaporated to dryness on
hot plate. The amount of Cl- was calculated from the Cl- concentration and
volume of the eluent, and then water was added to the solid residue (CsCl) to
form a 2 g-Cl/L solution.
Seawater samples were also treated by a different procedure as follows.
Seawater (ca. 25 μL, containing 0.5 mg of Cl) was passed through Ba-form cation
exchange resin (0.2 mL in a borosilicate glass column, inner diameter: 3mm), and
Cs-form cation exchange resin (0.1 mL in a borosilicate glass column: inner
diameter 2mm). The eluent (ca. 250 μL) was recovered, and concentrations of Cs+
and Cl- were measured by ion chromatography.
Mass Spectrometry
As preliminary study of isotopic ratio measurements, CsCl ionization
efficiency and stability depending on loading or filament conditions were
investigated using a JEOL JMS-05RB mass spectrometer (30 cm radius, 90o
geometry). The instrument has a Faraday cup detectors and a secondary electron
multiplier.

13
The isotopic measurements of reagents and samples were performed using
a Finnigan MAT Model 262 thermal ionization mass spectrometer (Fig. 2-3). This
instrument has an equivalent radius of 64 cm and a 90o geometry. The
instrument has five Faraday cup detectors, coupled to 1011 Ω resistors, a
secondary electron multiplier, and a retarding potential quadrupole system. Flat
undegassed Ta ribbons (purity: 99.95 %; 0.025 x 1.5mm, Nilaco) were used for
routine single filament mode measurements (Table 2-1).
The mass spectrometric procedure for routine Cl isotope measurements
was the modified from Xiao and Zhang (1992), Magenheim et al. (1994), and Xiao
et al. (1995). Two micrograms of chlorine as CsCl aqueous solution (56.4 mM, 1.0
μL) and graphite powder as a slurry in 80 % ethanol were mixed on a
polytetrafluoroethylene sheet. The mixture was loaded on the center of the
filament and then dried with a filament current of 1.5 A. The filaments were
loaded into the ion source of the mass spectrometer and the analysis was started
when the pressure in the ion source reached less than 10-5 Pa. The filament
current was automatically increased to 1.2 A in 10min, and then increased
manually to detect and focus the Cs235Cl+ ion beam. The intensity of Cs235Cl+ ion
current was adjusted to (2 – 3) x 10-13 A by the filament current, which was
typically between 1.4 - 1.5 A. In order to detect the target ions (Cs235Cl+: m/z =
301 and Cs237Cl+: m/z = 303), the accelerating voltage was set to 8 kV.
Data were acquired in a static (multi-Faraday cup) mode for less than 100
min. Typically 400 to 500 ratios were collected in blocks from 20 to 25.

14
Results and Discussion
Effects of graphite on CsCl ionization
A high m/z molecular ion Cs2Cl+, is suitable for isotope measurements
because of its small mass discrimination during the thermal ionization process.
The ratio of Cs+ to Cs2Cl+ would be good indicator of the analytical conditions
(Xiao and Zhang, 1992; Xiao et al., 2000; Banks et al., 2000; Rosenbaum et al,
2000).
Relationship of filament current and intensities of Cs2Cl+ and Cs+ is shown
in Fig.2-4. For this investigation, the JEOL mass spectrometer and Ta filaments
(width: 0.75mm; Nilaco) were used. Besides, signal intensity of Cs2Cl+ reached
plateau at more than 0.9 A of the filament current, Cs+ intensity increased along
with the filament current. As CsCl vaporized as dimeric molecule Cs2Cl2 at high
temperature, the observed phenomena could be explained by dissociation of the
molecule. At optimal filament current, Cs+ / Cs2Cl+ ratio was smaller than 1
(approximately 0.3 at the lowest, during the early stage of ionization). As
graphite is a reducing agent in high temperature, it has been used to generate
ions at relatively low oxidation level (e.g. Nd+ instead of NdO+; Noble et al., 1989)
for TIMS. Molecular ion emission from graphite loading filament at low
temperature has been applied for isotope measurements of non-metallic elements
(Xiao et al., 1988; Xiao and Zhang, 1992; Xiao et al., 1993). In the case of Cs2Cl+
mass spectrometry, graphite will not be a reducing agent because of low
ionization temperature (<400℃; Xiao et al., 2000), and oxidation level of Cs2Cl+
is same to Cs+. More studies are necessary to understand the mechanism of the
molecular ion generation from graphite.
The graphite supplied from the USGS was mainly used for analyses in this
chapter. This coarse graphite powder gave high ion current, but the mixture of
15
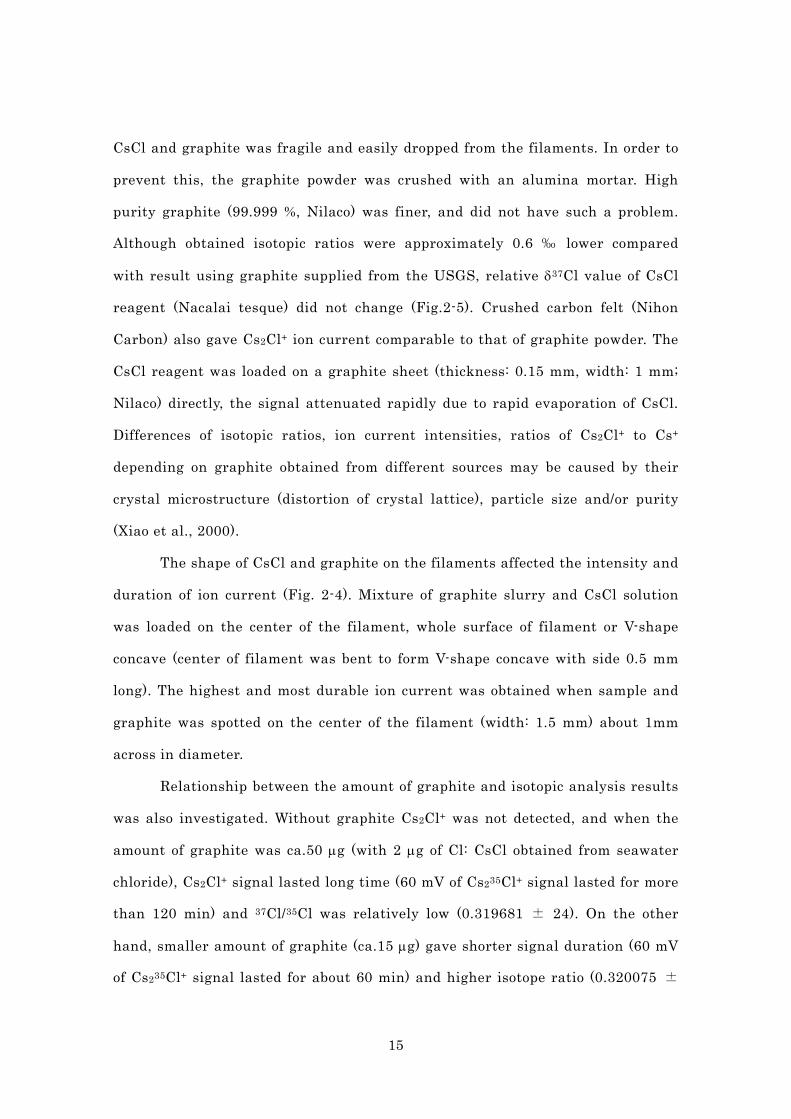
CsCl and graphite was fragile and easily dropped from the filaments. In order to
prevent this, the graphite powder was crushed with an alumina mortar. High
purity graphite (99.999 %, Nilaco) was finer, and did not have such a problem.
Although obtained isotopic ratios were approximately 0.6 ‰ lower compared
with result using graphite supplied from the USGS, relative δ37Cl value of CsCl
reagent (Nacalai tesque) did not change (Fig.2-5). Crushed carbon felt (Nihon
Carbon) also gave Cs2Cl+ ion current comparable to that of graphite powder. The
CsCl reagent was loaded on a graphite sheet (thickness: 0.15 mm, width: 1 mm;
Nilaco) directly, the signal attenuated rapidly due to rapid evaporation of CsCl.
Differences of isotopic ratios, ion current intensities, ratios of Cs2Cl+ to Cs+
depending on graphite obtained from different sources may be caused by their
crystal microstructure (distortion of crystal lattice), particle size and/or purity
(Xiao et al., 2000).
The shape of CsCl and graphite on the filaments affected the intensity and
duration of ion current (Fig. 2-4). Mixture of graphite slurry and CsCl solution
was loaded on the center of the filament, whole surface of filament or V-shape
concave (center of filament was bent to form V-shape concave with side 0.5 mm
long). The highest and most durable ion current was obtained when sample and
graphite was spotted on the center of the filament (width: 1.5 mm) about 1mm
across in diameter.
Relationship between the amount of graphite and isotopic analysis results
was also investigated. Without graphite Cs2Cl+ was not detected, and when the
amount of graphite was ca.50 μg (with 2 μg of Cl: CsCl obtained from seawater
chloride), Cs2Cl+ signal lasted long time (60 mV of Cs235Cl+ signal lasted for more
than 120 min) and 37Cl/35Cl was relatively low (0.319681 ± 24). On the other
hand, smaller amount of graphite (ca.15 μg) gave shorter signal duration (60 mV
of Cs235Cl+ signal lasted for about 60 min) and higher isotope ratio (0.320075 ±

16
25). Larger amount of graphite (ca.200 μg) also gave shorter signal duration (30
mV of Cs235Cl+ signal lasted for about 50 min) and higher isotope ratio (0.319909
± 53). As isotopic analysis results were sensitive to amount of graphite, amount
of graphite should be reproducible for precise measurements of Cl isotope. For
routine measurements, graphite slurry was taken into a teflon capillary mounted
on the tip of a microsyringe, and the capillary (and syringe) was stood upright.
By gentle strikes, graphite powder formed compact precipitation, and the height
of precipitation was checked using a scale to confirm reproducibility of amount of
graphite for each sample loading operations.
Xiao et al. (1992) loaded CsCl solution after loading the graphite on the
filaments, while the procedure of Magenheim et al. (1994) was opposite. In the
former case, graphite repels aqueous solution. In the latter case, ethanol easily
spread on the filaments. In order to load the samples and graphite as small and
homogeneous spot on the Ta filament, CsCl solution and graphite slurry were
mixed before loading.
Effects of filament on CsCl ionization
Influence of materials and dimension of the filament was investigated
using the JEOL mass spectrometer. The order of signal (Cs2Cl+) intensity and
duration was as follows:
Ta(width:1.5 mm; Nilaco)≧Ta(width: 1.0 mm; Finnigan MAT) >Ta(width: 0.75
mm; Finnigan MAT, straight ribbon)> Re(width: 0.75mm; Finnigan MAT)≧
Ta(width:0.75 mm; Finnigan MAT, rolled ribbon)>Ta(width: 1.5 mm; Nilaco)>
W(width: 0.75 mm; Finnigan MAT).
Cs2Cl+ was detected by all cases, but the cause of the filament effect is not
clear. Because of difference of ion optics between the JEOL mass spectrometer
and the Finnigan MAT mass spectrometer, the difference of signal intensities

17
depending on filament width was not significant for isotopic analysis by using the
Finnigan MAT mass spectrometer. For routine isotopic ratio measurements, Ta
filaments (width: 1.5 mm, Nilaco) were used, because filament current control
was easier.
Pretreatment procedures for filament cleanup were different by report on
Cl isotopic analysis (degassed: Magenheim et al., 1994; Xiao et al., 2000; Banks et
al., 2000, undegassed: Xiao and Zhang, 1992). In this study, the Ta filaments
(width: 1.5 mm, Nilaco) were washed with water or 0.1 M HNO3 in an ultrasonic
oscillation bath (10 min) or degassed for 30 min at 5.0 A in vacuum. Compared
with untreated filament, filaments washed with HNO3 gave lower intensity of the
signal. As the sample solution and graphite slurry easily spread on the degassed
filaments, reproducible loading was difficult. In addition, the Cs2Cl+ signal was
sometimes unstable using the degassed filaments. Thus filaments washed with
water were used for routine isotope measurements.
Effects of other conditions on CsCl ionization
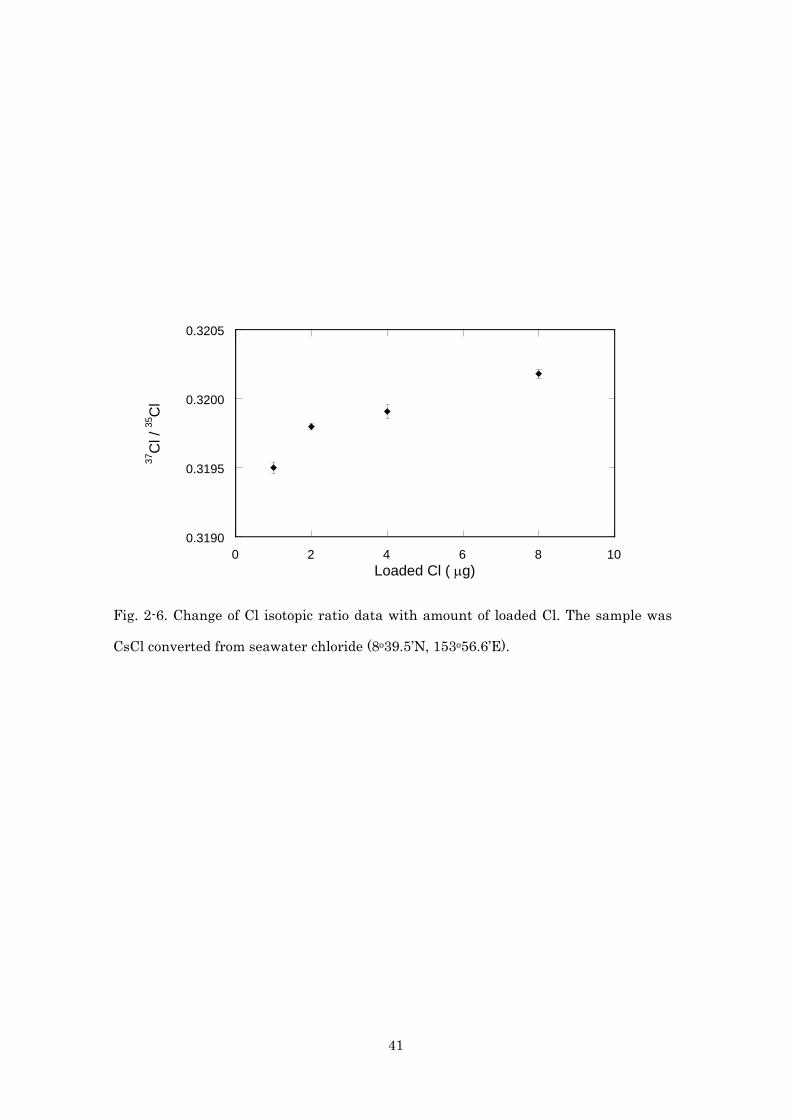
The relationship between amount of loaded Cl (CsCl obtained from
seawater chloride) and measured isotopic ratio was shown in Fig.2-6. Isotope
ratios of increased along with amount of loaded Cl. When the amount of Cl was 2
μg, Cs2Cl+ signal lasted long time (60 mV of Cs235Cl+ signal lasted for more than
120 min). But smaller amount of Cl (1 μg) gave lower but stable signal (35 mV of
Cs235Cl+ signal lasted for more than 120 min). Larger amount of Cl (5 and 10 μg)
gave shorter signal duration (40-50 mV of Cs235Cl+ signal lasted for less than 60
min). Rosenbaum et al. (2000) reported linear relationship between observed
isotopic ratios and amount of loaded Cl in the range of 3 to 200 μg of Cl. It was
suggested that Cs2Cl+ mass spectrometry could not be used as absolute
measurement of Cl isotope ratio and amount of Cl should be reproducible for

18
precise measurements of Cl isotope. From linear regression of the results in this
study (Fig. 2-6), 0.2 μg (10 %) error of Cl amount might accompany with 0.04 ‰
of Cl isotope ratio error.
It was reported that optimum Cs2Cl+ beam was obtained for sample with a
pH in the range 2-5 (Xiao and Zhang, 1992). On the other hand, it is possible that
H35Cl preferential evaporation from acidic solution of Cl- causes Cl isotope
fractionation during sample loading and ionization (Volpe and spivack, 1994;
Magenheim et al.,1994; Banks et al., 2000). In order to check the effect of acid in
the sample solution on ionization of CsCl, non-volatile acids (H3BO3, H3PO4,
H2SO4) were added to the sample solution. The Cs2Cl+ signal was sometimes
enhanced by addition of 0.01-0.1 nmol of acids, but the effect was not
reproducible. Thus, any non-volatile acid was not added to sample solution for
routine isotope measurements.
For all reported mass spectrometry of CsCl, only single filament was used.
In order to improve intensity of Cs2Cl+, isotopic measurements in double filament
mode were examined (Table 2-2). Configurations of the double-filament
measurements were as follows (EVA: evaporation filament – IONI: ionization
filament; CsCl: Nacalai 56.4 nmol, graphite: Nilaco 50 μg):
1. CsCl+graphite (EVA) – CsCl+graphite (IONI)
2. CsCl+graphite (EVA) – CsCl (IONI)
3. CsCl+graphite (EVA) – none (IONI)
4. CsCl (EVA) – graphite+0.1 nmol of H3BO3 (IONI)
Only part of loaded CsCl is ionized as Cs2Cl+ during isotopic measurement
of Cl by TIMS. It is possible that dissociation of Cs2Cl+ is suppressed under high
partial pressure of CsCl vapor or Cs+ on graphite surface. It was expected that
partial pressure of CsCl vapor would be kept by the experimental setup 1. In
addition, duplicate sample loading will level off ionization from uneven condition

19
and reduce the deviation of analytical results. In the experiment 2, effects of Cs+
supply from the ionization filament on Cs2Cl+ yield was also tested. Although
relatively high and durable ion current was observed in the experiments 1 and 2
compared with the single filament ionization, repeated measurements will be
necessary to assess the external error of this method. In the case of the
experiment 3, the mixture of CsCl and graphite on the evaporation filament was
heated by radiation from ionization filament, but Cs2Cl+ was not detected with
indirect heating. When both filaments were heated, result same to result of single
filament was obtained at relative low filament current. In order to remove
possible non-volatile impurities that inhibit ionization of CsCl, sites of
evaporation and ionization were separated in experiment 4. The Cs2Cl+ signal
attenuated quickly after the intensity reached 10-13 A. As CsCl and graphite did
not exist on the filaments after heating, amount of CsCl and H3BO3 (as binder of
graphite) has to be larger to obtain stable signal.
Optimum conditions of Cl isotope measurement judged from above
experiments were provided in Table 2-1. Typical time course of signal (Cs235Cl+)
intensity and mass discrimination during isotopic analysis were shown in Fig. 2-7.
Because mass discrimination sometimes progressed at early stage and rate stage
of data acquisition, such data blocks were omitted for evaluation of data.
Procedure of CsCl preparation from chloride ion
For accurate and reproducible measurements of Cl isotopic ratios, the
recovery yield for conversion process from Cl- sample to CsCl should be high
enough. Some impurities that suppress generation of Cs2Cl+ should be removed
from samples (Magenheim et al., 1994).
Reported procedures of CsCl preparation were based on cation exchange
techniques (Xiao and Zhang, 1992; Magenheim et al., 1994; Xiao et al., 2000;

20
Rosenbaum et al., 2000). In seawater, evaporites, aerosol and condensates
obtained from pyrohydrolysis of silicate rocks, Cl- is a major anion and
concentrations of organic compounds are low. The reported procedures are not
tedious but could be applicable for such simple composition samples. On the other
hand, AgCl precipitation would be suitable to recover and concentrate Cl- from
samples having more complex contents.
In order to establish procedures of CsCl preparation from recovered AgCl,
several procedures were examined. The reactions of conversion procedures were
as follows:
1. 2AgCl + M0 → M2+ + 2Cl- (+ SO42-) → Ba2+ + 2Cl- → 2Cs+ + 2Cl-
(H2SO4) Ba-resin Cs-resin
M: Zn or Mg, resin: DOWEX 50Wx8
2. 2AgCl + 4NH3 → 2[Ag(NH3)2]+ + 2Cl- → [M(NH3)n]2+ + 2Cl-
M0
→ M2+ + 2Cl- → 2Cs+ + 2Cl-
Cs-resin M: Zn or Mg, Δ: Hot plate (120 ℃)
3. 2AgCl + 4NH3 → 2[Ag(NH3)2]+ + 2Cl- → 2Na+ + 2Cl- + 4NH4+ + 4OH-
Na-form CR-11
→ 2Na+ + 2Cl- → 2Cs+ + 2Cl-
Cs-resin CR-11: chelate resin, Δ: Hot plate (120 ℃)
4. 2AgCl + 4NH3 → 2[Ag(NH3)2]+ + 2Cl- → 2H+ + 2Cl- → 2Cs+ + 2Cl-
H-form CR-11 Cs-resin
5. 2AgCl + 4NH3 + Cs2CO3 → 2[Ag(NH3)2]+ + 2Cl- + Cs2CO3 →
2AgCl + Cs2CO3 → 2Ag0 + CO2 + 1/2O2+ 2CsCl
AgCl dissolved in NH3 was loaded with Cs2CO3
Δ: The mixture of AgCl and Cs2CO3 was heated on the filament
Δ
Δ
Δ
Δ

21
Except for the CsCl obtained by the method 2 using metallic Mg and the
method 3, Cs2Cl+ signal intensities were lower than 10-13 A. There was no
significant difference in isotopic ratios measured by the method 2 (using Mg) and
3 (0.31974: n=3, 0.31982: n=3; respectively). Because the batch treatment of
[Ag(NH3)2]+ with the chelate resin CR-11 was tedious, the method 2 using
metallic Mg was adopted for routine isotopic analysis. Almost stoichiometric CsCl
solutions (Cs+:Cl- ≒ 1:1, only 0.2 % of NH4+ and 0.5 % of Mg2+ in molar fraction
of cations were detected) were obtained and the average of recovery yields of Cl-
as CsCl, was approximately 90 %.
Treatment with Ba-form resin of seawater sample gave higher signal
intensities compared with treatment by AgNO3 and Mg, also the former one gave
insignificantly higher Cl isotope ratios (Table 2-3, Fig. 2-8). However, systematic
shift of the Cl isotope ratios depending on signal intensities (Fig. 2-9) or the shift
caused by recovery process was not observed in the analytical results of the
Nacalai CsCl (Table 2-6).
Established CsCl preparation procedures for routine Cl isotope
measurements are shown in Fig. 2-2.
Seawater
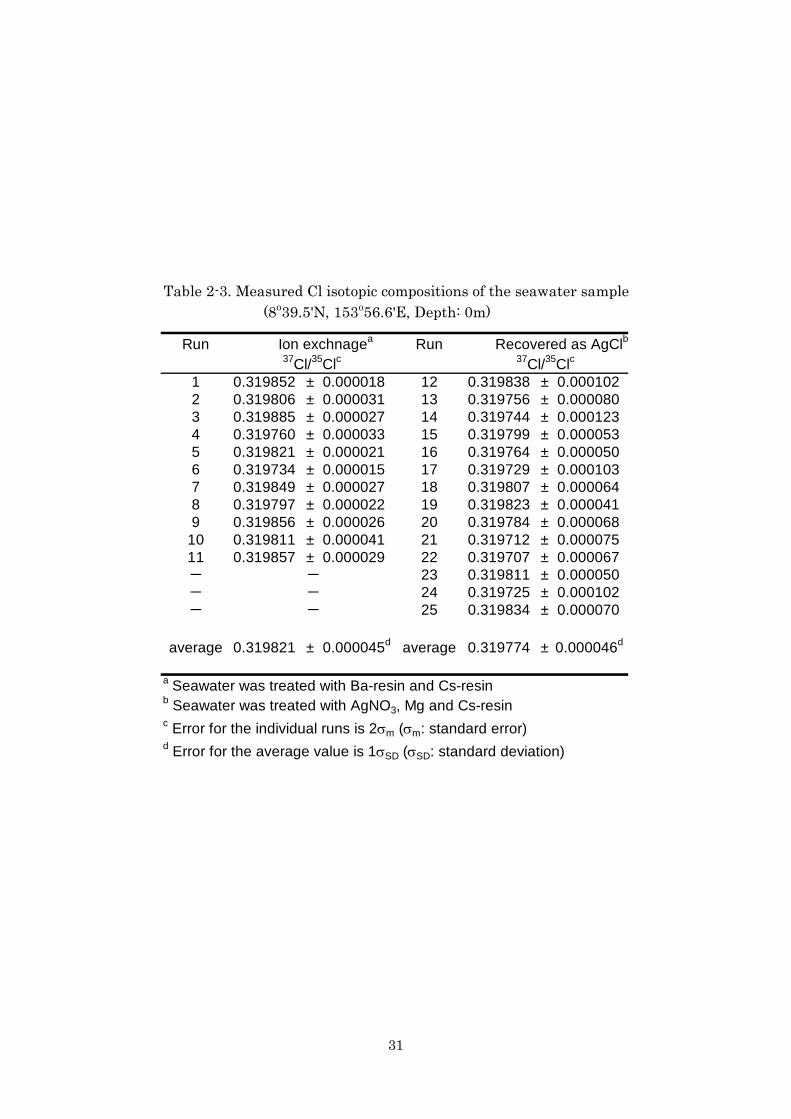
The results of Cl isotopic measurements of seawater (8o39.5’N, 153o56.6’E)
chloride are shown in Table 2-3 and Fig. 2-8. The results of runs 1 to 11 were
obtained for chloride recovered by treatment with Ba and Cs-form ion exchange
resin, and the results of runs 12 to 25 were obtained for those recovered as AgCl.
The mean 37Cl/35Cl ratios obtained by latter method appear to be lower, but the
difference was not significant. The recovery yield of Cl as CsCl ranged from 79 to
94 % (average: 88 %) by the AgCl-precipitation procedure.
The ion current intensities for runs 1 to 11 were higher (4 - 7 x 10-13 A)

22
than values of runs 12 to 25 (2 - 4 x 10-13 A). Although the internal errors (2σm:
standard error of the mean of individual ratios in each run) of runs 12 to 25 were
larger than errors of runs 1 to 11 by difference of ion current intensity, there was
no difference in external reproducibility (1σSD: standard deviation of the mean of
individual runs) between both pretreatment procedures. The average value
(0.319794: run 1 - 25) was used as standard (standard mean ocean chloride:
SMOC, δ37Cl = 0 ‰; Long et al., 1993) in the following results.
Nine seawater samples from different locations were repeatedly analyzed
(Table 2-4). Those samples were treated with Ba-form resin and Cs-form resin
before isotopic measurement. The results revealed the isotopic composition of Cl
in seawater is homogeneous as reported previously (Hoering and Parker, 1961;
Kaufman et al., 1984). Hydrothermal activity was found near one of sampling
point in the Pacific Ocean (18o12.9’N, 144o42.2’E; depth 992 m: minimum salinity
layer; depth 3235 m: center of plume from hydrothermal vent; depth 3725 m: just
above seafloor). Because the samples were not directly collected from
hydrothermal vent, hydrothermal fluid would be highly diluted with seawater.
Even if isotopic composition of chloride in hydrothermal fluid was different from
seawater, the influence on Cl isotopic composition in the samples might be
negligible. A sample from the In-land Sea (Setonaikai) must be affected by
industrial and municipal discharge, but no difference of δ37Cl was observed.
CsCl reagents
Because NIST SRM 975 (NaCl) is not available now, there is no
international standard for Cl stable isotopic composition. Although Cl in
seawater is isotopically homogeneous with variations less than the analytical
precision, it is possible that the analytical methods could be improved to detect
these variations (Xiao et al., 1995). In the case of mass spectrometry of CH3Cl,

23
reference CH3Cl gas is introduced into the spectrometer, and ion beams are
measured alternately in the sample and the reference for precise relative
measurement (Long et al., 1993; Musashi et al., 1998). In order to compare
precision and accuracy between laboratories and to check day-to-day
reproducibility in a laboratory by thermal ionization mass spectrometry of Cs2Cl+,
CsCl reagent would be suitable as a laboratory reference standard.
In order to establish a laboratory standard, 5 lots of commercial CsCl
reagents were analyzed (Table 2-5, 2-6). We noted that mass spectrometric runs
of a commercial grade reagent (Nacalai tesque) were most successful in obtaining
more stable isotopic ratios over an extended time period (Fig. 2-8), while ion
currents during a high purity CsCl (Aldrich, 99.999 %) and reagent grade CsCl
(Wako, 1 g bottle) runs were occasionally unstable and hence some data which are
not given in Table 2-4 were of poor quality. Also attenuation of Cs2Cl+ signal from
other 2 reagents was too rapid to measure isotopic ratio. Therefore, we
tentatively concluded that the Nacalai reagent was most safely employed as
laboratory standard.
Xiao et al. have reported the pH of loading solution affect on efficiency and
stability of ionization (Xiao and Zhang, 1992) and the pH of CsCl reagents may be
different due to excess alkalinity remaining in reagents (Xiao, personal
communication). The pH values of CsCl reagent solutions (56.4 mM) obtained by
measurements with a pH electrode were 5.67 (Nacalai, reagent grade), 5.98
(Aldrich, 99.999%), 6.08 (Wako, reagent grade, 1 g bottle), 6.00 (Wako, high purity,
25 g bottle) and 6.33 (Wako, reagent grade, 500 g bottle). The differences were
not so significant, but the order was roughly consistent with the order of the ion
current stability.

24
Inorganic compounds
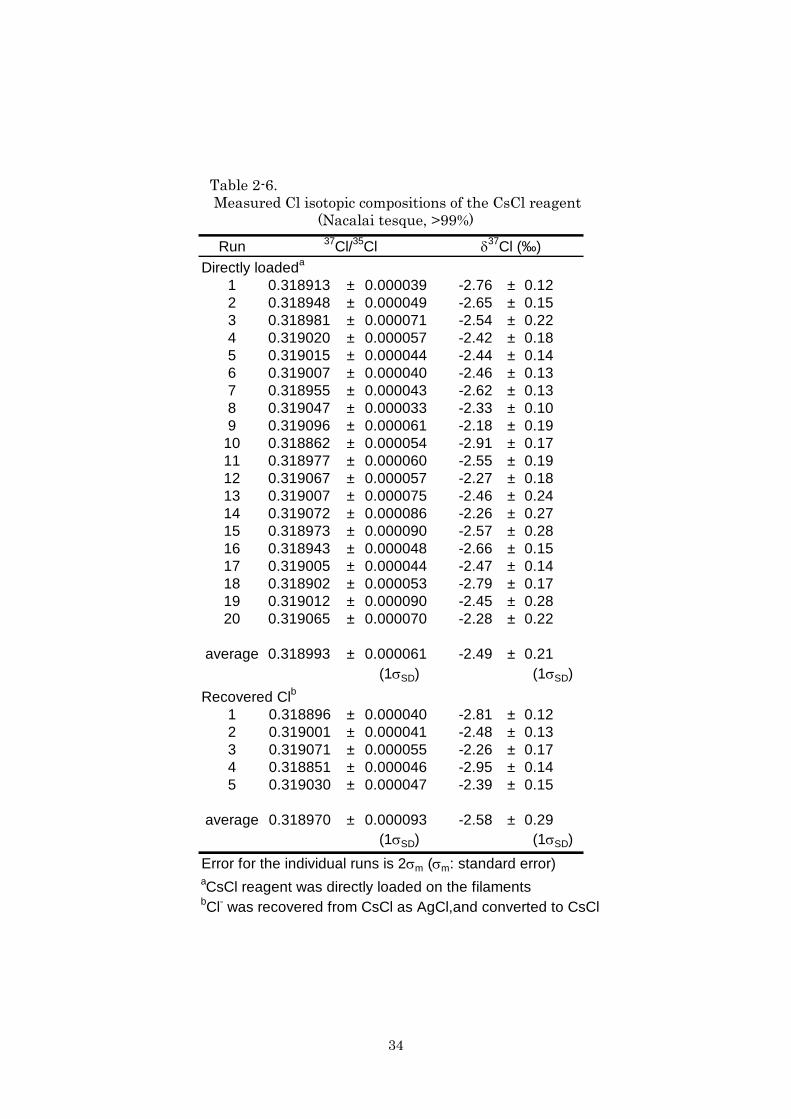
Isotopic composition of Cl recovered as AgCl from a CsCl reagent was
measured to check isotopic fractionation by the procedure (Table 2-6). A
significant difference was not observed between the composition obtained by this
treatment and that of directly loaded CsCl reagent. The recovery yield of Cl
ranged from 89 to 96 %.
Four kinds of inorganic chlorine compounds were used for Cl isotopic
measurement. Chloride ion (50 μg) in each compound was recovered as AgCl and
converted to CsCl (recovery yield: 88 to 96 %, average: 93 %). The range of δ37Cl
in the inorganic compounds, including CsCl, was -2.5 to +0.9 ‰ (Table 2-5, 2-6,
2-7). Difference in raw materials, processing of salts and production of Cl2 and
HCl gas would cause differences of δ37Cl in inorganic compounds.
Main resources of Cl are seawater, brine and evaporites. Chlorine isotopic
composition in seawater is homogeneous (δ37Cl: 0 ‰), and the variations in brine
and halite is small (in most of the case δ37Cl: -1 to +1 ‰, Eggenkamp et al., 1995;
Liu et al., 1997, Eastoe et al., 1999). Difference in raw materials would not be
enough to explain the variation.
Salts, including NaCl and KCl, were purified by crystallization for
industrial use (Grayson, 1985). The isotopic fractionation factor of chloride
between NaCl crystal and its saturated solution is 1.0003, and δ37Cl of NaCl
crystals are expected to decrease from +0.3 to -0.6 ‰ during precipitation from
seawater (Eggenkamp et al., 1995). Potassium chloride is obtained from
evaporites (carnallite, KCl・MgCl2・6H2O; sylvine, KCl) or bittern (residual brine
after precipitation of NaCl) by fractional crystallization. Since the potassium
salts crystallized at a later stage during the evaporation of brine, δ37Cl of KCl
would be more negative than δ37Cl of NaCl. A small isotope fractionation factor of
Cl between KCl crystal and its saturated solution (α = 0.9999, Eggenkamp et al.,

25
1995) would give KCl crystal depleted in 37Cl at an early stage of the fractional
crystallization. The repeated recrystallization for refinement could cause low
δ37Cl of KCl such as we can see it in case of this study. Other physical (e.g.
flotation) and chemical (e.g. removal of divalent cations with chelate resin)
processes for refinement would not affect the isotopic composition of the salts.
The most important intermediate of inorganic and organic chlorine
compounds, Cl2 gas is mainly produced by electrolysis of NaCl in aqueous
solution (Grayson, 1985). After the tragic Minamata disease, Hg cells for the
electrolysis were changed to ion exchange membrane cells, and more than 80 % of
Cl2 gas is produced using the membrane cells in Japan. Electrophoretic mobility
in solution (Madorsky and Straus, 1947), and oxidation rate on anode are
different between 35Cl- and 37Cl- in the electrolysis process. Johnston and
Huchinson (1942) reported 35Cl preferential Cl2 gas generation and relatively
large fractionation factor (α = 1.006) for electrolysis of NaCl. Although the
influence of cell type and electrode material on the fractionation factor has not
been reported, electrolysis of NaCl can be the important step that causes the
isotopic variation in manufacturing process of chlorine compounds.
Another important intermediate of chlorine compounds, HCl is mainly
produced as by-product of organic chlorine compounds, and less than 1/3 is
produced by the reaction of inorganic compounds (Cl2 and H2; NaCl and H2SO4,
Grayson, 1985). In latter case, small isotopic fractionation in the step of
manufacturing would result from high Cl-yields of these reactions.
Isotopic fractionation mechanisms during Cl2 and HCl manufacturing
processes were summarized in Fig. 2-10.
Most of cesium chloride is produced from pollucite (CsAlSi2O6) by digestion
with acid (HCl) or decomposition with base (CaCO3 + CaCl2 or Na2CO3 + NaCl),
and refined by precipitation as a complex double salt (Grayson, 1985). The δ37Cl

26
in three different CsCl regents ranged from -2.5 to +0.1 ‰ (Table 2-5, 2-6), but
the information is not enough to qualify the procedure that causes such
variations.
Comparison of mass spectrometric methods
Negative thermal ionization mass spectrometry (N-TIMS) of Cl- from AgCl
was developed by Shields et al. (1962). Vengosh et al. (1989) reported a simple
procedure of N-TIMS using directly loaded geochemical samples. However, these
techniques based on N-TIMS of Cl- have high discrimination factor and large
filament blank (Magenheim et al., 1994). Their high sensitivity is suitable for Cl
qualification by isotope dilution mass spectrometry (Heumann et al., 1987;
Shinonaga et al., 1994a,b), but they are not precise enough (uncertainty: 2 ‰) for
isotopic analysis of most geochemical samples. This study showed that TIMS of
Cs2Cl+ was sensitive and precise enough for some purpose.
The ion current intensity obtained in this study (2 - 3 x 10-13 A, 2 μg-Cl
loaded) was much lower than the intensity reported by Xiao et al. (1995) (7 x 10-12
A, 10 μg-Cl loaded), but higher than the value reported by Magenheim et al.
(1994) (4 x 10-14 A, 2 μg-Cl loaded). The Cl isotopic ratio of seawater measured in
this study was 0.319794 ± 0.000051 (average of run 1 – 25, ± 1σSD). This value
is significantly higher than the one obtained by Xiao et al. (1995) (0.318988 ±
0.000049: 1σSD), but similar to the ones reported by Magenheim et al. (1994)
(0.31944 ± 0.00009 or 0.31970 ± 0.00008: 1σSD). As described previously, many
factors affect the ion current intensity, the reason of the differences of ion current
and isotopic ratio is not clear. According to recent reports (Rosenbaum et al.,
2000; Xiao et al., 2000), quantities of loaded samples and crystal microstructures
of graphite would be most important factors on Cs2Cl+ signal intensity and Cl
isotopic ratios. The modifications of loading condition and use of multi-Faraday

27
cup mode employed in this work yielded precision (0.16 ‰ ) better than or
comparable to the level of previously reported (0.15 ‰ using 10 μg of Cl: Xiao et
al., 1995; 0.25 ‰ using 2 μg of Cl: Magenheim et al., 1994) using smaller size of
samples (2 μg of Cl).
Although the precision of the measurements (0.12 to 0.29 ‰ : external
reproducibility, 1σSD) was slightly lower compared to values obtained by electron
impact ionization mass spectrometry of CH3Cl (0.09 ‰: Long et al., 1993; 0.1 ‰:
Musashi et al., 1998), purification process with a gas chromatograph is not
necessary for the procedure described in this chapter. Also, the mass
spectrometry of CsCl requires smaller amounts of sample as chloride ion (2 μg)
for each measurement, and it is possible that the sample quantity for the
measurements could be reduced further.
Conclusions
Thermal ionization mass spectrometry of Cs2Cl+ was applied for chlorine
isotopic measurements of inorganic chlorine compounds. Representative results
in this study are shown in Fig. 2-11. The δ37Cl range of inorganic samples (-2.5 to
+0.9 ‰) was similar to the range of that of most Cl in surface and subsurface
water.
The precision (external reproducibility) of the analytical method (0.1 to
0.3 ‰: 1σSD) was not better than the precision of the mass spectrometry of CH3Cl,
but was precise enough to distinguish Cl isotopic composition of chlorine
compounds. In order to reduce the error of the method, improvement of sample
preparation and loading procedure are necessary because many factors affect
CsCl ionization process. Since it was possible to reveal Cl isotopic fractionation in
most of the reagents and perhaps natural materials using small amounts of

28
samples and without expensive equipment for pretreatment, this analytical
procedure could be applied to solve geochemical, cosmochemical and
environmental issues.
No variations in isotopic composition of seawater sample and commercial
grade CsCl reagent from the corresponding average values were observed during
the period of this study (more than 7months). Thus, CsCl reagent can be used as
laboratory reference standard.

29
Table 2-1. Conditions of mass spectrometry
Filament undegassed Ta
Sample Loading
Amount of Chloride Ion 2 μg
pH 5 - 6
Cs+ : Cl- (molar ratio) 1 : 1
Drying (filament current) 1.5 A, 0.5 min
Filament current
Preheat 0 → 1.2A(0.12A/min)
Measurement 1.42 - 1.48A
Ion current (Cs235Cl+) 2 - 5×10 -13A

Tabl
e 2-
2. R
esul
ts o
f dou
ble-
filam
ent m
etho
ds
Lo
adin
g
Fi
lam
ent c
urre
nt
S
igna
l (C
s 235
Cl+ )
37
Cl /
35C
l E
vapo
ratio
nIo
niza
tion
Evap
orat
ion
Ioni
zatio
nIn
tens
ityD
urat
ion
Dou
ble
filam
ent
CsC
l + G
CsC
l + G
1.31
2A1.
312A
~10
0mV
>1hr
0.31
87±
2C
sCl
CsC
l + G
1.33
5A1.
335A
40~
50m
V>1
hr0.
3188
±5
CsC
l + G
-1.
365A
1.47
0A30
~35
mV
<2hr
0.31
87±
7C
sCl
H3B
O3 +
G1.
410A
1.36
6AM
ax. 1
0mV
~5m
in
-
Sin
gle
filam
ent
CsC
l + G
1.38
~1.
45A
-30
~40
mV
>2hr
0.31
88±
8*
*: m
ean
of 1
0 m
easu
rem
ents
± e
xter
nal e
rror
(1σ S
D),
G: g
raph
ite
31
Table 2-3. Measured Cl isotopic compositions of the seawater sample (8o39.5'N, 153o56.6'E, Depth: 0m)
Run Ion exchnagea Run Recovered as AgClb37Cl/35Clc 37Cl/35Clc
1 0.319852 ± 0.000018 12 0.319838 ± 0.0001022 0.319806 ± 0.000031 13 0.319756 ± 0.0000803 0.319885 ± 0.000027 14 0.319744 ± 0.0001234 0.319760 ± 0.000033 15 0.319799 ± 0.0000535 0.319821 ± 0.000021 16 0.319764 ± 0.0000506 0.319734 ± 0.000015 17 0.319729 ± 0.0001037 0.319849 ± 0.000027 18 0.319807 ± 0.0000648 0.319797 ± 0.000022 19 0.319823 ± 0.0000419 0.319856 ± 0.000026 20 0.319784 ± 0.000068
10 0.319811 ± 0.000041 21 0.319712 ± 0.00007511 0.319857 ± 0.000029 22 0.319707 ± 0.000067- - 23 0.319811 ± 0.000050- - 24 0.319725 ± 0.000102- - 25 0.319834 ± 0.000070
average 0.319821 ± 0.000045d average 0.319774 ± 0.000046d
a Seawater was treated with Ba-resin and Cs-resinb Seawater was treated with AgNO3, Mg and Cs-resinc Error for the individual runs is 2σm (σm: standard error)d Error for the average value is 1σSD (σSD: standard deviation)

Tab
le 2
-4. M
easu
red
Cl i
soto
pic
com
posi
tion
s of
sea
wat
er s
ampl
es
Loca
tion
Dep
th (
m)
Sal
inity
(‰
) T
emp
( ℃)
Sam
plin
g da
te37
Cl /
35C
l *P
acifi
c O
cean
8o 39
.5'N
, 153
o 56.6
'E0
34.8
7328
.003
/04/
1998
0.31
9820
±0.
0000
37(n
=7)
12o 06
.9'N
, 138
o 52.3
'E0
34.3
8726
.403
/08/
1998
0.31
9894
±0.
0001
71(n
=5)
12o 58
.4'N
, 143
o 43.7
'E0
34.3
97-
03/1
0/19
980.
3198
47±
0.00
0041
(n=3
) 1
8o 12.9
'N, 1
44o 42
.0'E
034
.843
27.0
03/1
1/19
980.
3198
29±
0.00
0079
(n=4
) 1
8o 12.7
'N, 1
44o 42
.2'E
992
34.4
704.
103
/11/
1998
0.31
9870
±0.
0000
87(n
=4)
18o 12
.7'N
, 144
o 42.2
'E32
3534
.667
1.7
03/1
1/19
980.
3198
83±
0.00
0091
(n=5
) 1
8o 12.7
'N, 1
44o 42
.2'E
3725
34.6
691.
703
/11/
1998
0.31
9856
±0.
0000
79(n
=6)
26o 30
.2'N
, 142
o 39.4
'E0
34.9
4722
.903
/13/
1998
0.31
9853
±0.
0001
17(n
=4)
Set
onai
kai
34o 38
.3'N
, 135
o 07.0
'E0
31.6
-02
/08/
1998
0.31
9849
±0.
0000
93(n
=4)
* E
rror
: 2σ
m (
σm
: ext
erna
l sta
ndar
d er
ror)
Per
iod
of th
e an
alys
is: J
une
1998
- J
uly
1998

33
Table 2-5. Measured δ37Cl values of the CsCl reagentsRun Aldrich (99.999%) Wako (>99%)
δ37Cl (‰) δ37Cl (‰)1 -0.74 ± 0.22 0.36 ± 0.152 -0.68 ± 0.41 0.15 ± 0.123 -0.81 ± 0.14 0.00 ± 0.144 -1.00 ± 0.15 -0.06 ± 0.155 -0.80 ± 0.226 -0.66 ± 0.147 -0.61 ± 0.438 -0.96 ± 0.179 -0.96 ± 0.23
average -0.80 ± 0.14 0.11 ± 0.19(1σSD) (1σSD)
Error for the individual runs is 2σm (σm: standard error)CsCl was directly loaded on the filaments with graphite
34
Table 2-6. Measured Cl isotopic compositions of the CsCl reagent (Nacalai tesque, >99%)
Run 37Cl/35Cl δ37Cl (‰)Directly loadeda
1 0.318913 ± 0.000039 -2.76 ± 0.122 0.318948 ± 0.000049 -2.65 ± 0.153 0.318981 ± 0.000071 -2.54 ± 0.224 0.319020 ± 0.000057 -2.42 ± 0.185 0.319015 ± 0.000044 -2.44 ± 0.146 0.319007 ± 0.000040 -2.46 ± 0.137 0.318955 ± 0.000043 -2.62 ± 0.138 0.319047 ± 0.000033 -2.33 ± 0.109 0.319096 ± 0.000061 -2.18 ± 0.19
10 0.318862 ± 0.000054 -2.91 ± 0.1711 0.318977 ± 0.000060 -2.55 ± 0.1912 0.319067 ± 0.000057 -2.27 ± 0.1813 0.319007 ± 0.000075 -2.46 ± 0.2414 0.319072 ± 0.000086 -2.26 ± 0.2715 0.318973 ± 0.000090 -2.57 ± 0.2816 0.318943 ± 0.000048 -2.66 ± 0.1517 0.319005 ± 0.000044 -2.47 ± 0.1418 0.318902 ± 0.000053 -2.79 ± 0.1719 0.319012 ± 0.000090 -2.45 ± 0.2820 0.319065 ± 0.000070 -2.28 ± 0.22
average 0.318993 ± 0.000061 -2.49 ± 0.21(1σSD) (1σSD)
Recovered Clb
1 0.318896 ± 0.000040 -2.81 ± 0.122 0.319001 ± 0.000041 -2.48 ± 0.133 0.319071 ± 0.000055 -2.26 ± 0.174 0.318851 ± 0.000046 -2.95 ± 0.145 0.319030 ± 0.000047 -2.39 ± 0.15
average 0.318970 ± 0.000093 -2.58 ± 0.29(1σSD) (1σSD)
Error for the individual runs is 2σm (σm: standard error)aCsCl reagent was directly loaded on the filamentsbCl- was recovered from CsCl as AgCl,and converted to CsCl

35
Table 2-7. Measured δ37Cl values of the inorganic compounds
Run HCl (gas) HCl NaCl KClδ37Cl (‰) δ37Cl (‰) δ37Cl (‰) δ37Cl (‰)
1 0.88 ± 0.14 -0.26 ± 0.33 -0.95 ± 0.34 -2.30 ± 0.312 1.03 ± 0.28 -0.24 ± 0.32 -1.04 ± 0.28 -2.26 ± 0.323 0.85 ± 0.16 -0.22 ± 0.25 -0.96 ± 0.47 -2.16 ± 0.374 0.05 ± 0.18 -0.70 ± 0.31
average 0.92 ± 0.10 -0.17 ± 0.15 -0.91 ± 0.15 -2.24 ± 0.07(1σSD) (1σSD) (1σSD) (1σSD)
Error for the individual runs is 2σm (σm: standard error)

36
Fig. 2-1. Location map of the seawater sampling points.
Route of the KH-98-1 Expedition
Setonaikai Depth: 0m Depth: 0m
Depth: 0m
Depth: 0m Depth: 0m
Depth: 0m, 999m, 3235m, 3725m

37
Sample solution ← 1M HNO3 (50μL) ← 30mM AgNO3 (100μL)
Centrifuge sup. ppt ( AgCl ) Washing 0.01M HNO3 (500μL×2), H2O (50μL×1) ← 1M NH3 (50μL) ( [Ag(NH3)2]+,NH4
+,Cl-,OH- ) ← Mg powder (ca. 1mg) Centrifuge sup ( Mg2+,Cl-,NH4
+,OH- ) ppt ( Ag, Mg ) Dry on Hot plate ← H2O (50μL) 50Wx8 column (Cs+-form) elute with H2O
( ← activated charcoal (1mg) ) (Centrifuge) Dry on Hot plate ← H2O (ca. 20μL) ( Cs+,Cl- ) 2.0μg-Cl/μL Fig. 2-2. Procedures of CsCl preparation from seawater, inorganic reagents and chloride ion recovered from organic compounds.
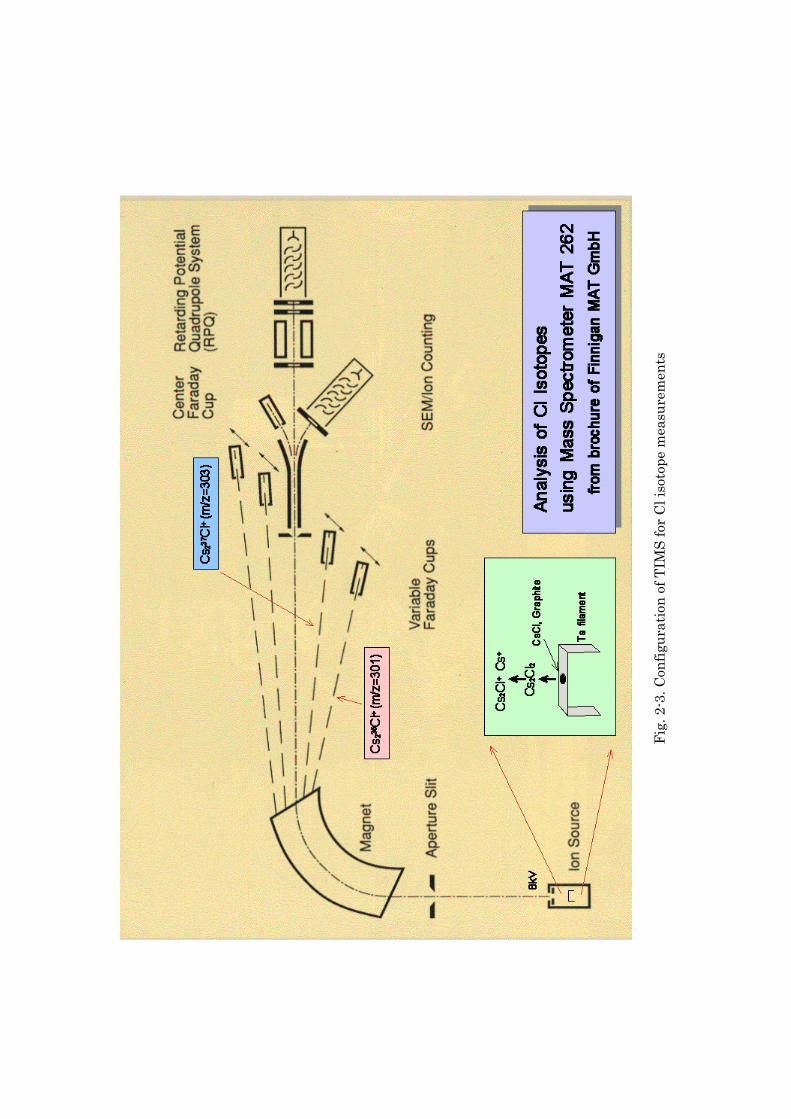
Fig.
2-3
. Con
figur
atio
n of
TIM
S fo
r C
l iso
tope
mea
sure
men
ts

39
1.0E-12
1.0E-11
1.0E-10
1.0E-09
1.0E-08
1.0E-07
1.0E-06
0.8 0.9 1.0 1.1
Filament current (A)
Mul
tiplie
r out
put (
A)
Fig. 2-4. The change of ion current intensities with filament current. A reagent grade
CsCl (2 μg-Cl) was loaded on Ta filament (width 0.75mm; Nilaco) with graphite
powder. Center, flat, whole: CsCl and graphite were loaded on center of the filament in
ca. 1 mm, 2 mm, 7 mm of length respectively.
◆ : Cs+ (center)
◇: Cs2Cl+ (center)
▲: Cs+ (flat)
△: Cs2Cl+ (flat)
■: Cs+ (whole)

0.31
84
0.31
88
0.31
92
0.31
96
0.32
00
-4.0
-3.0
-2.0
-1.0
0.0
1.0
Dat
e
δ37Cl(‰)
37Cl /
35Cl
Sep
J
an
May
Sep
J
an
May
1998
2000
1999
CsC
l
Sea
wat
er
0.31877±8
0.31899±6
0.31957±5
0.31977±5
Gra
phite
(US
GS
)
Gra
phite
(Nila
co)
Fig.
2-5
. Va
riat
ion
of 3
7 Cl
/ 35
Cl
ratio
s of
sea
wat
er c
hlor
ide
and
Nac
alai
CsC
l rea
gent
with
diff
eren
t kin
ds o
f gra
phite
load
.
41
0.3190
0.3195
0.3200
0.3205
0 2 4 6 8 10
37C
l / 35
Cl
Loaded Cl ( g)μ
Fig. 2-6. Change of Cl isotopic ratio data with amount of loaded Cl. The sample was
CsCl converted from seawater chloride (8o39.5’N, 153o56.6’E).

42
Fig. 2-7. Typical time course of Cs2Cl+ ion current (a) and mass discrimination (b)
during TIMS analysis.
b
a
10min
10mV
3mV
1mV Data
acquisition

43
0.3185
0.3190
0.3195
0.3200
0.3205
-4
-3
-2
-1
0
1
2
37C
l / 35
Cl
δ (‰
)
May Jun Jul
1998 1999Aug Sep Oct Nov Dec Jan Feb Mar Apr May Jun Jul
37C
l
CsCl
Seawater-1 Seawater-2
Fig. 2-8. Chlorine isotopic compositions of seawater and a CsCl reagent for the period
between June 1998 and July 1999. The seawater was taken from the Pacific Ocean
(8o39.5’N, 153o56.6’E) in March 1998 (Seawater-1: The seawater was treated with
Ba-form resin and Cs-form resin; Seawater-2: The seawater was treated with AgNO3,
Mg, and Cs-form resin). The commercial grade (purity: >99%) CsCl reagent was
obtained from Nacalai tesque, Kyoto. Error bars represent 2σm (σm: internal standard
error).

44
0.3180
0.3185
0.3190
0.3195
0.3200
10 20 30 40 50 60 70 80
37C
l / 35
Cl
Intensity of Cs2Cl+ signal (mV)
Fig. 2-9. Relationship between Cl isotopic compositions of the Nacalai CsCl and signal
intensities of Cs2Cl+.

Fig.
2-1
0. C
l iso
tope
frac
tiona
tion
duri
ng m
anuf
actu
ring
pro
cess
es o
f Cl 2
and
HC
l fr
om E
ncyc
lope
dia
of C
hem
ical
Tec
hnol
ogy
(Joh
n W
eile
y &
Son
s)
etc.
, 1
) Kau
fman
et a
l.(19
84),
2) L
iu e
t al.(
1997
), 3)
Egg
enka
mp
et a
l.(19
95),
4) M
ador
sky
& S
trau
s (1
947)
, 5) H
erri
ck &
Hut
chis
on (1
942)

46
-3 -2 -1 0 1 2 3
Seawater (n=25)
CsCl-1 (n=20)
CsCl-2 (n= 9)
CsCl-3 (n= 4)
HCl/gas (n= 3)
HCl (n= 4)
NaCl (n= 4)
KCl (n= 3)
δ (‰)37Cl
Fig. 2-11. Results of chlorine isotopic measurements of seawater and inorganic
reagents. CsCl reagents were purchased from three companies (Nacalai tesque,
Aldrich, Wako Pure Chemicals). Error bars are 2σm (σm: external standard error).

47
3. Measurements of chlorine isotopic ratio in chlorinated organic
compounds
Introduction
Soil and groundwater contaminations with chlorinated aliphatic
hydrocarbons (CAHs) are found in many industrial and residential areas
(Kawasaki, 1985; Fisher et al., 1987). Although some of CAHs are suspected to
be carcinogens and mutagens, it is difficult to identify the sources of subsurface
pollutions and to evaluate effectiveness of clean-up technologies because of
limited monitoring points and frequency, and complex behavior of CAHs in
subsurface environments (Fig. 3-1).
Isotopic ratios of elements such as carbon, nitrogen, sulfur, boron,
selenium, lead are useful indicators for tracing the sources of pollutants and
their reactions in the field (Conrad et al., 1997; Aggarwal et al., 1997; Jarman et
al., 1998; Yoshida and Toyoda, 2000; Nakai et al., 1991; Komor, 1997; Johnson et
al., 2000; Strurges and Barrie, 1989). Ratios of two stable Cl isotopes (37Cl / 35Cl)
can be used for similar purposes.
The range of Cl isotopic compositions in natural systems is smaller
compared to that of other light elements (Hoef, 1997). The isotopic fractionation
occurs in groundwater by the difference of diffusion rate between 35Cl and 37Cl
(Desauliniers et al., 1986), ion filtration process (Phillips and Bentley, 1987), and
mixing of different source of Cl (Kaufmann et al., 1993). The Cl isotopic
composition of ground water typically range from –2 to +2‰ relative to standard
mean ocean chloride (SMOC). In contrast, Tanaka and Rye (1991) reported a
larger Cl isotopic variations in CAHs, and suggested that it may be used to
quantify the flux of stratospheric chlorine derived from man-made chlorinated

48
compounds apart from natural sources (e.g. Gschwend et al., 1985; Gribble, 1994;
Hoekstra et al., 1998; Jordan et al., 2000; Robert et al., 2000; Yokouchi et al.,
2000; Keppler et al., 2000). A similar study was also undertaken by van
Warmerdam et al. (1995) who measured the Cl and C isotopic ratios in CAHs to
distinguish the groundwater contaminants from different manufacturers and to
trace them.
Electron impact mass spectrometry of CH3Cl (Taylor and Grimsrud, 1969;
Kaufmann et al., 1984; Long et al., 1993; Musashi et al., 1998) is known as the
most precise method of Cl isotopic analysis, and has been used for investigation
of Cl isotopes in CAHs (Tanaka and Rye, 1991; van Warmerdam et al., 1995; Holt
et al., 1997; and Jendrzejewski et al., 1997; Beneteau et al., 1999) and PCBs
(Jarman et al., 1998; Reddy et al., 2000). However, the technique of CH3Cl
preparation from chloride requires relatively large quantities of chlorine.
Thermal ionization mass spectroscopy of Cs2Cl+ has small mass dependent
fractionation (Xiao and Zhang, 1992; Xiao et al., 1995), low filament blank, and
high sensitivity (Magenheim et al., 1994; Rosenbaum et al., 2000). In this study,
chlorine isotopic ratios in CAHs were determined using a high resolution mass
spectrometer.
Experimental Procedures
Presentation of isotopic data.
The isotopic compositions of chlorine are represented in per mil (‰ )
deviation from those of the standard mean ocean chloride (SMOC: Long et al.,
1993), and a reagent grade CsCl from Nacalai tesque was utilized as a routine

49
laboratory standard of Cl isotopic composition during the course of this study
(Numata et al., in press; see Chapter 2).
.
1000137 ×⎥⎥⎦
⎤
⎢⎢⎣
⎡−⎟⎟
⎠
⎞⎜⎜⎝
⎛=
SMOC
sample
RR
Clδ ClCl
35
37
=R (3-1)
One or two standards were typically loaded into the mass spectrometer together
with the samples, and δ values of samples were calculated from the following
equation.
1000)101(
13
37 ×⎥⎥⎦
⎤
⎢⎢⎣
⎡ +−=
−
CsCl
CsClsample
RR
Clδ
δ (3-2)
where δCsCl : -2.49 (per mil deviation of isotopic ratios between the CsCl reagent
and seawater, which was calculated from more than 25 isotopic measurements;
Chapter 2), R : average of standard CsCl isotopic ratios in the period of sample
analysis.
Samples and Reagents.
The water used for this work, was purified using a Milli-RX12Plus and a
Milli-Q SP system (Millipore). A commercial grade CsCl (minimum assay 99%;
Nacalai tesque) were stored as 56.4 mM (2.0 g-Cl/L) solution and was used for
laboratory reference standard (Numata et al., in press). An activated charcoal
(GX-60: GL Sciences) was washed with water before use in order to remove
chloride ion.
Dichloromethane (DCM: minimum assay 99 %; Wako, 99 %; Nacalai,
50
pesticide analysis grade; Nacalai, pesticide analysis grade; Wako),
trichloromethane (CF: assay 99 %; Nacalai), tetrachloromethane (CT: minimum
assay 95%; Nacalai, assay 99 %; Nacalai, minimum assay 96 %; Nacalai),
1,2-dichloroethane (DCA: assay 99 %; Nacalai), 1,1,1-trichloroethane (MC: assay
97 %; Wako, assay 95 %; Nacalai), 1,1-dichloroethene (1,1-DCE: assay 99 %;GL),
cis-1,2-dichloroethene (cDCE: assay 97 %; GL), trans-1,2-dichloroethene (tDCE:
assay 99 %; GL), trichloroethene (TCE: minimum assay 99.5 %; Wako, minimum
assay 99.5 %; Wako, assay 99.5 %; Nacalai), and tetrachloroethene (PCE:
minimum assay 99 %; Wako, assay 98%; Nacalai, minimum assay 98 %, Nacalai,
assay 99.7 %; Merck) were used for Cl isotopic measurements (where GL: GL
Sciences; Merck: E. Merck ; Nacalai: Nacalai tesque; Wako: Wako Pure chemical
Industries). Other chemicals were analytical or reagent grades.
Preparation of Cl- fromCAHs.
The organic chlorine atoms were liberated as chloride ion with the sodium
biphenyl reagent following the method of Liggett (1954) with some modifications
(Numata et al., in press; Fig. 3-2).
Place 2.0 ml of organic solvents (toluene, n-decane or di-isopropyl ether)
and 1.2 to 1.6 mg of chlorinated organic compounds containing 1.0 mg of Cl in
test tubes with screw stoppers. Gas phase was replaced with nitrogen, and 0.2 ml
of sodium biphenyl reagent (1 M solution in dimethoxyethane, Dojindo
Laboratory) was added. After 30 min, 0.5 mL of water was added and shaken to
extract chloride ion and to destroy the excess reagent. The lower aqueous layer
was separated and the chloride ion was extracted twice with 1.0 mL of 1 M HNO3
and 0.5 mL of water respectively. The extracted fractions were combined and
diluted to 10 mL with water.

51
CAHs (DCM, CT, TCE and PCE) were also treated with KMnO4 and the
Fenton reagent (H2O2 + Fe2+) (Imagawa, 1990) in order to compare the recovery
yield of Cl and isotopic ratio with the result of sodium biphenyl method. Place
100 mL of 0.01 M KMnO4 and 15 mg of CAHs in a serum bottle, and the bottles
were sealed with polytetrafluoroethene lined rubber septa and aluminum cups.
After the reaction (30 ℃, 12 hr), 0.38 g of Na2SO3 was added and the bottles were
shaken to reduce the excess permanganate ion. For the experiments of Fenton
reaction, 45 mL of aqueous solution containing 50 mg of FeSO4・7H2O, 25 mg of
H2SO4 and 15 mg of CAHs were placed in a serum bottle. The bottles were then
sealed with polytetrafluoroethene lined rubber septa and aluminum cups, and the
solution was injected with 5 mL of 20% H2O2. After reacting for 12 hours at 30 ℃,
1.5 mL of 1 M Na2SO3 solution was added and the bottle was shaken to reduce
the excess H2O2.
Preparation of CsCl from Cl-.
Chloride ion in aqueous solution was isolated as AgCl and was converted
into CsCl using the modified method of Hoering and Parker (1961) and
Magenheim et al. (1994) (Numata et al., in press; see Chapter 2). The
degradation products of CHAs containing 50 μg of Cl- were placed in a
polypropylene centrifuge tubes and water was added to produce 1.0 mL of
solution. Fifty microliter of 1 M HNO3 and 100 μL of 30 mM AgNO3 solution were
then added to each tube. After waiting for ~1 hour at room temperature, the
solutions were centrifuged at 12,000 g for 5 min, and the supernatants were
discarded. The AgCl precipitate was washed twice with 500 μL of 0.01 M HNO3
and once with 50 μL of water by centrifugation, and 50 μL of 1 M NH3 was
subsequently added to dissolve the AgCl. Approximately 1 mg of Mg powder was

52
then added to the solution. After one-hour of reaction, the solution was
centrifuged and the supernatant was recovered. The precipitate was washed
twice with 50 μL of water. All supernatant fractions were combined and
evaporated to dryness on a hot plate. The residue (NH4Cl + MgCl2) was dissolved
in 50 μL of water and was loaded onto a column that contained 0.1 mL of Cs-form
cation exchange resin (DOWEX 50Wx8, 200-400mesh; Nakarai Chemicals). The
column was washed with 150 μL of water. Activated charcoal suspension (20 μL,
ca.1mg activated charcoal included) was added to the eluent in order to remove
possible residual organic compounds. After 30 min, the solution was centrifuged
(at 12,000 g, 5 min). The precipitate was washed with 50 μl of water, and was
centrifuged again. The concentration of Cl- in the combined supernatant was
measured by ion chromatography. The eluent was evaporated to dryness on a hot
plate. Amount of Cl- was calculated from Cl- concentration and weight of the
eluent, and then water was added to the solid residue (CsCl) to form 2 g-Cl/L of
solution.
Chloride ion concentrations were measured using a Hitachi ion
chromatograph L-7000 with a Hitachi 2740 analytical column and a mixed eluent
(2.3mM phthalic acid and 2.5mM 2-amino-2-hydroxymethyl-1,3-propanediol) at 1
mL min-1.
CAHs recovery from aqueous solution
To establish an extraction method of Cl in chlorinated solvent dissolved in
water, reagent grade TCE (Wako) and PCE (Wako) were recovered from aqueous
solution by solvent extraction and air purge. The extraction experiments were
performed in 120-mL serum bottles. Place 100 mL of water and 1.5 mg of TCE or
PCE were placed in serum bottles, and then the bottles were sealed with

53
polytetrafluoroethene lined rubber septa and aluminum cups. After 24 hours, 3.0
mL of toluene was added through the septum in order to extract TCE. The bottles
were then shaken vigorously to extract TCE from water and headspace. After
transferring the toluene layer containing chloroethenes to another test tube, 2.0
mL of toluene was added to the bottle and extraction of chloroethenes was
repeated. TCE extracted in toluene was dried with 1.0 g of anhydrous Na2SO4
and then treated with the sodium biphenyl reagent by the above method. Because
remaining water consumed the sodium-biphenyl reagent at the degradation of
TCE, 400 μL of the sodium-biphenyl reagent was added instead of 200 μL.
The TCE solution was also purged with air flow (30 mL / min, 1 hr) and the
effluent was passed through in PbO2+H2SO4 layer in a commercial gas detector
tube (Gastec No.132M: for TCE detection). Released HCl gas was bubbled
through 10 ml of water in test tube.
Regioselective Cl elimination from TCE
TCE (Wako) was degraded by three kinds of culture of anaerobic bacteria
(Table 4-1) to eliminate Clc in the TCE molecule (Fig. 3-5). From regressions of Cl
isotopic ratio trajectories with fraction of TCE, Cl isotopic ratio in Clc and
average of ratio in Cla and Clb were calculated (Fig. 4-7).
The Clb atom in the TCE molecule was liberated as chloride ion by
β-elimination (dehydrochlorination) with KOH. The reaction was performed in
68-mL serum bottles with 1.0 mL of 5 M KOH. The solution was purged with N2
gas for 5 min to remove oxygen in the media and headspace gas. The bottles were
then sealed with polytetrafluoroethylene lined rubber septa and aluminum cups.
The solution was injected with 10 mg of the TCE, and then heated in an
autoclave for 8 hors at 121 ℃ . Progress of the reaction was monitored by
54
headspace analysis using GC-FID after cooling. The headspace was purged with
N2 gas for 5 min to remove oxygen and dichloroethyne, a reaction product,
because dichloroethyne is unstable in oxic atmosphere. The solution was
neutralized with 1 M HNO3 and the eliminated Cl- was recovered as AgCl.
Mass Spectrometry
Isotopic determinations were performed using a Finnigan MAT Model 262
thermal ionization mass spectrometer. The mass spectrometric procedure (see
Chapter 2) was modified from Xiao and Zhang (1992), Magenheim et al. (1994)
and Xiao et al. (1995). Two micrograms of chlorine as CsCl aqueous solution (56.4
mM, 1.0 μL) and ca. 70 μg of graphite powder (purity: 99.999 %; Nilaco) as a
slurry in 80 % ethanol were mixed on a polytetrafluoroethylene sheet. The mixed
slurry was loaded onto the center of a Ta filament (purity: 99.95 %; 0.025 × 1.5
mm, Nilaco) and was dried with a filament current of 1.5 A. The filaments were
placed into the ion source of the mass spectrometer and the analysis began when
the pressure in the ion source was better than 10-5 Pa. The filament current was
first increased to 1.2 A in 10 min, and then increased manually to detect the
Cs235Cl+ ion beam. The intensity of Cs235Cl+ ion current was adjusted to (2 – 3) x
10-13 A by adjusting the filament current, which was typically between 1.35 - 1.43
A. Because mass range of the target ions was high (Cs235Cl+: m/z=301 and
Cs235Cl+: m/z=303), the accelerating voltage was set to 8 kV.
Results and Discussion
Effects of degradation procedures on Cl recovery yield
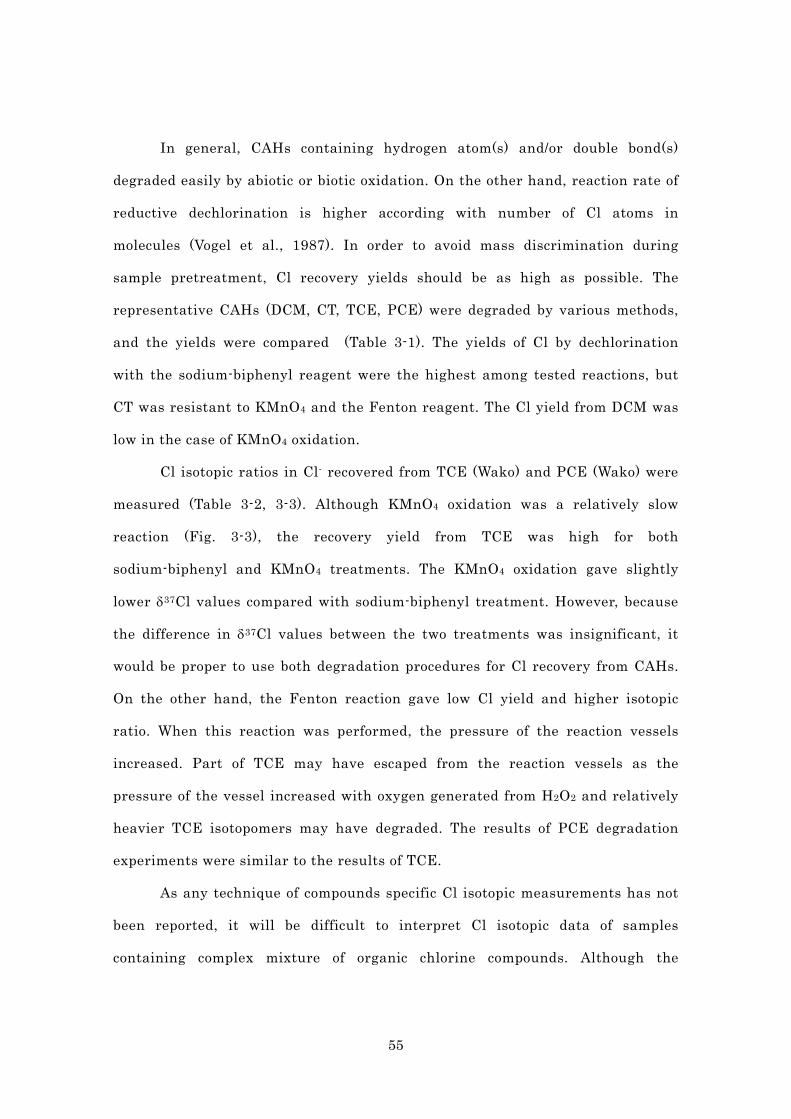
55
In general, CAHs containing hydrogen atom(s) and/or double bond(s)
degraded easily by abiotic or biotic oxidation. On the other hand, reaction rate of
reductive dechlorination is higher according with number of Cl atoms in
molecules (Vogel et al., 1987). In order to avoid mass discrimination during
sample pretreatment, Cl recovery yields should be as high as possible. The
representative CAHs (DCM, CT, TCE, PCE) were degraded by various methods,
and the yields were compared (Table 3-1). The yields of Cl by dechlorination
with the sodium-biphenyl reagent were the highest among tested reactions, but
CT was resistant to KMnO4 and the Fenton reagent. The Cl yield from DCM was
low in the case of KMnO4 oxidation.
Cl isotopic ratios in Cl- recovered from TCE (Wako) and PCE (Wako) were
measured (Table 3-2, 3-3). Although KMnO4 oxidation was a relatively slow
reaction (Fig. 3-3), the recovery yield from TCE was high for both
sodium-biphenyl and KMnO4 treatments. The KMnO4 oxidation gave slightly
lower δ37Cl values compared with sodium-biphenyl treatment. However, because
the difference in δ37Cl values between the two treatments was insignificant, it
would be proper to use both degradation procedures for Cl recovery from CAHs.
On the other hand, the Fenton reaction gave low Cl yield and higher isotopic
ratio. When this reaction was performed, the pressure of the reaction vessels
increased. Part of TCE may have escaped from the reaction vessels as the
pressure of the vessel increased with oxygen generated from H2O2 and relatively
heavier TCE isotopomers may have degraded. The results of PCE degradation
experiments were similar to the results of TCE.
As any technique of compounds specific Cl isotopic measurements has not
been reported, it will be difficult to interpret Cl isotopic data of samples
containing complex mixture of organic chlorine compounds. Although the

56
GC/C/MS is a powerful tool to trace natural or artificial organic compounds by
compound specific δ13C or δ15N fingerprints (e.g. Hunkeler et al., 1999; Hunkeler
and Aravena, 2000a; Bloom et al., 2000), such on-line isotope ratio mass
spectrometry for Cl has never been developed. Separation (e.g. preparative
chromatography) or compound (group) specific degradation (e.g. KMnO4
oxidation) techniques might be used for the purpose.
Effect of solvents on Cl recovery from CAHs
Dehalogenation of chlorinated organic compounds with sodium-biphenyl
reagent has been performed in benzene (Pecherer et al., 1950), toluene (Liggett,
1954) or diethyl ether (Venkateswarlu, 1982). Effects of solvents (n-decane,
toluene, di-isopropyl ether) on Cl recovery yields from CAHs were examined to
obtain high Cl recovery yield (Table 3-4). The yield was the highest in the case of
toluene extraction. The Cl recovery rates from CT and DCM were lower using
di-isopropyl ether. Thus, toluene was used for routine analysis of CAHs.
Comparison of Cl isotopic ratios in CAHs
The sodium biphenyl reagent, known as a reactive reductant, is used for
complete extraction and qualification of organic chlorine in fuels and industrial
waste. Although yield of reductive dechlorination from ca. 1 mg of chlorinated
organic solvents was high (96 to 99 %, average, 98 %), yield of Cl recovery as
CsCl (78 to 97 %, average: 85 %) was lower than the yield of CuO-oxidation
methods used for CH3Cl preparation (Holt et al., 1997; Jendrzejewski et al., 1997).
Since isotopic fractionation during the CsCl preparation procedure from Cl- is
negligible (Table 2-6), low recovery yield at this step would not be a problem
during the analysis. Chloride ion was not detectable by ion chromatography

57
during blank test of the pretreatment procedure. Possible contamination in the
CsCl preparation step was less than 0.05 % of Cl- from organic compounds.
Ten different kind of chlorinated organic solvents (chlorinated methanes,
ethanes and ethenes; 20 lots) obtained from several agents of chemical products
were used for isotopic measurements, and the results are shown in Table 3-5, 3-6.
The variation of isotopic compositions (-5.0 to +2.9‰) is consistent with reported
values, e.g. -6.8 to +2.6 (Tanaka and Rye, 1991), -2.9 to +4.1(van Warmerdam et
al., 1995), -2.9 to +2.1 (Holt et al., 1997), +1.0 to +3.9 (Jendrzejewski et al., 1997).
The chlorinated organic solvents are produced adding of Cl2 or HCl to carbon
from CH4, CH3OH, C2H4, C2H2, C3H8 (Grayson, 1985). Difference in raw materials,
processing of salts and production of Cl2 and HCl gas would cause differences of
δ37Cl in organic compounds (Fig. 2-10).
In addition to the difference in raw materials and intermediates, the
isotope effects on C-Cl covalent bond formation or Cl elimination from carbon
atoms are important. Chlorine kinetic isotope effects (k35 / k37) on nucleophilic
substitution by SN1 and SN2 reaction mechanisms showed that 37Cl is bound more
firmly to the carbon atom than 35Cl (Barthlomew et al., 1954; Turnquist et al.,
1973; Wastaway et al., 1998). Therefore the isotopic fractionation during the
synthesis of chlorinated compounds would have a cumulative effect on isotopic
variations of Cl2 and HCl. Radical reaction, electrophilic addition, β-elimination,
and other reactions of Cl2 or HCl are utilized to manufacture the chlorinated
compounds ranging in temperature from 20 to 650 ℃ (Fig 3-4). The high δ37Cl
value of 1,1-dichloroethene can be explained by faster elimination of H35Cl from
1,1,2-trichloroethane at relatively low reaction temperature (< 100℃). However,
only speculations on the fractionation mechanisms are possible, because the
manufacturers did not open the information about actual manufacturing

58
procedures of each reagent. More information on the manufacturing processes of
the chlorinated organic compounds is necessary to qualify fractionation effects.
CAHs recovery from aqueous solution
In order to determine Cl isotopic ratio of actual groundwater samples, low
concentration CAHs need to be extracted from aqueous solution and the Cl in
CAHs has to be converted to CsCl. The purge-and-trap (Struchio et al., 1998;
Beneteau et al.,1999; Heraty et al., 1999) and solid-phase microextraction
(SPME: Hunkeler and Aravena, 2000a) techniques have been applied successfully
for isotopic analysis of CAHs in aqueous solution. In this study, solvent
extraction and air purging methods were examined.
Difference between Cl isotopic ratios in TCE pure phase and TCE
recovered by toluene extraction were insignificant (Table 3-7). Also TCE (Wako)
and PCE (Wako) were extracted from a medium for bacteria culture (MMY
medium for anaerobic bacteria; see Chapter 4). The δ37Cl value in recovered TCE
and PCE were -1.66±0.22 ‰ (n=3, error: 1σSD) and -2.46±0.08 ‰ (n=4, error:
1σSD) respectively. The differences between Cl isotopic ratios in pure phase and
extracted TCE and PCE were insignificant.
Instead of aqueous solution of CAHs, 1 M NaCl solution was extracted
with toluene and the recovered toluene layer was treated with the
sodium-biphenyl reagent. The reaction product was extracted with water and
HNO3 and then Cl- concentration was measured by ion chromatography to
determine the procedural blank. Because the Cl blank was less than 0.1 μg,
inorganic chloride in sample solution will have negligible effect on the
measurement of Cl isotopic ratios in CAHs of more than 10 microgram.
Detection tubes are known as simple tools for determination of gaseous
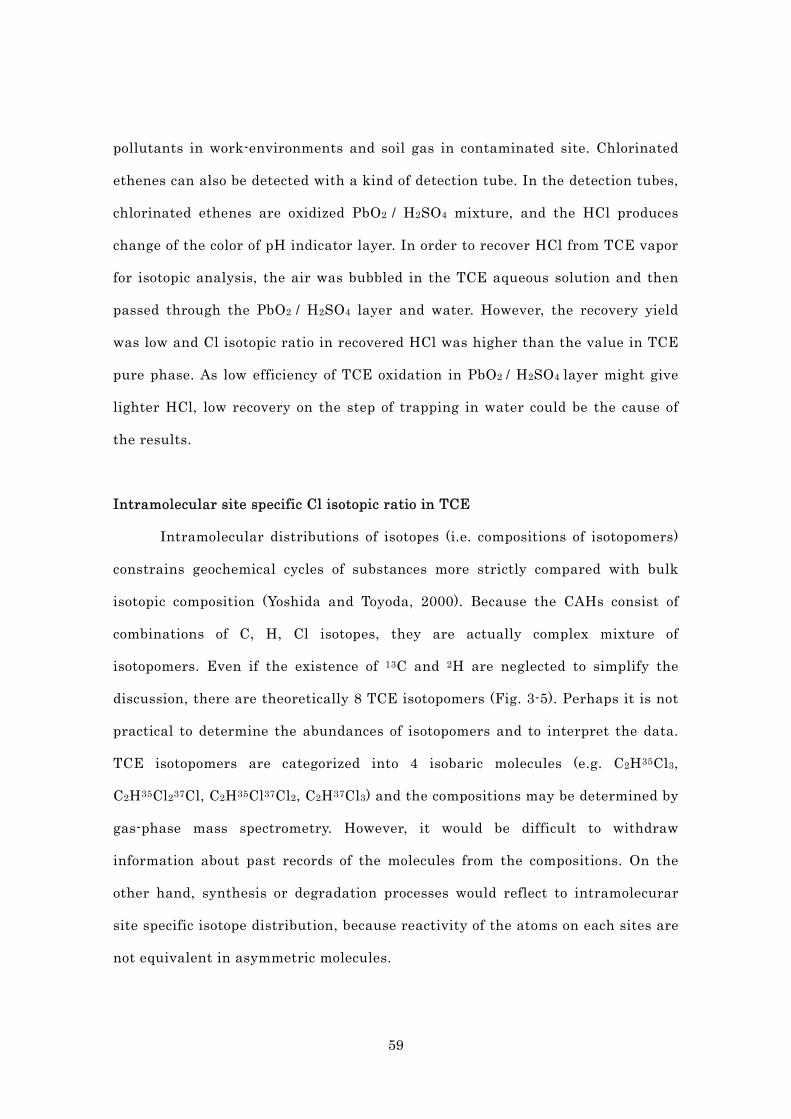
59
pollutants in work-environments and soil gas in contaminated site. Chlorinated
ethenes can also be detected with a kind of detection tube. In the detection tubes,
chlorinated ethenes are oxidized PbO2 / H2SO4 mixture, and the HCl produces
change of the color of pH indicator layer. In order to recover HCl from TCE vapor
for isotopic analysis, the air was bubbled in the TCE aqueous solution and then
passed through the PbO2 / H2SO4 layer and water. However, the recovery yield
was low and Cl isotopic ratio in recovered HCl was higher than the value in TCE
pure phase. As low efficiency of TCE oxidation in PbO2 / H2SO4 layer might give
lighter HCl, low recovery on the step of trapping in water could be the cause of
the results.
Intramolecular site specific Cl isotopic ratio in TCE
Intramolecular distributions of isotopes (i.e. compositions of isotopomers)
constrains geochemical cycles of substances more strictly compared with bulk
isotopic composition (Yoshida and Toyoda, 2000). Because the CAHs consist of
combinations of C, H, Cl isotopes, they are actually complex mixture of
isotopomers. Even if the existence of 13C and 2H are neglected to simplify the
discussion, there are theoretically 8 TCE isotopomers (Fig. 3-5). Perhaps it is not
practical to determine the abundances of isotopomers and to interpret the data.
TCE isotopomers are categorized into 4 isobaric molecules (e.g. C2H35Cl3,
C2H35Cl237Cl, C2H35Cl37Cl2, C2H37Cl3) and the compositions may be determined by
gas-phase mass spectrometry. However, it would be difficult to withdraw
information about past records of the molecules from the compositions. On the
other hand, synthesis or degradation processes would reflect to intramolecurar
site specific isotope distribution, because reactivity of the atoms on each sites are
not equivalent in asymmetric molecules.

60
TCE is the only asymmetric molecule among chlorinated ethenes
containing plural Cl atoms. This means each Cl atoms are distinguishable by
their intramolecular sites. Several anaerobic bacteria cultures (e.g. Yaguchi et al.,
1994; Lee et al., 1997; Numata et al.,1999a,b) mediate reductive dechlorination
(hydrodechlorination) of TCE to cDCE. In this case, only Clc is eliminated by the
reaction (Fig. 3-6). The difference between the initial and final isotopic
composition of the organic Cl (TCE+cDCE), would indicate difference of isotopic
compositions of Clc and Cla+Clb. The compositions were calculated by three
regression curves (Fig. 4-7).
In order to determine δ37Cl value in Clb (and Cla), TCE was treated with
KOH (Otto, 1942). The dehydrochlorination product will be dichloroethyne and
Cl- (Clb), if the reaction mechanism is anti-elimination of H and Cl atoms in the
molecule. Although 47 % of TCE was lost from the reference reaction vessel and
9.1 % of TCE remained in the reaction vessel, 31.8 % of Cl was recovered from
TCE as Cl-. This means that the labile dichloroethyne was degraded and the
recovered Cl- included not only Cla but also Clb and Clc. Assuming that the δ37Cl
value (+2.6±0.3 ‰, n=9, error: 95 % confidential limit) of recovered Cl- is the
isotopic composition of Cla, the δ37Cl value of Clb may be 2.0 ‰. The provisional
results in intramolecular Cl isotope distribution are shown in Fig. 3-6. However
other site-specific and high-yield elimination procedure should be applied to
obtain accurate isotopic ratio in Cla and Clb.
Comparison of mass spectrometric methods
Impurities or degradation products of some chlorinated organic solvent
inhibited the ionization of CsCl without activated charcoal treatment. Also, small
amount of impurity affected ionization of CsCl regent even after activated

61
charcoal treatment. This effect may be more serious for organic compounds than
inorganic compounds (external reproducibility: inorganic Cl, 0.1 to 0.2 ‰; organic
Cl, 0.1 to 0.4 ‰; see Chapter 2). Although the precision of the measurements
(0.12 to 0.43 ‰: external reproducibility, 1σSD) was slightly worse compared to
values obtained by electron impact ionization mass spectrometry of CH3Cl
(0.07 ‰: Holt et al., 1997; 0.04 to 0.32 ‰: Jendrzejewski et al., 1997), vacuum
lines and furnaces are not necessary for the sodium biphenyl degradation
procedure. Also, the mass spectrometry of CsCl requires smaller amounts of
sample as chloride ion, and it is possible that the amount of organic chlorine
sample for the measurements could be reduced further.
Conclusions
Thermal ionization mass spectrometry of Cs2Cl+ was applied for chlorine
isotopic measurements of organic chlorine compounds. The results in this study
are shown in Fig. 3-7, 3-8. The range of δ37Cl in inorganic samples (-2.5 to
+0.9 ‰, Chapter 2) was similar to the range of most Cl in surface and subsurface
water. On the other hand, the range of δ37Cl in organic compounds (-5.0 to
+2.9 ‰) was almost twice as large.
The external reproducibility of the analytical method (0.1 to 0.4 ‰: 1σSD)
was slightly worse than the precision of the CH3Cl mass spectrometry, but it
enough to distinguish Cl isotopic composition of organic chlorine compounds.
Since it was possible to reveal Cl isotopic fractionation in most of the reagents
and natural materials using small amounts of samples for pretreatment without
vacuum line, this analytical procedure could be applied to solve environmental
issues.

62
CAHs in aqueous solution were recovered by solvent extraction and the
mass discrimination during pretreatment processes was negligible. Also
compound specific and intramolecular site specific Cl isotopic ratio measurements
were investigated and preliminary results were obtained. These techniques have
potential to clarify subsurface behavior of CAHs.

63
DCM CT TCE PCEFenton
TCE→Cl- 77% 0.2% 80% 82%Cl-→CsCl 100% - 98% 98%
Total 77% - 79% 80%KMnO4
TCE→Cl- 0% 0% 96% 78%Cl-→CsCl - - 91% 90%
Total - - 87% 70%Na-biphenyl
TCE→Cl- 96% 98% 99% 97%Cl-→CsCl 88% 88% 87% 86%
Total 84% 86% 86% 83%
Table 3-1. Effects of degradation procedures on Cl recovery yields

64
Table 3-2. Comparison of TCE degradation procedures
Degradation Na-Biphenyl KMnO4 FentonRecovery yield
TCE→Cl- 97 - 99% 94 - 98% 80%Cl-→CsCl 82 - 92% 89 - 93% 98%
Total 80 - 91% 84 - 91% 79%
δ37Cl (‰)1) -1.72 ± 0.10 -2.03 ± 0.17 -0.90 ± 0.30(n=5) (n=3) (n=2)
1) Error:1σ (external reproducibility, σ: standard deviation)

65
Table 3-3. Comparison of PCE degradation procedures
Degradation Na-Biphenyl KMnO4 FentonRecovery yield
PCE→Cl- 98% 96% 82%Cl-→CsCl 82 - 98% 88 - 95% 98%
Total 82 - 96% 83 - 92% 80%
δ37Cl (‰)1) -1.97 ± 0.36 -1.63 ± 0.38 -1.1 ± 0.7(n=5) (n=3) (n=2)
1) Error:1σ (external reproducibility, σ: standard deviation)

66
Solvents DCM CT TCE PCEtoluene 96% 98% 99% 97%
n-decane 82% 96% 98% 98%DIPE 88% 89% 97% 99%
DIPE: di-isopropyl ether
Table 3-4. Effect of solvents on Cl recovert yields of CAHs dechlorination with Na-biphenyl reagent

Tabl
e 3-
5.
Chl
orin
e re
cove
ry y
ield
s an
d δ3
7 Cl o
f chl
orin
ated
met
hans
and
eth
anes
CA
Hs
Com
pany
Rec
over
y of
Cl (
%)
δ37Cl
δ37Cl
δ37Cl
δ37Cl
Mea
n δ37
Cl
σ SD
(Abb
revi
atio
n)D
echl
orin
atio
nTo
tal (
as C
sCl)
(‰)
(‰)
(‰)
(‰)
(‰)
(n≧
3)C
H2C
l 2N
acal
ai98
84-9
0+0
.49
+0.5
-
(DC
M)
± 0.
14N
acal
ai97
75-9
2+0
.64
+0.6
-
± 0.
26W
ako
9580
-88
-0.2
6-0
.3-
± 0.
17C
HC
l 3N
acal
ai98
80-9
3-2
.83
-2.9
2-2
.92
-2.9
0.05
(CF)
± 0.
25±
0.18
± 0.
39C
HC
l 4N
acal
ai10
387
-97
-2.3
9-2
.4-
(CT)
± 0.
27N
acal
ai98
91-4
.33
-4.3
-
± 0.
12N
acal
ai99
83-9
5-0
.23
-0.2
0-0
.79
-0.1
1-3
.30.
31±
0.16
± 0.
19±
0.35
± 0.
20C
H2C
l-CH
2Cl
Nac
alai
9989
-96
-1.1
1-1
.1-
(DC
A)
± 0.
26C
Cl 3-
CH
3N
acal
ai99
89-2
.83
-3.0
8-3
.0-
(MC
)±
0.25
± 0.
23W
ako
9673
-91
-4.8
9-4
.95
-5.2
0-5
.00.
16±
0.33
± 0.
25±
0.30
Inte
rnal
erro
r of δ
37C
l: 2σ
m (σ
m: s
tand
ard
erro
r)

Tabl
e 3-
6. C
hlor
ine
reco
very
yie
lds
and
δ37 C
l of c
hlor
inat
ed e
then
s
CA
Hs
Com
pany
R
ecov
ery
of C
l (%
)δ3
7C
lδ3
7C
lδ3
7C
lδ3
7C
lδ3
7C
lM
ean
δ37C
σS
D
(Abb
revi
atio
n)D
echl
orin
atio
nTo
tal (
as C
sCl)
(‰)
(‰)
(‰)
(‰)
(‰)
(‰)
(n≧
3)
CC
l 2=C
H2
GL
9884
-86
+2.9
3+3
.20
+2.4
1+2
.90.
40
(1,1
-DC
E)
± 0.
15±
0.29
± 0.
25C
HC
l=C
HC
l G
L10
084
+0.0
8+0
.1-
(cD
CE
)±
0.20
CH
Cl=
CH
Cl
GL
9386
-0.1
4-0
.1-
(tDC
E)
± 0.
23C
Cl 2=
CH
Cl
Nac
alai
9781
-87
-0.3
6-0
.54
-0.5
-
(TC
E)
± 0.
21±
0.27
Wak
o97
-99
85-9
1-1
.76
-1.8
0-1
.55
-1.7
2-1
.79
-1.7
0.10
± 0.
16±
0.18
± 0.
23±
0.23
± 0.
27W
ako
9886
+0.0
5+0
.1-
± 0.
21C
Cl 2=
CC
l 2N
acal
ai98
75-1
.33
-1.3
-
(PC
E)
± 0.
20N
acal
ai98
80-8
7-2
.08
-2.1
-
± 0.
18W
ako
9782
-96
-1.7
4-1
.50
-1.9
6-2
.35
-2.2
9-2
.00.
36±
0.17
± 0.
19±
0.30
± 0.
27±
0.27
Mer
ck99
85-0
.67
-1.0
4-0
.9-
± 0.
30±
0.26
In
tern
al e
rror o
f δ37
Cl:
2σm
(σm
: sta
ndar
d er
ror)

69
Table 3-7. Comparison of TCE recovery procedures
TCE 1.5mg TCE extracted from aqueous solution (15mg/L)
Extraction - with Toluene Purge with airDegradation Na-Biphenyl Na-Biphenyl PbO2/H2SO4
Recovery yieldExtraction - 88~95%1) 98%2)
TCE→Cl- 97~99% (98%) 33%Cl-→CsCl 82~92% 89~93% 92%
Total 80~91% 80~83% 30%
δ37Cl (‰)3) -1.79 ± 0.12 -1.84 ± 0.30 -0.26 ± 0.19(n=3) (n=3) (n=3)
1) Assuming recovery rate of TCE dechlorination is 98%2) Calculated from residual TCE concentration after purging3) Error:1σ (external reproducibility, σ: standard deviation)

70
Fig. 3-1. Processes of CAHs in the subsurface environment. Source: From Diffusion in Natural Porous Media, Peter Grathwohl, Kluwer Academic Publishers, Boston

Chlorinated organic compounds (ca.1mg-CI)
Dissolved in 2.0ml of toluene ( under N2 )
+- 1M Na-biphenyl (O.2mI)
30min (room temp.)
_____1 +- H20 (O.5mI)
Ilower layer
(O.5mI)
upper layer
~HNO'
upper layer lowerlayer--------------->,
~(l.oml)
upper layer lower layer ----------------~>:;.
toluene (2mI) ~
lower layer upper layer
n-heXane(2m~
lower layer upper layer
n-hexane(2m~
lower layer upper layer
I( CI- )
Fig. 3-2. Procedures of reductive dechlorination of chlorination organic compounds with
sodium-biphenyl reagent.
71

72
-10
0
10
20
30
40
50
60
70
0 2 4 6 8 10
Time (hr)
Con
cent
ratio
n (m
g / b
ottle
)
TCEPCE
Figure 3-3. Concentrations of chloroethenes (PCE, TCE) in sample bottles over time during the course of KMnO4-oxidation experiments.

Fig.
3-4
. Man
ufac
turi
ng p
roce
sses
of C
AH
s fr
om E
ncyc
lope
dia
of C
hem
ical
Tec
hnol
ogy
(Joh
n W
eile
y &
Son
s)
etc.

Clc H\ /C=C
/ \Clb Cia
Cia--->~ Clb ~> 37Cl / 35CI
ClcBulk isotopic composition
37CI / 35CI
~Clc H
\ /C=C
/ \Clb Cia
C2H37CI3
C2H37CI235CI
C2H37CI35Cb
C2H35Cb
Isobaric molecules
Intramolecular site specific
isotopic compositions
Isotopomers
Fig. 3-5. Concepts of CI isotope distribution in TCE molecule
74

-Cl b?537CI = - 2.6+0.3~?
TCE
Clc H
'" /C===C
/ ""Clb Cia
537CI = -1.7+0.5~
cDCE
H H+2[H] '" /
---~> C===C
-Clc• / ""Clb Cia
537CI = - 2.3 + 0.3 %'0
Clc-C=C-Cla
537Cia = - 2.0~?
Fig. 3-6. Intramolecular distribution of Cl isotopes within the TCE
molecule (Wako, reagent grade).
75
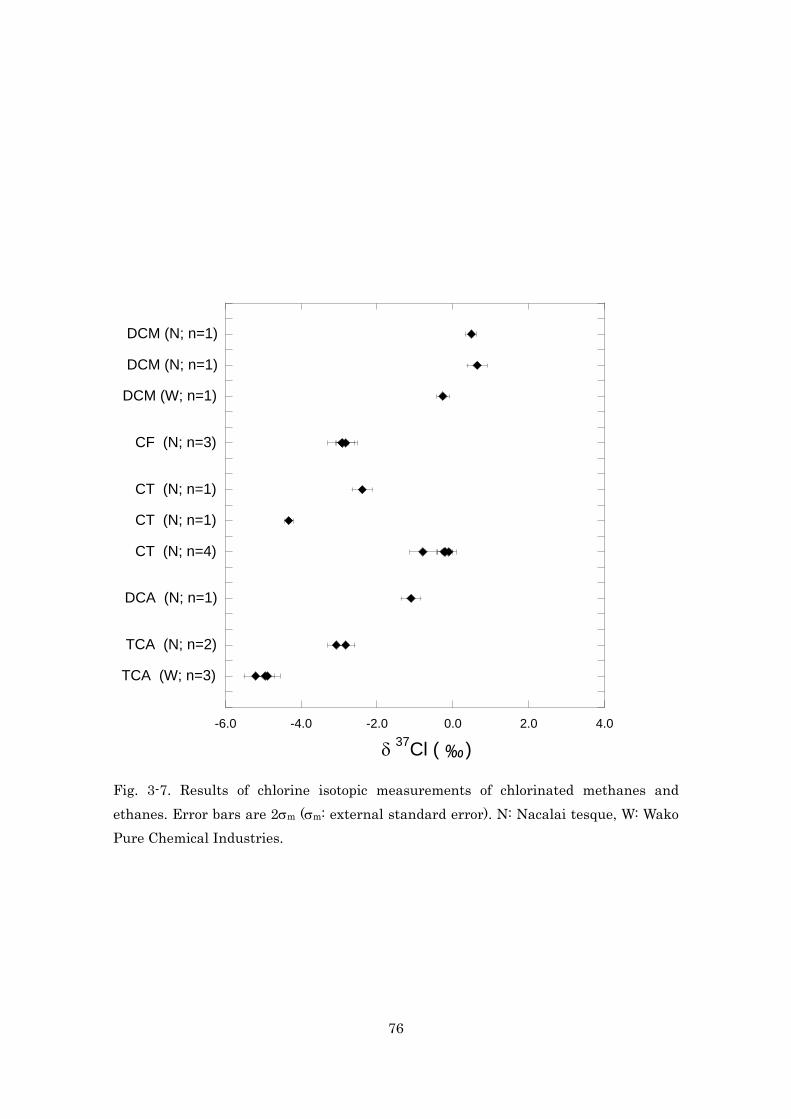
76
-6.0 -4.0 -2.0 0.0 2.0 4.0
DCM (N; n=1)
DCM (N; n=1)
DCM (W; n=1)
CF (N; n=3)
CT (N; n=1)
CT (N; n=1)
CT (N; n=4)
DCA (N; n=1)
TCA (N; n=2)
TCA (W; n=3)
δ 37Cl ( )‰
Fig. 3-7. Results of chlorine isotopic measurements of chlorinated methanes and ethanes. Error bars are 2σm (σm: external standard error). N: Nacalai tesque, W: Wako Pure Chemical Industries.

77
Fig. 3-8. Results of chlorine isotopic measurements of chlorinated ethenes. Error bars are 2σm (σm: external standard error). G: GL Sciences, N: Nacalai tesque, W: Wako Pure Chemical Industries, M: Merck.
-6.0 -4.0 -2.0 0.0 2.0 4.0
1,1DCE (G; n=3)
cDCE (G; n=1)
tDCE (G; n=1)
TCE (N; n=2)
TCE (W; n=5)
TCE (W; n=1)
PCE (N; n=1)
PCE (N; n=1)
PCE (W; n=5)
PCE (M; n=2)
δ 37Cl ( )‰

4_ Isotope fractionation during reductive dechlorination of chlorinated
ethenes
Introduction
Chlorinated aliphatic hydrocarbons (CARs) have been widely utilized as
solvent and degreasing agents for many years. Once they enter subsurface
environment, they migrate as soil gas and aqueous solution in aquifer with
supplying from the dense non-aqueous phase liquids (DNAPL, free product, pure
phase) and absorbed phase on soil particles. Coexistence of such mobile and less
mobile phases of CARs causes wide and durable pollution of surface soils,
unsaturated zones and aquifers (Fig. 3-l). Although, CARs are degraded by
abiotic or biotic reactions (e.g. oxidation, hydrolysis, dehydrohalogenation,
substitution Vogel et al., 1987; Fetzner, 1998), the reaction rates are usually low
in natural systems. Because number of sampling points and frequency of
monitoring are limited, investigation of the pollution source and behavior of
CARs in subsurface is difficult.
Isotope analysis is valuable tool to investigate not only to investigate the
inorganic pollutants (e.g. Nakai et al., 1991; Sturges and Barrie, 1989; Johnson
et al., 2000) but also organic ones. Carbon isotope analysis of hydrocarbons has
been successfully used for such purposes (e.g. Conrad et al., 1997). Significant
progress in this field was made by development of gas chromatograph
/combustion/isotope ratio mass spectrometry (GC/C/MS), rapid, sensitive and
compound-specific technique (e.g. Dempster et al., 1997). As isotope analysis also
has potential for research of organic chlorine compounds, several analytical
techniques for isotopes in CARs have been developed Tanaka and Rye, 1991; van
Warmerdam et al., 1995; Holt et al., 1997; Jendzejewski et al., 1997; Slater et al.,
1999; Hunkeler and Aravera, 2000a). The quantitative information about
78

isotope fractionation would be necessary to (1) judge feasibility of using isotopes
to trace the sources of pollutant, (2) evaluate effectiveness of in-situ cleanup
techniques and (3) investigate mechanisms of subsurface processes.
Tanaka and Rye (1991) reported relatively large CI isotope variations in
CAHs, these authors suggested CI isotope can be used to quantify the flux of
stratospheric chlorine derived from man-made chlorinated compounds. In
addition, isotopic compositions of chlorinated solvents (Beneteau et al., 1999) and
PCBs (Jarman et al., 1998; Reddy et al., 2000) were measured to distinguish
contaminants from different manufacturers and to trace them in the environment.
Although, isotopes are regarded as idealist ic tracer of elements or compounds,
sometimes isotopes of CI- are not regarded as conservative tracer in aquatic
system because they would be discriminated during migration by interaction with
solid phases (Desaulniers et al., 1986; Pillips and Bentley, 1987). In order to use
unique isotopic compositions of pollutants to fingerprint their source, magnitude
of isotopic fractionation during migration should be known quantitatively.
In"situ cleanup techniques (e.g. bioremediation, natural attenuation,
permeable reactive barrier) would be cost effective and suitable for contaminated
plume widely spread (Fig. 4-1). However, practical uses of these techniquei> are
limited by difficulty of proving their effectiveness, because the contribution of
both biotic or abiotic degradation from contribution of other physical processes
(e.g. dilution, migration) by chemical analysis of samples obtained from limited
number of boring cores or monitoring wells. Carbon isotope analysis has
successfully been utilized to investigate contribution of biotic degradation of
hydrocarbons to inorganic carbon in contaminated soil (e.g. Suchomel et al., 1990;
Conrad et al., 1997). Compared with petroleum hydrocarbons, relatively few
measurements of isotope fractionation during reactions of CAHs have been made.
Because trajectories of C and CI isotope composition of residual dichloromethane
79

are different in the case of evaporation and aerobic biodegradation (Heraty et al.,
1999; Huang et al., 1999), it was suggested that isotopic change could be used to
distinguish contribution of biodegradation from evaporation in bioremediation
processes. In order to interpret the actual isotopic changes in CAHs contaminated
aquifer (Sturchio et al., 1998; Hunkeler et al., 1999), morejnformation on isotope
fractionation is necessary (e.g. anaerobic degradation: Hunkeler et al., 1999;
Bloom et al., 2000; Sherwood Lollar et al., 1999, aerobic biodegradation: Heraty
et al., 1999; Hunkeler and Aravera, 2000b, abiotic degradation: Dayan et al.,
1999, evaporation: Slater et al., 1999; Huang et al., 1999, absorption,
solubilization) .
In general, it is difficult to investigate pathway and mechanism of
subsurface processes because soil is complex chemical and biological system.
Changes in 'isotope ratios have been successfully exploited to investigate
metabolism processes of compounds containing C (Sugimoto and Wada, 1993), N
(Mariotti et al., 1988), 0 (Aggarwal et al., 1997) and S (Kemp and Thode, 1968).
Studies of isotopes in CAHs would be a useful tool to investigate mechanisms of
reactions mediated by complex consortium or non'culturable microorganisms.
Chlorinated ethenes are representative CARs. In paticuller,
trichloroethene (TCE) and tetrachloroethene (PCE) are among the most serious
groundwater contaminants (Kawasaki, 1985; Fisher et al., 1987). Reductive
dechlorination (hydrogenolysis) of chlorinated ethenes mediated by abiotic
(Liggett, 1954; Gantzer and Wackett, 1991) and biotic (Holliger et al., 1993;
Maym6-Gatell et al., 1997) systems plays important roles for wastewater
treatment (de Bruin et al., 1992; Numata et al., 1999a,b), remediation and
natural attenuation of contaminated aquifers and soils (Holliger, 1995; Bloom et
al., 2000; Gillham and O'Hannesin, 1994) (Fig. 4-2).
In this study, the degree of CI isotope fractionation during biotic
80

dechlorination of TCE or PCE to cis-1,2-dichloroethene (cDCE) has been
investigated in laboratory experiments. Mathematical models for the change of
isotopic ratios were developed and we attempted to determine isotope
fractionation factors for each dechlorination step. And also isotope effect in
abiotic dechlorination of PCE mediated with a transition-metal coenzyme
cyanocobalamin (vitamin Bd was examined as a model of electron transport
enzymes.
Experimental Procedures
Presentation of isotopic data
The isotopic compositions of chlorine are represented in per mil (~)
deviation from those of the standard mean ocean chloride (SMOC: Long et al.,
1993), and a reagent grade CsCl from Nacalai tesque was utilized as a routine
laboratory standard of CI isotopic composition during the course of this study
(Numata et al., in press; see Chapter 2).
37 CIR=
35 CI(3-1)
One or two standards were typically loaded into the mass spectrometer together
with the samples, and 0 values of samples were calculated from the following
equation.
[
R (1 + 10-3 8 )]8 37Cl = 1- sample CsCI xl 000RCsCI
81

where tSCsCl: ·2.49 (per mil deviation of isotopic ratios between the CsCI reagent
and seawater, which was calculated from more than 25 isotopic measurements;
Chapter 2), R : average of standard CsCI isotopic ratios in the period of sample
analysis.
Microorganisms
The strain '1' (a sulfate-reducing bacterium belongs a novel genus, isolated
from a drainage of a laundry, (Yaguchi et aI., 1991; Yaguchi et aI., 1994),
consortium N (an enrichment culture N-YE obtained from TCE contaminated soil,
Numata et aI., 1999a) and consortium F (an enrichment culture obtained from
PCE contaminated soil, Lee et aI., 1997) were used for biological dechlorination of
PCE and TCE. The cultures dechlorinated PCE and TCE to cis-1,2'dichloroethene
(cDCE).
The cultures were sustained in 120'mL serum bottles with 50 mL of liquid
media containing 10 mg/L of PCE under N2 atmosphere. The MMY medium
(K2HP04 7 g, KH2P04 2 g, MgS04· 7H20 0.1 g, (NH4hS04 1 g, Yeast Extract 2 g,
trisodium citrate 0.5 g in distilled water 1 L, pH 7.2; Yaguchi et aI., 1991) was
used for cultivation of consortium F. For cultivation of strain '1', 0.3 gIL of
L'cysteine hydrochloride was added to the medium. For cultivation of consortium
N, trisodium citrate was omitted from the medium.
Samples and reagents
Water used for this work was purified using a Milli·RX12Plus and a
Milli-Q SP systems (Millipore). A commercial grade CsCI (minimum assay 99 %;
Nacalai tesque) was used for laboratory reference standard (Numata et aI., in
press; see Chapter 2). Activated charcoal (GX-60: GL Sciences) was washed with
water before use in order to remove chloride ion.
82

TCE (minimum assay 99.5 %; Wako Pure Chemical Industries) and PCE
(minimum assay 99 %; Wako Pure Chemical Industries) were used for
dechlorination experiments. The 837CI values of the TCE and PCE were -1.72±
0.10 %'0 and -1.97±0.36 %'0 (n=5, error: lcrsD) respectively (see Chapter 2). Other
chemicals were analytical or reagent grades.
Chemical analysis
Concentrations of chlorinated ethenes in liquid media were determined by
headspace gas analysis using a Shimadzu GC-9A gas chromatograph equipped
with a Shimadzu CBPI Hi-Cap .column (0.2 mm x 25 m, film thickness 0.25 ~m)
and a flame-ionization detector. The 50 ~L of headspace gas was sampled with a
gastight syringe through rubber septum and was injected into the GC-FID system
and analyzed in isothermal mode (column temperature: 40°C). As internal
standard, 50 ~mol of toluene dissolved in methanol was added to each reaction
vessels. Molar fractions of chlorinated ethenes were the mole amount of each
compound normalized with initial PCE or TCE mole amount. As ethene, ethane
and methane were not separated with the column, the corresponding
chromatogram peaks were simply regarded as ethene (ETE). Also separation of
ethene and vinyl chloride (VC) was incomplete and quantification of VC might
not be so accurate.
Chloride concentrations were measured using a Hitachi ion chromatograph
L-7000 with Hitachi 2740 analytical column.
Dechlorination of chlorinated ethenes with microoraganisms
The biotic dechlorination experiments were performed in 68-mL serum
bottles with 25 mL of liquid media for consortium F and N. Because strain T
could not degrade high concentration of peE, the experiments for strain T were
83

performed in 120-mL serum bottles with 50 mL of liquid media. Several bottles
with the media (23.S mL for consortium F or N, 47.5 mL for strain T) were
sterilized with autoclave (121 °e, 15 min). After cooling, the media were purged
with N2 gas for 5 min to remove oxygen in media and headspace gas, and 1.2 mL
(consortium F or N) or 2.5 mL (strain T) of subcultures were inoculated in the
bottles. N2 purge was continued for 5min to remove chlorinated ethenes dissolved
in subculture, and then the bottles were sealed with polytetrafluoroethylene lined
rubber septa and aluminum cups. The cultures were injected with 10 ilL of PCE
or TCE stock solution (in methanol) containing 10 Ilmol of PCE or TCE, and then
incubated at 30 °e. Progress of the reaction was monitored by headspace analysis
by GC-FID. Toluene (3 mL) was added through the septa in order to stop the
reaction. The bottle. was then shaken vigorously to extract chlorinated ethenes
from medium and headspace. More than 7 bottles were prepared for a series of
experiment, and one of which was sacrificed for extraction at each reaction stage.
After moving the toluene layer containing chlorinated ethenes to another test
tube, 2mL of toluene was added to the bottle and chlorinated ethenes were
extracted repeatedly. The procedures were shown in Fig. 4-3.
Anaerobic chloroethene dechlorination mediated with cyanocobalamin
The procedure was modified method of Gantzer and Wackett (1991). The
chemical dechlorination experiments were performed in 6S-mL serum bottles
with 25 mL of Tris·HCI buffer (1 M, pHS.2) containing 0.75 Ilmol of
cyanocobalamin and 0.75 mmol of trisodium citrate. After purging the bottle with
N2 gas to remove oxygen in media and headspace gas, the bottles were sealed
with polytetrafluoroethene lined rubber septa and aluminum cups. The solution
were injected 10 ilL of PCE stock solution (in methanol) containing 10 IlIDol of
PCE, and then incubated at 30 °e. Partition of PCE between the solution and the
84
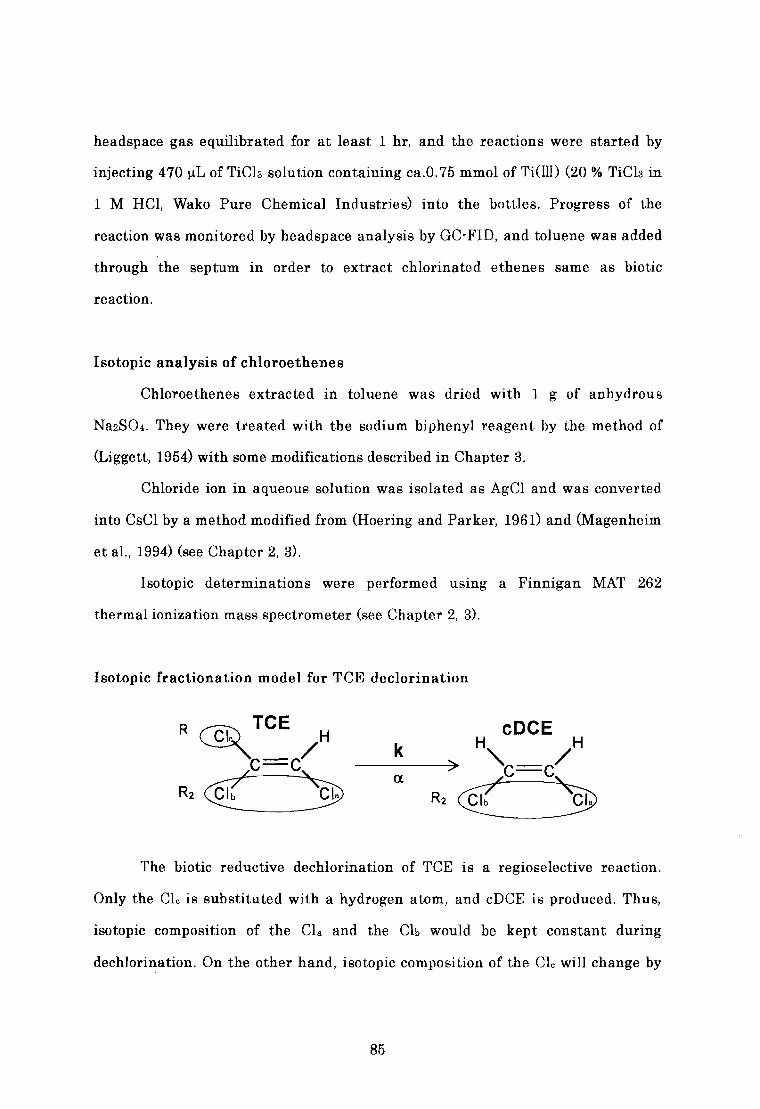
headspace gas equilibrated for at least 1 hr, and the reactions were started by
injecting 470 ~L of TiCb solution containing ca.0.75 mmol of 'l'i(III) (20 % TiCb in
1 M HCI, Wako Pure Chemical Industries) into the bottles. Progress of the
reaction was monitored by headspace analysis by GC-FID, and toluene was added
through the septum in order to extract chlorinated ethenes same as biotic
reaction.
Isotopic analysis of chloroethenes
Chloroethenes extracted in toluene was dried with 1 g of anhydrous
Na2S04. They were treated with the sodium biphenyl reagent by the method of
(Liggett, 1954) with some modifications described in Chapter 3.
Chloride ion in aqueous solution was isolated as AgCI and was converted
into CsCl by a method modified from (Hoering and Parker, 1961) and (Magenheim
et al., 1994) (see Chapter 2, 3).
Isotopic determinations were performed using a Finnigan MAT 262
thermal ionization mass spectrometer (see Chapter 2, 3).
Isotopic fractionation model for TCE declorination
R cCkJ TCE~ /H
C=C
R2~ ~
eDCEk H H
---~> 'C=C/
a R2~ ~
The biotic reductive dechlorination of TCE is a regioselective reaction.
Only the Clc is substituted with a hydrogen atom, and cDCE is produced. Thus,
isotopic composition of the CIa and the Ch would be kept constant during
dechlorination. On the other hand, isotopic composition of the Clc will change by
85

mass discrimination. The isotope ratio in organic-chlorine (TCE + cDCE) is
represented as a binary mixing relationship between R2 (isotope ratio in CIa +
Clb) and R (isotope ratio in Clc):
R - N cR(1+R2 ) +(1-NJR2 (1 +R)t - N c (1+R
2)+(1-NJ(1+R)
Rt : CI isotopic ratio of organic-CI (TCE+cDCE), Ne: molar fraction of Clc
When the change of isotope ratio is small enough, it means that ratio of (1+R2)
and (l+R) approach unity. Thus eq 4-3 reduced to
Using molar fraction ofTCE remaining (fr), Nc becomes
N = ITc IT +2
(4-4)
(4-5)
If the isotopic fractionation of Clc by dechlorination follows the Rayleigh
equation,
R - R I' (a-I)- IJT
where Rl is the initial isotope ratio of Clc and a is the fractionation factor.
Substituting eq 4-5 and eq 4-6 into eq 4-4 gives,
~ =RJra+2~
IT +2
Isotopic fractionation model for peE declorination
86
(4-7)
eCCEH H
k2 > 'c=c/<X.2 c,/ 'CI

Dechlorination of PCE to cDCE will be regarded as a sequential first-order
reaction (Ninomiya and Sakai, 1993). Theoretically, time course of chloroethenes
concentrations change on time represented as follows (fp,fT,fD: fraction of PCE,
TCE, cDCE):
(4-8)
(4-10)
During the first step of the PCE dechlorination to TCE, one-fourth of CI
atom may be eliminated randomly. If the second dechlorination step does not
occur and isotope fractionation follows the Rayleigh equation, isotope ratio
change of CI in PCE and TCE will be represented as follows:
RpTD (fp) =Ro{(3 + fp)/4}Ca 1-l)
where aJ is isotope fractionation factor for the first dechlorination step.
(4-11)
During the second dechlorination step, Clc in TCE molecule would be
eliminated and CIa and Ch would remain in cDCE molecule. Namely, total isotope
composition of CIa + Ch in TCE molecule; and Cl in PCE and cDCE molecules will
change as eq 4-11. Meanwhile, isotopes of Clc in TCE might be fractionated more.
The fractionation model of Clc was calculated as follows.
The material balance of 37CI in the system is derived as eq 4-12 (left hand
side is quantity of 37CI in Clc at time=t, right hand side is distribution of 37CI at
time=t+.6.t).
(4-12)
where f refers to the fraction of CI; X37 is the molar fraction of 37CI [37CI I
(35CI+37CI)]; subscript letters T, e and i represent TCE (Clc), efflux and influx
respectively.
Since the PCE dechlorination is a sequential first-order reaction, the
87

amount of influx to TCE in ~t would be equal to degradation of PCE in L\t. Also,
the ratio of the first reaction rate and second reaction rate (~fe I /1fi) would be k2h
/ kJip. If new parameters F (=l-!p) and b (=k2lkl) are introduced, the Mi and ~fe
would be represented as follows:
(4-13)
The molar fraction of 37Cl can be written as follows using isotopic ratio Rc and
isotopic fractionation factor of the second reaction <x'2.
(4-14)
Substituting eqs 4-13 and 4-14 into eq 4-12 gives
(4-15)
If ~t is an infinitely short time,
M' ~ dF, A.(Rc /(1 +RJ)~ d(Rc /(1 +RJ), M' . A.(Rc /(1 +RJ) ~ 0
Thus,
From eq 4-8, eq 4-9 and eq 4-11, hand X37i are represented as function of F.
~b - f. (1- Ft - (1- F)IT = ; _b P = 1- b
x _ RPTD
_ Ro{(4-F)/4ya,-I)
37; - 1+ RpTD
- 1+Ra {(4 _ F)/4ya l -l)
88
(4-16)
(4-17)
(4-18)

Eq 4-16 becomes a differential equation by substitution with eq 4-17 and eq 4-18:
dRe =( Ro{(4-F)/4}(a1-l) _l-b(l-FYb-l) .~+I-(l-FYb-I). a 2Re I
dF 1+Ro{(4-F)/4}<a1-l) I-b l+Re I-b 1+a2Re )
(I-b J(1 R)2
(1- F)b - (1- F) + e(4-19)
The equation was solved numerically using a commercially available software
MATLAB (Math Works) with the initial condition RcCO.001)=Ro, because
denominator of the right hand side becomes 0 when F equals to O.
The change of isotope ratio in total organic-Cl was then calculated as
binary mixing equation. If the reaction started from one mole of PCE, the sum of
Cl atomic abundance in the molecule PCE and cDCE; CIa and Clb in TCE is
represented as follows:
(4-20)
Substituting eq 4-5 into eq 4-20 gives
The atomic abundance of Clc is,
n.( I" ) =f = I: - IpeJp T l-b
(4-21)
(4 -22)
The binary mixing equation with Clc and other Cl isotopic composition is similar
to eq 4-3.
R (J:) =nPTD (Ip)' RpTD (fp)' (1 + Re (fp» + ncCfp)' Re (Ip)' (1 + RPTD (Ip» (4-23)10101 P nPTD (Ip)' (1 +Re (Ip» + ne (fp)' (1 +RPTD (fp»
Change of organic CI isotopic ratio (Rtota}) was calculated by substituting eq 4-11,
eq 4-21, eq 4-22 and numerical solution of eq 4-19 into eq 4-23.
89

Results
Biotic reductive dechlorination of TCE and PCE
Fig.4-4 shows time courses of reductive TCE dechlorination with 3 kinds of
the anaerobes. Although, these results may be the first-order reactions on the
concentrations of TCE, lag phase of bacteria growth gave sigmoid curves of
chlorinated ethenes concentration instead of logarithmic curves. In the case of
PCE dechlorination, features of the curves correspond to the theoretical
sequential first-order reaction (eqs 4-3,4-4,4-5) except existence of lag phase
(Fig.4-5). The peaks of 1,1-DCE were also detected on the chromatograms, but its
amounts were negligible against cDCE (strain T, 0.1 - 0.2 %; consortium Nand
consortium F, 0.1 % or less). Therefore, the simultaneous reaction of TCE
dechlorination will not affect the discussions below. Rate constants of
dechlorination calculated from regressions of late reaction stage are shown in
Table 4-1.
Isotope fractionation associated with TCE dechlorination
The covalent bonds formed by the lighter isotopes are usually weaker than
bonds formed by heavier isotopes. Due to preferential elimination of 35CI from
C-CI bonds, the residual CI in precursors becomes enriched in 37Cl. However in
the case of TCE dechlorination to eDCE, only part of Cl isotope in the molecule is
fractionated. Consequently, change of bulk isotopic ratio will be relatively small.
The mathematical model of Cl isotopic shift (eq 4-7) plotted against
fraction of TCE remaining is shown in Fig. 4-6. The initial isotopic composition is
given by weighted mean of isotopic compositions of Clc and CIa + Ch, and final
isotopic composition is equal to composition of CIa + Ch. The smaller isotope
fractionation factor G.e. the larger isotope effect) gives the larger curvature of
90

trajectories.
The Rayleigh equation (eq 4-6) is an approximation when the abundance of
minor isotope is much smaller than unity. The equation must be modified as eq
4-24 for cases where the concentration of minor isotope is substantial such as 37CI
(Criss, 1999).
R(1 +R)(a-l) =R1{(1 +R
1)!r r.<l) (4-24)
As differences between the calculated values of Rt calculated from eq 4-3 and eq
4-24 and the values calculated from eq 4-7 were less than 0.01 %'0, it will be
unnecessary to use eq 4-24 for interpretation of the data.
The results of isotopic measurements during biotic TCE dechlorination by
3 kinds of anaerobic bacteria culture are shown in Fig. 4-7. The changes of
isotopic composition during biotic dechlorination were small but the trend of
depletion in 37CI at the later stage of dechlorination was observed in all cases.
The difference of the isotopic ratio trajectories was not significant because of
relatively large error on isotopic analysis. The regressions through the data
shown in Fig. 4-7 yield best fit isotope fractionation factors (a) of 0.9943 to
0.9945 for 3 bacterial cultures utilizing the eq 4-7.
Isotope fractionation associated with PCE dechlorination
The mathematical model for CI isotopic change (eq 4-23) plotted against
the fraction of PCE remaining is shown in Fig. 4-8 and Fig. 4-9. The isotopic shift
is controlled by fractionation factors al and a2 (Fig. 4-8); and ratio of rate
constant of the reactions, k2/kl (Fig. 4-9). Same al values give same isotopic ratio
at the end of the reaction. The effect of the a2 value on the trajectories is small,
but it shifts the curves upward as the a2 value decreases. Clearly shift of
trajectories from simple Rayleigh fractionation curve (eq 4-11) depends on
fraction of the TCE (i.e. k2/kl ratio).
91

From the numerical solution of eq 4-19, the isotopic ratio of Clc increases
as the Fvalue increases, and then reach to plateau. The higher k2/kl ratio gives
the wider interval of plateau and the smaller 0.2 gave higher CI isotopic ratio at
the end. Also, higher k2/kl ratio gives higher TCE fraction. The shifts of the
theoretical curves from simple Rayleigh model curves (0.2=1) can be explained by
these effects (Fig. 4-10).
Compared with TCE dechlorination, changes in CI isotopic compositions
were larger. The general trends toward enriched 837CI values with degradation of
PCE were consistent with the theoretical models (dotted curves in Fig. 4-10), and
shifts from the simple Rayleigh model were slightly larger when the k2/kl ratio
was smaller. The isotope fractionation factors for PCE dechlorination to TCE
were 0.991 (strain T), 0.990 (consortium N) and 0.987 (consortium F) at a rough
estimate from 837CI values at initial and final reaction stage. The order of isotope
effects coincided with order of rate constants for dechlorination, but the causality
is unclear. The precision of CI isotopic measurements was not high enough to
determine values of 0.2.
Abiotic reductive dechlorination of PCE mediated with cyanocobalamin
In this work, the reaction ingredient was slightly different from conditions
of Gantzer and Wackett (1991). We used the mixture of titanium (III) chloride and
sodium citrate and N2 gas instead of titanium(III) citrate and Ar gas used in the
original report. FigA-11 shows time course of PCE dechlorination mediated with
cyanocobalamin. Features of the reaction were different from biotic ones in some
respects. One of important diffecences was fast ethene generation. The molar
fraction of ethene was represented in Fig. 4-11 as 'ETE' but it is possible that the
quantities of 'ETE' include ethane and Cl-compounds. The ethene accumulated
faster than isomers of dichloroethenes (DCEs) and VC. The other difference was
92

the lower regiospecificity during the TCE dechlorination to DCEs. Two isomers of
dichloroethenes, trans-l,2-dichloroethene (tDCE) and 1,I-dichloroethene
(1,1- DCE) accounted for 10 % and 7 % respectively of DCEs. These rates were
higher some extent but consistent with the results of previous paper (Gantzer
and Wackett, 1991). Despite of the complex change in composition of chlorinated
ethenes, the trend of isotope composition in organic-Cl during dechlorination was
similar to the change during biotic reactions (Fig 4-12).
Discussion
Highly chlorinated organic compounds are usually nonbiodegradable by
aerobes. And supply of electron acceptors, especially molecular oxygen is limiting
factor of in" situ biodegradation of organic pollutants in subsurface environments.
However, microbial communities and isolates that can reductively dechlorinate
high concentration of chlorinated organic compounds under anaerobic conditions
(Fetzner, 1998), have potential for bioaugmentation and natural attenuation.
PCE and TCE are the most ubiquitous contaminants in aquifers and soils.
Numbers of enriched culture of anaerobic bacteria that can dechlorinate PCE and
TCE have been reported, and there are on going research on isolated
microorganism (e.g. Yaguchi et al., 1994; Maymo-Gatell et al., 1997) and
molecular biological studies of dechlorination enzyme system (Neumann et al,
1996; Schumacher et aI, 1997; Miller et al., 1998; Magnuson et al., 2000).
Isotopic data in chlorinated organic compounds can be used to constrain
degradation mechanisms in subsurface environments. It might be possible to
evaluate contribution of biotic or abiotic degradation to attenuation of pollutants,
and to identify microorganisms (or metabolic pathway) mediating degradation of
pollutants by using quantitative information on isotope effects in various
93
subsurface processes.
The Rayleigh model (Criss, 1999) is usually used to quantify fractionation
factor. However it is difficult to apply such model to the data obtained from
multi-step reactions. Although compound specific 813C data are available, a series
of microcosm experiments starting with the each intermediate product in every
step is necessary to determine the enrichment factor of 13C for each step of PCE
dechlorination to ethene (Hunkeler et al., 1999; Bloom et al., 2000). Fractionation
during sequential reactions: bacterial reduction of selenate [Se(VI)] to elemental
selenium [Se(O)] via selenite [Se(IV)] have been investigated using a numerical
model (Herbel et al., 2000), but each Se species contains only one Se atom. As
compound specific techniques has never been developed for CI isotopic analysis,
and elimination of CI atom(s) from organic compounds is sometimes regiospecific
reaction, interpretation of CI isotope data is more difficult. Therefore, relatively
simple one-step process (TCE to cDCE) and two-step process (PCE to cDCE) were
investigated in this study. Isotopic fractionation factors calculated for PCE
dechlorination to TCE were ca. 0.987 to ca. 0.991 and for TCE to cDCE were ca.
0.9943 to ca. 0.9945 using the mathematical models.
A few studies have been published on CI isotope fractionation during biotic
and abiotic reactions of chlorinated organic compounds. The isotope fractionation
factor for 2-chloro-1-methyl-propane solvolysis (SN1 reaction) and for
1-chlorobutane substitution (SN2 reaction) were reported (0.=0.991 and 0.996
respectively, at room temperature) (Bartholomew et al., 1954; Turquist et al.,
1973). Isotope fractionation factor for the abiotic reductive dehalogenation of
benzyl chloride with sodium borohydride (SN2 reaction) derived from
measurement using FABS-mass spectrometry was 0.992 (Wastaway et al., 1998).
Heraty et al. (1999) reported isotopic fractionation factor for aerobic
biodegradation of dichloromethane (0.=0.9962). The fractionation factors for PCE
94

and TCE dechlorination calculated from the isotope data using the mathematical
models developed in this study were consistent with those reported values.
Although two Cl atoms existed in dichloromethane molecule, the Cl
isotopic fractionation during aerobic biodegradation can be explained by a simple
Rayleigh model (Heraty et al., 1999). The rate-determining step of the
dichloromethane by methylotrophs is a glutathione-dependent nucleophilic
substitution on one of Cl atoms, and then another Cl atom eliminates
spontaneously. Because only one of Cl atoms participates in isotopic fractionation,
the change in isotopic composition follows the Rayleigh equation. In contrast, Cl
isotopic fractionations during dechlorination of PCE and TCE are more
complicated. In this study, mathematical models to determine isotopic
fractionation factors using non-compound specific Cl isotope data were developed.
Although, the actual changes in isotope compositions were roughly consistent
with the models, more precise and/or compounds specific isotopic measurement
technique should be developed to interpret the small isotopic change like case of
TCE dechlorination and to verify suitability of the model. Also isotopic change in
the eliminated Cl may be more sensitive against progress of degradation.
However the isotopic analysis of Cl- in reaction medium will be difficult because
high concentration of Cl- and organic compounds exist in the medium.
Carbon isotope fractionation during biotic and abiotic dechlorination of
chlorinated ethenes has been investigated (Sherwood Lollar et al., 1999;
Hunkeler et al., 1999; Bloom, et al., 2000; Dayan et al., 1999). The reported 13C
enrichment factors for each step of the dechlorination decreased monotonically as
a function of number of Cl atoms in precursor molecules in the case of
dechlorination by anaerobic microorganisms (Hunkeler et al., 1999; Bloom et al.,
2000). In contrast, such correlation was not found in reductive dechlorination of
PCE, TCE and cDCE by metallic iron (Dayan et al., 1999). The authors explained
95

the relatively small isotope effect on TCE dechlorination by metallic iron by
simultaneous dechlorination pathways starting from asymmetric TCE molecule.
Apart from this case, the reason for the dependence of isotope change on degree
of chlorination has not been explained. The calculated Cl isotopic enrichment
factors for PCE dechlorination were larger than the factors for TCE
dechlorination. The reason for the opposite trend of enrichment factors depending
upon degree of chlorination between 13C and 37Cl is unclear.
However, further studies on factors that may possibly affect isotopic
fractionation during dechlorination of CARs will be necessary to make the models
more precise and to apply the model for actual contaminated sites. In this study,
the possibilities of isotope exchange between chlorinated ethenes and Cl- in the
media (Bantysh et al., 1962; Harper et al., 2000), rearrangement of CI atoms in
the molecules, and isotope effects on neighboring Cl atoms in the molecules were
neglected during the development of the mathematical models. Furthermore,
bacteria population (Flynn et al., 2000) change in consortiums and rate constant
and isotope fractionation factor change depending on concentration of CAHs or
growth stage of the bacteria would affect trajectories of isotopic composition.
During PCE dechlorination, actual trajectories of TCE fraction along with PCE
fraction change were slightly shifted from theoretical curves (Fig. 4-10) and also
the rate constants for TCE dechlorination to cDCE were different in the cases of
PCE dechlorination and TCE dechlorination (Table 4-1). This means that
dechlorination was inhibited by high concentration of TCE or the bacteria
population has changed depending upon growth stage or chlorinated ethenes
concentration. Such factors may disturb simple assumptions for development of
the models.
The CI isotopic composition of Clc in a TCE reagent (Wako) was
significantly different from the composition of CIa + Clb. The reactivity of the
96

atoms on each sites are not equivalent in asymmetric molecules like TCE. Such
intramolecular distributions of isotopes (i.e. compositions of isotopomers)
constrains geochemical cycles of substances more strictly compared with bulk
isotopic composition (Yoshida and Toyoda, 2000), because synthesis or
degradation processes would reflect to intramolecurar site specific isotope ratios.
(see Chapter 3).
The transition-metal coenzyme cyanocobalamin mediates dechlorination of
chlorinated organic compounds (Gantzer and Wakett, 1991) and it works as active
center of dehalogenase in anaerobic bacteria (Schumacher et aI., 1997; Holliger et
aI., 1999). Therefore the cyanocobalamin mediating dechlorination are regarded
as simple model to investigate the enzymatic systems participating in biotic
dechlorination.
In the dechlorination of chlorinated ethenes mediated by several
transition-metal coenzymes, the displacement of each CI atom decreased the rate
constant for the removal of subsequent CI atom by approximately 1 order of
magnitude (Gantzer and Wakett, 1991). However, in this study, stoichiometric
quantities of TCE or DCEs did not accumulate but another product (possibly
ethene) was formed (Fig. 4-11). The relatively higher rate constants for
dechlorination of DCEs and VC or existence of bypass pathway to ethene may be
the possible cause of the results. Although, the sum of molar fractions of
chlorinated ethenes and 'ETE' were almost unity during the reaction, it is
possible that the quantities of 'ETE' include ethane and Cl-compounds. Therefore,
identification of the compounds having same retention time to ethane will be
needed to examine the inconsistency of this and previous works.
The interpretation of isotopic data for dechlorination of PCE to ethane is
difficult, because it is a multi-step reaction and the regiospecificity of the TCE
dechlorination is lower than biotic reaction. It was expected that the isotope
97

fractionation factors for each dechlorination step may be calculated if the rate
constants for the each step decrease by large magnitude along with decrease in
number of CI atoms as reported by Gantzer and Wackett (1991). Despite of the
complex change in composition of chlorinated ethenes, the trend of isotope
composition in organic-CI during dechlorination was similar to the biotic reaction
(Fig 4-12). The larger isotopic change at final stage of the reaction would be due
to progress of dechlorination of DCEs. Further experiments will need to explain
the trajectory of isotopic compositions.
Conclusions
Biotic and abiotic reductive dechlorination of TCE and PCE caused
significant isotope fractionation of organic-form Cl. The mathematical models
derived from the Rayleigh equation were developed to estimate the fractionation
factors of CI isotope for regiospecific reaction (TCE to cDCE) and two· step
reaction (PCE to cDCE). The measured change in CI isotope roughly followed the
calculated trajectories. The values of the kinetic fractionation factor (a.) for the
TCE dechlornation, estimated from series of experiments using 3 kinds of
anaerobe culture conducted at 30 °e, were 0.9943 to 0.9945. The isotope
fractionation in the first step of PCE dechlorination was larger than fractionation
in TCE dechlorination, the values of the kinetic fractionation factor (a.l) ,
estimated from experiments conducted at 30 °e, were 0.987 to 0.991.
However, more precise and/or compounds specific isotopic measurement
technique should be developed to interpret small isotopic change (e.g. TCE
dechlorination) and multi-step reactions (e.g. PCE dechlorination by
cyanocobalamin).
Heterogeneous intramolecular distribution of isotopes G.e. compositions of
isotopomers) was found in a TCE reagent. It would constrain geochemical cycles
98

of substances more strictly compared with bulk isotopic composition.
The analytical techniques and the mathematical models developed in this
study will be a preliminary step to apply isotopic data to evaluation of possible
disturbance on tracing pollution sources by their isotopic fingerprint,
quantification of in·situ cleanup effectiveness, and investigation of mechanisms
in subsurface processes.
99

Ana
erob
ic B
acte
riaSt
rain
TC
onso
rtium
NC
onso
rtium
F
ni
trate
redu
ctio
nn.
d.n.
d.+
suf
ate
resp
iratio
n+
-n.
d.
m
etha
noge
nesi
s-
--
PC
E →cD
CE
k
1 (P
CE →
TCE)
0.06
1 hr
-10.
11 h
r-10.
12 h
r-1
k
2 (T
CE →
cDC
E)0.
53 h
r-11.
7 hr
-13.
4 hr
-1
α
1 (P
CE →
TCE)
0.99
10.
990
0.98
7
TC
E →cD
CE
k
(TC
E →cD
CE)
0.16
hr-1
0.14
hr-1
0.25
hr-1
α
(TC
E →cD
CE)
0.99
45±9
0.99
44±7
0.99
43±1
0
n.d.
: not
det
erm
ined
Tabl
e 4-
1. P
rope
rtie
s of
ana
erob
ic b
acte
ria
used
for
the
biot
ic d
echl
orin
atio
n ex
peri
men
ts.

101
Fig. 4-1. The concept of in-situ bioremediation. (Source: From Hazardous Waste Management, C. A. Wenz, McGraw-Hill, New York)

102
Fig. 4-2. Biotic and abiotic reductive dechlorination pathway of chlorinated ethenes
> > : toxicity
C C
Cl
Cl
Cl
Cl
C C
H
Cl
Cl
Cl
C C
H
H
Cl
ClC C
H
Cl
H
Cl
C C
Cl
H
H
Cl
C C
H
H
H
Cl
C C
H
H
H
H
PCE
TCE
1,1-DCE cDCE tDCE
VC
ETE
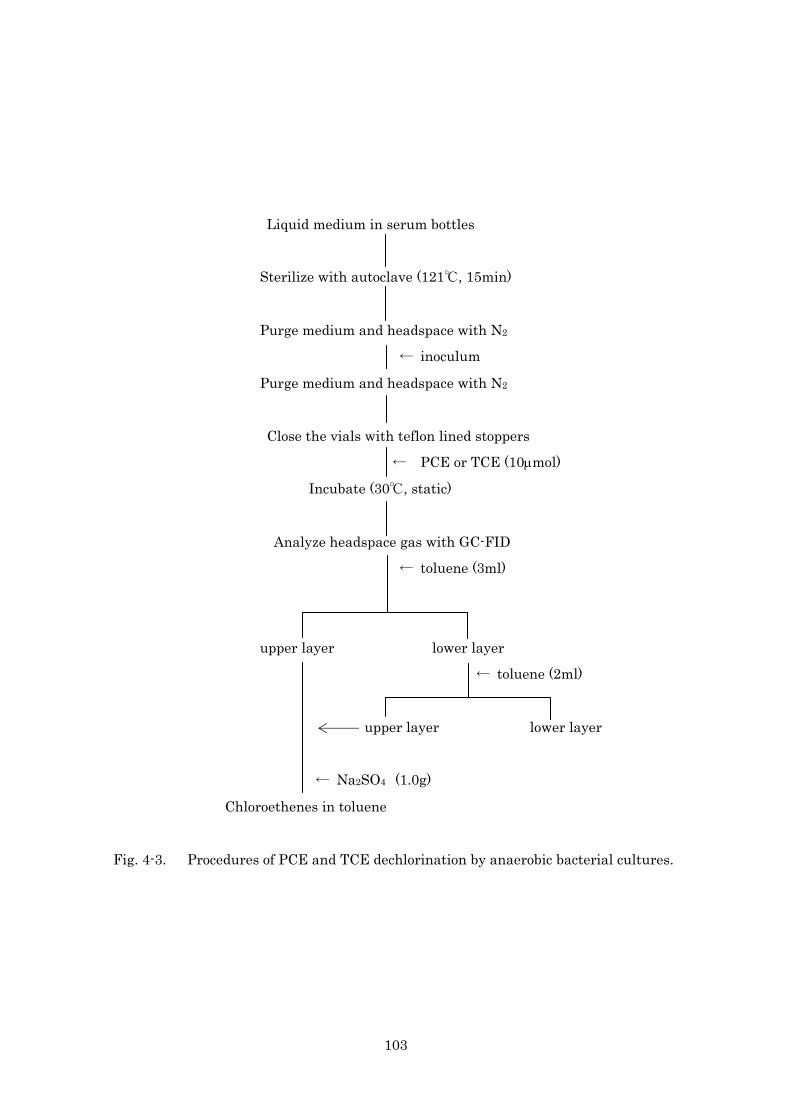
103
Liquid medium in serum bottles
Sterilize with autoclave (121℃, 15min)
Purge medium and headspace with N2
← inoculum
Purge medium and headspace with N2
Close the vials with teflon lined stoppers
← PCE or TCE (10μmol)
Incubate (30℃, static)
Analyze headspace gas with GC-FID
← toluene (3ml)
upper layer lower layer
← toluene (2ml)
upper layer lower layer
← Na2SO4 (1.0g)
Chloroethenes in toluene
Fig. 4-3. Procedures of PCE and TCE dechlorination by anaerobic bacterial cultures.

104
Fig. 4-4. Molar fractions of chloroethenes (TCE, cDCE) in sample bottles over time during the course of biological TCE dechlorination experiments. ○: TCE, ▲: cDCE
Frac
tions
of c
hlor
inat
ed e
then
es
Time (hr)
0
0.2
0.4
0.6
0.8
1
Consortium F
0 20 40 60 80 100
0
0.2
0.4
0.6
0.8
1
Consortium N
0
0.2
0.4
0.6
0.8
1
Strain T

105
Fig. 4-5. Molar fractions of chloroethenes (PCE, TCE, cDCE) in sample bottles over time during the course of biological PCE dechlorination experiments. ■: PCE, ○: TCE, ▲: cDCE
Frac
tions
of c
hlor
inat
ed e
then
es
Time (hr)
0
0.2
0.4
0.6
0.8
1
Consortium F
0 40 80 120 160
0
0.2
0.4
0.6
0.8
1
Consortium N
0
0.2
0.4
0.6
0.8
1
Strain T

106
Fig. 4-6. Calculated trajectories of δ37Cl value of organic-chlorine (TCE + cDCE) versus fraction of TCE remaining (eq 4-7; see text). δ1 and δ2 represent initial δ37Cl value of Clc and Cla,b respectively. α represents isotope fractionation factor.
-4.0
-2.0
0.0
2.0
4.0
6.0
0 0.2 0.4 0.6 0.8 1
(fraction of TCE remaining)
1 = 0,
2 = +3
= 0.990 = 0.994 = 0.998
δ δ
1 = 0,
2 = -3δ δ
1 = 0,
2 = 0δ δ
37C
l SMO
C (
)δ
‰
fT
ααα

Fig.
4-7
.
δ37 C
l va
lue
of o
rgan
ic-c
hlor
ine
(TCE
+ c
DC
E)
vers
us f
ract
ion
of T
CE
rem
aini
ng f
rom
the
bio
logi
cal
TCE
dech
lori
natio
n ex
peri
men
ts.
Dot
ted
lines
are
cal
cula
ted
traj
ecto
ries
of
δ37 C
l va
lue
of o
rgan
ic-c
hlor
ine
(eq
4-7;
see
tex
t).
Err
or b
ars
repr
esen
t th
e in
tern
al e
rror
of
each
run
of
Cl
isot
opic
mea
sure
men
t (2
σ m).
δ 1 a
nd δ
2 fo
r ca
lcul
ated
tra
ject
orie
s ar
e av
erag
e of
δ1
and
δ 2 i
n th
ree
regr
essi
ons
(δ1 a
nd δ
2 rep
rese
nt in
itial
δ37
Cl v
alue
of C
l c an
d C
l a,b).
00.
20.
40.
60.
81
α
(Fra
ctio
n of
TC
E re
mai
ning
)
0.99
6
0.99
9
0.99
3
0.99
0
f T
00.
20.
40.
60.
81
α
(Fra
ctio
n of
TC
E re
mai
ning
)
0.99
6
0.99
9
0.99
3
0.99
0
f T
-3.5
-3.0
-2.5
-2.0
-1.5
-1.0
-0.5
0
0.0
00.
20.
40.
60.
81
α
(Fra
ctio
n of
TC
E re
mai
ning
)
37ClSMOC ( ) δ‰
0.99
6
0.99
9
0.99
3
0.99
0
f T
Stra
in T
Con
sorti
um N
Con
sorti
um F

108
Fig. 4-8. Calculated trajectories δ37Cl value of organic-chlorine (PCE + TCE + cDCE) versus fraction of PCE (eq 4-23; see text) for different values of isotope fractonation factor with constant k2/k1 value. δ0 represents initial δ37Cl value of PCE (0‰). α1 and α2 represents isotope fractionation factor for PCE and TCE dechlorination respectively. k2/k1 represents ratio of rate constants of TCE dechlorination and PCE dechlorination (k2/k1=15).
0.0
1.0
2.0
3.0
4.0
5.0
0 0.2 0.4 0.6 0.8 1
37C
l SMO
C (
)
(fraction of PCE remaining)
δ‰
α1 = 0.985
α1 = 0.990
α1 = 0.995
α2 = 1.000
α2 = 0.980
α2 = 0.990
fP

109
Fig. 4-9. Calculated trajectories δ37Cl value of organic-chlorine (PCE + TCE + cDCE) and fraction of TCE versus fraction of PCE (eq 4-23 and eq 4-17; see text) for different k2/k1 values with constant values of isotope fractonation factors. δ0 represents initial δ37Cl value of PCE (0‰). α1 and α2 represents isotopic fractionation factor for PCE and TCE dechlorination respectively (α1=0.990, α2=0.980). k2/k1 represents ratio of rate constants of TCE and PCE dechlorination.
-1.0
0.0
1.0
2.0
3.0
-0.05
0
0.05
0.1
0.15
0.2
0.25
0.3
0.35
0.4
0 0.2 0.4 0.6 0.8 1
37C
l SMO
C (
)
(fraction of PCE remaining)fP
δ‰
(frac
tion
of T
CE)
f T
TCE
37Clδ
k2 / k
1 = 7.5
k2 / k
1 = 15
k2 / k
1 = 30

Fig.
4-1
0.
δ37
Cl
valu
e of
org
anic
-chl
orin
e (P
CE
+ T
CE
+ c
DC
E)
and
frac
tion
of T
CE
ver
sus
frac
tion
of P
CE
rem
aini
ng f
rom
the
bi
olog
ical
PC
E d
echl
orin
atio
n ex
peri
men
ts. D
otte
d lin
es a
re c
alcu
late
d tr
ajec
tori
es o
f δ3
7 Cl
valu
e of
org
anic
-chl
orin
e an
d fr
actio
n of
TC
E (
eq 4
-23
and
eq 4
-17;
see
tex
t).
Err
or b
ars
repr
esen
t th
e in
tern
al e
rror
of
each
run
of
Cl
isot
opic
mea
sure
men
t (2
σ m).
δ 0 fo
r ca
lcul
ated
tra
ject
orie
s is
ave
rage
of i
nitia
l δ37
Cl v
alue
of P
CE
(-2.
47‰
). α
1 and
α2 r
epre
sent
s is
otop
ic fr
actio
natio
n fa
ctor
for
PCE
and
TC
E d
echl
orin
atio
n re
spec
tivel
y. k 2
/k1 r
epre
sent
s ra
tio o
f rat
e co
nsta
nts
of T
CE
and
PC
E d
echl
orin
atio
n.
-5.0
-4.0
-3.0
-2.0
-1.00.0
1.0
2.0
00.
20.
40.
60.
81
37ClSMOC ( )
(Fra
ctio
n of
PC
E re
mai
ning
)
α2
TCE
37C
l
δ‰
δ
0.97
0
1.00
0
f P 1 = 0
.991
k 2 / k 1 =
8.7
α
00.
20.
40.
60.
81
(Fra
ctio
n of
PC
E re
mai
ning
)
α2
TCE
37C
lδ
1.00
0
0.97
0
f P 1 = 0
.990
k 2 / k 1 =
15
α
00.
20.
40.
60.
81
0.0
0.05
0
0.10
0.15
0.20
0.25
0.30
0.35
(Fra
ctio
n of
PC
E re
mai
ning
)
α2
TCE
37C
lδ
(Fraction of TCE)
0.97
0
1.00
0
f P
fT
1 =
0.9
87k 2 /
k 1 = 2
8α
Stra
in T
Con
sorti
um N
Con
sorti
um F

Fig.
4-1
1.
Mol
ar f
ract
ions
of
(chl
orin
ated
) et
hene
s in
sam
ple
bott
les
over
tim
e du
ring
the
cou
rse
of a
n ab
iotic
PC
E d
echl
orin
atio
n ex
peri
men
t. ■
: PC
E, ○
: TC
E, ▲
: cD
CE
, ×
: tD
CE
, +
: 1,1
-DC
E, □
: VC
, ◇
: (E
TE),
●: s
um o
f (ch
lori
nate
d) e
then
es.
10-4
10-3
10-2
10-1
100
05
1015
2025
30
Fractions of (chlorinated) ethenes
Tim
e (h
r)

112
-7.0
-6.0
-5.0
-4.0
-3.0
-2.0
-1.0
0.0
1.0
2.0
3.0
0
0.2
0.4
0.6
0.8
1
1
1
0 0.2 0.4 0.6 0.8 1
Fraction of PCE remaining
δ37
Cl (
) ‰
Frac
tions
of (
chlo
rinat
ed) e
then
es
Fig. 4-12. δ37Cl value of organic-chlorine (PCE + TCE + cDCE +VC) and fraction of TCE, cDCE, VC and ETE versus fraction of PCE remaining from the abiotic PCE dechlorination experiment. Error bars represent the internal error of each run of Cl isotopic measurement (2σm). ▼: δ37Cl, ○: TCE, ▲: cDCE, □: VC, ◇: ETE
113
5. Application of chlorine isotopic analysis for cosmo-geochemistry
Introduction
Halogens participate in many geochemical processes on the Earth as
volatile elements (e.g. hydrothermal activity, chemical evolution of ocean; Eastoe
et al., 1989; Eastoe and Guilbert, 1992; Seyfield et al., 1986; Ransom et al., 1995;
Ito et al., 1983; Philippot et al., 1998; Boudreu et al., 1997; Schilling et al., 1978;
Campbell et al., 1988; Berndt and Seyfried; 1990). Halogens also exist in
meteorites (Reed, 1971; Dreibus et al., 1977; Garrison et al., 2000) as components
of silicates (e.g. sodalite, scapolite, glass; Bridges et al., 1997), chloroapatite
(Bridges and Grady, 1999), lawrencite, and halite (Zolensky et al., 1999; Whitby
et al., 2000; Bridges and Grady, 1999; Bridges and Grady, 2000; Sawyer et al.,
2000).
Although isotopic analysis is a useful tool for the determination of
geochemical and cosmochemical processes of many elements, a few investigations
on Cl isotopic composition in meteorites have been reported. The small range of
bulk δ37Cl values (-0.7 to +0.7 ‰ ) in 4 ordinary chondrites was reported in
Hoering and Parker (1961). The bulk δ37Cl values in representative carbonaceous
chondrites Orgueil (CI), Murchison (CM), Allende (CV) were also measured (+2.7
to +4.0 ‰; Magenheim et al., 1994; Magenheim et al., 1995). The distributions of
Cl among mantle and an exogenic reservoir (atmosphere, ocean and crust) can be
calculated from mass balance of Cl isotopes. By assuming CI chondrite (Orgueil)
and MORB glass represents the bulk Earth and degassed mantle respectively,
Magenheim et al. (1995) calculated that approximately 40 % of Cl resides in the
exogenic reservoir. Although this result is rough estimation due to a small
number of measurements of Cl isotopic composition in meteorite and uncertainty

114
of Cl isotopic composition in MORB (i.e. mantle), it constrains evolution of ocean
and atmosphere on the Earth. The climate of ancient Mars would be warm
enough to sustain liquid water on the surface. The martian ‘soil’ containing much
amount of sulfates and chloride ranges all over the surface of the mars. These
salts in the martian soil (Clark and Van Hart, 1981; Banin et al., 1992; Rieder et
al., 1997) and martian meteorites (Bridges and Grady, 1999; Bridges and Grady,
2000; Sawyer et al., 2000) may be residues of ancient seawater. If isotopic
composition of Cl in the salts is homogeneous enough and martian meteorites
retains volatile elements in the mantle component, distribution of Cl between
martian mantle and exogenic reservoir may be calculated.
Evidences of aqueous alteration have been found in CI and CM chondrites,
but their evolution processes have not been clarified (Tomeoka, 1990;
Brandenburg 1996). The isotopic composition has never used to investigate
chemical evolution of meteorites. Heavier halogen isotopes distribute to solid
phase than fluid (Eastoe and Guilbert, 1992; Magenheim et al., 1995; Ransom et
al., 1995; Philippot et al., 1998), aqueous solution than gas phase (Volpe and
Spivack, 1994). Distribution of halogen and its isotopes in minerals may
constrain evolution of meteorites and their parent bodies.
The radioactive and radiogenic isotopes of halogens (36Cl → 36Ar,36S:
t1/2=3.01×105 yr; 129I→129Xe: t1/2=1.57×107 yr, 81Kr→81Br: t1/2=2.29×105 yr) are
utilized for not only dating of groundwater (e.g. Phillips, 1995; Lyons et al., 1998;
Hendry et al., 2000; Collon et al., 2000) but also dating of meteorites. A
cosmogenic isotope 36Cl is used to determine terrestrial residence age (Nishizumi
et al., 1989). An extinct isotope 129I is utilized to determine relative age of
meteorites (e.g. Ott, 2000). Chlorine bearing minerals are important as carriers
of these isotopes (Bridges et al., 1997; Whitby et al., 2000). As the I-Xe age of

115
halite in an ordinary chondrite is one of the oldest value in the solar system,
trace of shorter life time isotope 36Cl is searched in the halite (Ott, 2000). It was
thought that the half-life of 81Kr is not long enough to survive the time necessary
for the bodies to cool to temperatures low enough to retain noble gases
(Wyttenbach et al., 1965), decay of 81Kr may cause δ81Br anomaly.
In general, analysis of halogens in silicate rocks is more difficult than
metal elements due to their volatility. In particular, this is more serious problem
for limited sample size of meteorites.
Halogens are extracted from silicate rocks and meteorites for
determination of their abundances and isotopic compositions by alkali fusion
(Hoering and Parker, 1961; Wyttenbach et al., 1965; von Gunten et al., 1965;
Maxwell, 1968; Jeffery, 1975; Wilson and Gent, 1983; Potts, 1987; Shinonaga et
al., 1994a; Shinonaga et al., 1994b; Black, 1997), HF decomposition (Heumann et
al., 1987; Magenheim et al., 1995; Musashi et al., 1998), HCl distillation (Geijer,
1960; Robinson, 1959), Cl2 volatilization (Aruscavage and Campbell, 1983),
combustion (Evans and Moore, 1980), pyrohydrolysis (Dreibus et al., 1977; Potts,
1987; Magenheim et al., 1994; Magenheim et al., 1995). Techniques of mineral
specific extraction have been also reported. Cl in water soluble phases (e.g. halite,
fluid inclusion) is extracted with boiling water (von Gunten, 1965; Eastoe and
Maxwell, 1968; Jeffery, 1975; Guilbert, 1992; Bank, et al., 2000) and ‘acid soluble
Cl’ is extracted from sodalite, chlorapatite and carbonates with dilute nitric acid
(Maxwell, 1968; Eastoe and Guilbert, 1992; Eggenkamp and Koster van Groos,
1997).
The abundances of halogens are determined by INAA (Wyttenbach et al.,
1965; von Gunten, 1965; Dreibus et al., 1977; Shinonaga et al., 1994a; Shinonaga
et al., 1994b; Garrison et al., 2000), EPMA (Bridges et al, 1997), gravimetric
116
methods (Jeffery, 1975; Maxwell, 1968), photometric methods (Jeffery, 1975;
Blackwell, 1997), ion chromatography (Potts, 1987; Blackwell et al., 1997; Evans
and Moore, 1980; Wilson and Gent, 1983), ion selective electrode (Aruscavage and
Campbell, 1983; Jeffery, 1975; Potts, 1987), isotope dilution mass spectrometry
(Heumann et al., 1987; Heumann, 1988; Shinonaga et al., 1994a; Shinonaga et al.,
1994b).
Measurement of isotopic ratio is conducted by electron impact mass
spectrometry of CH3Cl (Markl et al., 1997; Eastoe and Guibert, 1992; Eastoe et
al., 1989; Musashi et al., 1998) and thermal ionization mass spectrometry of
Cs2Cl+ (Magenheim et al., 1994; Magenheim et al., 1995; Banks et al., 2000).
As described previously, it is important to develop techniques for
determination of halogens abundances and isotopic compositions in meteorites for
investigation of their history. In general, isotope dilution mass spectrometry
(IDMS) gives accurate results for trace analysis of many elements. The IDMS is
regarded as a definitive analytical method and utilized for dating of meteorites
by isochron methods and determination of rare earth elements pattern in
meteorites (Heumann, 1988; Potts, 1987). The IDMS by negative thermal
ionization mass spectroscopy (N-TIMS) of halogens is highly sensitive and has
been used successfully in the investigation of meteorites (Heumann et al., 1987;
Shinonaga et al., 1994a; Shinonaga et al., 1994b). Although sensitivity of thermal
ionization mass spectroscopy of Cs2Cl+ is lower than the N-TIMS method in some
extent, the precision may be higher.
In this work, in order to develop an improved method of IDMS for
determination of Cl and Br abundances, and the precise Br isotopic ratio using
TIMS which is applicable to tiny planetary materials, 37Cl spiked CsCl and CsBr
prepared from a commercial KBr reagent were analyzed. Preliminary results of

117
IDMS for Cl abundance determination and isotopic analysis of Br were described
in this chapter.
Experimental Procedures
Seawater Sample and Reagents
A seawater sample from the Pacific Ocean (8o39.5’N, 153o56.6’E) was used
for isotopic dilution mass spectrometer (see Chapter 2).
A 37Cl enriched spike (NaCl: 37Cl 98.21 %; Oak Ridge National Laboratory)
was stored as 6.85 and 1.37 μmol/g aqueous solution (24.7 mg of 37Cl enriched
NaCl was dissolved with water). A commercial grade CsCl reagent (minimum
assay 99 %; Nacalai tesque) was stored as 56.4 mM (2 g-Cl/L) solution. Water was
purified with a Milli-RX12Plus and a Milli-Q SP system (Millipore).
Cs-form and Ba-form cation exchange resin was prepared from DOWEX
50Wx8 (see Chapter 2).
Measurements of isotopic composition in the 37Cl spike
The 37Cl spike solution containing 3.2 μmol of Cl was evaporated to
dryness on hot plate (120 ℃). The residue was dissolved in 50 μL of water and
loaded on a column (borosilicate glass, inner diameter: 2 mm) that contained 0.1
mL of Cs-form cation exchange resin. The column was washed with 200 μL of
water. The eluent was evaporated to dryness on a hot plate (120 ℃). The residue
was dissolved in 60 μL of water, and 1.0 μL of the solution was loaded on a Ta
filament with graphite. The isotopic ratios were measured by using a Finnigan
MAT Model 262 thermal ionization mass spectrometer (see Chapter 2).

118
Isotope dilution mass spectrometry for determination of Cl concentration in
seawater
The spike solution containing 0.3 or 0.6 μmol of 37Cl was added to 50 μL of
the dilute seawater sample containing 0 to 0.25 μmol of Cl. And then the mixed
solutions were evaporated to dryness on a hot plate (120 ℃). The residue was
dissolved in 50 μL of water and loaded on a column (borosilicate glass, inner
diameter: 4 mm) that contained 0.2 mL of Ba-form cation exchange resin. The
column was washed with 250 μL of water, and the eluent was loaded on a column
(borosilicate glass, inner diameter: 2 mm) that contained 0.1 mL of Cs-form
cation exchange resin. The column was washed with 200 μL of water. The eluent
was evaporated to dryness on a hot plate (120 ℃). The residue was dissolved in
3.0 μL of water, and 1.0 μL of the solution was loaded on a Ta filament with
graphite. The isotopic ratios were measured by using a JEOL JMS-05RB mass
spectrometer (30 cm radius, 90o geometry) as described in Chapter 2.
Concentration of Cl- in the seawater was also determined with a Hitachi
ion chromatograph L-7000.
Isotope mass spectrometry of Br
Fifty microliters of KBr solution (56.4 mM) was loaded on a column
(borosilicate glass, inner diameter: 2 mm) that contained 0.1 mL of Cs-form
cation exchange resin. The column was washed with 200 μL of water. The eluent
was evaporated to dryness on a hot plate (120 ℃ ). The residue (CsBr) was
dissolved in 50 μL of water, and 1.0 μL of the solution containing 56.4 nmol of
CsBr was loaded on a Ta filament with graphite. The ratios of Cs279Br+ (m/z=345)
and Cs281Br+ (m/z=347) were measured by using a JEOL JMS-05RB mass

119
spectrometer. Also mixture of CsCl solution (56.4 mM, 0.5 μL) and the CsBr
solution (56.4 mM, 0.5 μL) were was analyzed by same procedure.
Results and Discussion
Isotope dilution mass spectrometry for determination of Cl concentration in
seawater
Isotopic composition in the 37Cl spike was determined using the Finnigan
MAT 262 mass spectrometer. The calculated 37Cl abundance was 98.1 % (37Cl /
35Cl = 51.53). The isotopic abundance of spike NaCl observed by us were in
agreement within 0.2 % with the value given by Oak Ridge National Laboratory.
Results of Cl abundance in diluted seawater determined by isotope
dilution mass spectrometry were shown in Fig. 5-1. The internal error (2σm) was
ca. 0.6 % by measurement of 9 scans ca. 3 × 10⁻¹⁰ A of signals. The calculated Cl
abundance in seawater was 528 mmol-Cl/kg. This value was slightly higher than
the value determined by ion chromatography (488 mmol-Cl/kg). The spike
solution should be calibrated with chloride standard solution which has natural
isotopic composition.
Advantage of isotope dilution mass spectrometry is independence of
accuracy on recovery yield of the target element after addition of spikes. Because
quantitative recovery of Cl from silicate rocks is recovery, this is important.
However, isotope dilution by Cs2Cl+ mass spectrometry requires relatively large
samples (50 nmol-Cl). Although the sensitivity of by ion chromatography is much
higher than this IDMS (detection limit of Cl-: approximately 0.02 nmol), the
accuracy depends on recovery yields. However less than 1 nmol of Br can be

120
measured by negative ion mass spectrometry of Br-(Shinonaga et al., 1994a). In
order to apply isotope dilution mass spectrometry of Cs2Cl+ to actual meteorites
samples, sample size should be reduced further.
Isotope mass spectrometry of Br
When 56 nmol of CsBr with ca.50 μg of graphite was loaded on the
filament, Cs2Br+ signal lasted long time enough to measure isotopic ratio (3.5×
10-10A of Cs279Br+ signal lasted for more than 60 min). The obtained isotopic
ration was 0.9745±0.0037 (9 scans, error: 2σm). When 28 nmol of CsCl and 28
nmol of CsBr with ca.50 μg of graphite were loaded on the filament, duration of
Cs2Cl+ and Cs2Br+ signals became shorter (2×10⁻¹⁰A of Cs279Br+ signal lasted for
60 min and 7×10⁻¹⁰A of Cs237Cl+ signal lasted for 60 min).
In this study, Cl- in aqueous solution is recovered as AgCl for Cl isotopic
analysis. Due to difficulty of handling of trace amount of AgCl precipitaion and
solubility of AgCl, the recovery yield of Cl from low concentration of solution will
be reduced. As graphite powder adhered to the surface of filament with CsCl,
graphite and CsCl will drop from the filament if amount of CsCl is too small.
Mixture of CsCl and CsBr will be obtained by co-precipitation of trace Cl- with
AgBr. As mixture of CsCl and CsBr gave Cs2Cl+ and Cs2Br+ signals, the
co-precipitation procedure may solve the problems.
The electron impact mass spectrometry of CH3Br (Willey and Taylor, 1978)
and the thermal ionization mass spectrometry of Cs2Br+ (Xiao et al., 1993) have
been developed and applied to samples processed Br from reagents suppliers.
However, the isotope geochemistry of Br has not been exploited, due to
expected analytical difficulties (e.g. rarity of Br in natural samples and
separation from relatively large amount of Cl). There are a few reports in which

121
attempts were made to measure natural Br isotope variations. Cameron and
Lippert (1955) applied mass spectrometry of HBr for measurement of Br isotope
composition in natural samples, but no significant variations were found.
Wyttenbach et al. (1965) reported Br isotopic compositions in 5 meteorites, but
the anomaly was not found because of low precision of isotopic analysis by the
neutron activation. Eggenkamp and Coleman (2000) have developed the method
for Br separation from Cl, conversion into CH3Br and electron impact mass
spectrometry of CH3Br. They measured two NaBr reagents, seawater bromide as
a standard (Standard Mean Ocean Bromide: SMOB), Br separated from 11
formation water samples.
It has been expected that the mechanisms of isotopic fractionation of Br in
natural systems resemble the case of Cl isotopic fractionation (e. g.
crystallization: Vengosh et al., 1989; Eggenkamp et al., 1995; Liu et al., 1997;
Lyons et al., 1999; Eastoe et al., 1999, aqueous alteration of silicate minerals:
Eastoe and Guilbert, 1992; Magenheim et al., 1995; Ransom et al., 1995,
volatilization: Volpe and Spivack, 1994; Volpe et al., 1998; Lyons et al., 1999,
diffusion: Desaulniers et al., 1986; Eggenkamp et al., 1994; Phillips and Bentley,
1987), because the chemistry of Br is very similar to Cl. However difference
processes of isotopic fractionation between Cl- and Br- in the formation water
samples was suggested due to coexistence of positive δ81BrSMOB values and
negative δ37ClSMOC values (Eggenkamp and Coleman, 2000). Different from δ37Cl,
δ81Br anomalies may be caused by oxidation of Br- to Br2 at high redox potential
circumstances (e.g. evaporites in the Chilean Atacama desert; Ericksen, 1981),
formation or decomposition of natural or artificial brominated organic compounds
(Harper, 1985) or radioactive decay of 81Kr (Wyttenbach et al.,1965; Collon et al.,
2000).

122
Conclusions
The isotope dilution mass spectrometry (IDMS) of Cs2Cl+ for determination
of Cl abundance was developed. The results of measurement of a seawater sample
by IDMS were consistent with results of ion chromatography. The sensitivity of
IDMS should be improved for practical use for meteorite samples.
Also isotope ratio mass spectrometry of Br was examined. The stability
and duration of Cs2Br+ signals were enough for isotopic analysis.

123
Fig. 5-1. Results of isotope dilution mass spectrometry for determination of Cl
concentration in a seawater sample.
0
50
100
150
200
0 0.002 0.004 0.006 0.008 0.01
Cl c
once
ntra
tion
(mg/
L)
(dilution rate)-1
y = 18394x + 1.7574
R2 = 0.9986

6. References
Aggarwal, P. K, Fuller, M. E., Gurgas, M. M., Manning, J. F. and Dillon, M. A.
(1997) Use of oxygen and carbon isotope analyses for monitoring the
pathways and rates of intrinsic and enhanced in situ biodegradation.
Environ. Sci. TechnoJ., 31, 590-596.
Aruscavage, P. J. and Campbell, E. Y. (1983) An ion-selective electrode method
for determination of chlorine in geological materials. Talanta, 30, 745-749.
Banin, A., Clark, B. C. and Wanke, H. (1992) Surface chemistry and mineralogy,
In Kieffer, H. H., Jakosky, B. M., Snyder, C. W. and Matthews, M. S. (eds.)
Mars. pp. 594-625. The University of Arizona Press. Tuscon.
Banks, D. A, Green, R., Cliff, R. A. and Yardley, B. W. D. (2000) Chlorine
isotopes in fluid inclusions: Determination of the. origins of salinity in
magmatic fluids. Geochim. Cosmochim. Acta, 64, 1785-1789.
Bantysh, A. N., Zel'venskii, Y. D., and Shalygin, V. A. (1962) Isotopic exchange of
the chloride ion with some organic chloro-compounds. Rus. J. Phys. Chem.,
36,30-33.
Bartholomew, R. M., Brown, F., and Lounsbury, M. (1954) Chlorine isotope effect
in reactions of tert-butyl chloride. Can. J. Chem., 32, 979-983.
Beneteau,K.M., Aravena, R. and Frape, S.K. (1999) Isotopic characterization of
chlorinated solvents - laboratory and field results. Org. Geochem., 30,
739-753.
Berndt, M. E. and Seyfried Jr., W. E. (1990) Boron, bromine, and other trace
elements as clues to the fate of chlorine in mid-ocean ridge vent fluids.
Geochim. Cosmochim. Acta, 54, 2235-2245.
Blackwell, P. A., Cave. M. R., Davis, A. E. and Malik, S. A. (1997) Determination
of chlorine and bromine in rocks by alkaline fusion with ion
124

chromatography detection. J. Chromatogr. A., 770, 93-98.
Bloom, Y., Aravena, R., Hunkeler, D., Edward, E. and Frape, S. K. (2000)
Carbon isotope fractionation during microbial dechlorination of
trichloroethene, cis-1,2-dichloroethene, and vinyl chloride: Implications for
assessment of natural attenuation. Environ. Sci. TechnoJ., 34, 2768-2772.
Boudreau, A. E., Stewart, M. A. and Spivack, A. J. (1997) Stable CI isotopes and
origin of high-CI magmas of the Stillwater Complex, Montana. Geology, 25,
791-794.
Boyd, A. W., Brown, F. and Lounsbury, M. (1955) Mass spectrometric study of
natural and neutron-irradiated chlorine. Canadian J. Phys., 33, 35-42.
Brandenburg, J. E. (1996) Mars as the parent body of the CI carbonaceous
chondrites. Geophys. Res. Lett., 23, 961-964.
Bridges, J. C., Alexander, C. M. O'D., Huchison, R., Franchi, I. A. and Pillinger, C.
T. (1997) Sodium-, chlorine-rich mesostases in Chainpur (LL3) and
Parnallee (LL3) chondrules. Meteorit. Planet. Sci., 32, 555-565.
Bridges, J. C. and Grady, M. M. (1999) A halite-siderite-anhydrite-chlorapatite
assemblage in Nakhla: Mineralogical evidence for evaporites on Mars.
Meteorit. Planet. Sci., 34, 407-415.
Bridges, J. C. and Grady, M. M. (2000) Evaporite mineral assemblages in the
naklite (martian) meteorites. Earth Planet. Sci. Lett., 176, 267-279.
Cameron, A. E. and Lippert, E .L. (1955) Isotope composition of bromine in
nature. Science, 121, 136-137
Campbell, A. C., Palmer, M. R., Klinkhammer, G. P., Bowers, T. S., Edmond, J.
M., Lawrence, J. R., Casey, J. F., Thompson, G., Humphris, S., Rona, P. and
Karson, cT. A. (1988) Chemistry of hot springs on the Mid-Atlantic Ridge.
Nature, 335, 514-519.
Cicerone, R. J. (1981) Halogens in the atmosphere. Rev. Geophys. Space Phys., 19,
125

123-139
Clark, B. C. and Van Hart, D. C. (1981) The salts of Mars. ICARUS, 45, 370'378.
ColIon, P., Kutschera, W., Loosli, H. H., Lehmann, B. E., Purtschert, R., Love, A.,
Sampson, L., Anthony, D., Cole, D., Davids, R, Morrissey, D. J., Sherrill, R
M., Steiner, M., Pardo, R. C. and Paul, M. (2000) 8lKr in the Great Artesian
Basin, Australia: a new method for dating very old groundwater. Earth
Planet. Sci. Lett., 182, 103-113.
Conrad, M. E., Daley, P. F., Fisher, M. 1., Buchanan, R B., Leighton, T., and
Kashgarian, M. (1997) Combined 14C and 8l3C monitoring of in situ
biodegradation of petroleum hydrocarbon. Environ. Sci. Technol., 31,
1463-1469.
Criss, R. E. (1999) Principles of stable isotope distribution, Oxford University
press, New York. pp.105·110.
Dayan, H., Abrajano, T., Sturchio, N. C. and Winsor, 1. (1999) Carbon isotopic
fractionation during reductive dehalogenation of chlorinated ethenes by
metallic iron. Org. Geochem., 30, 755-763.
de Bruin, W. P., Kotterman, M. J. J., Posthumus, M. A. Shraa, G. and Zehnder, A.
J. B. (1992) Complete biological reductive transformation of
tetrachloroethene to ethene. AppJ. Environ. Microbiol., 58, 1996-2000.
Dempster, H. S., Sherwood Lollar, B. and Feenstar, S. (1997) Tracing Organic
Contaminants in groundwater: A new methodology using compound-specific
isotopic analysis. Environ. Sci. TechnoJ., 31, 3193-3197.
Desaulniers, D. E., Kaufmann, R. S., Cherry, J. A., and Bentley, H. W. (1986)
37CI·35CI variations in a diffusion'controlled groundwater system. Geochim.
Cosmochim. Acta, 50, 1757-1764.
Dreibus, G., Spettel, B. and Wanke, H. (1977) Halogens in meteorites and their
primordial abundances. In Ahrens, L. H. (ed,) Origin and distribution of the
126

elements, pp. 33-38, Pergamon Press, Oxford.
Eastoe, C. J., Guilbert, J. M. and Kaufmann, R. S. (1989) Preliminary evidence
for fractionation of stable chlorine isotopes in ore-forming hydrothermal
systems. Geology, 17,285-288.
Eastoe, C. J. and Guilbert, J. M. (1992) Stable chlorine isotopes in hydrothermal
processes. Geochim. Cosmochim. Acta, 56, 4247-4255.
Eastoe, C. J., Long, A. and Knauth, P. (1999) Stable chlorine isotope in the Palo
Duro Basin, Texas: Evidence for preservation of Permian evaporite brines.
Geochim. Cosmochim. Acta, 63, 1375-1392.
Eggenkamp, H. G. M., Middelburg, J. J., and Kreulen, R. (1994) Preferential
diffusion of 35CI relative to 37CI in sediments of Kau Bay, Halmahera,
Indonesia. Chem. Geol (Isotope Geosci. Sect), 116, 317-325.
Eggenkamp, H.G., Kreulen, R., and Koster van Groos, A. F. (1995) Chlorine stable
isotope fractionation in evaporite. Geochim. Cosmochim. Acta, 59,
5169-5175.
Eggenkamp, H.G. and Koster van Groos, A. F. (1997) Chlorine stable isotopes in
carbonatites: evidence for isotopic heterogeneity in the mantle. Chem. GeoJ.,
140, 137-143.
Eggenkamp, H. G. M., and Coleman, M. L. (2000) Rediscovery of classical
methods and their application to the measurement of stable bromine
isotopes in natural samples. Chem. Geol., 167, 393-402.
Erickson, G. E. (1981) Geology and origin of the Chilean nitrate deposits. USGS
Prof. Paper, 1188, pp. 37.
Evans, K. L. and Moore, C. B. (1980) Combustion-ion chromatographic
determination of chlorine in silicate rocks. Anal. Chem., 52, 1908-1912.
Fetzner, S. (1998) Bacterial dehalogenation. Appl. MicrobioJ. BiotechnoJ. , 50,
633-657.
127

Fisher, A. J., Rowan, E. A. and Spalding, R, F. (1987) VOCs in ground water
influenced by large scale withdrawals. Ground Water. 25, 407-413
Flynn, S. J., Lorfler, F. E. and Tiedie, J. M. (2000) Microbial community changes
associated with a shift from reductive dechlorination of PCE to reductive
dechlorination of cis-DCE and VC. Environ. Sci. TechnoJ., 34, 1056-1061.
Gantzer, C. J. and Wackett, L. P. (1991) Reductive dechlorination catalyzed by
bacterial transition-metal coenzymes. Environ. Sci. TechnoJ., 25, 715-722.
Garrison, D., Hamlin, S. and Bogard, D. (2000) Chlorine abundances in
meteorites. Meteorit. Planet. Sci., 35, 419·429.
Geijer, P. (1960) Halogens in skarn amohiboles. Arkiv. Mineral. GeoJ., 2, 482-484.
Gillham, R. W. and O'Hannesin, S. T. (1994) Enhanced degradation of chlorinated
aliphatics by zero'valent iron. Groundwater, 32, 958-971.
Grayson, M. eds. (1985) Kirk-Othmer Concise Encyclopedia of Chemical
Technology, John Wiley and Sons, New York
Gribble, G. W. (1994) The natural production of chlorinated compounds. Environ.
Sci. TechnoJ., 28, 31OA-319A.
Gschwend, P. M., MacFarlane, J. K., and Newman, K, A. (1985) Volatile
halogenated organic compounds released to seawater from temperate
marine macroalgae. Science, 227, 1033-1035.
Harper, D. B. (1985) Halomethane from halide ion - a highly efficient fungal
conversion of environmental significance. Nature} 315., 55-57.
Harper, D. B., Kalin, R. M., Larkin, M. J., Hamilton, J. T. G. and Coulter, C.
(2000) Microbial transhalogenation: A complicating factor in determination
of atmospheric chloro' and bromomethane budgets. Environ. Sci. TechnoJ.,
34, 2525·2527.
Hendry, M. J., Wassenaar, L. 1. and Kotzer, T. (2000) Chlorine and chlorine
isotopes (36CI and 835Cl) as tracers of solute migration in a thick, clay'rich
128

aquitard system. Water Resour. Res., 36, 285-296.
Heraty, L. J., Fuller, M. E., Huang, L., Abrajano Jr., T. and Sturchio, N. C.
(1999) Isotopic fractionation of carbon and chlorine by microbial
degradation of dichloromethane. Org. Geochem., 30, 793-799.
Herbel, M. J., Johnson, T. M., Oremond, R. S. and Bullen, T. D. (2000)
Fractionation of selenium isotopes during bacterial respiratory reduction of
selenium oxyanions. Geochim. Cosmochim. Acta, 64, 3701-3709.
Heumann, K. G., Gall, M. and Weiss, H. (1987) Geochemical investigation to
explain iodine-overabundances in Antarctic meteorite. Geochim. Cosmochim.
Acta, 51, 2541-2547.
Heumann, K. G. (1988) Isotope dilution mass spectrometry. In Adams, F., Gijbels
R. and van Grieken, R. (eds,) Inorganic Mass Spectrometry, pp. 301-368.
John Wiley and Sons, New York.
Hoefs, J. (1997) Stable Isotope Geochemistry. Springer-Verlag, Berlin, pp. 62-63.
Hoekstra, E. J., de Leer, E. W. B. and Brinkman, U. A. T. (1998) Natural
formation of chloroform and brominated trihalomethanes in soil. Environ.
Sci. Technol., 32, 3724-3729.
Hoering, T. C., and Parker, P. L. (1961) The geochemistry of the stable isotopes of
chlorine. Geochim. Cosmochim. Acta, 23, 186-199.
Holliger, C., Schiraa, G., Stams, A. J. M. and Zehnder, A. J. B. (1993) A highly
purified enrichment culture coupled the reductive dechlorination of
tetrachloroethene to growth. Appl. Environ. Microbiol., 59, 2991-2997.
HoBiger, C. (1995) The anaerobic microbiology and biotreatment of chlorinated
ethenes. Curro Opin. Biotechnol., 6, 347-351.
Holliger, C., Wohlfarth, G. and Diekert, G. (1999) Reductive dechlorination in the
energy metabolism of anaerobic bacteria. FEMS MicrobioJ. Rev., 22,
383-398.
129
Holt, B. D., Sturchio, N. C., Abrajano, T. A., and Heraty, L. J. (1997) Conversion
of chlorinated volatile organic compounds to carbon dioxide and methyl
chloride for isotopic analysis of carbon and chlorjne. Anal. Chem., 69,
2727-2733.
Huang, L., Sturchio, N. C., Abrajano Jr., T., Heraty, L.J. and Holt, B.D. (1999)
Carbon and chlorine isotope fractionation of chlorinated aliphatic
hydrocarbons by evaporation. Org. Geochem., 30, 777-785.
Hunkeler, D., Aravena, R. and Butler, B. J. (1999) Monitoring microbial
dechlorination of tetrachloroethene (PCE) III groundwater using
compound-specific carbon isotope ratios: Microcosm and field studies.
Environ. Sci. Technol., 33, 2733-2738.
Hunkeler, D. and Aravena, R. (2000a) Determination of compound-specific carbon
isotope ratios of chlorinated methanes, ethanes, and ethenes in aqueous
samples. Environ. Sci. Technol., 34, 2839-2844.
Hunkeler, D. and Aravena, R. (2000b) Evidence of substantial carbon isotope
fractionation among substrate, inorganic carbon, and biomass during
aerobic mineralization of 1,2-dichloroethane by Xanthobacter autotrophicus.
Appl. Environ. Microbiol., 66, 4870-4876.
Imagawa, T. (1990) 1l:i~&Jit~: J: {, 1f.~*1l:iir~£D)1fW. Kagaku-Kougyou, (1),
24-27 (in Japanese).
Ito, E., Harris, D. M. and Anderson Jr., A. T. (1983) Alteration of oceanic crust
and geologic cycling of chlorine and water. Geochim. Cosmochim. Acta, 47,
1613-1624.
Jarman, W. M., Hilkert, A., Bacon, C. E., Collister, J. W., Ballschmiter, K., and
Risebrough, R. W. (1998) Compound-specific carbon isotopic analysis of
Aroclors, Clophens, Kaneclors, and Phenoclors. Environ. Sci. Technol., 32,
833-836.
130

Jeffery, P. G. (1975) Chemical methods ofrock analysis, Pergamon Press, Oxford.
pp. 190-197.
Jendrzejewski, N., Eggenkamp, H. G. M., and Coleman, M. L. (1997) Sequential
determination of chlorine and carbon isotopic composition in single
microliter samples of chlorinated solvent. Anal. Chem., 69, 4259-4266.
Johnson, T. M., Bullen, T. D. and Zawislanski, P. T. (2000) Selenium stable
isotope ratios as indicators of sources and cycling of selenium: Results from
the Northern Reach of San Francisco Bay. Environ. Sci. Technol., 34,
2075-2079.
Johnston, H. L., and Hutchison, D. A. (1942) Efficiency of the electrolytic
separation of chlorine isotopes. J Chem. Phys., 10, 469-472.
Jordan, A., Harnisch, J., Borcher, R., Guern, F. L. and Shinohara, H. (2000)
Volcanogenic hydrocarbons. Environ. Sci. TechnoJ., 34, 1122-1124.
Kaufmann, R. S., Long, A., Bentley, H., and Davis, S. (1984) Natural chlorine
isotope variations. Nature, 309, 338-340.
Kaufmann, R. S., Frape, S. K., McNutt, R., and Eastoe, C. (1993) Chlorine stable
isotope distribution of Michigan Basin formation waters. AppJ. Geochem., 8,
403-407.
Kawasaki, T. (1985) Present condition and countermeasure with groundwater
pollution. Jpn. J Water Pollut. Res., 8, 265-268.
Kemp, A. L. W. and Thode, H. G. (1968). The mechanism of the bacterial
reduction of sulfate and of sulfite from isotopic fractionation studies.
Geochim. Cosmochim. Acta, 32, n-91.
Keppler, F., Elden, R., Niedan, V., Pracht, J. and Scholer, H. F. (2000)
Halocarbon produced by natural oxidation processes during degradation of
organic matter. Nature, 403, 298-301.
Komor, S. C. (1997) Boron contents and isotopic compositions of hog manure,
1:11
selected fertilizers, and water III Minnesota. J. Environ. Qual., 26,
1212-1222.
Lee, T., Yoshimi, M., Ike, M., and Fujita, M. (1997) Characterization of an
anaerobic soil enrichment capable of dechlorinating high concentrations of
tetrachloroethylene. Water Sci. Technol., 36, 117-124.
Liggett, L. M. (1954) Determination of organic halogen with sodium biphenyl
reagent. Anal. Chem., 26, 748-750.
Liu, W. G., Xiao, Y. K., Wang, Q. Z., Qi, H. P., Wang, Y. H., Zhou, Y. M., and
Shirodkar, P. V. (1997) Chlorine isotopic geochemistry of salt lakes in the
Qaidam Basin, China. Chem. Geol. (Isotope Geosci. Sect), 136, 271-279.
Long, A., Eastoe, C. J., Kaufmann, R. S., Martin, J. G., Wirt, L., and Finley, J. B.
(1993) High-precision measurement of chlorine stable isotope ratios.
Geochim. Cosmochim. Acta, 57,2907-2912.
Lyons, W. B., Welch, K. A. and Sharma, P. (1998) Chlorine-36 in the waters of
the McMurdo Dry Valley lakes, Southern Victoria Land, Antarctica:
Revisited. Geochim. Cosmochim. Acta, 62, 185-191.
Lyons, W. B., Frape, S. K. and Welch, K. A. (1999) History of McMurdo Dry Valley
lakes, Antarctica, from stable chlorine isotope data. Geology, 27, 527-530.
Madorsky, S. L., and Straus, S. (1947) Concentration of isotopes of chlorine by the
counter-current electromigration method. J. Res. Natl. Bur. Stand., 38,
185-189.
Magenheim, A. J., Spivack, A. J., Volpe, C., and Ransom, B. (1994) Precise
determination of stable chlorine isotopic ratios in low-concentration natural
samples. Geochim. Cosmochim. Acta, 58, 3117-3121.
Magenheim, A. J., Spivack, A. J., Michael, P. J., and Gieskes, J. M. (1995)
Chlorine stable isotope composition of the oceanic crust: Implications for
earth's distribution of chlorine. Earth Planet. Sci. Lett., 131, 427-432.
132

Mangnuson, J. K., Romine, M. F., Burris, D. R. and Kingsley, M. T. (2000)
Trichloroethene reductive dehalogenase from Dehalococoides ethenogenes:
Sequence of tceA and substrate range characterization. Appl. Environ.
MicrobioL, 66, 5141-5147.
Mariotti, A., Landreau, A., and Simon, B. (1988) 15N isotopic biogeochemistry and
natural denitrification process in groundwater: Application to the chalk
aquifer of northern France. Geochim. Cosmochim. Acta, 52, 1869-1878.
Markl, G., Musashi, M., and Bucher, K. (1997) Chlorine stable isotope
composition of granulites from Loften, Norway: Implications for the CI
isotopic composition and for the source of CI enrichment in the lower crust.
Earth Planet. Sci. Lett., 150, 95-102.
Maxwell, J. A. (1968) Rock and mineral analysis, Intersience Publishers, New
York.
Maym6-Gatell, X., Chien, Y. T., Gossett, J. M. and Zinder, S. H. (1997) Isolation
of bacterium that reductively dechlorinates tetrachloroethene to ethene.
Science, 276, 1568-1571.
Miller, E., Wohlfarth, G. and Diekert, G. (1998) Purification and chracterization
of the tetrachloroethene reductive dehalogenase of strain PCE-S. Arch.
MicrobioL, 169, 497-502.
Musashi, M., Marl, G., and Kreulen, R. (1998) Stable chlorine-isotope analysis of
rock samples: New aspects of chlorine extraction. Anal. Chim. Acta, 362,
261-269.
Nakai, N., Tsuji, Y., and Takeuchi, U. (1991) Stable isotopes- Natural and
anthropogenic sulfur in the environment. In Krouse, H. R. and Grinenko, V.
G. (eds.) SCOPE, 43, pp. 344-361, John Wiley & Sons, New York.
Neumann, A., Wolfarth, G. and Diekert, G. (1996) Purification and
characterization of tetrachloroethene reductive dehalogenase from
133

Dehalospirillum multivorans. J. Biol. Chem., 271, 16515-16519.
Ninomiya, K. and M. Sakai (1993) Estimation on behavior of chlorinated
hydrocarbons in groundwater using mathematical model. J. Jpn. Soc. Water
Environ., 16, 742-746 (in Japanese, with English abstract).
Nishizumi, K., Elmore, D. and Kubik, P. W. (1989) Update on terrestrial ages of
Antarctic meteorites. Earth Planet. Sci. Lett., 93, 299-313.
Noble, S. R., Lightfoot, P. C. and Scharer, U. (1989) A new method for
single-filament isotopic analysis of Nd using in situ reduction. Chem. Geol.
(Isotope Geosci. Sect.), 79, 15-19.
Numata, M., Matsuura, K. and Yuki, Y. (1999a) Continuous degradation of
tetrachloroethene by a two' stage anaerobic/aerobic bioreactor system. J.
Jpn. Soc. Water Environ., 22, 485-490 (in Japanese with English abstract).
Numata, M., Matsuura, K. and Yuki, Y. (1999b) Degradation of tetrachloroethene
and trichloroethene by immobilized anaerobic and aerobic microorganisms.
J. Jpn. Soc. Water Environ., 22, 479-484 (in Japanese with English
abstract).
Numata, M., Nakamura, N. and Garno, T. Precise measurement of chlorine stable
isotopic ratios by thermal ionization mass spectrometry. Geochem. J., (In
Press).
Ott, E. (1942) Ber., 75, 1517
Ott, U. (2000) Salty old rocks. Science, 288, 1761-1762.
Pecherer, B., Gambrill, C. M. and Wilcox, G. W. (1950) Determination of bromine
and chlorine in gasoline. Anal. Chem., 22, 311-315.
Philipott, P., Agrinier, P. and Scambelluri, M. (1998) Chlorine cycling during
subduction of altered oceanic crust. Earth Planet. Sci. Lett., 161, 33-44.
Phillips, F. M. and Bentley, H. W. (1987) Isotopic fractionation during ion
filtration: I. Theory. Geochim. Cosmochim. Acta, 51, 683-695.
134

Phillips, F. M. (1995) The use of isotopes and environmental tracers in subsurface
hydrology. Rev. Geophys., (Supplement), 1029-1033.
Potts, P. J. (1987) A handbook of silicate rock analysis, Blackie Academic and
Professional, London.
Ransom, B., Spivack, A. J., and Kastner, M. (1995) Stable Cl isotopes in
subduction' zone pore waters: Implications for fluid-rock reactions and the
cycling of chlorine. Geology, 23, 715-718.
Reddy, C. M., Heraty, L. J., Holt, B. D., Sturchio, N. C., Eglinton, T. 1., Drenzek,
N. J., Xu, L., Lake, J. L. and Maraya, K. A. (2000) Stable isotopic
compositions of Aroclors and Arochlor-contaminated sediments. Environ. Sci.
TechnoJ., 34, 2866-2870.
Reed Jr., G. W. (1971) Chlorine, In Muson, B. (ed,) Handbook of elemental
abundances in meteorites. pp. 143-148. Gordon and Bereach Science
Publishers, New York.
Rieder, R., Economou, '1'., Wanke, H., Turkevich, A., Crisp, J., Bruckner, J.,
Dreibus, G. and McSween Jr., H. Y. (1997) The chemical composition of
martian soil and rocks returned by the mobile alpha proton X-ray
spectrometer: Preliminary results from the X-ray mode. Science, 278,
1771-1774.
Robert, R. C., Miller, B. R. and Weiss, R. F. (2000) Natural methyl bromide and
methyl chloride emissions from coastal salt marshes. Nature, 403, 292-295.
Robinson, J. W. (1959) Rapid determination of chloride in silica or other solids.
Anal. Chim. Acta, 20, 2014-2026.
Rosenbaum, J. M., Cliff, R. A. and Coleman, M. L. (2000). Chlorine stable
isotopes; A comparison of dual inlet and thermal ionization mass
spectrometric measurements. Anal. Chem., 72, 2261-2264.
Sawyer, D. J., McGehee, M. D., Canepa, J. and Moore, C. B. (2000) Water soluble
135
ions in the Nakhla martian meteorite. Meteorit. Planet. Sci., 35, 743-747.
Schilling, J. ·G., Unni, C. K and Bender, M. L. (1978) Origin of chlorine and
bromine in the oceans. Nature, 273, 631-636.
Schumacher, W. and Holiger, C., Zehnder, A. J. B. and Hagen, W. R. (1997)
Redox chemistry of cobalamin and iron-sulfur cofactor in the
tetrachloroethene reductase of Dehalobacter restricus. FEBS Lett., 409,
421-425.
Seyfried Jr., W. E., Berndt, M. E. and Janecky, D. R. (1986) Chloride depletions
and enrichments in seafloor hydrothermal fluids: Constraints from
experimental basalt alteration studies. Geochim. Cosmochim. Acta, 50,
469·475.
Sherwood Lollar, B., Slater, G.F., Ahad, J., Sleep, B., Spivack, J., Brennan,M.
and MacKenzie, P. (1999) Contrasting carbon isotope fractionation during
biodegradation of trichloroethylene and toluene: Implications for intrinsic
bioremediation. Org. Geochem., 30, 813-820.
Shields, W. R., Murphy, T. J., Garner, E. L., and Dibeler, V. H. (1962) Absolute
isotopic abundance ratio and the atomic weight of chlorine. J. Am. Chem.
Soc., 84, 1519-1522.
Shinonaga, T., Ebihara, M., Nakahara, H., Tomura, K and Heumann. K G.
(1994a) CI, Br and I in igneous standard rocks. Chem. Geol., 115, 213-225.
Shinonaga, T., Endo, K, Ebihara, M., Heumann, K G. and Nakahara, H.
(1994b) Weathering of Antarctic meteorites investigated from contents of
Fe3+, chlorine, and iodine. Geochim. Cosmochim. Acta,' 58, 3735'3740.
Slater, G. F., Dempster, H. S., Lollar, B. S., and Ahad, J. (1999) Headspace
analysis: A new application for isotopic characterization of dissolved organic
contaminants. Environ. Sci. Technol., 33, 190'194.
Sturchio, N. C., Clausen, J. L., Heraty, L. J., Huang, L., Holt, B. D., and
136

Abrajano, Jr., T. A. (1998) Chlorine isotope investigation of natural
attenuation of trichloroethene in an aerobic aquifer. Environ. Sci. Technol.,
32, 3037-3042.
Strurges, W. T., and Barrie, 1. A. (1989) The use of stable lead 206/207 isotope
ratio and elemental composition to discriminate the origins of lead in
aerosols at a rural site in eastern Canada. Atmos. Environ., 23, 1645-1657.
Sturchio, N. C., Clausen, J. 1., Heraty, 1. J., Huang, L., Holt, B. D., and Abrajano,
Jr., T. A. (1998) Chlorine isotope investigation of natural attenuation of
trichloroethene in an aerobic aquifer. Environ. Sci. TechnoJ., 32, 3037-3042.
Suchomel, K. H., Kleamer, D. K. and Lomg, A. (1990) Production and transport of
carbon dioxide in an contaminated vadose zone: A stable and radioactive
carbon isotope study. Environ. Sci. TechnoJ., 24, 1824-1831.
Sugimoto, A. and Wada, E. (1993) Carbon isotopic composition of bacterial
methane in a soil incubation experiment: Contribution of acetate and
C02/H2. Geochim. Cosmochim. Acta, 57, 4015-4027.
Tanaka, N., and Rye, D. M. (1991) Chlorine in the stratosphere. Nature, 353, 707.
Taylor, J. W., and Grimsrud, E. P. (1969) Chlorine isotopic ratios by negative ion
mass spectrometry. Anal. Chem., 41, 805-810.
Tomeoka, K. (1990) Phyllosilicate veins in a CI meteorite: evidence for aqueous
alteration on the parent body. Nature, 345, 138-140.
Turnquist, C. R., Taylor, J. W., Grimsrud, E. P., and Williams, R. C. (1973)
Temperature dependence of chlorine kinetic isotope effects for aliphatic
chlorides. J. Am. Chem. Soc., 95, 4133-4138.
van Warmerdam, E. M., Frape, S. K, Aravena, R. Drimmie, R. J., Flatt, H., and
Cherry, J. A. (1995) Stable chlorine and carbon isotope measurements of
selected chlorinated organic solvents. Appl. Geochem., 10, 547-552.
Vengosh, A. Chivas, A. R., and McCulloch, M. T. (1989) Direct determination of
137

boron and chlorine isotopic compositions in geological materials by negative
thermal-ionization mass spectrometry. Chem. Geol., 79, 333-343.
Venkateswarlu, P. (1982) Sodium biphenyl method for determination of covalently
bound fluorine in organic compounds and biological materials. Anal. Chem.,
54, 1132-1137.
Vogel, T. M., Criddle, C. S. and McCarty, P. L. (1987) Transformation of
halogenated aliphatic compounds. Environ. Sci. Techn oJ. , 21, 722·736.
Volpe, C. and Spivack, A. J. (1994) Stable chlorine isotopic composition of marine
aerosol particles in the western Atlantic Ocean. Geophys. Res. Lett., 21,
1161'1164.
Volpe, C., Wahlen, M., Pszenny, A. A. P., and Spivack, A. J. (1998) Chlorine
isotopic composition of marine aerosols: Implications for the release of
reactive chlorine and HCI cycling rates. Geophys. Res. Lett., 25, 3831-3834.
von Gunten, H. R., Wyttenbach, A. and Scherle, W. (1965) Determination of
chlorine in stony meteorites by neutron activation. Geochim. Cosmochim.
Acta, 29, 475-480.
Wastaway, K. C., Koemer, T., Fang, Y. R., Rudzinski, J., and Paneth, P. (1998) A
new method of determining chlorine kinetic isotope effect. Anal. Chem., 70,
3548·3552.
Whitby, J., Burgess, R., Turner, G., Glimour, J. and Bridges, J. (2000) Extinct
1291 in halite from a primitive meteorite: Evidence for evaporite formation in
the early solar system. Science, 288, 1819-1821.
Willey, J. F. and Taylor, J. W. (1978) Capacitive integration to produce high
precision isotopic measurement on methyl chloride and bromide. Anal.
Chem., 50, 1930-1933.
Wilson, S. A. and Gent, C. A. (1983) Determination of chlorine in geological
samples by ion chromatography. Anal. Chim. Acta, 148, 299-303.
138

Wyttenbach, A., von Gunten, H. R. and Scherle, W. (1965) Determination of
bromine content and isotopic composition of bromine in stony meteorites by
neutron activation. Geochim. Cosmochim. Acta, 29, 467-474.
Xiao, Y. K., Beary, E. S. and Fassett, J. D. (1988) High precision isotopic
measurement of boron by thermal ionization mass spectrometry of the
CS2CI+ ion. Int. J Mass Spectrom. Ion Proc., 85, 203.
Xiao, Y. K., and Zhang, C. G. (1992) High precision isotopic measurement of
chlorine by thermal ionization mass spectrometry of the CS2CI+ ion. Int. J.
Mass Spectrom. Ion Proc., 116, 183-192.
Xiao, Y. K., Liu, W. G., Qi, H. P. and Zhang, C. G. (1993) A new method for the
high precision isotopic measurement of bromine by thermal ionization mass
spectrometry. Int. J Mass Spectrom. Ion Proc., 123, 117-123.
Xiao, Y. K., Zhou, Y. M., and Liu, W. G. (1995) Precise measurement of chlorine
isotopes based on CS2CI+ by thermal ionization mass spectrometry. Anal.
Lett., 28, 1295-1304.
Xiao, Y. K., Wei, H. Z., Zhou, Y. M., Wang, Y. H. and Liu, W. G. (2000)
Investigation of characteristics of non-reductive thermal ion emission of
various graphites in thermal ionization mass spectrometry. Anal Chim Acta,
420, 95-101.
Yaguchi, K., Watanabe, S., Hirata, 1., Itoh, T. and Hamada, A. (1991)
Degradation of tetrachloroethylene by an anaerobic bacterium from soil.
Suishituodakukenkyu, 14, 479-486 Gn Japanese with English abstract).
Yaguchi, K., Suzuki, T., Hirata, I., Itoh, T. and Hamada, A. (1994) Biological and
chemical characterization of the tetrachloroethylene-degrading bacterium,
strain T. Jpn. J Toxicol. Environ. Health, 40, 178-1184 Gn Japanese with
English abstract).
Yokouchi, Y., Nojiri, Y., Barrie, L. A., Toom-Sauntry, D., Machida, T., lnuzuka, Y.,
139

Akimoto, H., Li, H. -J., Fujinuma, Y. and Aoki, S. (2000) A strong source of
methyl chloride to the atmosphere from tropical coastal land. Nature, 403,
295-298.
Yoshida, N. and Toyoda, S. (2000) Constraining the atmospheric N20 budget from
intramolecular site preference in N20 isotopomers. Nature, 405, 330-334.
Zolensky, M. E., Bodnar, R. J., Gibson Jr., E. K., Nyquist, L. E., Reese, Y, Shih,
C-Y. and Wiesmann, H. (1999) Asteroidal water within fluid
inclusion-bearing halite in an H5 chondrite, Monahans (1998). Science, 285,
1377-1379.
140