Embed Size (px)
Citation preview
1
������������� �������������
Dave Sauchyn (Prairie Adaptation Research Collaborative)Elaine Barrow (Adjunct Professor, University of Regina)Ron Hopkinson (Meteorological Service of Canada)Peter Leavitt (University of Regina)
Drifting Soil near Oyen, Alberta, May 2002
�������������� �� ��� ���������������� ��� ���� �� ������
����������������� ������������������������������� �����������������������������������
��������������������������������������� ���
���������
2
This study was managed by the Prairie AdaptationResearch Collaborative (PARC). Funding wasprovided by the Natural Sciences and EngineeringResearch Council, and PARC. PARC is aninterdisciplinary research network established toaddress the potential impacts of climate change on theCanadian Prairie Provinces and to develop appropriateadaptation strategies. PARC also funds andcoordinates the training of personnel in climate changeadaptation research.
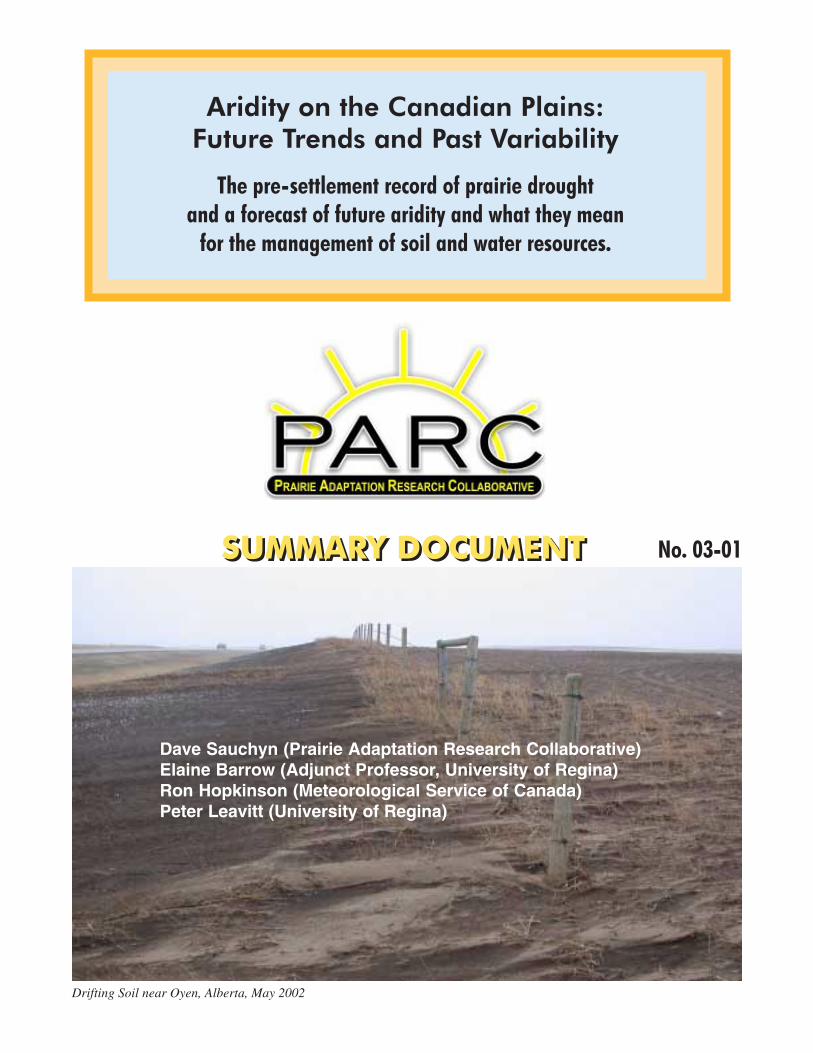
Stranded Stream Gauge near Outlook, Saskatchewan, May, 2002
For further information on this project and otherresearch managed by PARC, visit www.parc.ca.
Any comments or questions related to this reportshould be sent to the first author:[email protected].
General e-mail for PARC: [email protected]: 306-337-2300;Fax: 306-337-2301Website: www.parc.ca
3
������ �
The Prairie Ecozone is the only major region of Canadawhere drought is a natural hazard. Management of prai-rie ecosystems and soil landscapes therefore requires anunderstanding of past variability and future trends in re-gional aridity. We used instrumental and paleoclimaticrecords to define a baseline for prairie aridity, to evalu-ate the utility of modern climate normals (i.e. 1961-1990)as a benchmark for future climatic change, and to pro-vide a historical context for a range of forecasts of re-gional aridity from Global Climate Models (GCMs). TheCanadian GCM forecasts the least increase in precipita-tion and the largest increase in temperature and there-fore, by the 2050s, an approximately 50% increase inthe area of subhumid climate, and semiarid climate overa significant area, where previously the climate was onlysubhumid. Tree rings and lake salinity inferred from dia-tom assemblages record prolonged arid events and showthat modern climate normals are not representative ofthe full range of potential climatic conditions, even inthe absence of global warming. The climate of the 20th
century was anomalous in terms of the absence of sus-tained drought and the climate normal period of 1961-1990 may have been among the most benign of the past750 years. Because both lake and tree-ring analyses re-corded an abrupt amelioration of climatic conditions nearthe start of the instrumental record, we suggest that theimmediate impacts of future global warming may be toreturn the prairie environment to past conditions in whichpersistent aridity was recorded for intervals of decadesor longer.
��!�"#$� ��
In southern Canada, the largest rise in mean surface tem-perature from increased CO
2 will occur in the western
interior, according to the Canadian Centre for ClimateModelling and Analysis (Boer et al., 2000). The Cana-dian Global Climate Model (GCM) forecasts an increasein winter precipitation for this region, with decreased netsoil moisture and water resources in summer, and morefrequent extreme climate anomalies, including drought.In general, natural systems react to short-term climatevariability and to extreme events before they respond togradual changes in mean conditions. Extreme andanomalous climate can exceed the coping capacity ofnatural systems and the design parameters of engineeredstructures. When climate exceeds these thresholds, theimpacts of climate can be severe.
Unfortunately, the long-term forecasting of precipitationis difficult, especially for dry environments, where pre-cipitation is variable and occasionally extreme (Hunteret al., 2002). Semiarid ecosystems and soil landscapes
are sensitive to fluctuations in the surface and soil waterbalances. Sustained periods of low precipitation and soilmoisture lower the resistance to disturbance such as fireor erosion and the recovery of natural systems can takedecades or centuries. In southwestern Saskatchewan,sand dunes have been active since about 1800, follow-ing severe droughts of the 1790’s known from tree-ringrecords (Wolfe et al., 2001).
Because aridity is closely linked to soil erosion and landdegradation, future management of prairie ecosystemsand soil landscapes will require an improved understand-ing of past and future trends and variability in regionalaridity. Land use can have greater impact on soil land-scapes than climate change; forest and farm managementpractices enable adaptation to climate change. Any ex-pansion of agriculture into the currently forested mar-gins of the southern prairies will require assessment ofthe sensitivity of these soil landscapes to both climatechange and an altered vegetation cover. To address theseissues, we used instrumental and paleoclimatic recordsto define regional baseline aridity for the grasslandecoregions (Figure 1). The proxy and instrumental cli-mate data were compared to a range of climate changescenarios for the next 80 years to evaluate the usefulnessof historical climate reconstructions as analogs for fu-ture climate change.
"%& � �'�(�"�)(�� �'�(! " ��
Aridity is simply a lack of moisture expressed in termsof mean annual precipitation and potentialevapotranspiration as a ratio (P/PET) or deficit (P-PET).P/PET, the Aridity Index (AI), is the basis for classify-ing drylands as hyperarid (< 0.05), arid (0.05 = AI <0.2), semiarid (0.2 = AI < 0.5) and dry subhumid (0.5 =AI < 0.65) and for identifying land at risk ofdesertification, “land degradation in arid, semiarid and
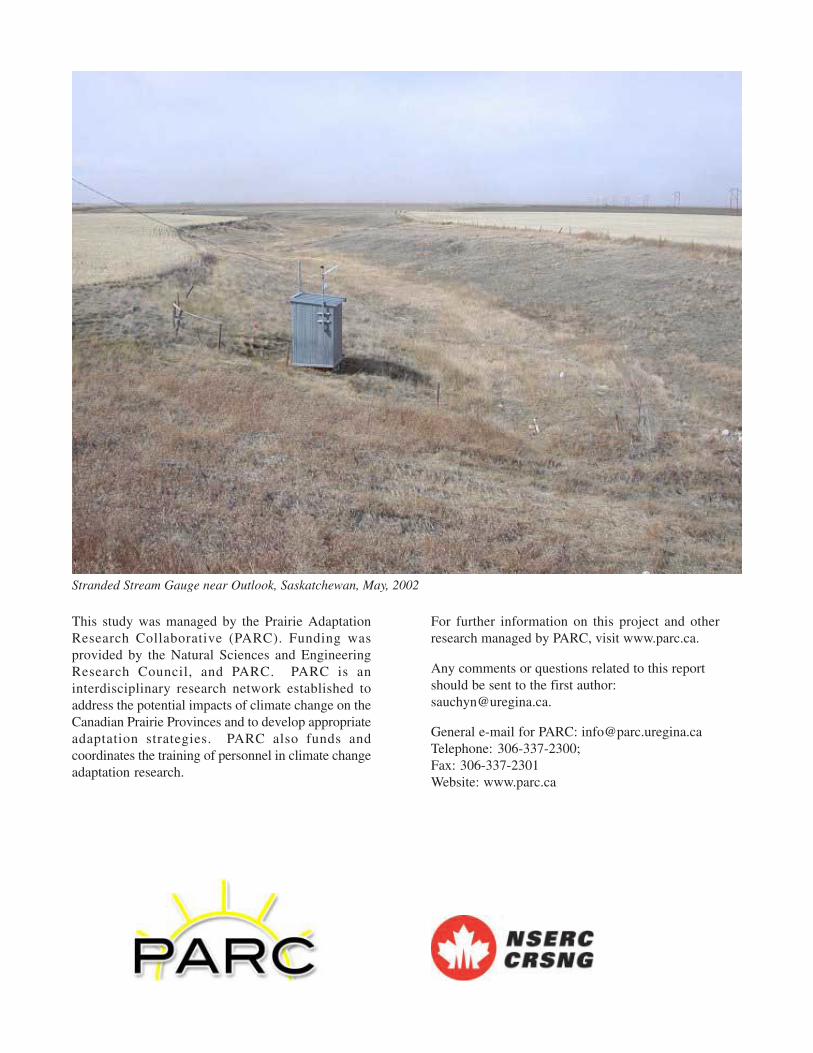
Rainfall over the Hand Hills, Alberta
4
dry subhumid areas resulting mainly from adverse hu-man impact” (Middleton and Thomas, 1992). We esti-mated PET from the widely used Thornthwaite formula(Dunne and Leopold, 1978), which uses temperature asthe sole measure of the energy available forevapotranspiration. Monthly PET calculated must beadjusted using a correction factor for daylength accord-ing to latitude and month. We used Thornthwaite PETbecause it works best in mid-latitude continental climateswhere air temperature is strongly correlated with net ra-diation and because more complex formulas require netradiation and wind data which are available for few sta-tions in the Prairie Provinces.
To map recent and future aridity we first loaded a griddeddatabase of historical climate observations into a geo-graphic information system (GIS). This database of meanmonthly temperature and total precipitation was derivedfrom all of the available monthly climate data in the Ca-nadian Climate Archive for the Prairie Provinces and thesurrounding climate regions. An interpolation procedurewas used to calculate aridity at each intersection on a 50km grid. These values should be viewed as representa-tive of the region within 25 km of the grid point, althoughthe gridded analysis cannot reproduce the high spatialvariability associated with precipitation events. Furtherinformation on the database and interpolation procedure
is available at http://www.cics.uvic.ca/climate/data.htm.Because mapping the aridity index on a 50 km grid pro-duced jagged boundaries between categories of aridity(e.g. dry subhumid), the aridity data were was furtherinterpolated to a 5 km grid to smooth the boundaries be-tween maps units. The map units were defined using thelegend in Figure 2.
Scenarios of future climate change were applied to the50 km grid of baseline (1961-1990) temperature andprecipitation to produce maps of future aridity centeredon the 2020s, 2050s and 2080s. The IntergovernmentalPanel on Climate Change strongly recommends the useof more than one GCM for any assessment of climateimpacts. They also recommend that the selected GCMsshow a range of changes in the key climate variables forthe study region. In a recent study of climate changeimpacts on the island forests of the northern Great Plains,Henderson et al. (2002) thoroughly analyzed the avail-able GCM scenarios and chose three that captured therange of annual temperature and precipitation changesprojected for the region. Given the very similar scenariorequirements of this recent study and the forecasting offuture aridity attempted here, we accepted the conclu-sions reached by Henderson et al. (2002) and used thesame climate change experiments. They are listed inTable 1. HadCM3 B21 forecasts the least increase in
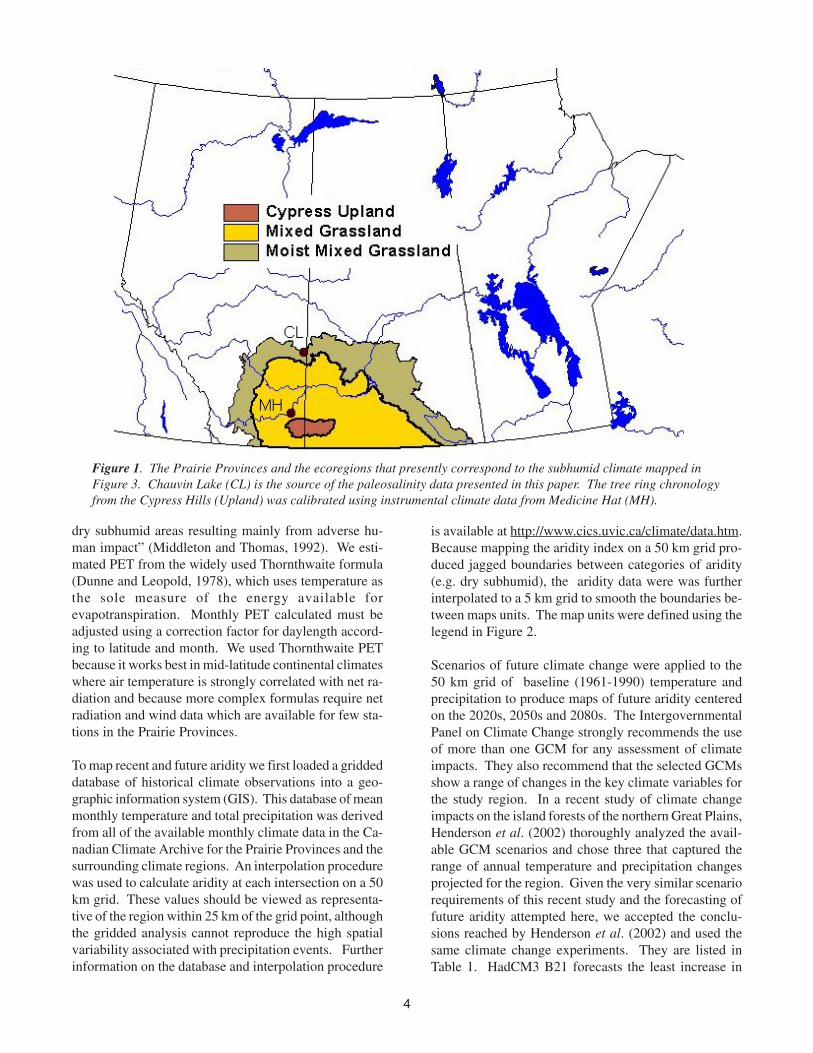
Figure 1. The Prairie Provinces and the ecoregions that presently correspond to the subhumid climate mapped inFigure 3. Chauvin Lake (CL) is the source of the paleosalinity data presented in this paper. The tree ring chronologyfrom the Cypress Hills (Upland) was calibrated using instrumental climate data from Medicine Hat (MH).
5
climate record and validated by comparing predicted andobserved aridity for the other half of the climate record.Then the calibration/validation periods were reversed andthe model was calibrated and validated again. The finalpredictive model was calibrated using the full length ofthe instrumental record.
The analysis of aerial photographs shows that the size ofsmall prairie lakes varies with historical changes in pre-cipitation. As climate warms or dries, lakes become morechemically concentrated, leading to marked changes inthe aquatic biota. Analysis of past changes in lake waterchemistry demonstrates that salinity accurately recordsthe occurrence of major drought events (Laird et al. 1996),with elevated salinity representing the dry conditions.
temperature and greatest increase in precipitation.CGCM2 A21 forecasts the smallest change in precipita-tion and the largest increase in temperature. CSIROMk2bB11 is a mid-range scenario.
!%$����!#$� �'��(���(! " ��
We derived detailed records of past aridity from lakesediments and tree rings. The tree rings are fromlodgepole pine (Pinus contorta) in the Cypress Hills ofsouthwestern Saskatchewan and southeastern Alberta(Figure 1). Standard procedures (Cook and Kairiukstis,1990) were used to process the tree cores and disks,measure ring width to within .001 mm, assign the cor-rect calendar year to each tree ring, and derive standard-ized ring widths (a residual index chronology) from theraw ring-width data. The reconstruction of June-July(P/PET) was based on the significant statistical relation-ship (r = 0.452; p < 0.05) between standardized residualring width and P/PET for Medicine Hat, Alberta for theperiod 1900-1999. A tree-ring model of June-July arid-ity was calibrated using the first half of the instrumental
Modelling Centre Model Emission Scenario1
U.K. Hadley Centre for Climate Prediction and Research
HadCM3 A21
Canadian Centre for Climate Modelling and Analysis
CGCM2 B21
Australian Commonwealth Scientific and Industrial Research Organization
CSIROMk2b B11
1 Special Report on Emission Scenarios (SRES) emission scenarios (Nakicenovic, 2000).
Table 1. The climate change experiments (from Henderson et al., 2002)used for the forecasting of future aridity.
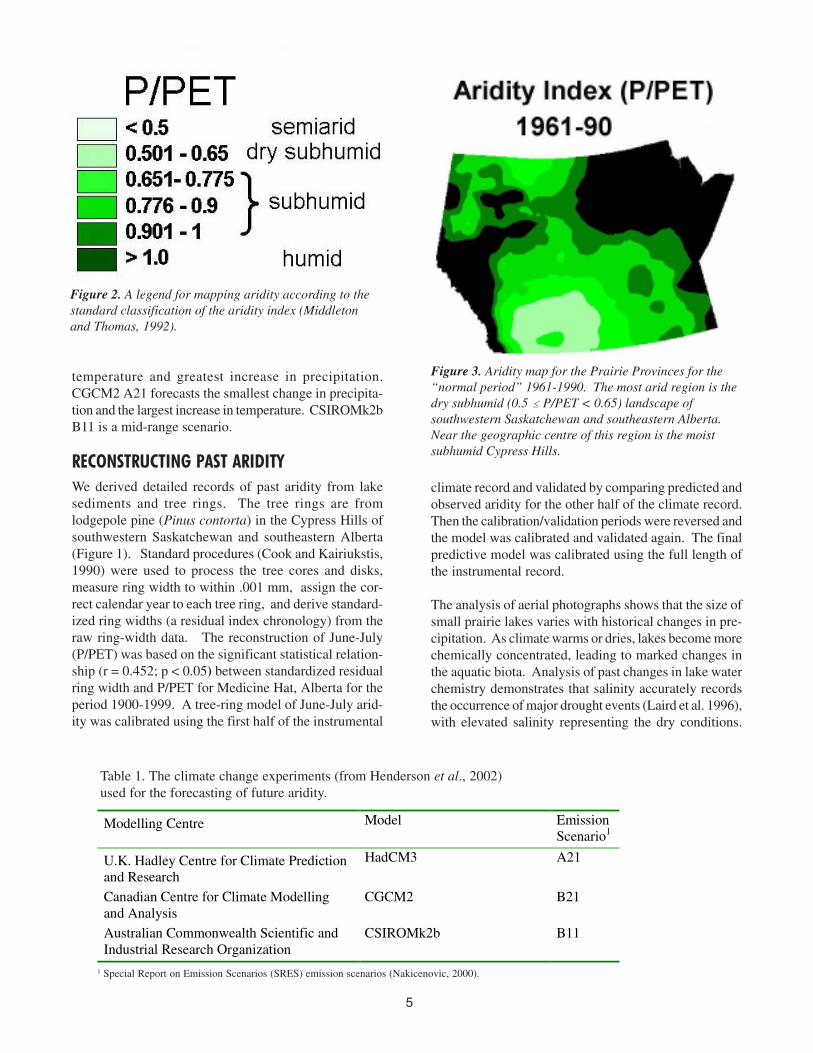
Figure 2. A legend for mapping aridity according to thestandard classification of the aridity index (Middletonand Thomas, 1992).
Figure 3. Aridity map for the Prairie Provinces for the“normal period” 1961-1990. The most arid region is thedry subhumid (0.5 � P/PET < 0.65) landscape ofsouthwestern Saskatchewan and southeastern Alberta.Near the geographic centre of this region is the moistsubhumid Cypress Hills.
6
Lake sediments cores were collected from Chauvin Lake,Alberta (Figure 1) using standard piston-coring proceduresand sediments were cut into 2.5 mm intervals equivalentto an average of 1-3 years of lake history. Fossil diatomswere isolated, identified to species and quantified for al-ternate sediment levels, and changes in species composi-tion were used in published inference models (Wilson etal. 1996) to reconstruct past changes in lake water salinityat intervals of 3-5 years. Sediment age was determined byanalysis of naturally-occurring radioisotopes in recent bulksediments (210Pb) and individual plant macrofossils (AMS
14C). Diatom-inferred changes in lake salinity were com-pared to instrumental climate records from 1910 to 1990to evaluate the ability of fossil reconstructions to inferchanges in aridity. PET data were filtered using three-year running mean to match the temporal resolution of thefossil time series. All time series were detrended by linearregression, and residual curves compared using correla-tion analysis. Lags of 1-5 years are applied to fossil datato evaluate the possibility of delayed hydrologic responseto climatic forcing functions.
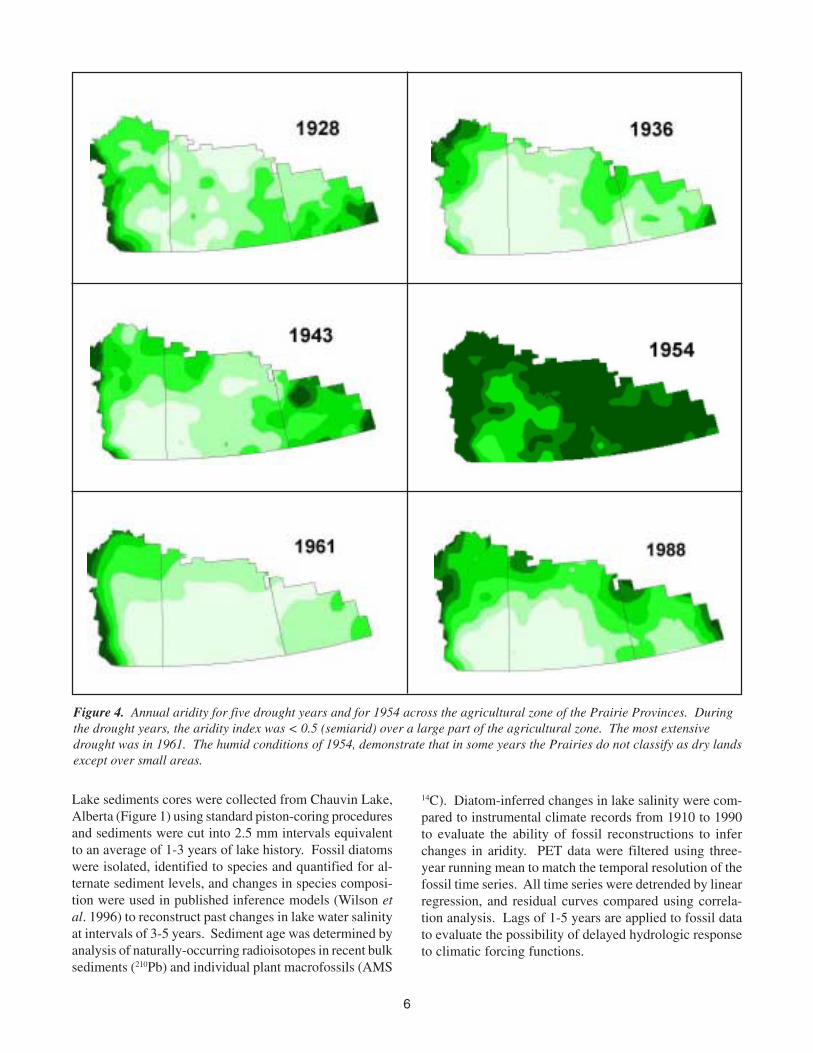
Figure 4. Annual aridity for five drought years and for 1954 across the agricultural zone of the Prairie Provinces. Duringthe drought years, the aridity index was < 0.5 (semiarid) over a large part of the agricultural zone. The most extensivedrought was in 1961. The humid conditions of 1954, demonstrate that in some years the Prairies do not classify as dry landsexcept over small areas.
7
&#�#!%��!%�"�
Future climate is expressed as change relative to a base-line climate. A map of baseline (i.e. 1961-1990) aridityfor the Prairie Provinces (Figure 3) illustrates that, at 50km resolution, the “normal” climate of the Prairie Prov-inces cannot be described as semiarid anywhere (P/PET< 0.5), even though this terminology is often used to de-scribe the southern Prairies. The driest region, the drysubhumid (0.5 < P/PET < 0.65) landscape of southwest-ern Saskatchewan and southeastern Alberta, corresponds
to the mixed grass prairie ecoregion. An analysis of thelongest instrumental record (Medicine Hat, AB) in thisarea shows that annual P/PET varied from 0.34 (1943)to 1.24 (1927), with 26 years of semiarid conditions (AI< 0.5). On average, these dry events occurred approxi-mately every fifth year, although only eight semiarid yearswere seen after 1950.
With the large variation in annual climate at each loca-tion, there is corresponding variation in the geographicextent of aridity from year to year. Each historical drought
CGCM2 CSIROMk2b HadCM3
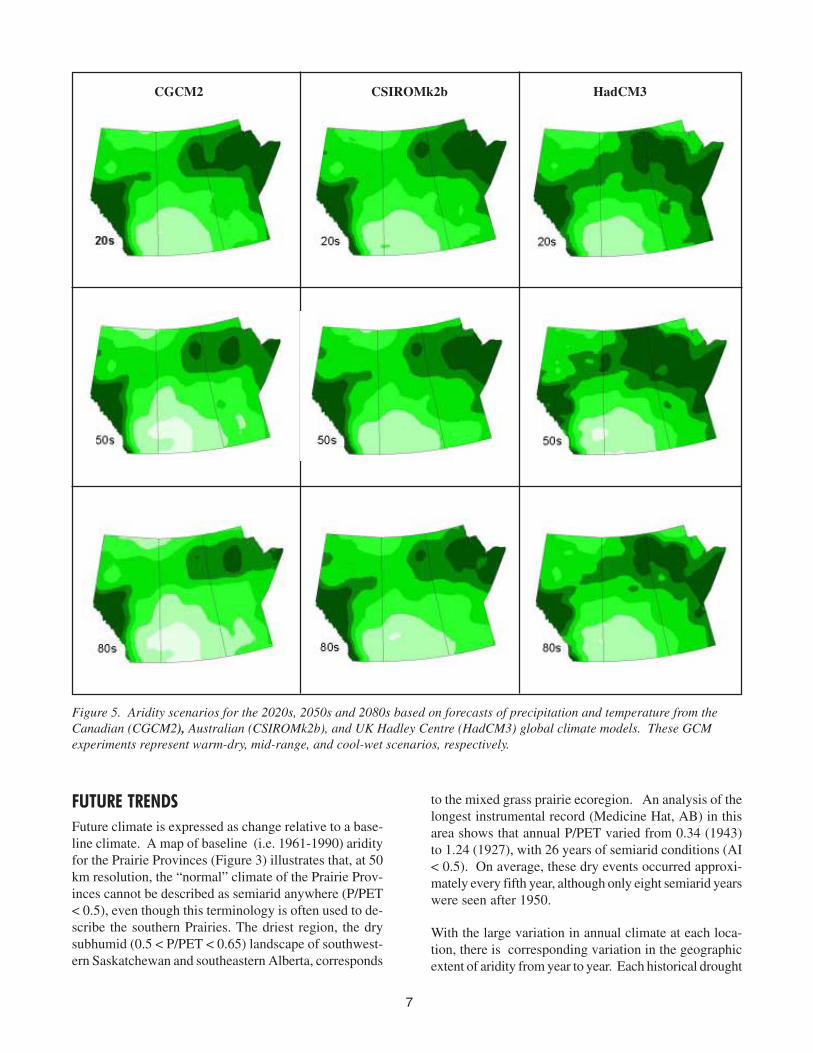
Figure 5. Aridity scenarios for the 2020s, 2050s and 2080s based on forecasts of precipitation and temperature from theCanadian (CGCM2), Australian (CSIROMk2b), and UK Hadley Centre (HadCM3) global climate models. These GCMexperiments represent warm-dry, mid-range, and cool-wet scenarios, respectively.

8
had a unique geographic extent and intensity, althoughsemiarid conditions were consistently recorded in south-eastern Alberta and southwestern Saskatchewan (Figure4). The “normal” dry subhumid climate of this regionreflects the relative high frequency of below average pre-cipitation and low P/PET. The most extensive drought
was in 1961. The humid conditions of 1954 demonstratethat in some years the prairies do not classify as dry lands(P/PET < 0.65) except over small areas.
Scenarios of future aridity centered on the 2020s, 2050sand 2080s are mapped for the Prairie Provinces in Fig-ure 5 for the CGCM2 A21 (warm-dry), CSIROMk2b B11(mid-range), HadCM3 B21 (cool-wet) climate changescenarios. Under the CGCM2 A21 scenario, a small areacharacterized by a semiarid climate (P/PET < 0.5) ap-pears in western Saskatchewan by the 2020s and expandssignificantly by the 2050s. In contrast, forecasts usingthe CSIROMk2b B11 mid-range scenario suggest thatperpetually semiarid conditions will be evident only by2080, although a dry subhumid climate will extend intosouthwestern Manitoba. The HadCM3 B21 scenarioindicates the least climate change, with a marginal in-crease in the area of subhumid climate and maximumaridity in mid century. Taken together, these forecastssuggest a general increase in the geographic extent ofdry conditions, with possible risks of desertification inthe more extreme scenarios (CGCM2 A21).
Figure 6. Proxy summer aridity for Medicine Hat, Alberta as reconstructed from residual index tree ring chronology fromPinus contorta from the Cypress Hills. The red fill highlights prolonged summer droughts of the 18th and 19th centuries.
Windmill for drawing water, southwestern Saskatchewan
9
�(���*(! (+ , ��
The reconstruction of summer aridity for 1723-2000 (Fig-ure 6) revealed that events of high aridity occurred regu-larly during the past 3 centuries, with major droughtsindicated for 1768-1782 and the 1786-1796 and 1851-1864. The aridity (P/PET) signal in the tree rings mostlyreflects variability in precipitation, because ThornthwaitePET is a function of temperature and heat has both posi-tive and negative affects on tree growth, depending onair temperature and soil moisture conditions. Not onlyis the response to precipitation direct and unambiguous,but amounts of rain and snow are much more variablefrom year to year than mean temperature and in turnevapotranspiration.
In this proxy aridity record, the mean interannual vari-ance (as standard deviation) was greater during the in-strumental period (post-1884; SD = 0.080) than in thepreceding period (1723-1883; SD = 0.063). This promi-nent increase in inter-annual variability may be relatedto a mid 19th century shift in the Pacific Decadal Oscilla-
tion (D’Arrigo et al., 2001). The consecutive years ofsummer aridity highlighted in Figure 6 are further evi-dence of prolonged aridity prior to Euro-Canadian set-tlement of the western Canadian plains and the instru-mental observation of climate. The impacts of these
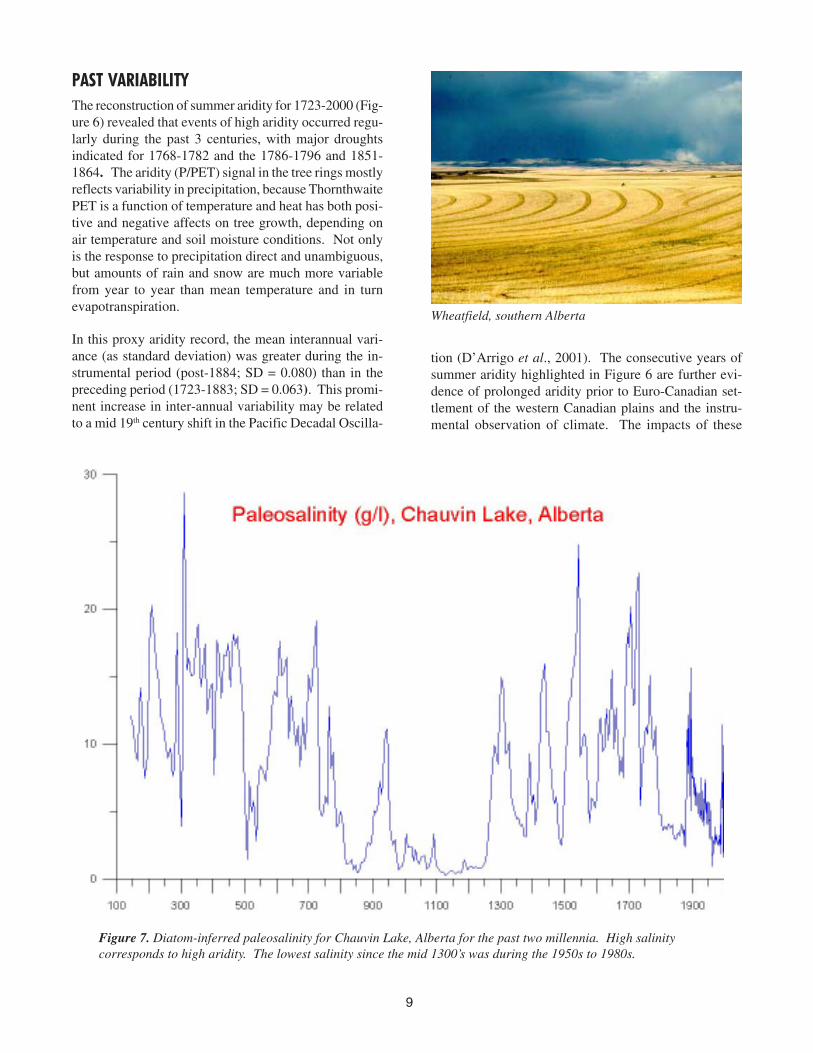
Figure 7. Diatom-inferred paleosalinity for Chauvin Lake, Alberta for the past two millennia. High salinitycorresponds to high aridity. The lowest salinity since the mid 1300’s was during the 1950s to 1980s.
Wheatfield, southern Alberta
10
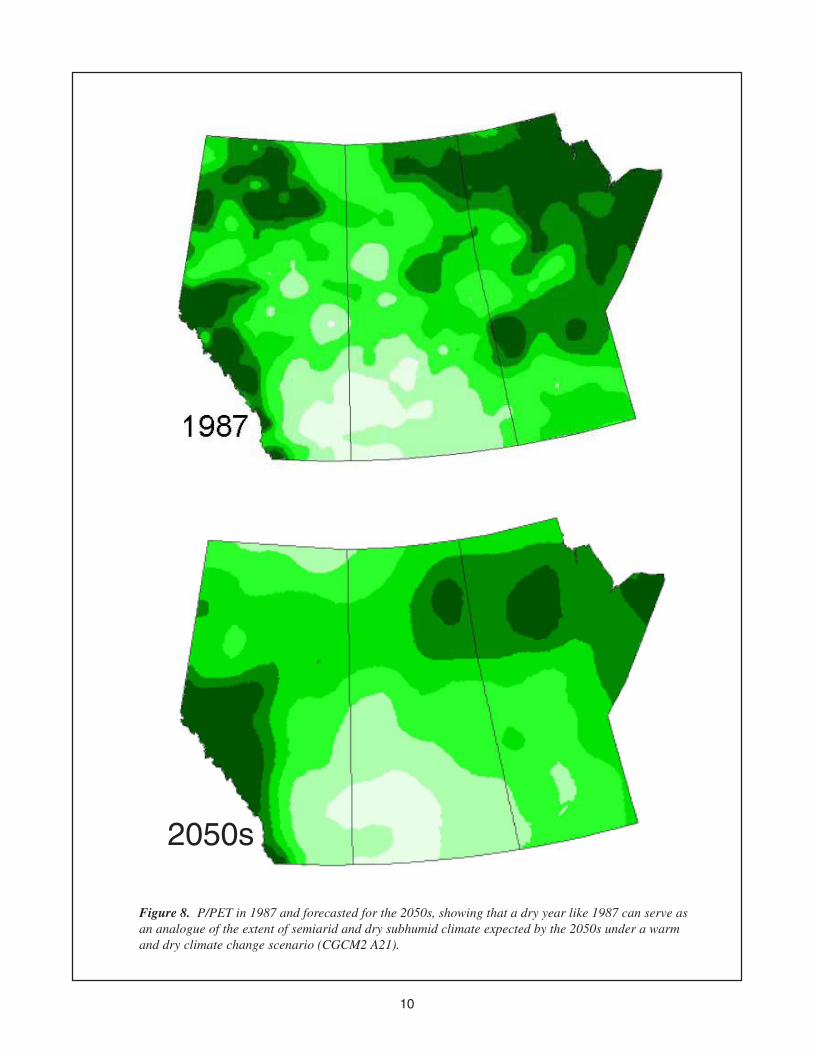
Figure 8. P/PET in 1987 and forecasted for the 2050s, showing that a dry year like 1987 can serve asan analogue of the extent of semiarid and dry subhumid climate expected by the 2050s under a warmand dry climate change scenario (CGCM2 A21).
2050s
11
droughts are described in Wolfe et al. (2001). Their rel-evance here is as possible analogues of anomalous pre-cipitation expected with global warming in contrast tothe climate of the 20th century, and particularly 1961-1990, the basis for our definition of the normal climate.
Paleoclimatic reconstructions based on the 2000-yearsalinity record from Chauvin Lake, AB, also suggest thatpast drought severity was greater than that recorded dur-ing the instrumental period. Detrended lake salinity data,inferred from the fossil diatoms, was significantly (p <0.05) and positively correlated with PET during 1910-1990. Correlations were also positive and significant atlags of one or two years. Using these observations, andthe drought of 1988-89 as a benchmark, analysis of pastsalinities reveals that climatic conditions were continu-ously dry during the 4th to 8th centuries and regularly aridduring 1300-1750 (Figure 7). Severe events were alsorecorded during 1860-1890, an interval of broadscaledroughts in central North America. Salinities declinedsubstantially during the 20th century, reaching valuesduring the 1960s and 1970s that were the lowest of thepast 750 years.
)�, $(� ����&�!��� ,-�.(�%!�(�"*%'%�(� ���)(�('%)%��
Analysis of climate normals (1961-1990) reveals that alarge part of the southern Canadian Plains usually has adry subhumid climate, although P/PET was rarely < 0.5(semiarid) when analyzed on a 50x50 km grid. There is ahigh degree of spatial variability such that any given sitecould experience a wide range of climate, from semiarid(P/PET< 0.5) to humid conditions (> 1.0). Such high vari-ability is also evident on longer timescales, as recordedboth from tree-ring (Figure 6) and lake sediment (Figure7) reconstructions. These same records demonstrate thatmore prolonged, intensely arid events were common inthe past. The modern climate normals (1961-90) are notrepresentative of the full range of potential climatic con-ditions, even in the absence of global warming.
The increasing aridity projected by the GCM scenariosrepresents a higher frequency of dry years over a largerarea. As a result of an increase in mean annual tempera-ture and, in turn, potential evapotranspiration, with eventhe coolest and wettest climate change scenario, there isa marginal increase in the area of subhumid climate inthe Prairie Provinces by the 2080s. The Canadian GCMforecasts the least increase in precipitation and the larg-est increase in temperature and therefore an approxi-mately 50% increase in the area of subhumid climateand a significant area of semiarid climate by the 2050s.
Past droughts may provide important benchmarks toevaluate potential impacts of increasing aridity forecastby GCMs. For example, comparison of climatic condi-tions observed in the pre-drought year 1987 shows amarked similarity to the average conditions forecast bythe CGCM2 A21 scenario for 2050, in terms of the geo-graphic extent of semiarid and dry subhumid climate(Figure 8). Dry conditions during 1987 are viewed aspartly responsible for establishing more extensivedroughts during 1988-1989 (Figure 4) and suggest thatfuture increases in aridity may produce conditions thatfavour the regular development of large-scale droughts.
The implication of more frequent and widespreaddroughts is that they place a larger area at risk of cropfailure, water shortages and desertification more oftenunless there are counteracting management strategies.The critical variable will be the duration of the semiaridconditions in any given area. The scenario of increasedclimate extremes includes unusually wet years duringwhich social and biophysical systems will recover fromdrought. If aridity is prolonged, however, the resistanceof systems could drop below critical thresholds, such thatthey will not recover during the next wet year.
Drought adaptation strategies must acknowledge thepotential for prolonged drought. Improved drought riskmanagement supports effective responses to impendingdrought, reducing the cost of drought over the long termthrough planning and preparedness. This contrasts withthe costly and untimely short-term solutions that resultfrom the ad hoc response to an existing drought crisis.A policy framework to minimize the adverse impacts ofdrought and increasing aridity under climate change mustsupport adaptation of soil and water management prac-tices to climatic variability that exceeds the experiencefrom the non-aboriginal history of the Canadian plains.
Our analysis of climatic proxies suggests that the climateof the 20th century was anomalous in terms of the absenceof sustained drought. Furthermore, comparison of instru-mental records and climatic reconstructions suggests thatthe climate normal period of 1961-1990 may have beenamong the most benign of the past 750 years. Possibly,the climate of the period 1921-1950 is more characteristicof the past and future climate of the Prairie Provinces thanthe “normal” climate of 1961-1990. Because both lakeand tree-ring analyses recorded an abrupt amelioration ofclimatic conditions at near the start of the instrumentalrecord, we suggest that the immediate impacts of futureglobal warming may be to return the prairie environmentto past conditions in which persistent aridity was recordedfor intervals of decades or longer.
12
($/��.,%"')%���
The results presented here are the product of researchfunded by NSERC, PARC and CFCAS. We thankSam Kennedy and Brent Joss for compilation of themaps; Antoine Beriault, Jennifer Stroich and JulieFrischke for processing of the tree-ring data; SybilleWunsam for diatom enumeration, Jim Rusak fordiatom data management, and Brian Cumming forsalinity reconstructions.
!%&%!%�$%�
Boer, G.J., G. Flato and D. Ramsden. 2000. A transientclimate change simulation with greenhouse gas andaerosol forcing: projected climate for the 21st century.Climate Dynamics, 16: 427-450.
Cook E.R.& Kairiukstis L.A. (eds.) 1990. Methods ofDendrochronology - Applications in the EnvironmentalSciences. Dordrecht, The Netherlands: Kluwer Aca-demic Publishers, 394 pp.
D’Arrigo, R.; Villalba, R.; Wiles, G. 2001. Tree-ringestimates of Pacific decadal climate variability. Cli-mate Dynamics 18(3-4): 219-224.
Dunne, T and Leopold, L.B. 1978. Water in Environ-mental Planning. W.H. Freeman, San Francisco.
Henderson,N., Hogg, E., Barrow, E., and Dolter, B.2002. Cliamtic Change Impacts on the island forests ofthe Great Plains and the implications for nature conser-vation policy. Report to the Prairie Adaptation Re-search Collaborative, August, 2002.
Hunter, F.G., Donald, D.B., Johnson, B.N., Hyde,W.D., Hanesiak, J.M., Kellerhals, M.O.B., Hopkinson,R.F., and Oegema, B.W. 2002. The Vanguard Torren-tial Storm (Meteorology and Hydrology). CanadianWater Resources Journal, 27(2): 213-228.
Liard, K.R., Fritz, S.C., Maasch, K.A,, and Cumming,B.F. 1996. Greater drought intensity and frequencybefore AD 1200 in the northern Great Plains, USA.Nature, 384:552-54.
Middelton, N. and Thomas, D.S.G. 1992, World Atlasof Desertification. United Nations EnvironmentProgram, Edward Arnold, London, 69 pp.
Nakicenovic, N. et al., 2000. IPCC Special Report onEmission Scenarios Cambridge University Press,Cambridge.
Wilson, S., Cumming, B., and Smol, J.P. 1996. Assess-ing the reliability of salinity inference models fromdiatom assemblages: An examination of a 219 lakedataset from western North America. Can. J. Fish. Aq.Sci. 53: 1580-1594.
Wolfe, S.A., Huntley, D.J., David, P.P., Ollerhead, J.,Sauchyn, D.J. and Macdonald, G.M. 2001. Late 18thcentury drought-induced sand dune activity, GreatSand Hills, southwestern Saskatchewan. CanadianJournal of Earth Sciences, 38(1): 105-117.
�0����$!%" �
Dave Sauchyn
Killdeer badlands, Grasslands National Park