Embed Size (px)
Citation preview

Marius Pedersen A/S
ANNUAL REPORT 2016
MARIUS PEDERSEN A/S ØRBÆKVEJ 851
5863 FERRITSLEV, FYN
CENTRAL BUSINESS REGISTRATION NO. 49 97 95 17
The annual general meeting approved the annual report on / 2017
Chairman

Contents
Marius Pedersen A/S – Annual report 2016 1
02 Company Details
03 Statement by Management on the Annual Report
04 Independent Auditor's Report
06 Management Commentary
08 Accounting Policies
12 Statement of Income 2016
13 Balance Sheet at 31.12.2016
14 Statement of Changes in Equity
15 Notes

Company Details
Marius Pedersen A/S – Annual report 2016 2
Company
Marius Pedersen A/S, Ørbækvej 851, 5863 Ferritslev, Fyn
Central Business Registration No.: 49 97 95 17
Registered in: Faaborg-Midtfyn
Phone: +45 63 909 909
Fax: +45 63 909 910
Homepage: www.mariuspedersen.dk
E-mail: [email protected]
Board of Directors
Finn Junge Andersen, Chairman
Peter Schak Larsen, Deputy Chairman
Søren Klarskov Vilby
Birgit Elin Munck-Kampmann
Jens Flesner Kristiansen
Kirsten Almosetoft Kildegaard*
Henrik Jørgensen*
Michael Kenneth Andersen*
* Elected by the employees
Executive Board
Christian Ørum Madsen, CEO
Simon Hovgaard Clausen
Jeanett Halling Vikkelsøe
Company auditors
Deloitte Statsautoriseret Revisionspartnerselskab

Statement by Management on the Annual Report
Marius Pedersen A/S – Annual report 2016 3
The Board of Directors and the Executive Board have today considered and approved the annual report of Marius Pedersen A/S for the financial year 1 January - 31 December 2016.
The annual report is presented in accordance with the Danish Financial Statements Act.
In our opinion, the financial statements give a true and fair view of the Company’s financial position at 31.12.2016 and of the
results of its operations for the financial year 1 January - 31 December 2016.
In our opinion, the management commentary contains a fair review of the affairs and conditions referred to therein.
We recommend the annual report for adoption at the Annual General Meeting.
Ferritslev, 29 May 2017
Executive Board
Christian Ørum Madsen CEO
Simon Hovgaard Clausen
Jeanett Halling Vikkelsøe
Board of directors
Finn Junge Andersen Chairman
Peter Schak Larsen Deputy Chairman
Søren Klarskov Vilby
Birgit Elin Munck-Kampmann Jens Flesner Kristiansen
Kirsten Almosetoft Kildegaard
Henrik Jørgensen Michael Kenneth Andersen

Independent Auditor's Report
Marius Pedersen A/S – Annual report 2016 4
To the shareholders of Marius Pedersen A/S
Opinion We have audited the financial statements of Marius Pedersen A/S for the financial year 01.01.2016 - 31.12.2016, which comprise the income statement, balance sheet, statement of changes in equity and notes, including a summary of significant accounting policies. The financial statements are prepared in accordance with the Danish Financial Statements Act.
In our opinion, the financial statements give a true and fair view of the Entity’s financial position at 31-12-2016 and of the results of its operations for the financial year 01.01.2016 - 31.12.2016 in accordance with the Danish Financial Statements Act.
Basis for opinion We conducted our audit in accordance with International Standards on Auditing (ISAs) and additional requirements applicable in Denmark. Our responsibilities under those standards and requirements are further described in the Auditor’s responsibilities for the audit of the financial statements section of this auditor’s report. We are independent of the Entity in accordance with the International Ethics Standards Board of Accountants' Code of Ethics for Professional Accountants (IESBA Code) and the additional requirements applicable in Denmark, and we have fulfilled our other ethical responsibilities in accordance with these requirements. We believe that the audit evidence we have obtained is sufficient and appropriate to provide a basis for our opinion.
Management's responsibilities for the financial sta tements Management is responsible for the preparation of financial statements that give a true and fair view in accordance with the Danish Financial Statements Act, and for such internal control as Management determines is necessary to enable the preparation of financial statements that are free from material misstatement, whether due to fraud or error.
In preparing the financial statements, Management is responsible for assessing the Entity’s ability to continue as a going concern, for disclosing, as applicable, matters related to going concern, and for using the going concern basis of accounting in preparing the financial statements unless Management either intends to liquidate the Entity or to cease operations, or has no realistic alternative but to do so.
Auditor's responsibilities for the audit of the fin ancial statements Our objectives are to obtain reasonable assurance about whether the financial statements as a whole are free from material misstatement, whether due to fraud or error, and to issue an auditor’s report that includes our opinion. Reasonable assurance is a high level of assurance, but is not a guarantee that an audit conducted in accordance with ISAs and the additional requirements applicable in Denmark will always detect a material misstatement when it exists. Misstatements can arise from fraud or error and are considered material if, individually or in the aggregate, they could reasonably be expected to influence the economic decisions of users taken on the basis of these financial statements.
As part of an audit conducted in accordance with ISAs and the additional requirements applicable in Denmark, we exercise professional judgement and maintain professional scepticism throughout the audit. We also:
• Identify and assess the risks of material misstatement of the financial statements, whether due to fraud or error, design and perform audit procedures responsive to those risks, and obtain audit evidence that is sufficient and appropriate to provide a basis for our opinion. The risk of not detecting a material misstatement resulting from fraud is higher than for one resulting from error, as fraud may involve collusion, forgery, intentional omissions, misrepresentations, or the override of internal control.
• Obtain an understanding of internal control relevant to the audit in order to design audit procedures that are appropriate in the circumstances, but not for the purpose of expressing an opinion on the effectiveness of the Entity’s internal control.
• Evaluate the appropriateness of accounting policies used and the reasonableness of accounting estimates and related disclosures made by Management.
• Conclude on the appropriateness of Management’s use of the going concern basis of accounting in preparing the financial statements, and, based on the audit evidence obtained, whether a material uncertainty exists related to events or conditions that may cast significant doubt on the Entity’s ability to continue as a going concern. If we conclude that a material uncertainty exists, we are required to draw attention in our auditor’s report to the related disclosures in the financial statements or, if such disclosures are inadequate, to modify our opinion. Our conclusions are based on the audit evidence obtained up to the date of our auditor’s report. However, future events or conditions may cause the Entity to cease to continue as a going concern.
• Evaluate the overall presentation, structure and content of the financial statements, including the disclosures in the notes, and whether the financial statements represent the underlying transactions and events in a manner that gives a true and fair view.
We communicate with those charged with governance regarding, among other matters, the planned scope and timing of the audit and significant audit findings, including any significant deficiencies in internal control that we identify during our audit.
Statement on the management commentary Management is responsible for the management commentary.
Our opinion on the financial statements does not cover the management commentary, and we do not express any form of assurance conclusion thereon.

Independent Auditor's Report
Marius Pedersen A/S – Annual report 2016 5
In connection with our audit of the financial statements, our responsibility is to read the management commentary and, in doing so, consider whether the management commentary is materially inconsistent with the financial statements or our knowledge obtained in the audit or otherwise appears to be materially misstated.
Moreover, it is our responsibility to consider whether the management commentary provides the information required under the Danish Financial Statements Act.
Based on the work we have performed, we conclude that the management commentary is in accordance with the financial statements and has been prepared in accordance with the requirements of the Danish Financial Statements Act. We did not identify any material misstatement of the management commentary.
Odense, 29-05-2017
Deloitte Statsautoriseret Revisionspartnerselskab
Business Registration No 33 96 35 56
Lars Leopold Larsen Ole Martin Hansen
State-Authorised State-Authorised
Public Accountant Public Accountant

Management Commentary
Marius Pedersen A/S – Annual report 2016 6
Key figures In thousands of DKK
2016 2015 2014 2013 2012
Revenue
1.039.854 1.005.277 1.049.470 1.027.072 1.024.814
Operating profit
68.784 43.662 44.000 32.743 77.375
Net financials
-2.617 -13.509 40 -9 -2.578
Profit/loss for the year
201.466 169.388 173.394 169.017 205.252
Equity
1.178.294 1.100.871 915.311 1.598.675 1.677.985
Balance Sheet total
1.879.356 1.849.133 1.748.502 1.811.622 1.973.144
Investments in tangible assets
ex. acquisition of group enterprises 126.369 82.595 87.800 98.828 83.828
Operating margin (%)
6,6 4,3 4,2 3,2 7,6
Return on investment (%)
6,3 4,2 4,6 3,4 7,6
Return on equity (%)
17,7 16,8 13,8 10,3 13,1
Equity ratio (%)
62,7 59,5 52,3 88,2 85,0
Primary activities We consider waste as a potential new resource.
We collect all types of waste, solid as liquid waste, from waste producers, and work constantly to be in control of as much as possible of the value adding chain of waste – from collecting waste to selling secondary resources – with respect of adding value to our customers and our owners.
Group activities include: • Sorting, treatment and handling a series of different
types of recyclable waste at our own sites. • Trading of recyclable waste. • Services concerning handling of waste and
recyclables from the client to final recycling, utilisation, or disposal – that is consulting, materiel for rent, transport service, sludge service, management reporting and other types of reporting for trade, industrial production, institutions, households and municipal recycling stations. In addition the Group executes contractor business and furthermore owns companies in Denmark, the Czech Republic and Slovakia primarily handling environmental activities.
Development in activities The waste and recycling market for Marius Pedersen A/S in Denmark is mature and competitive. The market is grounded on the waste management act from EU and Denmark. New business opportunities arise from changes in waste law and change in the focus or numbers of the market players.
During 2016 Marius Pedersen A/S has taken actions to improve result in several of our business lines on the Danish market. Among others we had focus on value adding sales activities in each business line, focus on productivity and efficiency and change of strategic focus from offering all services to offering the profitable services. Also we had focus on slimming the organization and cutting costs.
At the end of 2015 Marius Pedersen A/S acquired commercial and industrial customers from Miljøteam A/S, as well as contracts with municipality of Aarhus with effect from 1 January 2016. This year we have implemented acquired activities into existing activities and thereby we have achieved expected synergies.

Management Commentary
Marius Pedersen A/S – Annual report 2016 7
In the markets in Czech Republic and Slovakia the activities and volumes in 2016 have been stable and the development has been satisfactory. In Czech Republic Marius Pedersen a.s. acquired the activities from Becker Bohemia s.r.o. in October 2016.
Development in finances The company has chosen not to publish independent audited consolidated accounts. We refer to the consolidated accounts of MPWM 2014 A/S in which Marius Pedersen A/S is included.
Profit for the year is 201,5 MDKK which is an increase of 32,1 MDKK compared to 2015. Impact from net financials is 10,9 MDKK compared to 2015.
Operating profit is 68,8 MDKK in 2016 which is 25,1 MDKK higher than 2015.
Revenue is 1.039,9 MDKK in 2016 which is 34,6 MDKK higher than 2015.
Profit for the year coming from Danish activities as well as profit coming from activities abroad has been better than expected in budget for 2016.
Profit for the year is considered satisfactory.
Particular risks
Financial risks and interest risks The company has a financial policy which operates with a low risk profile. This means that currency, interest and credit risk only occur based on commercial conditions.
The company’s use of derivative financial instruments is regulated by a written policy approved by the board of directors and internal procedures which among other things set maximum amounts allowed and which derivative financial instrument that can be used.
Currency risks The company’s result from group enterprises is dependent on changes in exchange rates (CZK, EUR), due to the fact that the foreign group enterprises’ results and equity at the end of the year are being converted into Danish kroner based on the average rate and the rate of the balance sheet date.
Business risks The company’s most significant risks are linked to the ability of being strongly positioned on the activity areas on which the company’s services are directed. The company continuously invests in new materials to secure optimum utilisation and efficiency.
Environmental performance The company acts in accordance with current environmental and safety legislation which helps to create a healthy and safe environment.
The company continuously evaluates the total activities in order to constantly reduce the environmental impact. Business relations are also encouraged to choose systems or products that secure the highest possible amount of recycling or reduction in the use of natural resources.
The company has ISO-14001 certifications covering all environmental activities of the company. The company is also ISO-9001 certified.
In order to promote environmental and safety conscience in general the company is educating and creating awareness among its employees for them to take responsibility for environment, health and safety.
Research and development The company is continuously developing products and service concepts. These are charged to the profit and loss account.
Events after the balance sheet date To this date no events have occurred after the balance sheet date which influences the evaluation of this annual report.
Outlook The Company expects a positive development in the activities, revenue and result. In 2017 budget shows increase in revenue and result coming from Danish activities is expected to increase significant compared with 2016.
In first quarter of 2017 result coming from Danish activities is above budget and significant above result of first quarter 2016.
Statement concerning Corporate Social Responsibilit y Referring to § 99a of the Danish Financial Statements Act the company has not published an independent statement concerning Corporate Social Responsibility. The statement is included in the annual consolidated report of MPWM 2014 A/S.
Statement concerning gender composition in the top management body Referring to § 99b of the Danish Financial Statements Act the company has not published an independent statement concerning gender composition in the top management body. The statement is included in the annual consolidated report of MPWM 2014 A/S.

Accounting Policies
Marius Pedersen A/S – Annual report 2016 8
This annual report has been prepared in accordance with the provisions of the Danish Financial Statements Act governing reporting class C enterprises (large).
Referring to § 86 (4) of the Danish Financial Statements Act there has not been made any cash flow statement. The company’s cash flow is included in the cash flow statement of the consolidated annual accounts of MPWM 2014 A/S.
Referring to § 112 (1) of the Danish Financial Statements Act the company has chosen not to prepare consolidated annual accounts.
The accounting policies applied for these financial statements are consistent with those applied last year.
1. Recognition and measurement Assets are recognised in the balance sheet when it is probable as a result of a prior event that future economic benefits will flow to the Company, and the value of the asset can be measured reliably.
Liabilities are recognised in the balance sheet when the Company has a legal or constructive obligation as a result of a prior event, and it is probable that future economic benefits will flow out of the Company, and the value of the liability can be measured reliably.
On initial recognition, assets and liabilities are measured at cost. Measurement subsequent to initial recognition is effected as described below for each financial statement item.
Notes have been prepared according to the Danish Financial Statements Act.
Anticipated risks and losses that arise before the time of presentation of the annual report and that confirm or invalidate affairs and conditions existing at the balance sheet date are considered at recognition and measurement. Income is recognised in the income statement when earned, whereas costs are recognised by the amounts attributable to this financial year. Value adjustments of financial assets and liabilities are recorded in the income statement as financial income or financial expenses.
2. Foreign currency translation On initial recognition, foreign currency transactions are translated applying the exchange rate at the transaction date. Receivables, payables and other monetary items denominated in foreign currencies that have not been settled at the balance sheet date are translated using the exchange rate at the balance sheet date. Exchange differences that arise between the rate at the transaction date and the one in effect at the payment date or the rate at the balance sheet date are recognised in the income statement as financial income or financial expenses. Property, plant and equipment, intangible assets, inventories and other non-monetary assets that have been purchased in foreign currencies are translated using historical rates.
When recognising foreign group enterprises and associates that are independent entities, the income statements are translated at average exchange rates for the months that do not significantly deviate from the rates at the transaction date. Balance sheet items are translated using the exchange rates at the balance sheet date. Goodwill is considered as belonging to the independent foreign entity and is translated using the exchange rate at the balance sheet date. Exchange differences are recognised directly in equity, when arising out of the translation of foreign subsidiaries’ equity at the beginning of the year at the balance sheet date exchange rates as well as out of the translation of income statements from average rates to the exchange rates at the balance sheet date.
3. Statement of income
Revenue Revenue from the sale of services, manufactured goods and goods for resale is recognised in the income statement when delivery is made and risk has passed to the buyer. Revenue is recognised net of VAT, duties and sales discounts.
Contract work in progress is included in revenue based on the stage of completion so that revenue corresponds to the selling price of the work performed in the financial year (the percentage-of-completion method).
Production costs Production costs comprise direct and indirect costs incurred to earn revenue. In direct production costs materials, wages and operation of rolling fleet are included.
Other production costs comprise indirect costs including salaries and depreciation concerning the production of the year.
Production costs concerning contract work in progress are recognised as they incur.
Distribution costs Cost of sales comprises costs for sales staff, marketing expenses and depreciation.
Administrative costs Administrative costs comprise costs incurred for manage-ment and administration of the company, including costs for the administrative staff and management, stationery and office supplies as well as depreciation and amortisation.
Other operating income and expenses Other operating income and expenses comprise income and expenses of a secondary nature viewed in relation to the company’s primary activities.
Financial income and expenses Financial income and expenses comprise interest income and expenses, the interest portion of finance lease payments, realised and unrealised capital gains and loss on securities, payables and transactions in foreign currencies, amortisation premium or allowance on mortgage debt etc.
Accounting Policies
Marius Pedersen A/S – Annual report 2016 9
Taxation Tax for the year, which consists of current tax for the year and changes in deferred tax, is recognised in the income statement by the portion attributable to the profit for the year and recognised directly in equity by the portion attributable to entries directly in equity. The portion of the tax taken to the income statement, which relates to extraordinary profit/loss for the year, is allocated to this entry whereas the remaining portion is taken to the year’s income statement from ordinary activities.
The current tax payable or receivable is recognised in the balance sheet, stated as tax calculated on this year’s taxable income, adjusted for prepaid tax.
Deferred tax is recognised and measured according to the liability methods on all temporary differences between the carrying amount and tax-based value of assets and liabilities, for which the tax-based value of assets is calculated based on the planned use of each asset.
Deferred tax is measured based on the tax laws and rates which are valid on the balance date when the deferred tax is expected to generate current tax. Changes in deferred tax due to changes in tax rates are recognised in the income statement.
Deferred tax assets, including the tax base of tax loss carryforwards, are recognised in the balance sheet at their estimated realisable value, either as a set-off against deferred tax liabilities or as net tax assets.
The Company is jointly taxed with the Danish companies within the group. The current Danish income tax is allocated among the jointly taxed companies proportionally to their taxable income (full allocation with a refund concerning tax losses).
4. Balance sheet
Goodwill Goodwill is amortised straight-line over its estimated useful life which is fixed based on the experience gained by management for each business area. The amortisation period is usually 3-10 years, however, it may be up to 20 years for strategically acquired enterprises with a strong market position and a long-term earnings profile if the longer amortisation period is considered to give a better reflection of the Group’s benefit from the relevant resources.
The booked value of goodwill is being reviewed on an ongoing basis and is written down to the recoverable amount in the income statement if the booked value exceeds the expected future net income in the company or activity to which the goodwill is attached.
Property, plant and equipment Land and buildings, plant and machinery as well as other fixtures and fittings, tools and equipment are measured at cost and revaluation less accumulated depreciation and impairment losses. Land is not depreciated.
Cost comprises the acquisition price, costs directly attributable to the acquisition, and preparation costs of the asset until the time when it is ready to be put into operation. For company-manufactured assets, cost comprises direct and indirect costs of materials, components, sub suppliers and labour costs. For assets held under finance leases, cost is the lower of the asset’s fair value and present value of future lease payments.
The basis of depreciation is cost less estimated residual value after the end of useful life. Straight-line depreciation is made on the basis of the following estimated useful lives of the assets:
Buildings: 25-50 years.
Plants on rented sites: The period is expected useful life-limits in the contracts taken into account.
Plant and machinery: 5-10 years.
Other equipment etc.: 5-8 years.
Depreciations are recognised in the financial statement as production costs, sales costs and administrative costs.
Property, plant and equipment are written down to the lower of recoverable amount and carrying amount.
Profits and losses from the sale of property, plant and equipment are calculated as the difference between selling price less selling costs and carrying amount at the time of sale. Profits or losses are recognised in the income statement as other operating income or expenses.
Investments in group enterprises and associates Investments in group enterprises and associates are recognised and measured under the equity method. This means that, in the balance sheet, investments are measured at the pro rata share of the enterprises’ equity plus or less unamortised positive, or negative, goodwill and plus or less unrealised intra-group profits or losses.
The Company's share of the enterprises' profits or losses after tax and after elimination of unrealised intra-group profits and losses and less or plus amortisation of positive, or negative, goodwill is recognised in the income state-ment.
Group enterprises and associates with a negative equity value are measured at zero value, and any receivables from these enterprises are written down by the Company’s share of such negative equity if it is deemed irrecoverable. If the negative equity exceeds the amount receivable, the remaining amount is recognised under provisions if the Company has a legal or constructive obligation to cover the liabilities of the relevant enterprise.
Upon distribution of profit or loss, net revaluation of investments in group enterprises and associates is transferred to reserve for net revaluation according to the equity method under equity.

Accounting Policies
Marius Pedersen A/S – Annual report 2016 10
Goodwill is calculated as the difference between cost of the investments and the fair value of the assets and liabilities acquired which have been measured at fair value at the date of acquisition.
Inventories Inventories are measured at the lower of cost using the FIFO method and net realisable value.
Cost of goods for resale, raw materials and consumables consists of purchase price plus delivery costs. Financing costs are not included in cost.
The net realisable value of inventories is calculated as the estimated selling price less completion costs and costs incurred to execute sale.
Receivables Receivables are measured at amortised cost, usually equalling nominal value less provisions for bad debts.
Contract work in progress Contract work in progress (construction contracts) is measured at the selling price of the work carried out at the balance sheet date. The selling price is measured based on the stage of completion and the total estimated income from the individual contracts in progress. Usually, the stage of completion is determined as the ratio between actual and total budgeted consumption of resources. For some projects where the consumption of resources cannot be applied as a basis, the ratio between completed and total sub activities of the individual projects has been applied.
If the selling price of a construction contract cannot be made up reliably, it is measured at the lower of costs incurred or at the net realisable value if this is lower.
Each contract in progress is recognised in the balance sheet under receivables or liabilities other than provisions, depending on whether the net value, calculated as the selling price less prepayment received, is positive or negative.
Costs of sales work and of securing contracts as well as financing costs are recognised in the income statement as incurred.
Prepayments Prepayments comprise incurred costs relating to subsequent financial years. Prepayments are measured at cost which usually means nominal value.
Dividend Dividend is recognised as a liability at the time of adoption at the general meeting. The proposed dividend for the financial year is disclosed as a separate item in equity.
Other provisions Other provisions comprise anticipated costs of restoration and percolate treatment, non-recourse guarantee commit-ments, loss on contract work in progress, decided and published restructurings, etc.
Non-recourse guarantee commitments comprise commit-ments to remedy defects and deficiencies within the guarantee period of 1-5 years.
Once it is likely that total costs will exceed total income on a contract in progress, provision is made for the total loss estimated to result from the relevant contract.
On acquisition of enterprises, provisions are made for costs relating to restructurings in the acquired enterprise that were decided and published at the takeover date at the latest.
Lease commitments Lease commitments relating to assets held under finance leases are recognised in the balance sheet as liabilities other than provisions, and, at the time of inception of the lease, measured at the present value of future lease payments. Subsequent to initial recognition, lease commit-ments are measured at amortised cost. The interest of the lease payments is recognised in the income statement as a financial expense over the term of the leases. Lease payments on operating leases are recognised on a straight-line basis in the income statement over the term of the lease.
Other financial liabilities Other financial liabilities are measured at amortised cost, which usually corresponds to nominal value.
Segment information Information is given regarding revenue allocated on the activities.
Accounting Policies
Marius Pedersen A/S – Annual report 2016 11
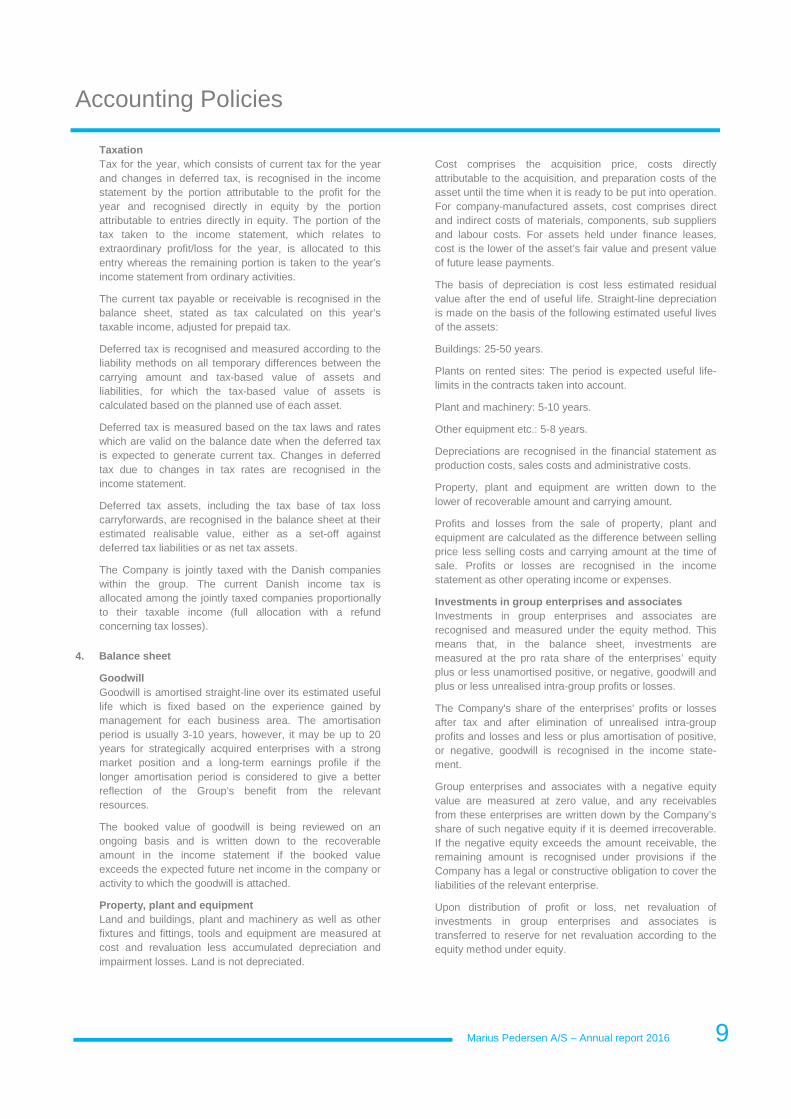
Financial highlights
Operating margin (%) Operating profit x 100
Revenue
Return on investment (%) Operating profit x 100
Average operationally assets
Return on equity (%) Profit for the year x 100
Average Equity
Equity ratio (%) Equity x 100
Total assets
Average operationally assets are defined as balance Sheet total minus cash funds, interest
bearing assets (including shares) and investments in associate enterprises.

Statement of Income 2016
Marius Pedersen A/S – Annual report 2016 12
In thousands of DKK Note 2016 2015
Revenue 1 1.039.854 1.005.277 Direct production costs
2 -680.806 -684.195
Contribution margin
359.048 321.082 Other production costs 2 -231.285 -222.366 Gross profit
127.763 98.716
Distribution costs
2 -36.681 -36.710 Administrative costs 2 -29.468 -26.965 Other operating income 3 7.170 8.621 Operating profit
68.784 43.662
Profit on ordinary activities in group enterprises
4 150.192 146.036 Income from financial investments and securities 5 11 7 Financial income 6 3.700 3.431 Financial expenses 7 -6.317 -16.940 Profit before tax
216.370 176.196
Taxation on profit for the year 8 -14.904 -6.808 Profit for the year
9 201.466 169.388

Balance Sheet at 31.12.2016
Marius Pedersen A/S – Annual report 2016 13
In thousands of DKK Note 2016 2015
Assets
Intangible assets
10 158.764 150.384 Land and buildings 11 153.137 158.458 Plant and machinery 11 323.897 288.550 Other equipment 11 3.487 5.887 Property, plant and equipment
480.521 452.895
Investments in group enterprises 12 792.387 761.200 Other securities and investments 13 265 254 Non-current assets
792.652 761.454
Total non-current assets
1.431.937 1.364.733 Inventories 14 8.177 10.598 Receivables 15 439.017 473.648 Cash 225 692 Current assets
447.419 484.938
Total assets
1.879.356 1.849.671
Equity
Share capital
16 68.880 68.880
Reserve for net revaluation according to the equity method 737.376 707.570 Retained earnings 137.038 203.421 Proposed dividends for financial year 235.000 121.000 Total equity
1.178.294 1.100.871
Provisions
Provisions for deferred tax 17 30.124 28.298 Guarantee and re-establishment commitments 18 300 750 Total Provisions
30.424 29.048
Credit institutions 441.423 498.580 Trade payables 117.724 96.621 Accounts owed to group enterprises 9.549 41.046 Other payables
19 101.922 79.313
Income taxes 20 4.192 Current liabilities other than provisions
670.638 719.752
Total liabilities
1.879.356 1.849.671
Staff costs 20 Fee to auditor appointed by the general meeting 21 Securities and contingent liabilities etc. 22 Related parties
23
Ownership 24 Consolidation 25
Statement of Changes in Equity
Marius Pedersen A/S – Annual report 2016 14
In thousands of DKK Share capital
Reserve for net
revaluation Retained earnings
Proposed dividends for financial year Total equity
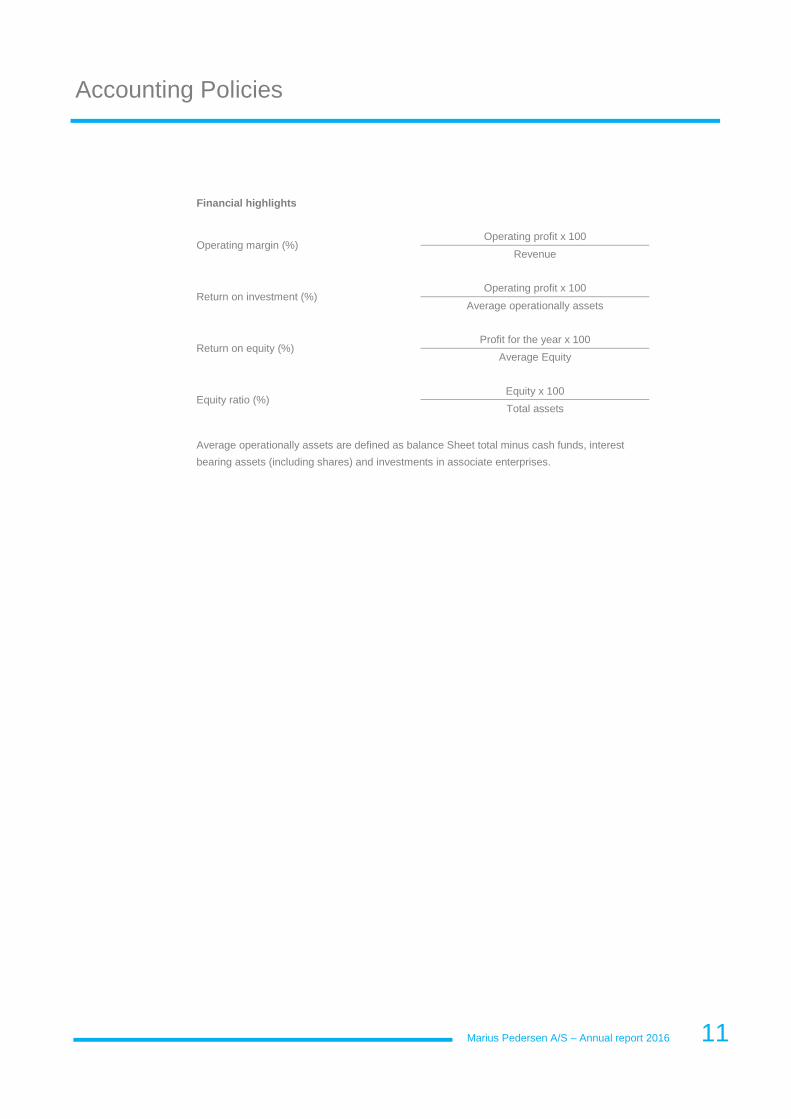
Balance at 1 January 2015 68.880 668.436 177.995 0 915.311 Dividends paid 0 -123.074 123.074 0 0 Net profit/loss for the year 2015 0 146.036 -97.648 121.000 169.388 Exchange rate adjustments 0 16.172 0 0 16.172 Balance at 31 December 2015 68.880 707.570 203.421 121.000 1.100.871
Balance at 1 January 2016 68.880 707.570 203.421 121.000 1.100.871 Dividends paid 0 -115.962 115.962 -121.000 -121.000 Other adjustments in capital 0 -1.381 1.381 0 0 Net profit/loss for the year 2016 0 150.192 -183.726 235.000 201.466 Exchange rate adjustments 0 -3.043 0 0 -3.043 Balance at 31 December 2016 68.880 737.376 137.038 235.000 1.178.294
Notes
Marius Pedersen A/S – Annual report 2016 15
16 1. Revenue, market segment
16 2. Amortisation, depreciation and impairment
16 3. Other operating income
16 4. Profit on ordinary activities in group enterprises
16 5. Income from financial investments and securities
16 6. Financial income
16 7. Financial expenses
17 8. Tax on profit/loss for the year
17 9. Proposed distribution of profit/loss
17 10. Intangible assets
17 11. Property, plant and equipment
18 12. Investments in group enterprises
18 13. Other securities and investments
18 14. Inventories
18 15. Receivables
19 16. Share capital
19 17. Deferred tax
19 18. Guarantee and re-establishment commitments
19 19. Other payables
20 20. Staff costs
20 21. Fee to auditor appointed by the general meeting
20 22. Securities and contingent liabilities etc.
21 23. Related parties
21 24. Ownership
21 25. Consolidation

Notes
Marius Pedersen A/S – Annual report 2016 16
1. Revenue, market segment In thousands of DKK
2016 2015
Collection, sorting, recycling and trading activities
983.521 952.053
Contracting activities etc. 56.333 53.224
1.039.854 1.005.277
2. Amortisation, depreciation and impairment In thousands of DKK
2016 2015
Amortisation, depreciation and impairment of the year is included in the below mentioned entries
Other production costs 108.519 120.589 Distribution costs 508 488 Administrative costs 468 458
109.495 121.535
3. Other operating income In thousands of DKK
2016 2015
Gains from disposal of tangible assets 4.759 5.111 Other operating income 2.411 3.510
7.170 8.621
4. Profit on ordinary activities in group enterpris es In thousands of DKK 2016 2015
Group enterprises 150.192 146.036
150.192 146.036
5. Income from financial investments and securities
In thousands of DKK 2016 2015
Adjustment of shares 11 7
11 7
6. Financial income
In thousands of DKK 2016 2015
Interest income from group enterprises
1.872 1.967
Other interest income 1.828 1.464
3.700 3.431
7. Financial expenses
In thousands of DKK 2016 2015
Interest expenses from group enterprises
259 439
Other interest expenses 6.058 16.501
6.317 16.940

Notes
Marius Pedersen A/S – Annual report 2016 17
8. Tax on profit/loss for the year
In thousands of DKK 2016 2015
Current tax
9.599 5.902
Change in deferred tax 5.101 906 Adjustment concerning previous years 204 0
14.904 6.808
9. Proposed distribution of profit/loss In thousands of DKK 2016 2015
Dividends for the financial year 235.000 121.000 Transfer to reserve for net revaluation under the equity method 150.192 146.036 Retained earnings -183.726 -97.648
201.466 169.388
10. Intangible assets
In thousands of DKK Goodwill
Cost at 01.01. 310.505 Additions during the year
24.000
Cost at 31.12. 334.505
Amortisation and impairment at 01.01. 160.121 Amortisation and impairment for the year
15.620
Amortisation and impairment at 31.12. 175.741
Book value at 31.12. 158.764 Intangible assets are determined as the difference between purchase price and the fair value of acquired assets
11. Property, plant and equipment
In thousands of DKK Land and buildings
Plant and machinery
Other equipment
Cost at 01.01. 307.308 1.392.966 53.395 Additions during the year
5.142 124.922 305
Disposals during the year -1.845 -90.806 -2.278 Cost at 31.12. 310.605 1.427.082 51.422
Revaluations at 01.01
2.729 0 0
Disposals during the year -2.729 0 0 Revaluations at 31.12. 0 0 0
Depreciation at 01.01.
151.579 1.104.416 47.508
Depreciation as to the year's disposal -3.742 -83.341 -1.707 Depreciation for the year 9.631 82.110 2.134 Depreciation at 31.12. 157.468 1.103.185 47.935
Book value at 31.12 153.137 323.897 3.487

Notes
Marius Pedersen A/S – Annual report 2016 18
12. Investments in group enterprises
In thousands of DKK
2016 2015
Cost at 01.01.
55.011 55.011
Cost at 31.12.
55.011 55.011
Net revaluation 01.01. 706.189 667.055 Exchange rate adjustments
-3.043 16.172
Profit/loss for the year 150.192 146.036 Dividends paid -115.962 -123.074 Net revaluation at 31.12.
737.376 706.189
Carrying amount at 31.12.
792.387 761.200 Investments in group enterprises comprise:
Odense Affaldssortering A/S, Odense, 50,2% Marius Pedersen a.s., Hradec Kralove, Czech Republic; 100% Marius Pedersen a.s., Trencin, Slovakia; 100%
13. Other securities and investments
In thousands of DKK 2016 2015
Cost at 01.01. 56 56 Disposals during the year 0 0 Cost at 31.12.
56 56
Net revaluation at 01.01. 198 191 Net revaluation of the year 11 7 Net revaluation at 31.12.
209 198
Book value at 31.12.
265 254
14. Inventories
In thousands of DKK 2016 2015
Raw materials and consumables 7.316 7.426 Finished goods
861 3.172
8.177 10.598
15. Receivables
In thousands of DKK 2016 2015
Sales and services maturity within 1 year 211.293 173.714 Receivables from group enterprises (due after 1 year: 66.909)
221.927 261.568
Other receivables 4.154 5.511 Prepayments (rent, contracts, subscriptions etc.) 1.643 32.855
439.017 473.648

Notes
Marius Pedersen A/S – Annual report 2016 19
Work in progress for the account of others
In thousands of DKK 2016 2015
Work in progress, sales price
23.687 14.883
Invoicing on account -24.900 -15.421
-1.213 -538
Work in progress for the account of others is included in the balance sheet as follows:
Payables, work in progress -1.213 -538
-1.213 -538
16. Share capital
In thousands of DKK 2016 2015
Share capital consist of
A-share capital (756.000) 15.120 15.120 B-share capital (2.688.000) 53.760 53.760
68.880 68.880
There has not been any changes in share capital for 5 years.
17. Deferred tax In thousands of DKK 2016 2015
Balance at 01.01. 28.298 27.392 Adjustment for the year 5.101 906 Other adjustments -3.275 0 Balance at 31.12. 30.124 28.298
18. Guarantee and re-establishment commitments In thousands of DKK 2016 2015
Balance at 01.01. 750 1.025 Adjustment for the year -450 -275 Balance at 31.12. 300 750
19. Other payables In thousands of DKK 2016 2015
Wages, holiday pay etc. 61.681 54.188 VAT and taxes 7.510 6.841 Deposits 186 213 Other items 32.545 18.071
101.922 79.313

Notes
Marius Pedersen A/S – Annual report 2016 20
20. Staff costs In thousands of DKK 2016 2015
Wages and salaries 405.831 372.889 Pension contribution 34.914 32.506 Other social costs 16.305 16.030
457.050 421.425
From this total fee for the company: Executive board 11.190 3.187 Board of directors 4.783 950
Average number of employees 955 912
The fees are partly expensed in other Group companies. The fees are influenced by the changes in management in 2016.
21. Fee to auditor appointed by the general meeting In thousands of DKK 2016 2015
Administrative costs include fee for the auditor appointed by the general meeting: Statutory audit services 335 335 Tax services 40 40 Other services 35 35
410 410
22. Securities and contingent liabilities etc.
Mortgage and securities To provide security for the groups drawing facilities in banks etc., including performance guarantees and other guarantees given by the bank, are placed on deposit on the following items.
In thousands of DKK 2016 2015
Mortgage deed, not pledged as security 16.250 16.250
Carrying amount of mortgage properties 39.362 40.790
Guarantees
The company guarantees as follows: Group enterprises' outstanding accounts with banks etc. 82.530 82.830
Contingent liabilities
Obligations according to rent and operating lease contracts 52.683 38.947 Recourse obligations concerning contract guarantees etc. 63.829 61.745
Company holds properties on rented premises.
Joint taxation Marius Pedersen A/S and its Danish subsidiaries are jointly taxed with MPWM 2014 A/S. The company thus has secondary liability with respect to income taxes etc. and any obligations to withhold taxes on interest, royalties and dividends applying to the jointly taxed companies. Such secondary liability is, however, capped at an amount equal to the portion of the share capital in the company held directly or indirectly by the ultimate parent.
Notes
Marius Pedersen A/S – Annual report 2016 21
23. Related parties Related parties with controlling interest in Marius Pedersen A/S: Marius Pedersen Holding A/S. 24. Ownership The following shareholders hold more than 5% of the Company's share capital: Marius Pedersen Holding A/S, Faaborg-Midtfyn Ultimate shareholder: Entreprenør Marius Pedersens Fond, Faaborg-Midtfyn. 25. Consolidation Marius Pedersen A/S group enterprises are included in the following consolidated financial statement: MPWM 2014 A/S, Ørbækvej 851, 5863 Ferritslev Fyn. CVR 35846735.

Marius Pedersen A/S – Annual report 2016