Embed Size (px)
DESCRIPTION
STATISTICHE SUL MERCATO DEL LAVORO NEI PAESI PARTNER DEL PROGETTO WINNET8 - UN’ANALISI COMPARATIVA. Marta Hozer-Koćmiel Urszula Zimoch University of Szczecin, Poland. Forti disparità nel reddito PIL pro capite. UK, S E - 111.0-120.0 FI, IT - 95.0-111.0 - PowerPoint PPT Presentation
Citation preview

Marta Hozer-Koćmiel Urszula Zimoch
University of Szczecin, Poland
STATISTICHE SUL MERCATO DEL LAVORO NEI PAESI PARTNER DEL
PROGETTO WINNET8 - UN’ANALISI COMPARATIVA

Forti disparità nel reddito
PIL pro capite
UK, SE - 111.0-
120.0
FI, IT - 95.0-
111.0
PT, GR - 61.0-
95.0
PL, BG - 41.0-
61.0
NOTA: Dato da tenere presente nelle buone pratiche

Tasso di crescita del
PIL reale
PL, BG- 111.0-
120.0
SE- 95.0-111.0
FI, UK, IT- 61.0-
95.0
GR, PT- 41.0-
61.0

Fin
lan
d
Bu
lgari
a
Sw
eden
Port
ugal
Gre
ece
Pola
nd
Italy
Un
ited
Kin
...0
10
20
30
40
50
60
70
50
55
60
65
70
75
80
85
Total population in million Activity rate
Total population (in mln.)
Activity rate (%)
Forte disparità tra i Paesi Winnet8 riguardo a popolazione totale e attiva

Tasso di occupazione per sessoIt
aly
Gre
ece
Pola
nd
Bu
lgari
a
Port
ugal
Un
ited
Ki.
..
Fin
lan
d
Sw
eden
0
10
20
30
40
50
60
70
80
90
Women activity rate Men activity rate
%
NOTA: le donne devono conciliare il lavoro pagato con quello domestico; in PL i bambini che frequentano l’asilo nido sono il 28%, mentre in SE e UK
sono quasi il 100%. Come si può aumentare l’attività economica delle donne che stanno a casa coi figli?

Tasso di occupazione per etàIt
aly
Pola
nd
Gre
ece
Bu
lgari
a
Port
ugal
Fin
lan
d
Un
ited
Ki.
..
Sw
eden
0
10
20
30
40
50
60
70
80
90
100
activity rate, 15-24 activity rate, 25-54 activity rate, 55-64
%

Il tasso di crescita occupazionale delle donne aumenta più di quello maschile?
Country
Men’s employment growth rate,
%
Women’s employment growth rate,
%
BG 3,5 3GR 0,7 2,1IT -0,4 1,4PL 4,1 3,9PT 0,2 0,7FI 2 1,2SE 1,1 0,7UK -0,2 0,4
BG EL IT PL PT FI SE UK
-1
0
1
2
3
4
5
Men employ-ment growth rate, %
Women em-ploy-ment growth rate, %

Il tasso di occupazione femminile rimane più basso di quello maschile
Country
Men’s employment rates, %
Women’s employmen
t rate,%
Gender gap, %
BG 68,5 59,5 9
EL 75 48,7 26,3
IT 70,3 47,2 23,1
PL 66,3 52,4 13,9
PT 74 62,5 11,5
FI 73,1 69 4,1
SE 76,7 71,8 4,9
UK 77,3 65,8 11,5
BG EL IT PL PT FI SE UK0
10
20
30
40
50
60
70
80
90
Men employ-ment rates, %
Women employ-ment rate,

I tassi di occupazione femminile sono più alti nella fascia d’età 25-54 anni
Country
Women’s employment rate, 15-
24
Women’s employment rate, 25-
54
Women’s employment rate, 55-
65
BG 23,1 77,9 37,7EL 18,5 61,9 27,5
IT 19,4 60,2 24
PL 23,7 71 20,7
PT 30,8 75,8 43,9
FI 45,1 81,2 55,8
SE 42,1 83,5 66,7
UK 51 75,2 49
BG EL IT PL PT FI SE UK0
10
20
30
40
50
60
70
80
90
Women employ-ment rate, 15-24
Women employ-ment rate, 25-54
Women employ-ment rate, 55-65

Donne con impiego part time in %
Country
Women employed part-time,
%BG 2,7EL 9,9IT 27,9PL 11,7PT 17,2FI 18,2SE 41,1UK 41,8
BG EL IT PL PT FI SE UK0
5
10
15
20
25
30
35
40
45
Women employed part time, %
Vantaggio: migliore conciliazione vita-lavoro
Svantaggio: minor reddito, pensioni più basse

Occupazione femminile per status professionale, in percentuale
Country
Employers or self-
employed women, %
Women Employees
, %
BG 8,1 91,9EL 23 77IT 16,8 83,2PL 15 85PT 17,2 82,8FI 7,9 92,1SE 5,3 94,7UK 7,5 92,5
BG EL IT PL PT FI SE UK0
10
20
30
40
50
60
70
80
90
100
Employers or self-employed women, %
Women Em-ployees, %GR, IT, PT: microimprese,
presenza nel settore agricoloPL: autoimprenditoria indotta
per abbassare i costi del datore di lavoro

Occupazione femminile per settore di attività economica, in percentuale
Country
Women in Agricultur
e
Women in Industry
Women in Services
BG EL 11,7 8 80,3IT 2,9 15,2 81,9PL PT 12,2 16,3 71,5FI 2,9 10,9 86,2SE UK 0,9 7,4 91,8
BG EL IT PL PT FI SE UK0
10
20
30
40
50
60
70
80
90
100
Women in Agriculture
Women in Industry
Women in Services

Occupazione femminile per grado di istruzione, in percentuale
Count.Primar
y educat.
Secondary educat.
Tertiary educat.
Prop.of popul 0-14
BG 12,8 55,3 32 13,4EL 26,8 41,7 31,4 14,3IT 29,3 48,9 21,9 14PL 7,2 63,1 29,7 15,5PT 62,9 16,8 20,3 15,3FI 14 43,8 42,2 16,9SE 11,5 51,2 37,7 16,8UK 21,2 43 35,8 17,6
BG EL IT PL PT FI SE UK0
10
20
30
40
50
60
70
Primary education Secondary educationTertiary educattion
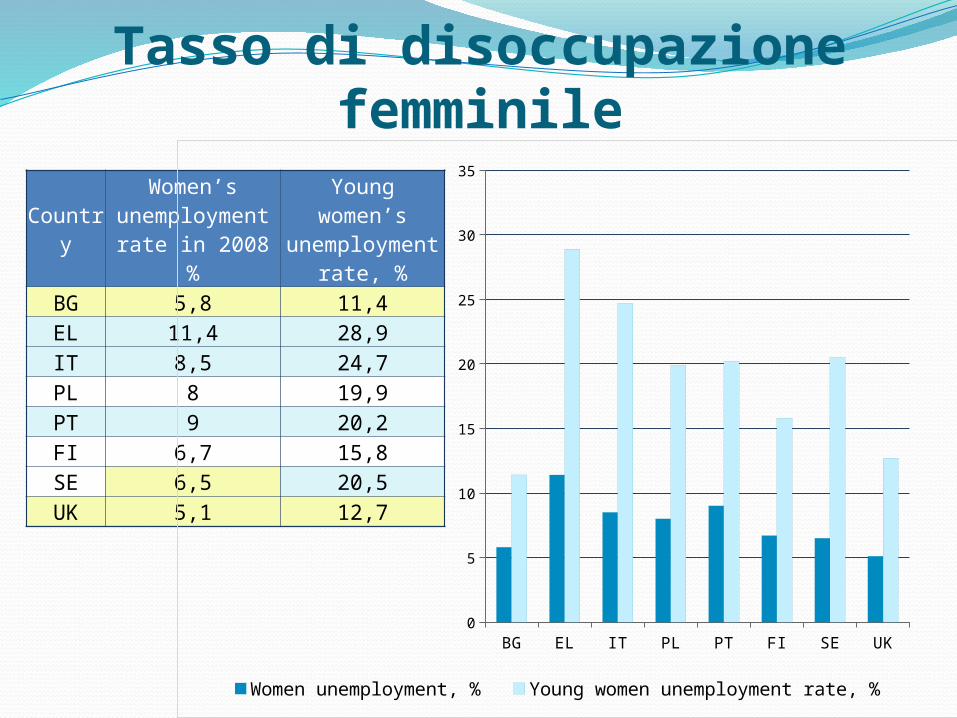
Tasso di disoccupazione femminile
Country
Women’s unemployment rate in 2008 %
Young women’s
unemployment rate, %
BG 5,8 11,4EL 11,4 28,9IT 8,5 24,7PL 8 19,9PT 9 20,2FI 6,7 15,8SE 6,5 20,5UK 5,1 12,7
BG EL IT PL PT FI SE UK0
5
10
15
20
25
30
35
Women unemployment, % Young women unemployment rate, %

Stipendio femminile mensile per occupazione, in Euro (2006)
Country
Women’s earnings in
total
Earnings of women
legislators, senior officials and managers
BG 183 434EL 1400 2833IT 1865 4546PL 597 1192PT 1089 2658FI 2267 3786SE 2635 4035UK 2760 4178
BG EL IT PL PT FI SE UK -
500
1,000
1,500
2,000
2,500
3,000
3,500
4,000
4,500
5,000
Women earnings total
Earnings of women legisla-tors, se-nior offi-cials and managersNOTA: enormi disparità
nel guadagno mensile tra i partner

Pay gap di genere in
percentuale
UK, EL 20.0-22.0%
FI, SE- 13.6-20.0%
PL, BG- 9.2-13.6%
PT, IT- 4.9-9.2%

IN CONCLUSIONE
Le politiche regionali e nazionali sono strettamente legate alla condizione delle donne nel mercato del lavoro. Per questo è importante conoscere bene il mercato del lavoro dei Paesi partner del progetto, anche attraverso l’uso di dati statistici.
Nel raccogliere le 100 buone pratiche previste dal progetto e nel promuovere l’innovazione nelle pari opportunità di genere dobbiamo tenere presente le forti disparità che esistono tra i Paesi partner.

Contrastare la segregazione orizzontale e verticale nel mercato del lavoro; contrastare l’assenza di donne nei settori tecnico-scientifici, contrastare la carenza di donne imprenditrici sarà più facile conoscendo i dati quantitativi di questi fenomeni.
IN CONCLUSIONE