Embed Size (px)
DESCRIPTION
Â
Citation preview

Northern Territory Audit of Surgical Mortality
2010 - 2015 Report

2
CONTACT
Royal Australasian College of Surgeons Northern Territory Audit of Surgical MortalityPO Box 7385 East Brisbane QLD 4169 AustraliaTelephone: 07 3249 2903Facsimile: 07 3391 7915Email: [email protected]: www.surgeons.org/NTASM
The information contained in this Annual Report has been prepared by the Royal Australasian College of Surgeons Northern Territory Audit of Surgical Mortality, which is a declared quality improvement committee under section 7 (1) of the Health Services (Quality Improvement) Act 1994 (Gazetted 26 July 2005).
The Australian and New Zealand Audit of Surgical Mortality, including the Northern Territory Audit of Surgical Mortality, also has protection under the Commonwealth Qualified Privilege Scheme under Part VC of the Health Insurance Act 1973 (Gazetted 23rd August 2011).

NTASM 2010 - 2015 REPORT 3
CONTENTS
Clinical Director’s Report .............................................................................................................. 6
NTASM Steering Committee Chairman’s Report ........................................................................ 7
Shortened Forms ........................................................................................................................... 9
Executive Summary ..................................................................................................................... 10
Recommendations ....................................................................................................................... 12
1. Introduction .............................................................................................................................. 13
1.1 Background ........................................................................................................................ 13
1.2 Project governance ............................................................................................................. 13
1.3 NTASM audit process ......................................................................................................... 15
1.4 Reporting conventions ........................................................................................................ 16
2. Audit Overview ......................................................................................................................... 18
2.1 Overview of NTASM cases .................................................................................................. 18
3. Results ...................................................................................................................................... 19
3.1 Clinical incidents ................................................................................................................. 19
3.2 Surgeons ............................................................................................................................ 22
3.3 Hospitals ............................................................................................................................ 26
3.4 Patients .............................................................................................................................. 29
3.5 Aboriginal and Torres Strait Islander persons ...................................................................... 34
3.6 Trauma ............................................................................................................................... 38
3.7 Infection ............................................................................................................................. 39
Acknowledgements ..................................................................................................................... 41
NTASM Management Committee ............................................................................................... 42
NTASM staff .................................................................................................................................. 42
References ................................................................................................................................... 43

NTASM 2010 - 2015 REPORT4
TABLES
Table 1: Overview of NTASM cases in the audit reporting period 2010 to 2015 .........................18
Table 2: Surgeon participation by specialty ...............................................................................22
Table 3: Grade of surgeon completing the surgical case form ...................................................22
Table 4: Grade of surgeon deciding, operating, assisting or in theatre .......................................23
Table 5: Surgical specialty and number of patients admitted .....................................................23
Table 6: Surgical specialty and patient age distribution .............................................................24
Table 7: Surgeon and first-line assessor views on patient management ....................................24
Table 8: Days in hospital (length of stay) before death in NTASM and ANZASM ........................28
Table 9: Gender distribution of NTASM patients compared with ANZASM patients ...................29
Table 10: Age at death of Aboriginal and Torres Strait Islander persons and non-Aboriginal and Torres Strait Islander persons in NTASM compared with ANZASM patients ........................................................................................................34
Table 11: Comparison of serious comorbidities in Aboriginal and Torres Strait Islander persons and non-Aboriginal and Torres Strait Islander persons in NTASM and ANZASM .....................................................................................................................35
Table 12: Age adjusted comparison of serious comorbidities in Aboriginal and Torres Strait Islander persons and non-Aboriginal and Torres Strait Islander persons in NTASM ....................................................................................................................35
Table 13: Percentage distribution of patients at risk of death .......................................................36
Table 14: Issues with postoperative care in NTASM and ANZASM ..............................................37

NTASM 2010 - 2015 REPORT 5
FIGURES
Figure 1: Northern Territory Audit of Surgical Mortality (NTASM) project governance structure ....13
Figure 2: Northern Territory Audit of Surgical Mortality (NTASM) methodology .............................15
Figure 3: Serious clinical incidents and areas of consideration identified by assessors ................19
Figure 4: Distribution of association of serious clinical incidents ..................................................20
Figure 5: Distribution of patient admissions by day of the week ..................................................26
Figure 6: Distribution of elective and emergency admissions by day of the week ........................26
Figure 7: Postoperative complications by type ...........................................................................28
Figure 8: Age distribution by gender of NTASM patients compared with ANZASM regions .........30
Figure 9: Comparison of the 5-year age group distribution of Aboriginal and Torres Strait Islander patients and non-Aboriginal and Torres Strait Islander patients ..............30
Figure 10: Distribution of ASA class .............................................................................................31
Figure 11: Distribution of comorbidities ........................................................................................32
Figure 12: Distribution of comorbidities in NTASM patients compared with ANZASM patients ......33
Figure 13: Distribution of patient risk of death prior to surgery, as perceived by surgeons .............33
Figure 14: Distribution of causes of trauma ...................................................................................38
Figure 15: Infections acquired before and during admission compared by ANZASM region ..........40
Figure 16: Frequency of types of infections in patients who died with a clinically significant infection ......................................................................................................40

NTASM 2010 - 2015 REPORT6
CLINICAL DIRECTOR’S REPORT
The Northern Territory Audit of Surgical Mortality (NTASM) Report represents a summary of audit findings for all the years in which the Northern Territory (NT) has participated in the audit of surgical mortality.
It is encouraging to have full participation from all surgeons, public hospitals and private hospitals in the NT. This very broad-based support has resulted in the collection of robust data relating to surgical mortality and surgical process in the NT. This data allows possible recommendations to be made that may improve healthcare delivery in the NT.
This NTASM report notes multiple comorbidities (diabetes, alcohol abuse, cigarette smoking, and domestic violence) in Aboriginal and Torres Strait Islander persons in the NT.
This report also shows a 19 year age difference with respect to surgical mortality between Aboriginal and Torres Strait Islander persons compared with non-Aboriginal and Torres Strait Islander persons. Healthcare administrators and professional societies must collaborate closely in trying to reduce this gap.
Data in this report highlights issues relating to distance and delays. The NTASM recognises that there is only one large capital city trauma centre in the NT, and thus distances and transfers warrant careful attention. The NTASM would
recommend that healthcare professionals have appropriate knowledge, skills and resources to manage patient transfers to centres of excellence for more comprehensive assessment and/or surgical treatment. There is a need for complex social and medical support services for patients requiring transfer.
The NTASM data also indicate significant head injury pathologies. With no resident neurosurgeon in the NT, general surgeons undertake neurosurgery procedures. The NTASM recommends that continuous education opportunities be afforded to these general surgeons, with regular hands-on opportunities to update and maintain skills. Although attracting a neurosurgeon on a permanent basis to the NT might at this point seem impossible, careful thought must be given to the opportunity to do this within the coming few years.
I trust this report will be of interest to both surgeons and health administrators. The report allows administrators to think about the possible institution of some of the NTASM recommendations to improve healthcare process in the NT.
Dr John North
NTASM Clinical Director

NTASM 2010 - 2015 REPORT 7
NTASM STEERING COMMITTEE CHAIRMAN’S REPORT
The NTASM continues to provide accountability of surgeons, not only to their peers, but to hospital administrators, politicians, other health funding bodies and to the wider NT community.
By way of this report, NT surgeons affirm their responsibility to these groups. All surgeons need to be vigilant to ensure they are providing the best possible care for their patients. The NTASM provides a vehicle to monitor progress and make change, not only of NT surgeons and their clinical activities, but also to the health systems and processes that influence patient care.
The NTASM continues to provide significant data on the activities of surgeons within NT hospitals. Reassuringly, all NT surgeons and all NT hospitals participate in the audit. Obstetricians and Gynaecologists now participate, through their Fellowship of the Royal Australian and New Zealand College of Obstetricians and Gynaecologists (RANZCOG). This current report is significant in that it provides five years of data.
From 1 July 2010 to 30 June 2015 there were 306 surgically-related deaths reported to the NTASM.
Some of the main findings from this report are as follows.
1. RATES OF SERIOUS COMORBIDITIES
Serious comorbidities were present in 80% (196/244) of all patients. The most frequent comorbidities included: cardiovascular, respiratory, diabetes and renal disease. The rates of diabetes and hepatic disease were considerably higher than those of other states and territories throughout Australia.
2. ABORIGINAL AND TORRES STRAIT ISLANDER PERSONS
Aboriginal and Torres Strait Islander persons are over-represented in the NTASM, comprising 37% (91/245) of cases and 26.8% (61,996/231,331) of the NT population.[1] Aboriginal and Torres Strait Islander patients were younger than non-Aboriginal and Torres Strait Islander patients at death. In the age groups below 60 years, 71% of the patients were Aboriginal and Torres Strait Islander persons. When the age is capped at 50 years then Aboriginal and Torres Strait Islander persons were at twice the risk of serious comorbidities compared with non-Aboriginal and Torres Strait Islander persons. No differences in clinical management issues were noted between Aboriginal and Torres Strait Islander persons and non-Aboriginal and Torres Strait Islander persons.
3. TRAUMA AND VIOLENCE
Trauma and violence continue to be major sources of mortality in the NT. Trauma was present in 27% (53/195) of all deaths, with just over half of these trauma cases associated with falls. Public violence and domestic violence each accounted for approximately one-quarter of the cases associated with violence. Trauma was more prevalent in non-Aboriginal and Torres Strait Islander persons: approximately one-third of trauma cases were Aboriginal and Torres Strait Islander persons. Although the NT has a nearly three-fold increased rate of deaths due to motor vehicle accidents (MVAs) compared with the rest of Australia,[2] only one-quarter of the NTASM trauma cases were associated with traffic accidents.
4. INFECTION
Infection was reported in a high proportion of cases (37%; 70/187), with septicaemia and pneumonia the most common types of infection. Of the patients with infections, two-thirds acquired the infection prior to admission. This contrasts to national data in which 41% were admitted with an existing infection. Rates of pre-hospital infections were significantly higher in Aboriginal and Torres Strait Islander persons, at 77% of all infections. This high rate of infections may relate to increased comorbidities that predispose individuals to infection, as well as other lifestyle choices that may lead to infections.

NTASM 2010 - 2015 REPORT8
NOTABLE RECOMMENDATIONS
1. HIGH-RISK PATIENTS AND EFFECTIVE HEALTH CARE DELIVERY
Most patients admitted are high-risk patients. In some cases an intensive care unit (ICU) facility was not used when it should have been. This report recommends improved communication between teams when care of a patient is shared. It also recommends increased use of pre-procedure meetings, an example of which is the complex-case committee at the Royal Darwin Hospital.
2. SUPPORT OF NT SURGEONS
The NT does not have resident surgeons from all the surgical subspecialties, such as Neurosurgery, but relies upon visiting surgeons. Further, the number of surgeons per head of population is low in the NT, when compared with the rest of Australia. The NT continues to rely on locum surgeons to supplement the surgical workforce. To address this, the report recommends the appointment of more resident surgeons.
3. TEAMWORK BETWEEN COMMUNITY HEALTH SERVICES, PATIENTS AND THEIR FAMILIES
Comorbidities associated with lifestyle choices are high in the NT. This report recommends increased education on the effects of lifestyle choices, increasing the profile of the NT Government’s initiatives to educate and control alcohol use and sales, plus support for the delivery of social services. This is most important in communities, in order to “close the age gap” of Aboriginal and Torres Strait Islanders person’s life expectancy.
4. DISTANCES BETWEEN REMOTE HEALTH CENTRES AND MAJOR HOSPITALS
Delays of patient presentation, not only to the major hospitals but also to community health centres, remain common in the NT. The tyranny of distance at NT communities may be reduced by implementation and facilitation of TeleHealth services, improved and enhanced transport services, plus support and education of doctors and nurses at remote communities. Systems need to be developed to ensure that patients who are seen in the community are not lost to follow-up and that they attend all scheduled visits.
5. DOMESTIC VIOLENCE
Rates of domestic violence and resultant deaths remain high in the NT. The NTASM needs to incorporate data on domestic violence in future reports. The NT Government Department of Health should increase education around domestic violence for both genders. NT Hospitals should provide a safe environment for persons to feel comfortable when reporting domestic violence.
Dr John TreacyNTASM Chairman

NTASM 2010 - 2015 REPORT 9
SHORTENED FORMS
ACT Australian Capital Territory
AIHWAustralian Institute of Health and Welfare
ANZASMAustralian and New Zealand Audits of Surgical Mortality
ASAAmerican Society of Anaesthesiologists
CI confidence interval
FLA first-line assessment
FRACSFellow of the Royal Australasian College of Surgeons
HDU high dependency unit
ICU intensive care unit
IMG International Medical Graduate
IQR interquartile range
MBA motorbike accident
MVA motor vehicle accident
NSW New South Wales
NTASMNorthern Territory Audit of Surgical Mortality
NT Northern Territory
OR odds ratio
QASMQueensland Audit of Surgical Mortality
QLD Queensland
RACSRoyal Australasian College of Surgeons
RANZCOGRoyal Australian and New Zealand College of Obstetricians and Gynaecologists
RR risk ratio
SA South Australia
SAAPMSouth Australian Audit of Perioperative Mortality
SCF surgical case form
SET Surgical Education and Training
SLA second-line assessment
SPSSStatistical Package for Social Sciences
TAS Tasmania
VIC Victoria
WA Western Australia
WAASMWestern Australian Audit of Surgical Mortality

NTASM 2010 - 2015 REPORT10
EXECUTIVE SUMMARY
The NTASM is an external, independent, peer-reviewed audit of the process of care associated with surgically-related deaths in the NT. NTASM started in 2010 and is funded by the NT Government Department of Health.
The NTASM has qualified privilege protection under Commonwealth legislation. This report covers surgically-related deaths that occurred from 1 July 2010 to 30 June 2015 and for which the audit process is complete at the census date of 1 July 2015.
NTASM is principally designed as a feedback mechanism for participating surgeons to encourage reflection on surgical care and practice. The summary data for NTASM reflects a territory that is committed to surgical audit and improving surgical care.
CLINICAL INCIDENTS
�There were 53 serious clinical incidents (areas of concern or adverse events) that occurred in 31 patients.
SURGEONS
�All surgeons in NT were participating in the NTASM.
�The return rate for surgical case forms (SCFs) was 93% (285/306).
HOSPITALS
�All hospitals in NT participate in the audit. This report comprises data from the three hospitals in which a surgically-related death occurred during the audit period.
PATIENTS
�Over the five year audit period there were 306 surgically-related deaths reported to NTASM.
� In NTASM, 66% of patients were male and 34% were female. In ANZASM, 55% of patients were male.
�Serious comorbidities were present in 80% (196/244) of patients.
�The rates of diabetes (35%; 68/196) and hepatic disease (24%; 47/196) as comorbidities were higher in NTASM patients than ANZASM patients.
�More than half of the patients (54%; 100/184) were considered by surgeons to be at considerable risk of death prior to surgery.
ABORIGINAL AND TORRES STRAIT ISLANDER PERSONS
�Aboriginal and Torres Strait Islander persons comprised 37% (91/245) of surgically-related deaths.
�Overall, Aboriginal and Torres Strait Islander persons were younger (52 years; IQR 42 to 61) than non-Aboriginal and Torres Strait Islander persons (70 years; IQR 59 to 78).

NTASM 2010 - 2015 REPORT 11
OPERATIVE DEATHS
�At least one operation was undertaken on 76% (186/245) of patients.
�A total of 286 operations were performed on the 186 patients, with an average of 1.5 operations per patient.
�Multiple operations were performed on 33% (61/186) of patients. The number of operations performed on these patients ranged from 2 to 10 operations.
POSTOPERATIVE COMPLICATIONS
�A total of 57 postoperative complications occurred in 22% (40/186) of patients. The number of complications ranged from one to four per patient.
USE OF ICU
�Postoperative admission to an ICU occurred in 71% (131/184) of patients.
�A postoperative unplanned admission to an ICU occurred in 27% (34/124) of patients.
�Assessors felt that 13% (8/62) of patients who were not treated in an ICU should have received ICU treatment.
TRAUMA
�Trauma was present in 27% (53/195) of patients.
�55% (29/53) of trauma cases were associated with falls. �23% (12/53) of trauma cases were associated with traffic accidents. �40% (32/53) of trauma cases were non-Aboriginal and Torres Strait Islander persons.
INFECTION
� Infection was reported in 37% (70/187) of cases.
�Of the patients with infections, 63% (43/68) acquired the infection prior to admission and 36.8% (25/68) acquired the infection during the admission.
�The main types of infection were septicaemia (44%; 30/68) and pneumonia (31%; 21/68)
�A surgical site infection was reported for one patient.

NTASM 2010 - 2015 REPORT12
RECOMMENDATIONS
Recommendations following the review of the NTASM report by the the Chairman of the NTASM Management Committee have been included in the Chairman’s report.
The following recommendation supplement those included by the Chairman of the NTASM Management Committee.
LEARNING THROUGH THE AUDIT
It is recognised that the audt provides surgeons with an alternative form of learning. The audit aims to:
� increase the number of surgeons who participate as first- and second-line assessors. This will increase learning through the act of providing peer review.
�encourage surgeons to publish findings in their fields of interest using the audit data.
� facilitate and disseminate learnings from the audit. Audit staff should continue to identify areas for improvement in surgical care and address these where possible in seminars.
� review the comorbidity question in the surgical case form to include “alcohol abuse”.
�continue to promote the use of the Fellows’ Interface, thereby increasing the robustness of the reported data.
PATIENT MANAGEMENT Most of the patients admitted in NTASM were high risk patients.
�When patient care is shared between multiple disciplinary teams, awareness of the patients’ risks need to be communicated clearly especially during clinical handover. � Issues with “patient assessment” continue to be the main contributor to clinical incidents. It is recommended earlier and definitive measures in patient assessment and treatment be initiated. �More than half the patients who died with a clinically significant infection, were admitted with an existing infection. Education within communities need to be strengthened to ensure patients present early.

NTASM 2010 - 2015 REPORT 13
1. INTRODUCTION
KEY POINTS
�The NTASM is an independent peer review audit of the processes of care associated with all surgically-related deaths in the NT.
�This report covers the audit period 1 July 2010 to 30 June 2015 (census date 1 July 2015).
�All NT surgeons are participating in the audit.
�All NT hospitals, both public and private, are participating in the audit.
�The primary aim of NTASM is to provide feedback to participants about their performance, and to encourage reflection and learning about surgical care and practice.
1.1 BACKGROUND
The project is funded by the NT Government Department of Health. RACS became responsible for the management of the Western Australian Audit of Surgical Mortality (WAASM) in 2005. The WAASM was modelled on the Scottish Audit of Surgical Mortality, which has operated since 1988. Its methodology, and NTASM’s, is based on the original Scottish Audit of Surgical Mortality (www.sasm.org.uk/).
1.2 PROJECT GOVERNANCE
The project governance structure is illustrated in Figure 1. As part of the Australian and New Zealand Audits of Surgical Mortality (ANZASM), NTASM has protection under the Commonwealth Qualified Privilege Scheme, under Part VC of the Health Insurance Act 1973 (gazetted 23rd August 2011).
All Australian states and territories participate in the national ANZASM process. Information about the state and territory audits is available on the RACS website: www.surgeons.org
Figure 1: Northern Territory Audit of Surgical Mortality (NTASM) project governance structure
NT and Queensland* consultant surgeons
NTASM Project staff
RACS Professional Development and Standards Board
Australian and New Zealand Audit of Surgical Mortality
NTASM Management Committee
RACS Research, Audit and Academic Surgery Board
RACS Council
NT Department of Health
Northern Territory (NT) Minister of
Health
NT Hospitals
*Consultant surgeons from Queensland also undertake assessments for NTASM
1.2.1 EDUCATION FOR SURGEONS
The NTASM has contributed to the surgical education process in the NT. In particular, the NTASM has:
�managed the audit process for the NT, including the provision of 250 first-line assessment (FLA) reports and 31 second-line assessment (SLA) reports to NT surgeons.
�published 15 volumes of Lessons from the Audit, in conjunction with the Queensland Audit of Surgical Mortality (QASM). The Lessons from the Audit series contains case studies that highlight key issues relating to surgical practice. This publication is of interest not only to NT surgeons, but to all who are involved in patient care in the NT, from emergency department managers to hospital executive teams. A list of volumes and themes is provided below.
• Vol 1 Cardiac
• Vol 2 Perforated T-cell gastric lymphoma undergoing chemotherapy
• Vol 3 Bronchial stump leak
• Vol 4 Abdominal sepsis following elective laparoscopic ventral hernia repair
• Vol 5 Serious multi-trauma patients demand serious measures

NTASM 2010 - 2015 REPORT14
• Vol 6 Multiple systems - multiple obstructions to best patient care?
• Vol 7 Decision before incision!
• Vol 8 Death after endoscopy - ‘surgical audit’ or not?
• Vol 9 Not in that institution…please!
• Vol 10 History and examination are still important for surgeons.
• Vol 11 Communication issues.
• Vol 12 Preoperative management.
• Vol 13 The obese surgical patient.
• Vol 14 When not to operate.
• Vol 15 Postoperative complications.
1.2.2. PRESENTATIONS, PUBLICATIONS AND COMMENDATIONS
�Dr Jacob, a surgeon at the Alice Springs Hospital and the Alice Springs representative on the NTASM steering committee, was awarded the Aboriginal and Torres Strait Islander Health Medal by RACS.
�Two International Medical Graduates (IMGs) at the Royal Darwin Hospital obtained Fellowship of the RACS.
�Dr Treacy, a NT surgeon and Chair of the NTASM Management Committee, was the lead author of an article published in the Australian and New Zealand Journal of Surgery entitled “Outcomes from the Northern Territory Audit of Surgical Mortality: Aboriginal deaths.”[3] The article used NTASM data and showed that the standard of surgical care was the same for Aboriginal and Torres Strait Islander persons and non-Aboriginal and Torres Strait Islander persons. The article highlighted that an age gap still exists between Aboriginal and Torres Strait Islander persons and non-Aboriginal and Torres Strait Islander persons at the time of death.
• findings from the study prompted a letter from the NTASM to the Federal government, and the Minister for Indigenous Affairs acknowledged the NTASM age gap and equivalency in the standard of surgical care for Aboriginal and Torres Strait Islander persons and non-Aboriginal and Torres Strait Islander persons.
�Seminars held in Brisbane, QLD, over the audit period have been well attended by NT surgeons. One seminar was convened by an NT surgeon. The seminars have focussed on the following issues:
• Queensland dilemmas: distance, delay, deteriorating patient (2011)
• Complex surgical decision-making in modern surgical practice (2012)
• Adverse events – systems or surgeons (2013)
• Situational awareness and the surgeon (2014).
�Presentations made at the Joint Western Australia/South Australia/Northern Territory Annual Scientific meetings during the audit period include:
• From Scotland to Shoal Bay (2010)
• Northern Territory surgical patient population differences compared with the rest of Australia and review of new mortality questions (2012)
• A glimpse at Northern Territory (2012)
• Is quality assurance important for surgeons? (2013)
• Audit is about learning (2014)
• Improving care for rural and remote communities (2015)
• Learning from the audits of surgical mortality (2015).
�Attendance of meetings by NTASM staff (clinical director, manager and project officer) include:
• Neville Taylor Research Day, Royal Darwin Hospital (2013)
• Neville Taylor Research Day, Royal Darwin Hospital (2014)
• Presentation to the Royal Darwin Hospital surgeons, Royal Darwin Hospital (2014)
• RACS Northern Territory Trauma Seminar, Darwin (2015)
�The NTASM’s manager is an active member of the RACS Reconciliation Group which meets monthly to facilitate the integration of Aboriginal and Torres Strait Islander persons into the College workforce, including the surgical workforce.
�An NTASM staff member attended a course held by The BlackCard organisation entitled Above and beyond cultural awareness. Feedback from the course was provided to the NTASM and the RACS Reconciliation Group.

NTASM 2010 - 2015 REPORT 15
1.3 NTASM AUDIT PROCESS
1.3.1 METHODOLOGY
The NTASM is directly notified of all in-hospital surgically-related deaths via the surgical or medical records departments of participating NT hospitals. All cases in which a surgeon was responsible for, or had significant involvement in, the care of the patient are included in the audit, irrespective of whether the patient underwent a surgical procedure.
The clinical details relating to the management of each case are recorded on a standard, structured questionnaire known as a surgical case form (SCF), which is completed by the consultant surgeon associated with the case. The completed SCF is de-identified by NTASM and sent for FLA to a surgeon of the same specialty.
In NTASM first- and second-line assessors are peer surgeons from a different state. De-identification, combined with the use of assessors from outside the NT, ensures that anonymity and impartiality are preserved, and minimises the potential for conflicts of interest. The first-line assessor will either close the case or recommend that the case undergo further assessment in the form of an SLA.
Cases may be referred for SLA if: �an area of concern or adverse event is thought to have occurred during the clinical care of the patient and warrants further investigation.
�an SLA report could usefully draw attention to an area of surgical practice, providing an educational opportunity for the surgeon involved in the case or for a wider audience as part of a case note review publication.
� the information provided by the consultant surgeon was insufficient and did not allow the first-line assessor to reach a conclusion about the case.
In instances where an SLA is deemed necessary, the second-line assessor is selected by the clinical director, based on the same criteria as for the first-line assessor. Second-line assessors are generally considered experts in the area under review.
The methodology used by NTASM is outlined in Figure 2.
Figure 2: Northern Territory Audit of Surgical Mortality (NTASM) methodology
Case closed
No
Case closed
Is a second-line assessment (SLA) required?
Has an appeal been lodged on the second
line assessment?
Feedback to surgeon
Second-line assessment*
Surgical case form sent for first-line assessment* by paper or Fellows’ Interface
Completed surgical case form returned to the audit of surgical mortality and de-identified
Surgical case form sent to surgeon for completion
Audit of surgical mortality receives notification of death
Yes
Yes
*First- and second-line assessors for NTASM are peers surgeons from a different state
1.3.2 PROVIDING FEEDBACK
The role of the NTASM is to inform, educate, facilitate change and improve practice by providing feedback. The NTASM provides feedback to surgeons and hospitals in the following ways:
�surgeons receive written feedback from assessors regarding their cases.
�surgeons receive the NTASM Report. The report is also available from the NTASM section of the RACS website: www.surgeons.org/ntasm.
�surgeons receive de-identified summaries of SLAs from cases in the form of the Lessons from the Audit series. Surgeons also receive the National Case Note Review Booklet, which comprises case studies drawn from cases across Australia.
�hospitals participating in NTASM receive clinical governance reports on aggregated, de-identified data comparing their hospital to the averages of other hospitals across Australia.
�surgeons can view online reports relating to their own audit data and assessments via the Fellows’ Interface at: https://asm.surgeons.org/mortaudit/

NTASM 2010 - 2015 REPORT16
1.3.3 AUDIT INCLUSION AND EXCLUSION CRITERIA
NTASM audits all deaths that occur in NT hospitals while the patient was under the care of a surgeon. However, patients who are deemed terminal before admission and do not have operations are excluded from the full audit process.
NTASM includes all deaths which meet one of the following criteria:
� the patient was under the care of a surgeon (surgical admission), whether or not an operation was performed
� the patient was under the care of a physician (medical admission) and subsequently underwent a surgical procedure
� it was a gynaecology-related case.
Cases that do not meet the inclusion criteria are excluded from the audit by the notifying hospital. A case will also be excluded in instances where the NTASM is notified of a death but subsequently decides that the case does not fall within the inclusion criteria.
1.4 REPORTING CONVENTIONS
1.4.1 REPORTING CLINICAL INCIDENTS
The NTASM provides a SCF for the treating surgeon to complete. The surgeon is asked to document whether any clinical incidents occurred during the care of the patient. Clinical incidents are reported against the following hierarchical criteria:
�area for consideration: where the clinician believes an area of care could have been improved or different but recognises that there may be debate about this; �area of concern: where the clinician believes that an area of care should have been better; �adverse event: an unintended “injury” caused by medical management, rather than by the disease process, that is sufficiently serious to:
• lead to prolonged hospitalisation;• lead to temporary or permanent impairment
or disability of the patient at the time of discharge;
• contribute to or cause death.
The surgeon is also asked to:
� report the impact of the incident on the outcome, that is, whether the incident:
• made no difference to death
• may have contributed to death
• caused the death of a patient who would otherwise have been expected to survive.
�give their opinion as to whether the incident was preventable, using the following categories:
• definitely
• probably
• probably not
• definitely not.
� indicate who the incident was associated with:
• audited surgical team
• another clinical team
• hospital
• other.
First- and second-line assessors are asked to respond to the same questions as part of the review process. This results in a two-level peer-review process for those cases which undergo SLA. The SLA is more in-depth and more forensic, as the second-line assessors have access to all available patient information through medical records.
1.4.2 ASSESSOR OPINION
The areas for consideration, areas of concern and adverse events contained within this report are events ascribed to the patient by either the first-line or second-line assessor. Throughout the report first-line and second-line assessors are both referred to as ‘assessors’.
The assessors’ opinions are asked for in:
� the categorisation of the severity of the clinical incident (area of consideration, area of concern or adverse event)
� the effect on outcomes
� the preventability of the clinical incident
�with whom the clinical incident was associated.
1.4.3 ANALYSIS OF CLINICAL INCIDENTS
Reporting of clinical incidents findings are expressed in terms that cannot identify the patient, the surgeon or the hospital.
The NTASM primarily focuses on areas of concern and adverse events. While data regarding areas for consideration are collected they are considered to be minor criticisms or suggestions regarding treatment.
Cases may be associated with more than one clinical incident. The most serious incident has been ascribed to the case in instances where an analysis looks at clinical incidents reported by case.
1.4.4 DATA ANALYSIS
This report covers deaths reported to the NTASM from 1 July 2010 to 30 June 2015. Five years of data collection is included in this report. All data presented in this report is from the NTASM database unless otherwise specified. The nature of the audit process means that some cases reported during this period

NTASM 2010 - 2015 REPORT 17
will still be undergoing review as at the census date (1 July 2015). These cases will be included in the next report.
Surgeons can complete the SCF and FLA online in the Fellows’ Interface, while data from paper forms is entered into the system by audit staff. Data is entered and stored in a specifically designed database, a central Structured Query Language server database which includes a reporting engine.
Data is encrypted in the database with Secure Sockets Layer certificates. All transactions are time stamped and all changes to audit data are written to an archive table, enabling a complete audit trail for each case. Security for this system is high. An integrated workflow rules engine supports the creation of letters, reminders and management reports. To maintain data integrity, all data are routinely checked against the original SCF and assessment forms by the project manager or another project officer. Data is cross-checked and the resources used include medical record departments, surgeons, and coroner’s reports. Data is cleaned using logic testing and manually reviewed before analysis. Variables are checked for extreme or illogical values and corrections are made to the original data. Once cleaned, the data are downloaded again before analysis. A total of 28 tables are downloaded into Excel and then copied across to Statistical Package for Social Sciences (IBM-SPSS version 19.0) for analysis. A key variable that is common to all tables can be used to combine tables. Generally, simple frequencies and cross tabulations are used to create the report. Graphs are produced using either SPSS or Excel.Qualitative analysis is performed using standard techniques. The NTASM Project Manager and Clinical Director independently classify all qualitative information into groups. These groupings are then compared and any differences discussed until consensus is reached.In this report the numbers in parentheses (n) in the figures and tables represent the number of cases analysed. As not all data points were completed, the total number of cases used in the analyses varies. The numbers of cases included in each analysis are provided for all tables and figures in the report. For surgical specialities, where there are too few numbers such that the identity of the patient or surgeon is compromised, the surgical specialty will not be listed and all deaths will be aggregated under the specialty “Other”.
1.4.5 STATISTICAL ANALYSIS
Cross tabulations are used to calculate risk ratios (RR).The RR is an intuitive way to compare the risks for the two groups. (i.e. it is the ratio of the probability of an event occurring (e.g. developing a disease) in an exposed group compared to the probability of the event occurring in a non-exposed group.
All RR are reported with a 95% confidence intervals (CI). The confidence interval indicates the level of uncertainty around the measure of effect (precision of the effect estimate). Confidence intervals are used so that inference can be made as the true population effect lies between the upper and lower confidence limits (25% and 75% limits).
� If the RR is 1 (or close to 1), it suggests no difference or little difference in risk (incidence in each group is the same). A RR > 1 suggests an increased risk of that outcome in the exposed group. A RR < 1 suggests a reduced risk in the exposed group.
� If the confidence interval crosses 1 (e.g. 95%CI 0.9-1.1) this implies there is no statistical difference between the two groups.
Medians are reported together with interquartile ranges (IQR). The IQR shows the values for the data within the 25% and 75% limits. It overcomes the problems that arise with the simple range because extreme values are ignored. It represents the middle 50% of values in a rank ordered series.
1.4.6 DATA COMPARISONS
In this report, the NTASM data is compared with both the ANZASM national report – 2014 [4] and its associated dataset. National and state-based comparisions against NTASM data provide context to the NTASM data in this report. These comparisons allow an easy assessment of health care standards overall. These comparisions may assist the NT Department of Health in future program planning for continued improvement in safety and quality of surgical care in the NT.

NTASM 2010 - 2015 REPORT18
2. AUDIT OVERVIEW
KEY POINTS
�There were 306 surgically-related deaths reported to NTASM over the five years of the audit.
�The NTASM is an independent peer review of all surgically-related deaths.
2.1 OVERVIEW OF NTASM CASES
An overview of the NTASM cases is provided in Table 1 below. Assessors completed 250 FLAs and 31 SLAs.
At the end of June 2015:
�Sixteen SCFs were outstanding
�No FLAs were outstanding
�Five SLAs were outstanding.
Table 1: Overview of NTASM cases in the audit reporting period 2010 to 2015 (n=306)
Audit report period2010–2015
Number of cases
Total deaths reported 306
Closed cases 245
Closed second-line assessments 26
Outstanding second-line assessments 5
Surgical case forms not returned 16
Excluded (terminal care case) 29
Excluded (error)* 11
*An error in reporting occurs when NTASM receives notification of a case that does not fulfil the inclusion criteria, and cannot be included in the audit.

NTASM 2010 - 2015 REPORT 19
3. RESULTS
3.1 CLINICAL INCIDENTS
KEY POINTS
�There were 53 serious clinical incidents (44 areas of concern and nine adverse events) which occurred in 31 patients.
�85% (33/39) of the areas of concern were considered preventable.
�67% (6/9) of the adverse events were considered preventable.
Clinical incidents, as defined by NTASM, include:
�area for consideration – where the clinician believes an area of care could have been improved or different but recognises that there may be debate about this �area of concern – where the clinician believes that an area of care should have been better �adverse event – an unintended “injury” caused by medical management, rather than by the disease process, that is sufficiently serious to:
• lead to prolonged hospitalisation
• lead to temporary or permanent impairment or disability of the patient at the time of discharge
• contribute to or cause death.
�note: serious clinical incidents = areas of concern and/or adverse events.
Over the five year audit period assessors identified 74 areas of consideration, 44 areas of concern and nine adverse events as shown in Figure 3.
Figure 3: Serious clinical incidents and areas of consideration identified by assessors (n= 127)
74
44
9
Area of consideration Area of concern Adverse event
(Data not available: n = 2)
�Serious clinical incidents (areas of concern and adverse events) encompass issues that are specific to surgical care and may relate to hospital or patient management issues. They are areas of care that were suboptimal and need to be improved.
�Areas of consideration are minor criticisms or suggestions regarding treatment and are not discussed further in this report.
The 53 serious clinical incidents occurred in 13% (31/245) of patients. This is comparable with ANZASM data, where serious clinical incidents occurred in 12% (2,854/23,292) of patients across all Australian states and territories.
A summary of the 53 serious clinical incidents from this audit is as follows:
� there were 44 areas of concern and nine adverse events
�39 of the 53 serious clinical incidents were considered preventable (preventability was not provided for five serious clinical incidents).

NTASM 2010 - 2015 REPORT20
ASSOCIATIONS:
�9 serious clinical incidents were associated with the surgical team
�7 serious clinical incidents were associated with another clinical team
�2 serious clinical incidents were associated with other causes (ICU, radiology and an initial procedure).
The distribution of association of serious clinical incidents is shown in Figure 4.
Figure 4: Distribution of association of serious clinical incidents (n= 53)
Audited surgical teamAnother clinical team
HospitalOther
35
9
7
2
Note: “Other” includes (1) intensive care unit and (2) radiology and an initial procedure.
PREVENTABLE SERIOUS CLINICAL INCIDENTS INCLUDED:
Patient assessment problems
�Choice of operation. �Decision to operate on a patient with advanced malignancy. This looks like an unnecessary operation but didn’t contribute to the patient’s death. �Delay in diagnosis. �Delay in diagnosis and therefore surgery. �Delay in diagnosis on initial presentation to clinic. �Preoperative preparation. �Slow recognition of severity of coronary artery disease. �The use of ICU is not appropriate in such a patient.
Delays
�Delay in offering surgery - seven hours from presentation. �Junior registrar reviewed the patient and the patient spent five days on a medical ward before diagnosis of a surgical admission. �Delay in colonoscopic management of bleeding. �Delay in recognising postoperative bleeding after first operation. �Delay in surgical management of bleeding. �Delay to theatre. �Delay to theatre from the intensive care unit (ICU) when bleeding – theatre not available. �Delay to transfer to ICU. �Lack of surgical input sought from admitting medical team. �Postoperative hypotension not recognised in recovery. �Delay to operation - five days from presentation with septic shock.

NTASM 2010 - 2015 REPORT 21
Suboptimal therapy
�Failure of the ICU to identify the abdominal deterioration. �Decision to palliate on presentation of necrotising soft tissue infection apparently extending into retroperitoneum and pelvis from right lower leg. �Early enteral feeding inappropriately given, giving rise to likely aspiration. �Fluid balance concerns. � Insertion of chest tube into the lung. � Intrapulmonary placement of sacral intercostal chest drain with massive haemorrhage. �Postoperative bleeding in ICU. �Postoperative care. �Soft tissue mass blocking tracheostomy tube.
Communication failures
�Failure of the surgical registrar to notify the consultant of the patient’s deterioration. �The patient was very ill and had many different doctors involved; was the surgical problem obscured by the numbers of specialists; was there insufficient communication between the teams? �Elevated blood results not known before surgery. �Poor communication between surgical team and intensive care. �Senior surgical opinion only three days after registrar saw patient. �Surgical documentation.
Open surgery – organ related
�Trauma to left common iliac vein.
Failure to use facilities
�Displacement of nasogastric tube may not have happened if the patient was admitted to ICU or high dependency unit (HDU). ICU or HDU declined to help and ought to have helped. �Lack of cooperation by intensive care and high dependency doctors.
Diagnosis-related complication
�Misdiagnosis before referral to the treating surgeon. �Reporting of original computed tomography scan missed malignancy.
Radiological surgery – technical
�No evidence of preoperative assessment of cardiac risk; increased cardiac risk a significant possibility in this patient. �Preoperative cardiac assessment. �Unexpected cardiac arrest leading to respiratory failure.
Patient-related factors
�Failure to maintain necessary endoscopy equipment.
Drugs-related factors
�Dosage and duration of gentamycin treatment.
Laparoscopic surgery – technical
�Management of coagulation at time of initial colonoscopy and post-procedure.

NTASM 2010 - 2015 REPORT22
3.2 SURGEONS
KEY POINTS
�All NT surgeons participated in the audit.
�More than half of NT obstetricians and gynaecologists participated in the audit.
�The NT relies on locum surgeons to supplement the surgical workforce.
�Consultant surgeon supervision in theatre was high.
3.2.1 OVERVIEW
�All 24 NT surgeons participated in the audit. One of the surgeons was an International Medical Graduate (IMG).
�Of the 15 obstetricians and gynaecologists in the NT, eight have agreed to participate in the audit.
There are also 15 locum surgeons who participated in the audit. Historically, locum surgeon involvement in the NTASM has been a challenge. With the latest enhancement to the NTASM database, locum surgeons are able to self-generate a notification of death and report the case details at the same time. NTASM proposes that this becomes standard practice for all locum surgeons, when a death occurs whilst they are still at the hospital.
3.2.2 SURGEON PARTICIPATION
RACS FELLOWS
All of the participating surgeons are Fellows of RACS. Assessor must have their RACS Fellowship in order to do first- and second-line assessments.
RANZCOG FELLOWS
All the participating obstetricians and gynaecologists are Fellows of RANZCOG. Fellows of this College can participate as first- and second-line assessors for gynaecology-related cases.
SURGEON PARTICIPATION BY SPECIALTY
Table 2 highlights surgeon participation by specialty.
Table 2: Surgeon participation by specialty
Surgical specialtyNumber of surgeons*
General Surgery 17
Vascular Surgery 1
Urology 1
Orthopaedic Surgery 6
Otolaryngology, Head and Neck Surgery
3
Obstetrics & Gynaecology 8
Plastic and Reconstructive Surgery 2
Oral and Maxillofacial Surgery 1
Total 39
*Excluded from this analysis were five surgeons who have either retired or left practice in the NT, and 15 locum surgeons.
3.2.3 COMPLETION OF SCFS As at the census date, 93% (285/306) of all SCFs had been completed and returned to the NTASM.
�The median time taken to return a SCF was 57 days, ranging from less than 1 day to 474 days. Nine SCFs were returned in less than one day, and these SCFs were completed online using the Fellows’ Interface. The SCF for nine cases was returned within one week. �Most SCFs were completed by the consultant in charge of the cases (see Table 3 below).
Table 3: Grade of surgeon completing the surgical case form (n=245)
Surgeon grade Number of cases (%)
Consultant 198 (81%)
SET trainee 15 (6%)
IMG 13 (5%)
Fellow 11 (4%)
Service registrar 8 (3%)
SET: Surgical Education and Training; IMG: International Medical Graduate.

NTASM 2010 - 2015 REPORT 23
3.2.4 CONSULTANT SURGEON INVOLVEMENT IN OPERATIONS
In total, 286 operations were performed on 186 patients. Two or more operations were performed on 60 patients. The number of operations on these patients ranged from two to 10. The level of consultant input into the surgical management of patients was high. The distribution of grades of surgeons and their roles in the operating theatre is shown in Table 4.
�Consultant surgeons made the decision to operate in 82% (235/286) of operations.
�The consultant surgeon operated in 59% (169/286) of operations.
Table 4: Grade of surgeon deciding, operating, assisting or in theatre (n= 286)
Deciding Operating Assisting In theatre
Consultant 82% 59% 13% 21%
SET trainee 4% 12% 21% 4%
Service registrar
2% 5% 13% 3%
IMG 3% 6% 6% 2%
Fellow 2% 12% 8% 3%
GP surgeon
0% 0% 0% 0%
Note: the column percentages do not add up to 100%. In many cases multiple surgeons were performing and assisting during the operation. In addition, surgeon’s roles and involvement were not always provided for each operation.
SET: Surgical Education and Training; IMG: International Medical Graduate; GP: General Practice
As two of the participating hospitals are teaching hospitals it was expected that Surgical Education and Training (SET) trainees and service registrars would be deciding to operate as well as performing operations. The rate of SET trainees deciding was 4% in NTASM.
3.2.5 SURGEON SUPERVISION IN THEATRE
Consultant surgeon supervision in theatre is high in the NT. This supervision is noted for all SET trainees, IMGs and service registrars.
�SET trainees performed 34 operations and in 88% (30/34) of these operations the consultant made the decision to operate.
• The SET trainee was assisted by the consultant in 12% (4/34) of these operations.
• The consultant was present in the operating theatre for 15% (6/34) of the operations.
� IMGs performed 16 operations.
• The consultant made the decision to operate in 63% (10/16) of these operations.
• The IMG was assisted by the consultant in 25% (4/16) of these operations.
• The consultant was present in the operating theatre for 25% (4/16) of these operations.
�Service registrars performed 15 operations and in 56% (8/15) of these operations the consultant made the decision to operate.
• The service registrar was assisted by the consultant for 13% (2/15) of these operations.
• The consultant was present in the operating theatre for 20% (3/15) of the operations.
3.2.6 SPECIALTY OF SURGEON
An overview of patients admitted by surgical specialty is provided in Table 5. Although there are surgeons of various specialties working in the NT, surgically-related deaths primarily occurred in three specialties: General Surgery, Orthopaedic Surgery and Vascular Surgery.
Table 5: Surgical specialty and number of patients admitted (n=245)
SpecialtyNumber of
patientsPercentage of
patients
General Surgery 196 80%
Orthopaedic Surgery 25 10%
Vascular Surgery 15 6%
Other* 9 4%
Total 245 100%
*Other: Surgical specialties include Neurology, Otolaryngology Head and Neck and Oral/Maxillofacial.
There were no patient deaths reported for Urology, Obstetrics and Gynaecology, and Plastic and Reconstructive Surgery.
3.2.7 SURGEON SPECIALTY AND AGE DISTRIBUTION OF PATIENTS
Orthopaedic Surgery patients who died were older than General Surgery and Vascular Surgery patients, as can be seen in Table 6.

NTASM 2010 - 2015 REPORT24
Table 6: Surgical specialty and patient age distribution (n=245)
SpecialtyMedian age (years)
Interquartile range (years)
General Surgery (n=196)
59 46–74
Orthopaedic Surgery (n=25)
72 59–86
Vascular Surgery(n=15)
68 61–74
Other*(n=9)
64 44-67
*Other: Surgical specialties include Neurology, Otolaryngology Head and Neck and Oral/Maxillofacial.
3.2.8 TREATING SURGEON AND ASSESSOR VIEWS ON PATIENT MANAGEMENT
A comparison of surgeon and assessor views on the areas in which patient management could have been improved is provided in Table 7. The surgeon’s views for each case are compared with those of the first-line assessor.Both the decision to operate and the timing of the operation were more likely to be considered an area for improvement by the surgeon rather than by the assessor reviewing the case. Assessors reviewing cases considered preoperative management to be the area requiring the most improvement.
Table 7: Surgeon and first-line assessor views on patient management
Area in which patient management could have been improved
Surgeons’ views
(n=186)
First-line assessors’
views (n=231)
Preoperative management
7% 10%
Decision to operate 10% 6%
Choice of operation 3% 4%
Timing of operation 8% 5%
Intraoperative management
5% 4%
Postoperative care 4% 4%
Grade of surgeon operating
1% 1%
Note: more assessors than surgeons completed this part of the form.
3.2.9 OPERATION DURATION
Duration of operation is an important predictor of an adverse event in a surgical admission. According to Kable et al.,[5] as the duration of the operation increases so too does the risk of an adverse event. In the NTASM, operation duration was recorded for 82% (234/286) of operations. In the NTASM there was substantial variation in the time spent in theatre for patients who died in the perioperative period.
�The median operation duration was 87 minutes (IQR 60 to 120 minutes).
�The minimum operation duration was less than 10 minutes.
�The maximum operation duration was 420 minutes.
�There were 37 operations that exceeded 180 minutes.
In the NTASM there were fewer clinical incidents (22%; 44/197) in operations of <180 minutes compared with the 46% (17/37) in operations with extended duration, (risk ratio [RR] 2.06; 95 CI 1.33 to 3.18).
3.2.10 SURGEON VIEWS IN RETROSPECT
SURGEONS AND DIFFERENT ACTIONS
Surgeons were asked whether, in retrospect, they would have done anything differently in terms of patient management.
� In 16% (38/233) of cases the surgeon answered that they would have done something differently.
The areas of care identified for improvement by the surgeons covered all aspects of patient management. A sample of comments is provided below.
DELAY IN PRESENTATION
�Earlier transfer from community. �Patient was seen in the outreach clinic by the medical team who were concerned about dementia and recommended computed tomography scan of brain - (two months before hospitalisation) but the patient was delayed in getting to hospital.
PREOPERATIVE CARE
� I would have preferred this patient to have been admitted under the medical team with surgical consultation on a joint admission with surgical and medical teams. � I would have insisted the patient have a coronary angiogram prior to the second operation and possibly (easy in retrospect) before the first operation.

NTASM 2010 - 2015 REPORT 25
CHOICE OF PROCEDURE
� I would try to encourage the patient to have an above knee amputation when the below knee amputation failed to heal; rather than so many operations. However given his multiple comorbidities even this may have failed to heal. The other option was palliation at an earlier stage; however the family was not united enough to reach a consensus. �Would have tried harder to convince patient to have mastectomy on first presentation with sepsis rather than agreed to ultrasound-guided drainage. �This patient was very noncompliant and repeatedly pulled out the nasogastric tube. Retrospectively I feel a gastrostomy to drain the stomach would have been appropriate.
DECISION TO PERFORM THE OPERATION �This patient should not have undergone any surgery. The patient could have been referred for palliative care. �Probably I would have reconsidered my decision to scope this patient in light of his treatment limits and his ongoing alcohol abuse. The patient’s young age; however; was a compelling factor in my decision to operate. �Think hard before scoping the frail elderly with multiple medical problems.
POSTOPERATIVE CARE
�Earlier postoperative blood transfusion and more aggressive resuscitation. � In view of her severe comorbidities like end-stage renal failure; previous myocardial infarction and poorly controlled diabetes; a HDU admission would have been appropriate following surgery. As she was quite stable in the immediate postoperative period; me and the anaesthetist thought it was not needed. �Engaged more active participation of medical and HDU teams in advance of decompensation of liver cirrhosis. �Palliated patient early. Stopped him bouncing between nursing home and hospital. Assisted him with his decision for non-intervention early.

NTASM 2010 - 2015 REPORT26
3.3 HOSPITALS
KEY POINTS
�All NT hospitals participated in the NTASM, including one day surgery. � Interhospital transfer was required for 13% of patients. �A delay in obtaining the main surgical diagnosis occurred in 10% of cases.
3.3.1 HOSPITAL PARTICIPATION
All hospitals in the NT and one day surgery participate in NTASM. Data in this report is from three hospitals that service Central Australia and the whole Top End of the NT. Nearly all of the reported deaths (99%; 242/245) occurred in the main NT referral hospital.
3.3.2 HOSPITAL ADMISSIONS
The majority of hospital admissions were emergencies. Emergency admissions comprised 91% (216/237) of all hospital admissions while elective admissions comprised 9% (21/237). [Data not available, n= 8]
�Operations were performed on 91% (19/21) of elective admission patients.
�Operations were performed on 74% (159/216) of emergency admission patients.
� Interhospital transfer admissions occurred in 13% (32/239) of patients. ). [Data not available, n= 6]
3.3.3 HOSPITAL ADMISSIONS BY DAY OF THE WEEK.
The number of patients admitted increased from Monday through Wednesday. Patient admissions peaked in the middle of the week. A similar number of patients were admitted on Saturdays and Sundays as on a Monday (see Figure 5).
Figure 5: Distribution of patient admissions by day of the week (n = 245)
0
10
20
30
40
50
MON TUE WED THUR FRI SAT SUNC
ases
(n)
Patient admissions by day of the week
3.3.4 ELECTIVE AND EMERGENCY ADMISSIONS BY DAY OF THE WEEK
Elective admissions (18%; 8/43 ) were highest on a Wednesday. Elective admissions were less than a quarter of all admissions for each day (see Figure 6). No elective admissions occurred on weekends.
Figure 6: Distribution of elective and emergency admissions by day of the week (n=245)
0
5
10
15
20
25
30
35
40
Emergency admission Elective admission
Patient admissions by day of the week
Cas
es (n
)
MON TUE WED THUR FRI SAT SUN
Data not available: Monday, n=4; Tuesday, n=0; Wednesday, n=1; Thursday, n=1; Friday, n=1; Saturday, n=0 and Sunday n=1.

NTASM 2010 - 2015 REPORT 27
3.3.5 DELAYS IN MAIN SURGICAL DIAGNOSIS
Delays and errors in diagnosis are important factors that contribute to deaths in perioperative care.[6] There was a delay in obtaining the main surgical diagnoses in 10% (23/242) of cases. These delays, which can be attributed to more than one department, were associated with the following areas:
�surgical unit (n=7)
�medical unit (n=4)
�general practitioner (n=1)
�other departments or causes (n=13).
Delays in the main surgical diagnosis were primarily due to unavoidable causes (n=8) and inexperienced staff (n=6). Other reasons for delay were patient transfer, patient optimisation and delayed presentation to the hospital.
3.3.6 SURGICAL DIAGNOSIS
For the surgical patients (n=245), the most frequent surgical diagnoses on admission were:
� ischaemic bowel and/or intestinal obstruction or perforation (n=31)
�cerebral haemorrhage (intracerebral, subarachnoid, traumatic subdural) (n=27)
�peripheral vascular disease and/or leg ulcers or cellulitis (n=26)
�malignancy (n=45)
� fractured neck of femur (n=13)
�septicaemia or septic shock (n=16)
�severe head injury, hypoxic brain injury and/or both (n=19)
�necrotising fasciitis (n=12)
�upper gastrointestinal bleeding, haematemesis and/or bleeding oesophageal varices (n=12).
3.3.7 CASES WITH OPERATIONS
A total of 186 patients had 286 operations: �76% (186/245) of patients had at least one operation.
�Males (126/186) were more likely to have an operation than females (60/186).
�More than one operation was performed on 33% (61/186) of patients.
The high rate of return to theatre seen in patients may be explained by debridement of skin or muscle being the most common operation. Debridement of skin or muscle often requires repeat operations.
3.3.8 CASES WITH POSTOPERATIVE COMPLICATIONS
Postoperative complications are strong predictors of death.[7.8] However, the NTASM numbers are low and this data should be interpreted with caution.
NTASM surgeons reported that 22% (40/186) of patients had a postoperative complication. This is statistically significantly lower than the ANZASM rate of 34% (5,864/17,034) RR 0.62 (95% CI 0.47 to 0.82).
In the NTASM 40 patients experienced 57 complications. The number of complications per patient ranged from one to four. More than half the patients (63%; 25/40) had one complication and 38% (15/40) of patients had two complications. Half the patients (53%; 8/15) with two or more complications had a significant postoperative bleed. More than half the patients (60%; 9/15) with two or more complications had more than one operation (range 2-6 operations).
The most frequent complications (see Figure 7) were:
�other conditions (n=20)
�significant postoperative bleeding (n=12)
� tissue ischaemia (n=9)
�procedure-related sepsis (n=7)

NTASM 2010 - 2015 REPORT28
Figure 7: Postoperative complications by type (n=57)
0
5
10
15
20
25C
ompl
icat
ions
(n)
Other*
Signific
ant p
ostop
erativ
e blee
ding
Tissu
e isc
haem
ia
Proced
ure-re
lated
seps
is
Anasto
motic l
eak –
small
bowel
Vasc
ular g
raft o
cclus
ion
Anasto
motic l
eak –
gastr
ic
Anasto
motic l
eak –
panc
reas/b
iliary
Anasto
motic l
eak –
color
ectal
Endo
scop
ic pe
rforat
ion
*Other complications included: acute myocardial infarction, aspiration pneumonia, bleeding after second operation, extensive gastric cancer infiltration, failure to heal, lung collapse and infection, necrotising fasciitis of abdominal wall, pneumonia, prolonged ileus and respiratory failure, small bowel ischaemia, wound haematoma, alleged pulmonary embolism and bleeding from drain site, anastomotic leak of small bowel, failure or adhesion and collapse of mucous fistula, respiratory failure with pulmonary embolism, secondary brain injury and tongue swelling.
3.3.9 USE OF ICU
ICUs are essential contributors to surgical care. In high-risk patients a planned admission to the ICU may effectively decrease postoperative mortality.[9]
�Care in an ICU was received postoperatively by 71% (131/184) of patients. �A postoperative unplanned admission to an ICU occurred in 19% (34/176) of NTASM patients compared with 17% (2,744/15,899) of ANZASM patients.
� In 13% (8/62) of cases in which the patient did not receive support from an ICU or HDU the assessors believed that the patient should have received such support.
3.3.10 UNPLANNED RETURNS TO THEATRE
Unplanned returns to theatre and unplanned admissions to an ICU are each strong predictors of death in surgical patients.[10-12] The rate of unplanned returns to theatre is higher for the NTASM patients compared with ANZASM patients. An unplanned return to theatre occurred in 18% (31/176) of the NTASM cases, compared with 16% (2,580/16,652) of ANZASM cases.
�The difference between the NTASM cases and ANZASM cases is not significant RR 1.08 (95% CI 0.78 to 1.49) and numbers remain too low for definitive comparison.
3.3.11 LENGTH OF HOSPITAL STAY
The length of stay for surgical patients is determined by many factors.[10] The majority of patients had been in hospital for a short time, with 22% (54/245) of patients admitted to hospital for one day or less (see Table 8).
Table 8: Days in hospital (length of stay) before death in NTASM and ANZASM
Length of hospital stay NTASM n=245
ANZASM n=23,281
Median (IQR)
7 days(2–18)
8 days(3–18)
Minimum <1 day <1 day
Maximum 125 days 902 days
NTASM: Northern Territory Audit of Surgical Mortality;
ANZASM: Australian and New Zealand Audit of Surgical Mortality; IQR: interquartile range.

NTASM 2010 - 2015 REPORT 29
3.4 PATIENTS
KEY POINTS
�NTASM patients were younger than those in other regions of Australia.
�The profile of NTASM patients was similar to the ANZASM patients regarding significant comorbidities and emergency admissions.
�The proportion of the NTASM patients with hepatic disease was three times higher than that for ANZASM patients.
�The proportion of the NTASM patients with diabetes mellitus was twice that of ANZASM patients.
3.4.1 OVERVIEW OF PATIENTS
During the five years of the audit 306 patient deaths have been reported, of which 40 were excluded. The excluded cases were either terminal care cases (n=29) or cases that were reported to the audit in error (n=11). Of the reported deaths, 80% (245/306) have completed the audit process.A total of 286 operations were performed in 186 patients.
3.4.2 GENDER
An overview of the gender distribution of the NTASM patients, compared with ANZASM patients is shown in Table 9.
Table 9: Gender distribution of NTASM patients compared with ANZASM patients
Regional audit Males Females
NTASM 65.7% 34.3%
ANZASM 55.2% 44.8%
NTASM: Northern Territory Audit of Surgical Mortality (n=245). ANZASM: Australian and New Zealand Audit of Surgical Mortality (n=23,287; data not available: n=5; gender indeterminate: n=7).
The age distribution by gender in Figure 8 shows that for NT patients:
� the median ages were lower than that for other regions.
�males were younger than females, which was similar to the other regions.
NTASM 2010 - 2015 REPORT30
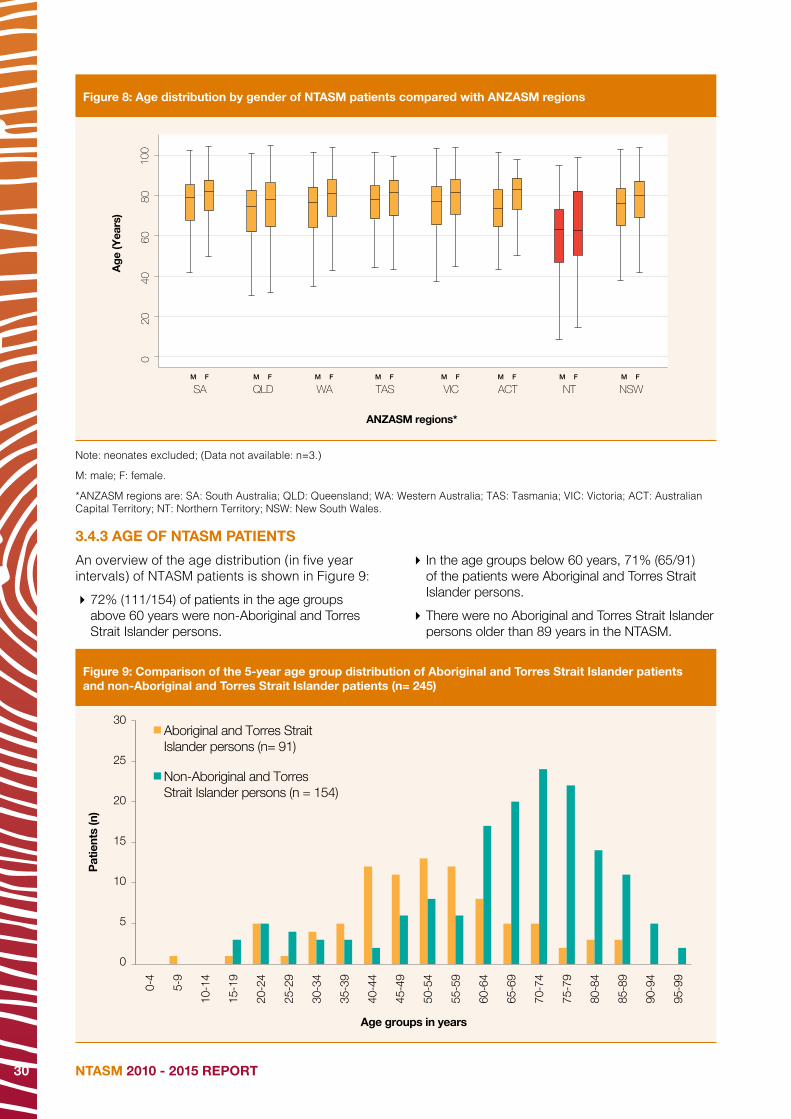
Figure 8: Age distribution by gender of NTASM patients compared with ANZASM regions
SAM F M F M F M F M F M F M F M F
QLD WA TAS VIC ACT NT NSW
020
4060
8010
0
Age
(Yea
rs)
ANZASM regions*
Note: neonates excluded; (Data not available: n=3.)
M: male; F: female.
*ANZASM regions are: SA: South Australia; QLD: Queensland; WA: Western Australia; TAS: Tasmania; VIC: Victoria; ACT: Australian Capital Territory; NT: Northern Territory; NSW: New South Wales.
3.4.3 AGE OF NTASM PATIENTS
An overview of the age distribution (in five year intervals) of NTASM patients is shown in Figure 9:
�72% (111/154) of patients in the age groups above 60 years were non-Aboriginal and Torres Strait Islander persons.
� In the age groups below 60 years, 71% (65/91) of the patients were Aboriginal and Torres Strait Islander persons.
�There were no Aboriginal and Torres Strait Islander persons older than 89 years in the NTASM.
Figure 9: Comparison of the 5-year age group distribution of Aboriginal and Torres Strait Islander patients and non-Aboriginal and Torres Strait Islander patients (n= 245)
0
5
10
15
20
25
30
0-4
5-9
10-1
4
15-1
9
20-2
4
25-2
9
30-3
4
35-3
9
40-4
4
45-4
9
50-5
4
55-5
9
60-6
4
65-6
9
70-7
4
75-7
9
80-8
4
85-8
9
95-9
9
90-9
4
Pat
ient
s (n
)
Age groups in years
Aboriginal and Torres StraitIslander persons (n= 91)
Non-Aboriginal and TorresStrait Islander persons (n = 154)
F

NTASM 2010 - 2015 REPORT 31
3.4.4 AMERICAN SOCIETY OF ANAESTHESIOLOGISTS CLASS
The American Society of Anaesthesiologists (ASA) class is an international measure of patient risk used by anaesthetists.[13] In the NT an ASA class is assigned to the patient by the assisting anaesthetist prior to a procedure being undertaken. An ASA class indicating the presence of severe disease (ASA class 3 to 6) was assigned to 91% (165/182) of patients prior to the patient going to theatre. This is similar to the number of patients in ANZASM who were assigned an ASA class of 3 to 6 (90%; 14,980/16,686). Figure 10 shows the distribution of ASA class for NTASM patients.
ASA class definitions
1. A normal healthy patient.2. A patient with mild systemic disease.3. A patient with severe systemic
disease which limits activity, but is not incapacitating.
4. A patient with an incapacitating systemic disease that is a constant threat to life.
5. A moribund patient who is not expected to survive 24 hours, with or without an operation.
6. A brain dead patient for organ donation.
Figure 10: Distribution of ASA class
Aboriginal and Torres Strait Islander persons
Non-Aboriginal and Torres Strait Islander persons
Pat
ient
s (n
)
ASA 1
ASA 2
ASA 3
ASA 4
ASA 5
ASA 6
ASA Class
All NTASM patients
0
10
20
30
40
50
60
70
80
90
(Data not available: n=4.) ASA: American Society of Anaesthesiologists; NTASM: Northern Territory Audit of Surgical Mortality;
The 12 patients considered ASA class 1 (a healthy patient) prior to the incident which necessitated admission, were admitted due to:
�accidental strangulation
�a massive bleed from a stab wound
� ruptured visceral and multiple fractures (Motor Vehicle Accident - MVA)
�a severe traumatic head injury (MVA)
� left subdural, subarachnoid haemorrhage, right haemopneumothorax (MVA)
�severe head injury with diffuse axonal injury (MVA)
�multisystem trauma (pedestrian involved in MVA)
�severe closed head injury (motorbike accident - MBA)
�severe traumatic brain injury (MBA)
�severe cerebral ischaemia due to self-harm
�spontaneous massive subarachnoid haemorrhage
�drowning
3.4.5 MALIGNANCY
Metastatic malignancy is a predictor of death in surgical patients.[14]
�Malignancy was present in 24% (57/238) of patients compared with 27% (4,452/16,396) in ANZASM patients.
�Malignancy was considered to have contributed to death in 74% (42/57) of NTASM patients and 66% of ANZASM patients. (2,842/4,304).* [*Data not available, n = 148]
The NTASM numbers here are low and need to be interpreted with caution.
3.4.6 COMORBIDITIES
According to the literature, comorbidities are a stronger predictor of mortality than the type of surgery.[8] Serious comorbidities were present in 80% (196/244) of the NTASM patients and most patients had more than one serious comorbidity. The distribution of comorbidities is shown in Figure 11.
�The median number of comorbidities per patient in the NTASM was three (range 1 to 6).
�The median number of comorbidities for the ANZASM pateints was three but the range was different (range 1 to 9).
�Cardiovascular disease, respiratory disease, diabetes and renal disease were the most common comorbidities in NTASM patients (see Figure 11).

NTASM 2010 - 2015 REPORT32
Figure 11: Distribution of comorbidities (n=244).
0
20
40
60
80
100
120
140
Postoperative complications
117 71 68 62 55 47 42 32 22 95
Cardiov
ascu
lar
Pat
ient
s (n
)
Respir
atory
Diabete
sRen
alAge
Hepati
c
Neurol
ogica
l
Advan
ced m
aligna
ncy
Obesit
yOthe
r
Note: the most common ‘Other’ comorbidities were: alcohol abuse, vascular disease, mental health/dementia, coagulopathy, heavy smoking, malnutrition and hypertension.
The distribution of comorbidities in the NTASM patients compared with the ANZASM patients is shown in Figure 12.
�The proportion of the NTASM patients (23%; 47/203) with hepatic disease was statistically significantly higher than the proportion of ANZASM patients (8%; 1,728/21429) with hepatic disease RR 2.87 (95% CI 2.22 to 3.70).
�The proportion of NTASM patients with diabetes mellitus was (33%; 68/203) statistically significantly higher than the proportion of ANZASM patients (19%; 5,034/21,429) with diabetes mellitus RR 1.42 (95% CI 1.17 to 1.73). �The NTASM patients had a reduced risk of cardiovascular disease (56%; 117/203) compared with ANZASM patients (69%; 14,770/21,429), RR 0.83 (95% CI 0.74 to 0.94). This may be an effect of the younger age of the NTASM pateints.

NTASM 2010 - 2015 REPORT 33
Figure 12: Distribution of comorbidities in NTASM patients compared with ANZASM patients
0
10
20
30
40
50
60
70
80Fr
eque
ncy
(%)
NTASM (n= 203)
ANZASM (n=21,429)
Renal
Cardiov
ascu
lar
Respir
atory
Diabet
esOthe
rAge
Hepat
ic
Neurol
ogica
l
Advan
ced M
aligna
ncy
Obesit
y
NTASM: Northern Territory Audit of Surgical Mortality;
ANZASM: Australian and New Zealand Audit of Surgical Mortality
Note: This covers all NTASM and ANZASM cases including those that have not completed the audit process.
Other comorbidities in both NTASM and ANZASM patients covered a wide range.
In ANZASM patients these included: alcohol abuse, anaemia, anticoagulation, bowel ischaemia, cachexia, cellulitits , coagulopathy, dementia, humuan immunodeficiency virus/acquired immunodeficiency syndrome, malnutrition, motor neurone disease, polymyalgia rheumatic, rheumatoid arthritis, sepsis and systemic lupus erythematosus. [Alcohol abuse was mentioned in 1% (268/20,620) of Other comorbidities]
In NTASM patients these included: Active smoking, alcohol abuse, anaemia, anticoagulation, chronic alcoholism, Child B cirrhosis, Child C cirrhosis, coagulopathy, dementia, hepatitis C, human immunodeficiency virus, ischaemic heart disease, malnutrition, peripheral vascular disease and sepsis. [Alcohol abuse was mentioned in 16% (43/269) of the Other comorbities]
Although alcohol abuse as an “other” comorbidity is based on evidence and is not a formal comorbiditiy question, the reported rate in NTASM patients may be related to the increased hepatic disease comorbidity.
3.4.7 RISK OF DEATH
While the risk of surgical mortality is generally low there are patients who are at a higher risk.[15] Surgeons were asked to rate the overall risk of death, prior to surgery, for each patient. The distribution of the risk of death is shown in Figure 13.The risk of death was considerable or expected in 65% (120/184) of patients, similar to the risk of 63% (10,762/17,002) in ANZASM patients.
Figure 13: Distribution of patient risk of death prior to surgery, as perceived by surgeons (n=184)
3% 5%
26%
54%
11%
Minimal Small Moderate Considerable Expected
(Data not available: n=2)

NTASM 2010 - 2015 REPORT34
3.5 ABORIGINAL AND TORRES STRAIT ISLANDER PERSONS
KEY POINTS
�One-third of the NTASM patients were Aboriginal and Torres Strait Islander persons.
�Aboriginal and Torres Strait Islander persons in the dataset were younger than non-Aboriginal and Torres Strait Islander persons.
�No differences in clinical management issues were noted between Aboriginal and Torres Strait Islander persons and non-Aboriginal and Torres Strait Islander persons.
3.5.1 OVERVIEW
Almost a third of the population in the NT are Aboriginal and Torres Strait Islander persons the highest of any Australian state or territory.[1] This was reflected in the surgical audit population, with the NTASM having a higher percentage of Aboriginal and Torres Strait Islander persons than the ANZASM.
�37% (91/245) of the NTASM patients were Aboriginal and Torres Strait Islander persons.
�3% (279/8,352) of the ANZASM patients were Aboriginal and Torres Strait Islander persons, although complete data on this question was not available for all States.
3.5.2 ABORIGINAL AND TORRES STRAIT ISLANDER PERSONS AND AGE
�Aboriginal and Torres Strait Islander persons who died in the perioperative period were younger than non-Aboriginal and Torres Strait Islander persons. This was also seen in the ANZASM patients, as shown in Table 10.
�The difference in median ages between Aboriginal and Torres Strait Islander persons and non-Aboriginal and Torres Strait Islander persons was 19 years in the NTASM and 24 years in the ANZASM.
�The age distribution of Aboriginal and Torres Strait Islander persons and non-Aboriginal and Torres Strait Islander persons in NTASM is shown in Figure 9.
Table 10: Age at death of Aboriginal and Torres Strait Islander persons and non-Aboriginal and Torres Strait Islander persons in NTASM compared with ANZASM patients
NTASM n=245
ANZASM n=8,352
Age at death of Aboriginal and Torres
Strait Islander persons(n=91)
Age at death of non-Aboriginal and
Torres Strait Islander persons(n=154)
Age at death of Aboriginal and Torres
Strait Islander persons(n=279)
Age at death of non-Aboriginal and Torres
Strait Islander persons(n=8073)
Median(IQR)
52 years(42–61)
70 years(59–78)
54 years(44–66)
78 years(66–86)
Minimum 9 years 15 years 0 years 0 years
Maximum 89 years 99 years 95 years 104 years
NTASM: Northern Territory Audit of Surgical Mortality;
ANZASM: Australian and New Zealand Audit of Surgical Mortality.
IQR: interquartile range.

NTASM 2010 - 2015 REPORT 35
3.5.3 ABORIGINAL AND TORRES STRAIT ISLANDER PERSONS AND ASA CLASS
�An ASA class of 3 or higher was recorded for 88% (60/68) of Aboriginal and Torres Strait Islander persons. At a minimum these patients presented with severe disease prior to undergoing surgery. Figure 10 shows the distribution of ASA class for Aboriginal and Torres Strait Islander persons. This data is not age adjusted.
� In ANZASM, an ASA class of 3 or higher was present in 79% (173/220) of Aboriginal and Torres Strait Islander persons who had an operation. This data is not age adjusted.
�The two Aboriginal and Torres Strait Islander persons considered ASA class 1 (a healthy patient) were admitted due to:
• massive bleed from stab wound
• multisystem trauma (pedestrian in Motor Vechile Accident).
3.5.4 ABORIGINAL AND TORRES STRAIT ISLANDER PERSONS AND MALIGNANCY
� In the NTASM, malignancy was present in 12% (11/89) of Aboriginal and Torres Strait Islander persons, and 31% (46/149) of non-Aboriginal and Torres Strait Islander persons.
� In the ANZASM, malignancy was present in 15% (39/267) of Aboriginal and Torres Strait Islander persons, and 27% (2,157/7,965) of non-Aboriginal and Torres Strait Islander persons.
�The lower malignancy rate in both the NTASM and the ANZASM Aboriginal and Torres Strait Islanders persons is most likely a reflection of the younger median age of Aboriginal and Torres Strait Islander persons.
3.5.5 ABORIGINAL AND TORRES STRAIT ISLANDER PERSONS AND COMORBIDITIES
The prevalence of comorbidities is a problem for the surgical care of Aboriginal and Torres Strait Islander persons. Aboriginal and Torres Strait Islander persons are at greater risk of liver disease than non-Aboriginal and Torres Strait Islander persons.[16]
Audit data shows that when age was not adjusted there was no statistical difference in the presence of serious comorbidites in Aboriginal and Torres Strait Islander persons and non-Aboriginal and Torres Strait Islander persons in both in the NTASM and the ANZASM. (see Table 11)
Table 11: Comparison of serious comorbidities in Aboriginal and Torres Strait Islander persons and non-Aboriginal and Torres Strait Islander persons in NTASM and ANZASM
NTASM patients with serious
comorbidities present
ANZASM patients with Serious comorbidities
present
Aboriginal and Torres Strait Islander persons
72/90 (80%)
220/259 (85%)
Non-Aboriginal and Torres Strait Islander persons
124/154 (81%)
6,776/7,532 (90%)
Risk ratio (95% CI)
0.99 ( 0.87 - 1.13)
0.94 (0.89 - 0.99)
When patient age in NTASM was capped at 50 years or younger, a considerable difference emerged between Aboriginal and Torres Strait Islander persons and non-Aboriginal and Torres Strait Islander persons.
Younger Aboriginal and Torres Strait Islander persons are at twice the risk of serious comorbidities than younger non-Aboriginal and Torres Strait Islander persons.[17] This is supported by the current NTASM audit data, which has a RR of 2.10 (95% CI 1.07 to 4.16) for serious comorbidities in younger Aboriginal and Torres Strait Islander persons compared with younger non-Aboriginal and Torres Strait Islander persons. (see Table 12).
Table 12: Age adjusted comparison of serious comorbidities in Aboriginal and Torres Strait Islander persons and non-Aboriginal and Torres Strait Islander persons in NTASM
NTASM patients with serious comorbidities present
50 year or youngern (%)
50 year or older n(%)
Aboriginal and Torres Strait Islander persons
23/39 (59%)
47/49 (96%)
Non-Aboriginal and Torres Strait Islander persons
7/25 (47%)
116/127 (93%)
Risk ratio (95% CI)
2.10*(1.07 - 4.16)
1.06(0.98 - 1.15)
* Statistically significant

NTASM 2010 - 2015 REPORT36
3.5.6 ABORIGINAL AND TORRES STRAIT ISLANDER PERSONS AND OPERATIONS
In the NTASM the number of operations performed on Aboriginal and Torres Strait Islander persons is lower than those performed on non-Aboriginal and Torres Strait Islander persons. In the NTASM patients of who had operations:
�37% (69/186) were Aboriginal and Torres Strait Islander persons
�63% (117/186) were non-Aboriginal and Torres Strait Islander persons.
3.5.7 ABORIGINAL AND TORRES STRAIT ISLANDER PERSONS AND RISK OF DEATH
Based on surgeon perception, a higher proportion of Aboriginal and Torres Strait Islander persons were at considerable or expected risk of death (75%; 52/69) than non-Aboriginal and Torres Strait Islander persons (59%; 68/115) (see Table 13).
Table 13: Percentage distribution of patients at risk of death (n = 184)
Risk of deathAboriginal and Torres Strait Islander persons
(n=69)Non-Aboriginal and Torres Strait Islander persons
(n=115)
Small 3% 7%
Minimal 1% 4%
Moderate 20% 29%
Considerable 68% 46%
Expected 7% 13%

NTASM 2010 - 2015 REPORT 37
3.5.8 ABORIGINAL AND TORRES STRAIT ISLANDER PERSONS AND CLINICAL MANAGEMENT
A 2013 publication showed that surgical care in the NTASM patients, as measured by accepted indicators, was equivalent in both groups.[3]
In patients who had an operation there was no difference in the levels of any of the clinical management indicators with regards to the care provided to Aboriginal and Torres Strait Islander persons and non-Aboriginal and Torres Strait Islander persons (See Table 14).The proportion of postoperative complications was not significantly different between Aboriginal and Torres Strait Islander person and non-Aboriginal and Torres Strait islander persons [RR 0.72 (95% CI 0.39 to 1.33)]. Likewise, there was no statistical difference in the use of DVT prophylaxis in Aboriginal and Torres Strait Islander person and non-Aboriginal and Torres Strait islander persons [RR 0.84 (95% CI 0.71 to 1.01].This is similar to what is reflected in the ANZASM patients. The proportion of postoperative complications was not significantly different between Aboriginal and Torres Strait Islander person and non-Aboriginal and Torres Strait islander persons [RR 1.18 (95% CI 0.97 to 1.44]. There was no statistical difference in the use of DVT prophylaxis in Aboriginal and Torres Strait Islander person and non-Aboriginal and Torres Strait islander persons [RR 0.90 (95% CI 0.82 to 0.97].
Table 14: Issues with postoperative care in NTASM and ANZASM
Postoperative care NTASM (n = 186) ANZASM (n = 6437)
Aboriginal and Torres Strait Islander
persons (n=69)
Non-Aboriginal and Torres Strait Islander
persons (n=117)
Aboriginal and Torres Strait Islander
persons (n=200)
Non-Aboriginal and Torres Strait Islander
persons (n=6,237)
Postoperative complications detected
17%. (12/69)
24% (28/117)
42% (60/144)
35%(2182/6,217)
Use of DVT prophylaxis70%
(47/67)87%
(97/117)74%
(148/199)83%
(5130/6,177)
Unplanned return to theatre19%
(12/65)17%
(19/111)22%
(43/199)16%
(967/6,147)
Unplanned readmission3%
(2/65)3%
(3/110)3%
(6/199)3%
(205/6,108)
Fluid balance problems9%
(6/65)10%
(11/108)19%
(19/199)10%
(578/6,101)
Communication6%
(4/64)11%
(12/112)7%
(13/198)5%
(310/6,102)
Treated in critical care unit72%
(48/67)71%
(83/11777%
(155/201)68%
(4,255/6,237)
Unplanned ICU admission19%
(12/65)20%
(22/111)21%
(41/200)17%
(1,049/6,078)
Different action by surgeon21%
(14/67)18%
(20/112)22%
(44/200)17%
(1,049/6,078)
NTASM: Northern Territory Audit of Surgical Mortality;
ANZASM: Australian and New Zealand Audit of Surgical Mortality;
DVT: deep vein thrombosis;
ICU: intensive care unit.

NTASM 2010 - 2015 REPORT38
3.6 TRAUMA
KEY POINTS
�The data relating to trauma should be interpreted with care as numbers are low.
�Trauma prevalence was similar in the NTASM patients and the ANZASM patients.
�Trauma was more prevalent in non-Aboriginal and Torres Strait Islander persons compared with Aboriginal and Torres Strait Islander persons.
�Trauma was most commonly due to falls.
3.6.1 TRAUMA OVERVIEW
Trauma has a similar prevalence in the NTASM patients compared with national audit patients. Currently only the Northern Territory, Queensland, Western Australia and Victoria provide trauma data to ANZASM.
In ANZASM, the prevalence of trauma was 29% (1,758/6,173). In the NTASM the prevalence of trauma was 27% of patients (53/195). The difference in trauma presentations for NTASM patients and ANZASM patients was not significant RR 1.05 (95% CI 0.83 to 1.32).
In the NTASM patients a higher proportion of non-Aboriginal and Torres Strait Islander persons (60%; 32/53) presented with trauma than Aboriginal and Torres Strait Islander persons.
Trauma is most commonly associated with falls, both in the NTASM patients (55%; 29/53) and ANZASM patients (81%; 1,419/6,173), as seen in Figure 14. However the NTASM trauma patients who had falls were younger (median 63 years; IQR 30 to 94) than the ANZASM patients (median 85 years, IQR 77 to 90)
Trauma fatalities in the NT due to motor vehicle accidents (MVAs) is nearly three times higher than for the rest of Australia.[2]
But in the NTASM only one-quarter of trauma cases were associated with motor vehicle accidents. This is most likely due to death at the accident scene rather than in-hospital. In the NTASM, the proportion of trauma due to MVA (23%; 12/53) is the same as resulting from violence (23%; 12/53). The numbers in these two areas are too low to compare with national data.
Figure 14: Distribution of causes of trauma (n=53)
55%
23%
15%
6% 2%
Falls Violence
Motor vehicle accidentsMotor bike accidents
Bicycle accidents
3.6.2 TRAUMA - FALLSFalls were the most frequent cause of trauma, accounting for 55% (29/53) of patients with documented trauma.
�48% (14/29) of the falls occurred at home.
�14% (4/29) of the falls occurred in hospital.
�14% (4/29) of the falls occurred in a care facility.
�21% (6/29) of falls were due to other causes, such as sport or recreation.
Falls occurred in a considerably higher proportion of the ANZASM trauma patients (81%; 1419/1745).The median age of the NTASM patients who experienced a fall was 63 years (IQR 30 to 94). The median age of the ANZASM patients who experienced a fall was considerably older at 85 years (IQR 77 to 90).
3.6.3 TRUAMA - MOTOR VEHICLE ACCIDENTSMotor vehicle accidents were the cause of 12 trauma cases (8 MVAs, 3 MBAs and 1 bicycle accident). The median age of patients who were involved in a traffic accident was 29 years. Ages for this group ranged from 16 years to 52 years.
3.6.4 TRUAMA - VIOLENCEThe median age of the 12 patients who experienced violence was 43 years (ranging from 23 years to 71 years). Public violence and domestic violence each accounted for approximately one quarter of the cases (public violence: 3/12; domestic violence: 3/12).

NTASM 2010 - 2015 REPORT 39
3.7 INFECTION
KEY POINTS
�Care should be used in the interpretation of infection data as numbers are low.
� Infection rates in the NTASM patients were higher than those in the ANZASM patients. This rate is statistically significant.
�Of the NTASM patients who died with an infection present, more than half presented to hospital with an existing infection.
�There was no difference in infection rates between Aboriginal and Torres Strait Islander persons and non-Aboriginal and Torres Strait Islander persons.
3.7.1 OVERVIEW
The infection rate of the NTASM patients is higher than those in other Australian states. However, there is a difference in the timing of the acquisition of the infection. Most infections in the NTASM patients were acquired prior to admission while in the ANZASM patients, the majority of infections were acquired during the admission (see Figure 15).
3.7.2 INFECTIONS AND OPERATIONS
Of the patients who died with a clinically significant infection, 89% (62/70) had operations.
�One patient had a surgical site infection.
�Six patients acquired an infection preoperatively.
�Thirteen patients acquired an infection postoperatively.
�Four patients had an invasive site infection. (Note: Data not available for 38 cases)
3.7.3 INFECTION RATES
A clinically significant infection was present in 37% of patients (70/187), compared with 34% (2,944/8,698) of ANZASM patients. This result was not significant RR 1.11 (95% CI 0.92 to 1.33).
�The rates of infection acquired by the NTASM patients before and during admission are shown in Figure 15.
�37% (43/115) of non-Aboriginal and Torres Strait Islander persons and 38% (27/72) of Aboriginal and Torres Strait Islander persons died with a clinically significant infection.
3.7.4 TIMING OF INFECTION
�Of the patients who died with a clinically significant infection, 63% (43/68) were admitted with an existing infection and 37% (25/68) acquired the infection during their admission.
�This is different to the national data, in which fewer patients (40.9%; 1,158/2,832) were admitted with an existing infection [RR 1.55 (95 CI 1.28 to 1.86)]. An overview of infections acquired before and during admission by region is provided in Figure 15.
� Infections were acquired prior to admission in 77% (20/26) of Aboriginal and Torres Strait Islander persons with an infection.
� Infections were acquired prior to admission in 55% (23/42) of non-Aboriginal and Torres Strait Islander persons with an infection.
(Note: data was not available for two patients who died with a clinically significant infection regarding timing of infections and types of infections)

NTASM 2010 - 2015 REPORT40
Figure 15: Infections acquired before and during admission by ANZASM region (n= 2832)
0%
10%
20%
30%
40%
50%
60%
70%
SA QLD WA TAS VIC ACT NT
During Before
Cas
es
ANZASM regions*
(Data not available: n=112 (4%))
*ANZASM regions are: SA: South Australia; QLD: Queensland; WA: Western Australia; TAS: Tasmania; VIC: Victoria; ACT: Australian Capital Territory; NT: Northern Territory; NSW: New South Wales.
3.7.5 TYPES OF INFECTIONS
A clinically significant infection was present at death in 70 patients. As shown in Figure 16, the most frequent types of infection were septicaemia (44%; 30/68) and pneumonia (31%; 21/68). Intra-abdominal sepsis comprised 9% (6/68) of infections while other-source infections comprised 16% (11/68) of infections.
Figure 16: Frequency of types of infections in patients who died with a clinically significant infection (n= 68)
31%
9%44%
16%
Pneumonia Intra-�abdominal sepsis Septicaemia Other Source
3.7.6 INFECTIVE ORGANISMS IDENTIFIED
The types of organisms identified in the NTASM patients were different to those identified in the ANZASM patients. This is possibly due to the increased number of soft tissue infections and necrotising fasciitis seen in the NT. Pseudomonas aeruginosa was the most frequently identified species of organism in NTASM patients (20%; 9/44). Pseudomonas infections are considered hospital acquired infections.[18] Serious Pseudomonas infections usually occur in immune-compromised or hospitalised patients. Hospital patients with the highest risk are those on ventilators or who have catheters, surgical wounds or burns. This organism is found in non-chlorinated swimming water and has been identified in necrotising fasciitis in the NT.[19] While Pseudomonas was the most frequently identified infective organism in the NTASM, in ANZASM patients the most frequently identified infective organism was Staphylococcus aureus. Staphylococcus aureus was isolated in only 11% (5/44) of the NTASM cases, lower than the ANZASM rate of (27%; 304/1,127). Methicillin-resistant Staphylococcus aureus was isolated at similar rates in the NT (18%; 8/44) and in ANZASM (12%; 135/1,127).Group A Streptococcus was isolated in 11% (5/44) of NTASM cases. This organism is often associated with necrotising fasciitis (type II) infections.[18, 20]

NTASM 2010 - 2015 REPORT 41
ACKNOWLEDGEMENTS
My sincere appreciation goes to my surgical colleagues, and I thank you for your continuing commitment to making the NTASM a very successful audit. Your solid support of the process continues to build our database and provides excellent peer review feedback for all surgeons, not only in the Northern Territory region but across the country. The NT region with its unique surgical difficulties is of great educational value to all surgeons across the nation.I thank all assessors who have responsibly completed and promptly returned first- and second-line assessments. This assessment process is a small but integral part of safety and quality in surgical care. As surgeons we need to make this an integral part of our daily activity. These audit and feedback mechanisms form part of our learning process. Surgeons learn well by self-reflection.Second-line assessors need particular thanks for their excellent reports. Their reviewing of cases (and medical records), along with forensic assessment and responses, form a significant portion of feedback to surgeons. Assessors’ comments (modified and de-identified) are regularly used in the Lessons from the Audit series. Without committed assessors to review the activities of their surgical peers, the NTASM could not exist nor could the data be gleaned from such an important quality assurance process.As the Clinical Director of the NTASM, I acknowledge the support and assistance of the NTASM staff in managing and coordinating so many aspects of this process. I also acknowledge many individuals and institutions that assist in the continuation of this project, including those outlined below.
�Medical records departments and surgical departments of all participating hospitals.
�The NT Department of Health (project funding).
�RACS (infrastructure support).
�Research, Audit and Academic Surgery Division of RACS, and the ANZASM Steering Committee.
Dr John North FRACS
NTASM Clinical Director

NTASM 2010 - 2015 REPORT42
NTASM MANAGEMENT COMMITTEE
�Dr John Treacy MBBS, MD, FRACS, Chair, NTASM Steering Committee, RACS, Australia
�Dr John North MBBS, FRACS, FAOrthA, Clinical Director NTASM �Dr Janak Mehta MBBS, MS (Orth) FCPS (Orth) DNB (Orth) D(Orth), FRACS �Mr Patrick Bade, MBBS, FRACS Chair, NT State Committee, RACS, Australia �Dr Bernard Whitfield BSc, MBChB (Leeds), FRCS(Ed), FCS(SA), FRACS, Chair, Queensland State Committee, RACS, Australia �Dr John Quinn MBBS, FRACS, FACS, Executive Director of Surgical Affairs, RACS, Australia �Associate Professor Phillip Carson MBBS, FRACS, FRCS (ED, FRCS, FRCS (Glas)) �Dr Jacob Ollapillil MBBS MS (Gen Surgery) MCh (Plastic Surgery) FRACS, Director of Surgery, Alice Springs Hospital �Mr Shiby Ninan MBBS, MS, FRACS �Mr Mahiban E Thomas MBBS, MS, DipNB, FRCSGlasg, FRACS �Mr Sanjay Kalgutkar MB MS FRACS
ALTERNATIVE ALICE SPRINGS REPRESENTATIVE
�Dr Kodituwakku Anoj Dharmawardhane MBBS, MS (Gen Surgery) Specialist General Surgeon Alice Springs Hospital
NORTHERN TERRITORY DEPARTMENT OF HEALTH REPRESENTATIVE
�Louise O’Riordan Quality Manager, Royal Darwin Hospital, Department of Health
ANAESTHESIA REPRESENTATIVE
�Dr Peter Harbison, FRANZCA
OBSTETRICS AND GYNAECOLOGY REPRESENTATIVES
�Dr Jane Thorn BMBS (Hons), FRANZCOG Staff Specialist Obstetrician and Gynaecologist, Royal Darwin Hospital
�Dr Margaret O’Brien FRANZCOG Director of Obstetrics and Gynaecology Royal Darwin Hospital NT
NTASM STAFF
CLINICAL DIRECTOR
�Dr John North MBBS, FRACS, FAOrthA
PROJECT MANAGER
�Therese Rey-Conde BApp Sc, MAACB, MPH, AFAAQHC
PROJECT OFFICERS
�Jenny Allen BSc (Hons)
�Sonya Faint BApp Sc, MA
�Candice Postin BCom
ADMINISTRATION OFFICER
�Kyrsty Webb
NTASM SUPPORT STAFF
�Surgical Audit Officer (Royal Darwin Hospital) Gayle Eccles
�Health Information Manager (Darwin Private Hospital) Francine Riessen
�Acting Health Information Services Managers (Alice Springs Hospital) Mary McKay Janine Wapper
CONSULTANT STATISTICIAN
�Dr Robert Ware BSc (Hons I), PhD School of Public Health, University of Queensland

NTASM 2010 - 2015 REPORT 43
REFERENCES
1. Australian Bureau of Statistics. LGA7- National Regional Profile: Northern Territory Population/People. 03 July 2014. [cited 2016 06 Feb]; Available from http://www.abs.gov.au/AUSSTATS/[email protected]/Previousproducts/LGA7Population/People12007-2011
2. Australian Government, Bureau of Infrastructure, Transport and Regional Economics. Road deaths Australia: 2013 statistical summary. Canberra: Department of Infrastructure and Regional Development, 2013. [cited 2015 26 November]; Available from: https://www.bitre.gov.au/publications/ongoing/files/RDA_Summary_2013.pdf
3. Treacy PJ, North JB, Rey-Conde T, Allen J, Ware RS. Outcomes from the Northern Territory Audit of Surgical Mortality: Aboriginal deaths. ANZ J Surg. 2015; 85:11-15. Available from: http://dx.doi.org/10.1111/ans.12896. DOI:10.1111/ans.12896
4. The Royal Australasian College of Surgeon. Australian and New Zealand Audit of Surgical Mortality national report 2014. Adelaide: Royal Australasian College of Surgeons; [2015] [Cited 2015 Oct]. 53p. Available from: http://www.surgeons.org/for-health-professionals/audits-and-surgical-research/anzasm/
5. Kable A, Gibberd R, Spigelman, A. Predictors of adverse events in surgical admissions in Australia. Int J Qual Health C. 2008; 20: 406-411. Available from: DOI: http://intqhc.oxfordjournals.org/content/20/6/406.long. DOI: 10.1093/intqhc/mzn032
6. North JB, Blackford FJ, Wall, D et al. Analysis of the causes and effects of delay before diagnosis using surgical mortality data. Br J Surg. 2013; 100: 419-425. Available from: http://dx.doi.org/10.1002/bjs.8986 DOI: 10.1002/bjs.8986
7. Fevang BT, Fevang J, Stangeland L, Soreide O, Svanes K, Viste A. Complications and death after surgical treatment of small bowel obstruction: A 35-year institutional experience. Ann Surg. 2000; 231: 529-537. Available from: http://www.ncbi.nlm.nih.gov/pmc/articles/PMC1421029/ PMCID: PMC1421029
8. McNicol L, Story DA, Leslie K et al. Postoperative complications and mortality in older patients having non-cardiac surgery at three Melbourne teaching hospitals. MJ Aust. 2007; 186(9): 447-52. Available from: http://www.ncbi.nlm.nih.gov/pubmed/17484705 DOI: mcn10566_fm [pii]
9. Cavaliere F, Conti G, Costa R, Masieri S, Antonelli M, Proietti R. Intensive care after elective surgery: a survey on 30-day postoperative mortality and morbidity. Minerva Anestesiol. 2008; 74:459-468. Available from: http://www.minervamedica.it/en/journals/minerva-anestesiologica/article.php?cod=R02Y2008N09A0459
10. Lefaivre KA, Macadam SA, Davidson DJ, Gandhi R, Chan H, Broekhuyse HM. Length of stay, mortality, morbidity and delay to surgery in hip fractures. Bone Joint Surg Br. 2009; 91: 922-927. Available from: http://www.jbjs.boneandjoint.org.uk/content/91-B/7/922.abstract DOI: 10.1302/0301-620x.91b7.22446
11. Vogel TR., Dombrovskiy VY, Lowry SF. In-hospital delay of elective surgery for high volume procedures: the impact on infectious complications. J Am Coll Surg. 2010; 211: 784-790. Available from: http://www.ncbi.nlm.nih.gov/pubmed/20980170 DOI: 10.1016/j.jamcollsurg.2010.08.009
12. Ehsani JP, Jackson T, Duckett SJ. The incidence and cost of adverse events in Victorian hospitals 2003-04. MJ Aust. 2006; 184: 551-555. Available from: http://www.ncbi.nlm.nih.gov/pubmed/16768660 DOI: ehs11107_fm [pii]
13. Cuvillon P, Nouvellon E, Marret E et al. American Society of Anesthesiologists’ physical status system: a multicentre Francophone study to analyse reasons for classification disagreement. Eur J Anaesthesiol. 2011; 28: 742-747. Available from: http://journals.lww.com/ejanaesthesiology/Fulltext/2011/10000/American_Society_of_Anesthesiologists__Physical.8.aspx doi: 10.1097/EJA.0b013e328348fc9d.
14. Kowdley GC, Merchant N, Richardson JP, Somerville J, Gorospe M, Cunningham SC. Cancer surgery in the elderly. ScientificWorldJournal. 2012; 303852; 9pages. Available from: http://www.ncbi.nlm.nih.gov/pubmed/22272172 DOI: 10.1100/2012/303852
15. Harris I, Madan A, Naylor J, Chong S. Mortality rates after surgery in New South Wales. ANZ J Surg. 2012; 82: 871-877. Available from: http://www.ncbi.nlm.nih.gov/pubmed/23088722 DOI: 10.1111/j.1445-2197.2012.06319.x
16. Australian Institute of Health and Welfare 2015. Leading cause of premature mortality in Australia fact sheet: liver disease. Cat. no. PHE 199. Canberra: AIHW. [cited 2015 8 October]; Avialable from: http://www.aihw.gov.au/WorkArea/DownloadAsset.aspx?id=60129552763
17. Burke V, Zhao Y, Lee AH et al., Health-related behaviours as predictors of mortality and morbidity in Australian Aborigines. J Prev Med. 2007; 44: 135-142. Available from: http://www.sciencedirect.com/science/article/pii/S0091743506003781 DOI: http://dx.doi.org/10.1016/j.ypmed.2006.09.008
18. Center for Disease Control and Prevention. Healthcare-associated Infections (HAIs); Pseudomonas aeruginosa in Healthcare Settings Atlanta: Center for Disease Control and Prevention; 2013 [updated January 26, 2015; cited 2015 26 November] Available from: http://www.cdc.gov/hai/organisms/pseudomonas.html
19. Bailey T, Mileva M, Zardawi I. Necrotising fasciitis in the Northern Territory of Australia. Pathol. 2014;46:S107-108 Available from: http://journals.lww.com/pathologyrcpa/Fulltext/2014/02001/4__NECROTISING_FASCIITIS_IN_THE_NORTHERN_TERRITORY.290.aspx DOI: 10.1097/01.PAT.0000443694.89576.ef.
20. Sarani B, Strong M, Pascual J, Schwab CW. Necrotizing Fasciitis: Current Concepts and Review of the Literature. J Am Coll Surg. 2009; 208:279-881. Available from: http://www.sciencedirect.com/science/article/pii/S1072751508015469 DOI: http://dx.doi.org/10.1016/j.jamcollsurg.2008.10.032
Royal Australasian College of Surgeons Northern Territory Audit of Surgical MortalityPO Box 7385 East Brisbane QLD 4169 AustraliaTelephone: 07 3249 2903Facsimile: 07 3391 7915Email: [email protected]: www.surgeons.org/NTASM