Embed Size (px)
Citation preview

PPT accompaniment for Carolina K-12’s
Supply, Demand, and Market Equilibrium

Introduction to Demand• In the United States, the forces of supply and demand work
together to set prices. • Demand is the desire, willingness, and ability to buy a good or
service.– Supply can refer to one individual consumer or to the total demand
of all consumers in the market (market demand).
• Based on that definition, which of the following do you have a demand for?

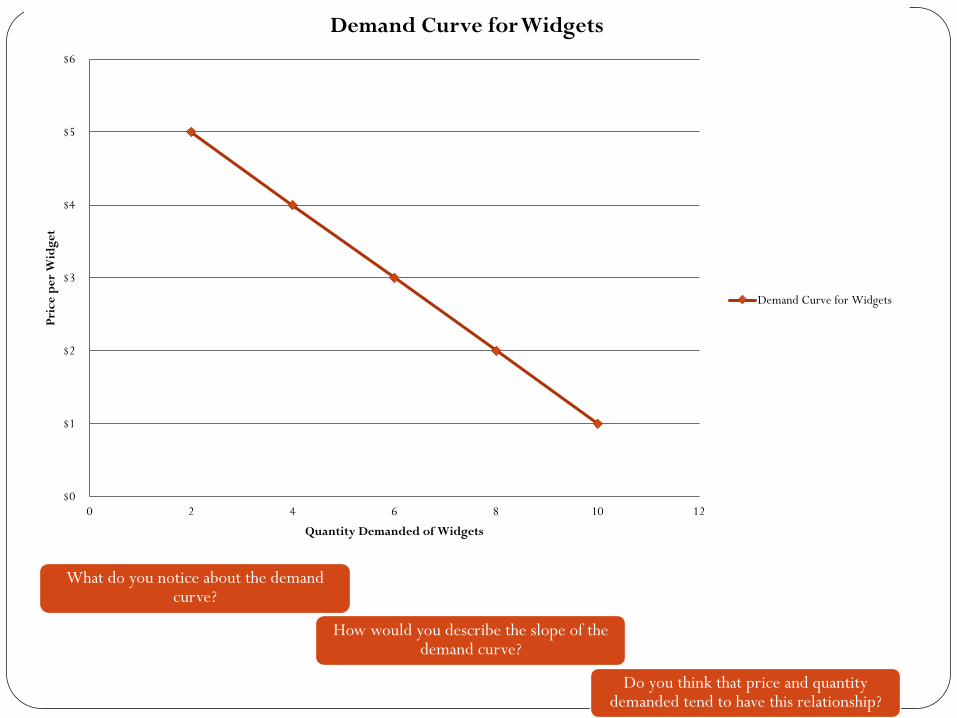
Introduction to Demand� A demand schedule is a table that lists the various
quantities of a product or service that someone is willing to buy over a range of possible prices.
Price per Widget ($) Quantity Demanded of Widget per day
$5 2
$4 4
$3 6
$2 8
$1 10

Introduction to Demand� A demand schedule can be shown as points on a graph.
� The graph lists prices on the vertical axis and quantities demanded on the horizontal axis.
� Each point on the graph shows how many units of the product or service an individual will buy at a particular price.
� The demand curve is the line that connects these points.
$0
$1
$2
$3
$4
$5
$6
0 2 4 6 8 10 12
Pric
e pe
r W
idge
t
Quantity Demanded of Widgets
Demand Curve for Widgets
Demand Curve for Widgets
What do you notice about the demand curve?
How would you describe the slope of the demand curve?
Do you think that price and quantity demanded tend to have this relationship?
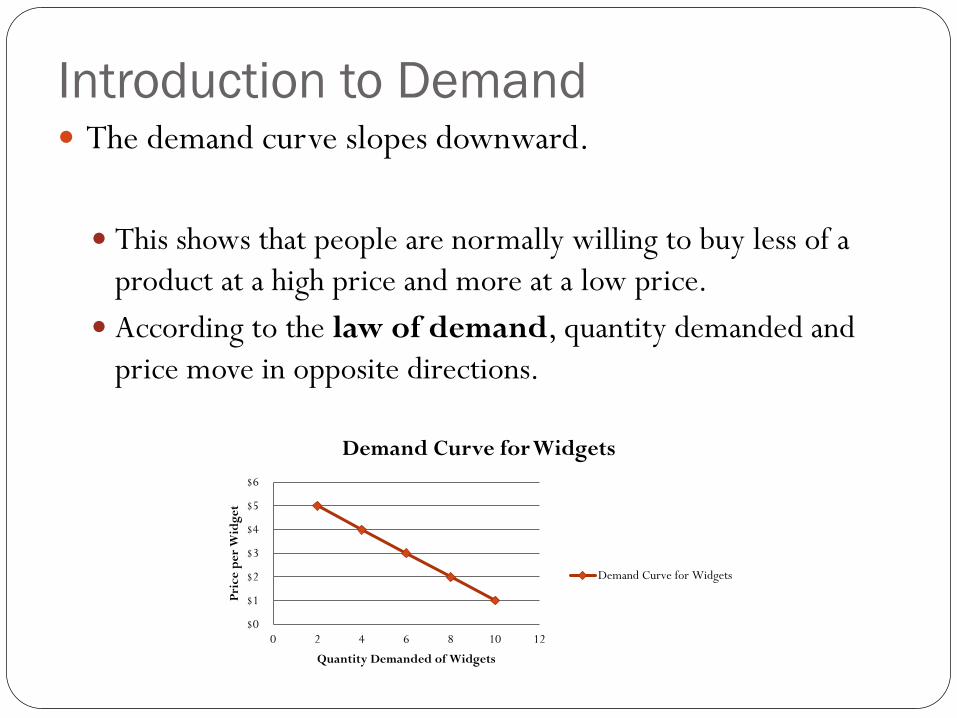
Introduction to Demand� The demand curve slopes downward.
� This shows that people are normally willing to buy less of a product at a high price and more at a low price.
� According to the law of demand, quantity demanded and price move in opposite directions.
$0
$1
$2
$3
$4
$5
$6
0 2 4 6 8 10 12
Pric
e pe
r W
idge
t
Quantity Demanded of Widgets
Demand Curve for Widgets
Demand Curve for Widgets

Introduction to Demand• We buy products for their utility- the pleasure, usefulness, or
satisfaction they give us.• What is your utility for the following products? (Measure your
utility by the maximum amount you would be willing to pay for this product)
• Do we have the same utility for these goods?

Introduction to Demand• One reason the demand curve slopes downward is due to
diminish marginal utility– The principle of diminishing marginal utility says
that our additional satisfaction tends to go down as we consume more and more units.
• To make a buying decision, we consider whether the satisfaction we expect to gain is worth the money we must give up.

Changes in Demand� Change in the quantity demanded due to a price change occurs
ALONG the demand curve
$0
$1
$2
$3
$4
$5
$6
0 2 4 6 8 10 12
Pric
e pe
r W
idge
t
Quantity Demanded of Widgets
Demand Curve for Widgets
Demand Curve for Widgets
•At $3 per Widget, the Quantity demanded of widgets is 6.
•An increase in the Price of Widgets from $3 to $4 will lead to a decrease in the Quantity Demanded of Widgets from 6 to 4.
Changes in Demand• Demand Curves can also shift in response to the following
factors:– Buyers (# of): changes in the number of consumers– Income: changes in consumers’ income– Tastes: changes in preference or popularity of product/ service– Expectations: changes in what consumers expect to happen in the
future– Related goods: compliments and substitutes
• BITER: factors that shift the demand curve

Changes in Demand• Prices of related goods affect on demand
– Substitute goodsà a substitute is a product that can be used in the place of another. • The price of the substitute good and demand for the other good are directly
related• For example, Coke Price Pepsi Demand
– Complementary goodsà a compliment is a good that goes well with another good.• When goods are complements, there is an inverse relationship between the
price of one and the demand for the other• For example, Peanut Butter Price Jam Demand

Changes in Demand
$0
$1
$2
$3
$4
$5
$6
0 2 4 6 8 10 12
Pric
e pe
r W
idge
t
Quantity Demanded of Widgets
Demand Curve for Widgets
Demand Curve for Widgets
$0
$1
$2
$3
$4
$5
$6
0 2 4 6 8 10 12 14
Pric
e pe
r W
idge
t
Quantity Demanded of Widets
Increase in Demand
Orginal Demand Curve
New Demand Curve
•Several factors will change the demand for the good (shift the entire demand curve)
•As an example, suppose consumer income increases. The demand for Widgets at all prices will increase.

Changes in Demand
$0
$1
$2
$3
$4
$5
$6
0 2 4 6 8 10 12
Pric
e pe
r W
idge
t
Quantity Demanded of Widgets
Demand Curve for Widgets
Demand Curve for Widgets
$0
$1
$2
$3
$4
$5
$6
0 2 4 6 8 10 12
Pric
e pe
r W
idge
t
Quantity Demanded of Widgets
Decrease in Demand
Original Demand Curve
New Demand Curve
•As an example, suppose Widgets become less popular to own.
•Demand will also decrease due to changes in factors other than price.
Changes in DemandChanges in any of the factors other than price causes the
demand curve to shift either:
� Decrease in Demand shifts to the Left (Less demanded at each price)
OR� Increase in Demand shifts to the Right (More demanded at
each price)

Demand Practice Answers
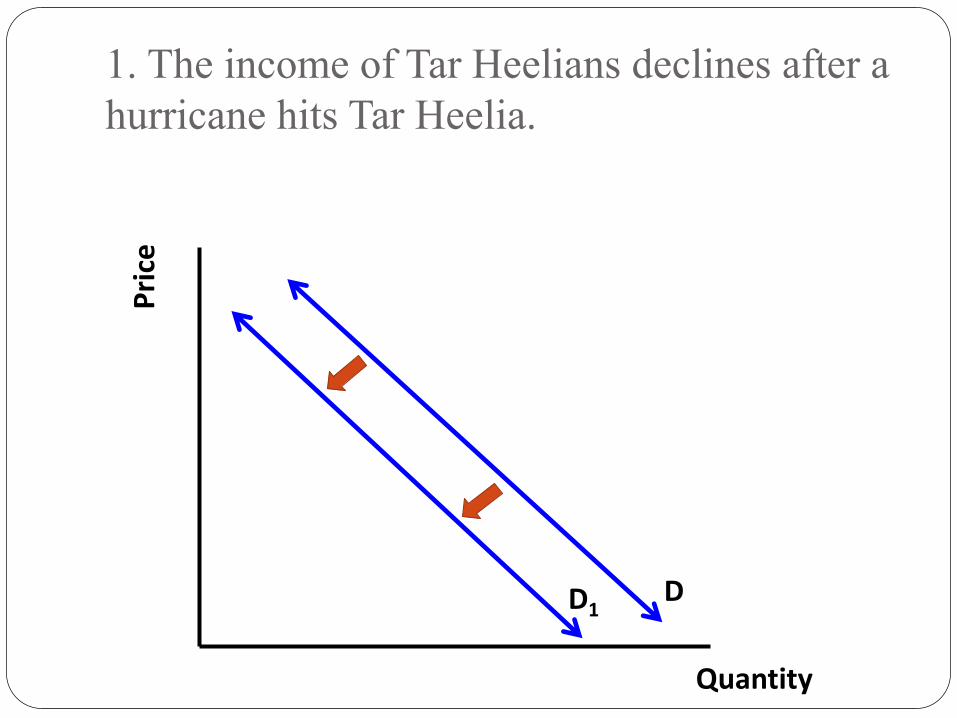
1. The income of Tar Heelians declines after a hurricane hits Tar Heelia.
Quantity
Price
DD1

2. Tar Heelia is named on of the most beautiful islands in the world and tourism to the island doubles.
Quantity
Price
DD1
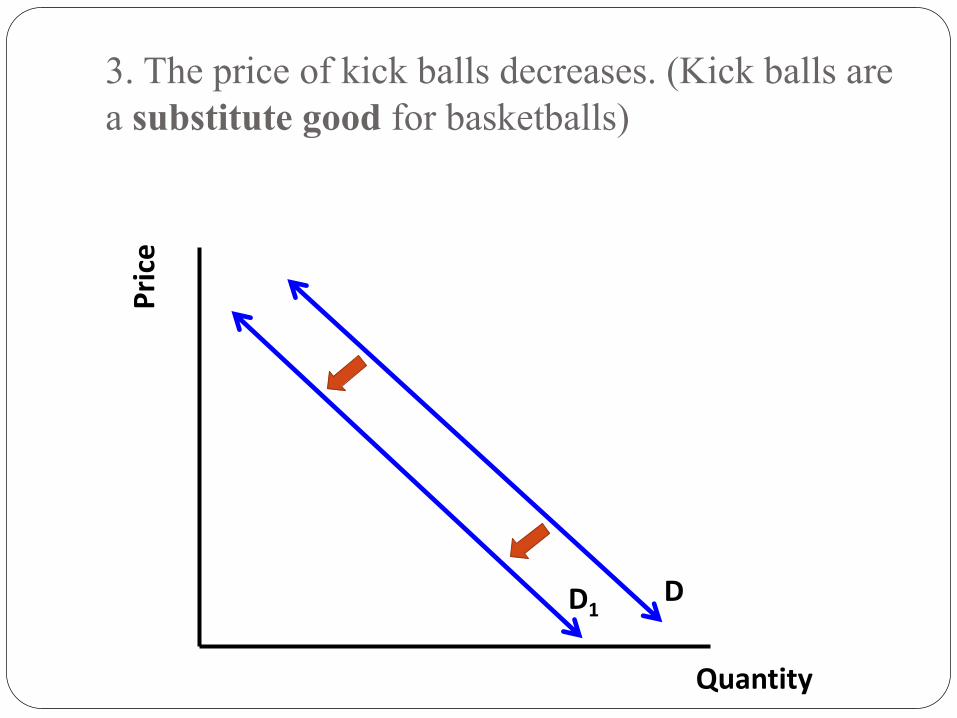
3. The price of kick balls decreases. (Kick balls are a substitute good for basketballs)
Quantity
Price
DD1

4. The price of basketball t-shirts decreases, which I assume all of you know are a complementary good.
Quantity
Price
D
D1

5. The basketball manufactures decide to add a money back guarantee on their product, which increases the popularity for them.
Quantity
Price
D
D1
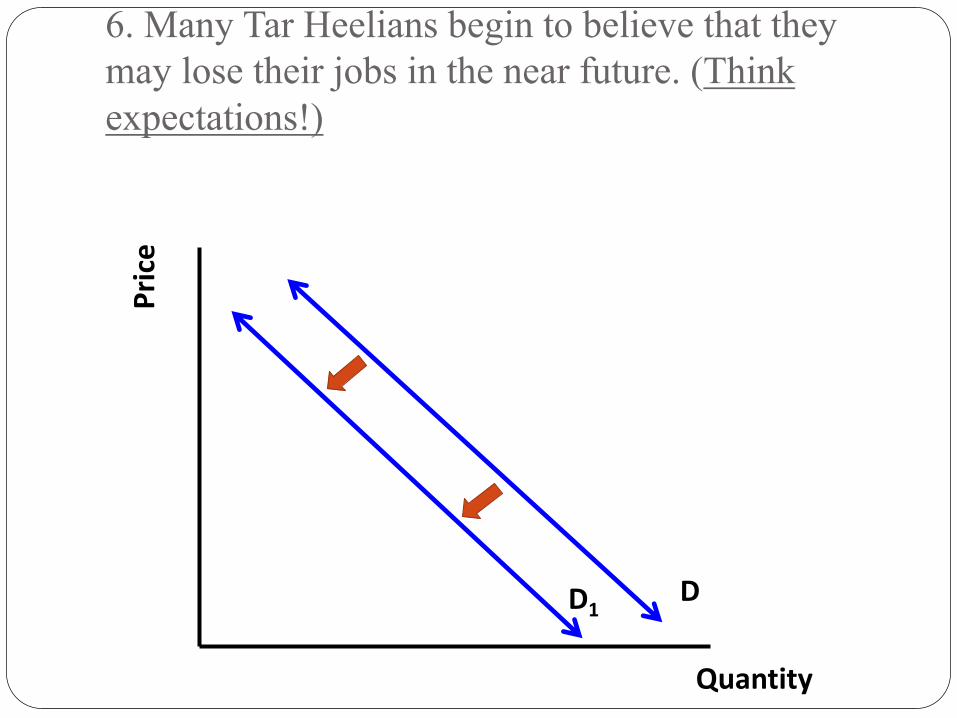
6. Many Tar Heelians begin to believe that they may lose their jobs in the near future. (Think expectations!)
Quantity
Price
DD1

7. Come up with your own story about basketballs and the Tar Heelians. Write down the story, draw the change in demand based on the story, and explain why demand changed.
Quantity
Price
D
Introduction to Supply• Supply refers to the various quantities of a good or
service that producers are willing to sell at all possible market prices.
• Supply can refer to the output of one producer or to the total output of all producers in the market (market supply).
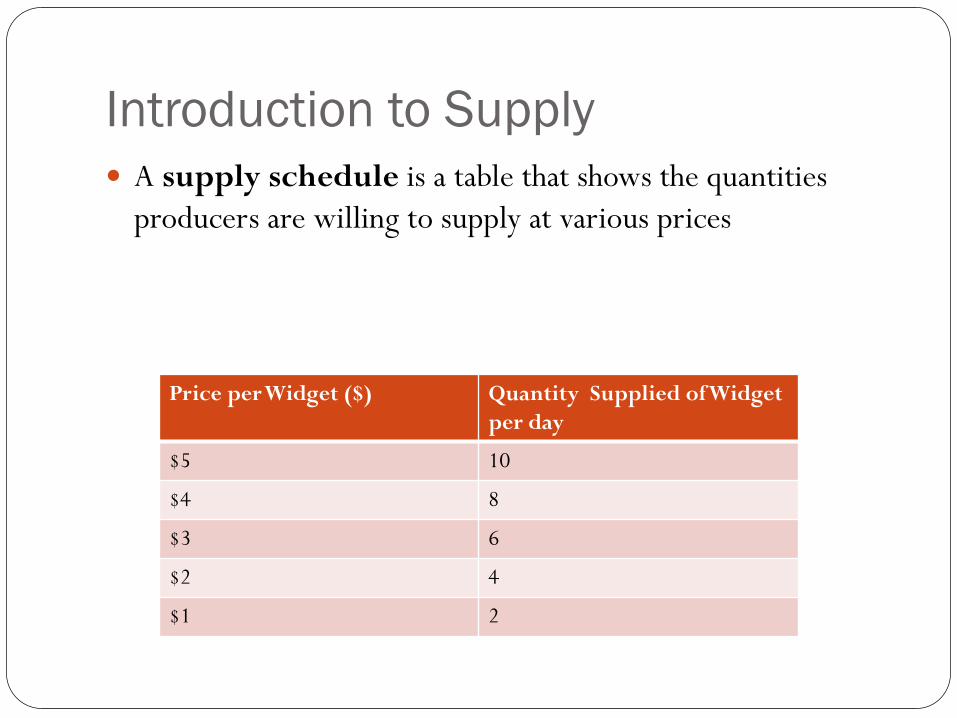
Introduction to Supply� A supply schedule is a table that shows the quantities
producers are willing to supply at various prices
Price per Widget ($) Quantity Supplied of Widget per day
$5 10
$4 8
$3 6
$2 4
$1 2

Introduction to Supply� A supply schedule can be shown as points on a graph.
� The graph lists prices on the vertical axis and quantities supplied on the horizontal axis.
� Each point on the graph shows how many units of the product or service a producer (or group of producers) would willing sell at a particular price.
� The supply curve is the line that connects these points.

What do you notice about the supply curve?
How would you describe the slope of the supply curve?
Do you think that price and quantity supplied tend to have this relationship?
$0
$1
$2
$3
$4
$5
$6
0 2 4 6 8 10 12
Pric
e pe
r W
idge
t
Quantity Supplied of Widgets
Supply Curve for Widgets
Supply Curve

Introduction to Supply• As the price for a good rises, the quantity supplied rises and
the quantity demanded falls. As the price falls, the quantity supplied falls and the quantity demanded rises.
• The law of supply holds that producers will normally offer more for sale at higher prices and less at lower prices.
$0
$1
$2
$3
$4
$5
$6
0 2 4 6 8 10 12
Pric
e pe
r W
idge
t
Quantity Supplied of Widgets
Supply Curve for Widgets
Supply Curve

Introduction to Supply� The reason the supply curve slopes upward is due to costs and
profit. � Producers purchase resources and use them to produce output.
� Producers will incur costs as they bid resources away from their alternative uses.

Introduction to Supply� Businesses provide goods and services hoping to make a
profit. � Profit is the money a business has left over after it
covers its costs.� Businesses try to sell at prices high enough to cover
their costs with some profit left over. � The higher the price for a good, the more profit a
business will make after paying the cost for resources.

Changes in Supply
$0
$1
$2
$3
$4
$5
$6
0 2 4 6 8 10 12
Pric
e pe
r W
idge
t
Quantity Supplied of Widgets
Supply Curve for Widgets
Supply Curve
•At $3 per Widget, the Quantity supplied of widgets is 6.
•If the price of Widgets fell to $2, then the Quantity Supplied would fall to 4 Widgets.
•ChangeinthequantitysuppliedduetoapricechangeoccursALONGthesupplycurve

Changes in Supply• Supply Curves can also shift in response to the following factors:
– Subsidies and taxes: government subsides encourage production, while taxes discourage production
– Technology: improvements in production increase ability of firms to supply
– Other goods: businesses consider the price of goods they could be producing
– Number of sellers: how many firms are in the market– Expectations: businesses consider future prices and economic
conditions– Resource costs: cost to purchase factors of production will
influence business decisions• STONER: factors that shift the supply curve
Changes in Supply
$0
$1
$2
$3
$4
$5
$6
0 2 4 6 8 10 12
Pric
e pe
r W
idge
t
Quantity Supplied of Widgets
Supply Curve for Widgets
Supply Curve
$0
$1
$2
$3
$4
$5
$6
0 2 4 6 8 10 12 14
Pric
e pe
r W
idge
t
Quantities Supplied of Widgets
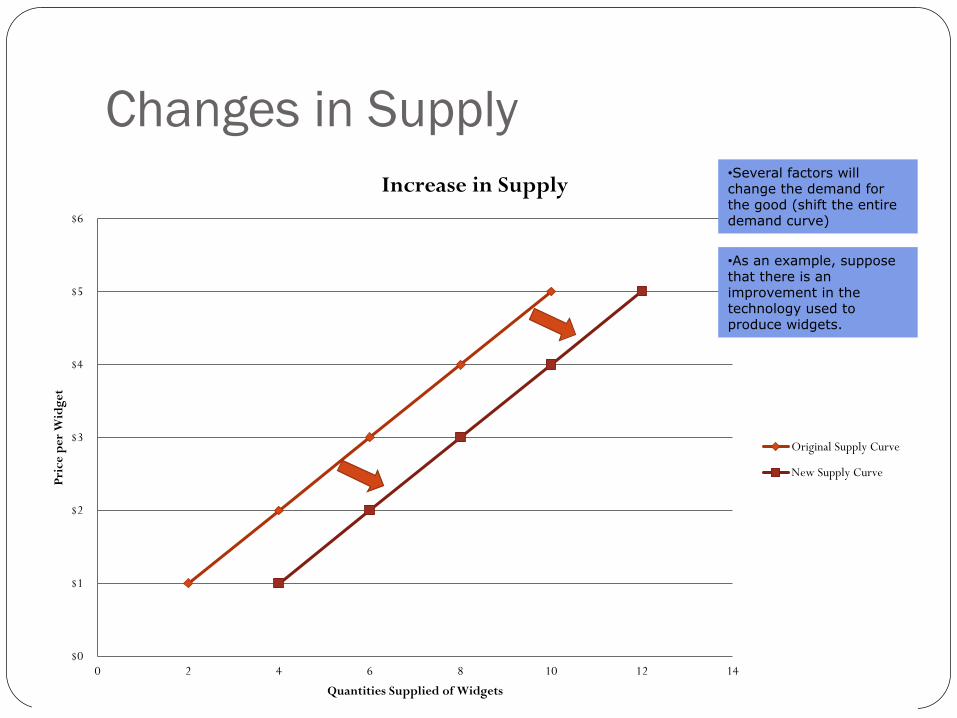
Increase in Supply
Original Supply Curve
New Supply Curve
•Several factors will change the demand for the good (shift the entire demand curve)
•As an example, suppose that there is an improvement in the technology used to produce widgets.
Changes in Supply
$0
$1
$2
$3
$4
$5
$6
0 2 4 6 8 10 12
Pric
e pe
r W
idge
t
Quantity Supplied of Widgets
Supply Curve for Widgets
Supply Curve
$0
$1
$2
$3
$4
$5
$6
0 2 4 6 8 10 12
Pric
e pe
r W
idge
t
Quantity Supplied of Widgets
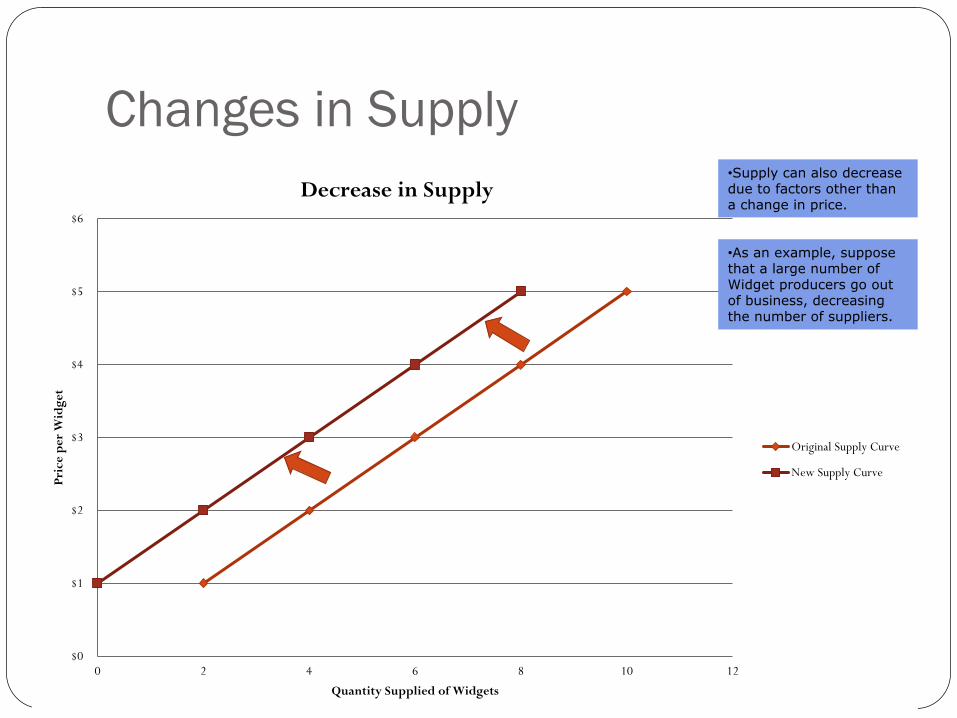
Decrease in Supply
Original Supply Curve
New Supply Curve
•Supply can also decrease due to factors other than a change in price.
•As an example, suppose that a large number of Widget producers go out of business, decreasing the number of suppliers.
Changes in SupplyChanges in any of the factors other than price causes the
supply curve to shift either:
� Decrease in Supply shifts to the Left (Less supplied at each price)
OR� Increase in Supply shifts to the Right (More supplied at each
price)

Supply Practice Answers
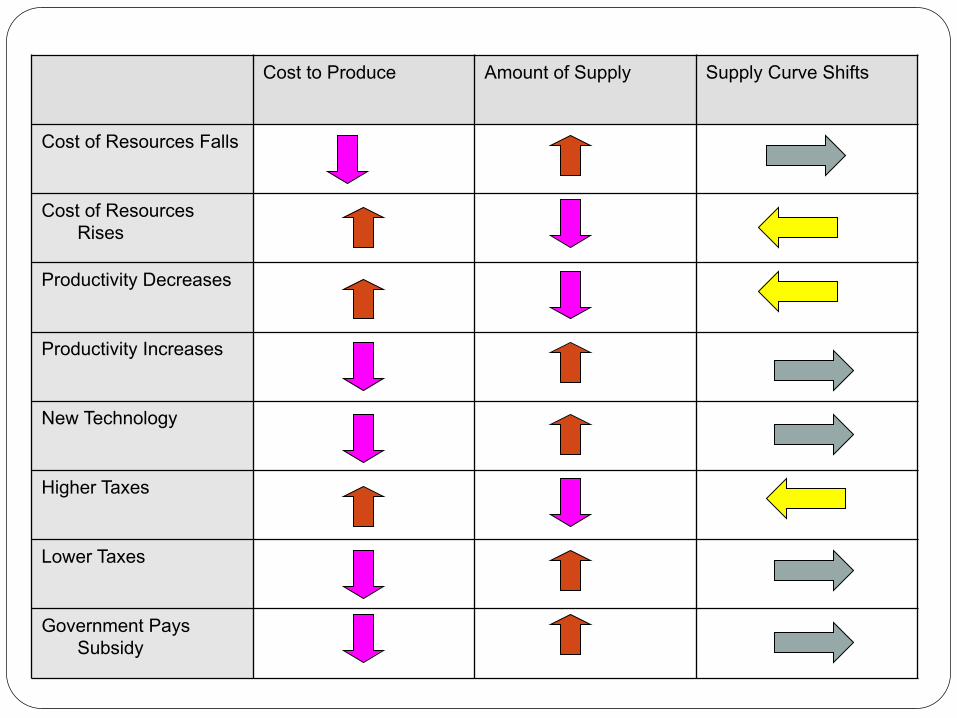
Cost to Produce Amount of Supply Supply Curve Shifts
Cost of Resources Falls
Cost of Resources Rises
Productivity Decreases
Productivity Increases
New Technology
Higher Taxes
Lower Taxes
Government Pays Subsidy
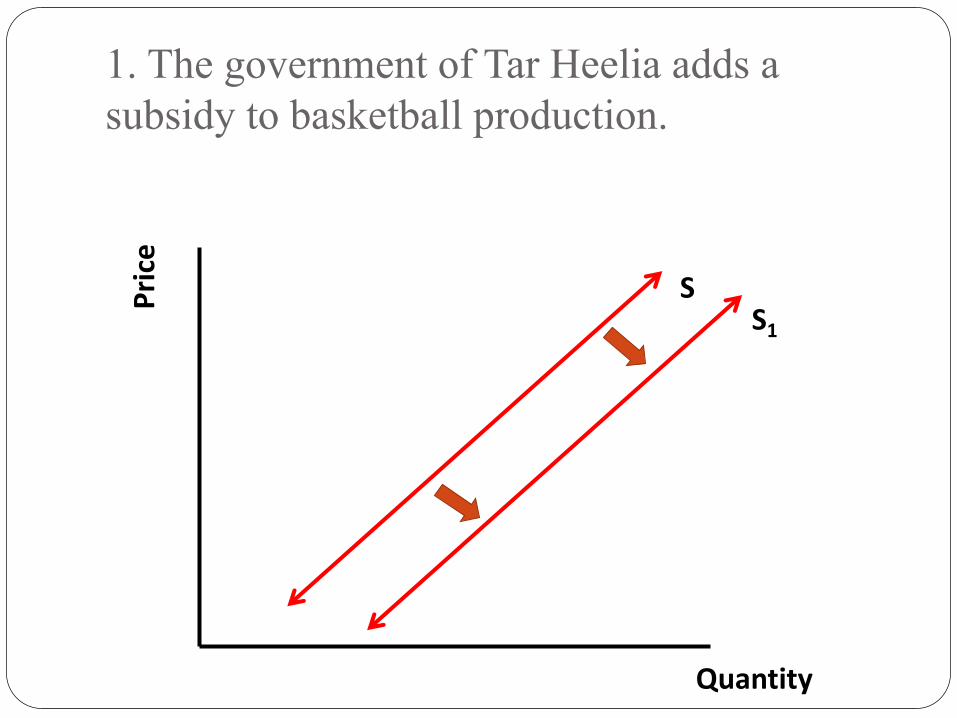
1. The government of Tar Heelia adds a subsidy to basketball production.
Quantity
Price
SS1

2. Basketball producers also produce kick balls. The price of kick balls goes up.
Quantity
Price
SS1

3. The government of Tar Heelia adds a new tax to basketball production.
Quantity
Price
S
S1
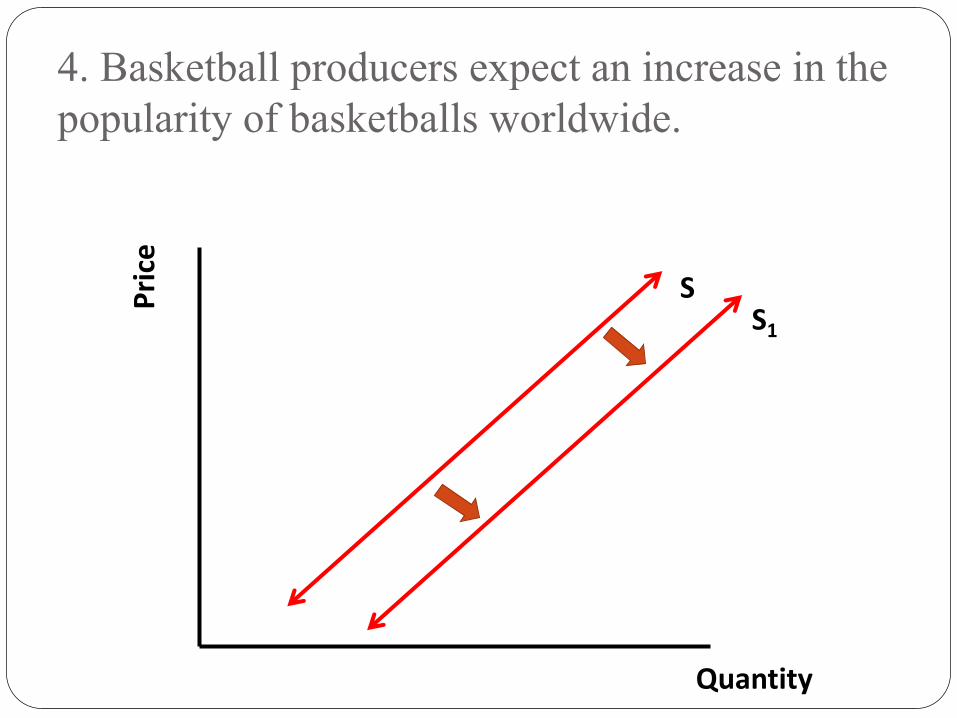
4. Basketball producers expect an increase in the popularity of basketballs worldwide.
Quantity
Price
SS1

5. The price of rubber, a major input in basketball production, increases.
Quantity
Price
S
S1

6. Tar Heelian workers are introduced to coffee as Tar Heelia becomes integrated into the world market and their productivity increases drastically.
Quantity
Price
SS1

7. Come up with your own story about basketballs and the Tar Heelians. Write down the story, draw the change in supply based on the story, and explain why supply changed.
Quantity
Price
S
Supply and Demand at Work
� Markets bring buyers and sellers together.� The forces of supply and demand work together in
markets to establish prices.� In our economy, prices form the basis of economic
decisions.

Supply and Demand at Work� Supply and Demand Schedule can be combined into one
chart.
Price per Widget ($) Quantity Demanded of Widget per day
Quantity Supplied of Widget per day
$5 2 10
$4 4 8
$3 6 6
$2 8 4
$1 10 2

Supply and Demand at Work
$0
$1
$2
$3
$4
$5
$6
0 2 4 6 8 10 12
Pric
e pe
r W
idge
t
Quantity of Widgets
Supply and Demand for Widgets
Demand Curve
Supply Curve

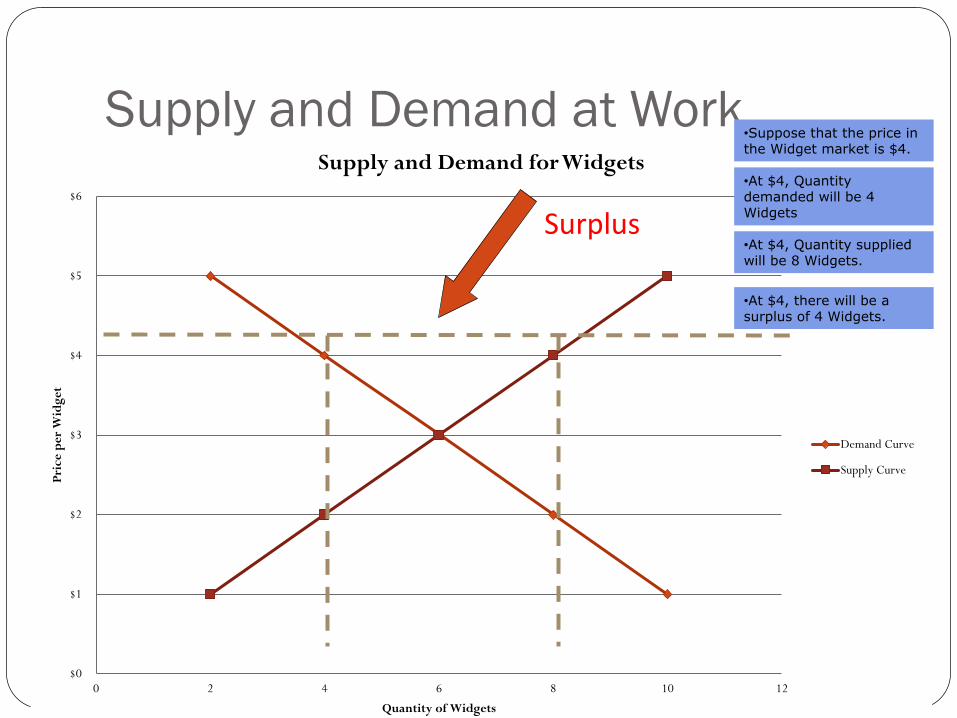
Supply and Demand at Work• A surplus is the amount by which the quantity
supplied is higher than the quantity demanded.– A surplus signals that the price is too high.– At that price, consumers will not buy all of the product
that suppliers are willing to supply. – In a competitive market, a surplus will not last. Sellers
will lower their price to sell their goods.
Supply and Demand at Work
$0
$1
$2
$3
$4
$5
$6
0 2 4 6 8 10 12
Pric
e pe
r W
idge
t
Quantity of Widgets
Supply and Demand for Widgets
Demand Curve
Supply Curve
•Suppose that the price in the Widget market is $4.
•At $4, Quantity demanded will be 4 Widgets
•At $4, Quantity supplied will be 8 Widgets.
•At $4, there will be a surplus of 4 Widgets.
Surplus

Supply and Demand at Work� A shortage is the amount by which the quantity
demanded is higher than the quantity supplied
� A shortage signals that the price is too low. � At that price, suppliers will not supply all of the product
that consumers are willing to buy. � In a competitive market, a shortage will not last. Sellers
will raise their price.

Supply and Demand at Work
$0
$1
$2
$3
$4
$5
$6
0 2 4 6 8 10 12
Pric
e pe
r W
idge
t
Quantity of Widgets
Supply and Demand for Widgets
Demand Curve
Supply Curve
•Suppose that the price in the Widget market is $2.
•At $2, Quantity supplied will be 4 Widgets
•At $2, Quantity demanded will be 8 Widgets.
•At $2, there will be a shortage of 4 Widgets.
Shortage
Supply and Demand at Work• When operating without restriction, our market
economy eliminates shortages and surpluses. – Over time, a surplus forces the price down and a shortage forces
the price up until supply and demand are balanced. – The point where they achieve balance is the equilibrium price.
At this price, neither a surplus nor a shortage exists.• Once the market price reaches equilibrium, it tends to stay
there until either supply or demand changes. – When that happens, a temporary surplus or shortage occurs until
the price adjusts to reach a new equilibrium price.

Supply and Demand at Work
$0
$1
$2
$3
$4
$5
$6
0 2 4 6 8 10 12
Pric
e pe
r W
idge
t
Quantity of Widgets
Supply and Demand for Widgets
Demand Curve
Supply Curve
•Suppose that the price in the Widget market is $3.
•At $3, Quantity supplied will be 6 Widgets
•At $3, Quantity demanded will be 6 Widgets.
•At $3, there will be neither a surplus or a shortage.

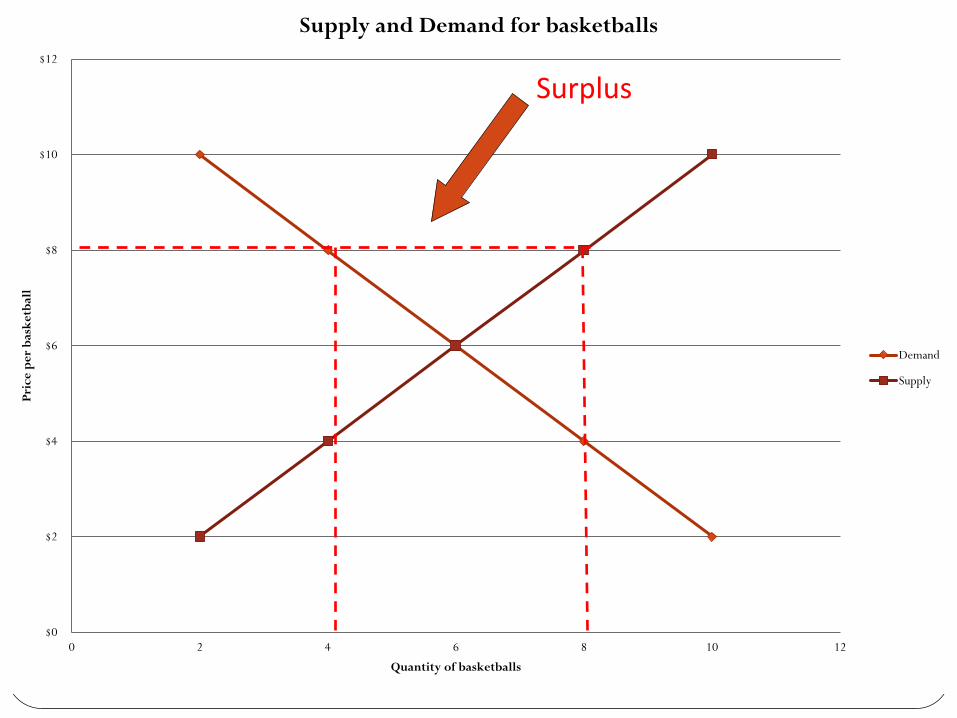
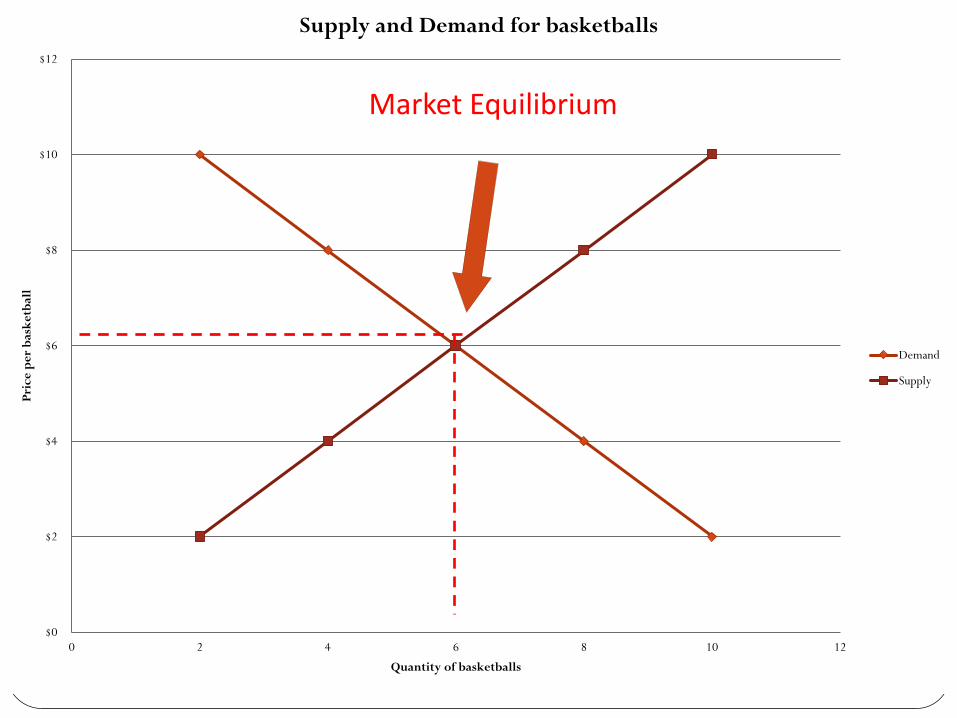
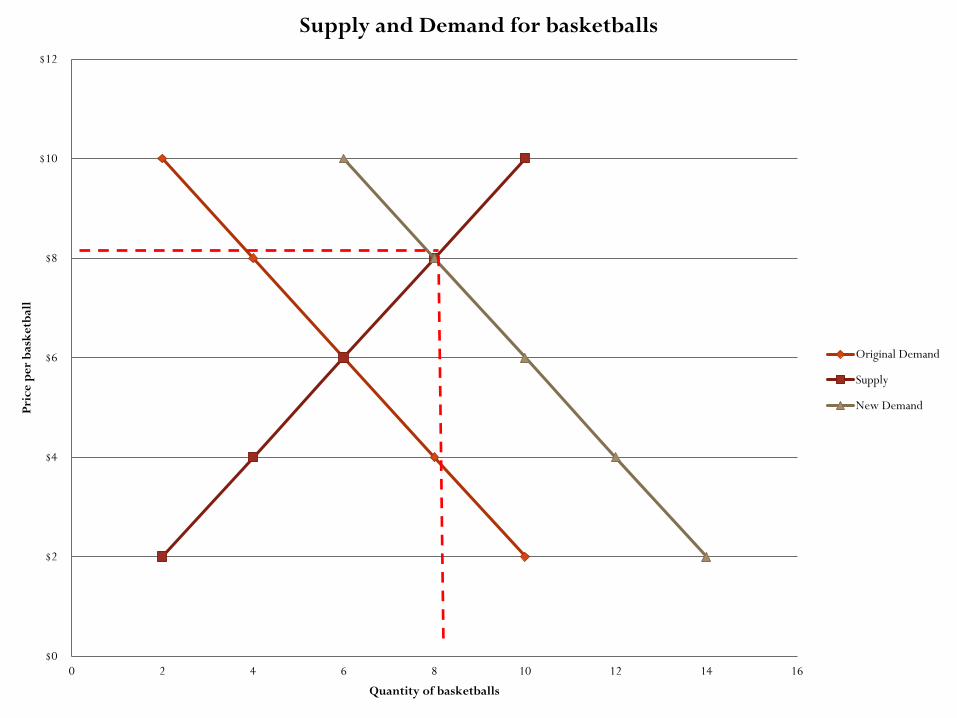
Supply and Demand Practice Answers
$0
$2
$4
$6
$8
$10
$12
0 2 4 6 8 10 12
Pric
e pe
r ba
sket
ball
Quantity of basketballs
Supply and Demand for basketballs
Demand
Supply
Surplus

$0
$2
$4
$6
$8
$10
$12
0 2 4 6 8 10 12
Pric
e pe
r ba
sket
ball
Quantity of basketballs
Supply and Demand for basketballs
Demand
Supply
Shortage
6
$0
$2
$4
$6
$8
$10
$12
0 2 4 6 8 10 12
Pric
e pe
r ba
sket
ball
Quantity of basketballs
Supply and Demand for basketballs
Demand
Supply
MarketEquilibrium
$0
$2
$4
$6
$8
$10
$12
0 2 4 6 8 10 12 14 16
Pric
e pe
r ba
sket
ball
Quantity of basketballs
Supply and Demand for basketballs
Original Demand
Supply
New Demand

1. The income of the Chapel Hill townies declines after an early loss during March Madness.
Quantity
Price
D
S
D1
P1
Q1
P2
Q2

2. Chapel Hill is named one of the most beautiful towns in North Carolina and tourism doubles
Quantity
Price
D
S
D1
P2
P1
Q1 Q2
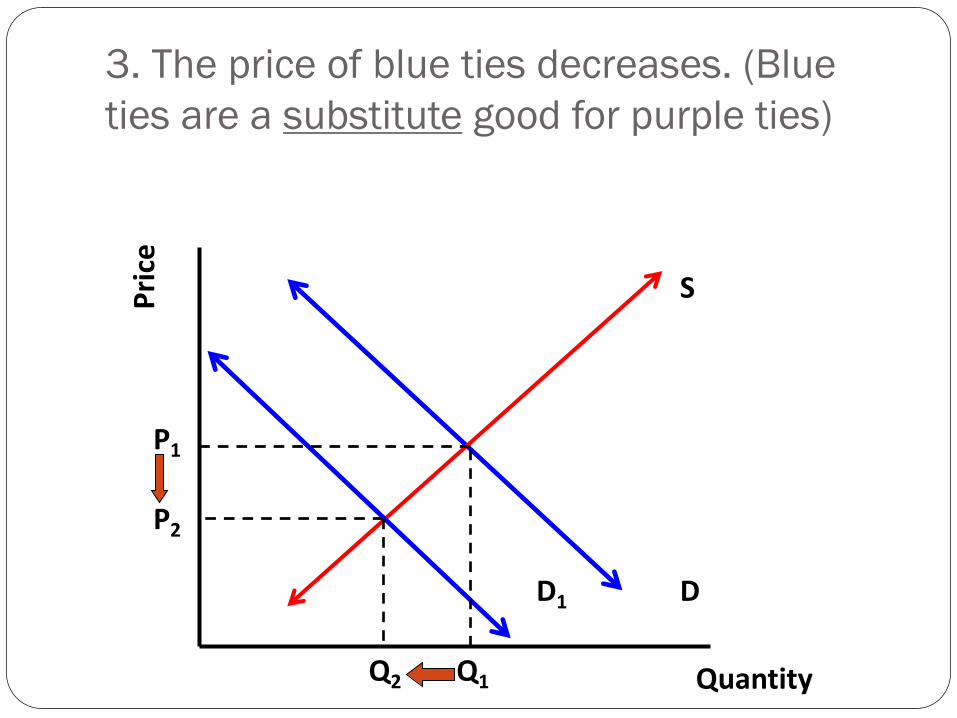
3. The price of blue ties decreases. (Blue ties are a substitute good for purple ties)
Quantity
Price
D
S
D1
P1
Q1
P2
Q2

4. The Federal government has been warning the public about the possibility of a recession and job loss in the RDU area. (Think expectations!)
Quantity
Price
D
S
D1
P1
Q1
P2
Q2
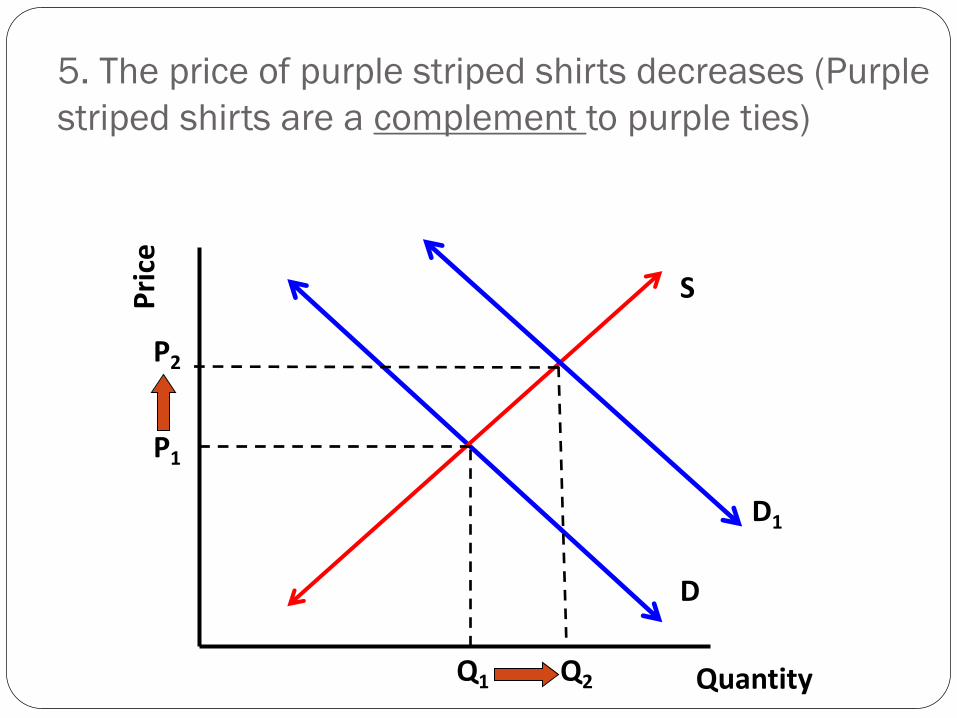
5. The price of purple striped shirts decreases (Purple striped shirts are a complement to purple ties)
Quantity
Price
D
S
D1
P1
Q1
P2
Q2

6. The price of silk increases (ties are made with silk).
Quantity
Price
D
S
P2
S1
P1
Q2 Q1

7. The government adds a subsidy to tie production.
Quantity
Price
D
S
S1
P1
Q1
P2
Q2
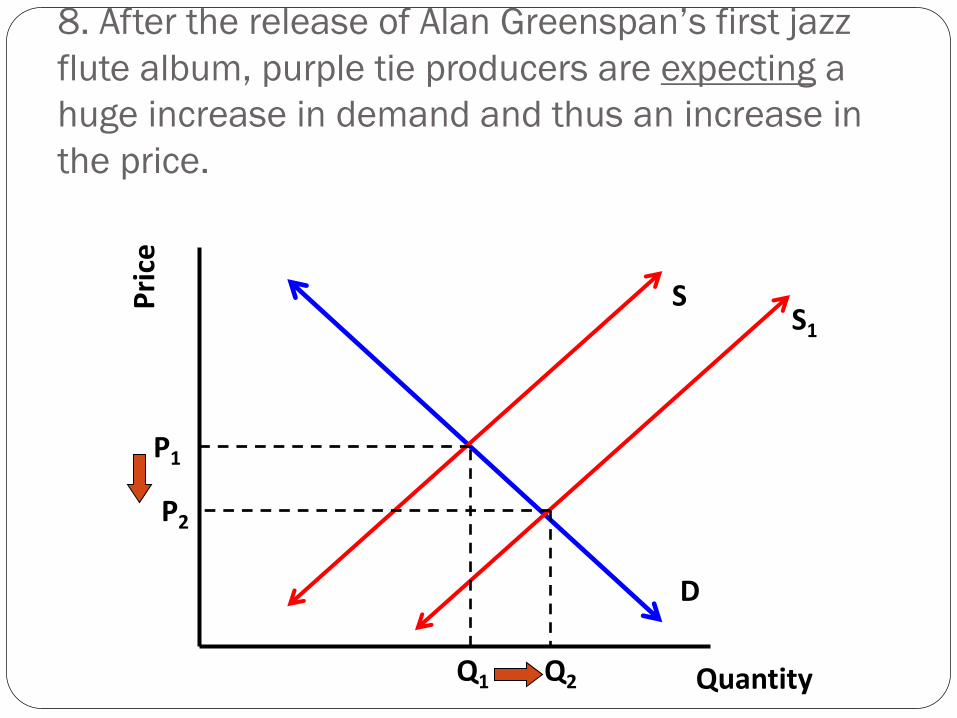
8. After the release of Alan Greenspan’s first jazz flute album, purple tie producers are expecting a huge increase in demand and thus an increase in the price.
Quantity
Price
D
SS1
P1
Q1
P2
Q2

9. Congress enacts new tax on the production of purple ties.
Quantity
Price
D
S
S1
P1
Q1
P2
Q2
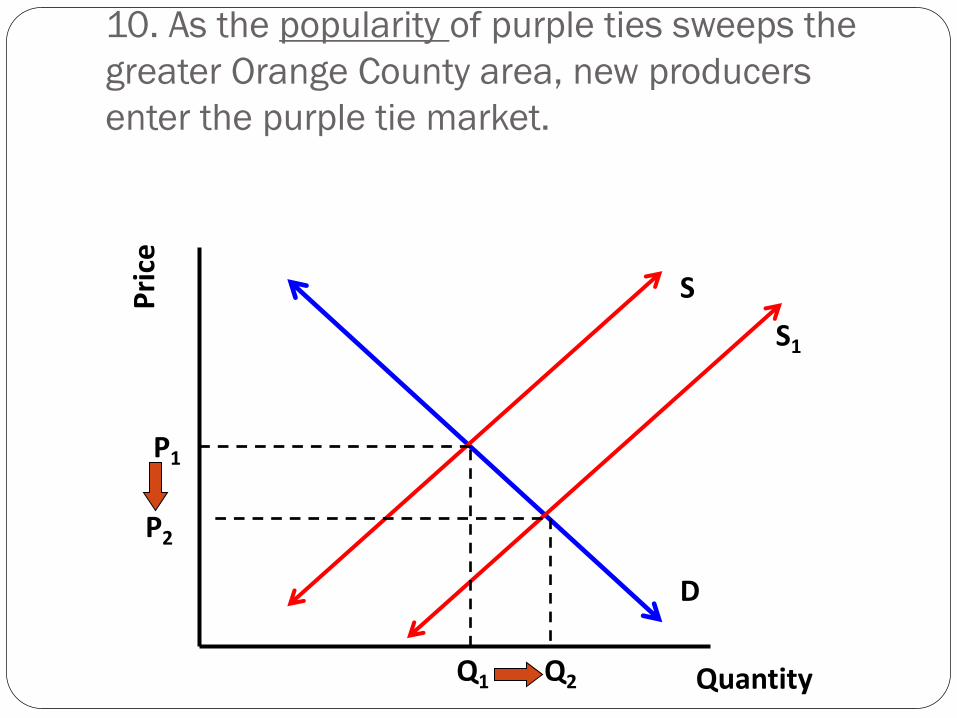
10. As the popularity of purple ties sweeps the greater Orange County area, new producers enter the purple tie market.
Quantity
Price
D
SS1
P1
Q1
P2
Q2

11. Purple ties are named by GQ magazine as a “must have” for all young professionals. At the same time, a new textile machine decreases the cost of producing purple ties.
Quantity
Price
D
S S1
D1
P1
Q1 Q2
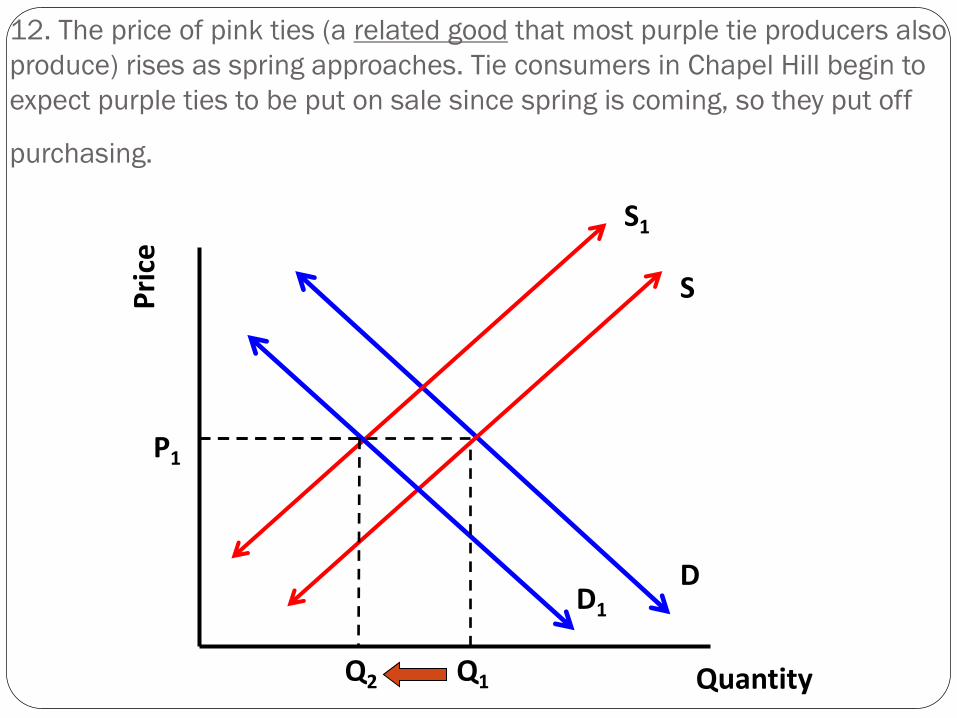
12. The price of pink ties (a related good that most purple tie producers also produce) rises as spring approaches. Tie consumers in Chapel Hill begin to expect purple ties to be put on sale since spring is coming, so they put off
purchasing.
Quantity
Price
D
S
S1
D1
P1
Q1Q2